Article

Divergent Geochemical Pathways of Carbonate Aquifer Evolution in a Classic Karst Terrain: (1) Polygenetic Cave Development Identified Using Longitudinal Groundwater Geochemistry

1
Indiana Geological and Water Survey, 1001 E. 10th St., Bloomington, IN 47405, USA
2
Cascade Grotto of the National Speleological Society, Redmond, WA 98052, USA
3
Washington Geological Survey, 1111 Washington St. SE, MS 47007, Olympia, WA 98504, USA
*
Author to whom correspondence should be addressed.
Water 2023, 15(19), 3410; https://doi.org/10.3390/w15193410
Submission received: 31 July 2023 / Revised: 15 September 2023 / Accepted: 21 September 2023 / Published: 28 September 2023
(This article belongs to the Special Issue Karst Dynamic System and Its Water Resources Environmental Effects)

Abstract

:
Carbonic acid and sulfuric acid speleogenesis describe a dichotomy between epigenetic and hypogenetic caves and carbon and sulfur cycling in karst, but do not acknowledge the global spectrum of cave formation. This paper, part one of a two-part investigation, tests and revises speleogenetic models from a classic karst landscape using dissolved ion concentrations δ13CDIC, and δ34S in water samples collected at four sites across the Bluespring and Lost River karst basins in the Mitchell Plateau, Indiana, USA. Analyses revealed elevated sulfur in both karst basins but differently sourced; H2S (δ34S = −14.2‰) evolved from petroleum seeps in Bluespring Caverns accounted for up to 61% of sulfur in the cave stream, while evaporite beds (δ34S = [+14.50‰, +17.91‰]) of the St. Louis Limestone contributed up to 100% of sulfur at Orangeville Rise, a terminal spring of the Lost River karst basin. These results have implications for carbon–sulfur cycle linkages, particularly the potential acceleration of carbon flux from sulfuric acid dissolution in otherwise epigenetic settings. We suggest a new paradigm for speleogenesis in the North American midcontinent—speleogenesis in the Mitchell Plateau and similar settings is not epigenetic or hypogenetic, but instead polygenetic with competing chemical processes varying across space and time.

1. Introduction

The dissolution of carbonate bedrock occurs through either epigenetic or hypogenetic pathways, meaning from the top down or the bottom up. In this sense, the relatively young science of caves and karst, speleology [1,2,3], has developed physical and chemical dichotomies of thought leading to end-member paradigms in a field of poorly understood, highly heterogeneous behavior. This case study is centered in south-central Indiana, USA, and consists of two parts. The first, this paper, is focused on two adjacent karst basins and a two-year time series of geochemical data that are used to develop geochemical models. The companion paper explores the same theme using a snapshot of data from more than 100 springs to illustrate regional patterns in karst aquifer behavior. We argue that the available data, combined, present a more complex picture where speleogenesis and, by extension, karst landscape evolution, follows a polygenetic pathway. Water–rock interactions in a classic karst terrain of the North American midcontinent compels a recognition of a continuum beyond binaries of speleogenesis, synthesizing previously described end members.
Epigenetic processes are the classic model by which caves form [4,5]. In this model, carbonates dissolve by reactions with carbonic acid (H2CO3) formed in equilibrium with carbon dioxide (CO2) in the atmosphere or plant respiration in the soil column [6]. As water containing H2CO3 infiltrates a carbonate aquifer, the rock is dissolved along the flow path, creating epikarst, terra rossa residuum soils, and a system of conduits that convey groundwater and dissolved ions to springs.
In contrast, hypogenetic processes are those in which the cave-forming reactions proceed from the bottom-up as opposed to top-down epigenetic processes. Geochemically speaking, the hypogenetic processes involved in speleogenesis and aquifer evolution commonly evoke reactions between carbonates and sulfuric acid (H2SO4) evolved from sources at depth [7]. Hypogenetic caves tend to possess morphologies distinct from epigenetic caves as a result [7].
Epigenetic and hypogenetic processes are both well-documented cave formation pathways, but there is little literature on systems that may fall between these pathways. Epigenetic karst aquifers are mixing zones for meteoric recharge, shallow groundwater, and deeper fluids [8,9,10]. Given that the depth of a water source tends to correlate with its oxidation–reduction potential, classic karst terrains, such as those in the North American Midcontinent, present a likely setting for the occurrence of significant redox interfaces [11]. Thus, a large suite of geochemical reactions is possible across these interfaces where mixing low-oxygen, reducing waters and oxygenated waters combines geochemical signatures of both epigenetic and hypogenetic processes [12].
The active geochemistry of caves serves as a major factory for carbon mobilization. Carbonate dissolution creates secondary porosity and mobilizes dissolved inorganic carbon (DIC) from bedrock (Equation (1)). In the carbonic acid speleogenesis (CAS) model of cave development, usually characterized as epigenetic, CO2-enriched waters from percolating recharge react with carbonate bedrock (Equation (2)) [4,5,13,14,15,16], reactant CO2 is sourced from the atmosphere or plant respiration, and DIC is an equal mixture of bedrock and reactant carbon (Equation (3)).
H+(aq) + CaCO3(s) → Ca2+(aq) + H2O + CO2(aq)
H2O + CO2(aq) → H+(aq) + HCO3(aq) and H2O + CO2(aq) → 2H+(aq) + CO32−(aq)
H2CO3(aq) +CaCO3(s) → Ca2+(aq) + 2HCO3(aq)
DIC mobilized from carbonate rock reservoirs is a poorly constrained member of the global carbon cycle [10,17,18,19,20,21,22]. While DIC flux to oceans from karst processes is theoretically balanced by carbonate precipitation over geologic time, CO2 equilibration occurs over the span of months in response to HCO3 concentrations [23]. Furthermore, the interlinkages between the carbon and sulfur cycles complicate these timescales and are a critical piece connecting carbonate rock and silicate rock weathering contributions to global carbon flux [24,25].
These complexities are reflected in the speleogenesis that occurs as carbon is removed from carbonate rocks. The evolution of secondary porosity and permeability in carbonates is more complex than the classic CAS model that focuses on carbon-cycle-specific development of voids [26]. For example, sulfates (in dissolved and mineral form) and SOX in the atmosphere may be reduced through dissimilatory sulfur reduction (DSR) by microbes and incorporated into organosulfur compounds using adenosine triphosphate (ATP) and enzymes to form the biologically active molecule adenosine 5′-phosphosulfate (APS) that reduces sulfur to H2S [27,28], or
SO42− + ATP → APS + 2e → SO32− + 6e → H2S.
When H2S interacts with oxygen, it oxidizes to highly caustic H2SO4 (Equation (5)) and interacts with carbonate rocks to break the ionic bonds between Ca2+ and CO32− and liberate DIC from the bedrock (Equation (6)). Under some conditions, these reactions create a gypsum byproduct (Equation (7)). This sulfuric acid speleogenesis (SAS) model is a fundamentally distinct geochemical system from the CAS model.
H2S(aq) + 2O2(aq) → 2H+(aq) + SO42−(aq) → H2SO4
H2SO4(aq) + CaCO3(s) → 2H+(aq) + SO42−(aq) + Ca2+(aq) + CO32−(aq) → H2CO3(aq) + Ca2+(aq) + SO42−(aq)
Ca2+(aq) + SO42−(aq) + 2H2O → (CaSO4 ∙ 2H2O)(s)
Worldwide, authors have used the SAS model [29] to explain the morphology and mineralogy of caves from the Guadalupe Mountains, New Mexico [30], as well as from Mexico (Cueva de Villa Luz [31]), Italy (Grotte di Frasassi [32]), Romania (Peştera Movile [33]; Cerna River Valley [34,35,36]), and Wyoming (Lower Kane Cave [37]).
While the role of SAS is recognized throughout western North America [37,38,39,40], the role of modern SAS is rarely discussed in association with the Interior Lowland Plateaus and the extensive epigenetic karst of the midcontinent of North America, despite the prevalence of sulfur in groundwater and leading evidence from caves such as the Warm River Cave in Virginia [41] and Parker Cave near Mammoth Cave in Kentucky [42].
A recent set of studies from the Cumberland Escarpment of Kentucky, on the east flank of the Cincinnati Arch, did formally note this discrepancy [43], where hydrocarbon-associated brines, rich in H2S, migrate updip from the Appalachian Basin through fractured Mississippian carbonates to entrain in shallow groundwater [44]. Stable isotopes of carbon [44] and geochemical mass balance [10] suggest that SAS may contribute to carbonate weathering and a significant fraction of DIC flux in some karst basins [10]. In that work, DIC was partitioned between the atmosphere and bedrock sources, with DIC exceeding that predicted by carbonate equilibrium kinetics ascribed to SAS; however, the co-occurrence of chemical processes was not directly observed in the caves.
On the west flank of the Cincinnati Arch and eastern margin of the Illinois Basin, the Mitchell Plateau is a classic karst landscape with documented concentration gradients of sulfur in groundwater associated with evaporite deposits along deeper flow paths in Mississippian carbonates [45]. The karst aquifers in the Mitchell Plateau include a shallow flow system fed by meteoric waters and a deeper, diffuse flow system that feeds mineral springs [45]. Ref. [8] measured δ34S using evaporites (+14.10‰ to +15.13‰) and four springs that were undersaturated with respect to calcite, gypsum, and anhydrite, with Pluto Spring in French Lick as the endmember for deep diffuse flow. The mean δ34SSO4 value of emergent groundwater at Pluto Spring (+18.47‰) is enriched in 34S relative to the evaporites, a possible result of microbial DSR [8] along the upwelling flow path. The δ13CDIC of groundwater in the Mitchell Plateau varies from −14.4‰ to −0.1‰ [46], with the mineral springs being the most enriched in 13C. This enrichment in 13C conveys the potential for SAS by enhanced dissolution of bedrock carbonates by sulfuric acid (Equation (6)).
The work of Krothe and others [8,9,47] developd an understanding for how sulfur isotopes can trace the water source in a complex carbonate aquifer. However, knowledge gaps remain with respect to the influence of sulfur on carbonate aquifer evolution. This study evaluates the role of sulfur in the Mitchell Plateau, which is an example of epigenetic karst [45]. Our conclusions draw a contrast with this historic classification, suggesting instead that some caves in the Mitchell Plateau mix both epigenetic and hypogenetic processes and are more accurately classified as polygenetic.

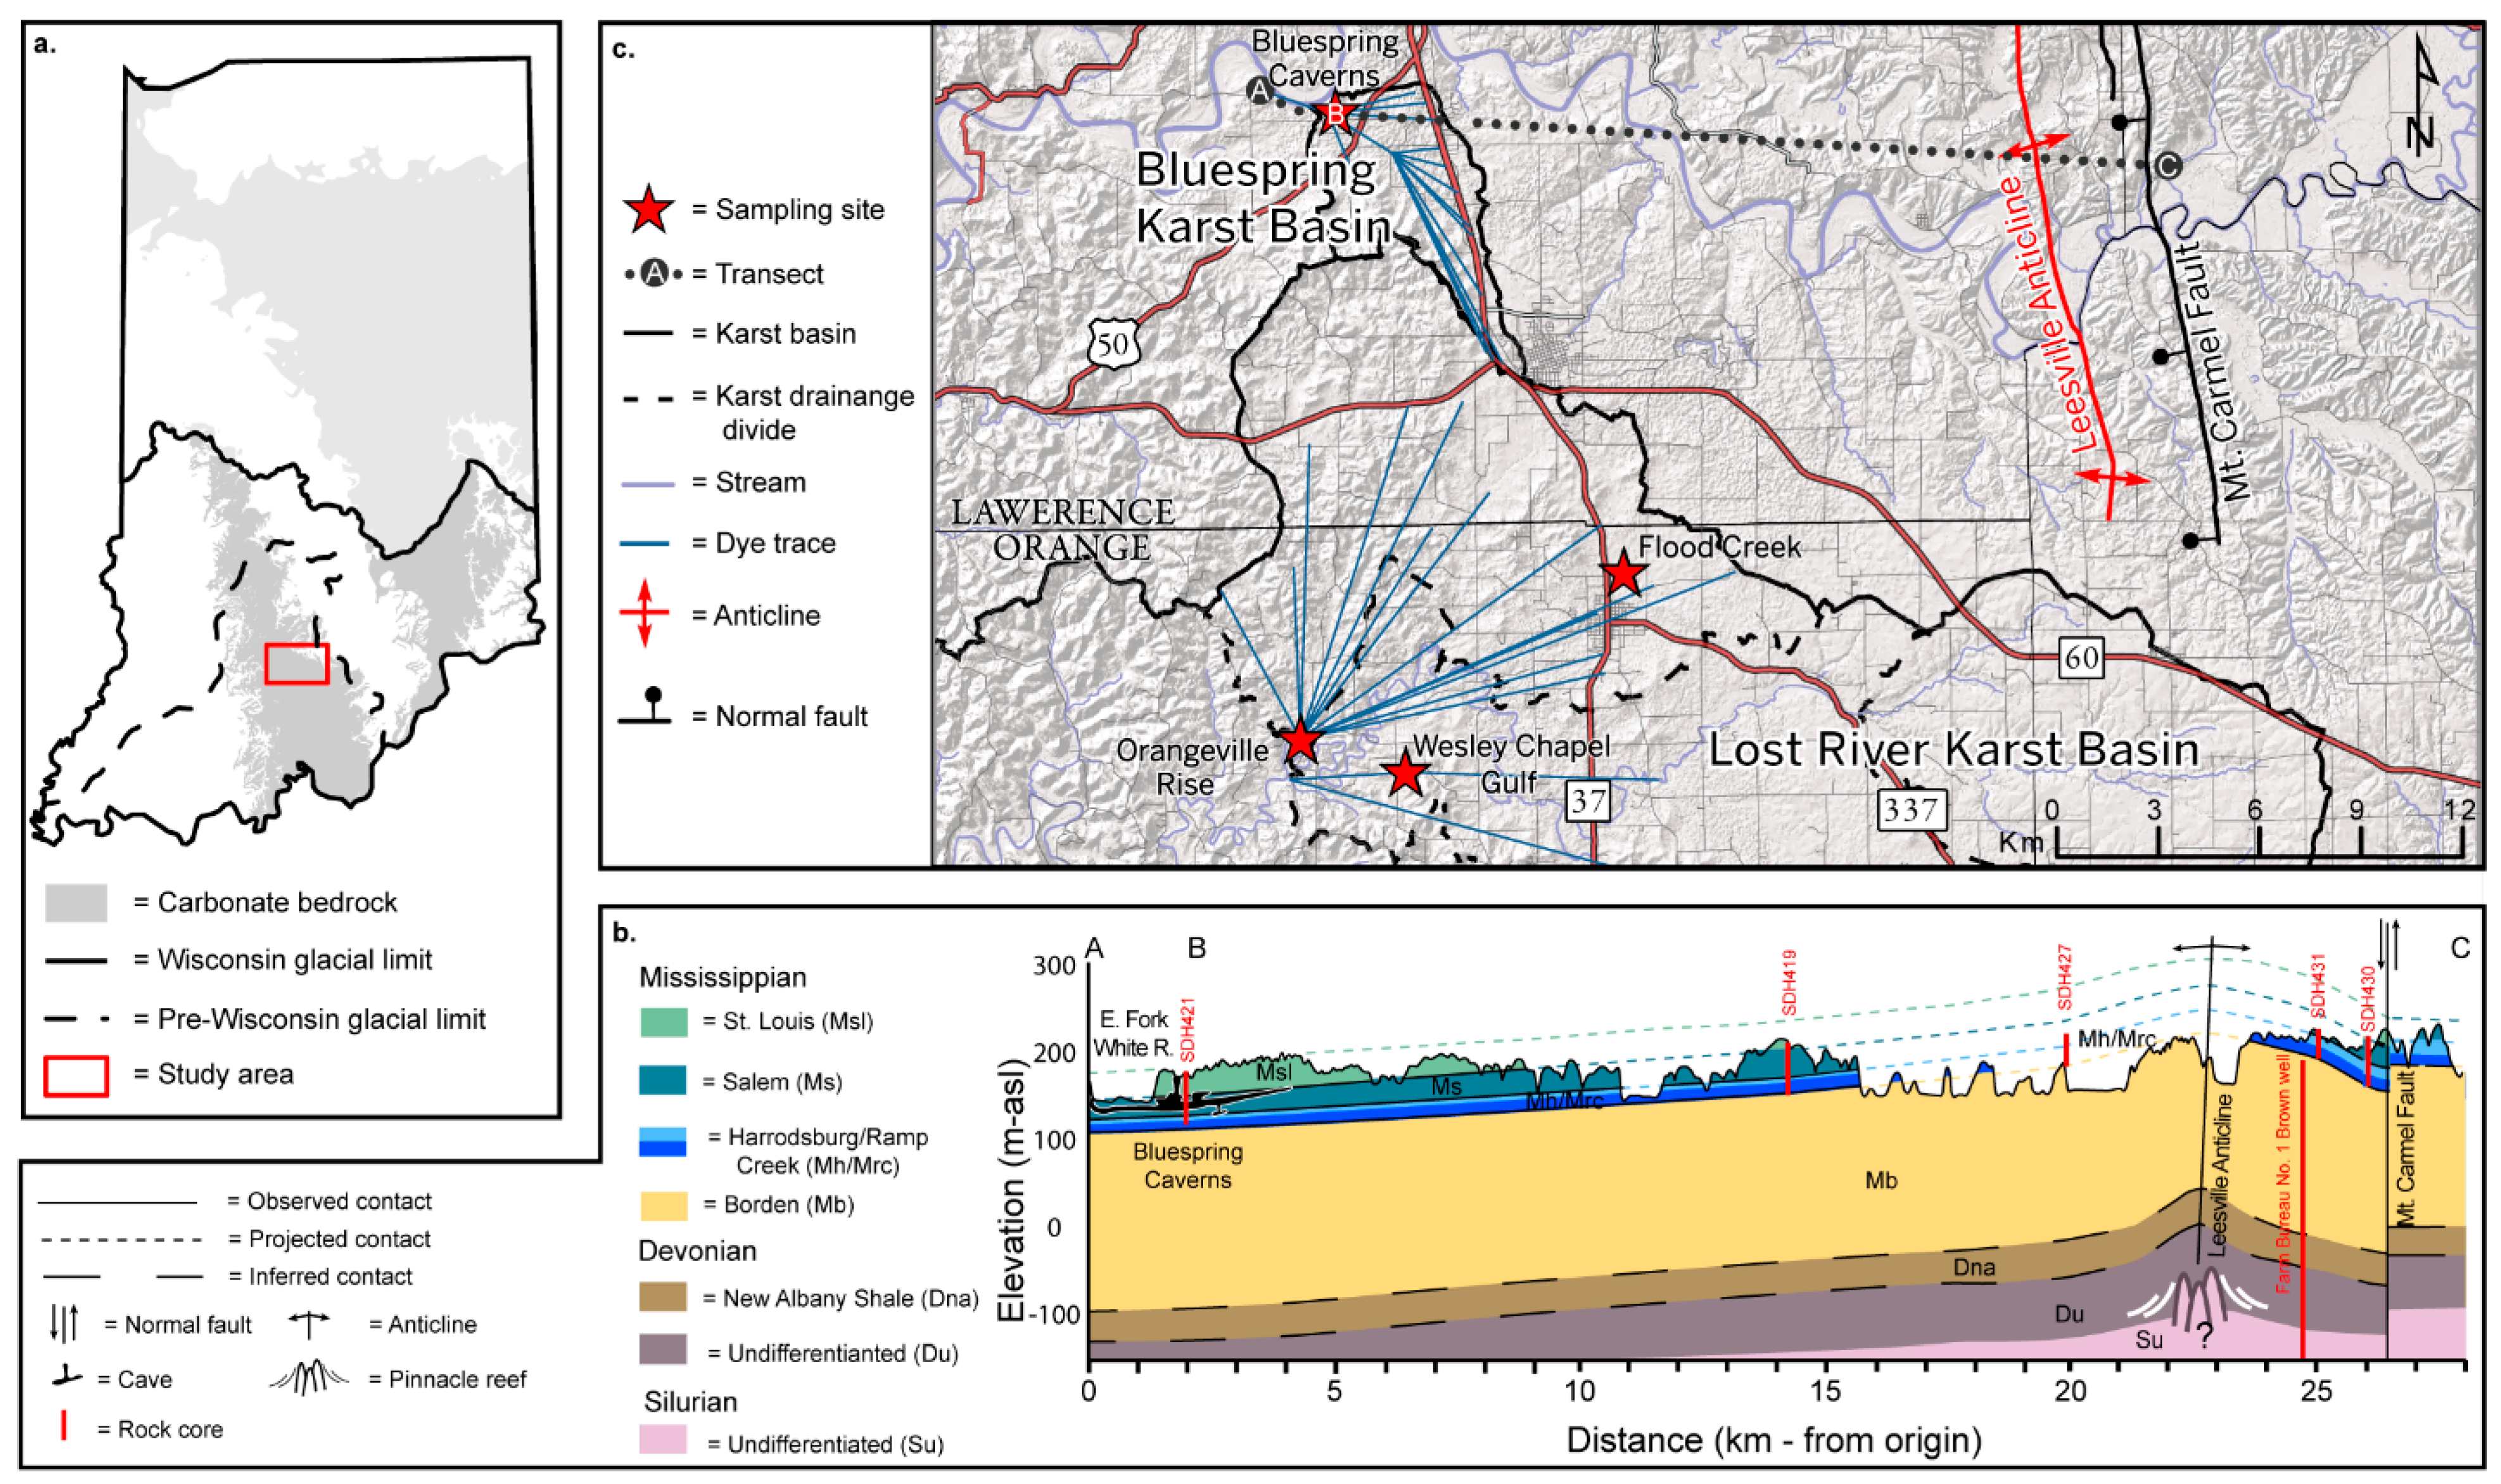
2. Site Characterization and Setting

The Paleozoic carbonates of south-central Indiana in this study are south of the glacial limit (Figure 1a), and contiguous with other important karst regions in the Interior Lowland Plateaus, including the Mammoth Cave in Kentucky. The morphology and spatial extent of the Mitchell Plateau are guided by the outcrop belt of the Mississippian Sanders and Blue River Groups. Carbonates of the Sanders Group consist of an upward transition from the Borden siliciclastics through a mixed carbonate–siliciclastic facies suite (Ramp Creek Formation and Harrodsburg Limestone) to the grainstone of the Salem Limestone. The overlying Blue River Group includes heterogenous carbonate facies of the St. Louis, Ste. Genevieve, and Paoli Limestones.
Of particular importance to the regional hydrogeology and geochemistry of groundwater are pervasive evaporites in the Blue River Group—for example, lagoonal and sabkha depositional cycles in the lower St. Louis Limestone that include significant interbedded anhydrite, gypsum, dolomite, and high-Mg limestone. The evaporites are primarily removed by dissolution in the outcrop belt [51], but are preserved downdip as economically important reserves. Where evaporites are removed, highly porous and permeable breccia [52] provides an efficient flow path for infiltrating meteoric waters. Thus, a. priori, a chemical transition toward sulfate-rich waters occurs downdip.
Subtle but significant geologic structures exist in the Mitchell Plateau (Figure 1b). For example, the Leesville Anticline, and associated domes, is a 15 m amplitude structure likely draped on Silurian pinnacle reefs. Elsewhere in Indiana, the co-occurrence of Silurian reef structures and the Devonian Geneva Dolomite has been explored for oil and gas development [49]. At present, the Leesville Anticline is used for natural gas storage [53]. East of and trending parallel to this anticline, the Mt. Carmel Fault (Figure 1b) [54] extends to the basalt of the Precambrian basement [49]. Fluid inclusion studies of rocks near the Mt. Carmel Fault demonstrated temperatures of 20 °C to 40 °C [55] that suggest emplacement of the observed fluorite and iron sulfides by brine fluids [56].
This research is focused on the adjacent Bluespring and Lost River karst basins near the city of Mitchell (Figure 1c). The Köppen climate classification is humid subtropical [57] with average seasonal temperatures that are the warmest in July (24.2 °C) and coolest in January (−1.05 °C) [58]. Average annual precipitation is 133 cm and is seasonally weighted toward wintertime and springtime rainfall, with monthly average maxima of 11.5 cm in May and minima of 7.7 cm in October.
Meteoric recharge in the Bluespring karst basin is primarily autogenic through sinkholes and other epikarst and collects in Bluespring Caverns, comprising 34 km of surveyed cave passage—a type of dendritic cave pattern [59]. Groundwater discharge from this basin is via an aggraded rise pool on the bank of the East Fork White River [45].
The Lost River karst basin (Figure 1b) spans 125 km2; includes the largest sinking stream in Indiana, the Lost River Cave with >34 km of surveyed passages, and straddles the Mitchell Plateau and the Crawford Uplands physiographic regions. Groundwater flow in the Lost River karst basin is roughly parallel to the west-trending regional dip and rises near the community of Orangeville [45]. In base flow, runoff sinks in the dry bed reach of the Lost River via a series of swallow holes. During elevated flow and storm events, the hydraulic capacity of these swallow holes and subsurface conduits is overwhelmed and overland flow returns to the dry bed.
This study includes data from Bluespring Caverns and three locations in the Lost River karst basin—Flood Creek, a sinking stream; Wesley Chapel Gulf, a karst window; and Orangeville Rise, a spring.

3. Methods

3.1. Discrete Water Samples

Discrete sampling for this study occurred twice monthly between 14 February 2019 and 3 November 2020 at Bluespring Caverns, Flood Creek, Wesley Chapel Gulf, and Orangeville Rise. The span of these discrete sample data includes two annual cycles of seasonal changes to surface water and groundwater and 42 distinct sampling campaigns. In total, 154 complete sets of water samples were collected: 42 from Bluespring Caverns at the boat dock in the tourist entrance to the cave, 29 from Flood Creek at the headwaters, 41 from Wesley Chapel Gulf at the Boiling Spring rise pool, and 42 from Orangeville Rise at the rise pool. There are two notable exceptions to the complete record. First, a safety issue at Wesley Chapel Gulf on 24 January 2020 prevented sample collection. Second, the ephemeral nature of Flood Creek reduced the sampling record. Precipitation records were used to add context to our water sampling data. For the first year of the study, daily precipitation records from the Indianapolis airport were used, about 120 km north of Bluespring Caverns [60]. In the second year of the study, a local rain gauge was set up and maintained at Bluespring Caverns.
Complementing these discrete samples are other samples taken outside the scheduled sampling campaigns and data collections used as points of comparison. These include previously published data on water chemistry in the Lost River karst basin [9], targeted samples of water and gypsum from inside Bluespring Caverns, stratigraphic and petrologic records from rock cores at the Indiana Geological and Water Survey (IGWS), and processed samples of regional gypsum and anhydrite from a set of these IGWS rock cores.
Sampling methods and quality assurance/quality control protocols—including equipment and field practices, sample preservation and storage, and field and lab calibrations—follow standard U.S. Geological Survey practice [61]. We used a combination of in-house and contractual services for analyses, including a YSI-ProDSS (YSI Inc., Yellow Springs, OH, USA) for field measurements, inflection-point titrations for alkalinity, and a HACH spectrophotometer (HACH, Loveland, CO, USA) for [SO42−] (performed at the Indiana Geological and Water Survey); ion chromatography for anions and inductively coupled plasma–mass spectrometry for cations (performed by the Indiana State Department of Health); and ion-ratio mass spectrometry for δ13C on a Thermo Finnigan DeltaPLUS XP IRMS (Thermo Finnigan LLC, San Jose, CA, USA) with Thermo Gasbench II and autosampler peripherals and δ34S on a Thermo Finnigan DeltaPLUS XP IRMS connected to a Thermo TC/EA interfaced with a ConFlo III and a Thermo Finnigan Delta-V IRMS connected to a Thermo EA (performed by the Indiana University, the University of Kentucky, and the Illinois State Geological Survey). Samples for δ34S were prepared using different procedures depending on the sample media. Sulfate was precipitated out of water samples by acidifying 1 L of filtered water to a pH of 3–4 using 10% HCl, adding 10 mL of Back solution, and then filtering and drying the precipitate. Gypsum samples were dissolved over three days in 250 mL of deionized water after which point the eluent was processed with the same method as water samples. The volatility of H2S required fixation at the time of sample collection. A 3-way luer-lock attached to a syringe was used to slowly draw 1 L of sample and inject it below a 0.1 M zinc acetate solution at a pH of 10–11 in situ to form ZnS without oxidizing the sample. The precipitate was reacted with AgCl in the lab to stabilize it as Ag2S before filtering and drying the sample for mass spectrometry.

3.2. Mixing Models

Bluespring Caverns. A system of two equations (Equations (8) and (9)) was used to produce a geochemical model for sulfur speciation at Bluespring Caverns, with the proportions of sulfur described as the ratio (X1) of the sulfur concentration of two end members (1 and 2) to the total (T) sulfur concentration (Equation (10)).
δ34ST = X1δ34S1 + X2δ34S2
[SO4]T = [SO4]1 + [SO4]2
X1 = [SO4]1/[SO4]T
Field data for [SO4] and δ34ST were collected as part of routine measurements at Bluespring Caverns, while δ34S1 was determined from the analysis of all δ34S values collected in the study and δ34S2 was measured from H2S end members in Bluespring Caverns. The derivation is provided below.
If [SO42−]T is the sum of two components, [SO42−]1 and [SO42−]2 (Equation (9)), then the sum of the ratios X1 and X2 is unity. By substituting this concept into Equation (10) and solving for X2,
X2 = 1 − ([SO4]1/[SO4]T).
Then, by combining Equations (10) and (11) into Equation (8), we find that
δ34ST = ([SO4]1/[SO4]T) δ34S1+ [1 − ([SO4]1/[SO4]T)] δ34S2.
To solve [SO42−]1, Equation (5) is rewritten as
δ34ST = ([SO4]1)(δ34S1/[SO4]T) + δ34S2 − ([SO4]134S2/[SO4]T), or
δ34ST − δ34S2/[(δ34S1/[SO4]T) − (δ34S2/[SO4]T)] = [SO4]1
Using Equations (9) and (14), the concentrations of the contributing end members can be determined if the end members are properly described and [SO4]T is known.
Orangeville Rise. Ref. [9] demonstrated that only one equation was needed to calculate the speciation of sulfur coming from the lower flow paths at Orangeville Rise based on a modeled linear relationship,
%Qdf = 47.197[SO4]T − 7.7749,
where %Qdf is the percent of total discharge coming from diffuse flow in the lower flow paths and is a function of total sulfur in mmol/L.
If diffuse flow is equilibrated with respect to sulfur, the proportion of discharge coming from the lower flow path can be multiplied by the total sulfur concentration for the partition of sulfur coming from the lower flow path at Orangeville Rise, as shown below.
[SO4]eva = (%Qdf/100) [SO4]T

4. Results

4.1. Discrete Water Samples
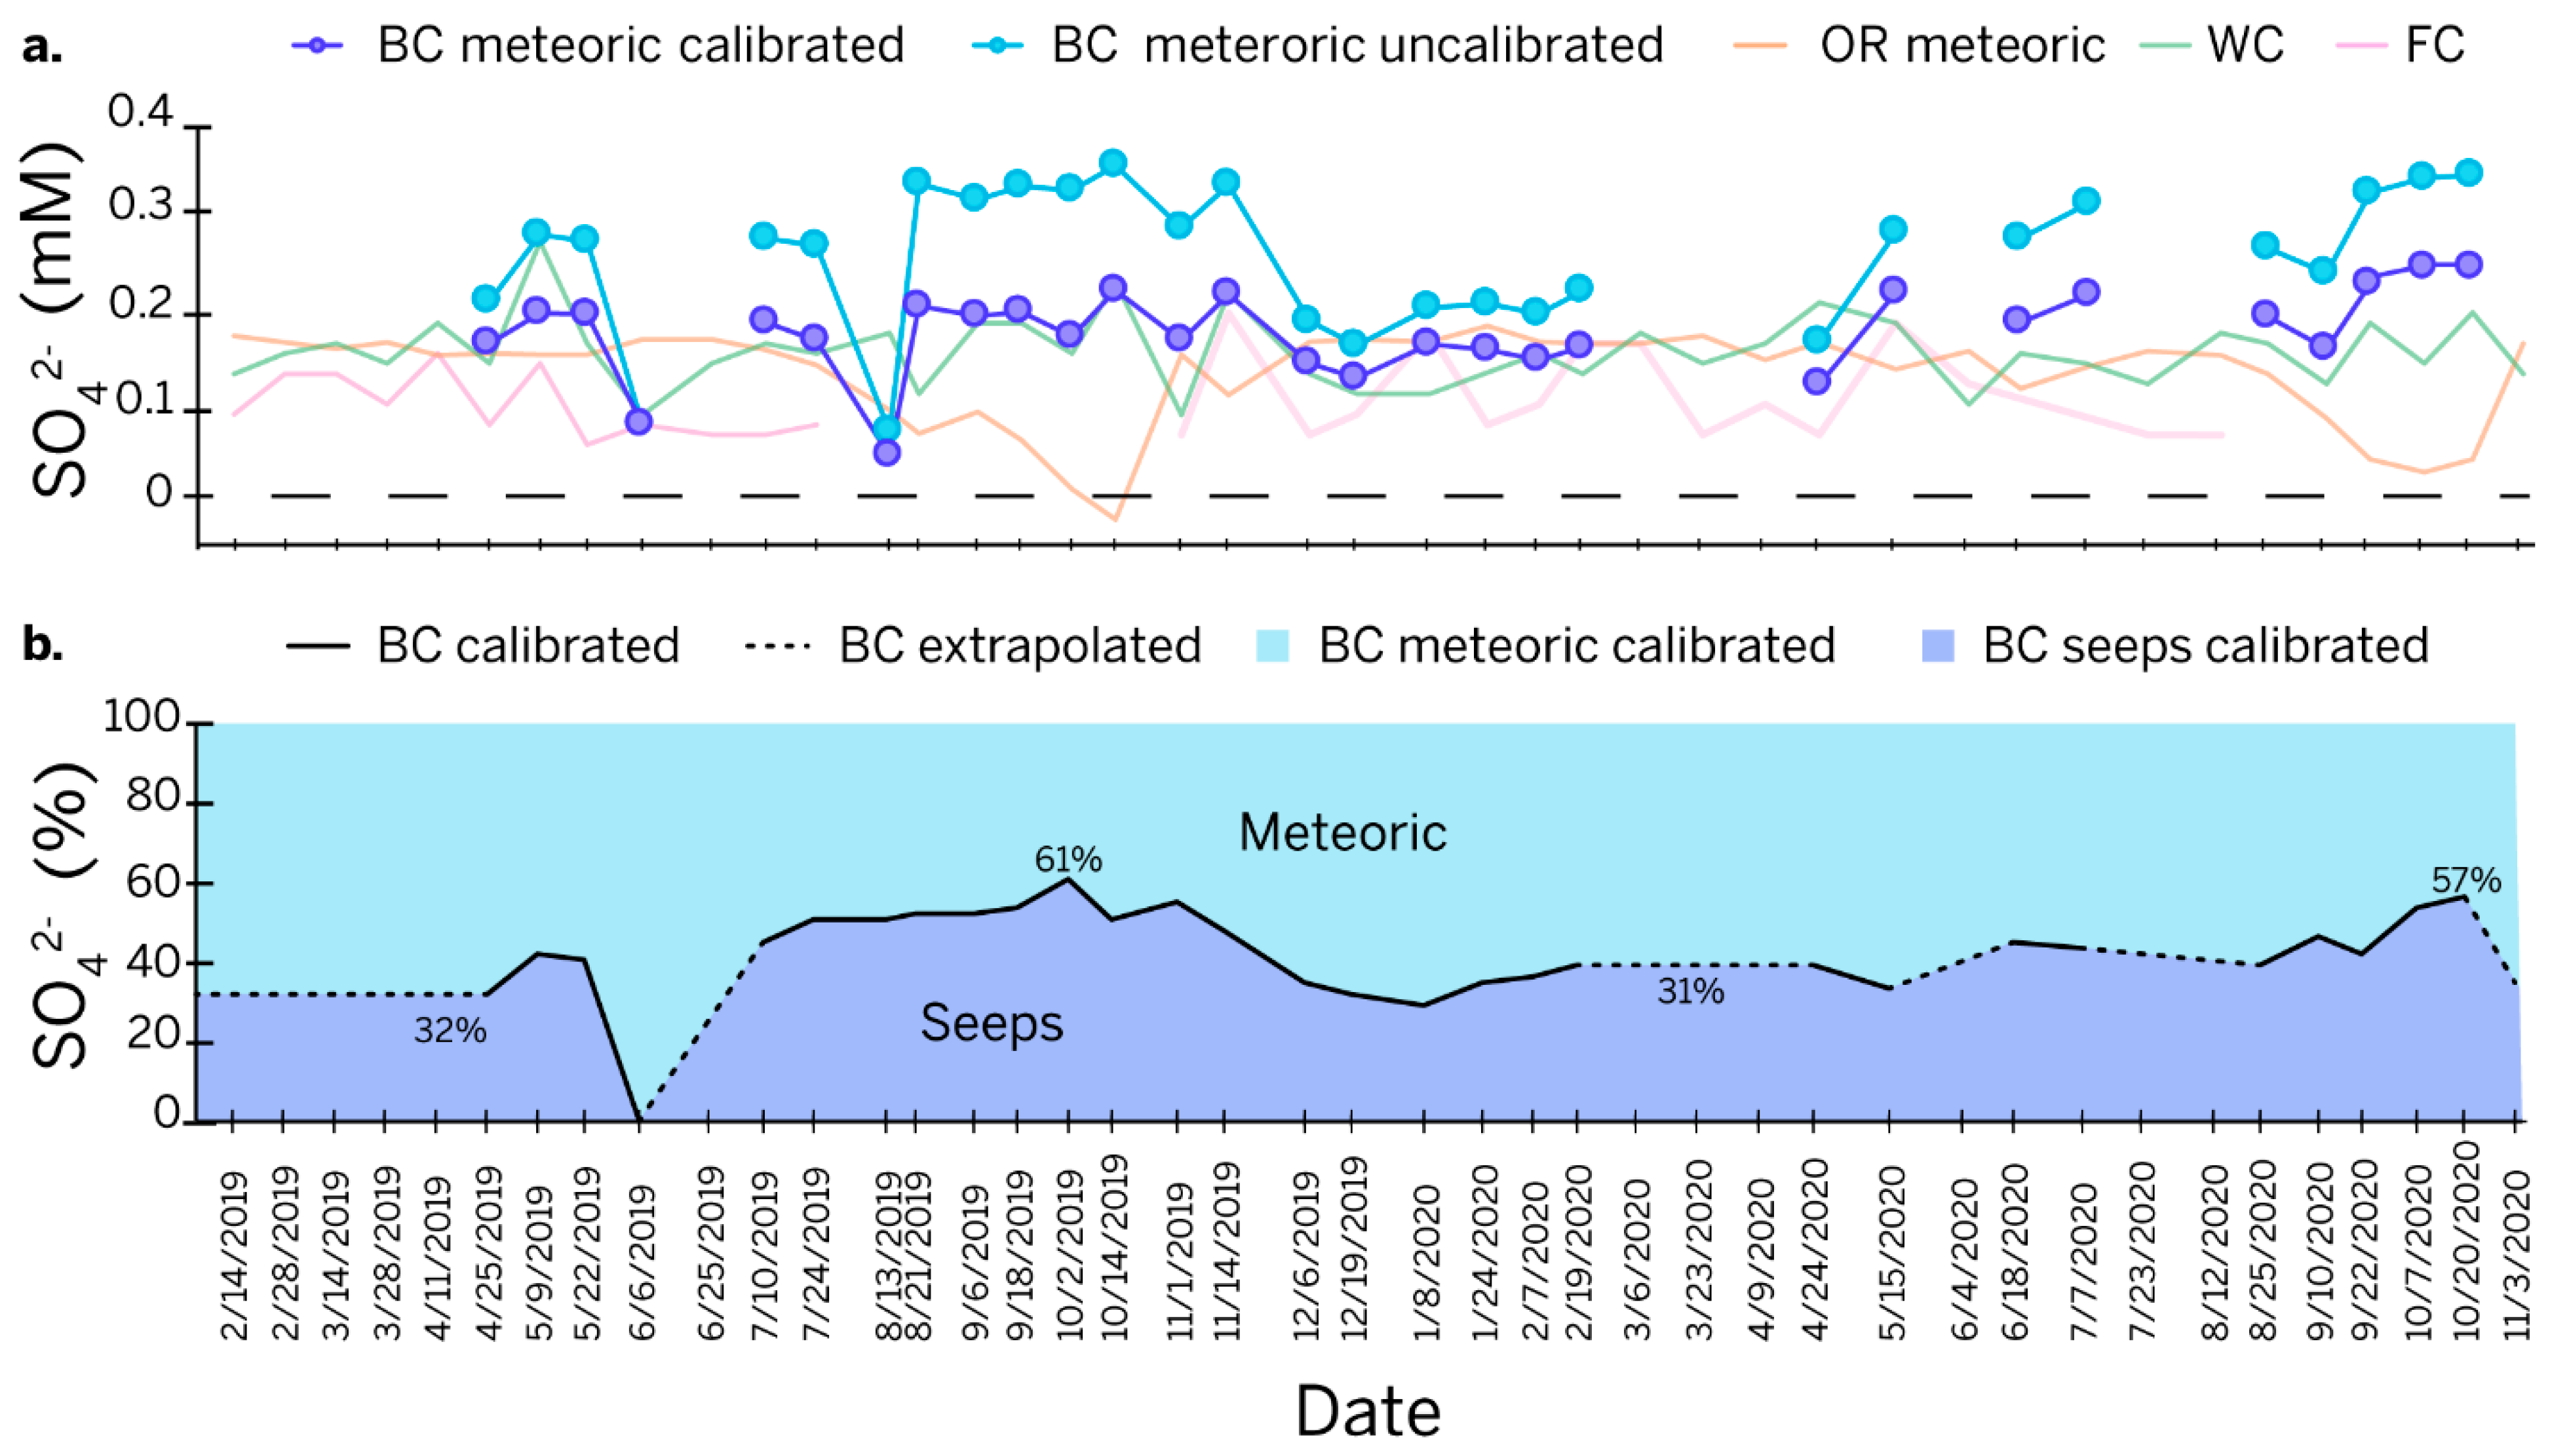
The stream bed at Flood Creek was dry from late summer to late autumn in both 2019 and 2020, used henceforth to define the dry season in this study. The discrete samples do not identify which specific days the stream bed became inactive and reactivated, so the dates are approximated as halfway between the wet and dry observations. Using this definition, the dry season spanned 13 August 2019 to 23 October 2019 and 2 August 2020 to 27 October 2020. Compared to the average monthly precipitation from 1981 to 2010 [58], 2019 had an exceptionally wet spring and an arid summer and fall, while 2020 was closer to average.
Daily precipitation totals combined with specific conductivity measurements (Table S1) (Figure 2a) provide a critical context for the study. During most of the year, the specific conductivity at Bluespring Caverns was the highest, except during dry season when the specific conductivity at Orangeville Rise climbed above the values at Bluespring Caverns. Wesley Chapel Gulf displayed a lower amplitude increase in specific conductivity during the dry season of 2019 and even less so in 2020. Outside of the dry season, specific conductivity at Orangeville Rise was slightly but consistently higher than at Wesley Chapel Gulf. The surface water at Flood Creek had the lowest specific conductivity of all sites.
[SO42−] varied seasonally at the sample sites with somewhat different overall trends (Table S2 and Figure 2b). [SO42−] values were almost always the highest at Orangeville Rise, peaking during the dry season at almost 2 mmol/L on 14 October 2019 and 1.5 mmol/L on 20 October 2020. [SO42−] values were the next highest at Bluespring Caverns. During the dry season, [SO42−] values at Bluespring Caverns had a broader peak than at Orangeville Rise, reaching maximums of about 0.4 mmol/L in both 2019 and 2020. [SO42−] values at Flood Creek and Wesley Chapel Gulf were comparable for most of the year, averaging about 0.1 mmol/L but increasing to more than 0.2 mmol/L during the dry season at Wesley Chapel Gulf.
Values of δ34S in the routine samples were difficult to measure when [SO42−] levels were less than 0.25 mmol, resulting in an incomplete data set. This is particularly true for Flood Creek (n = 12) and Wesley Chapel Gulf (n = 15), where [SO42−] never or rarely reached this threshold. Sulfur isotopes in the Lost River watershed ranged from δ34S = 3.10‰ at Flood Creek on 21 April 2020 to δ34S = 16.0‰ at Orangeville Rise during the dry season on 20 October 2020. In the Bluespring watershed, sulfur isotopes at Bluespring Caverns ranged from δ34S = −1.40‰ during the dry season on 2 October 2019 to δ34S = 2.80‰ during the 6 June 2019 flood event. Seasonally, δ34S became more enriched in the heavier isotope at Orangeville Rise but more depleted in the heavier isotope at Bluespring Caverns during the dry season. The δ34S values at Wesley Chapel Gulf and Flood Creek are too low to observe seasonal trends.
Values of δ34S from routine sampling were supplemented with analyses of St. Louis evaporites dissolved from cores (Table 1). Evaporites of δ34S for the St. Louis Limestone ranged from 14.50‰ to 17.91‰ with a trend toward more enrichment in 34S with increasing depth measured from the top of St. Louis. The evaporite bearing intervals sampled in the lower St. Louis Limestone tended to have a higher purity of gypsum and anhydrite as well as higher solubility. Core log descriptions from the sampled intervals indicate that anhydrite and gypsum were often associated with dolomite, particularly in the lower St. Louis Limestone.
An unexpected result of this study was the documentation of newly described petroleum seeps in the Second Discovery of Bluespring Caverns, approximately 2 km of the navigable passage upstream and northeast of the boat dock. The petroleum seeps (Figure 3) are relatively small (30 cm long and 10 cm wide) and identified by black bitumen surrounded by white sulfur metabolizing bacterial colonies. Some seeps were associated with fractures in the bedrock, while others ambiguously appeared in the streambed. Positive flow was observed, although not measured, coming from the seeps. A spot measurement of specific conductivity was taken at 1335 μS/cm, and samples were collected for δ13CDIC, and δ34S of sulfate (Table 2). H2S was detected during the initial sampling but could not be collected without specialized equipment. During a second sampling trip, the seeps were revisited to collect δ34S values of H2S in addition to the other stable isotopes (Table 2). Supplementing the water samples, two samples of cave gypsum were collected from a dry level passage parallel to the one housing the petroleum seeps and were analyzed for δ34S (Table 2).

4.2. Mixing Models

Bluespring Caverns. A two-component sulfur isotope mixing model was constructed for Bluespring Caverns using δ34S = 2.8‰ as a meteoric sulfur end member and δ34S = −14.1‰ as an end member for sulfur emerging from the petroleum seeps. These values were used for δ34S1 and δ34S2, respectively, for Equations (8) to (14) to solve the concentrations of each component, where [SO42−]1 is [SO42−]met and [SO42−]2 is [SO42−]seeps (Table S3). Based on these initial modeled values, the percentage of sulfur contributed by petroleum seeps ranges from 0% during the 6 June 2019 flood to 25% during the dry season on 2 February 2019. According to the untuned model, an average of 17.4% of the sulfur measured at the boat dock of Bluespring Caverns can be attributed to sulfur escaping from petroleum seeps in the upstream reaches of the cave.
Orangeville Rise. Sulfur speciation at Orangeville Rise was modeled using the linear relationship (Equation (16)) between [SO42−] and discharge from diffuse flow found in [9].
Based on the modeled values for sulfur speciation at Orangeville Rise (Figure 4 and Table S4), the percentage of sulfur contributed by the dissolution of evaporites in the St. Louis ranges between −4% on 21 January 2020 and 85% during the dry season on 14 October 2019. In this model, most of the sulfur in the rise pool during the dry season is derived from St. Louis evaporites. The occurrence of a negative percentage in the modeled data coincides with the lowest measured [SO42−] at Orangeville Rise in this study. The value could be an erroneous measurement or an indication that the [SO42−] measurements in [9] used to create their model are calibrated differently than the data from this study.

5. Discussion

Dissimilar groundwater chemistry in adjacent karst basins illustrates the heterogeneity of karst development. In this discussion, we present a comprehensive look at the systematics of inorganic carbon and sulfur in the Bluespring and Lost River karst basins grounded in published studies and enhanced by new insights from other karst regions. We begin by evaluating the hypothesis that the Mitchell Plateau will have geochemistry reflective of a classic epigenetic karst system. Then, data that cannot be explained by the classic model of epigenetic speleogenesis are evaluated through the lens of isotope mixing and stoichiometric models. The inferences made based on these geochemical relationships are then contextualized in the geologic setting of the study sites through comparisons to supplementary data from rock cores, cave gypsum, and petroleum seeps. We conclude our discussion with a new conceptual model for speleogenesis that likely manifests across mid-continent environments.

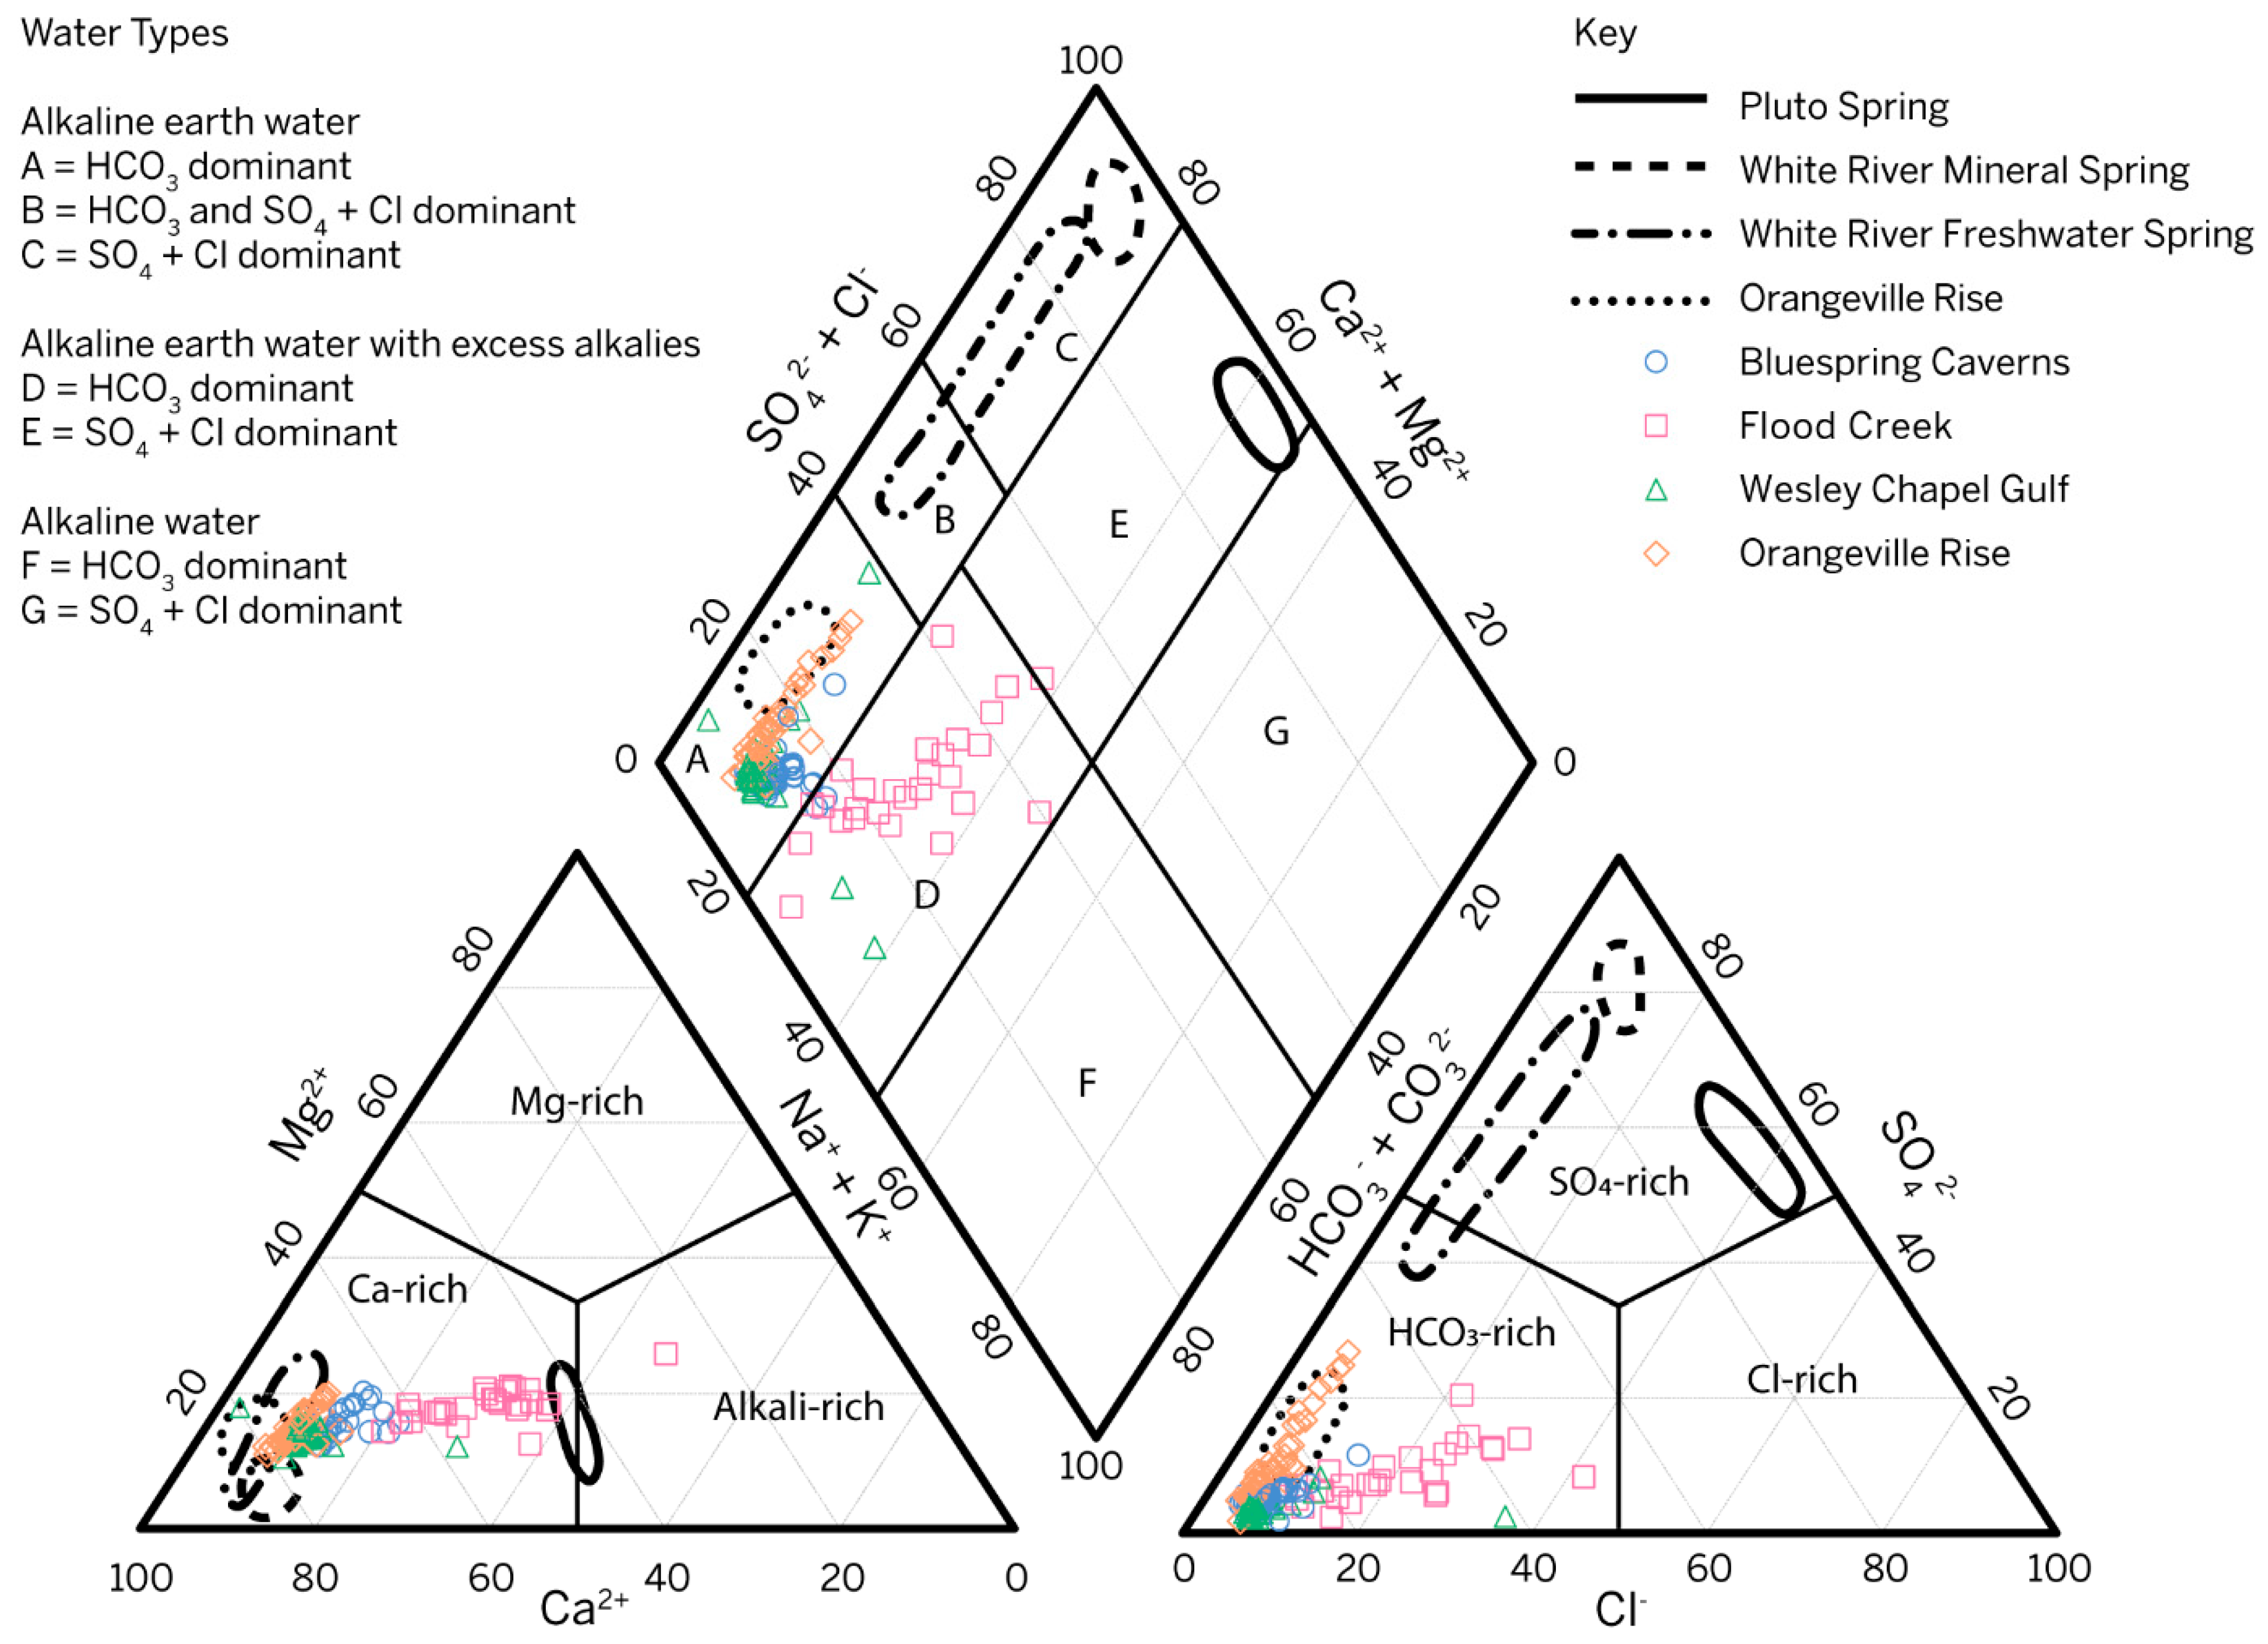
5.1. Water Types in Mitchell Plateau Groundwater

Water samples from the Mitchell Plateau fall into two different hydrochemical facies or water types as defined by [62] after [63]. All samples collected from Orangeville Rise and most samples from Wesley Chapel Gulf and Bluespring Caverns are HCO3-dominant, alkali earth waters, which is typical of carbonate aquifer systems (Figure 5). Samples collected from Flood Creek and the remaining samples from Wesley Chapel Gulf and Bluespring Caverns are HCO3-dominant alkali earth waters with excess alkalis (Na and K). The distribution of samples in Figure 5 central diamond reflects the evolution of water in the Lost River karst basin from a point of recharge at Flood Creek to a point of discharge at Orangeville Rise. Conceptually, in the Lost River karst basin, water at Flood Creek evolves toward the lower left diamond axis with higher [HCO3], converging at the median values of Wesley Chapel Gulf. As recharging water flows through the vadose zone and karst windows, like at Wesley Chapel Gulf, it then accumulates a higher [SO42−], drawing the distribution at Orangeville Rise from the lower SO42− end of alkali earth waters toward more SO42−-dominated waters (from the lower left side of field A toward field B in Figure 5). This follows the trends in data from [8] where Orangeville Rise trends toward SO4 + Cl-dominant Earth alkaline water like that observed at the White River springs and at the French Lick mineral springs downdip of the study area. Since ion data were only collected from the boat dock in the Bluespring karst basin, the same interpretation of geochemical evolution of water along the flow path cannot be made. For cations, Mg2+ clearly influences the chemistry in both Bluespring Caverns and Orangeville Rise. For anions, Cl and SO42− influence the chemistry of Bluespring Caverns, while Orangeville Rise only varies significantly with respect to SO42−. Wesley Chapel Gulf water chemistry has limited variation outside of outliers. Compared to the data from [8], the trends of our Orangeville Rise data highlight the transition between meteoric and mineralized waters at geographic change from the Mitchell Plateau to the Crawford Uplands.

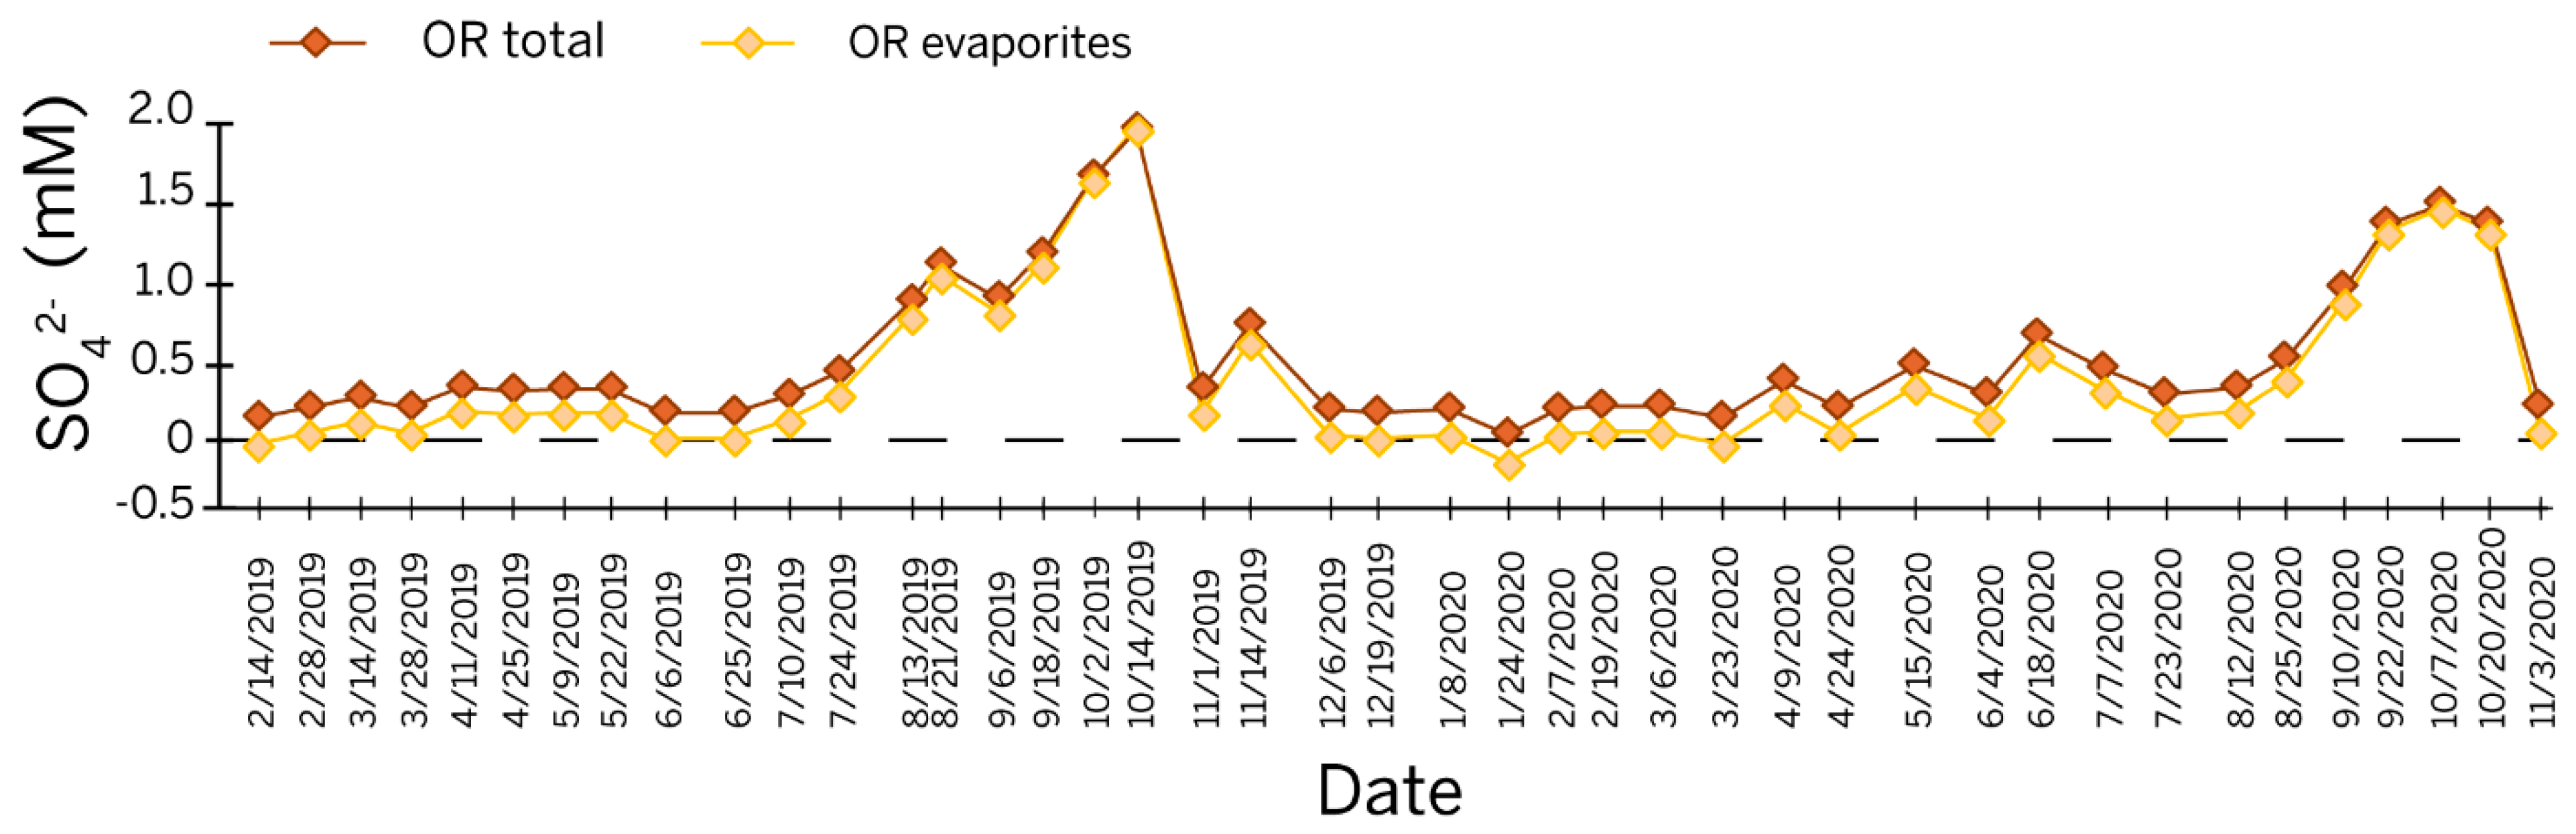
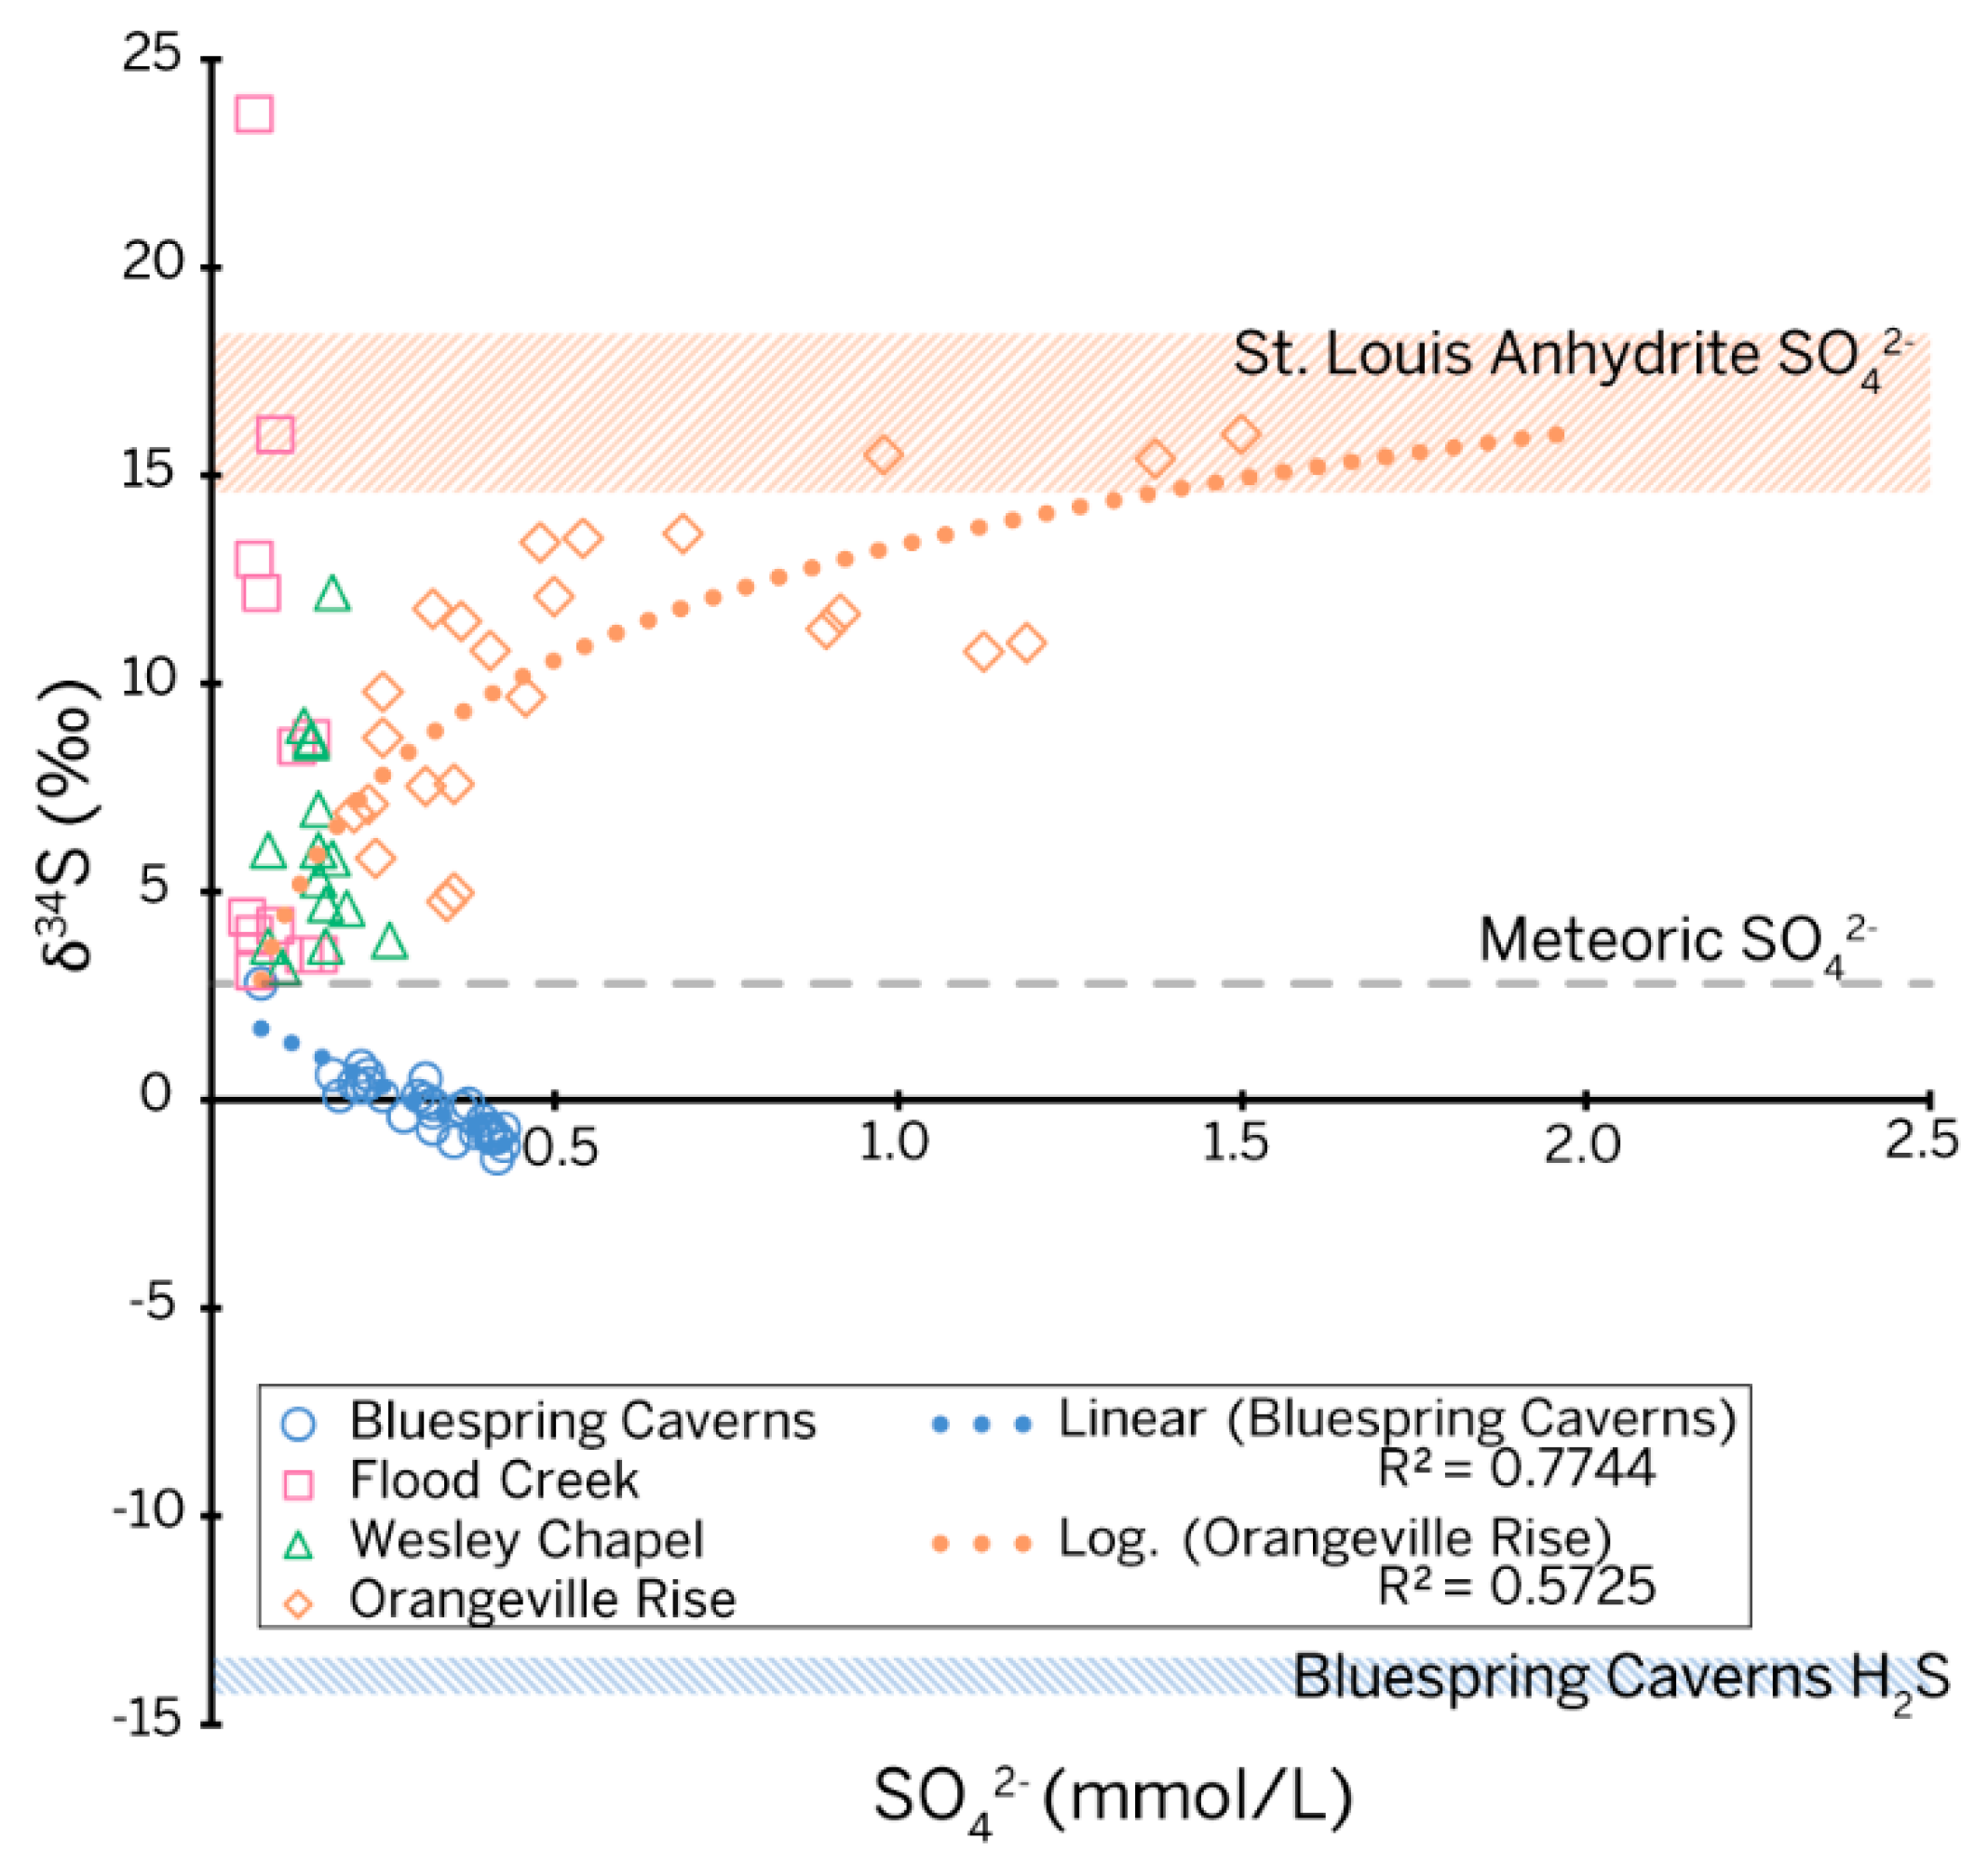
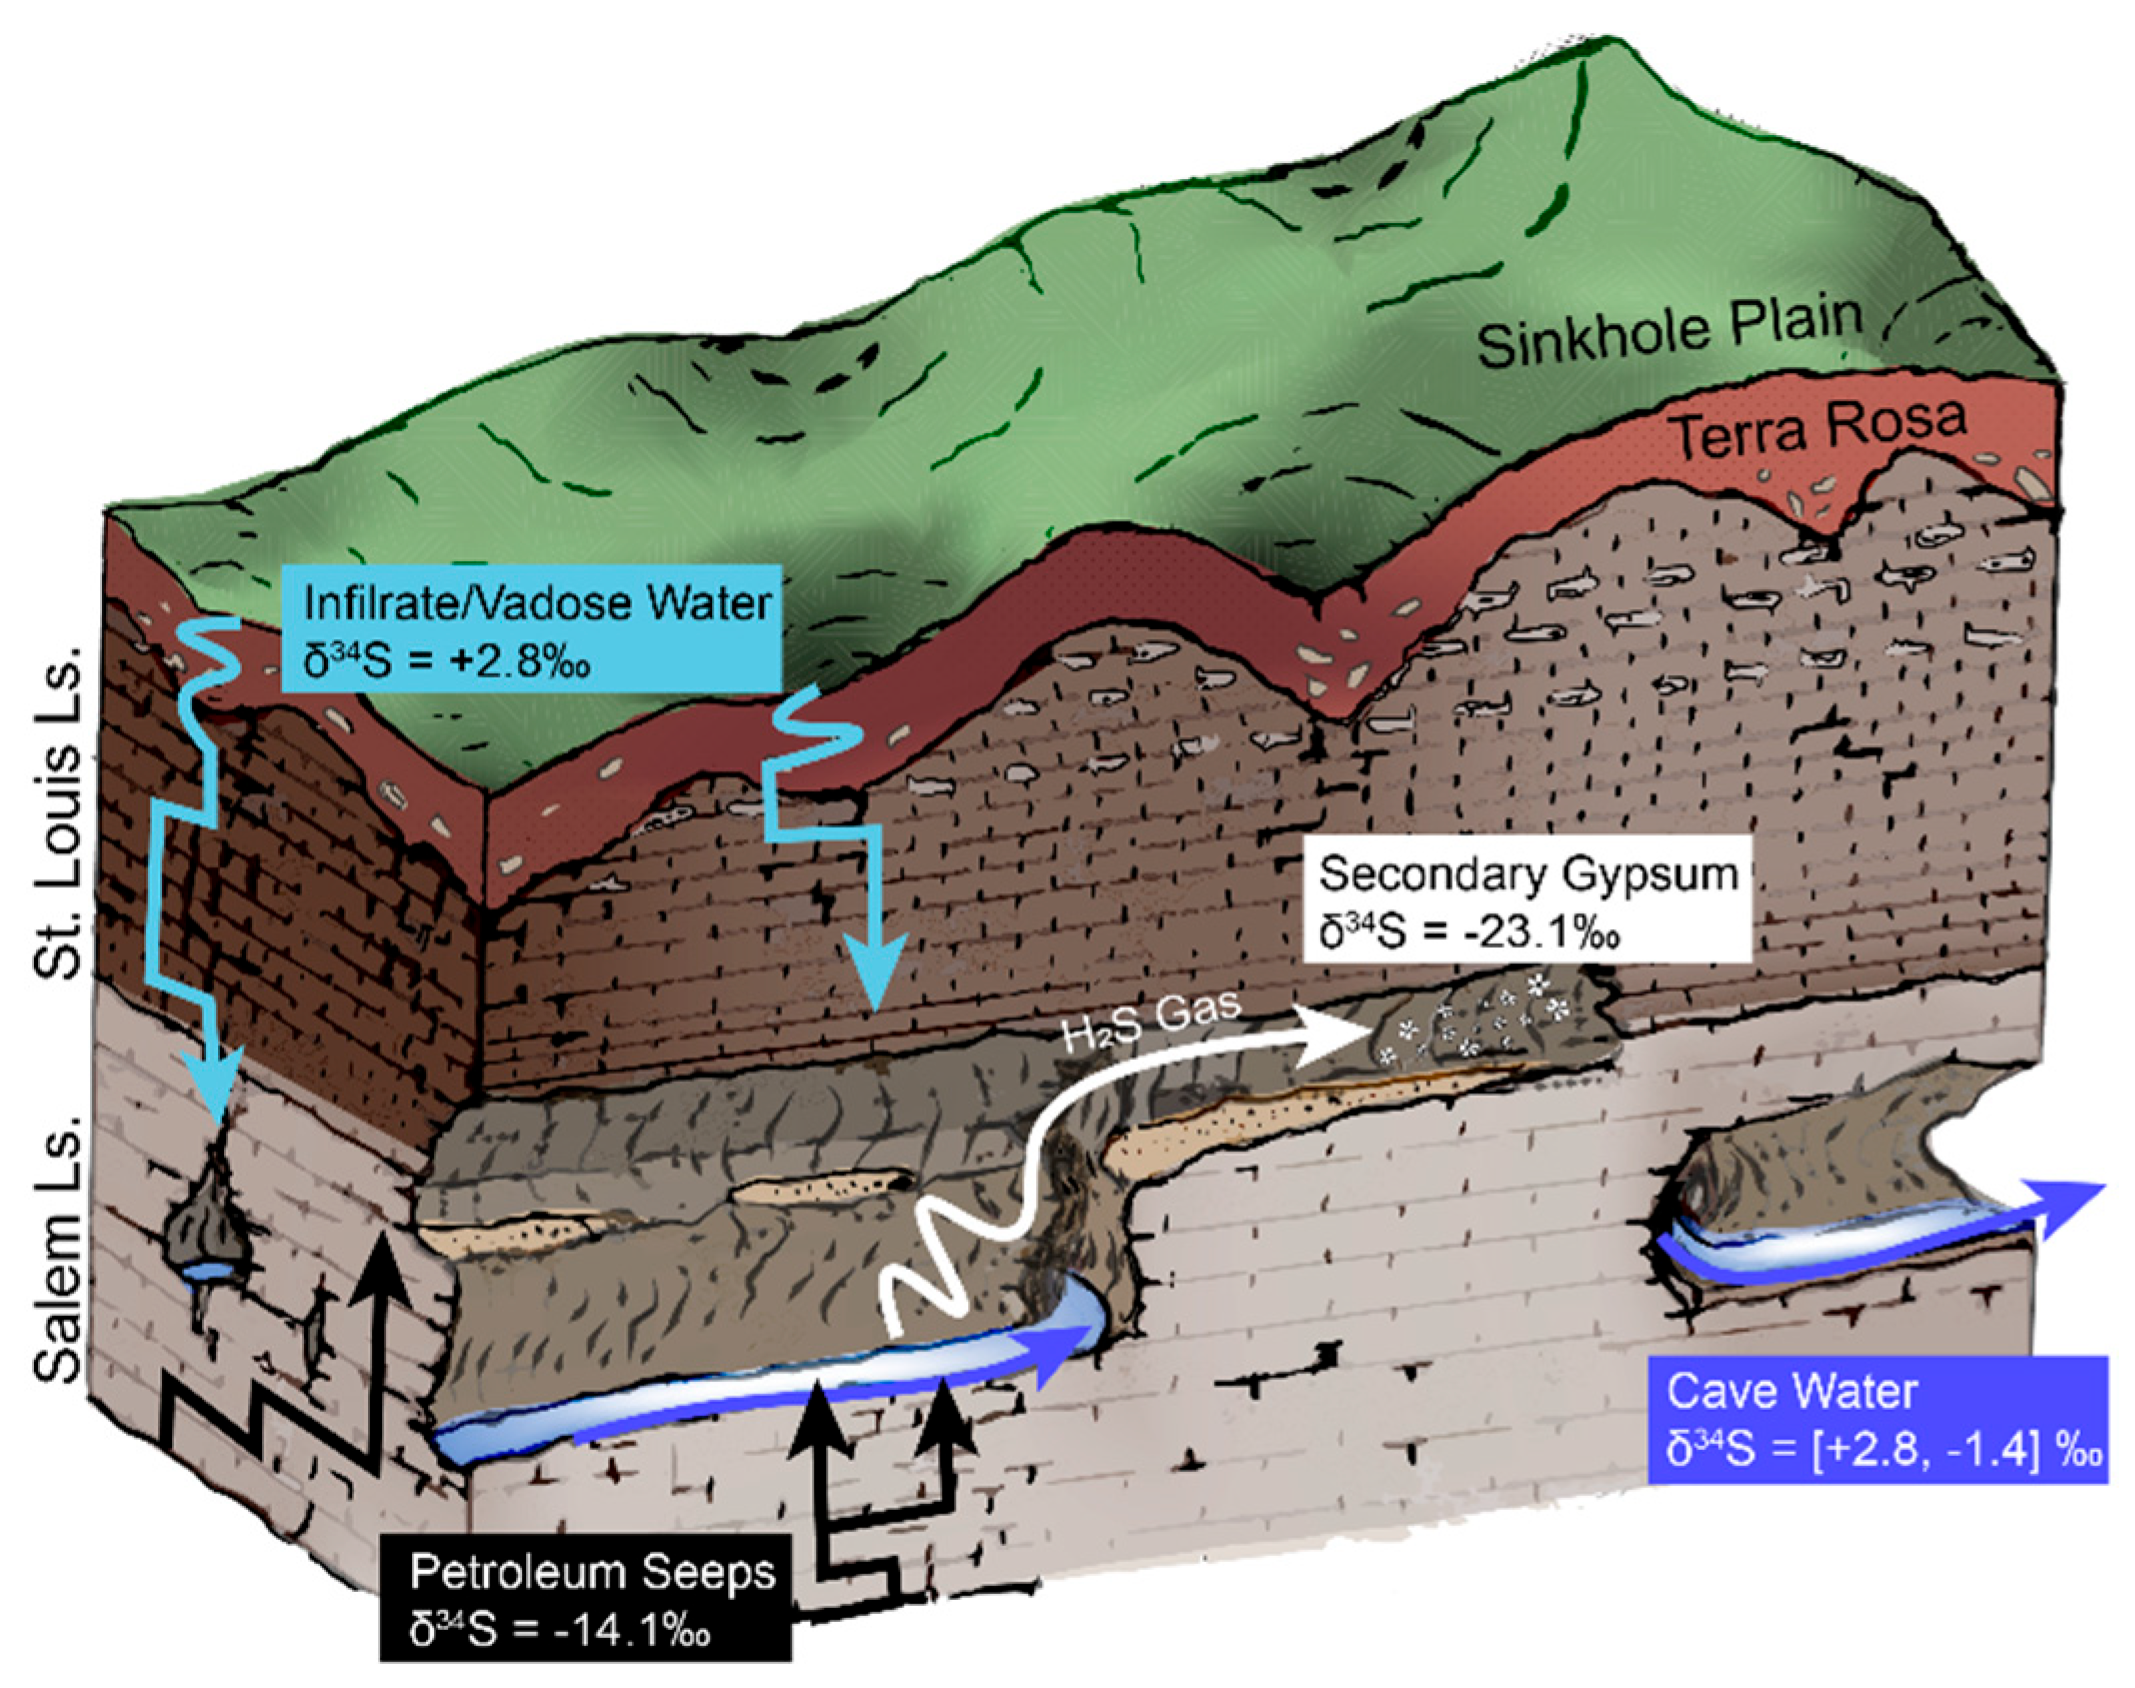
5.2. Sulfur Systematics in the Mitchell Plateau

The δ34S-[SO42−] plot (Figure 6) shows different behavior for each site, where all sites share a common projected origin of 2.80‰. Interestingly, this is the mean value for vadose sulfur collected in 1998 by [9] for their three-component mixing model.
As an ephemeral sinking stream, Flood Creek was expected to provide sulfur isotope values that could be used as an endmember for meteoric sulfur. Half of the sulfur isotope values returned for Flood Creek clustered near the projected origin; however, the other half spread vertically. A temporal assessment of the data correlates the 23.70‰ peak in sulfur isotopes at Flood Creek with the sampling date following the major flood event on 6 June 2019, suggesting increased runoff from the surrounding farm fields. The likely source of isotopically enriched sulfate in Flood Creek is gypsum additives in fertilizer. Importantly, Flood Creek reached a minimum δ34S value of 3.10‰. The similarity between this value of δ34S with limited water-rock interaction and values from water sampled from the vadose zone suggests that meteoric and vadose waters are not distinguishable based on sulfur alone. Although the temporal resolution of our study did not allow for water isotopes to be used tracers in the same way, we were able to tease apart the data to explore competing processes contributing sulfur from the phreatic zone of karst in the Mitchell Plateau.
Bluespring Caverns. The δ34S values at Bluespring Caverns are depleted relative to the isotopic signature of water in the Lost River karst basin, as well as the evaporite samples from the core, but are enriched relative to both the H2S sampled at the petroleum seeps and the sulfate from gypsum samples in the cave. This behavior suggests mixing between meteoric/vadose sulfate and H2S evolving from petroleum seeps. The modeled contributions from petroleum seeps increase during the dry season and fall during the wet season. A maximum of 25% of the total sulfate sampled at the boat dock can be sourced to the petroleum seeps based on our mixing model.
The contributions to sulfur flux by petroleum seeps in Bluespring Caverns is significant, but it is important to recognize that the implications of this discovery for carbon flux in the cave are still unclear. In water samples from the petroleum seeps, δ13C values approached 0‰, suggesting that sulfuric acid dissolution occurs along the petroleum brine flow path (Table 2). Still, the mass flux of carbon in the Bluespring karst basin is probably dominated by epigenetic dissolution. This process is evidenced by the time series of δ13C that shows a strong seasonal influence of plant CO2 on the overall carbon signature of the water at the boat dock. Furthermore, percent contributions from the petroleum seeps are unlikely to be constant at different time scales. In the past, before oil and gas exploration in the Leesville Anticline, the hydrostatic pressure moving the petroleum fluids upward into the cave may have been more substantial. The cave has also increased in size; in the early stages of speleogenesis, the passages would not have been as large and consequently incapable of transmitting as much epigenetic water as is currently observed. It is therefore conceivable that hypogene fluids from the petroleum seeps could have comprised a greater percentage of the carbon flux in the cave than is estimated from recent data.
Unlike sedimentary gypsum beds, cave gypsum forms from a secondary mineralization process. The gypsum in Bluespring Caverns is in an older, drier passage than the active stream level. The gypsum forms a crust on the walls, with some flower structures radiating outward. The δ34S value of the gypsum, −23.1‰, is more depleted than the H2S measured at the petroleum seeps by about −7‰. If the petroleum seeps are an open system, as expected of a discharging reservoir, isotopically lighter sulfur would be expected to be lost from the reservoir first. This could explain the difference between H2S sampled at the seep in this study and the gypsum sulfur that was likely released from the seep at a previous point in cave formation. The isotopically depleted gypsum is direct evidence of H2S corrosion of the host passage (Equations (5)–(7)).
The residual sulfate concentrations from the uncalibrated model for Bluespring Caverns (Figure 7a) are too high to be explained by the background sulfate concentrations from meteoric and vadose sources. The overestimation of residual sulfur at Bluespring Caverns was improved by tuning the model with a +10‰ shift in the sulfur end member from seeps to reduce the concentration of meteoric sulfur to a background level comparable to that in the Lost River karst basin. The apparent presence of sulfur-oxidizing bacteria at the petroleum seeps (Figure 3) indicates that seep H2S could oxidize to sulfate in a biologically mediated pathway and fractionate the reduced source by +12.5‰ or greater [65]. Biological oxidation of the sulfur is, therefore, a reasonable explanation for the modeled excess of meteoric sulfur. If a +10‰ shift is used in the model, the percent sulfur contributed from the petroleum seeps would be significantly increased with a maximum of 61% and an average of 43% (Figure 7b). This suggests that petroleum seeps play a critical role in the sulfur systematics of the Bluespring karst basin.
Orangeville Rise. The importance of sulfate to the chemistry of water in Orangeville Rise and its probable connection to gypsum and anhydrite in St. Louis Limestone has long been recognized. Our concentration data corroborate this interpretation (Figure 2b); [SO42−] at Orangeville Rise significantly increased to a peak at base flow conditions in the dry season, far above levels from other sites in the Lost River karst basin. Based on earlier concentration data, [66] suggested the sulfate trend indicated a “finite source” from a deeper flow system overprinted by seasonally variable discharge in the shallow flow system.
The constraints of our data set necessitated the use of a linear transformation from the three-component model of [9] to our data set to differentiate phreatic water interacting with the evaporite beds from vadose and meteoric sulfur. The shape of the δ34S-[SO42−] plot (Figure 6) for this study is very similar to the data from [9] during event-based sampling, with all δ34S values ranging between meteoric/vadose sulfur and lower St. Louis Limestone evaporite end members. The shape of the curve indicates a system with three sources contributing sulfur as meteoric, vadose, and diffuse flow, with the diffuse flow path interacting in a phreatic fashion with the St. Louis Limestone evaporite beds [9].
A calibration discrepancy is visible between the data sets (Figure 4), as the linear transformation produces a negative value for Seva on 24 January 2020 and a value for Seva greater than the total sulfur on 14 October 2019. The calibration issue is probably due to the greater fluctuations observed in the temporal span of our study as opposed to an event-based sampling. Still, the magnitude of these errors is relatively low, and the linear transformation provides a reasonable estimate of sulfur from the evaporite beds.
Synthesis. The water chemistry that cannot be explained by the classic interpretation of the Mitchell Plateau as an epigenetic karst landscape is caused by complex interactions between sulfur and carbonate ions. Our analysis demonstrates that hypogene, H2S-bearing fluids evolve from petroleum seeps in the Bluespring karst basin. The seep brine is an H2S-bearing, Na+- and Cl-heavy fluid that elevates the salinity of the cave water. The H2S in these rising fluids is caustic and likely contributes to carbonate dissolution, as evidenced by the depleted δ34S value of secondary gypsum and enriched δ13C values at the petroleum seeps (Table 2). While the precise contributions to carbon flux in Bluespring Caverns is unknown, the petroleum-associated sulfur and brine may be an important part of fracture enlargement during speleo-inception.
The exact origin of these petroleum seeps remains unknown. The Salem Limestone that encloses most of the cave is not a petroleum source rock in Indiana. The source may be related to the Leesville Anticline, 21 km east of Bluespring Caverns. The anticline, Silurian-age domes, and the surface-to-Precambrian Mt. Carmel Fault, form a once-productive hydrocarbon reservoir, now used for natural gas storage [53]. Related, lower-amplitude structures may be located closer to Bluespring Caverns, which may provide a gradient for migration from deeper hydrocarbon-bearing rocks, like the Mississippian New Albany Shale or the Devonian Geneva Dolomite, approximately 200 m below the cave floor (Figure 1c). The reduced sulfur is visibly associated with the petroleum seeps and probably comes from the catagenesis of petroleum from organosulfur compounds.
The presence of hypogene fluids suggests that the Bluespring karst basin does not follow the epigenetic model of speleogenesis. The heterogeneity of this phenomenon across the Mitchell Plateau is emphasized by the absence of hypogene fluids in the Lost River karst basin. To explain these co-occurring, but opposing, geochemical pathways in adjacent basins, we postulate a polygenetic model of speleogenesis for the Mitchell Plateau (Figure 8). This model encompasses both carbonic acid and sulfuric acid dissolution of carbonate bedrock in proportions varying with geographic location and point in time.
Palmer [59,67,68] described the morphology of Bluespring Caverns as an epigenetic flood-water diversion maze, formed by carbonic acid dissolution of limestone preferentially along joint sets, as other pathways for water were blocked. Petroleum seeps observed in this study have some association with joints in the cave passage, apparently rising from joints in the cave streambed. Petroleum could migrate along joints and bedding planes from a structural trap with incomplete closure. This supposed flow path for hypogene fluids coincides with the strong joint-patterned morphology of Bluespring Caverns. This does not invalidate the floodwater diversion speleogenesis model for the cave, but rather provides more context for how early speleogenesis may have occurred. It is likely that at some point in the formation of Bluespring Caverns, there was a switch between hypogene-dominated and epigene-dominated speleogenesis. Hypogene fluids may have played a crucial role in enlarging the joints of Bluespring Caverns until epigenetic fluids were able to flush and progressively enlarge the system with carbonic acid-bearing water. This epigenic flushing would overprint any hypogenetic distinctive morphologies present in the young cave. This model for the formation of Bluespring Caverns is a mix of both epigenetic and hypogenetic processes, making it fundamentally polygenetic.

6. Conclusions

The results of this study support the interpretation that hypogenetic processes are (1) more broadly involved in speleogenesis than generally thought; (2) influence landscape evolution in classic karst terrain in substantial ways, and (3) are non-uniform both in space and time. In the Mitchell Plateau of south-central Indiana, the adjacent Bluespring and Lost River karst basins have divergent sulfur systematics owing to their different geologic contexts. The water in these karst aquifers has seasonally elevated levels of sulfur contributed by petroleum seeps and sedimentary evaporites, respectively. In the Lost River karst basin, the evaporite-associated sulfur provides no geochemical evidence for hypogenetic cave development. In contrast, the elevated concentrations of sulfur measured in Bluespring Caverns directly originate from seeps rich in reduced sulfur and are therefore linked to hypogenetic speleogenesis. During early development, the hypogenetic processes helped enlarge the orthogonal fracture sets that control the overall morphology of the cave. The isotopically depleted sulfur from these seeps also influenced the secondary gypsum preserved in higher, older passages. While epigenetic speleogenesis dominates modern cave evolution, the combination of hypogenetic and epigenetic processes compel recognition of Bluespring Caverns as a polygenetic cave.
We expect that other classic karst landscapes are similarly diverse with respect to sulfur systematics. Likewise, we expect that polygenetic cave development may be pervasive where cave-hosting carbonates interact with petroleum reservoirs in regions with active groundwater circulation. This certainly applies throughout the North American midcontinent and in globally important karst regions of Europe and Asia. The latter could prove to be particularly interesting because of the more sulfurous, sour petroleum that could contribute even more sulfuric acid to speleogenesis.

Supplementary Materials

The following supporting information can be downloaded at: https://www.mdpi.com/article/10.3390/w15193410/s1. Table S1. Field measurements of specific conductivity at each site taken over the study period. Table S2. Sulfur concentration data for the study period as measured on an HACH spectrophotometer. Table S3. Uncalibrated geochemical mixing model data for sulfur sourcing at Bluespring Caverns calculated from end members of meteoric sulfur (Smeteoric) δ34S = 2.8‰ and petroleum seep sulfur (Sseeps) δ34S = −14.1‰. Mixing model values could only be calculated for samples with a measured value for δ34S. Table S4. Geochemical modeling data for sulfur sourcing at Orangeville Rise calculated using the three-component sulfur mixing model from Lee and Krothe (2003). The concentration of sulfur from dissolved evaporites (Seva) was calculated using the linear relationship between SO42− and discharge from the diffuse flow path. Vadose and meteoric sulfur cannot be discriminated using this method and are combined in the term Sv+m. The supplementary materials provided with this manuscript contain numerical research data used in this study. Supplementary Tables S1 and S2 provide specific conductivity measurements and Table S2 provides sulfate concentration measurements. Data from both Table S1 and S2 are presented graphically in the main body of the manuscript. Supplementary Table S3 contains the data used to generate the sulfur speciation models for Bluespring Caverns and Orangeville Rise, respectively. Table S4, includes the modeled results in concentration and percent.

Author Contributions

Conceptualization, L.J.F.; methodology, S.A.B., L.J.F. and T.D.B.; validation, S.A.B. and T.D.B.; formal analysis, S.A.B. and T.D.B.; investigation, S.A.B. and L.J.F.; resources, L.J.F. and T.D.B.; data curation, S.A.B., L.J.F. and T.D.B.; writing—original draft preparation, S.A.B. and L.J.F.; writing—review and editing, S.A.B., L.J.F. and T.D.B.; visualization, S.A.B.; supervision, L.J.F.; project administration, L.J.F.; funding acquisition, S.A.B. and L.J.F. All authors have read and agreed to the published version of the manuscript.

Funding

This research was funded by the Center for Rural Engagement at Indiana University with additional financial support from the Geological Society of America, National Speleological Society, and Cave Research Foundation. The APC was funded in part by the Indiana University Open Access Article Publishing Fund.

Data Availability Statement

All primary and secondary data products produced as part of this investigation are included as appendices as part of a thesis completed by S.B. at Indiana University and are available open access on ProQuest at https://www.proquest.com/openview/04aedea264f8fd754f057ad8d7a0099e (accessed on 26 September 2023).

Acknowledgments

Staff at the IU Stable Isotope Research Facility provided time, space, and guidance to prepare the samples for isotopic analysis. Staff at the UK Stable Isotope Lab helped with carbon and sulfur isotopes during the challenging times of the COVID-19 pandemic. Anion and cation analyses were performed by staff at the Indiana State Department of Health. Fieldwork was made possible by cooperation with the Hoosier National Forest, the Indiana Karst Conservancy, and the owners and staff of Bluespring Caverns Park. In particular, Carla Striegel-Winner, the property manager of Orangeville Rise, permitted and supported our work. Sam Frushour and Jim Richards permitted and assisted our work at Bluespring Caverns, along with AJ Horen and Nic Kaufman. Kaufman was also responsible for identifying petroleum seeps in Bluespring Caverns, a recognition that completely changed the direction of our work. Final thanks are to the Bloomington Indiana Grotto, the Indiana Cave Survey, and all the unaffiliated cavers who have helped map Bluespring Caverns and Lost River Cave. We are grateful for the many eyes that have considered and edited this work and are appreciative of the positive impact that those comments have on the quality of this manuscript.

Conflicts of Interest

The authors declare no conflict of interest.

References

  1. Curl, R.L. Speleology. Science 1962, 153, 559–560. [Google Scholar] [CrossRef]
  2. Shaw, T.R. History of Cave Science, the Exploration and Study of Limestone Caves, to 1900; Sydney Speleological Society: Broadway, NSW, Australia, 1992; p. 338. [Google Scholar]
  3. Vacher, H.; Florea, L.J. Quantitative hermeneutics: Counting forestructures on a path from W.M. Davis to the concept of multiple-permeability karst aquifers. Int. J. Speleol. 2015, 44, 207–230. [Google Scholar] [CrossRef]
  4. White, W.B. Geomorphology and Hydrology of Karst Terrains; No. 551.447 W4; University of South Florida: Tampa, FL, USA, 1988. [Google Scholar]
  5. Ford, D.; Williams, P. Karst Hydrogeology and Geomorphology; John Wiley & Sons: Hoboken, NJ, USA, 2007; p. 562. [Google Scholar]
  6. White, W. Chemistry and karst. Acta Carsol. 2015, 44, 349–362. [Google Scholar] [CrossRef]
  7. Klimchouk, A.; Palmer, A.N.; De Waele, J.; Auler, A.S.; Audra, P. (Eds.) Hypogene Karst Regions and Caves of the World; Springer: Berlin/Heidelberg, Germany, 2017. [Google Scholar]
  8. Krothe, N.C.; Libra, R.D. Sulfur isotopes and hydrochemical variations in spring waters of southern Indiana, U.S.A. J. Hydrol. 1983, 61, 267–283. [Google Scholar] [CrossRef]
  9. Lee, E.S.; Krothe, N.C. Delineating the karstic flow system in the upper Lost River drainage basin, south central Indiana: Using sulphate and δ34SSO4 as tracers. Appl. Geochem. 2003, 18, 145–153. [Google Scholar] [CrossRef]
  10. Florea, L.J. Carbon flux and landscape evolution in epigenic karst aquifers modeled from geochemical mass balance. Earth Surf. Process. Landf. 2015, 40, 1072–1087. [Google Scholar] [CrossRef]
  11. Barcelona, M.J.; Holm, T.R.; Schock, M.R.; George, G.K. Spatial and temporal gradients in aquifer oxidation-reduction conditions. Water Resour. Res. 1989, 25, 991–1003. [Google Scholar] [CrossRef]
  12. Sasowsky, I.; Palmer, M. (Eds.) Breakthroughs in Karst Geomicrobiology and Redox Geochemistry; Special Paper 1; Karst Waters Institute: Lewisburg, PA, USA, 1994. [Google Scholar]
  13. Davis, W.M. Origin of Limestone Caverns. Bull. Geol. Soc. Am. 1930, 41, 475–628. [Google Scholar] [CrossRef]
  14. Swinnerton, A.C. Origin of Limestone Caverns. Bull. Geol. Soc. Am. 1932, 43, 663–694. [Google Scholar] [CrossRef]
  15. Bretz, J.H. Bermuda: A partially drowned, late mature, pleistocene karst. Bull. Geol. Soc. Am. 1960, 71, 1729. [Google Scholar] [CrossRef]
  16. Ford, D.C.; Ewers, R.O. The development of limestone cave systems in the dimensions of length and depth. Can. J. Earth Sci. 1978, 15, 1783–1798. [Google Scholar] [CrossRef]
  17. Liu, Z.; Zhao, J. Contribution of carbonate rock weathering to the atmospheric CO2 sink. Environ. Geol. 2000, 39, 1053–1058. [Google Scholar] [CrossRef]
  18. Liu, Z.; Dreybrodt, W.; Wang, H. A new direction in effective accounting for the atmospheric CO2 budget: Considering the combined action of carbonate dissolution, the global water cycle and photosynthetic uptake of DIC by aquatic organisms. Earth-Sci. Rev. 2010, 99, 162–172. [Google Scholar] [CrossRef]
  19. Stets, E.G.; Striegl, R.G. Carbon export by rivers draining the conterminous United States. Inland Waters 2012, 2, 177–184. [Google Scholar] [CrossRef]
  20. Martin, J.B. Carbonate minerals in the global carbon cycle. Chem. Geol. 2017, 449, 58–72. [Google Scholar] [CrossRef]
  21. Zeng, S.; Liu, Z.; Kaufmann, G. Sensitivity of the global carbonate weathering carbon-sink flux to climate and land-use changes. Nat. Commun. 2019, 10, 5749. [Google Scholar] [CrossRef]
  22. Bai, X.; Zhang, S.; Li, C.; Xiong, L.; Song, F.; Du, C.; Li, M.; Luo, Q.; Xue, Y.; Wang, S. A carbon-neutrality-capactiy index for evaluating carbon sink contributions. Environ. Sci. Ecotechnol. 2023, 15, 100237. [Google Scholar] [CrossRef]
  23. Orr, J.C. Recent and Future Changes in Ocean Carbonate Chemistry. Ocean Acidif. 2011, 1, 41–66. [Google Scholar] [CrossRef]
  24. Torres, M.A.; West, A.J.; Li, G. Sulphide oxidation and carbonate dissolution as a source of CO2 over geological timescales. Nature 2014, 507, 346–349. [Google Scholar] [CrossRef]
  25. Li, C.; Smith, P.; Bai, X.; Tan, Q.; Luo, G.; Li, Q.; Wang, J.; Wu, L.; Chen, F.; Deng, Y.; et al. Effects of carbonate minerals and exogenous acids on carbon flux from the chemical weathering of granite and basalt. Glob. Planet. Change 2023, 221, 104053. [Google Scholar] [CrossRef]
  26. Klimchouk, A.; Ford, D. (Eds.) Hypogene Speleogenesis and Karst Hydrogeology of Artesian Basins; Special Paper; Ukrainian Institute of Speleology and Karstology: Simferopol, Ukraine, 2009; Volume 1, p. 292. [Google Scholar]
  27. Muyzer, G.; Stams, A.J.M. The ecology and biotechnology of sulphate-reducing bacteria. Nat. Rev. Genet. 2008, 6, 441–454. [Google Scholar] [CrossRef] [PubMed]
  28. Amrani, A. Organosulfur Compounds: Molecular and Isotopic Evolution from Biota to Oil and Gas. Annu. Rev. Earth Planet. Sci. 2014, 42, 733–768. [Google Scholar] [CrossRef]
  29. Jagnow, D.H.; Hill, C.A.; Davis, D.G.; DuChene, H.R.; Cunningham, K.I.; Northup, D.E.; Queen, J.M. History of the sulfuric acid theory of speleogenesis in the Guadalupe Mountains, New Mexico. J. Cave Karst Stud. 2000, 62, 54–59. [Google Scholar]
  30. Hill, C.A. Sulfuric Acid Speleogenesis of Carlsbad Cavern and Its Relationship to Hydrocarbons, Delaware Basin, New Mexico and Texas (1). AAPG Bull. 1990, 74, 1685–1694. [Google Scholar] [CrossRef]
  31. Hose, L.D.; Palmer, A.N.; Palmer, M.V.; Northup, D.E.; Boston, P.J.; DuChene, H.R. Microbiology and geochemistry in a hydrogen-sulphide-rich karst environment. Chem. Geol. 2000, 169, 399–423. [Google Scholar] [CrossRef]
  32. Galdenzi, S.; Menichetti, M. Occurrence of hypogenic caves in a karst region: Examples from central Italy. Environ. Geol. 1995, 26, 39–47. [Google Scholar] [CrossRef]
  33. Sarbu, S.M.; Kane, T.C.; Kinkle, B.K. A Chemoautotrophically Based Cave Ecosystem. Science 1996, 272, 1953–1955. [Google Scholar] [CrossRef]
  34. Onac, B.P.; Sumrall, J.; Tămaş, T.; Povară, I.; Kearns, J.; Dârmiceanu, V.; Veres, D.; Lascu, C. The Relationship Between Cave Minerals and H2S—Rich Thermal Waters along Cerna Valley (SW Romania). Acta Carsol. 2009, 38, 27–39. [Google Scholar] [CrossRef]
  35. Onac, B.P.; Wynn, J.G.; Sumrall, J.B. Tracing the sources of cave sulfates: A unique case from Cerna Valley, Romania. Chem. Geol. 2011, 288, 105–114. [Google Scholar] [CrossRef]
  36. Wynn, J.G.; Sumrall, J.B.; Onac, B.P. Sulfur isotopic composition and the source of dissolved sulfur species in thermo-mineral springs of the Cerna Valley, Romania. Chem. Geol. 2010, 271, 31–43. [Google Scholar] [CrossRef]
  37. Engel, A.S.; Stern, L.A.; Bennett, P.C. Microbial contributions to cave formation: New insights into sulfuric acid speleogenesis. Geology 2004, 32, 369. [Google Scholar] [CrossRef]
  38. Stafford, K.W.; Ulmer-Scholle, D.; Rosales-Lagarde, L. Hypogene calcitization: Evaporite diagenesis in the western Delaware Basin. Carbonates Evaporites 2008, 23, 89–103. [Google Scholar] [CrossRef]
  39. Polyak, V.J.; Asmerom, Y.; Hill, C.A.; Palmer, A.N.; Provencio, P.P.; Palmer, M.V.; McIntosh, W.C.; Decker, D.C.; Onac, B.P. Isotopic studies of byproducts of hypogene speleogenesis and their contribution to the geologic evolution of the western United States. Hypogene Cave Morphol. 2014, 18, 88–96. [Google Scholar]
  40. Palmer, A.N.; Palmer, M.V.; Paces, J.B.; Feinberg, J.; Gao, Y.; Alexander, E.C. Geologic history of the Black Hills caves, South Dakota. Caves Karst Across Time 2015, 516, 87–101. [Google Scholar] [CrossRef]
  41. Herman, J.S.; Lorah, M.M. CO2 outgassing and calcite precipitation in Falling Spring Creek, Virginia, USA. Chem. Geol. 1987, 62, 251–262. [Google Scholar] [CrossRef]
  42. Angert, E.R.; Northup, D.E.; Reysenbach, A.L.; Peek, A.S.; Goebel, B.M.; Pace, N.R. Molecular phylogenetic analysis of a bacterial community in Sulphur River, Parker Cave, Kentucky. Am. Mineral. 1989, 83, 1583–1592. [Google Scholar] [CrossRef]
  43. Florea, L.J. Sulfur-Based Speleogenesis in the Cumberland Plateau, USA. In Hypogene Karst Regions and Caves of the World; Springer: Cham, Switzerland, 2017; pp. 683–690. [Google Scholar] [CrossRef]
  44. Florea, L.J. Investigations into the potential for hypogene speleogenesis in the Cumberland Plateau of southeast Kentucky, USA. Acta Carsol. 2013, 42, 277–289. [Google Scholar]
  45. Florea, L.J.; Hasenmueller, N.R.; Branam, T.D.; Frushour, S.S.; Powell, R.L. Karst geology and hydrogeology of the Mitchell Plateau of south-central Indiana. In Ancient Oceans, Orogenic Uplifts, and Glacial Ice: Geologic Crossroads in America’s Heartland; Florea, L., Ed.; Geologic Society of America: Boulder, CO, USA, 2018. [Google Scholar] [CrossRef]
  46. Cannon, D.L. Delineating Mineral Water Flow Paths Using Oxygen, Hydrogen, and Inorganic Carbon Isotopes. Master’s Thesis, Department of Geological Sciences, Indiana University, Bloomington, IN, USA, 2002. [Google Scholar]
  47. Lakey, B.; Krothe, N.C. Stable Isotopic Variation of Storm Discharge from a Perennial Karst Spring, Indiana. Water Resour. Res. 1996, 32, 721–731. [Google Scholar] [CrossRef]
  48. Indiana Geological and Water Survey (IGWS). IndianaMap. Available online: https://maps.indiana.edu/ (accessed on 8 October 2021).
  49. Dawson, T.A. Deep Test Well in Lawrence County, Indiana: Drilling Techniques and Stratigraphic Interpretations; Indiana Geological & Water Survey: Bloomington, IN, USA, 1960. [Google Scholar]
  50. Keith, B.D.; Thompson, T.A. Rock cores in Monroe, Lawrence, and surrounding counties: Indiana Geological and Water Survey. Indiana J. Earth Sci. 2020, 2, 1–102. [Google Scholar]
  51. Bassett, J.L.; Ruhe, R.V. Geomorphology, Hydrology, and Soils in Karst. In Proceedings of the Southern Indiana Field Conference, Bloomington, IN, USA, 24–25 April 1974; Indiana University Water Resources Research Center: Bloomington, IN, USA, 1974; p. 54. [Google Scholar]
  52. Gray, H.H. The Mississippian and Pennsylvanian (Carboniferous) Systems in the United States—Indiana; U.S. Government Printing Office: Washington, DC, USA, 1979.
  53. Dawson, T.A.; Carpenter, G.L. Underground Storage of Natural Gas in Indiana; Indiana Geological & Water Survey: Bloomington, IN, USA, 1963; p. 28. [Google Scholar]
  54. Melhorn, W.N.; Smith, N.M. The Mt. Carmel Fault and Related Structural Features in South-Central Indiana; Indiana Geological Survey Report of Progress 16; Indiana Geological & Water Survey: Bloomington, IN, USA, 1959. [Google Scholar]
  55. Erd, R.C.; Evans, H.T.; Richter, D.H. Smythite, a new iron sulfide, and associated pyrrhotite from Indiana. Am. Mineral. J. Earth Planet. Mater. 1957, 42, 309–333. [Google Scholar]
  56. Heyl, A.V. Minor epigenetic, diagenetic, and syngenetic sulfide, fluorite, and barite occurrences in the central United States. Econ. Geol. 1968, 63, 585–594. [Google Scholar] [CrossRef]
  57. Peel, M.C.; Finlayson, B.L.; McMahon, T.A. Updated world map of the Köppen-Geiger climate classification. Hydrol. Earth Syst. Sci. 2007, 11, 1633–1644. [Google Scholar] [CrossRef]
  58. Vose, R.S.; Applequist, S.; Squires, M.; Durre, I.; Menne, M.J.; Williams, C.N., Jr.; Fenimore, C.; Gleason, K.; Arndt, D. NOAA Monthly U.S. Climate Divisional Database (NClimDiv); Climate Division IN08; NOAA National Climatic Data Center: Asheville, NC, USA, 2014. [CrossRef]
  59. Palmer, A.N. Origin and morphology of limestone caves. Geol. Soc. Am. Bull. 1991, 103, 1–21. [Google Scholar] [CrossRef]
  60. NOAA National Centers for Environmental Information. Integrated Surface Dataset; NOAA National Centers for Environmental Information: Asheville, NC, USA, 2001.
  61. Wilde, F.D. Water-Quality Sampling by the U.S. Geological Survey: Standard Protocols and Procedures; US Geological Survey Fact Sheet; U.S. Geological Survey: Reston, VA, USA, 2010. [CrossRef]
  62. Furtak, H.; Langguth, H.R. Zur Hydrochemischen Kennzeichnung von Grundwässern und Grund-Wassertypen Mittels Kennzahlen, Mem; IAH-Congress: Hannover, Germany, 1967; pp. 86–96. [Google Scholar]
  63. Piper, A.M. A graphic procedure in the geochemical interpretation of water-analyses. Eos Trans. Am. Geophys. Union 1944, 25, 914–928. [Google Scholar] [CrossRef]
  64. Winston, R.B. GW_Chart, Version 1.30; U.S. Geological Survey Software Release: Bloomington, IN, USA, 26 June 2020. [CrossRef]
  65. Jørgensen, B.B.; Findlay, A.J.; Pellerin, A. The Biogeochemical Sulfur Cycle of Marine Sediments. Front. Microbiol. 2019, 10, 849. [Google Scholar] [CrossRef]
  66. Bassett, J. Hydrology and geochemistry of the upper Lost River drainage basin, Indiana. NSS Bull. 1976, 38, 79–87. [Google Scholar]
  67. Palmer, A.N. The Survey of Blue Spring Cave, Lawrence Co., Indiana. In Proceedings of the Indiana Academy of Science; Indiana University: Bloomington, IN, USA, 1967; Volume 77, pp. 245–249. [Google Scholar]
  68. Palmer, A.N. Distinction between epigenic and hypogenic maze caves. Geomorphology 2011, 134, 9–22. [Google Scholar] [CrossRef]
Figure 1. (a) Map of Indiana showing areas underlain by carbonate bedrock and glacial limits. The study area is indicated by a red box. (b) Geological cross section of the transect in panel b. Geospatial layers were derived from IndianaMAP [48]. Core logs used in cross section preparation were provided by the Indiana Geological and Water Survey except for the deep well [49,50]. (c) Map of the study area and sampling locations showing karst basins, inferred karst drainage boundaries, dye traces, and geologic structure.
Water 15 03410 g001
Figure 2. Line graph of time series data. (a) Specific conductivity measurements (left axis) at all sampling sites, and daily precipitation totals (right axis). Dry seasons are marked during periods of time where Flood Creek had no surface flow. (b) Sulfate concentrations at all sites over the study period.
Water 15 03410 g002
Figure 3. Photograph of a petroleum seep localized in a fracture in the bedrock of the floor of Bluespring Caverns taken 21 January 2021. The black color within the seep is bitumen and the white haze around it is composed of colonies of sulfur-oxidizing bacteria.
Water 15 03410 g003
Figure 4. Line graph of a time series of sulfate concentration at Orangeville Rise showing the modeled sulfate from evaporites based on the linear relationship from [9]. Notes—OR = Orangeville Rise.
Water 15 03410 g004
Figure 5. Piper plot diagram showing all water samples collected from 14 February 2020 to 3 November 2021 with respect to their ion concentrations. Outlines describe data distributions of spring water sampled in the Mitchell Plateau and Crawford Uplands [8]. Piper plot constructed using the USGS groundwater software package, Version 1.30 [64] with fields modified from [62].
Water 15 03410 g005
Figure 6. Scatter diagram and regression fits of sulfur isotope ratios (calibrated to the V-CDT standard) versus sulfate concentration for all sites in the study as well as end members from rock core and petroleum seeps. The isotopic ratio for meteoric sulfate was approximated by the projection of data trends at all sites to a common origin.
Water 15 03410 g006
Figure 7. Line graphs of time series. (a) Modeled meteoric sulfate concentration at Bluespring Caverns overlaid on the meteoric residual from Orangeville Rise (Orangeville Rise total sulfate—Orangeville Rise evaporites) and total sulfate concentration from Flood Creek and Wesley Chapel Gulf. An end-member shift of 10‰ was used to tune the Bluespring Caverns model. (b) Percentages of sulfate contributed by petroleum seeps versus meteoric sources from the calibrated sulfur speciation model at Bluespring Caverns. Notes—BC = Bluespring Caverns, OR = Orangeville Rise, WC = Wesley Chapel Gulf, FC = Flood Creek.
Water 15 03410 g007
Figure 8. Schematic diagram illustrating a model for polygenetic cave development at Bluespring Caverns. Sulfur isotope data from this study are included for end members and water samples at Bluespring Caverns. Drawing is not to scale.
Water 15 03410 g008
Table 1. Analyses of archived St. Louis Limestone evaporite samples from IGWS core in Crawford Co. The total thickness of the St. Louis in these cores is about 79 m. Archived samples, composition, and dissolution percentages were provided courtesy of Tracy Branam. Notes—SDH = survey drill hole, % = percent, mg/L = milligrams per liter, ‰ = per mil.
Sample NameCore IDDepth from Top of St. Louis (m)CompositionDissolved SO4Evaporites Dissolved %δ34S
Gypsum
%
Anhydrite
%
Expected (mg/L)Actual (mg/L)
RF65-45SDH11416.513.843.076266073.414.68
RF65-47SDH11418.95.43.511011212.914.50
RF65-57SDH11426.813.162.51029117579.016.16
RF65-60SDH11427.44.112.021528020.716.03
DC69-294SDH19053.920.670.41223135084.716.54
DC69-298SDH19057.020.766.11164135089.017.08
DC69-299SDH19058.216.921.649460046.216.68
DC69-311SDH19067.375.715.41063112081.617.91
Table 2. Isotopic measurements for supplemental samples at Bluespring Caverns. SB210121A and SB200307C were collected at petroleum seeps in the Second Discovery section of the cave. SB200307A and SB200307B were samples of cave gypsum from the 1700 passage. SB210121B and SB200306A were collected at the boat dock. SB200306A was collected as part of routine sampling but is reported here for ease of comparison.
Site Sample Name DateStable Isotopes
δ13CDICδ34SSO4δ34SH2S
Bluespring CavernsSB200307A7 March 2020-−22.90-
Bluespring CavernsSB200307B7 March 2020-−23.30-
Bluespring CavernsSB200307C7 March 2020−6.30--
Bluespring CavernsSB200306A6 March 2020−14.50--
Bluespring CavernsSB210121A21 January 2021−5.44−3.40−14.1
Bluespring CavernsSB210121B21 January 2021−12.670.00-
Disclaimer/Publisher’s Note: The statements, opinions and data contained in all publications are solely those of the individual author(s) and contributor(s) and not of MDPI and/or the editor(s). MDPI and/or the editor(s) disclaim responsibility for any injury to people or property resulting from any ideas, methods, instructions or products referred to in the content.

