Article

Quantifying Household Water Use and Its Determinants in Low-Income, Water-Scarce Households in Karachi

1
Urban and Environmental Policy and Planning, Tufts University, Medford, MA 02155, USA
2
Dhanani School of Science and Engineering, Habib University, Karachi 75290, Pakistan
*
Author to whom correspondence should be addressed.
Water 2023, 15(19), 3400; https://doi.org/10.3390/w15193400
Submission received: 27 August 2023 / Revised: 25 September 2023 / Accepted: 26 September 2023 / Published: 28 September 2023
(This article belongs to the Section Water Use and Scarcity)

Abstract

:
Water system investments in megacities in South Asia are driven by a perceived ‘shortage’ of water supply compared to water demand. However, water demand estimates for such cities often do not reflect local socioeconomic and demographic characteristics nor account for seasonal variability. In this study, using a mixed-methods approach, we quantify household water use and its determinants and assess the seasonality of access to piped water in the low-income, water-scarce township of Lyari in Karachi. Results from over 600 household surveys show that the reported per capita water usage at the household level is lower than the assumed water demand by the city’s water utility. Water use is found to differ by gender, season, and economic status. More affluent households are able to “purchase” water security and sustain higher water use even in situations of extreme water scarcity. The perceived sufficiency of water supply improves markedly in the winter despite no increase in supply, indicating reduced demand. These findings can inform more accurate water demand projections for Karachi and highlight the importance of accounting for local socioeconomic and environmental contexts in water demand projections.

1. Introduction

Rapid urbanization combined with the growing impacts of climate change pose a serious challenge to urban water authorities in South Asia already struggling to meet present water needs [1]. Projections of domestic water usage play an important role in informing urban water management interventions [2] such as the design and operation of water distribution systems [3], water demand forecasts [4], and pricing strategies for different sections of the population [5,6]. Poorly informed domestic water use forecasts can lead to ineffective interventions that fail to ensure that all sections of the population are able to access adequate quantities of water per their needs.
Urban water management is often hampered by unreliable water demand estimates [7,8]. This problem is especially grave in South Asian cities where water utilities use assumed per capita water demands that are not indicative of the local context [9]. The coastal megacity of Karachi, with a population of over 20 million, is a prime example. The city’s sole water utility, Karachi and Water Sewerage Board (KWSB), makes use of an assumed spatially uniform per capita daily water demand that is not informed by local empirical evidence to project the city’s water needs [10]. This assumed usage combines municipal, commercial, and industrial usages. This projected water usage is subsequently used to make policy and investment decisions relating to Karachi’s water system. However, there are three major problems with KWSB’s domestic water use projections.
The first problem is exaggerated water demand forecasts. Residential water connections in Karachi are not metered, and no peer-reviewed household water use study exists for Karachi. In the absence of empirical evidence, various estimates for Karachi’s water demand abound, ranging from 900 million gallons per day (MGD) [11] to 1200 MGD [12], all significantly greater than Karachi’s water supply of 600 MGD. However, water demand forecasts in Karachi have historically been overstated, much like across cities globally [13], and especially so in low-to-middle income regions [14]. In an 1985 study, daily water demands in Karachi were predicted to increase to 81 gallons per capita by 2025 [15], much higher than the current 54 gallons per capita assumed by the KWSB. Ref. [16] forecasted a water usage of 1338 MGD for Karachi by 2010 (approximately 35% higher than the current assumed usage). Water demand analyses in other similar cities, e.g., Mumbai, suggest that actual water demands are often significantly lower than the numbers used by water utilities [17]. Exaggerated demand projections can lead to inefficient water supply augmentation investments [18,19]. Over-estimated water demand projections can also be employed to build narratives of acute water shortages that distract from more pressing water challenges and can be used as an easy excuse by water utilities to explain away poor water management [20].
The second problem with KWSB’s projections is the use of a uniform per capita daily demand that does not account for variability in household water use. Socio-economic variables are important predictors of water demand [21] and resultantly, there is tremendous variation in household water demands in large socioeconomically diverse metropolitan cities [22,23]. Although relatively few studies have examined intra-urban variations in domestic water use [24], for cities in the Global South, data aggregated to city-scale can mask localized variations, such as between informal/semi-regularized and formal neighborhoods [25].
Uniform water demand also does not account for seasonal variation in Karachi’s water use. Karachi’s climate features a distinct summer season where average daily temperatures exceed 35 °C and a mild winter where average daily temperatures drop to 23 °C [26]. Each year, as summer approaches, the city starts facing conditions of acute scarcity [27]. With increased heat spells, there is an increased urban demand for water [28]. Studies of temporal dynamics of access and quality of water in urban slums of India [29], and water demand datasets from several cities across the globe [30], demonstrate that the consumption for water is highly dynamic across multiple timescales (sub-daily to seasonal changes). Not accounting for the spatial and socioeconomic variability in water demands can lead to inefficient water system operations and result in highly inequitable access to water.
The third problem with KWSB’s assumed per capita water demand is that it’s not representative of its residents: over half of Karachi’s population lives in low-income informal settlements that feature acute water scarcity [31]. Without universal access to piped water supply, characterized by both lack of pipeline connections or intermittent (and unreliable) supply, many households depend on different and often multiple sources of water [32]. Resultantly, total water demand and water use behaviors in these households is distinct from households with access to piped water supply (e.g., bathing and laundry is done using buckets instead of showerheads and washing machines). Outdoor water use in these low-income neighborhoods tends to be minimal owing to small house sizes and absence of assets such as motor vehicles.
This paper addresses the aforementioned problems with Karachi’s water use projections through a household water use study using a mixed-methods approach that includes the use of both quantitative and qualitative data. Two rounds of surveys were conducted, one each in the summer and winter seasons, resulting in over 600 surveyed households supplemented with informal interviews. As a case study, we focus on the low-income and semi-regularized township of Lyari in Karachi, which is emblematic of the many low-income settlements that comprise a majority of the city’s population [33]. We find that reported per capita water usage at the household level is lower than the assumed water demand by the city’s water utility. We disaggregate water use to various activities and quantify how water supply schedules, as well as household characteristics (including socioeconomic and sociodemographic information), impact household water consumption. Although we are addressing this research gap specifically in the context of Karachi, the findings from this study are relevant for other similar South Asian megacities struggling to manage their urban water supply.

2. Materials and Methods

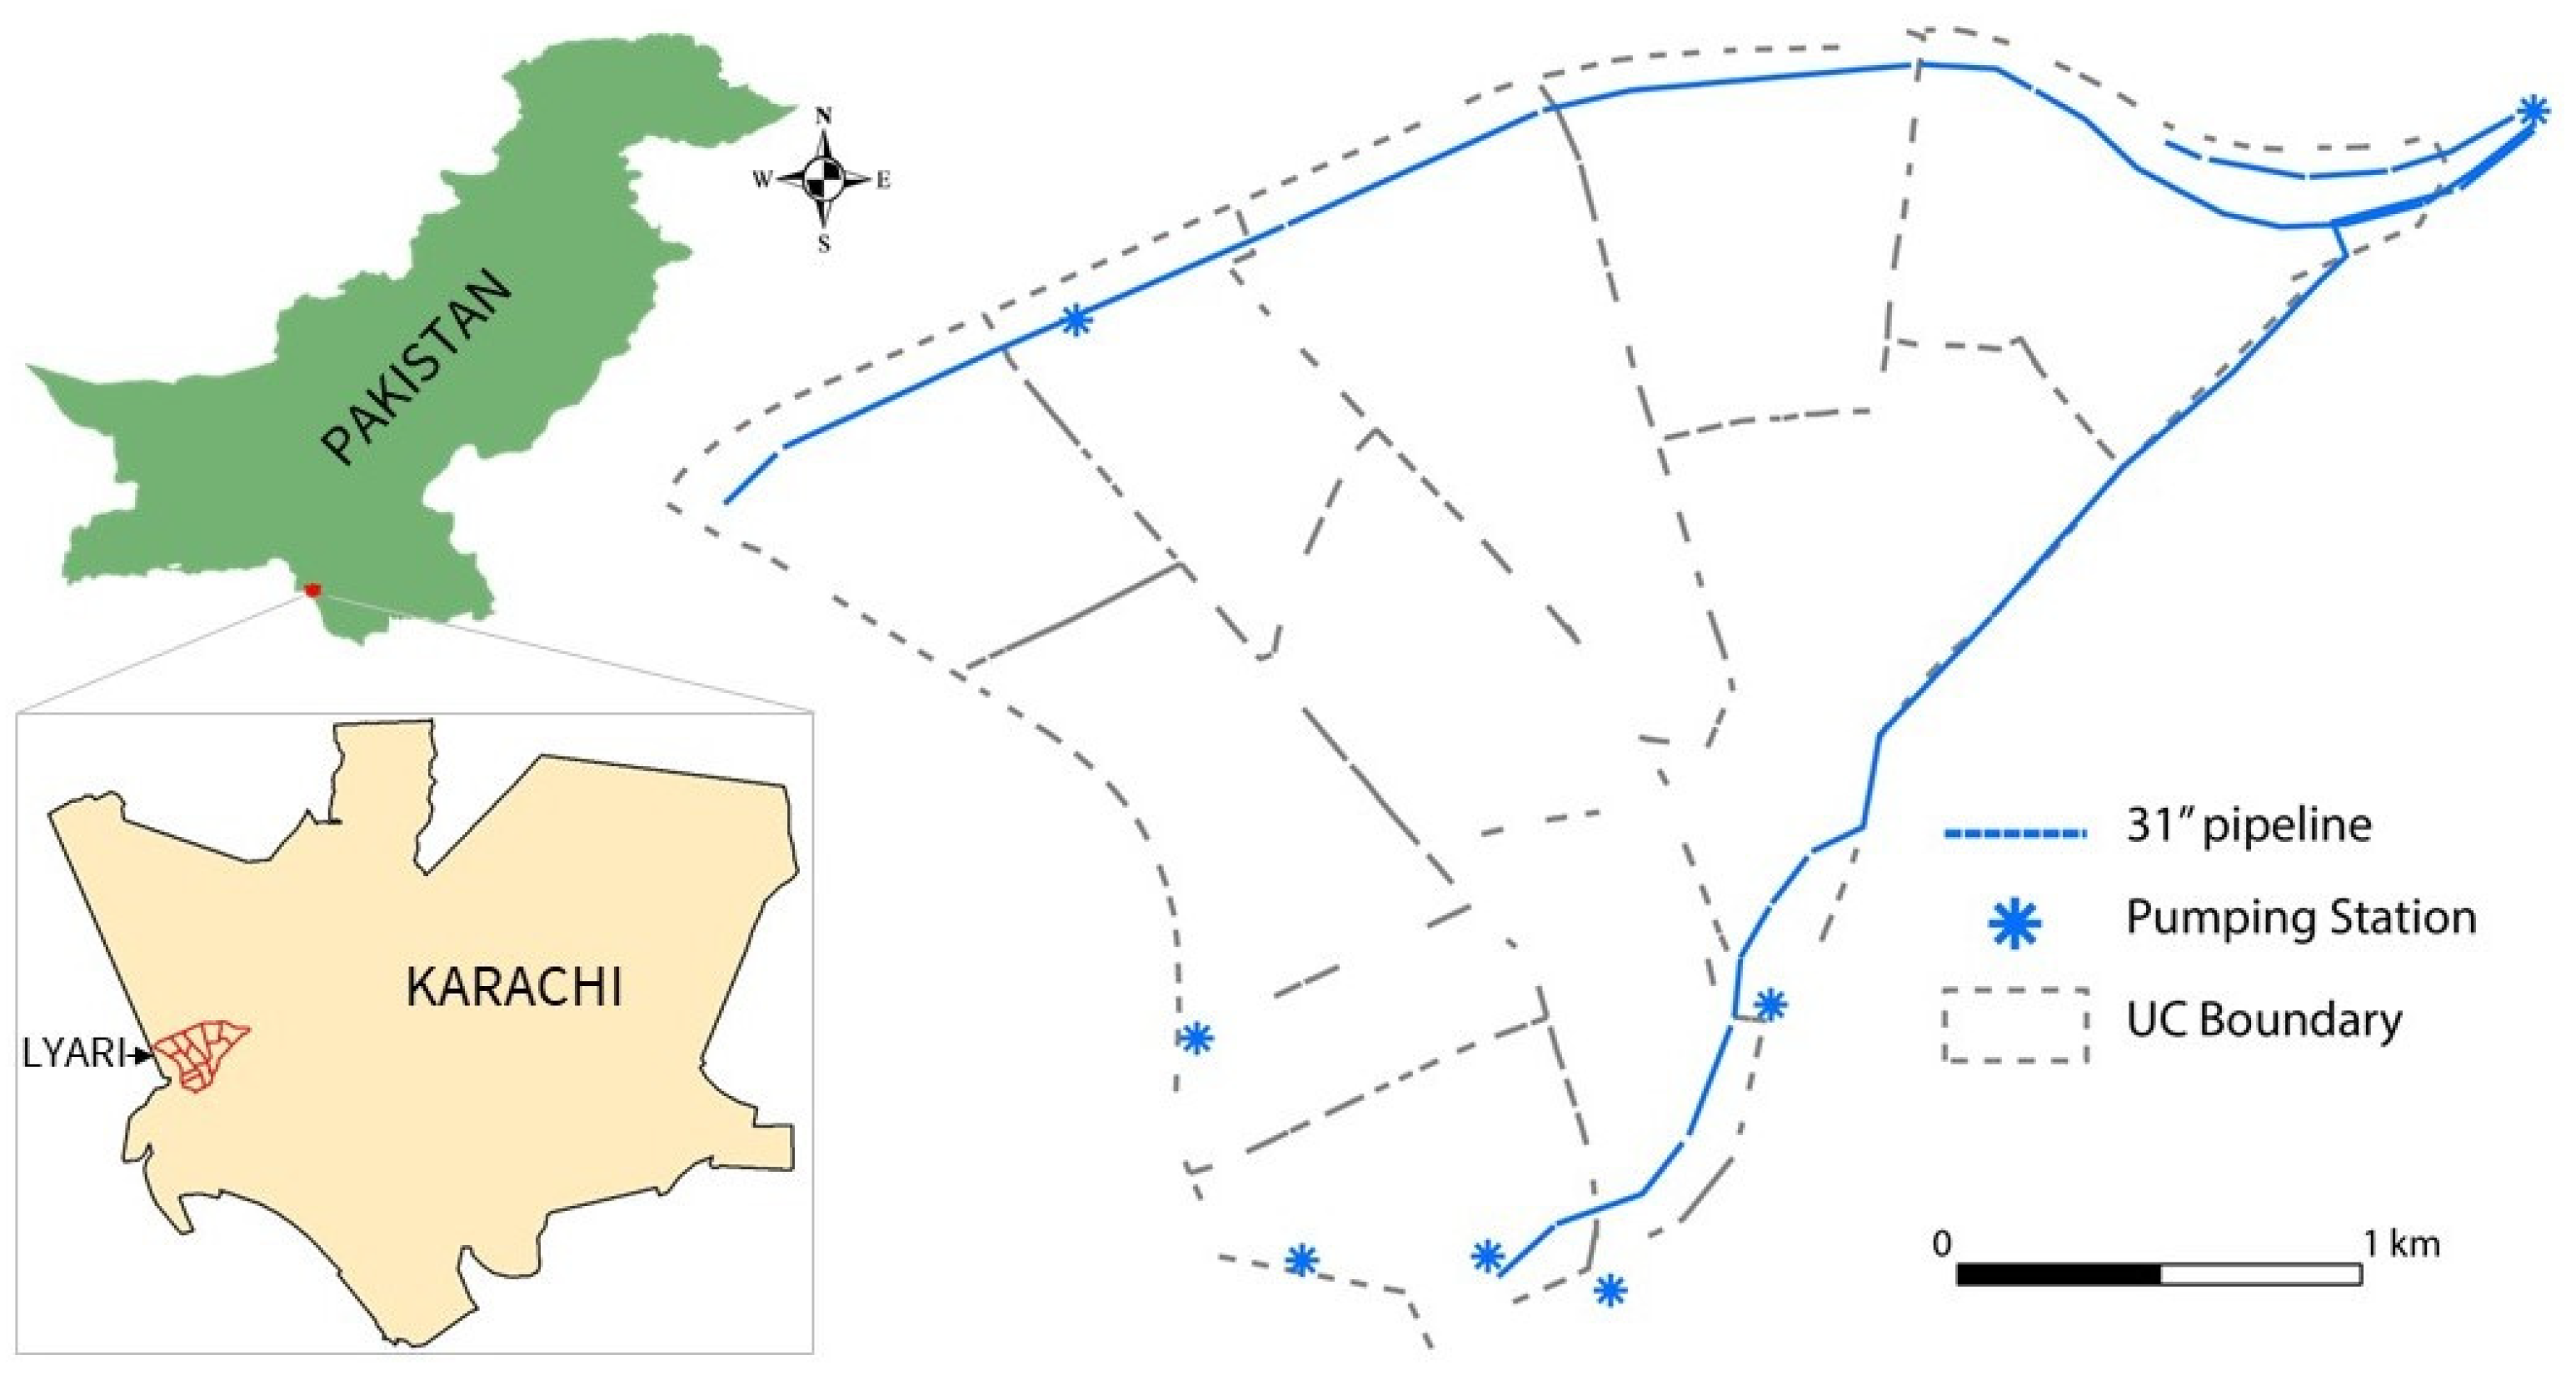
2.1. Study Area: Lyari Township

To improve the estimates and projections of domestic water demand for Karachi, it is critical to understand water use in water-scarce, low-income neighborhoods. Low-income households comprise most of Karachi’s population, and like other megacities in South Asia, these households suffer disproportionately from water-scarce conditions [32]. For this study, we focus on the semi-regularized and multi-ethnic township of Lyari, shown in Figure 1. Geographically, Lyari lies at the tail-end of Karachi’s piped supply infrastructure and is one of the most vulnerable townships in Karachi to face conditions of acute water scarcity, especially during summer seasons [34,35].
Lyari’s high population density, tremendous socioeconomic and ethnic diversity, and variations in access to piped water supply makes it suitably representative of low-income neighborhoods in Karachi. Lyari is a densely populated settlement with a population density of over 100,000 per square kilometer [36]. The settlement is predominantly low income; a substantial portion of the workforce comprise daily wage earners. It is home to some of the poorest communities in Karachi, including Zikri groups who migrated from Balochistan to settle here, and the Sindhi Mahigeer (fishermen) community, who were among the earliest settlers here, predating the creation of Pakistan [37]. These communities suffer from water insecurity of crisis proportions. However, not all households within Lyari suffer from the same intensity of water insecurity. Areas in the eastern part of Lyari, which lie in closer proximity to the bulk water pipelines, receive reliable piped water supply. On the other hand, western Lyari features an inequitable distribution of uncertain, intermittent piped water supply [20].

2.2. Methods

This study has two major research objectives: (i) quantify household water use and disaggregate it across various water use activities; and (ii) identify how socioeconomic determinants, access to piped water supply, and seasonal variations influence household water demand. To achieve these objectives, sequential explanatory mixed-method research was employed where qualitative data were collected to provide a more comprehensive contextualization of findings/interpretations drawn from the quantitative results [38]. Two rounds of household surveys were conducted, supplemented with informal interviews.
To obtain a representative sample of households across Lyari, we relied on the district-wise population in Karachi from the latest census. Since the census data did not have the population figures at the union council (UC) level, we consulted local experts (such as union councilors and community mobilizers) to estimate the number of surveys needed in each UC for a spatially representative sample of Lyari. We used clusters of five households that were randomly chosen to ensure a balanced spatial distribution within each UC. The first round of surveys was conducted in the summer season (June–July 2021) with 462 household respondents, followed by 162 household surveys in the second phase during winter (December 2021–January 2022). At the 95% confidence level, the summer survey sample size has a margin of error of 5%, whereas for the winters it is 8%. In both phases, the same proportion of households from each UC was used to ensure consistent spatial distribution. Surveys were conducted between 11 a.m. and 3 p.m.; thus, women accounted for over half of the survey respondents.
Domestic water usage in Karachi is not metered. In the absence of flow meter data, and in a region where households employ multiple methods of water collection and storage, respondents’ self-reported water use were recorded through a series of questions from our questionnaire. Our water use survey methodology is adapted from the methods employed by [14,23,39]. Respondents’ reported water use activities are used as a proxy for water use for their household. We categorize the various household water uses as either individual or collective. For collective water uses, the reported volume of water used for the activity was divided by the number of household members to determine the respondent’s ‘share’ of water use. We used a 1-week recall period for the respondents because our informal interviews suggested that this was the minimum time for all water uses to happen. Although a shorter recall period would have yielded more accurate results, surveyed households were unwilling to engage in daily recalls for a consecutive week. Only activities that use non-potable water are included in our survey, since the market for and sources of non-potable differ from those of potable water. The volumes of water used for the different activities were determined by ascertaining the volume and number of containers used. Where running tap or piped water was used in some activities, the duration for which the tap was used was multiplied with the measured flow rate to ascertain the total volume of water used. Since the water use habits and activities were recorded via respondents’ memories, an important limitation of this approach is that it could potentially introduce an implicit bias (e.g., underestimating the amount of water used in laundry, or withholding some information due to privacy concerns).

3. Results

Table 1 shows descriptive statistics for the two rounds of surveys. Across our total surveyed households (n = 624), on average, there were 7.87 residents in each dwelling, with about five adults (above the age of 16) and three children. On average, there was one bathroom per 4.76 residents and one room per 3.3 residents across all households. Over three quarters of all respondents live in a house they own, and the rest live in rented accommodation. The largest ethnic group by population were the Baloch, who comprised almost 30% of all respondents. Most surveyed households did not have a member who had at least 10 years of schooling, pointing to low education levels across Lyari. There were, on average, 1.7 earning members in each household.
The median reported water use (RWU) across Lyari is approximately 16 and 13 gallons per capita per day (gpcd) in the summers and winters, respectively. These usages are in line with findings from previous studies [15], and less than a third of the assumed daily per capita water demand of 54 gallons employed by KWSB to project Karachi’s water needs [10]. Household water use in Lyari, for the most part, does not feature modern water appliances (e.g., showerheads); residents predominantly use buckets and mugs to bathe and flush. In some cases, acute water scarcity forces households to flush collectively once a day. The use of washing machines is extremely rare; clothes are hand-washed as a communal activity carried out on a weekly basis.
Figure 2 shows RWU for the five major household water use activities, whereas Figure 3 shows water use disaggregated by sex and season. Bathing accounts for almost 40% (5.9 gpcd) of summer water usage, followed by flushing as the second largest water use activity, comprising almost 25% (3.48 gpcd) of all usage. Dishwashing (2.65 gpcd), laundry (1.26 gpcd), and house washing (0.84 gpcd) make up the rest of the water-intensive activities. Households report little-to-zero outdoor water uses owing to the small house sizes and lack of cars. The following sections (3.1 to 3.6) discuss the various factors that influence these reported water usages.

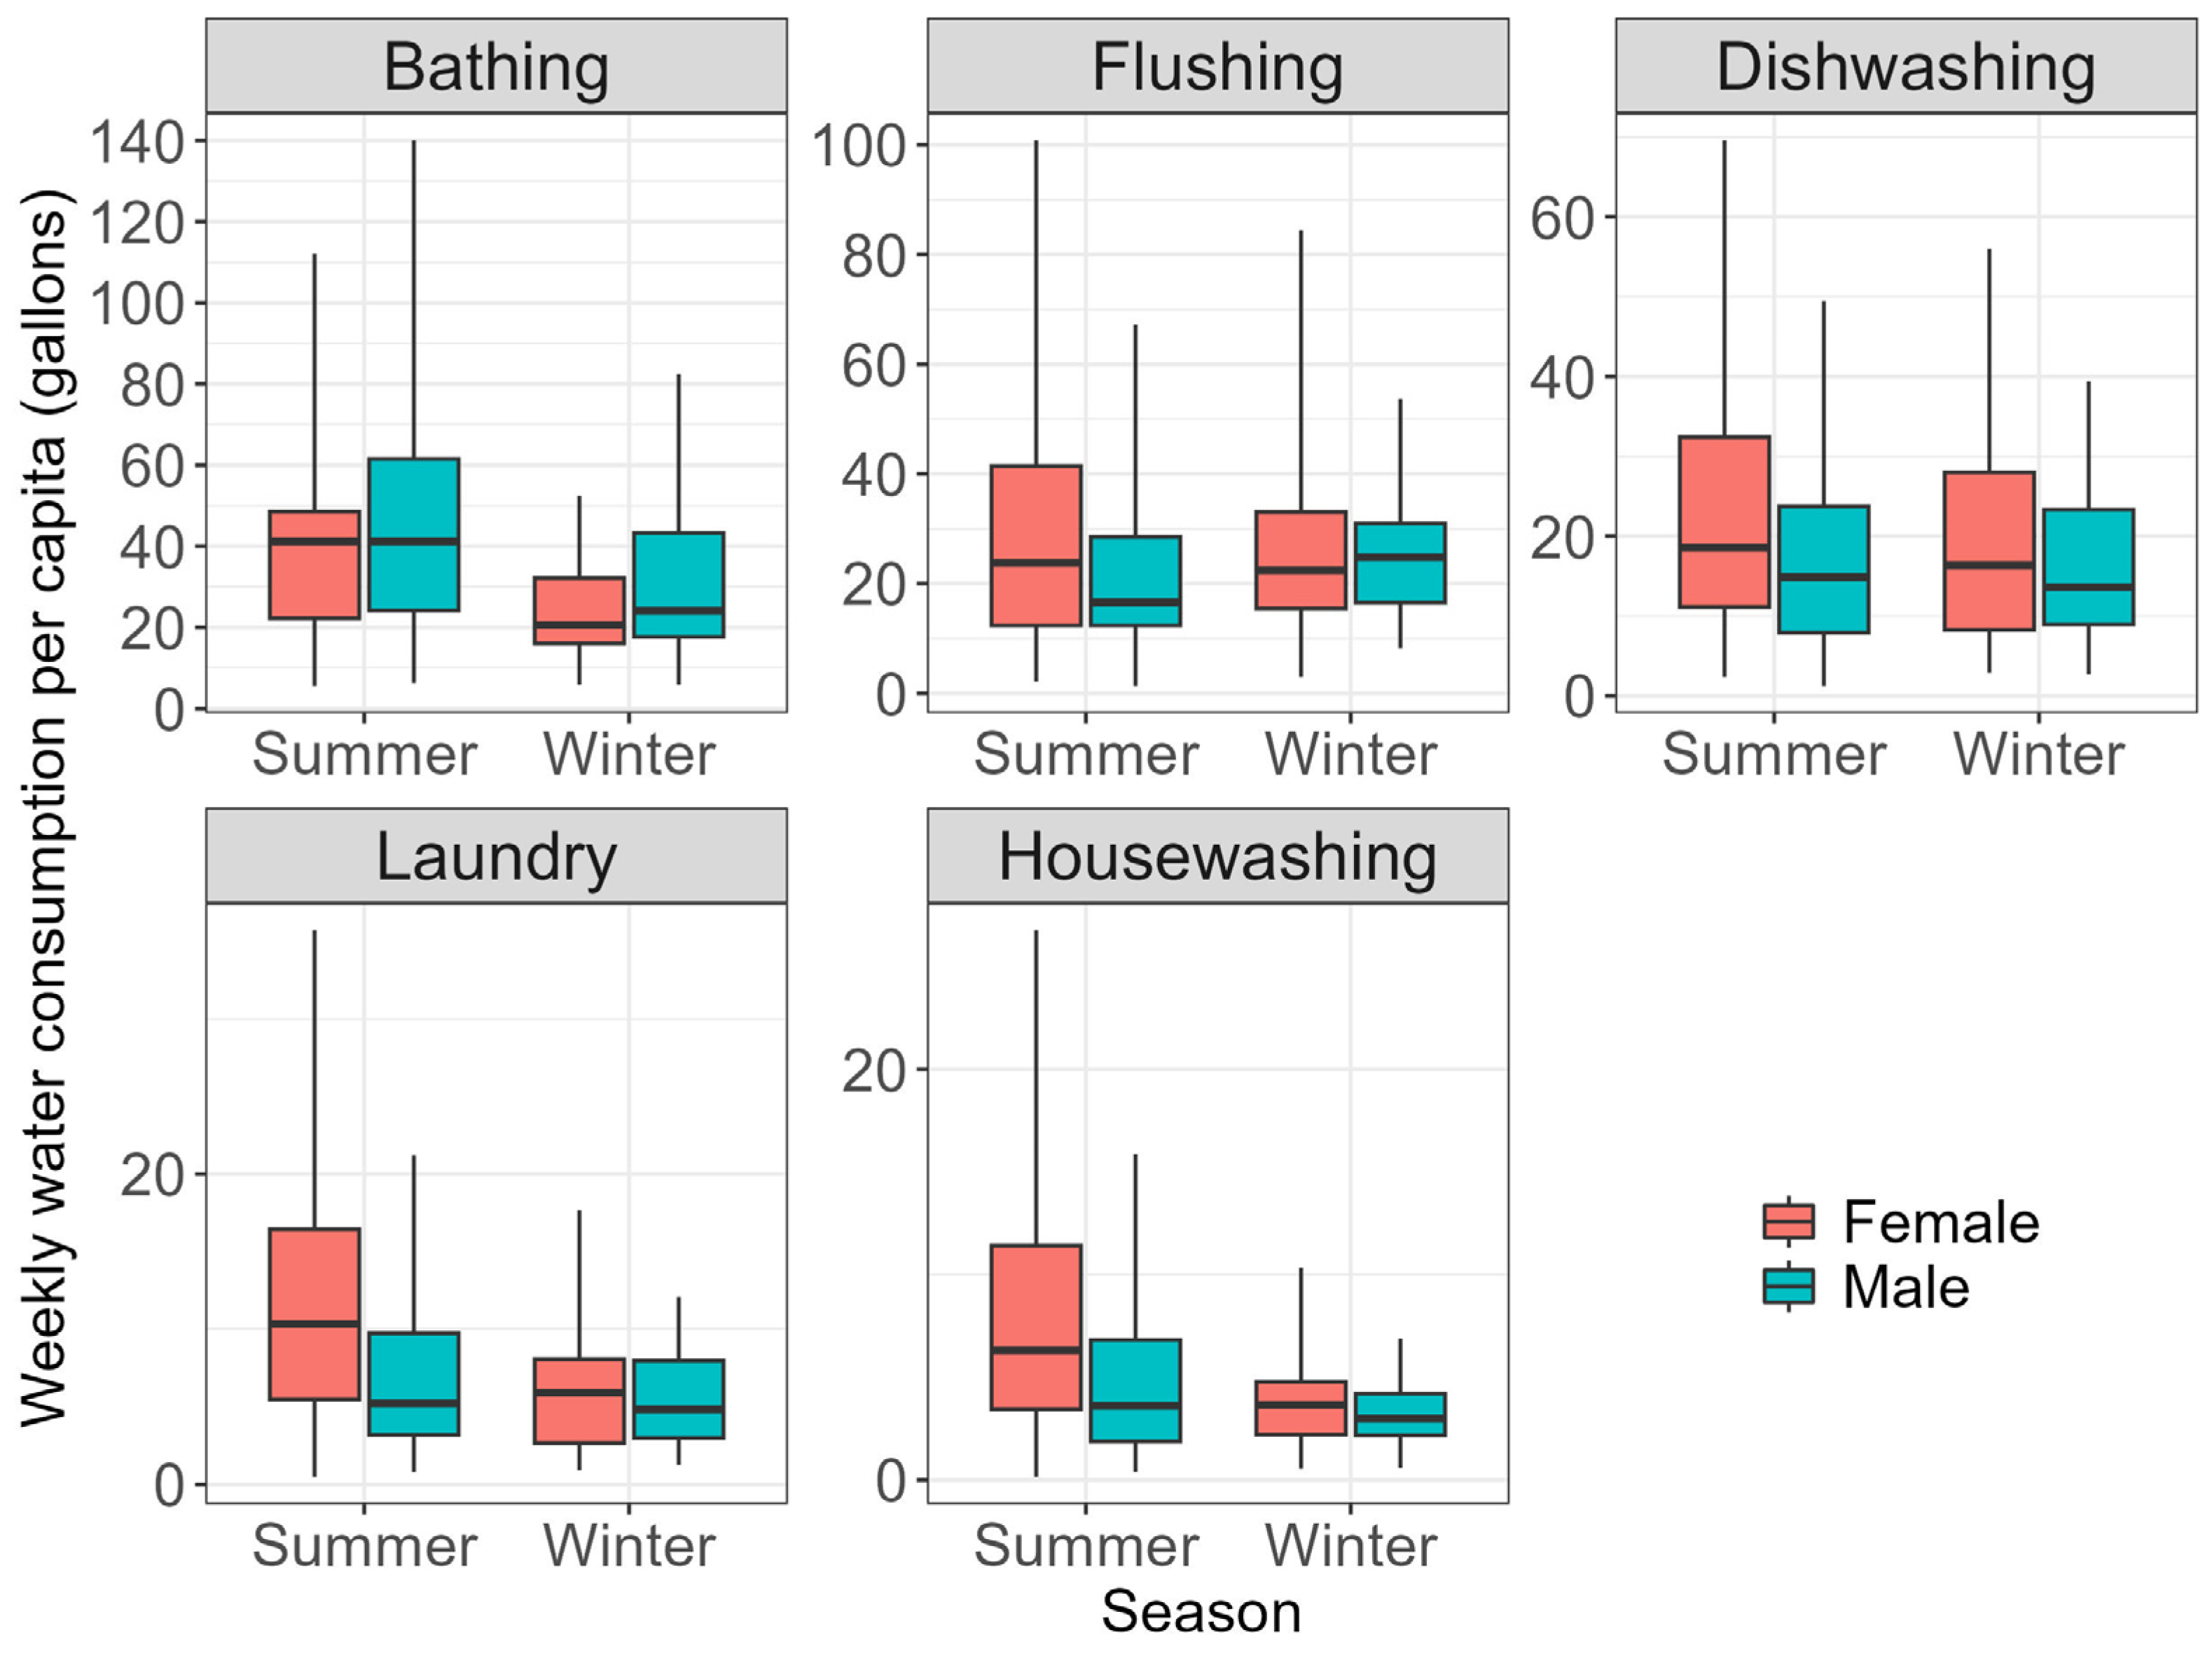
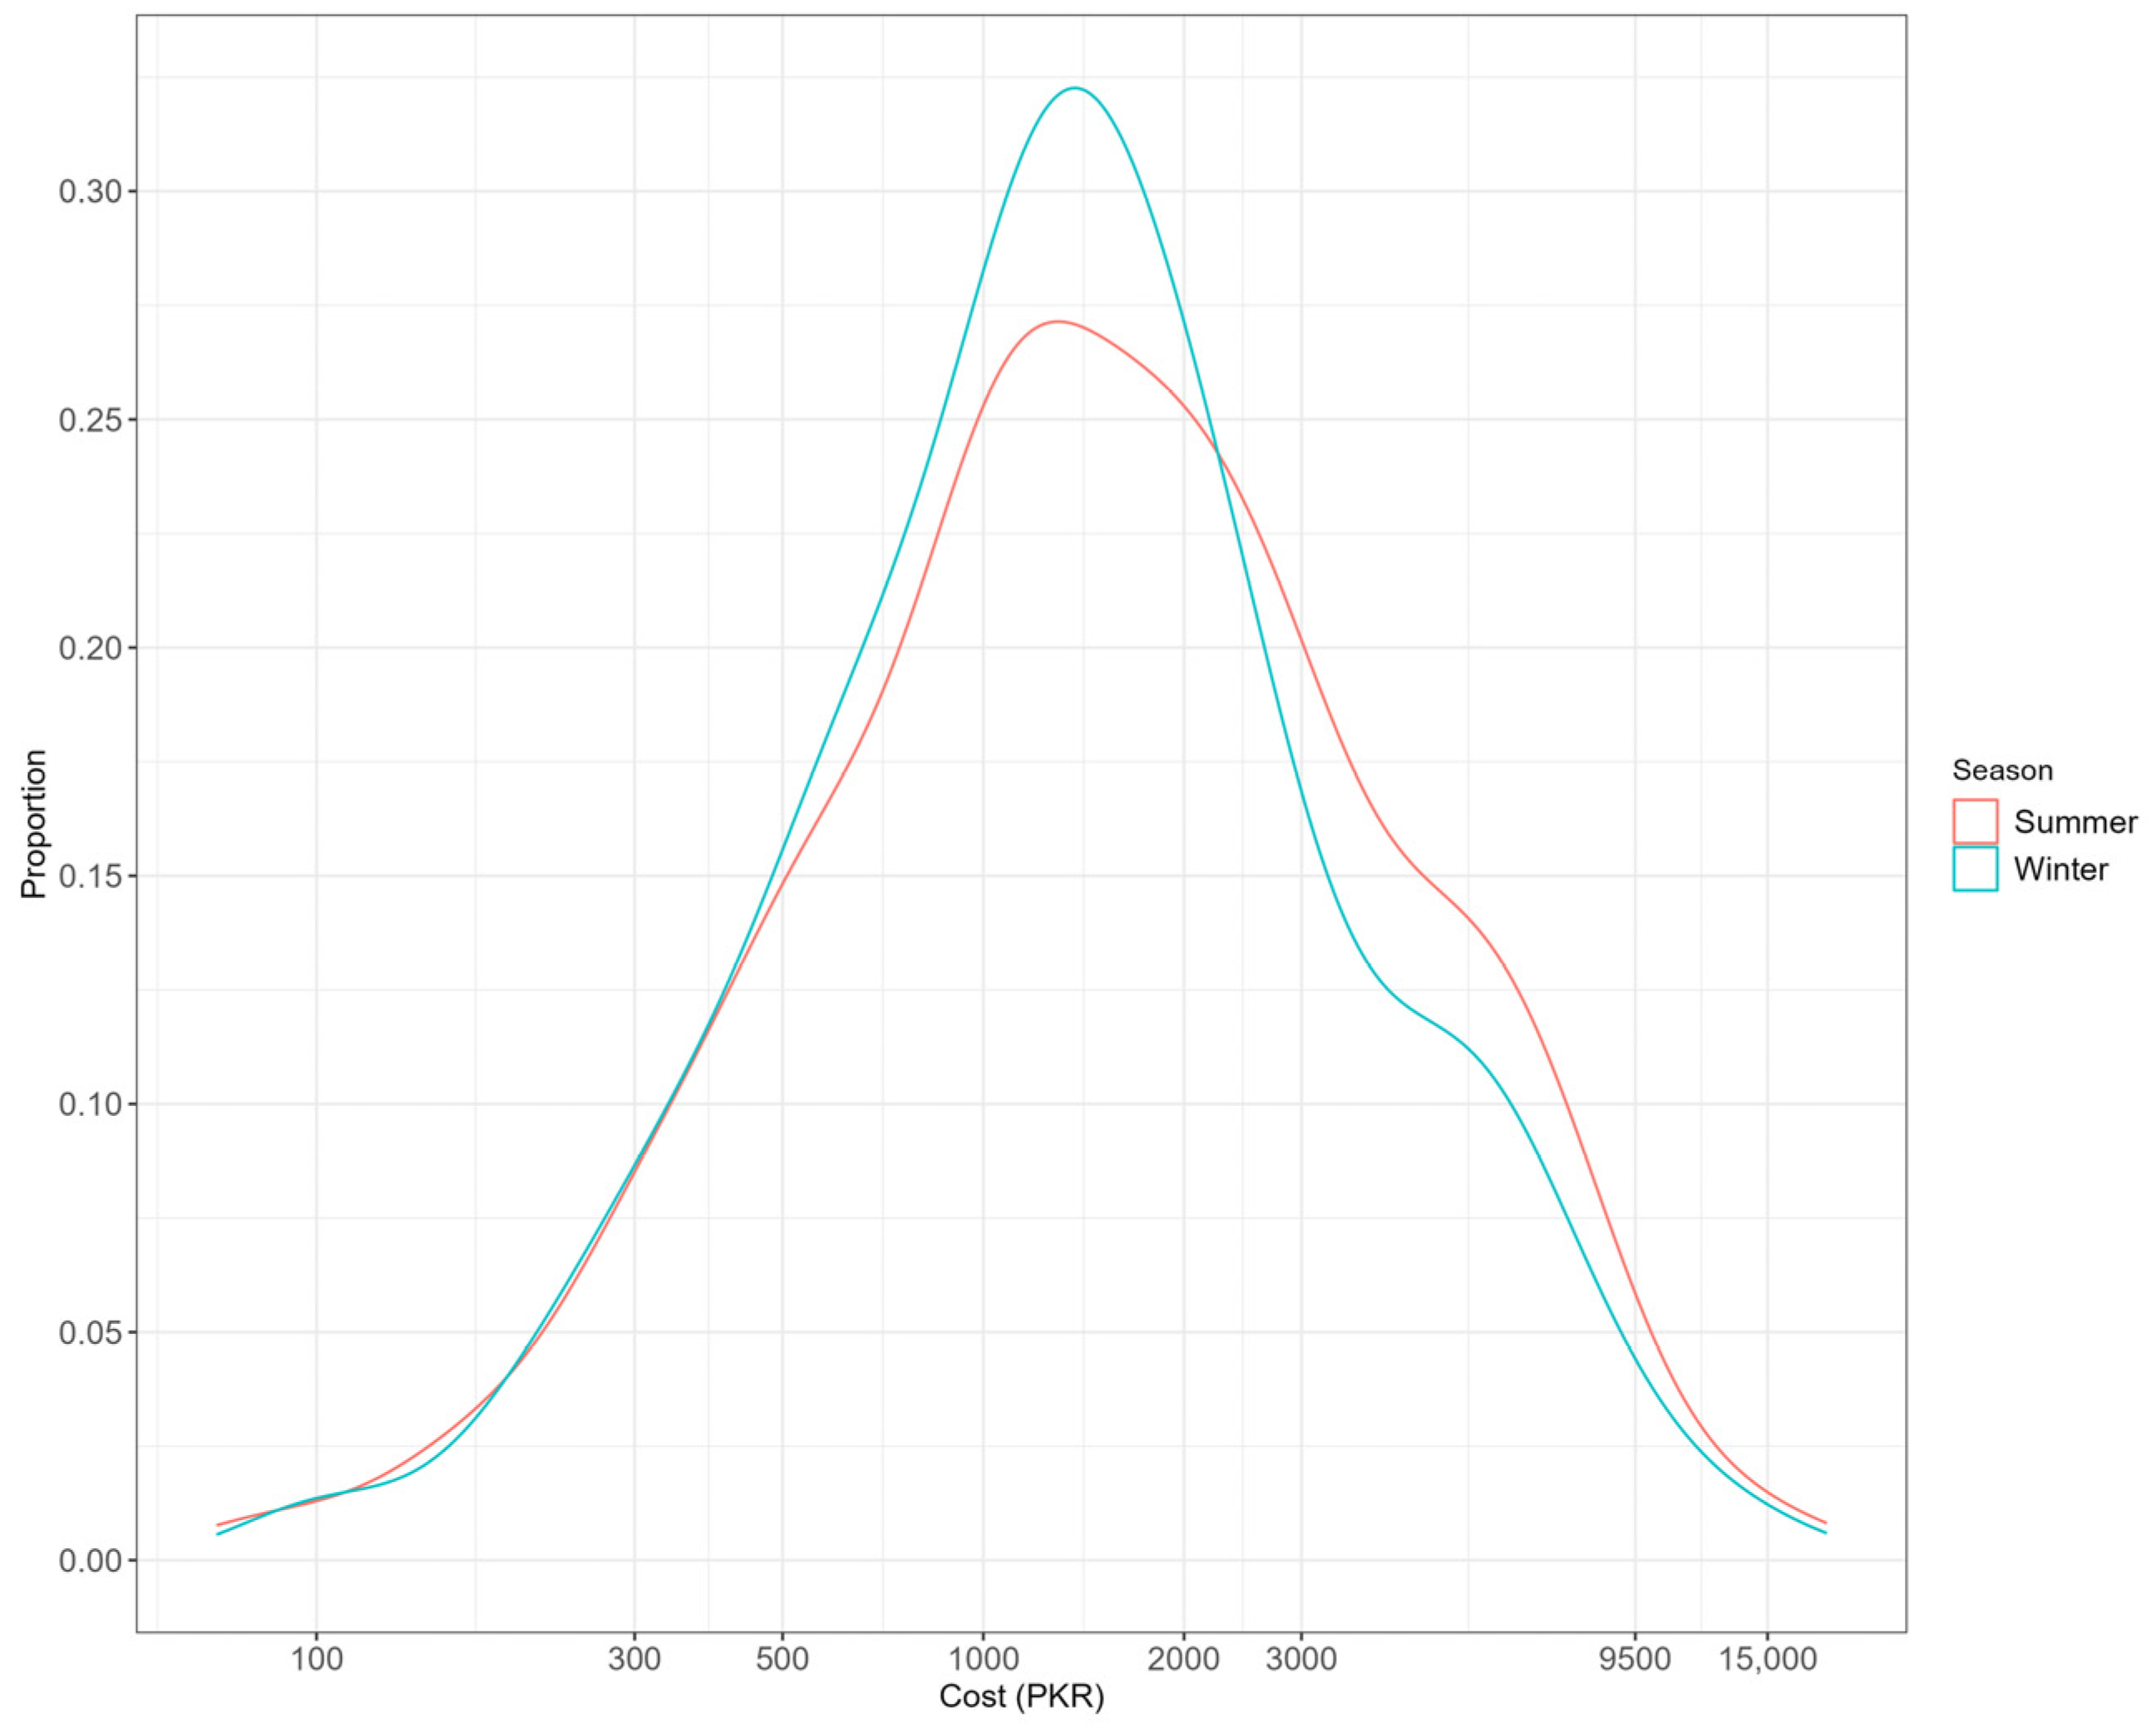
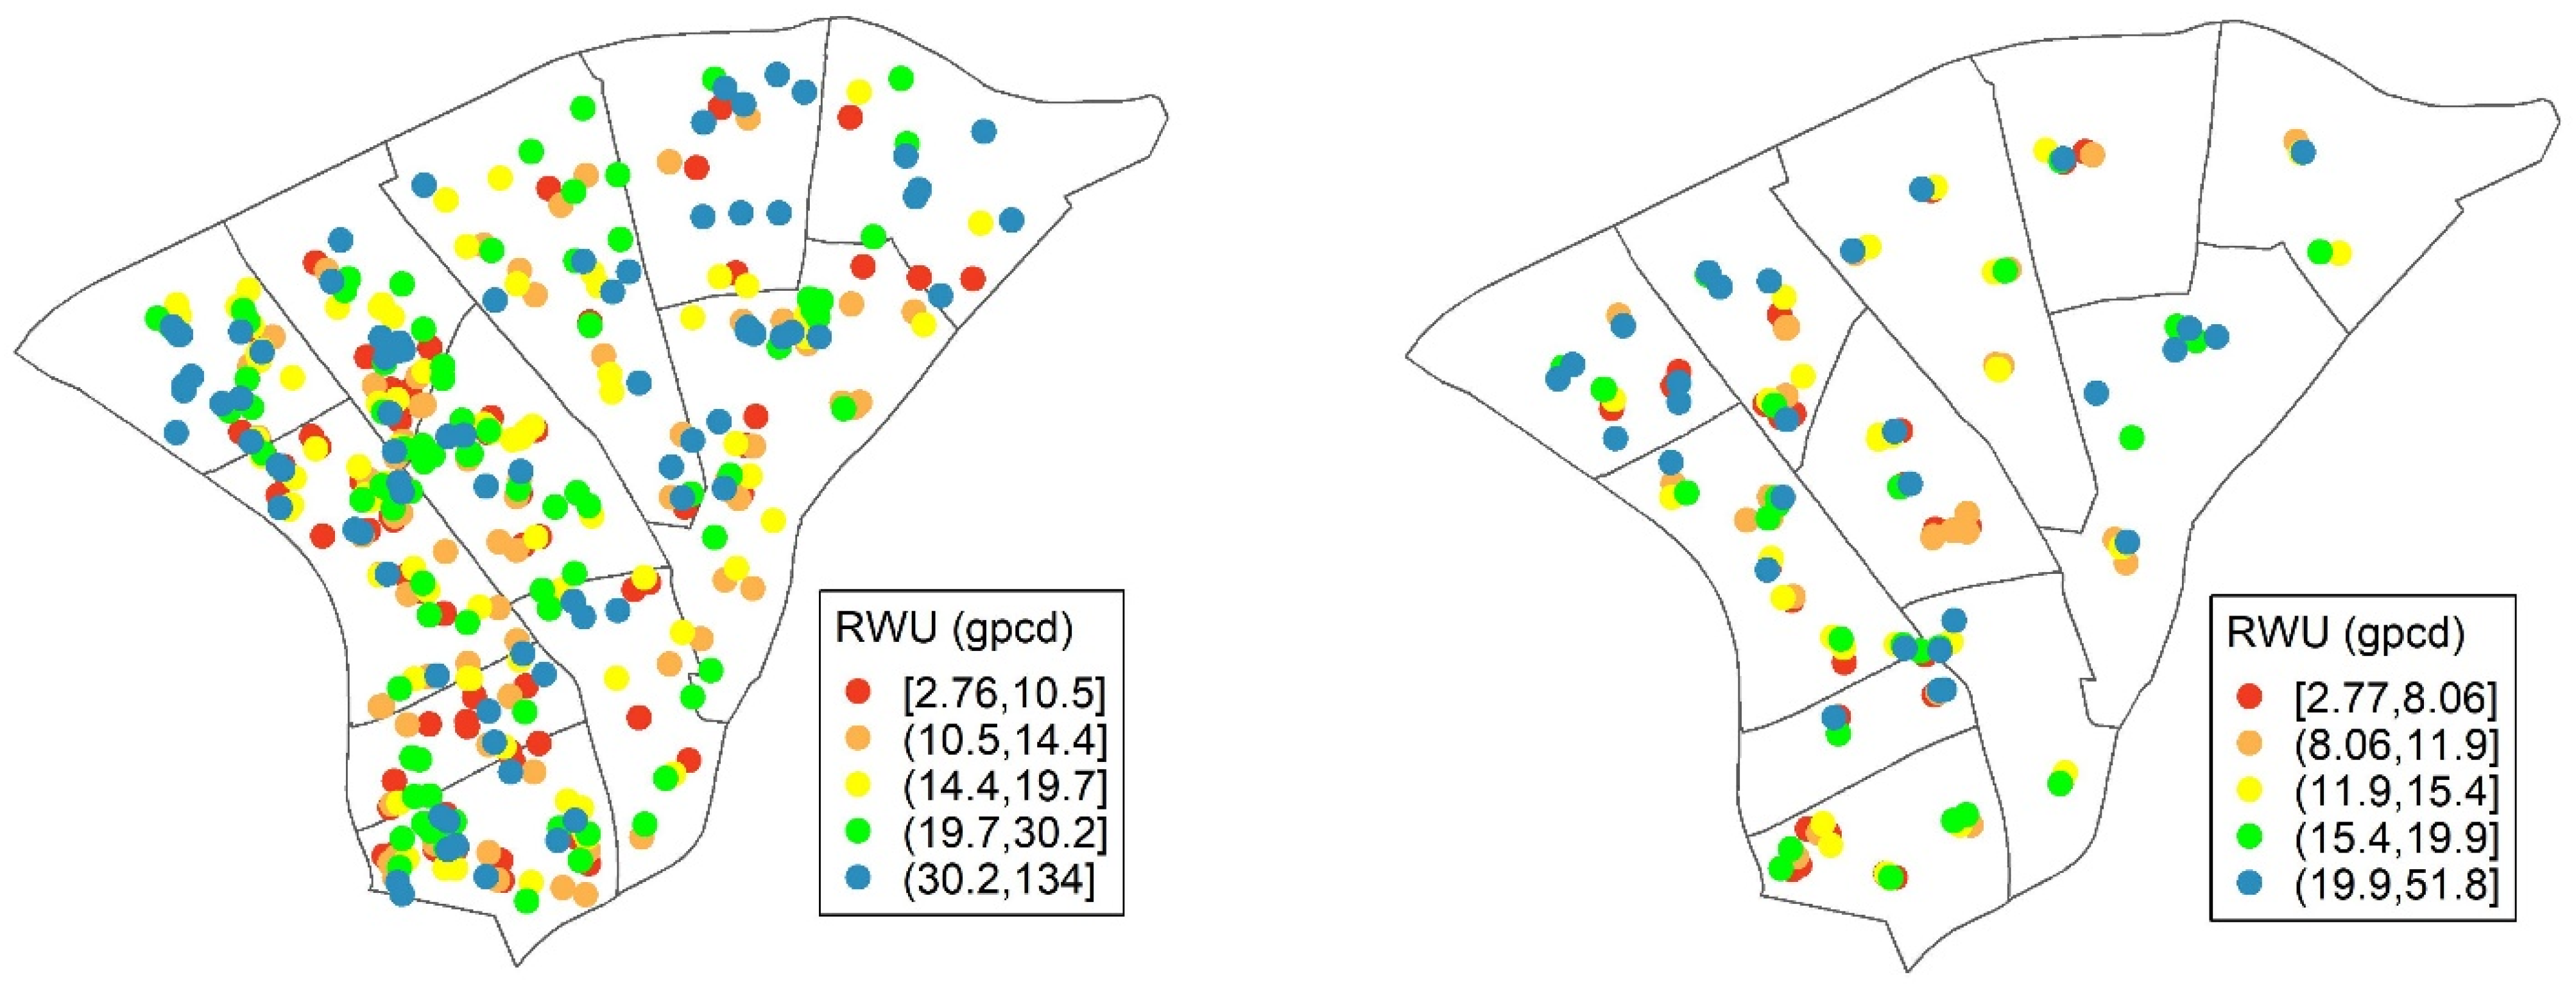
3.1. Seasonal Variation

Compared to the summers, total RWU decreases by about 19% in the winters. A significant portion of this decrease stems from a 41% reduction in bathing water use during the winters. With average daily maximum temperatures above 35 °C for most of the summers, citizens bathe to keep their body temperatures low; this is not needed in the cooler winter months. Water usage for laundry decreased by about 39% in the winters. Respondents attributed this lower laundry water use to the reduced need to change clothes in the winter. Median RWU for house washing is seen to decrease by over 38% in the winters, supporting previous findings that house washing in Karachi is practiced not only for sanitation purposes, but also as a coping mechanism against the summer heat [27]. A cooling effect is created as the water across the house evaporates; this is not required in the winters due to the cooler daytime temperatures. The RWU for dishwashing and flushing do not illustrate a similar drop due to seasonal change.
The lower water demand in the winter season means that fewer respondents reported extremely high water use. Combined with the relatively improved water supply (discussed in Section 3.4), this means that the cross-household variability in water use decreases noticeably in the winter.

3.2. Sociodemographic Variation

As noted in the existing literature, we also find differences in water use based on the respondent’s sex [40,41]. In our survey questionnaire, we ask and report the biological sex of the respondent. Most of the respondents in Lyari were women, who tended to be home when the survey was performed during the daytime (see Table 1). We observe that total RWU by female respondents was slightly higher than for male respondents. Male respondents reported a higher water use for the most water-consuming activity—bathing—whereas females reported higher water use quantities for dishwashing, laundry, and house washing. Flushing was an activity that was relatively less sensitive to the sex of the respondent.
Field observations and informal interviews suggest that the higher water use for bathing reported by male respondents could be because they were required to bathe more frequently as they would be employed in labor-intensive jobs. For the activities where females reported higher figures, it is important to note the shared nature of those activities; these collective water uses tend to primarily be carried out by females. This explains the slightly lower RWU by male respondents; they simply would not have the knowledge of the RWU for such activities, and interestingly tend to underreport time spent on the activity (which results in a lower water use number). The magnitude of seasonal variation in water use is generally similar for both male and female respondents.
Informal interviews with households revealed a gendered relationship with water in Lyari, supporting existing literature [42]. Women faced additional challenges in collecting water further away from their homes in terms of transport, safety, and culture. A female respondent remarked that collecting water as a woman in Lyari was more expensive; she had to hail auto rickshaws to make her journeys that are costlier relative to a motorbike ride that men would use. Women are often forced to only collect water during the daytime; a restriction that men do not face. Women are predominantly responsible for domestic water management in Lyari. They are tasked with ensuring the household’s water needs are being met. In some households, women are even responsible for flushing for their male counterparts; a respondent reported, “Flushing is something the women in the house take care of……it isn’t a man’s job to make sure water isn’t wasted when flushing”. Moreover, given the position of the men as the breadwinners and the role of the women in the household to manage water usage, it was very common for women to ensure that men got their water needs met before the rest of the household.
Discussion around water conservation and acknowledgment of water as a shared community resource featured in nearly all our informal interviews. Households cited religion as a major factor in their water conservation efforts and their inclination to routinely share their water source with nearby houses [43]. Almost all households shared various ways they would conserve water; households often made use of a wide range of containers and buckets for specific tasks to ensure no water is to be used out of proportion of the task.
Reusing the water from laundry for house washing was a common practice across households, where buckets of water used to rinse the clothes in laundry were then reused to mop the home. As low-income households had limited water storage capabilities, many reported doing laundry in the short duration in which piped water became available so that the water stored in the containers could be used later for other purposes. Respondents would constantly reiterate their lack of water wastage without prompting, which might indicate that the RWU may be slightly underestimating actual water consumption.

3.3. Socioeconomic Variation

Socioeconomic characteristics play a significant role in determining water demands [44]. We developed an asset score to measure a household’s wealth as an indication of its long-term economic status. Not only is this score less dependent on short-term economic changes compared to other wealth or poverty measures, it also helps avoid the limitations associated with collecting and measuring household income and expenditure accurately [45]. We collected information on various assets owned by the household and then made use of Principal Component Analysis (PCA) to develop our metric [46]. The first calculated principal component, explaining 34% of the variance in asset wealth across households, is used as the asset score.
A weak, but statistically significant positive correlation was observed between the asset score and RWU (r = 0.26), suggesting that wealthier households use more water, corroborating the findings in existing literature [47]. Another proxy for long-term wealth is the presence of household members who have completed tertiary education [48]. We find that households where one or more members had completed tertiary education reported a 60% higher water use than those without any tertiary education. It is also important to note that in Lyari, higher water uses are associated with the lowest costs; i.e., as monthly expenditures on water rise in Lyari, RWU actually drops [20]. Taken together, these findings paint a picture of highly inequitable and distorted water pricing in Lyari; the wealthier households not only use more water on average, but they do so having spent a lower amount.
Communities in Lyari that invested in collectively managing their water enjoyed a more reliable and ample water supply than households individually managing their water needs. For example, one of our survey respondents ended up spending over 100,000 PKR to source a water pipeline for his home, with the bulk of this amount comprising bribes to the police, plumbers, and KWSB employees. He believed that because he had no community backing, he was open to exploitation, stating that: “In Lyari, ordinary people’s rights and problems aren’t listened to, only the problems of communities are given some importance”.
Neighbors in individual streets often collaborate to source a bulk pipeline from another area to improve water supply. Joint purchase of a water tanker delivery or the installation of a pipeline to the nearest possible household was also observed. Respondents who live in apartments—which often have collectively managed water supply—have a higher median RWU in both the summer (18.5 gpcd) and winter seasons (14 gpcd) compared to those living in individual houses.
Figure 4 illustrates total daily per capita RWU across Lyari for the summer and winter seasons. Neighborhoods in western Lyari receive a lower water supply than eastern Lyari [20]. However, households with an RWU in the highest quintile are not just restricted to the water-rich eastern part of Lyari; they are spread all across Lyari, even in the most water-scarce neighborhoods in Lyari’s western wing. This suggests that certain households are able to deploy resources to reduce their water stress, pointing towards a glaring inequity in access to water. The figure shows how households in the lowest and highest quintiles of RWU often exist nearby, sometimes on the same street. During the surveys, many respondents lamented the ability of socioeconomically privileged neighboring households to procure water at will. This was perceived by many to aggravate their own state of water poverty. By diverting water supply by paying bribes, using strong suction pumps to change hydraulic pressure gradients, or by purchasing from alternate sources (that often illegally pilfer piped water), the privileged households were “stealing” from the share of others.
Disparities in water use give rise to social tensions. One such example was the Moosa Lane neighborhood in Lyari, where it was common for piped water availability to vary from street to street, and even sometimes within a street. Households were observed to be reluctant to admit they received piped water for fear of antagonizing their neighbors who did not. This disparity also prevented collective action to change the status quo; households who received a piped water supply would disengage from or even actively counter any action for fear of losing their existing ‘privilege’.
Lower-income households end up paying much higher proportions of their monthly income to cover their monthly water expenditure, often for much lower quantities of water [20]. There is tremendous variation in monthly household water expenditures: the 75th percentile (PKR 2000) is approximately five folds the amount of the 25th percentile (PKR 400), demonstrating inequitable water pricing in Lyari.
Next, we investigate whether monthly water expenses vary based on season. This expenditure on water includes not just the cost of water itself, but also any costs associated with its procurement (e.g., transportation, pumping etc.). The piped water supply in Karachi is not metered, and the water utility, KWSB, adopts a flat billing mechanism; it charges a uniform monthly fee for piped water supply. Given this context, monthly water expenses would not be expected to change for households that rely completely on piped water supply. However, the reduced water scarcity in the winters would be expected to lead to reduced monthly expenditures for those households relying on alternate sources of water (where the water costs are linked to the volume procured). In the summer months, respondents often noted that their water stress was exploited by private water vendors, who would increase prices based on the high prevailing water scarcity.
Figure 5 above shows that the distribution of monthly household water expenses is similar across summers and winters, with two consequential differences. First, as expected, a larger proportion of respondents reported spending more than PKR 2000 on monthly water expenses in the summers compared to the winter. This substantiates the claim of Lyari residents regarding water price gouging as being more prevalent in the summers. Second, the distribution shows a slightly higher median monthly water cost in the winters. This counter-intuitive finding indicates that the high monthly expenditure on water is not entirely a result of scarcity and has important policy implications. The slight increase in water expenditures in the winter could be attributed to the high inflation observed between the two rounds of survey. These inflationary pressures would also affect private water vendors, resulting in slightly higher prices in the winter (and not lower, as hypothesized).

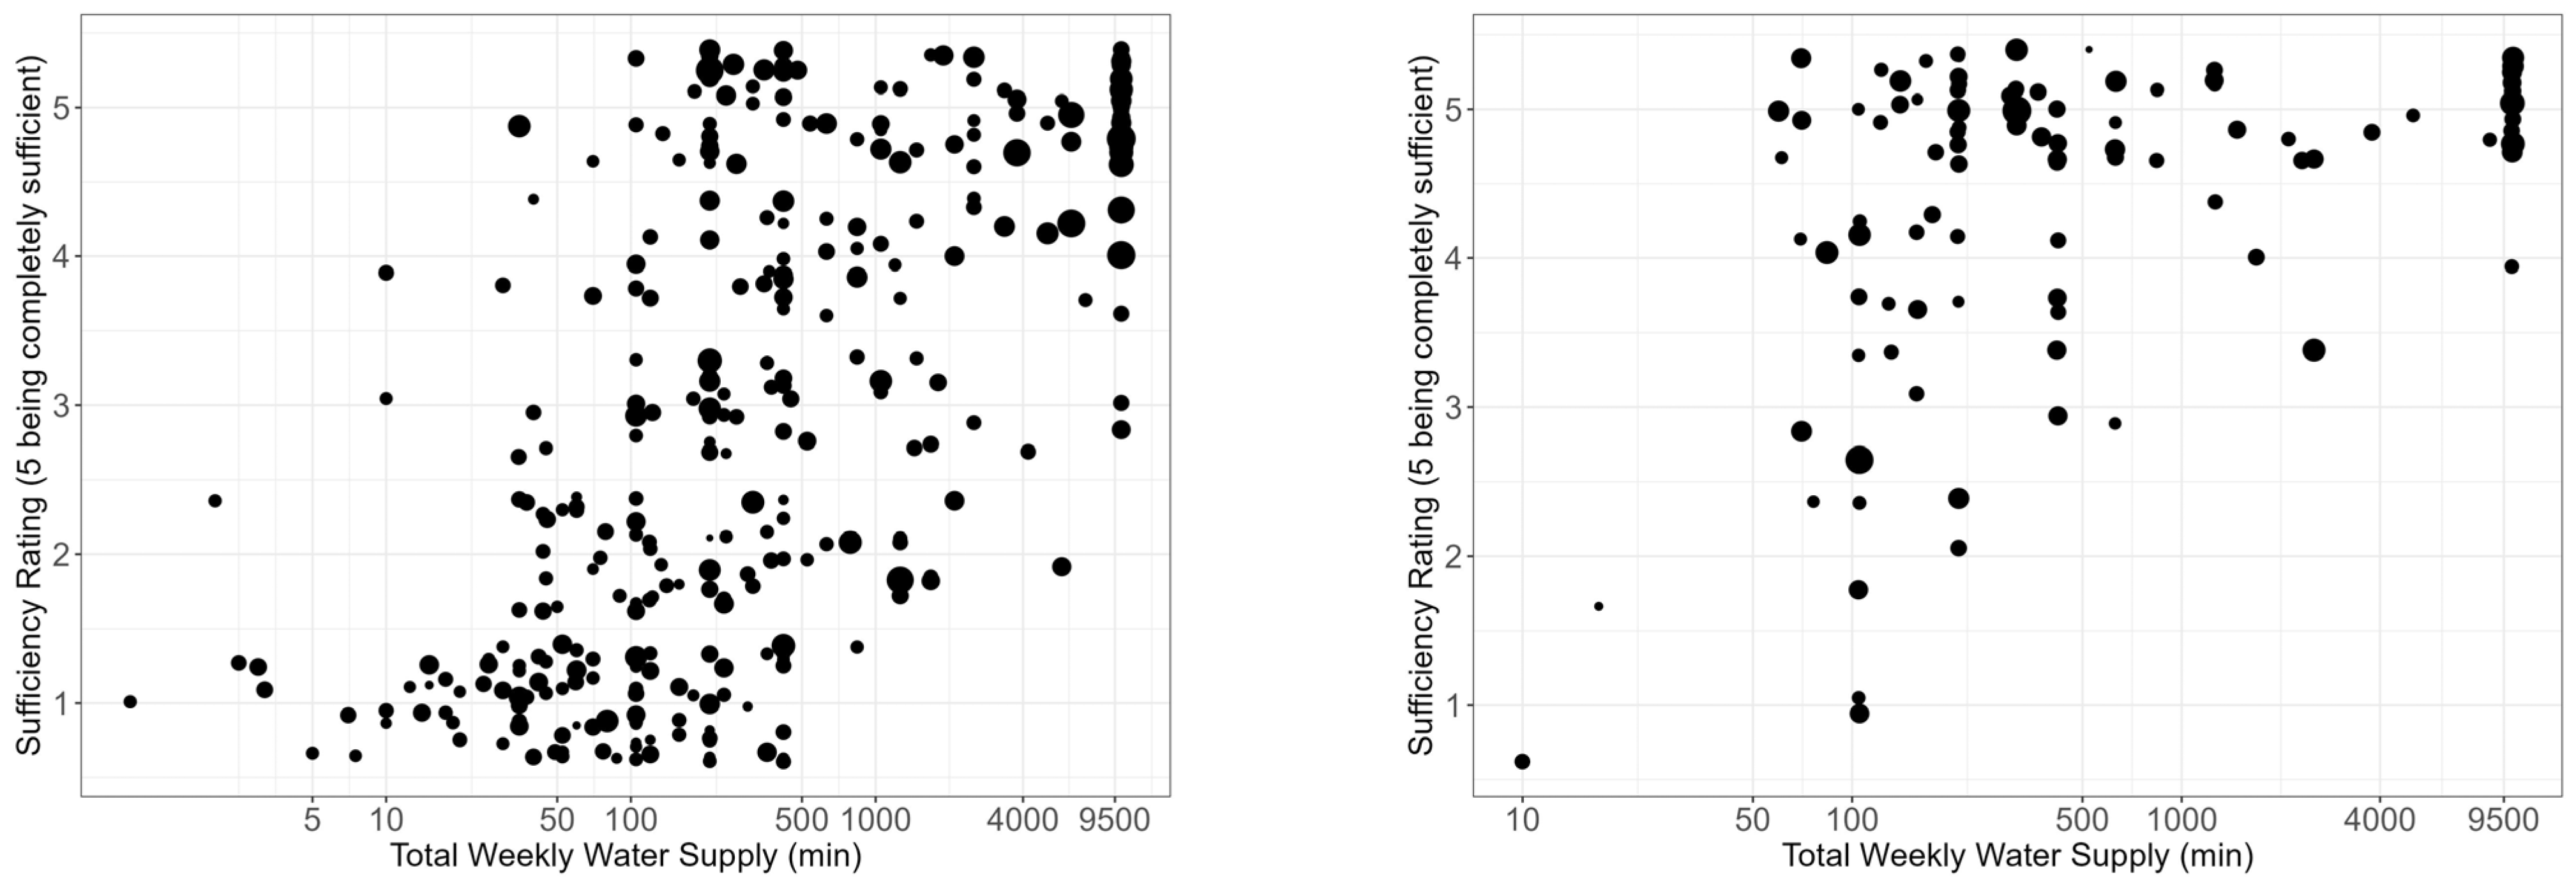
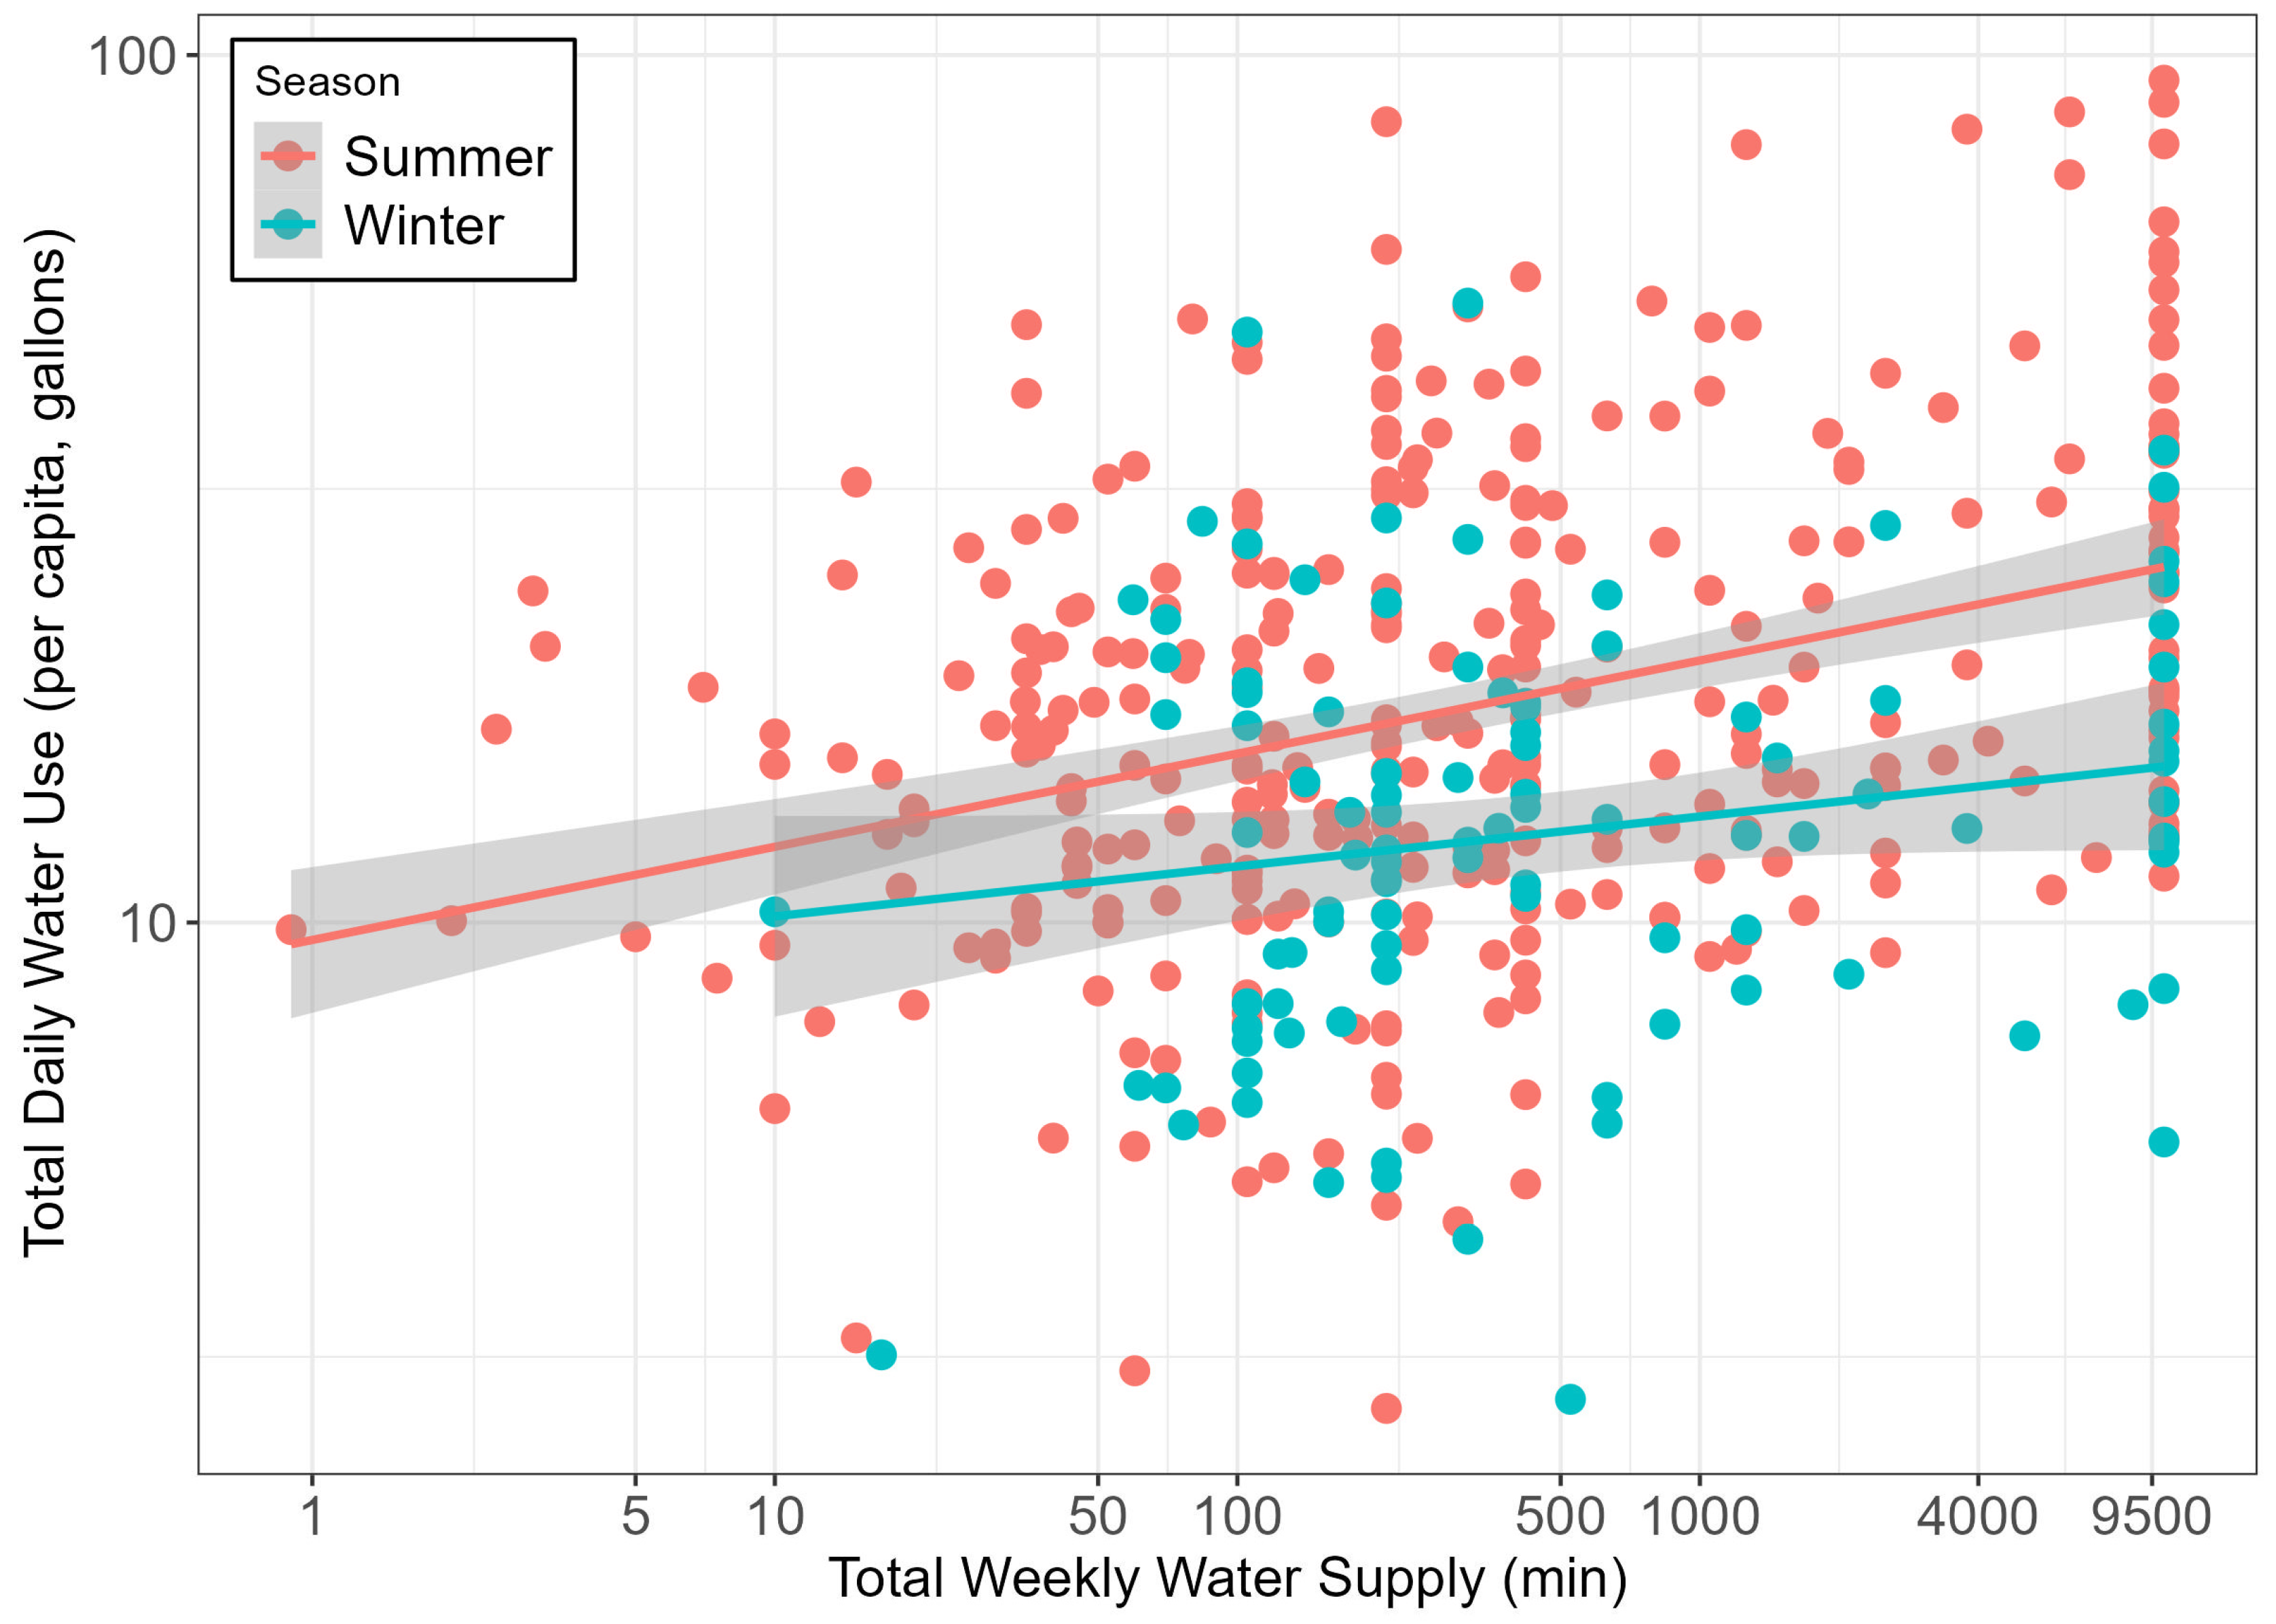
3.4. Water Supply Variation

Figure 6 illustrates that improved availability of piped water supply results in higher reported water use across both summers and winters. The higher the cumulative minutes of weekly water supply, the higher the RWU. The trendline is statistically significant in the summers (at the 99.9% confidence level) and not the winters; this might indicate a lower demand for water in the cooler months. Simply put, the demand for water in summers relative to the supply is so high that every additional drop of water gets used. For households that report access to uninterrupted piped water supply, there is a significant difference between median RWU in the summers (27 gpcd) and the winters (16.5 gpcd). It is important to note that even when households face no water supply restrictions, the reported per capita usage is significantly lower than the demand assumed by KWSB.
Dilapidated pipelines and intermittent water supply mean that the potable piped water is often contaminated by sewage; 41% of households reported that they regularly observed sewage mixing in their water supply. We find that a higher frequency of sewage mixing with piped water supply leads to reduced water use by households. This relationship is more evident in winters than in summers, indicating that higher water scarcity in the summers and a lack of alternatives mean that households are forced to use the water, despite sewage mixing. In winters, when scarcity and water demand are relatively reduced, households can use alternate sources or adapt their usage to avoid contaminated piped water.

3.5. Perceptions of Sufficiency

Piped water supply in Lyari is intermittent. Each area receives water for a limited duration on a predetermined weekly schedule. We calculated total weekly water supply to an area based on the number of instances water is delivered to a particular area and the average duration of water supply per instance. Figure 7 (left panel) shows that in the summer months, as total weekly water supply increases, respondents’ perception of sufficiency improves. Because sufficiency is a factor of both water demand and supply, there is significant variation in the reported perception for the same amount of water availability. A higher RWU (denoted by the size of the bubble) is often (but not always) seen to be associated with higher levels of sufficiency rating and water availability.
We find that despite there being no statistically significant seasonal difference between cumulative weekly water supply, citizens’ perception of water sufficiency changes significantly between summers and winters, indicating reduced water demand in the winters. Figure 7 (right panel) reveals a limited number of low sufficiency ratings by respondents in the winter. Interestingly, although the total duration of water supply is similar across the seasons, the frequency of water availability (i.e., number of times a week that water is available in the pipes) is significantly higher in the winter, suggesting a more consistent access to piped water. Thus, the improvement in reported sufficiency can be attributed to reduced demand and more frequent supply of piped water. This is explained by the socioeconomics of Lyari; lower income households simply do not have the capacity to store water in large capacities, as they would often be only able to store water for a couple of days. In the context of access to piped water, this supports existing literature [49] that emphasizes accounting for both duration of water availability and the frequency of water supply in intermittent piped water systems.

4. Discussion

The results have two key limitations that should be considered before discussing their implications. First, the results only reflect the water use patterns in Lyari, a predominantly low-income neighborhood. They do not reflect water usage for affluent household in different parts of Karachi. The results show that (i) water use varies significantly across time and space, which challenges the assumption of a uniform per capita demand for the entire city, and (ii) most residents in low-income neighborhoods, which comprise a majority of the city’s population, use much less water than the utility’s estimated usage. The second limitation is related to the accuracy of the reported water uses. Due to the unreliable and insufficient water supply in Lyari, the median water use among the surveyed households may not represent their actual water needs. As observed in many Indian cities [14], water supply, rather than demand, determines how much water households use. This forces households to “adjust” to the available water supply, often compromising their health, well-being, and quality of life.
A more realistic approximation of true water demands can be obtained from the reported usages of those respondents that expressed complete satisfaction with the sufficiency of their water supply (rating of 5). For such households, median RWU in the summers is 23.3 gpcd (n = 99) and 13.7 gpcd (n = 74) in the winters. Although the summer RWU for completely satisfied households is substantively higher than that of the entire surveyed sample (23.3 gpcd vs. 16 gpcd), the winter RWU is not too different (13.7 gpcd vs. 13 gpcd). As mentioned previously, this indicates that the RWU in the winter is close to the true demand. The reported uses by completely satisfied residents are still significantly lower than the 54 gpcd used by the water utility to project uniform water demand across the city.
Our estimates for RWU largely align with those from previous studies of low-income, water-stressed households in developing countries [14,25,50]. Household size, education, and wealth impacts the volumes of water used, supporting findings by others [2,51]. Relative to more affluent households, our surveyed population primarily focuses on meeting only domestic needs (instead of for example, landscaping). Importantly, this suggests that these water uses may increase in the future as more people gain access to improved water sources and services, and as their living standards rise [44]. Literature suggests that the seasonal variation of household water demand is not unique to Karachi, but a common phenomenon in many other cities and used by utilities to inform water resources planning [52,53].
The results suggest that the gap between water demand and supply in Karachi may be smaller than what the utility claims, as more than half of the city’s population lives in low-income informal settlements. This finding has two important implications. First, it challenges the KWSB’s use of system-level water scarcity as a justification for its poor service delivery. The results do not imply that the city has enough water supply, but they indicate that the water “shortages” may be exaggerated. Therefore, the utility should also address other issues (e.g., access, pricing) that affect Karachi’s water situation, rather than focusing only on increasing water supply. Second, and more significantly, the results question the need for costly water infrastructure projects that are based on inflated demand estimates. The KWSB, which depends on provincial subsidies to cover its operational costs, will find it hard to maintain such projects in a sustainable manner. A more realistic and effective solution for Karachi’s water problems may lie in management interventions that can improve the existing water system.
These findings raise the need for improved understanding of household water use in Karachi. Instead of relying on non-contextually relevant assumed water usage, the water utility would be well-advised to conduct empirical studies to ascertain true demand. Such studies should encompass households across a wide range of socioeconomic spectra. Water metering, even at a limited scale, would not only provide finer resolution data but could also contribute to more transparent water allocation and water pricing policies.
Ironically, although KWSB incorporates the huge number of residents in low-income neighborhoods in its water demand estimates for Karachi, it clearly fails to provide anything close to this water need to those residents. This is despite the fact that other higher income neighborhoods of Karachi receive a considerably higher per capita water supply. Only about one in six residents in Lyari are able to meet their water needs from KWSB’s piped water supply [20]. Water is essential for life, health, and dignity of all people. Human right to water entitles everyone to have water that is affordable, acceptable, accessible, and safe for personal and domestic use. However, this basic right is not available for many residents in Lyari. It is crucial that the utility adopt a human rights-based approach to water management that ensures that no one is left behind and that the most vulnerable groups are prioritized.
A useful avenue of future research would be the use of smart water meters to develop accurate water demand estimates for affluent households, which often have access to more regular and reliable piped water supply in Karachi [54]. Together with the water use of non-piped, low-income households, this would allow for better informed water demand projections [55]. Additionally, the use of water diaries to supplement the household surveys would make for a logical extension of this research [56]. Although our results may be affected by implicit biases, water diaries can provide more reliable and detailed information on how, when, and why people use water.

5. Conclusions

Urban South Asia faces growing water challenges due to the combined effects of water scarcity, urbanization, and climate change. To address these challenges, it is essential to have an empirical understanding of how domestic water is used in the region. This would help to make more accurate water demand forecasts, fairer water allocation schemes, and more effective water-saving measures. In this study, we use a mixed-methods approach comprising informal interviews and over 600 household surveys conducted across the summer and winter seasons to quantify household water use and its determinants in the low-income neighborhood of Lyari.
The results of the study reveal that the assumed per capita daily water demand used by the water utility for planning purposes (54 gpcd) vastly overestimates actual usage (13–16 gpcd) in our study area. This has important implications for the expensive water infrastructure investments that are either planned or underway. Household water use was found to be lower in the winters, showing the presence of seasonal variability in water demand. Wealthier households exhibited a higher water use, even when they were situated in a water-scarce neighborhood, highlighting the ability of the socioeconomically privileged to purchase water scarcity and thereby exacerbate social inequity. Surprisingly, monthly expenditures on water were not found to be linked closely to water scarcity. Even though piped water supply was not found to change substantially between the seasons, residents’ perception of sufficiency of water supply increased significantly in the winters, indicating reduced water demand.
This is the first empirical investigation of disaggregated household water use and its determinants in one of the largest cities in the world (Karachi). Although the body of literature focusing on urban water use in low-income neighborhoods in the Global South is sizeable, no such study exists for Karachi. This work addresses the shortcomings with the existing water demand projections for the city and lays the foundation for more realistic estimates. This work aims to move the discourse on urban water challenges beyond a one-dimensional focus on water shortages and scarcity. A logical extension of this work would be an investigation of household water use in higher income neighborhoods.

Author Contributions

Conceptualization, H.F.K. and S.A.A.; Methodology, H.F.K. and S.A.A.; Formal analysis, H.F.K.; Investigation, S.I., M.A.A. and S.A.A.; Writing—original draft preparation, H.F.K., S.I., M.A.A. and S.A.A.; Writing—review and editing, H.F.K.; Visualization, H.F.K.; Funding acquisition, H.F.K. All authors have read and agreed to the published version of the manuscript.

Funding

Field work was supported by a grant from the Higher Education Commission as part of the National Research Program for Universities [grant# 13659]. This publication was made possible by FRAC funding at Tufts University.

Institutional Review Board Statement

All surveys and interviews performed involving human participants were in accordance with the ethical standards of Habib University’s institutional review board.

Informed Consent Statement

Informed consent was obtained from all individual participants involved in the study.

Data Availability Statement

The data presented in this study are available on request from the corresponding author. The data are not publicly available due to privacy concerns of respondents.

Conflicts of Interest

The authors declare no conflict of interest. The funders had no role in the design of the study; in the collection, analyses, or interpretation of data; in the writing of the manuscript; or in the decision to publish the results.

References

  1. Flörke, M.; Schneider, C.; McDonald, R.I. Water Competition between Cities and Agriculture Driven by Climate Change and Urban Growth. Nat. Sustain. 2018, 1, 51–58. [Google Scholar] [CrossRef]
  2. Nauges, C.; Whittington, D. Estimation of Water Demand in Developing Countries: An Overview. World Bank Res. Obs. 2010, 25, 263–294. [Google Scholar] [CrossRef]
  3. Vairavamoorthy, K.; Gorantiwar, S.D.; Pathirana, A. Managing Urban Water Supplies in Developing Countries—Climate Change and Water Scarcity Scenarios. Phys. Chem. Earth Parts ABC 2008, 33, 330–339. [Google Scholar] [CrossRef]
  4. Pesantez, J.E.; Berglund, E.Z.; Kaza, N. Smart Meters Data for Modeling and Forecasting Water Demand at the User-Level. Environ. Model. Softw. 2020, 125, 104633. [Google Scholar] [CrossRef]
  5. Edwards, K.; Martin, L. A Methodology for Surveying Domestic Water Consumption. Water Environ. J. 1995, 9, 477–488. [Google Scholar] [CrossRef]
  6. Kim, S.H.; Choi, S.H.; Koo, J.Y.; Choi, S.I.; Hyun, I.H. Trend Analysis of Domestic Water Consumption Depending upon Social, Cultural, Economic Parameters. Water Supply 2007, 7, 61–68. [Google Scholar] [CrossRef]
  7. Abraham, S.; Diringer, S.; Cooley, H. An Assessment of Urban Water Demand Forecasts in California; Pacific Institute: Oakland, CA, USA, 2020; p. 16. [Google Scholar]
  8. Heberger, M.; Donnelly, K.; Cooley, H. A Community Guide for Evaluating Future Urban Water Demand; Pacific Institute: Oakland, CA, USA, 2016; p. 48. [Google Scholar]
  9. Anand, N. Hydraulic City: Water and the Infrastructures of Citizenship in Mumbai; Duke University Press: Durham, NC, USA; London, UK, 2017; ISBN 978-0-8223-6254-8. [Google Scholar]
  10. KWSB. Water Management—KWSB 2022; KWSB: Karachi, Pakistan, 2022. [Google Scholar]
  11. Janjua, S.; Hassan, I.; Ali, M.U.; Ibrahim, M.M.; Zafar, A.; Kim, S. Addressing Social Inequality and Improper Water Distribution in Cities: A Case Study of Karachi, Pakistan. Land 2021, 10, 1278. [Google Scholar] [CrossRef]
  12. Rizavi, T. Investing in Karachi. Available online: https://www.thenews.com.pk/print/885102-investing-in-karachi (accessed on 31 August 2022).
  13. Fan, L.; Wang, F.; Liu, G.; Yang, X.; Qin, W. Public Perception of Water Consumption and Its Effects on Water Conservation Behavior. Water 2014, 6, 1771–1784. [Google Scholar] [CrossRef]
  14. Shaban, A.; Sharma, R.N. Water Consumption Patterns in Domestic Households in Major Cities. Econ. Polit. Wkly. 2007, 42, 9. [Google Scholar]
  15. JICA. Study on Water Supply and Sewerage System in Karachi; JICA: Tokyo, Japan, 2008. [Google Scholar]
  16. Abdullah, R. The Role of Private Vending in Developing Country Water Service Delivery: The Case of Karachi, Pakistan. Master’s Dissertation, Massachusetts Institute of Technology, Cambridge, MA, USA, 1999. [Google Scholar]
  17. Anand, N. PRESSURE: The PoliTechnics of Water Supply in Mumbai. Cult. Anthropol. 2011, 26, 542–564. [Google Scholar] [CrossRef]
  18. Fletcher, S.; Strzepek, K.; Alsaati, A.; Weck, O. de Learning and Flexibility for Water Supply Infrastructure Planning under Groundwater Resource Uncertainty. Environ. Res. Lett. 2019, 14, 114022. [Google Scholar] [CrossRef]
  19. Fluence Sydney’s White Elephant Desalination Plant. Available online: https://www.fluencecorp.com/white-elephant-desalination-plant/ (accessed on 2 September 2022).
  20. Khan, H.F.; Arshad, S.A. Beyond Water Scarcity: Water (in)Security and Social Justice in Karachi. J. Hydrol. Reg. Stud. 2022, 42, 101140. [Google Scholar] [CrossRef]
  21. Donkor, E.A.; Mazzuchi, T.A.; Soyer, R.; Alan Roberson, J. Urban Water Demand Forecasting: Review of Methods and Models. J. Water Resour. Plan. Manag. 2014, 140, 146–159. [Google Scholar] [CrossRef]
  22. Baigorri, B.; Montañés, A.; Simón-Fernández, M.B. Household Water Consumption in Spain: Disparities between Region. Water 2022, 14, 1121. [Google Scholar] [CrossRef]
  23. Basu, M.; Hoshino, S.; Hashimoto, S.; DasGupta, R. Determinants of Water Consumption: A Cross-Sectional Household Study in Drought-Prone Rural India. Int. J. Disaster Risk Reduct. 2017, 24, 373–382. [Google Scholar] [CrossRef]
  24. Adams, E.A. Intra-Urban Inequalities in Water Access among Households in Malawi’s Informal Settlements: Toward pro-Poor Urban Water Policies in Africa. Environ. Dev. 2018, 26, 34–42. [Google Scholar] [CrossRef]
  25. Mutono, N.; Wright, J.; Mutembei, H.; Thumbi, S.M. Spatio-Temporal Patterns of Domestic Water Distribution, Consumption and Sufficiency: Neighbourhood Inequalities in Nairobi, Kenya. Habitat Int. 2022, 119, 102476. [Google Scholar] [CrossRef]
  26. Anwar, N.H.; Khan, H.F.; Abdullah, A.; Macktoom, S.; Fatima, A. Designed to Fail? Heat Governance in Urban South Asia: The Case of Karachi a Scoping Study; Cool Infrastructures: Life with Heat in the Off-grid City: Karachi; University of Edinburgh: Edinburgh, UK, 2022; p. 48. [Google Scholar]
  27. Anwar, N.H.; Sawas, A.; Mustafa, D. ‘Without Water, There Is No Life’: Negotiating Everyday Risks and Gendered Insecurities in Karachi’s Informal Settlements. Urban Stud. 2020, 57, 1320–1337. [Google Scholar] [CrossRef]
  28. Syvrud, A.; Pohlner, H.; Punthakey, J.F.; Grant, M.; Green, T. Advancing Urban Water Security in the Indus Basin, Pakistan—Priority Actions for Karachi and Lahore. Water 2021, 13, 3399. [Google Scholar] [CrossRef]
  29. Price, H.; Adams, E.; Quilliam, R.S. The Difference a Day Can Make: The Temporal Dynamics of Drinking Water Access and Quality in Urban Slums. Sci. Total Environ. 2019, 671, 818–826. [Google Scholar] [CrossRef]
  30. Di Mauro, A.; Cominola, A.; Castelletti, A.; Di Nardo, A. Urban Water Consumption at Multiple Spatial and Temporal Scales. A Review of Existing Datasets. Water 2020, 13, 36. [Google Scholar] [CrossRef]
  31. Beard, V.A.; Mitlin, D. Water Access in Global South Cities: The Challenges of Intermittency and Affordability. World Dev. 2021, 147, 105625. [Google Scholar] [CrossRef]
  32. Mustafa, D.; Gioli, G.; Karner, M.; Khan, I. Contested Waters: Subnational Scale Water Conflict in Pakistan; Peaceworks; United States Institute of Peace: Washington, DC, USA, 2017. [Google Scholar]
  33. Saleem, A.; Toheed, M.; Arif, M. Karachi—Housing without a Future?: More Than 60 Percent of Karachi’s Population Lives in Katchi Abadis or Informal Settlements. Available online: https://www.thenews.com.pk/tns/detail/621740-karachi-housing-without-a-future (accessed on 1 September 2022).
  34. PPP Senator Urges to Resolve Acute Water Shortage Issue of Lyari. Available online: https://nation.com.pk/2022/04/25/ppp-senator-urges-to-resolve-acute-water-shortage-issue-of-lyari/ (accessed on 20 October 2022).
  35. “We Are Not Treated like Humans”: Lyari’s Struggle for Water—Pakistan. Available online: https://dunyanews.tv/en/Pakistan/435359-We-are-not-treated-like-humans-Lyaris-struggle-for-water (accessed on 20 October 2022).
  36. Pakistan Bureau of Statistics Final Census Results. Available online: https://www.pbs.gov.pk/content/final-results-census-2017 (accessed on 16 July 2023).
  37. Gayer, L. Ordered Disorder and the Struggle for the City; Hurst and Co. Publishers: New Delhi, India, 2014. [Google Scholar]
  38. Ivankova, N.V.; Creswell, J.W.; Stick, S.L. Using Mixed-Methods Sequential Explanatory Design: From Theory to Practice. Field Methods 2006, 18, 3–20. [Google Scholar] [CrossRef]
  39. Singh, O.; Turkiya, S. A Survey of Household Domestic Water Consumption Patterns in Rural Semi-Arid Village, India. GeoJournal 2013, 78, 777–790. [Google Scholar] [CrossRef]
  40. Jorgensen, B.; Graymore, M.; O’Toole, K. Household Water Use Behavior: An Integrated Model. J. Environ. Manag. 2009, 91, 227–236. [Google Scholar] [CrossRef]
  41. Zoungrana, T.D. The Effect of Wealth on the Choice of Household Drinking Water Sources in West Africa. Int. J. Financ. Econ. 2021, 26, 2241–2250. [Google Scholar] [CrossRef]
  42. Anwar, N.; Mustafa, D.; Sawas, A.; Sharmeen, M. Gender and Violence in Urban Pakistan; IDRC: Karachi, Pakistan, 2016. [Google Scholar]
  43. Hüttl, R.F.; Bens, O.; Bismuth, C.; Hoechstetter, S. (Eds.) Society—Water—Technology; Water Resources Development and Management; Springer International Publishing: Cham, Switzerland, 2016; ISBN 978-3-319-18970-3. [Google Scholar]
  44. Hussien, W.A.; Memon, F.A.; Savic, D.A. Assessing and Modelling the Influence of Household Characteristics on Per Capita Water Consumption. Water Resour. Manag. 2016, 30, 2931–2955. [Google Scholar] [CrossRef]
  45. Tareq, M.; Abdel-Razaq, A.; Rahman, A.; Choudhury, T. Comparison of Weighted and Unweighted Methods of Wealth Indices for Assessing SOCIO-ECONOMIC Status|Elsevier Enhanced Reader. Heliyon 2021, 7, e06163. [Google Scholar] [CrossRef]
  46. Hjelm, L.; Mathiassen, A.; Miller, D.; Wadhwa, A. Creation of a Wealth Index; World Food Programme: Rome, Italy, 2017; p. 26. [Google Scholar]
  47. Barnett, M.J.; Jackson-Smith, D.; Endter-Wada, J.; Haeffner, M. A Multilevel Analysis of the Drivers of Household Water Consumption in a Semi-Arid Region. Sci. Total Environ. 2020, 712, 136489. [Google Scholar] [CrossRef]
  48. Arouna, A.; Dabbert, S. Determinants of Domestic Water Use by Rural Households Without Access to Private Improved Water Sources in Benin: A Seemingly Unrelated Tobit Approach. Water Resour. Manag. 2010, 24, 1381–1398. [Google Scholar] [CrossRef]
  49. Burt, Z.; Ercümen, A.; Billava, N.; Ray, I. From Intermittent to Continuous Service: Costs, Benefits, Equity and Sustainability of Water System Reforms in Hubli-Dharwad, India. World Dev. 2018, 109, 121–133. [Google Scholar] [CrossRef]
  50. Keshavarzi, A.R.; Sharifzadeh, M.; Kamgar Haghighi, A.A.; Amin, S.; Keshtkar, S.; Bamdad, A. Rural Domestic Water Consumption Behavior: A Case Study in Ramjerd Area, Fars Province, I.R. Iran. Water Res. 2006, 40, 1173–1178. [Google Scholar] [CrossRef] [PubMed]
  51. Koppen, B.V. Scaling Up Multiple Use Water Services: Accountability in the Water Sector; International Water Management Institute: Colombo, Sri Lanka, 2014. [Google Scholar]
  52. Jiang, S.; Liu, Y.; Wang, M.; Zhu, Y.; Cui, H.; Du, S.; Xu, C.-Y. Quantifying the Impact of Climate Change and Human Activities on the Eco-Hydrological Regimes of the Weihe River Basin, Northwest China. Hydrol. Res. 2022, 54, 49–64. [Google Scholar] [CrossRef]
  53. Oyerinde, A.O.; Jacobs, H.E. Determinants of Household Water Demand: A Cross-Sectional Study in South West Nigeria. J. Water Sanit. Hyg. Dev. 2022, 12, 200–207. [Google Scholar] [CrossRef]
  54. Bethke, G.M.; Cohen, A.R.; Stillwell, A.S. Emerging Investigator Series: Disaggregating Residential Sector High-Resolution Smart Water Meter Data into Appliance End-Uses with Unsupervised Machine Learning. Environ. Sci. Water Res. Technol. 2021, 7, 487–503. [Google Scholar] [CrossRef]
  55. Cominola, A.; Giuliani, M.; Piga, D.; Castelletti, A.; Rizzoli, A.E. Benefits and Challenges of Using Smart Meters for Advancing Residential Water Demand Modeling and Management: A Review. Environ. Model. Softw. 2015, 72, 198–214. [Google Scholar] [CrossRef]
  56. Zozmann, H.; Klassert, C.; Klauer, B.; Gawel, E. Water Procurement Time and Its Implications for Household Water Demand—Insights from a Water Diary Study in Five Informal Settlements of Pune, India. Water 2022, 14, 1009. [Google Scholar] [CrossRef]
Figure 1. Map of Lyari (inset in the top-left shows relative location of Lyari in Pakistan (in red), whereas the inset on the bottom-left shows Lyari’s location in Karachi). UC Boundary refers to demarcations of union-councils (UC).
Water 15 03400 g001
Figure 2. Proportion of total daily per capita reported water use (RWU) disaggregated to different activities in the summer and winter seasons.
Water 15 03400 g002
Figure 3. RWU disaggregated by season and sex for water use activities.
Water 15 03400 g003
Figure 4. Spatial variation in reported water use (RWU) across Lyari for the summers (left) and winters (right). RWU is categorized into equal sized quintiles.
Water 15 03400 g004
Figure 5. Probability density function (PDF) depicting monthly expenditure on procuring water for summer and winter seasons.
Water 15 03400 g005
Figure 6. Total daily reported water usage per capita (gallons) and total weekly piped water supply (min) for each household. Both axes are plotted on the log scale.
Water 15 03400 g006
Figure 7. Relationship between total weekly water supply (min) and sufficiency rating in the summer (left panel) and winter (right panel) seasons.
Water 15 03400 g007
Table 1. Summary statistics for household surveys conducted across Lyari.
SummerWinter
Number of surveys462162
Male respondents (%)37.138.9
Female respondents (%)62.961.1
Access to pipeline (%)9290
Apartment Accommodation (%)29.525.6
Average occupancy7.857.94
Disclaimer/Publisher’s Note: The statements, opinions and data contained in all publications are solely those of the individual author(s) and contributor(s) and not of MDPI and/or the editor(s). MDPI and/or the editor(s) disclaim responsibility for any injury to people or property resulting from any ideas, methods, instructions or products referred to in the content.

