1. Introduction
A dam is a water-retaining building that intercepts the upstream water body of a river to raise the water level or regulate the flow. By forming a reservoir with the help of a dam, the dam can play the roles of flood control; water supply for industry, agriculture, and living; hydroelectric power generation; and the improvement of river navigation [
1]. At present, more than 800,000 dams have been built in the world [
2], which has made a significant contribution to ensuring safety in flood control and water supply and increasing the proportion of non-fossil energy. In order to achieve the goal of intercepting water flow, dams are generally constructed in places with undulating terrain [
3]. In these areas, the probability of geological hazards occurring along the reservoir shores is higher, and the resulting consequences are also more severe. For example, landslides within reservoirs can generate massive surges, which may potentially damage hydraulic structures such as dams, posing a threat to downstream population centers [
4,
5,
6]. Meanwhile, the rapid rise or fall in the water level of the reservoir can easily cause rather large deformation of the dam body. For example, in 1963, a mountainside landslide occurred at the Vajont Reservoir in Italy, resulting in a shockwave that devastated the downstream city of Longarone, causing the deaths of 2000 people [
7]. In 1975, the effects of heavy rains caused the Banqiao Reservoir and Zhugou Reservoir Dams in Zhumadian, China, to collapse, affecting more than 10 million people [
8]. In 1959, the Malpasset arch dam in France burst due to the instability of the dam shoulder, causing a huge loss of life and property [
9]. Since a strong dam can reduce the downstream impact of landslides and rapid changes in water levels, it can be said that dam safety is related to the safety of downstream people’s lives and production [
10]. As an important indicator for evaluating dam safety, it is necessary to carry out the comprehensive and regular deformation monitoring of dams.
At present, the main means of dam deformation monitoring are leveling measurements, GNSS (Global Navigation Satellite System) measurements, etc. [
11]. These means require the selection of monitoring points at the local positions of dams and then using total station and GNSS equipment to monitor the deformation of these points. The stability of dams is analyzed by considering all the points together [
12]. These methods have been widely used in some key dams, such as China’s Three Gorges Dam equipped with a static level meter, Beidou and other monitoring means [
13], and GNSS measurements and terrestrial measurements based on optical/electronic total station instruments used to monitor the deformation of the Ataturk Dam in the northwest of Şanlıurfa, Turkey [
14]. These methods have the advantages of high monitoring accuracy and automation, but they are relatively expensive and may miss some major deformation hidden dangers due to discrete point monitoring. Obtaining deformation monitoring data on the dam can assist dam management personnel in promptly understanding the dam’s deformation trends, rates, and magnitudes [
15]. When phenomena such as an accelerated deformation rate or increased deformation magnitude are detected, it can guide dam management authorities to take immediate action, including lowering reservoir water levels and conducting dam maintenance and reinforcement, to prevent the occurrence of disasters.
In recent years, satellite remote sensing technology has developed rapidly, especially satellite-borne synthetic aperture radar differential interferometry technology (InSAR), which provides a new means for surface deformation monitoring [
16,
17]. The launch of multi-band and high-resolution radar satellites has laid a solid foundation for the application of InSAR technology. As one of the satellite remote sensing technologies, InSAR technology has the advantage of large-scale monitoring with radar remote sensing satellites. It also has the unique advantages of all-weather and all-time monitoring [
18]. At present, some scholars have taken the lead in using InSAR technology to monitor reservoir dam deformation [
3,
19,
20,
21,
22,
23]. For example, Antonio M.Ruiz-Armenteros used MT-InSAR technology based on ERS-1/2, Envisat, and Sentinel-1 data to monitor the deformation of La Viñuela (Málaga, southern Spain) dam facilities. The results show that the La Viñuela dam has been deforming continuously since its completion, and the maximum deformation occurred in the early stages after construction [
24]. Teng Wang et al. used the time series InSAR method to monitor the deformation of China’s Three Gorges Dam for the first time. The results show that dam deformation is greatly affected by Yangtze River water level changes, and high water levels are accompanied by more remarkable deformation [
13]. Using ALOS PALSAR images, Wei Zhou applied SBAS-InSAR technology to extract the deformation information of China’s Shuibuya Dam and compared it with ground-measured data. The correlation coefficient was up to 0.99, indicating reliability. The results show that InSAR technology can be used as a supplement to the traditional ground monitoring methods for dams [
25]. Zixin He et al. used SBAS-InSAR technology to monitor the deformation of the Xiaolangdi dam for July 2017–June 2020 based on Sentinel-1 images. Compared with leveling, the linear goodness of fit of the two results was 0.86. However, there is little water level data in the same time period, and the analysis of the relationship between deformation and water level change is insufficient in the paper [
26]. Mehdi Darvishi et al. used Sentinel-1 images and applied a variety of InSAR analysis methods to extract the deformation results of Hoover Dam. The results of SABS-InSAR and PS-InSAR were similar, and the results had a significant negative correlation with the water level changes [
27].
It is evident that InSAR technology has found some application cases in monitoring the deformation of reservoir dams. However, there are relatively few cases that involve comparing the deformation monitoring results with the water levels in the reservoir on the same day as satellite image acquisition. Moreover, the Xiaolangdi Reservoir is located in a key position for water and sediment control in the lower reaches of the Yellow River, which has an important strategic position. Satellite remote sensing technology can understand the deformation distribution of the dam more comprehensively and has more prominent significance for Xiaolangdi’s safe operation. Therefore, this paper collected and organized the water level information of Xiaolangdi Reservoir on the date of Sentinel-1 image acquisition. It uses PS-InSAR technology to obtain the deformation distribution information of the Xiaolangdi Dam from 2020 to 2022, analyzes the dam deformation characteristics, and conducts a joint analysis with the reservoir water level in detail. On one hand, it offers a valuable opportunity to further validate the applicability of InSAR technology in monitoring dam deformations. On the other hand, it holds crucial significance in assessing the current safety conditions of the Xiaolangdi Dam.
2. Materials and Methods
2.1. Overview of the Study Area
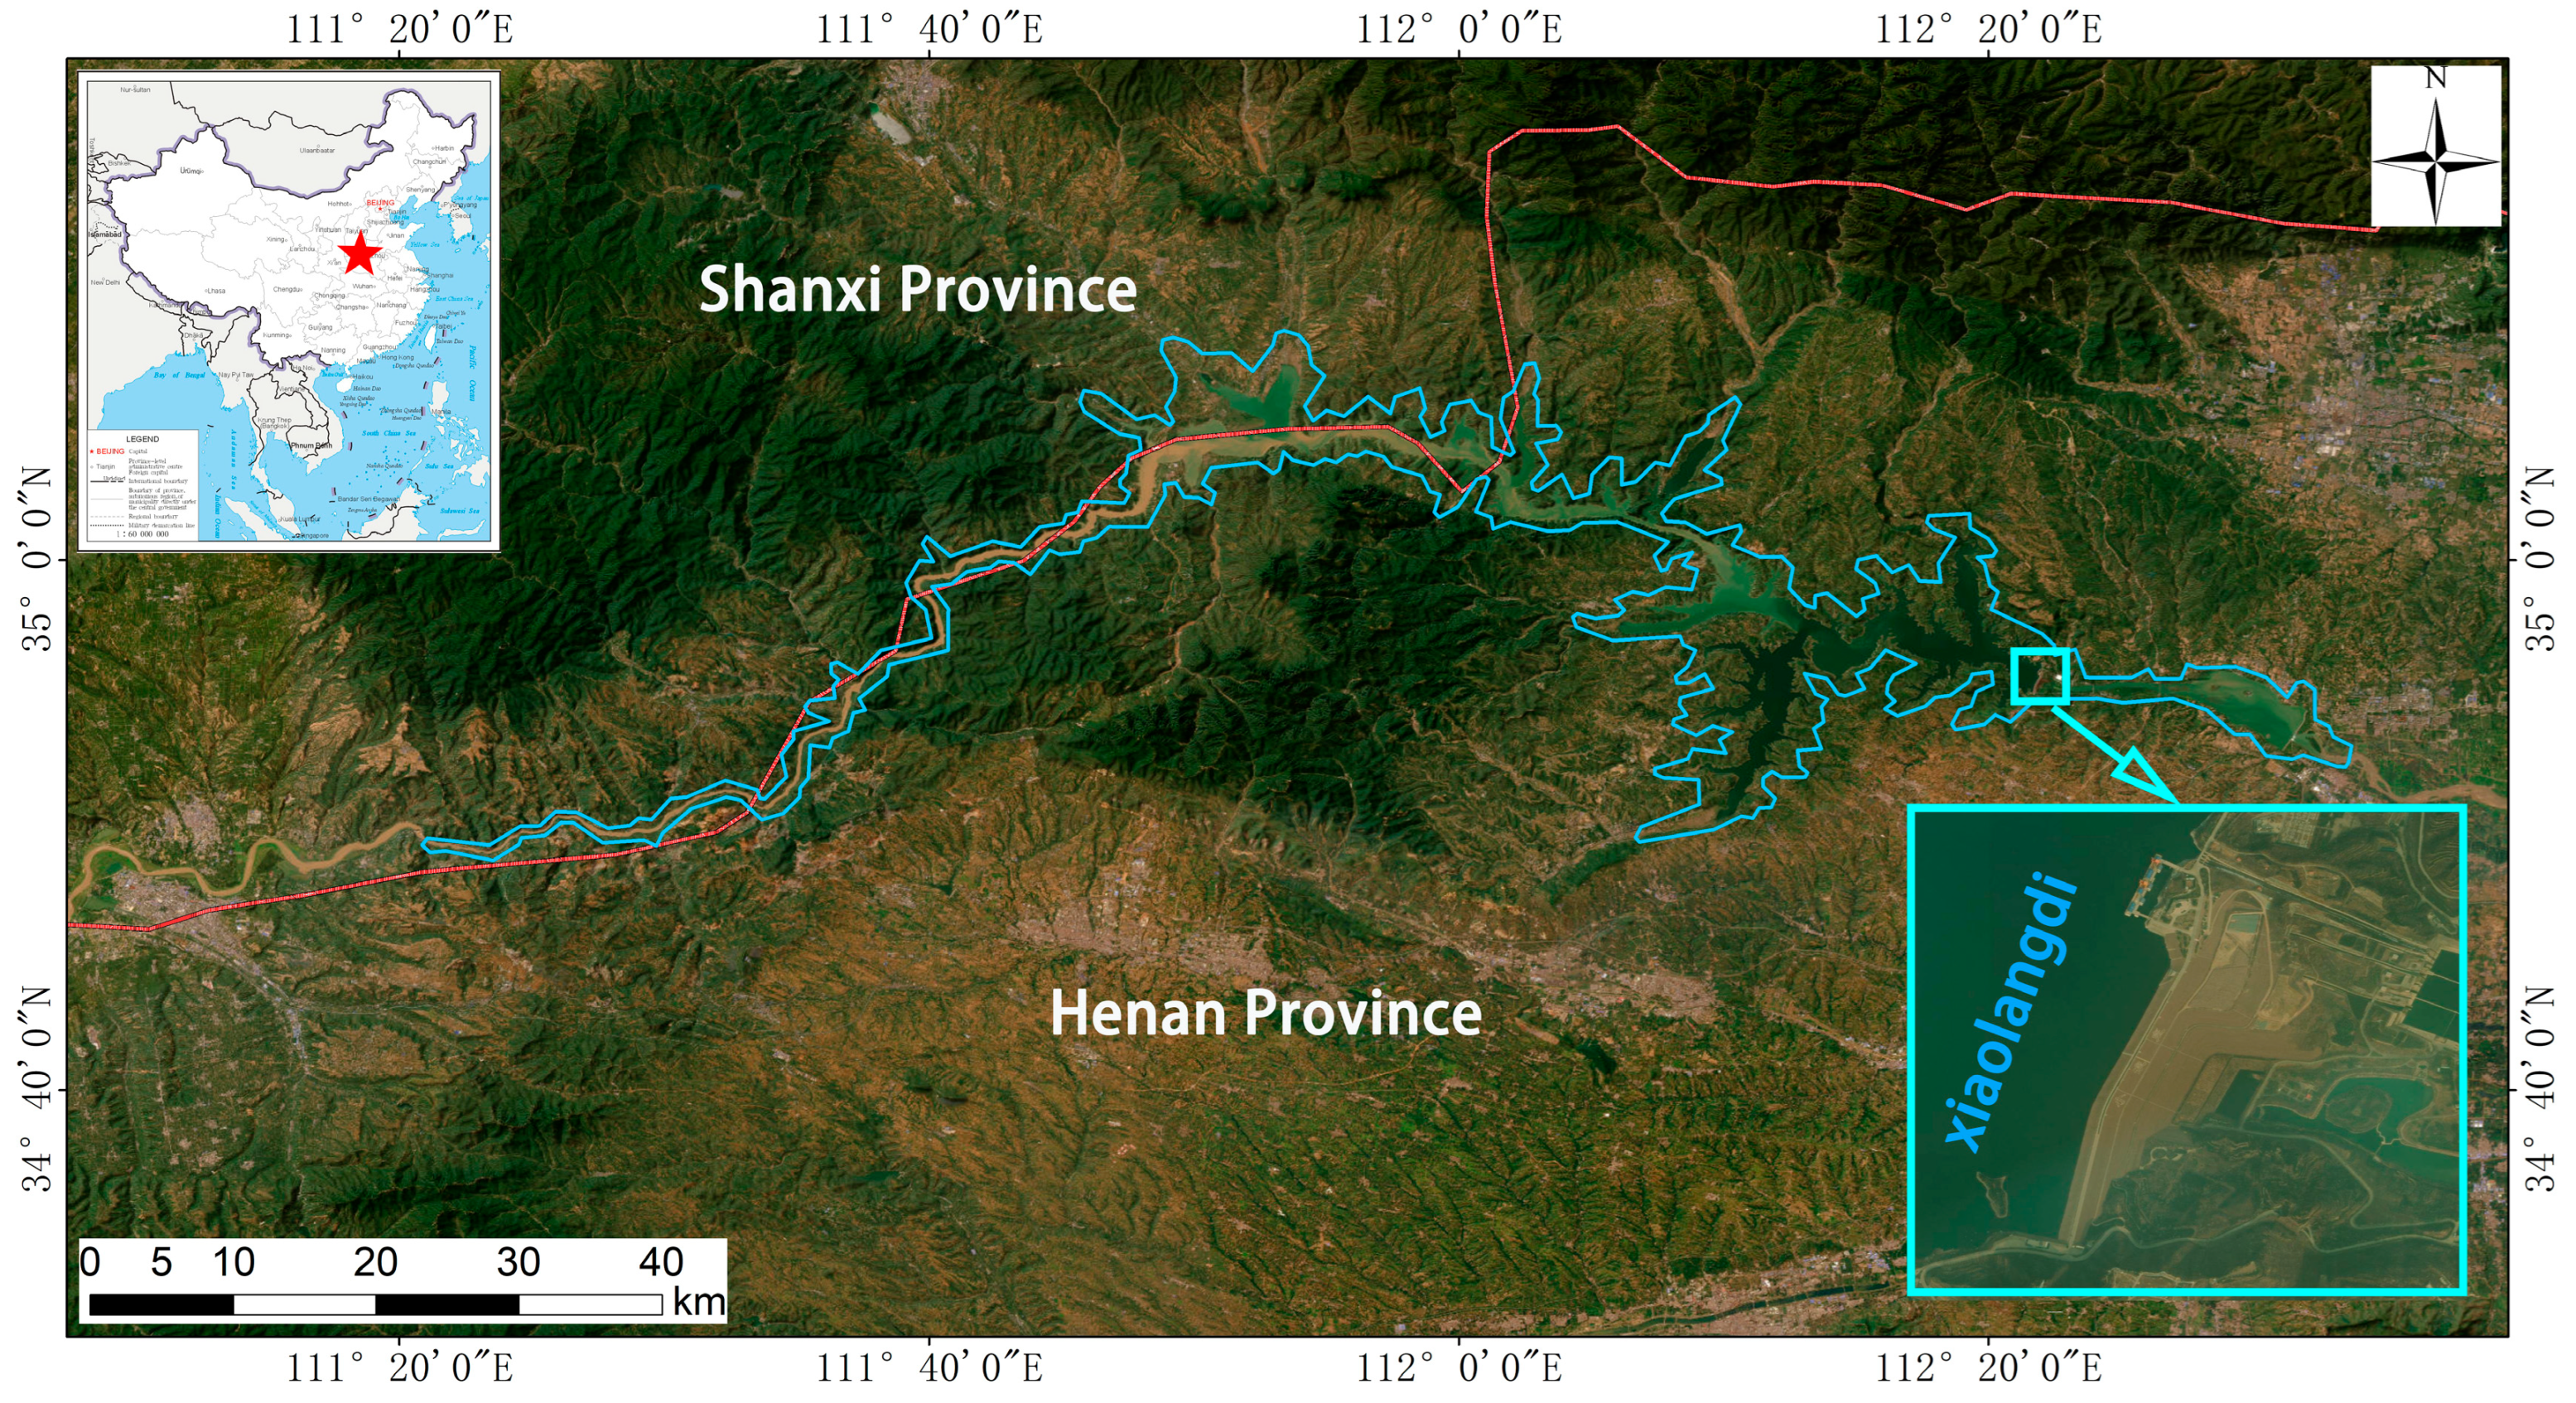
The Xiaolangdi Water Control Project is located on the main stream of the Yellow River between Xiaolangdi Village, Mengjin County, Luoyang City, Henan Province and Liwu Village, Jiyuan City in China [
28]. It is 130 km downstream from the Sanmenxia Water Control Project and 40 km north of Luoyang City. It is at the exit position of the last section canyon of the middle reaches of the Yellow River. It controls a basin area of 694,000 km
2, which takes up 92.3% of the Yellow River basin area. The primary tasks of the Xiaolangdi Reservoir include sand control, flood prevention, water supply for industrial and agricultural purposes, power generation, etc. It is a significant water conservancy project for managing the Yellow River. Xiaolangdi started the preliminary preparation project construction on 12 September 1991. The main project started construction officially on 1 September 1994. It cut off the river course on 28 October 1997. The first set generator was put into production for power generation at the beginning of the year 2000. The main project was completed at the end of the year 2001. The Xiaolangdi main dam is a high-inclined core wall rockfill dam. The dam crest elevation is 281.00 m. The reservoir’s normal storage level and check flood level are both 275.00 m. The normal dead water level is 230.00 m. The reservoir’s total capacity is 12,650 hm
3. Among them, the sand retention capacity is 7550 hm
3, the flood control capacity is 4050 hm
3, and the water regulation sand regulation capacity is 1050 hm
3. It is a large (1)-type comprehensive utilization water conservancy hub.
The Xiaolangdi Project is the only control project below Sanmenxia that has a large reservoir capacity. It is located at the key position of controlling water and sediment in the lower reaches of the Yellow River. It is also the only comprehensive water conservancy hub that can bear flood control, ice prevention, industrial and agricultural water supply, and power generation in the lower reaches. It has superior natural conditions and an important strategic position (see
Figure 1). Therefore, monitoring the deformation of the Xiaolangdi Dam has important research significance.
2.2. Data Introduction
The Sentinel-1 radar satellite is the successor of the ERS-1/2 (Launched on 17 July 1991 and 21 April 1995) and ENVISAT (Launched on 1 March 2002) satellite series and also the first satellite of the Copernicus program. Sentinel-1 consists of two C-band SAR satellites, Sentinel-1A and Sentinel-1B, which were successfully launched on 3 April 2014 and 25 April 2016 at Guiana Space Center, respectively. Sentinel-1A and Sentinel-1B are 180° apart in the same orbital plane. The revisit period of a Sentinel-1 single satellite is 12 days, which can be shortened to 6 days after networking [
29]. However, on 23 December 2021, Sentinel-1B malfunctioned and failed to transmit radar data, resulting in the early termination of its mission. As the only radar constellation in the Copernicus program, the Sentinel-1 satellite can image continuously all day long and in all weather conditions. It can be widely used in fields such as surface deformation monitoring, flood coverage inversion, crop growth monitoring, and polar environment monitoring.
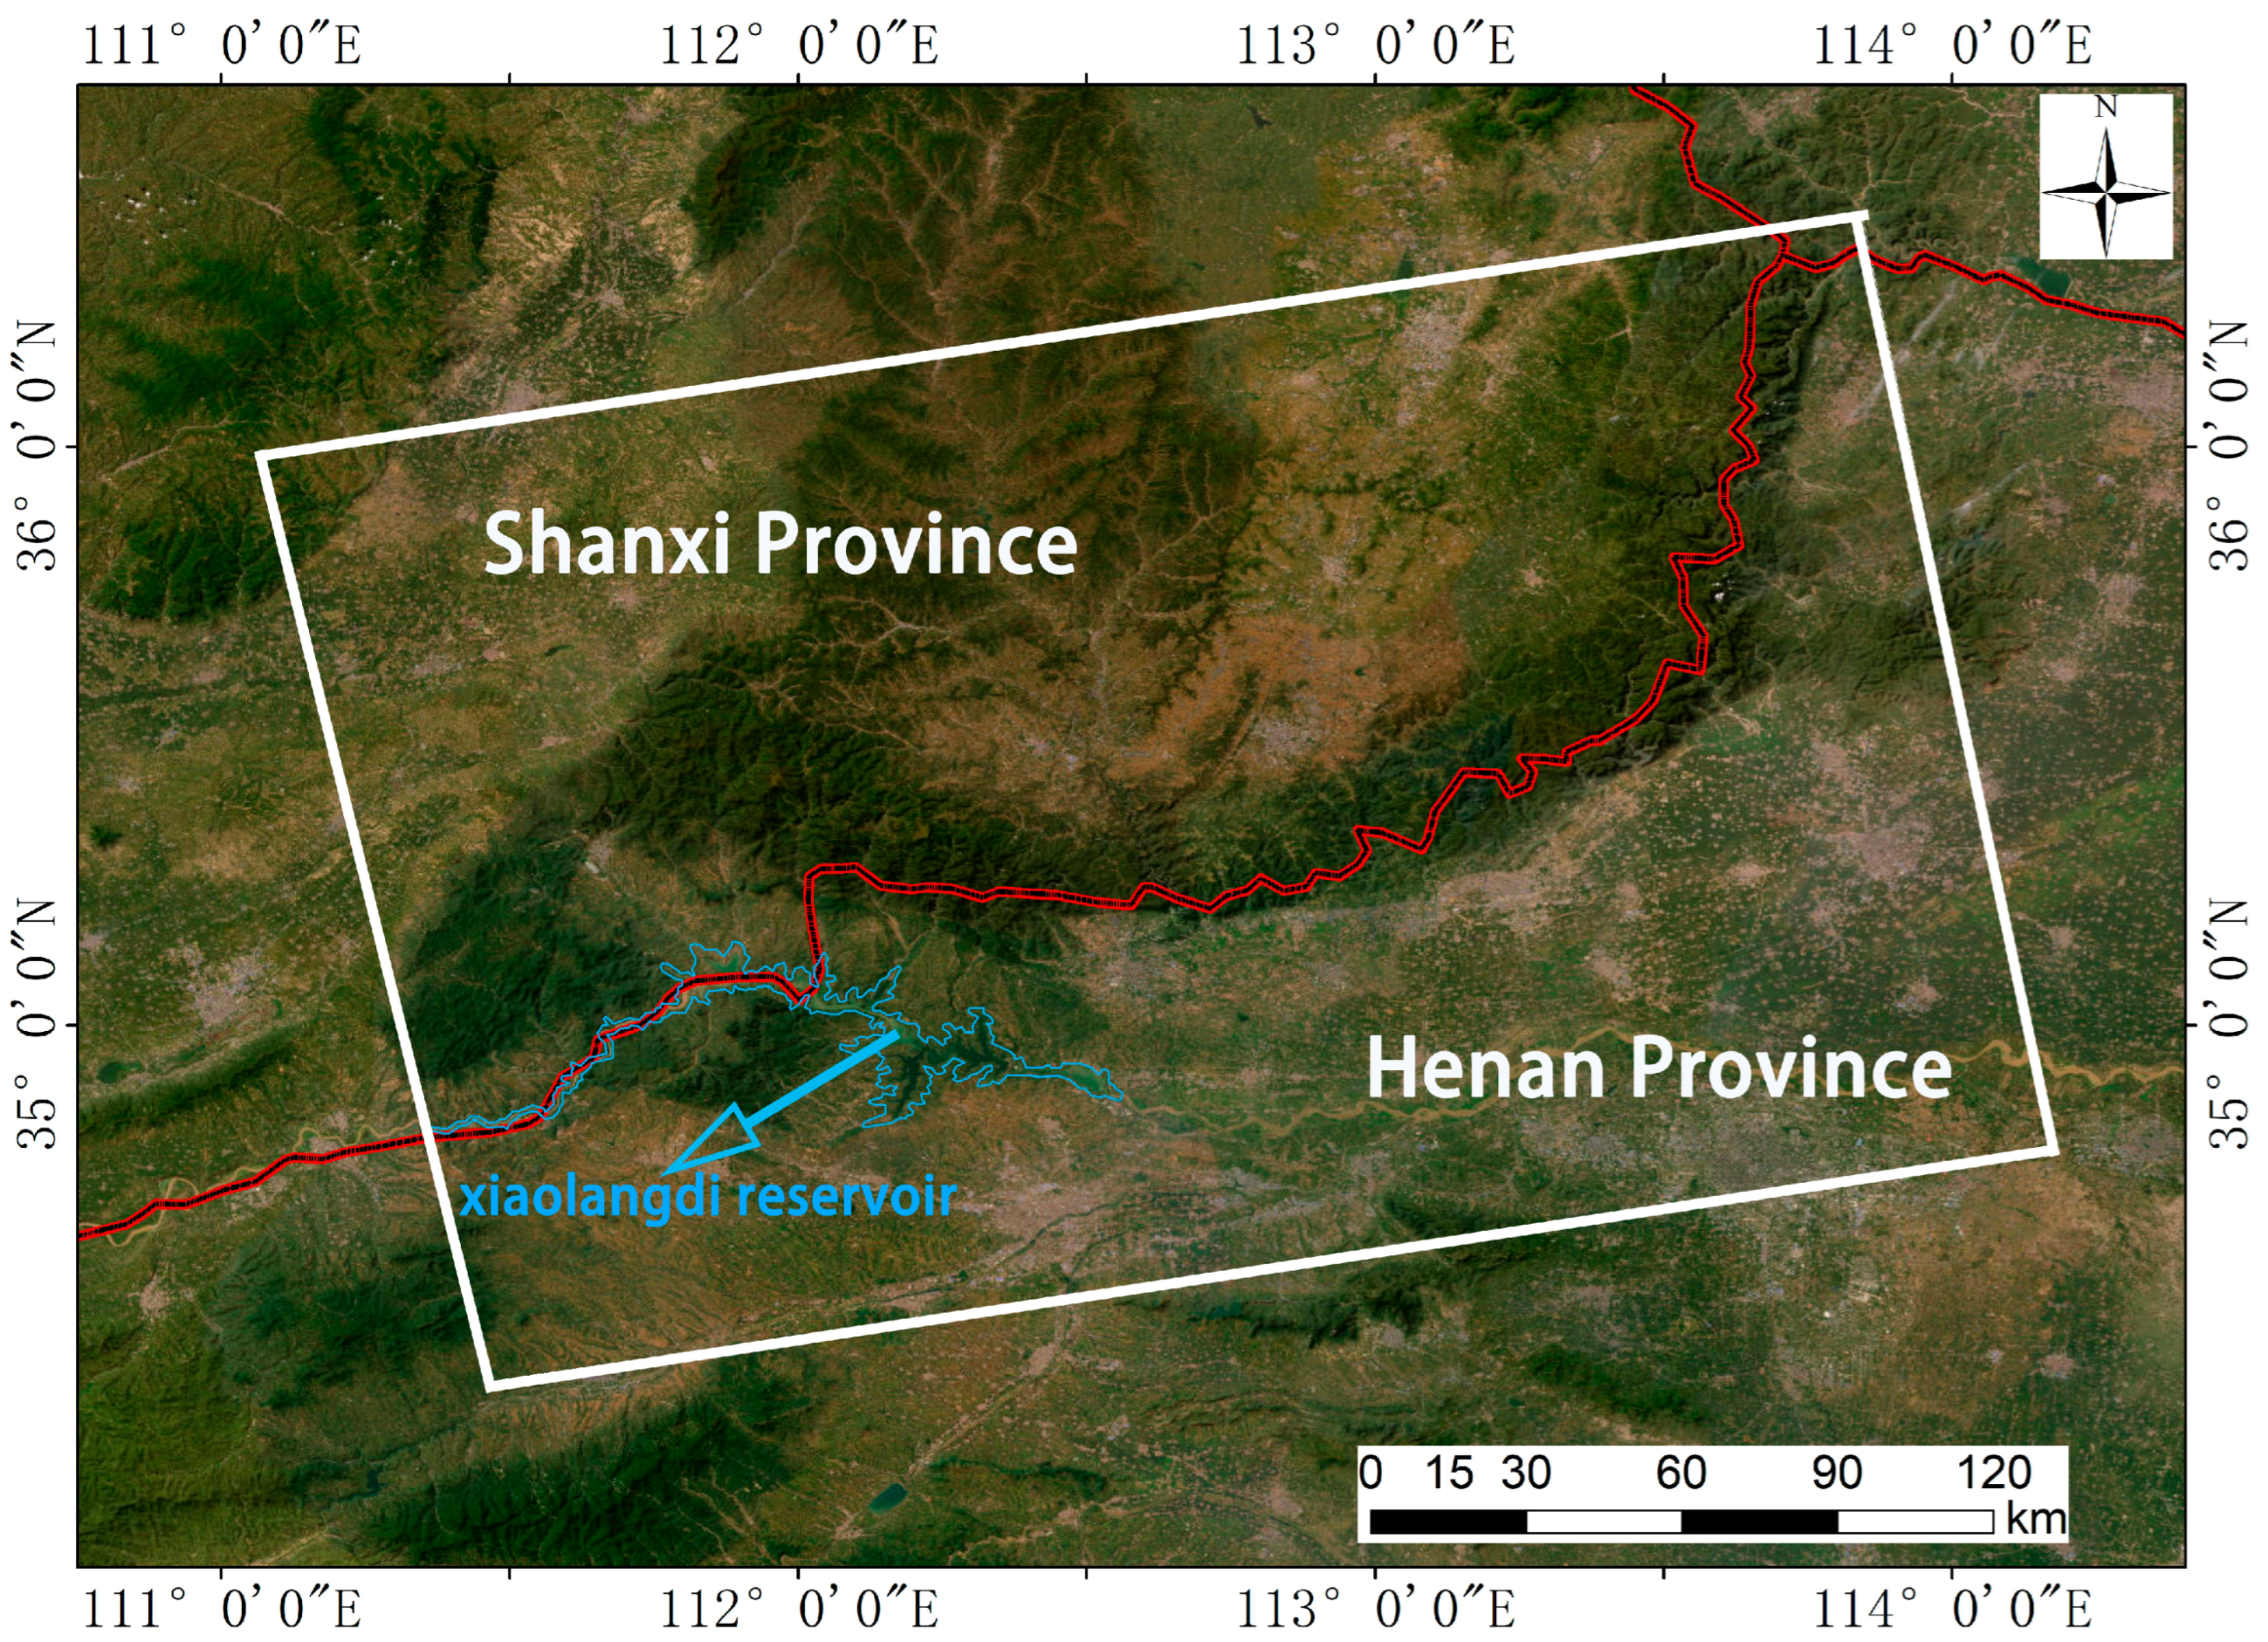
In this paper, 62 periods of Sentinel-1 ascending-orbit SAR images covering the Xiaolangdi Dam from 11 September 2020 to 24 November 2022 are used (unfortunately, there are no descending-orbit Sentinel-1 data for this region). The dates of Sentinel-1 images used are shown in the
Table 1 below, along with the coverage area, as illustrated in
Figure 2.
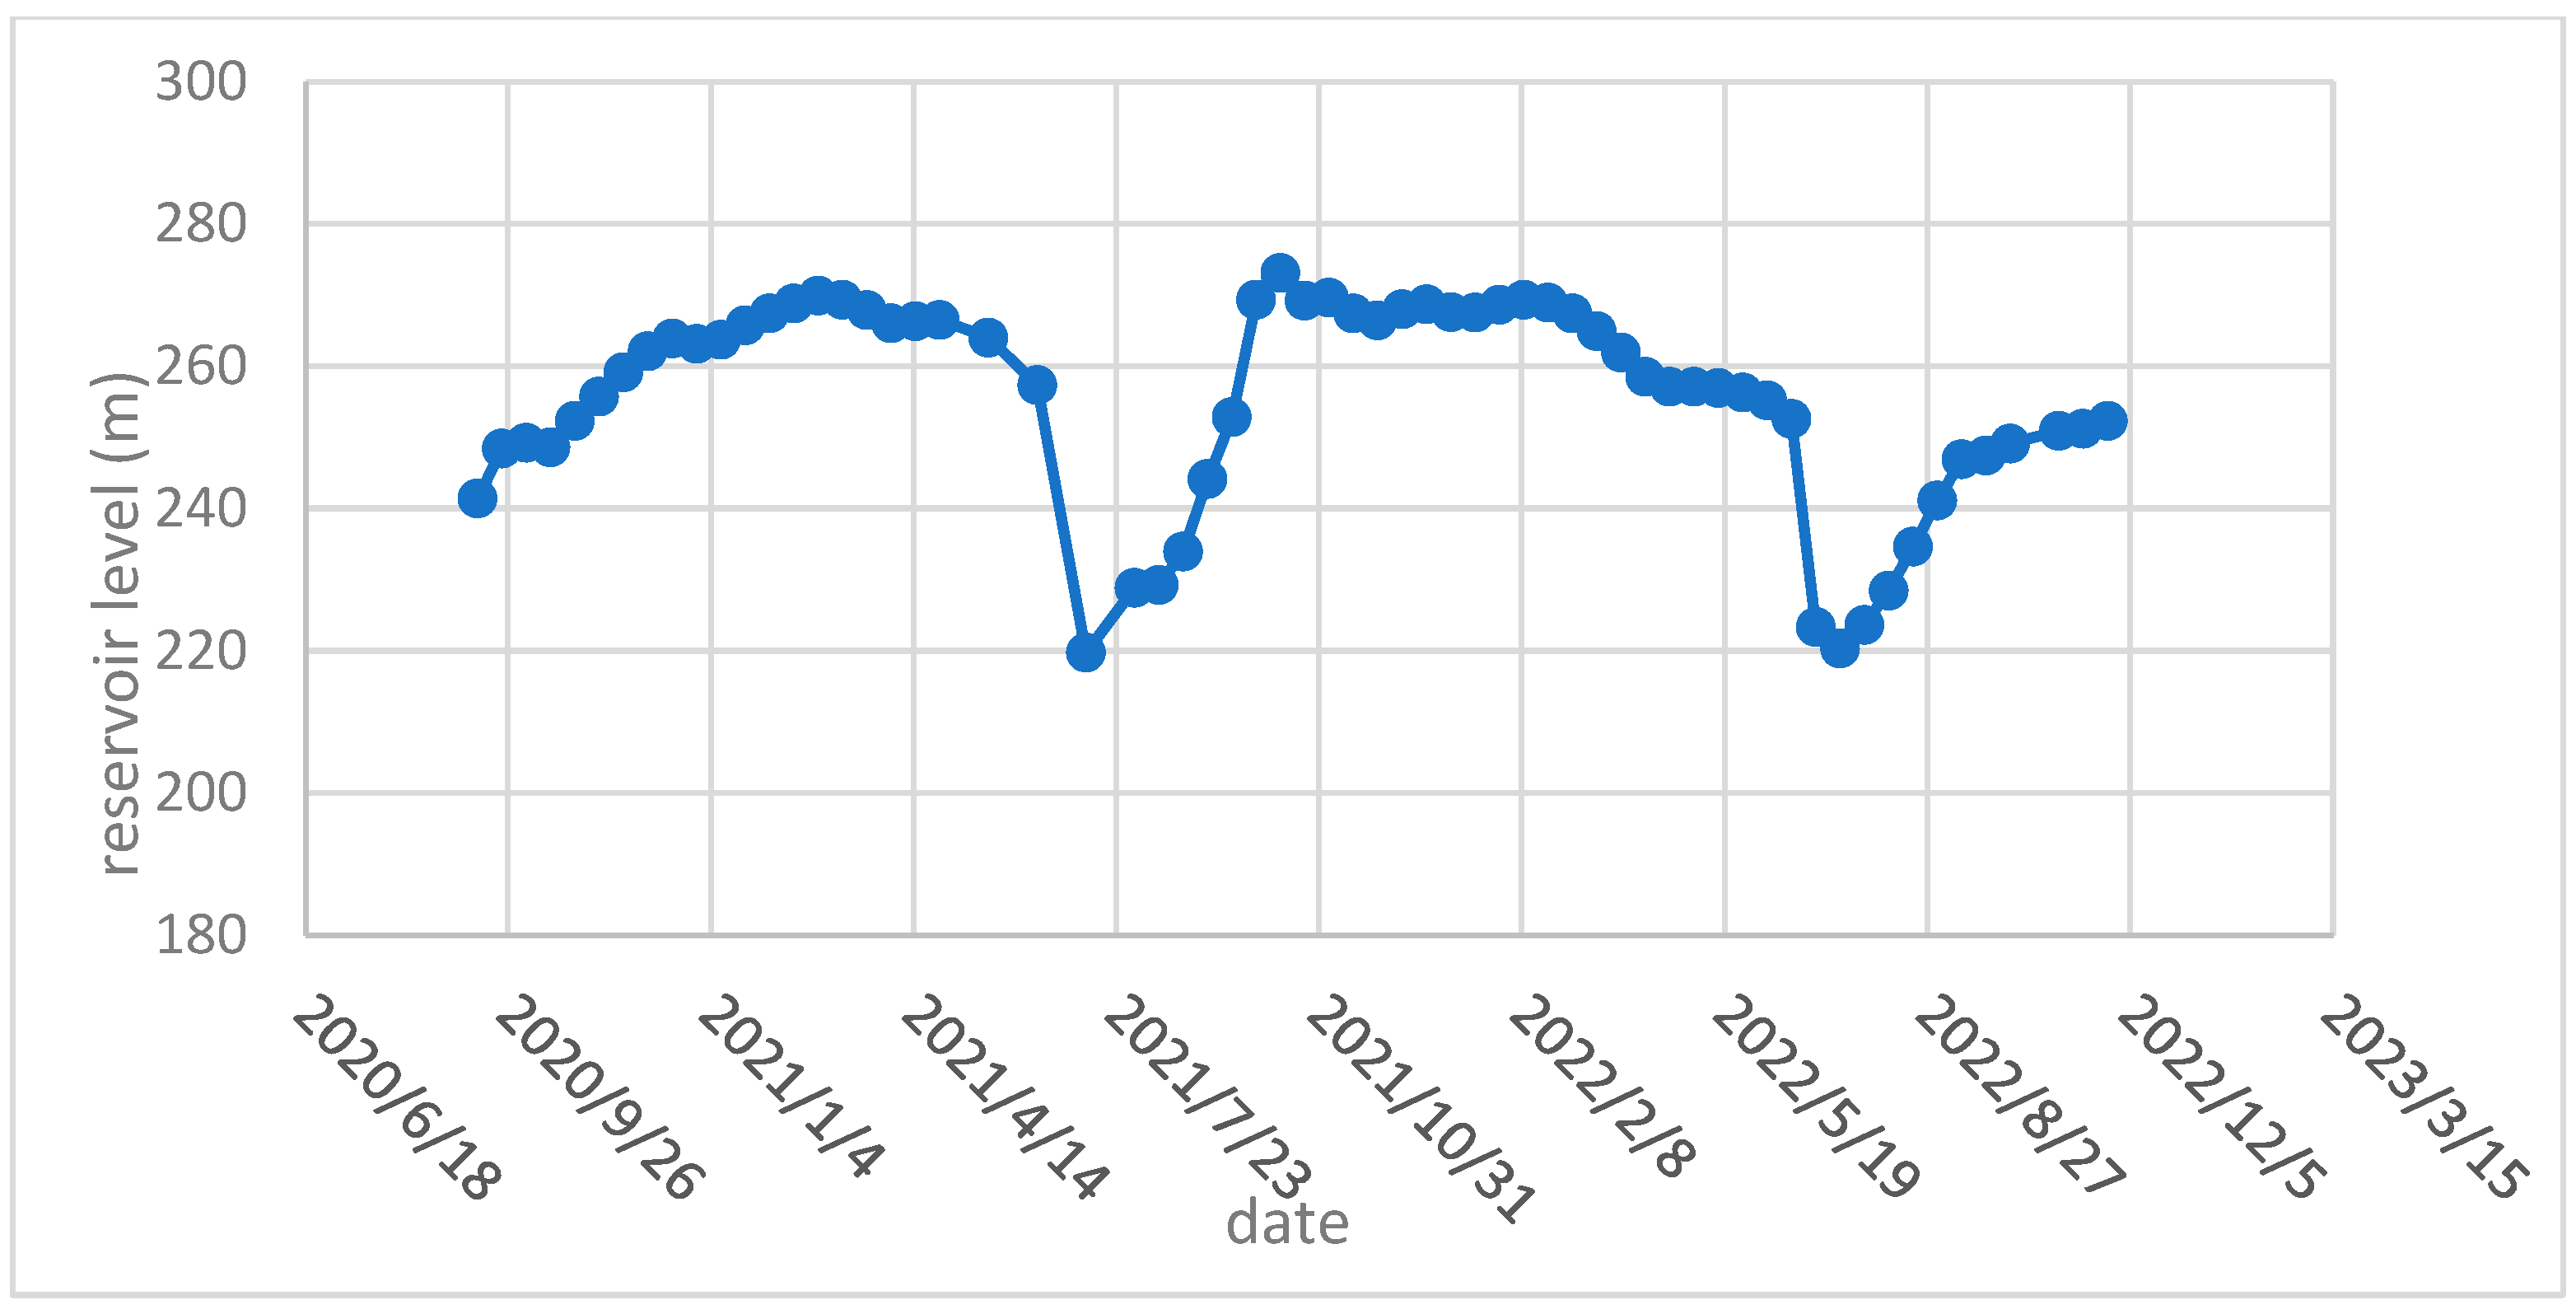
This paper selects ALOS World 3D 30 m elevation data with a high resolution as the terrain data for removing the terrain phase from the interferometric phase. We collected the historical water level data of the Xiaolangdi Reservoir from the years 2020 to 2022 on the same days as the acquisition of Sentinel-1 images. As shown below in
Figure 3, it can be seen that in the Xiaolangdi Reservoir every year from March to June, the reservoir water level gradually drops. Every year from mid to June to early July, the water level drops rapidly. Every year from July to October, the reservoir water level rises. Every year from November to the next year’s February, the reservoir level changes slowly.
The reason for this is that for the Xiaolangdi Reservoir, every year from March to June is the water supply operation period, so according to the controlled discharge operation to meet the downstream water demand, the reservoir water level gradually drops. During this period, generally, there is a peach blossom flood in March, which is mainly caused by the upstream ice flood ending, the stable opening of the river, and the river channel water flowing downstream, resulting in a short-term reservoir water level decrease, slow-down, or slight increase. Every year from mid-June to early July, the opportunity to implement water adjustment and sediment regulation operations is taken, as at this time the water level drops rapidly. Every year from July to October is the flood season. Under normal inflow situations, due to inflow and outflow balance operations, the reservoir does not exceed the flood limit water level, and the water level rises. Every year from November to the next year’s February is the ice-flood period. To ensure downstream ice prevention and safe flow demand control operation, during this period, the reservoir water level gradually rises.
In summary, the reservoir water level gradually drops in the first half of each year and gradually rises in the second half of each year, with a water level change range of up to 32.57–58.55 m. Among them, during the water transfer sediment regulation operation period from mid-June to early July each year, the water level of the reservoir decreases the most. During the flood season, the reservoir water level rises quickly when defending against floods.
2.3. InSAR Methods
InSAR technology involves the interferometric processing of two SAR images of the same area, allowing for the precise generation of a ground surface elevation model. DInSAR technology, derived from InSAR, further eliminates terrain phase components. It computes the differential interferometric phase between two radar satellite observations, mitigates atmospheric noise and other phase components, and retains phase components related to ground surface deformation as much as possible. This enables the quantitative inversion of subtle ground surface deformations. The theoretical inversion accuracy of ground surface deformation using DInSAR technology has currently reached millimeter-level precision. DInSAR technology has been widely applied in various scenarios including measuring post-earthquake co-seismic deformations, identifying potential landslide hazards, and determining glacier flow speeds.
Due to the difficulty of obtaining high-precision terrain data, the difficulty of removing atmospheric phase components, and the influence of surface decorrelation factors, the application scenarios of DInSAR technology are limited, and the promotion and application of DInSAR technology are restricted. PS-InSAR technology aims to solve the problems existing in the application process of DInSAR technology [
30]. It takes PS points with stable scattering characteristics and strong echo signals in time series SAR image sets as monitoring objects, performs phase modeling and deformation solution analysis, separates the atmospheric delay phase and the elevation residual phase, retains the linear deformation phase and the nonlinear deformation phase of PS, and realizes the high-precision monitoring of surface deformation [
31]. There are already many scholars who have carried out reliability assessments for InSAR monitoring achievements. Time-series InSAR technology’s accuracy can reach the millimeter level [
12,
32,
33,
34].
The technical principle of PS-InSAR is as follows:
The phase composition of PS in the time series differential interferogram can be represented as:
where
represents the differential interferometric phase of the
jth PS in the ith interferometric pair.
corresponds to the residual part after removing the terrain phase.
encompasses the phase associated with deformation monitoring, including both linear and nonlinear deformation phases.
signifies the atmospheric phase difference between SAR images that form differential interferograms.
accounts for random noise.
And:
where
represents the spatial vertical baseline of interference image pairs,
is the time difference between two images,
denotes the wavelength of the radar wave,
indicates the distance from the radar satellite to the PS,
is the incidence angle of the radar wave,
accounts for the DEM residual phase caused by inaccurate elevation data,
represents the linear deformation rate in the radar satellite line-of-sight direction, and
encompasses the residual phase, which includes atmospheric delay phases at the two moments of SAR image acquisition, nonlinear deformation phases, and random noise components.
To establish the differential phase of the neighborhood between the
jth and
hth PS:
where
represents the average value of the spatial vertical baseline for permanent scatterers,
is the average sensor distance between the two PSs,
is the average radar satellite incidence angle with respect to the PSs,
signifies the incremental DEM error for the PSs,
denotes the increment in the linear deformation rate for the PSs, and
represents the residual phase difference between the two permanent scatterers.
Due to the surface deformation and high spatial autocorrelation characteristics of the atmosphere, adjacent permanent scatterers can be considered as small values of atmospheric delay phases and nonlinear deformation-related phases. Permanent scatterers are almost unaffected by noise. Therefore, || ≤ π. At this time, the equation becomes a problem for solving the maximum value function. Then, obtain the and optimal solution based on the constructed irregular triangular network using the least squares adjustment method to estimate the permanent scatterer average deformation rate and DEM error.
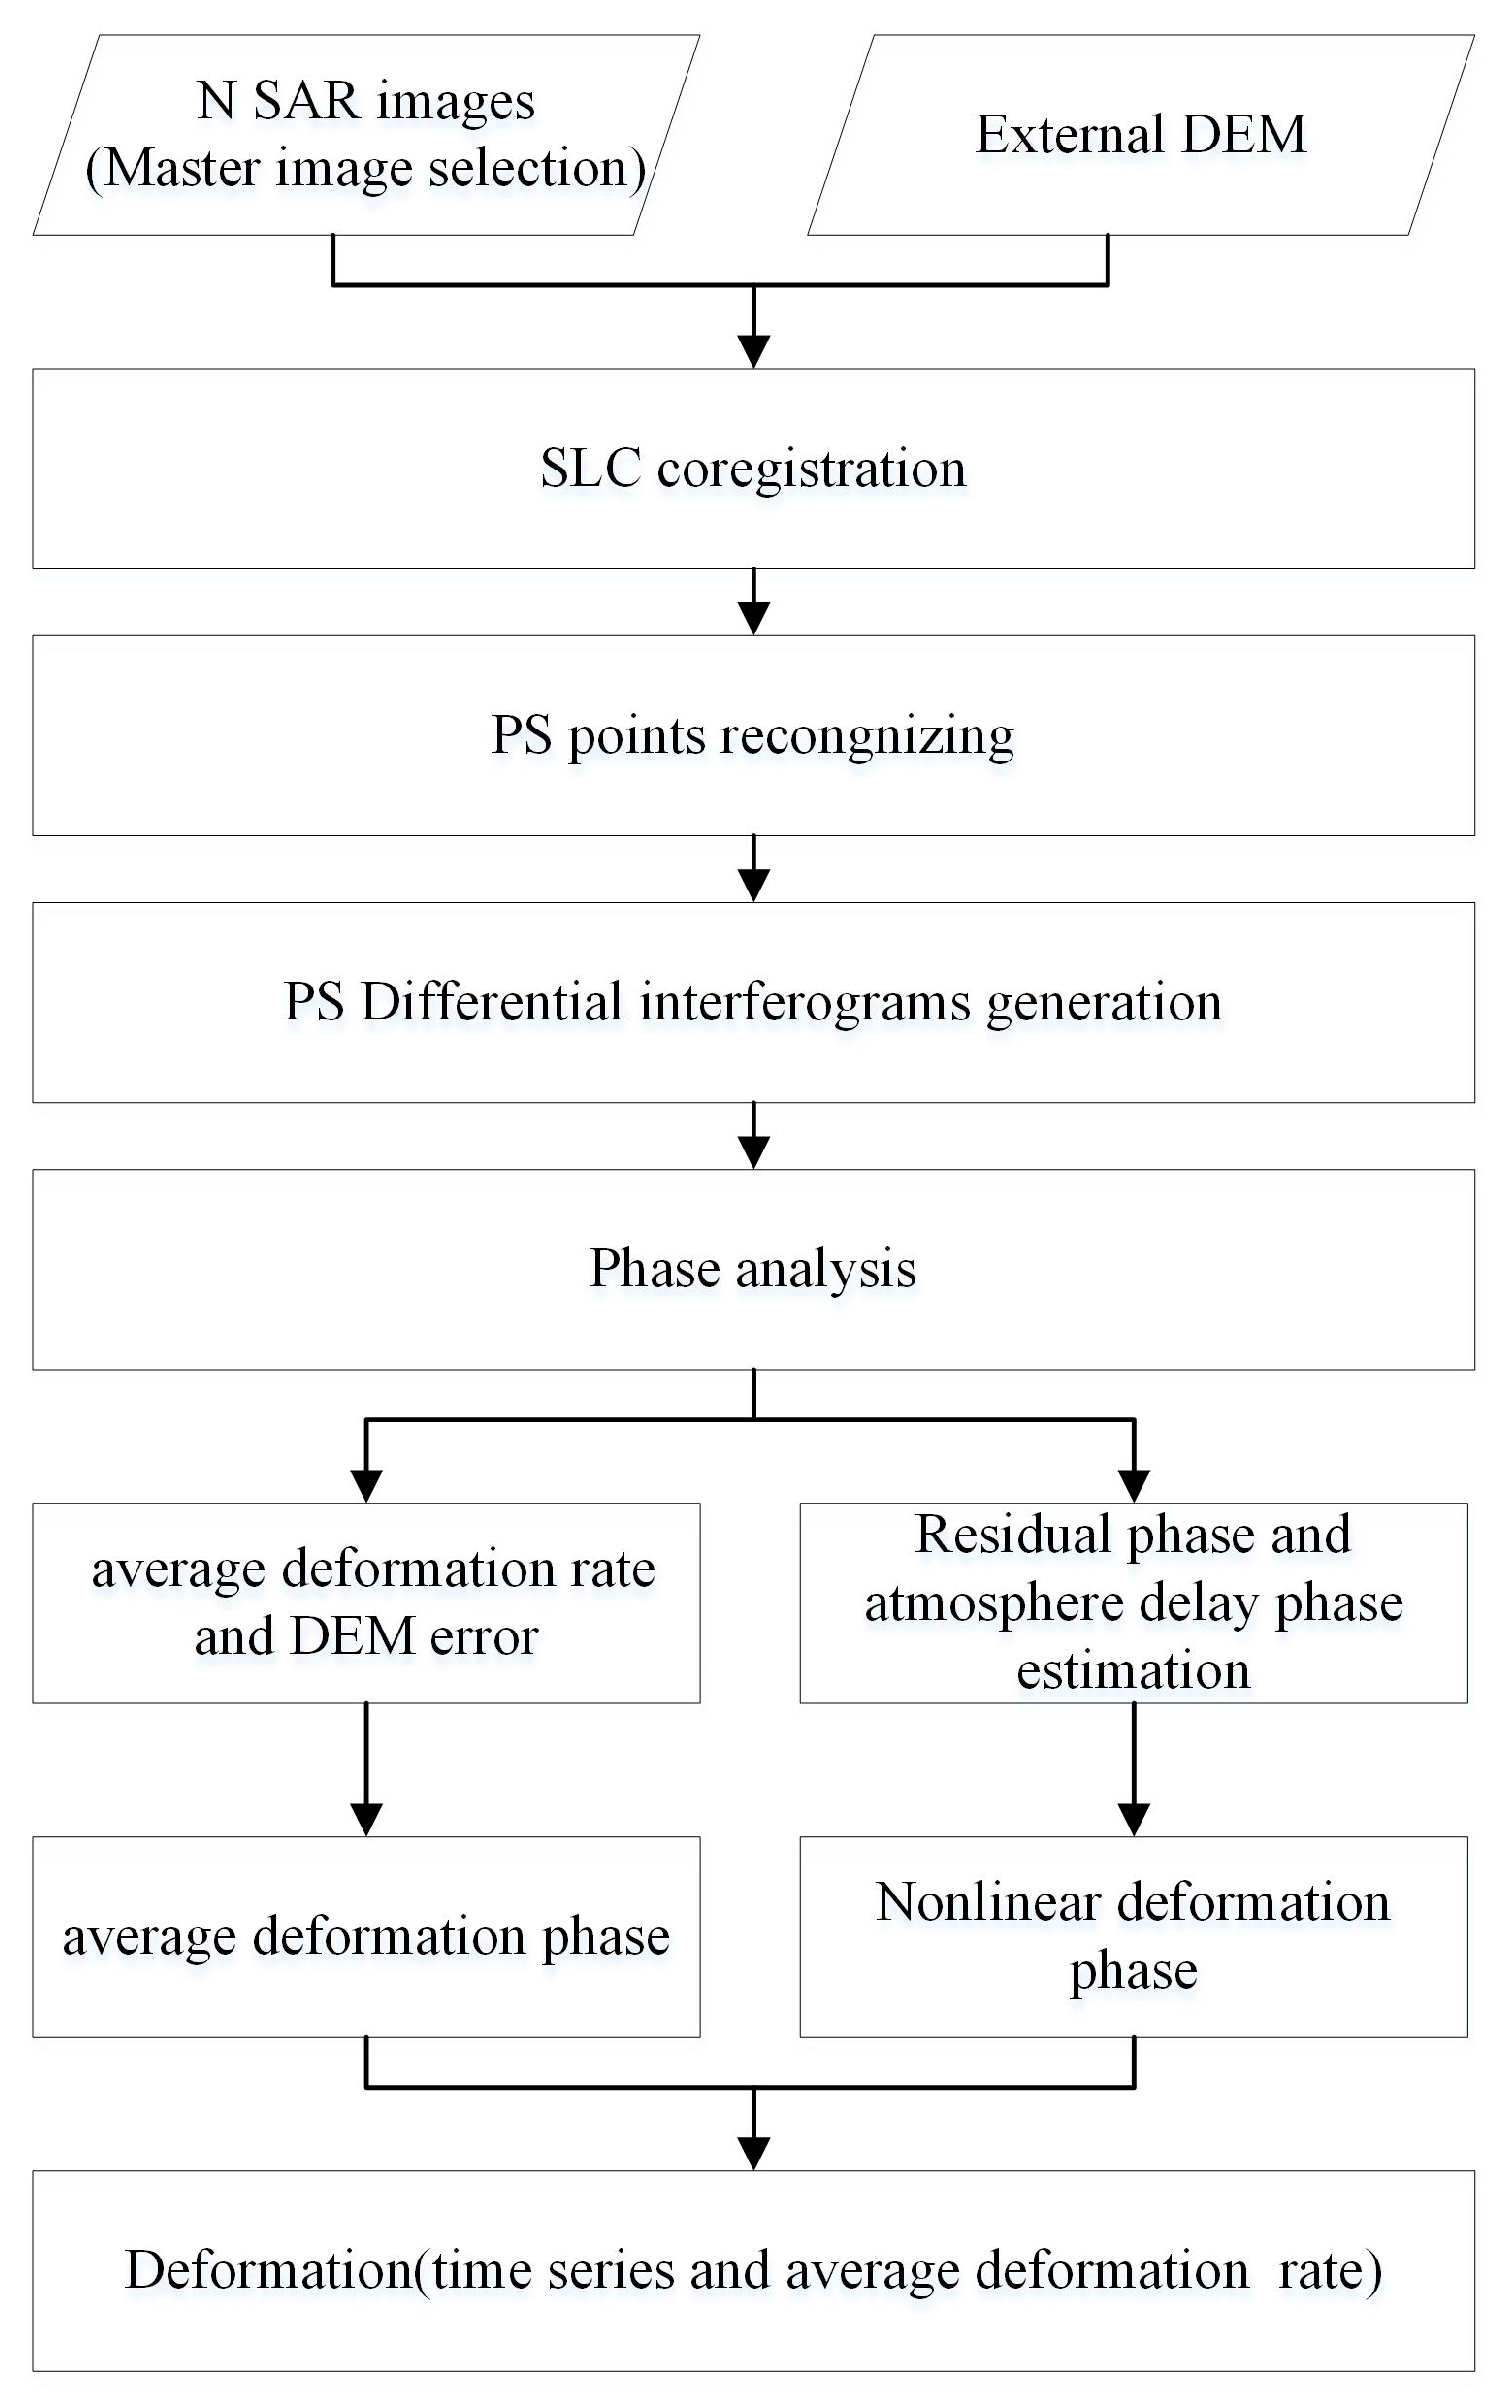
Then, according to the characteristics that the atmospheric delay phase component is high-frequency in the time domain and low-frequency in the space domain, while the nonlinear deformation phase is low-frequency in the time and space domains, the spatiotemporal filtering method is used to separate the atmospheric delay phase and the nonlinear deformation phase. The nonlinear deformation phase and the average deformation phase are superimposed, and the deformation history of PS in the time series can be obtained. The flowchart of PS-InSAR technology is shown in
Figure 4, below.
3. Results and Analysis
Based on 62 scenes of Sentinel-1 data covering the Xiaolangdi Dam and its corresponding precise orbit data as well as AW3D DEM data, the PS-InSAR technical analysis of the Xiaolangdi Dam was carried out. Based on the distribution of the temporal baseline and spatial baseline of the SAR dataset, the Sentinel-1 image taken on 14 February 2021 was selected as the master image. Subsequently, the slave images were registered to the master image, and SAR images exceeding the study area’s boundaries were cropped. PS candidate points within the study area were identified using both the coherence coefficient threshold method and the amplitude deviation method. Phase values of these PS candidate points in the time-series differential interferograms were extracted.
A network of PS points was established and solved linearly, yielding linear deformation rates, elevation correction values, and residual phases for each PS point. Nonlinear deformation and atmospheric phases were separated through temporal and spatial domain filtering. The linear deformation phases and nonlinear deformation phases were accumulated, ultimately providing linear deformation rates and time-series deformation parameters for each PS point. Finally, the linear deformation rate and time-series deformation characteristics at PS points were obtained, and the average deformation rate map of the Xiaolangdi Dam is shown in
Figure 5 below.
The monitoring results in this paper lack verification by ground monitoring data for the same period. However, comparing the Xiaolangdi Dam’s deformation monitoring results for September 2020–November 2022 with those obtained by SBAS-InSAR in the literature [
26] for July 2017–June 2020, satellite line-of-sight direction results show that they have similar deformation distribution characteristics, i.e., maximum deformation at the center of the dam crest; a decreasing rate of change towards both sides’ slopes and downstream slope/footing area; reference [
26]’s rate-of-change measurement results are consistent with the leveling measurement results; the annual average rate of change at the center of the crest is −20 mm/year~−25 mm/year; both sides’ slope areas are relatively stable with a rate of change of around 0 mm/year; the center of the crest in this paper is −18 mm/year~−36 mm/year; most points’ rates of change are concentrated at −19 mm/year~24 mm/year; and the near-dam slope’s annual rate of change is less than 3 mm/year, which is similar to reference [
26]’s rate-of-change measurement results. The above comparison also shows the reliability of this paper’s monitoring results.
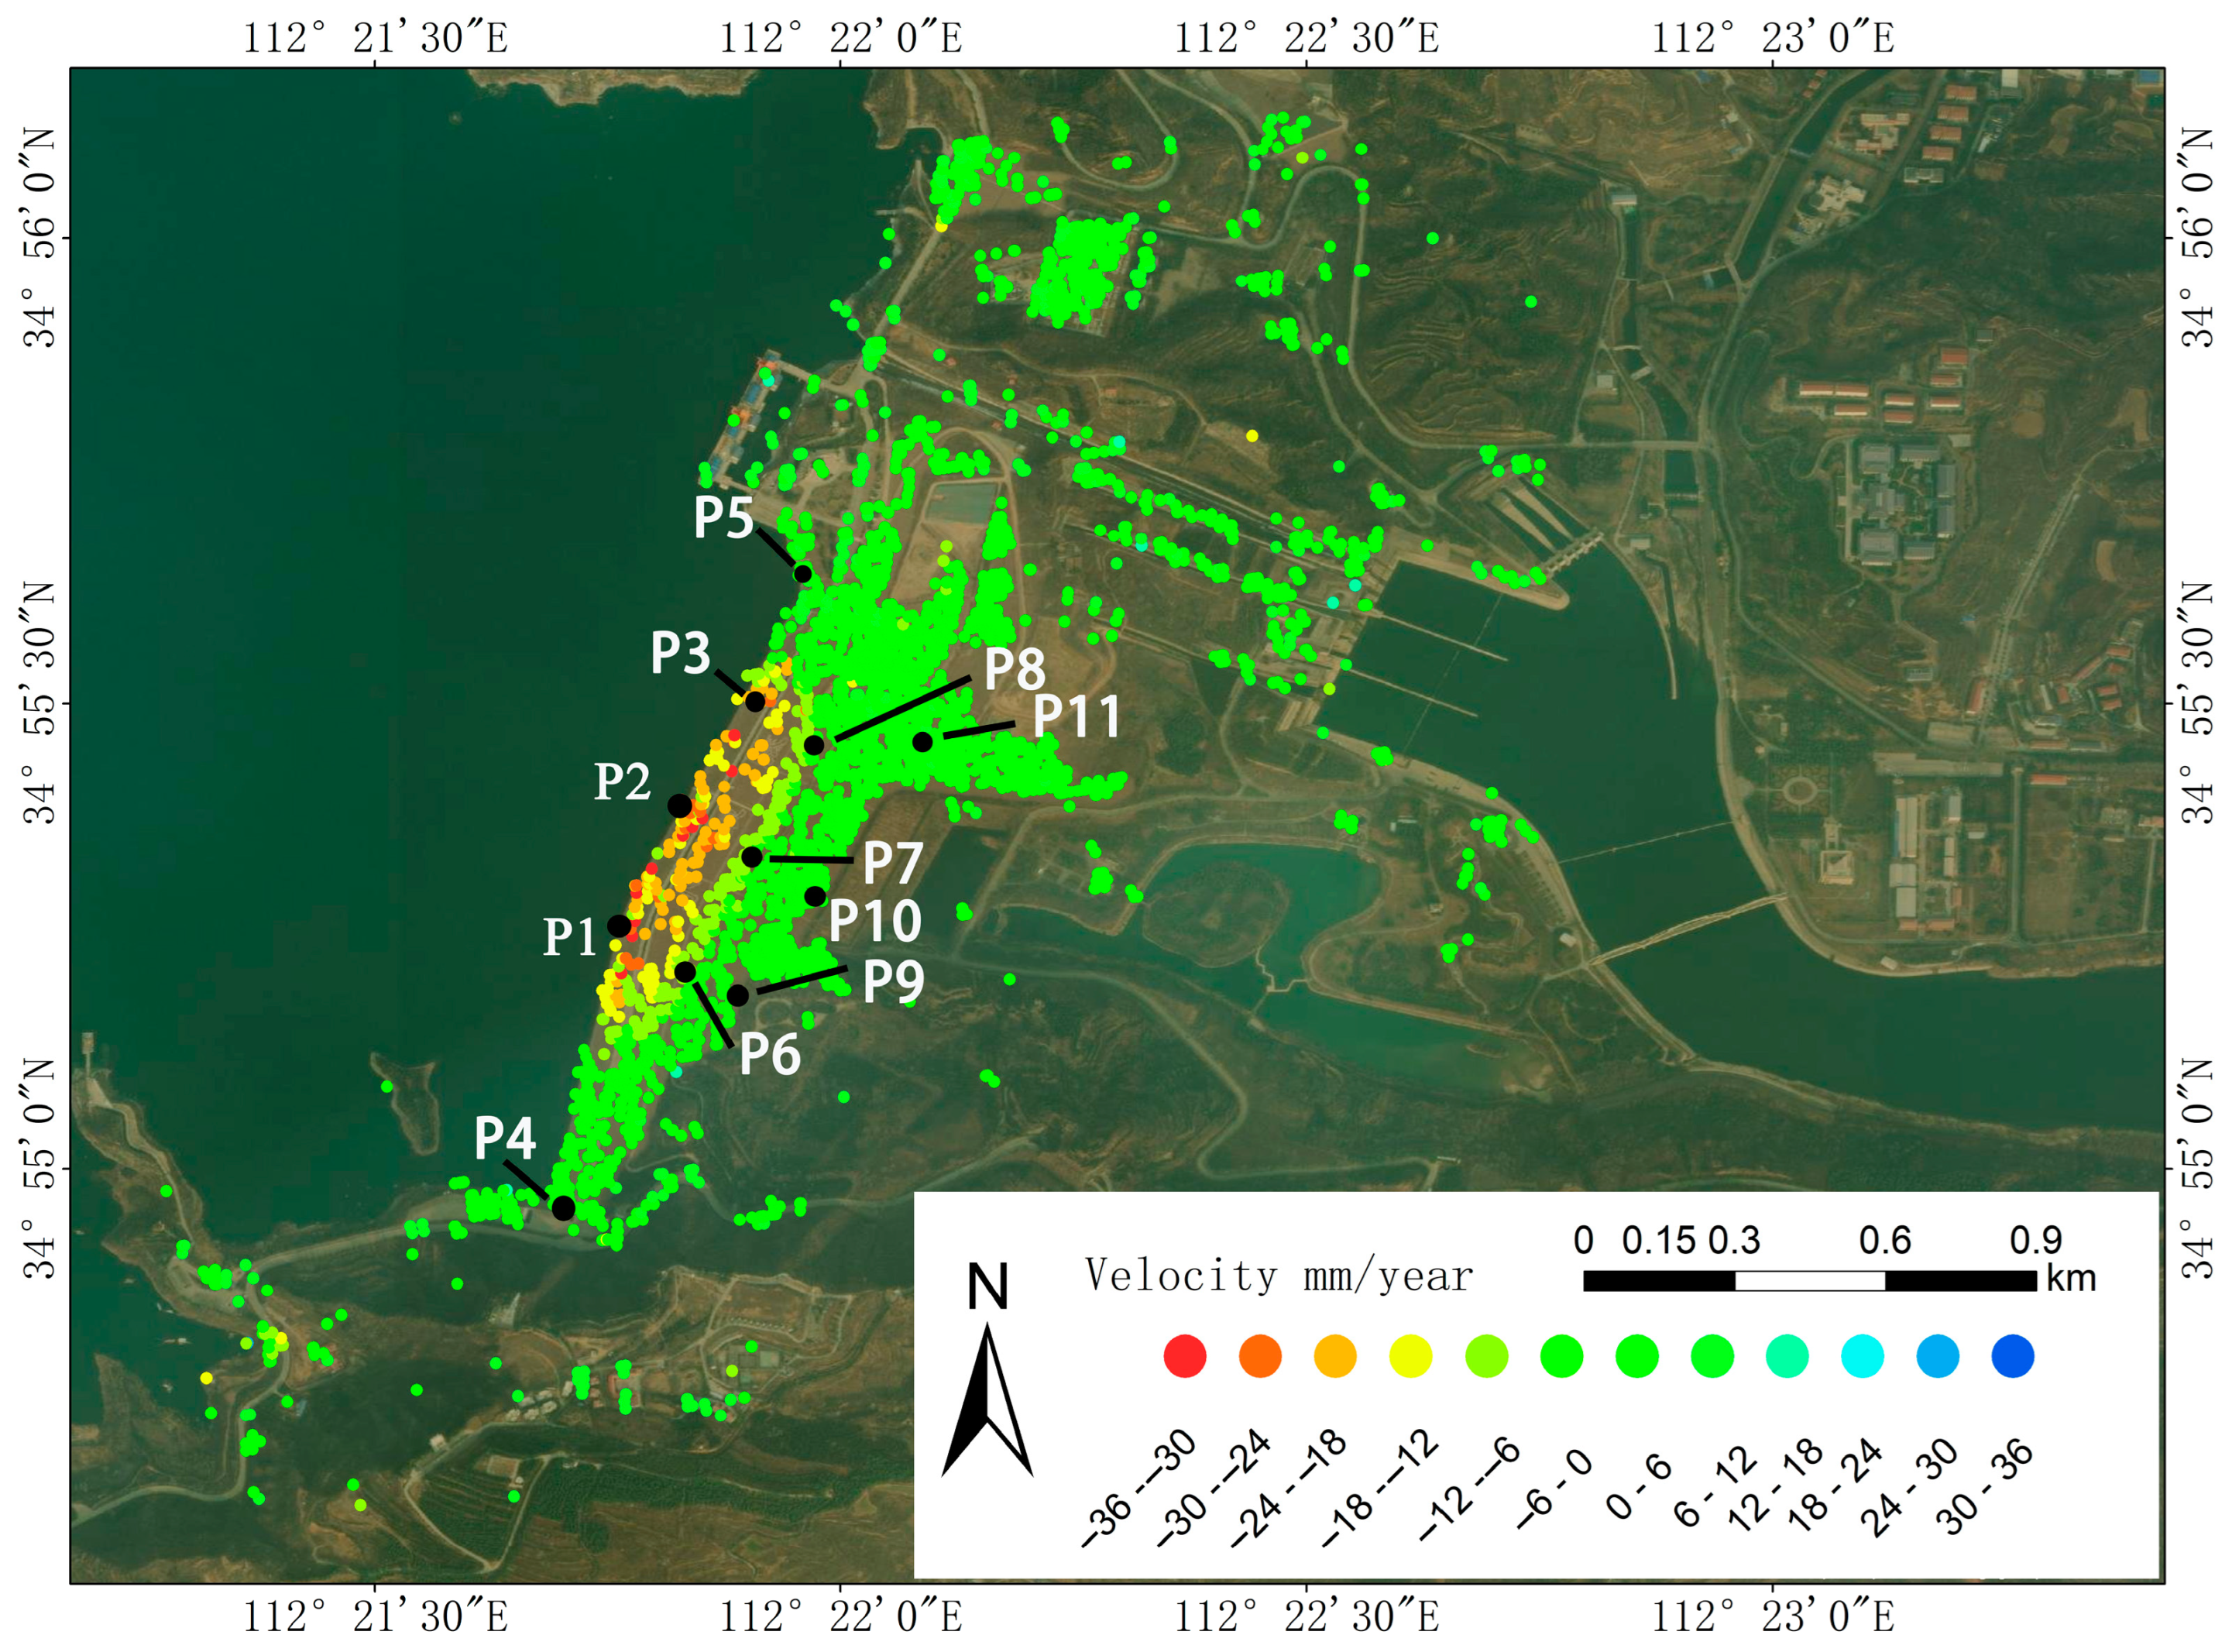
According to the results of this paper (
Figure 5), we can see that the number of monitoring points on the surface of the Xiaolangdi Dam is relatively high, and the distribution is relatively concentrated. The density of monitoring points in areas without artificial facilities is relatively low and more sparse. This also indirectly reflects the characteristics of the PS-InSAR technology, which is more suitable for monitoring artificial infrastructure such as buildings with strong reflection echoes. According to the deformation monitoring results of the Xiaolangdi Dam’s surface, the maximum deformation quantity is at the top-center of the dam, with an average annual deformation quantity between 18 mm and 36 mm and a maximum annual deformation quantity of up to 35.8 mm. The deformation rate gradually decreases from the top center of the dam towards both sides of the bank slope and downstream of the dam slope. The deformation rate at the dam foot near the bank slope is less than 3 mm/year, which can be interpreted as the bank slope and dam base being basically stable.
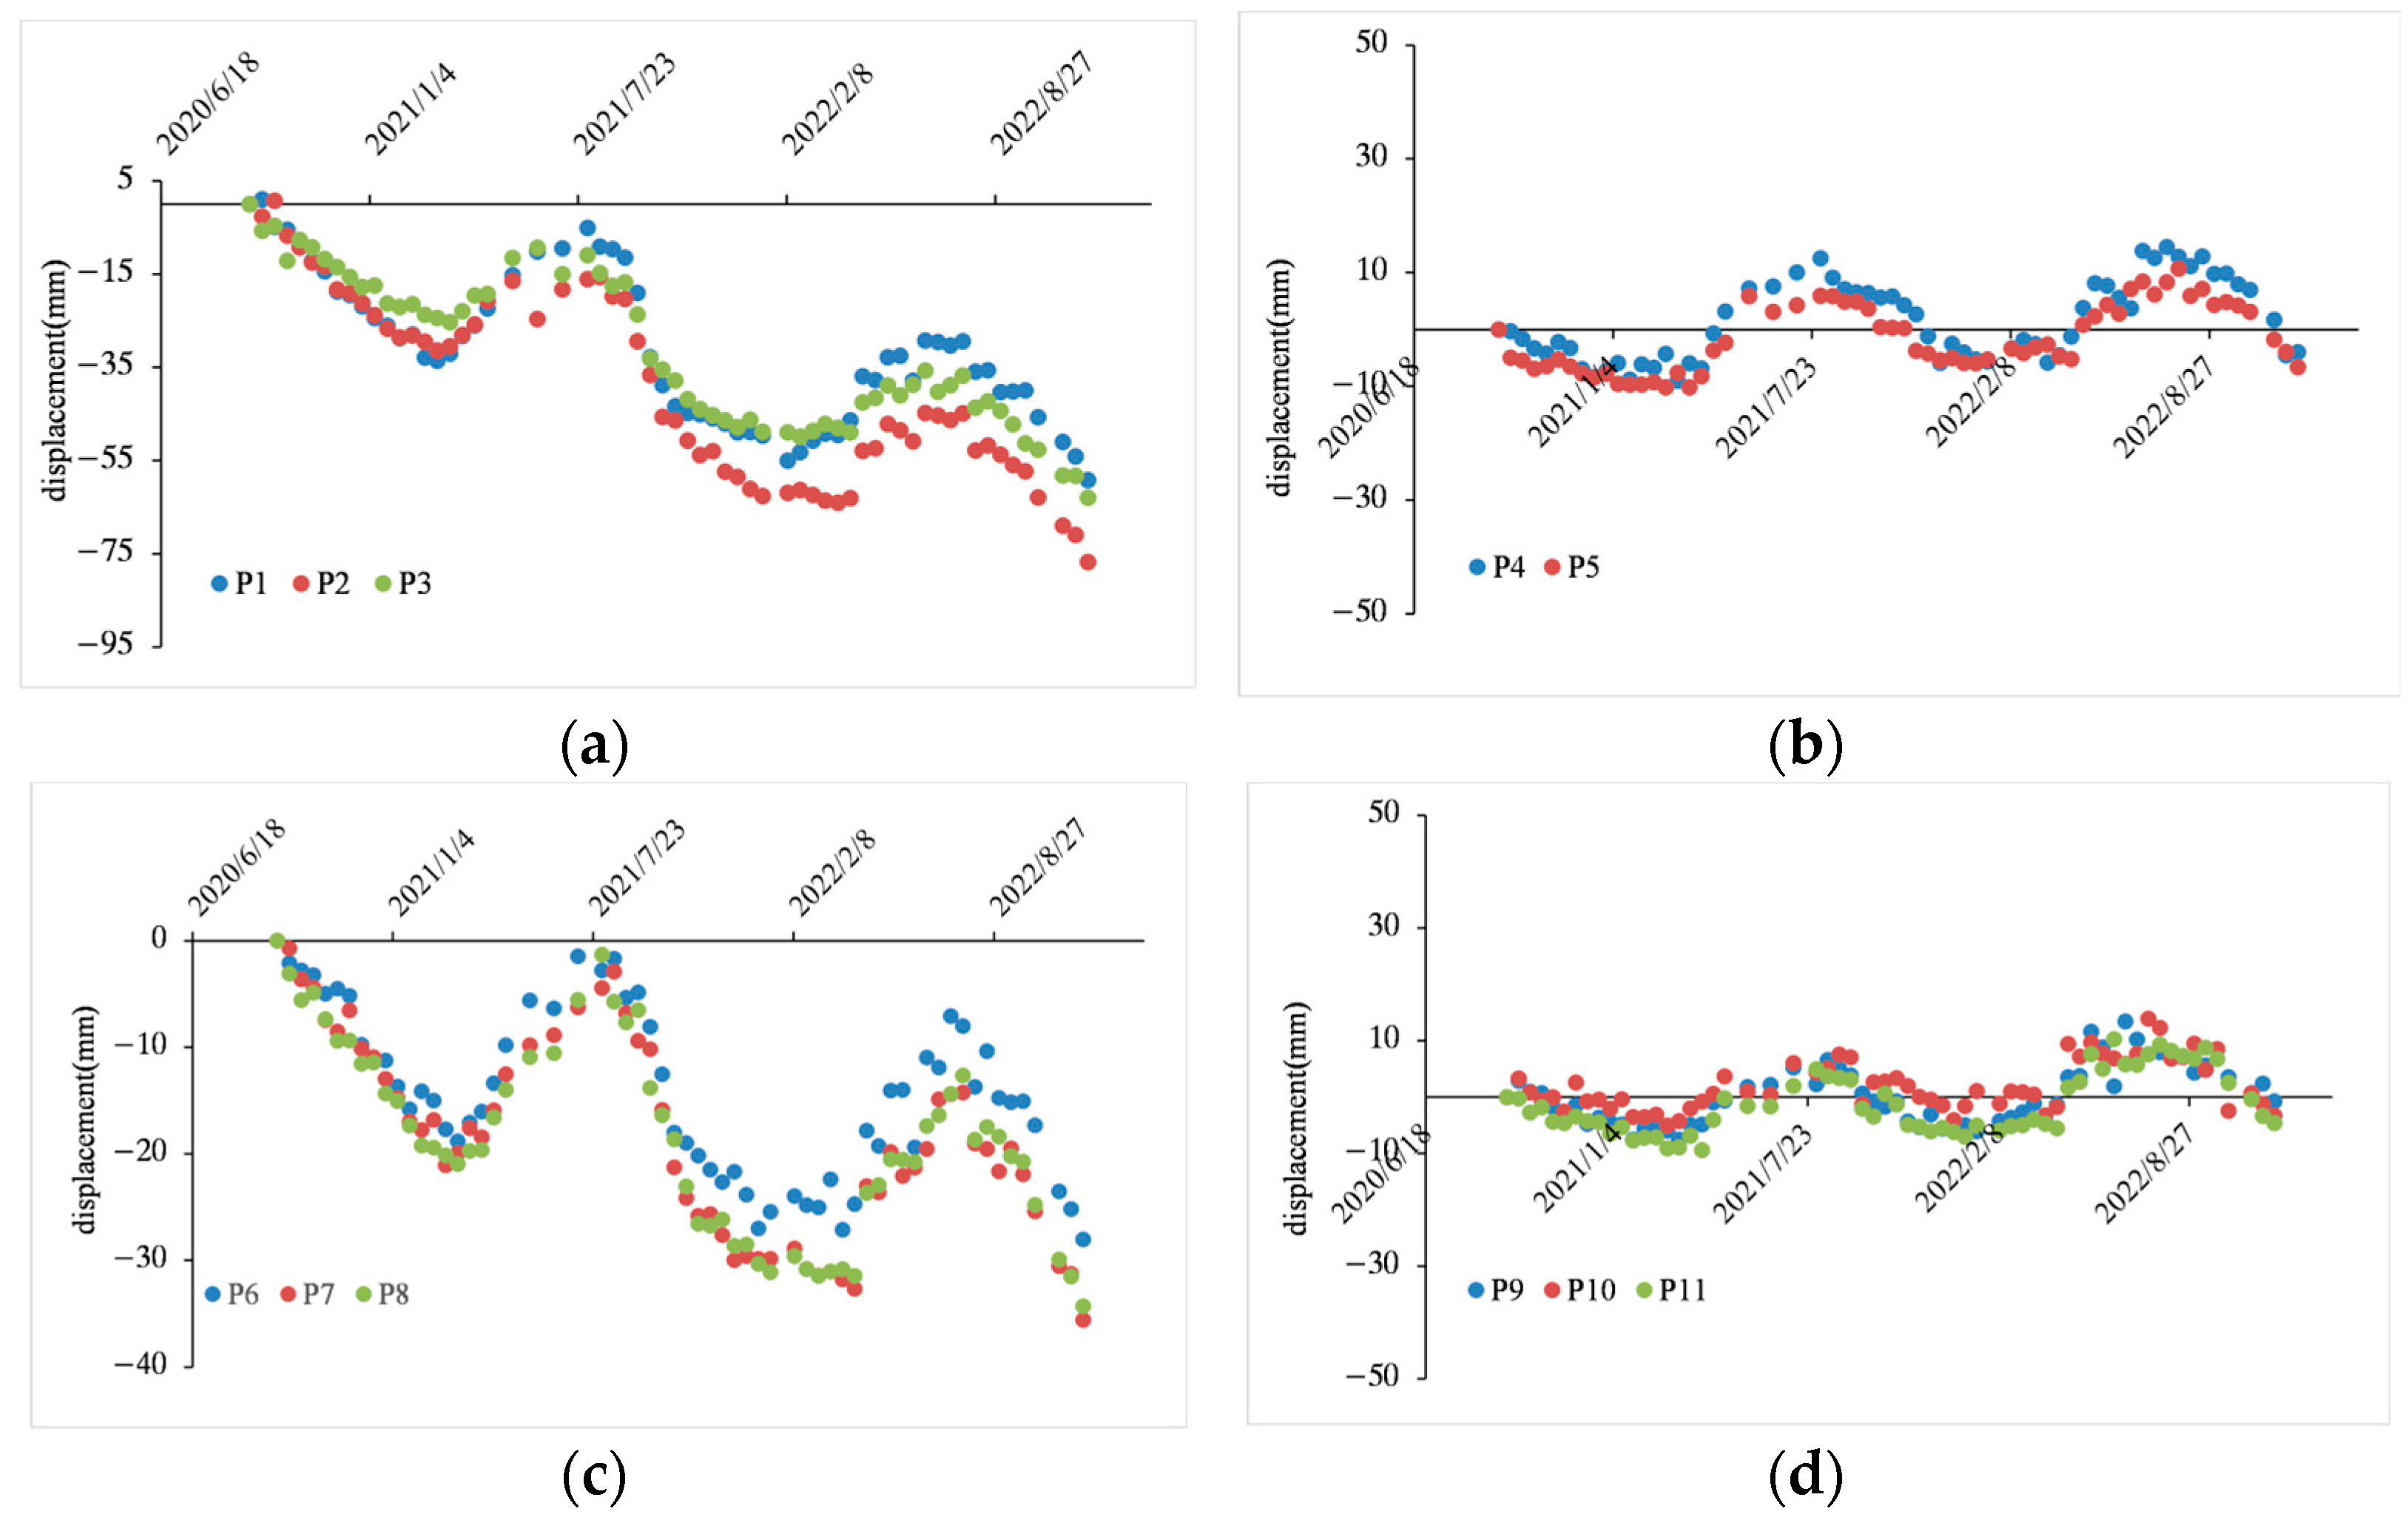
On the Xiaolangdi Dam, some monitoring points were selected at the top-center of the dam, both sides of the bank slope and downstream of the dam slope, and at the foot of the slope to analyze the temporal deformation characteristics of different areas. Among them, P1, P2, and P3 are located in the central area of the top of the Xiaolangdi Dam, where the deformation rate is the highest on the surface of the dam, and the absolute annual deformation rate exceeds 20 mm/year. P4 and P5 are located on both sides of the dam slope, where the deformation rate is relatively small, and the absolute annual deformation rate is less than 3 mm/year. P6, P7, and P8 are located in the middle of the downstream dam slope, where the absolute annual deformation rate is about 10 mm/year. P9, P10, and P11 are located at the foot of the dam slope, where the deformation rate is also relatively small, and the absolute annual deformation rate is less than 3 mm/year.
From
Figure 6, it can be seen that the deformation trend of each monitoring point in each region has good consistency, and the deformation sequence of the monitoring points in the four regions all have obvious periodic characteristics, showing that the surface deformation of the dam body increases continuously to the maximum deformation from September to March of the next year, and then decreases gradually to the minimum deformation feature from April to August. Based on the deformation distribution of the Xiaolangdi Dam from 2020 to 2022 and the water level information of Xiaolangdi Reservoir on the image acquisition date, the deformation characteristics of the dam body and the joint analysis with the reservoir water level were analyzed.
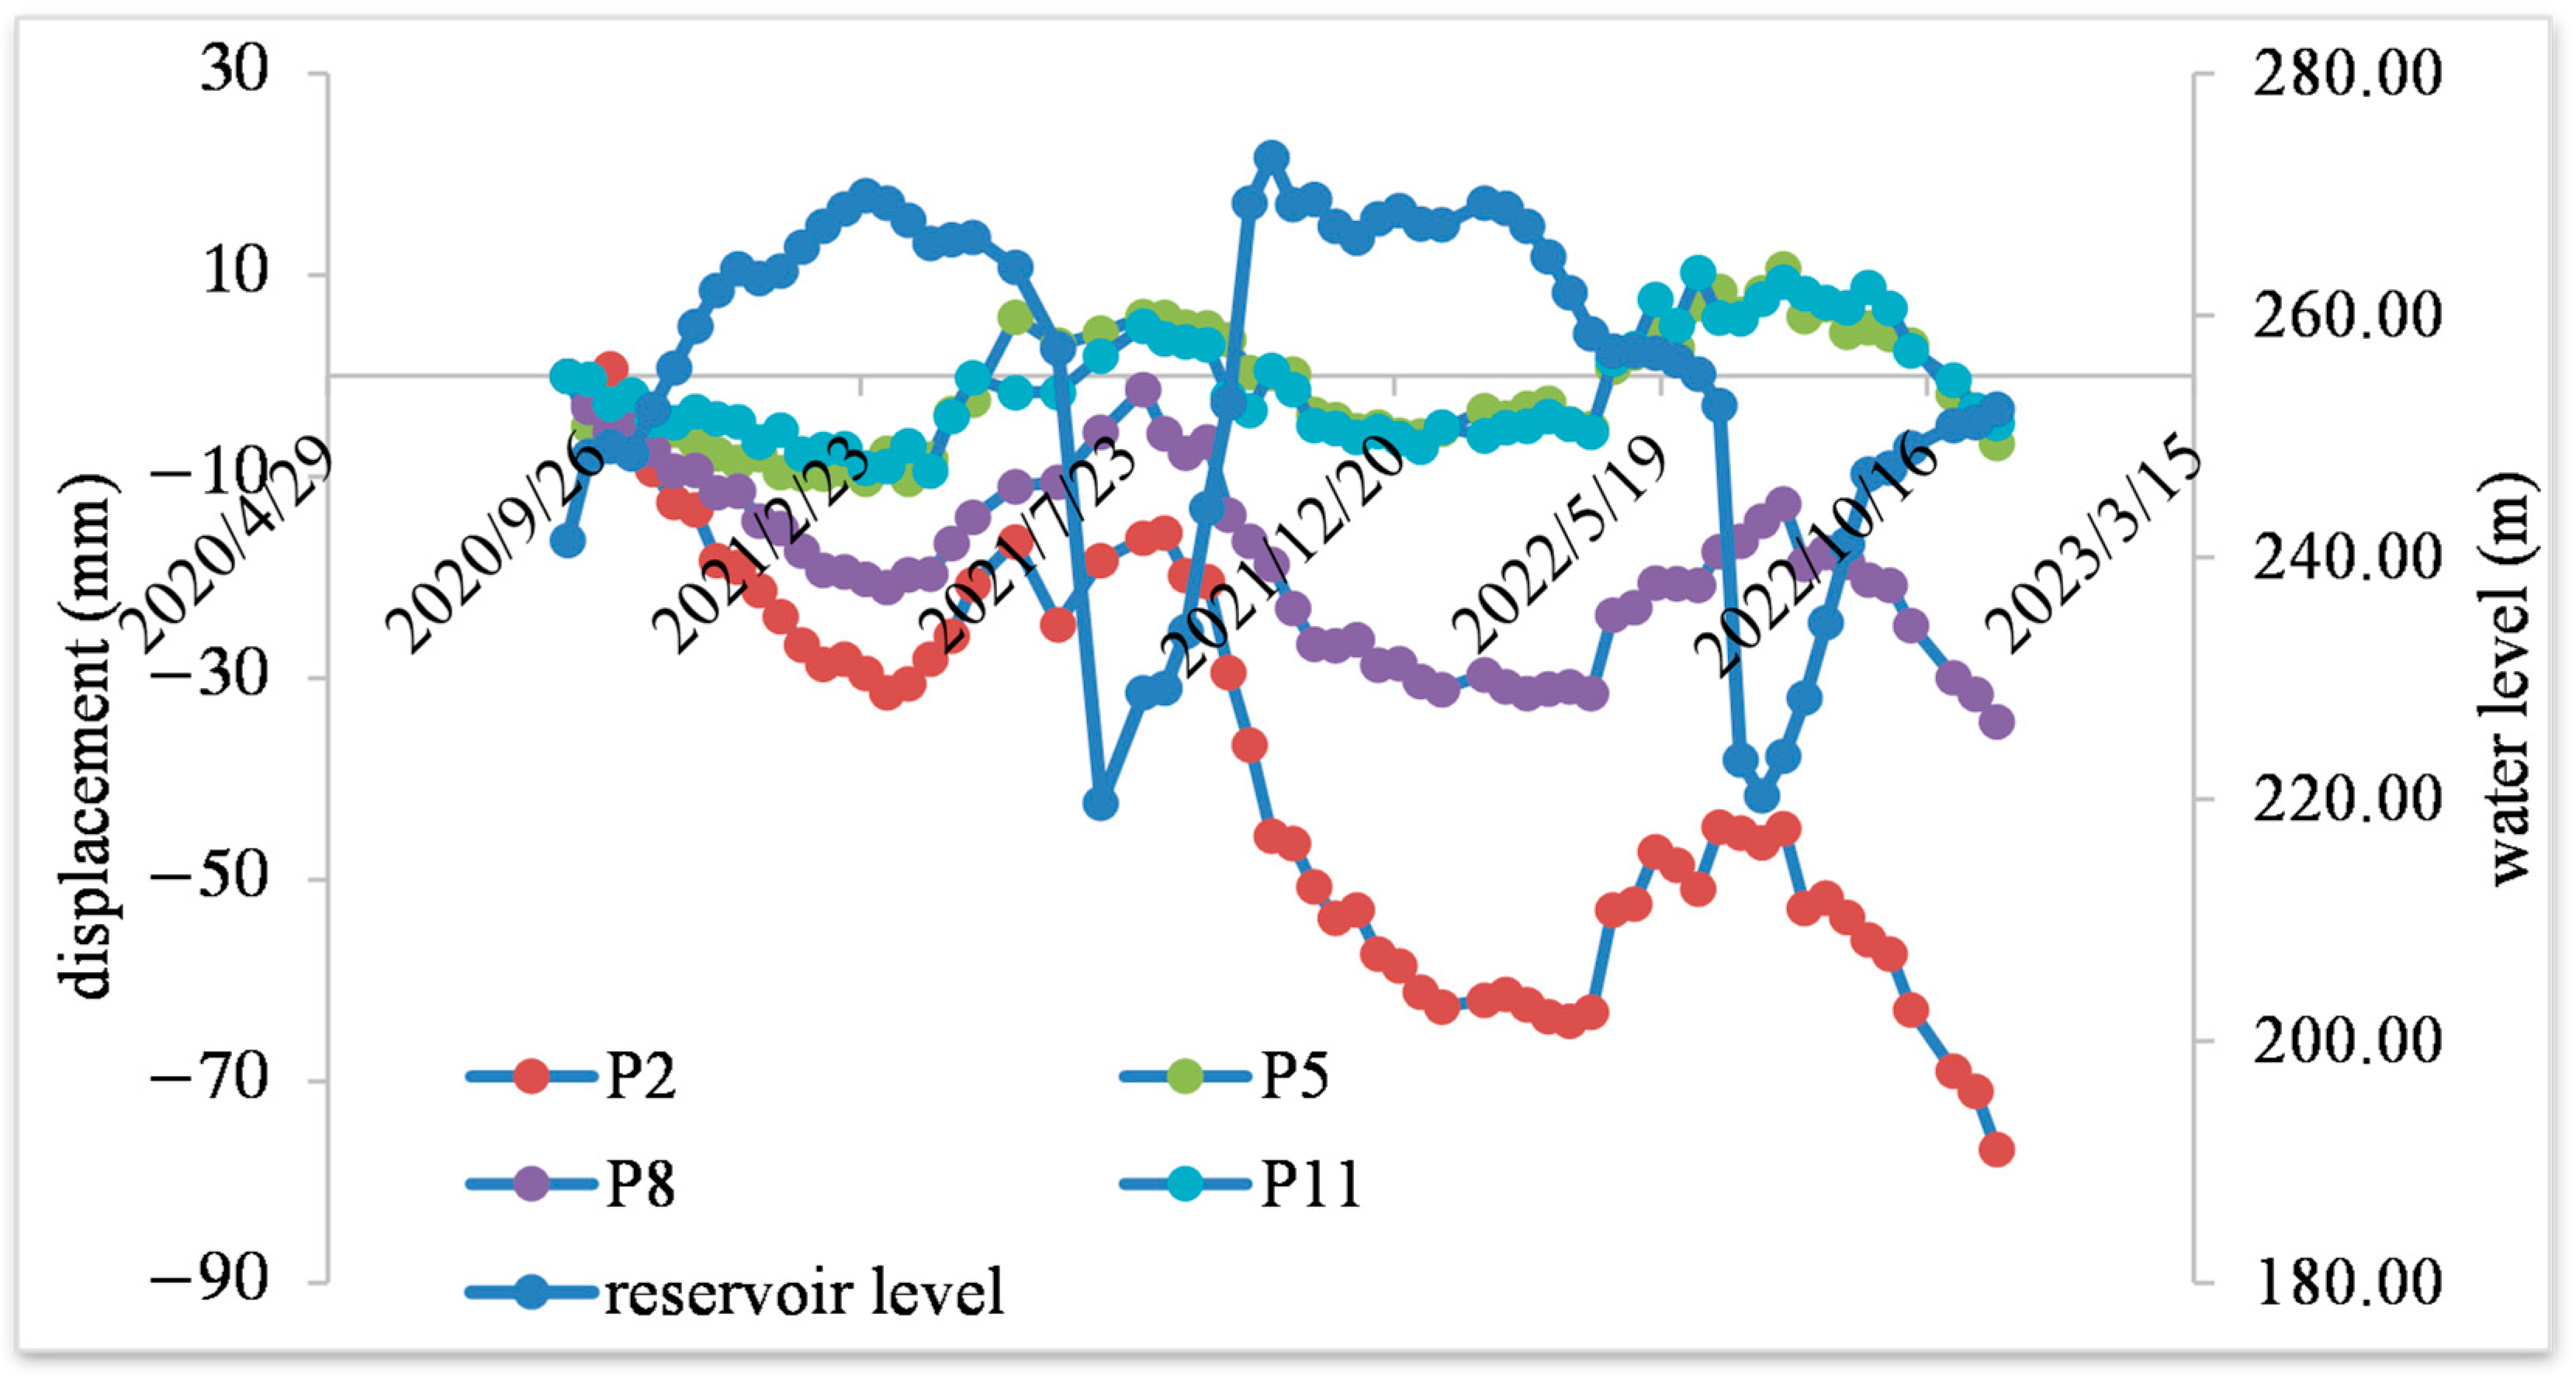
Representative points P2, P5, P8, and P11 were selected from the four regions for deformation and water level analysis. From
Figure 7, below, it can be seen that the deformation of the dam body and the water level of the reservoir basically show the following relationship: when the water level of the Xiaolangdi Reservoir rises, the dam body tends to deform downstream, and when the water level of the reservoir drops, the dam body tends to deform upstream. The reason is that when the water level rises, the water exerts greater pressure on the dam body, causing the dam body to tend to deform downstream. When the water level drops, the pressure of the water gradually decreases, and the dam body tends to deform upstream, which shows that the maximum deformation value of the dam body mostly occurs during the high water level period, and the minimum deformation value mostly occurs during the low water level period, which is consistent with the conclusions of Zixin He [
26] and Dongbiao Xu [
11].
5. Conclusions
This article uses Sentinel-1 radar data and PS-InSAR technology to extract the deformation of the Xiaolangdi Dam from September 2020 to November 2022 and analyze it, and the following conclusions are drawn:
(1) The maximum deformation amount at the center of the dam crest of the Xiaolangdi Dam is −18 mm/year~−36 mm/year; the deformation rate gradually decreases from the center of the dam crest to the two side slopes of the dam, the downstream dam slope, and the dam foot. The absolute value of the annual deformation rate near the dam slope and dam foot is less than 3 mm/year, and it can be considered that the slope and dam foundation are basically stable.
(2) The time series deformation of the Xiaolangdi Dam has obvious periodic characteristics, showing that from September to August of the next year, from September to March, the surface deformation of the dam body continues to increase to the maximum deformation, and from April to August, the surface deformation of the dam body gradually decreases to the minimum deformation feature. Its deformation characteristics are closely related to the change in the reservoir water level. The current deformation of the Xiaolangdi Dam does not affect the safe operation of the dam.
This study obtained and analyzed the deformation monitoring results of the Xiaolangdi Dam, concluding that the dam is currently in a safe state. Additionally, the results of this study further validate the applicability of InSAR technology in dam deformation monitoring. It demonstrates that InSAR technology can obtain high-precision and high-density deformation information on the surface of reservoir dams, especially suitable for small and medium-sized reservoir safety monitoring applications that have not been equipped with ground measurement methods such as GNSS. InSAR technology enables the timely detection of deformation hazard zones in reservoirs, which is conducive to the safe operation of reservoirs. It holds promising prospects and value for widespread application.
In this paper, it is regretted that the ground deformation monitoring data of the Xiaolangdi Dam were not collected, and it is still hoped that the relevant data can be obtained as much as possible in the future to further verify the reliability of the techniques used in this paper and to carry out more analyses.


 ,
, 
