
CMADS and CFSR Data-Driven SWAT Modeling for Impacts of Climate and Land-Use Change on Runoff


Abstract
:1. Introduction
2. Materials and Methods
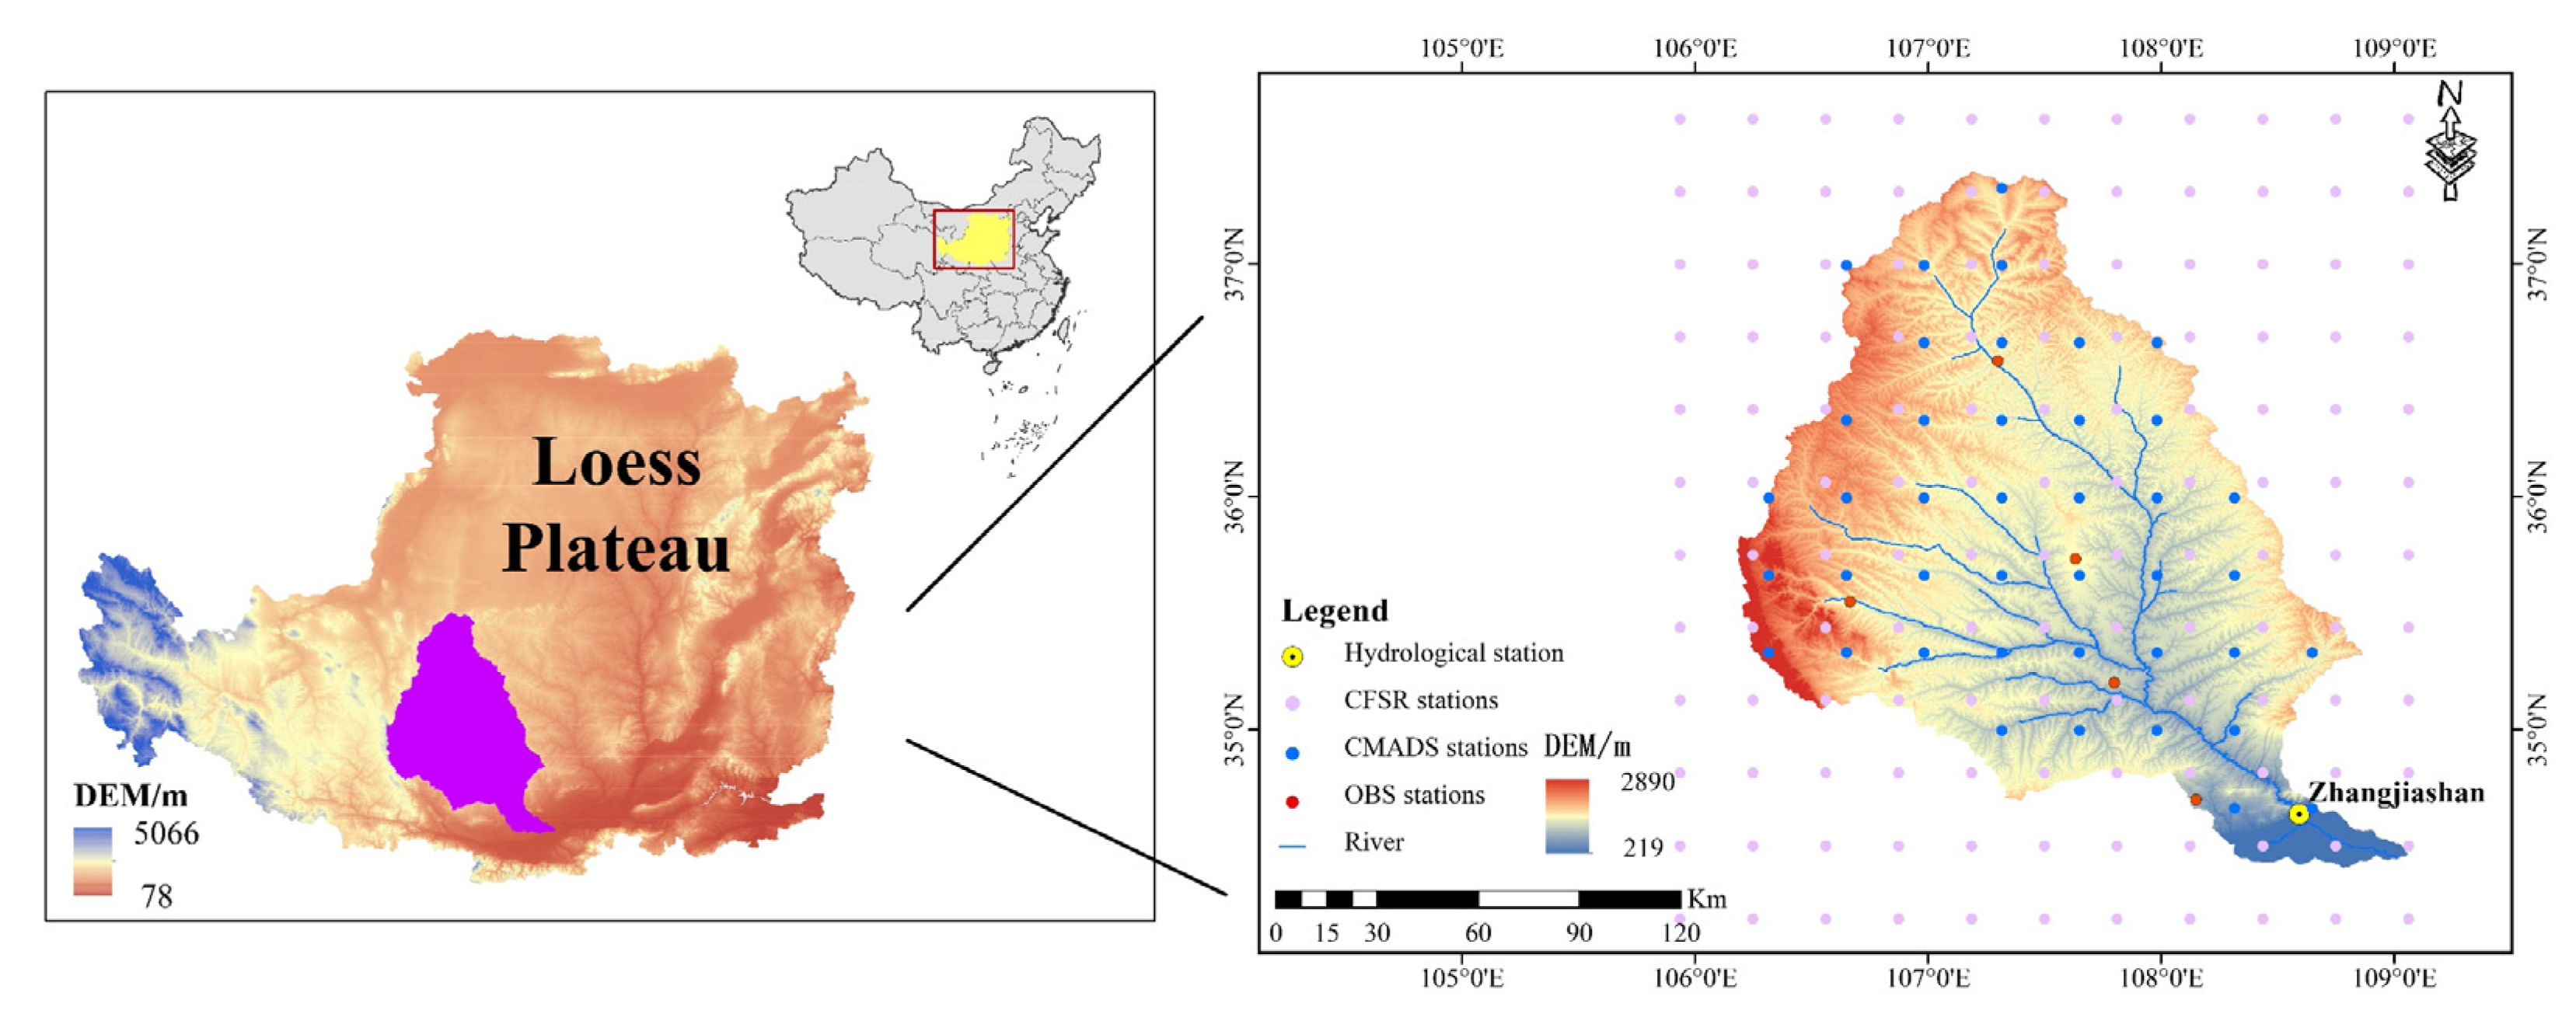
2.1. Study Area and Data
2.1.1. Study Area
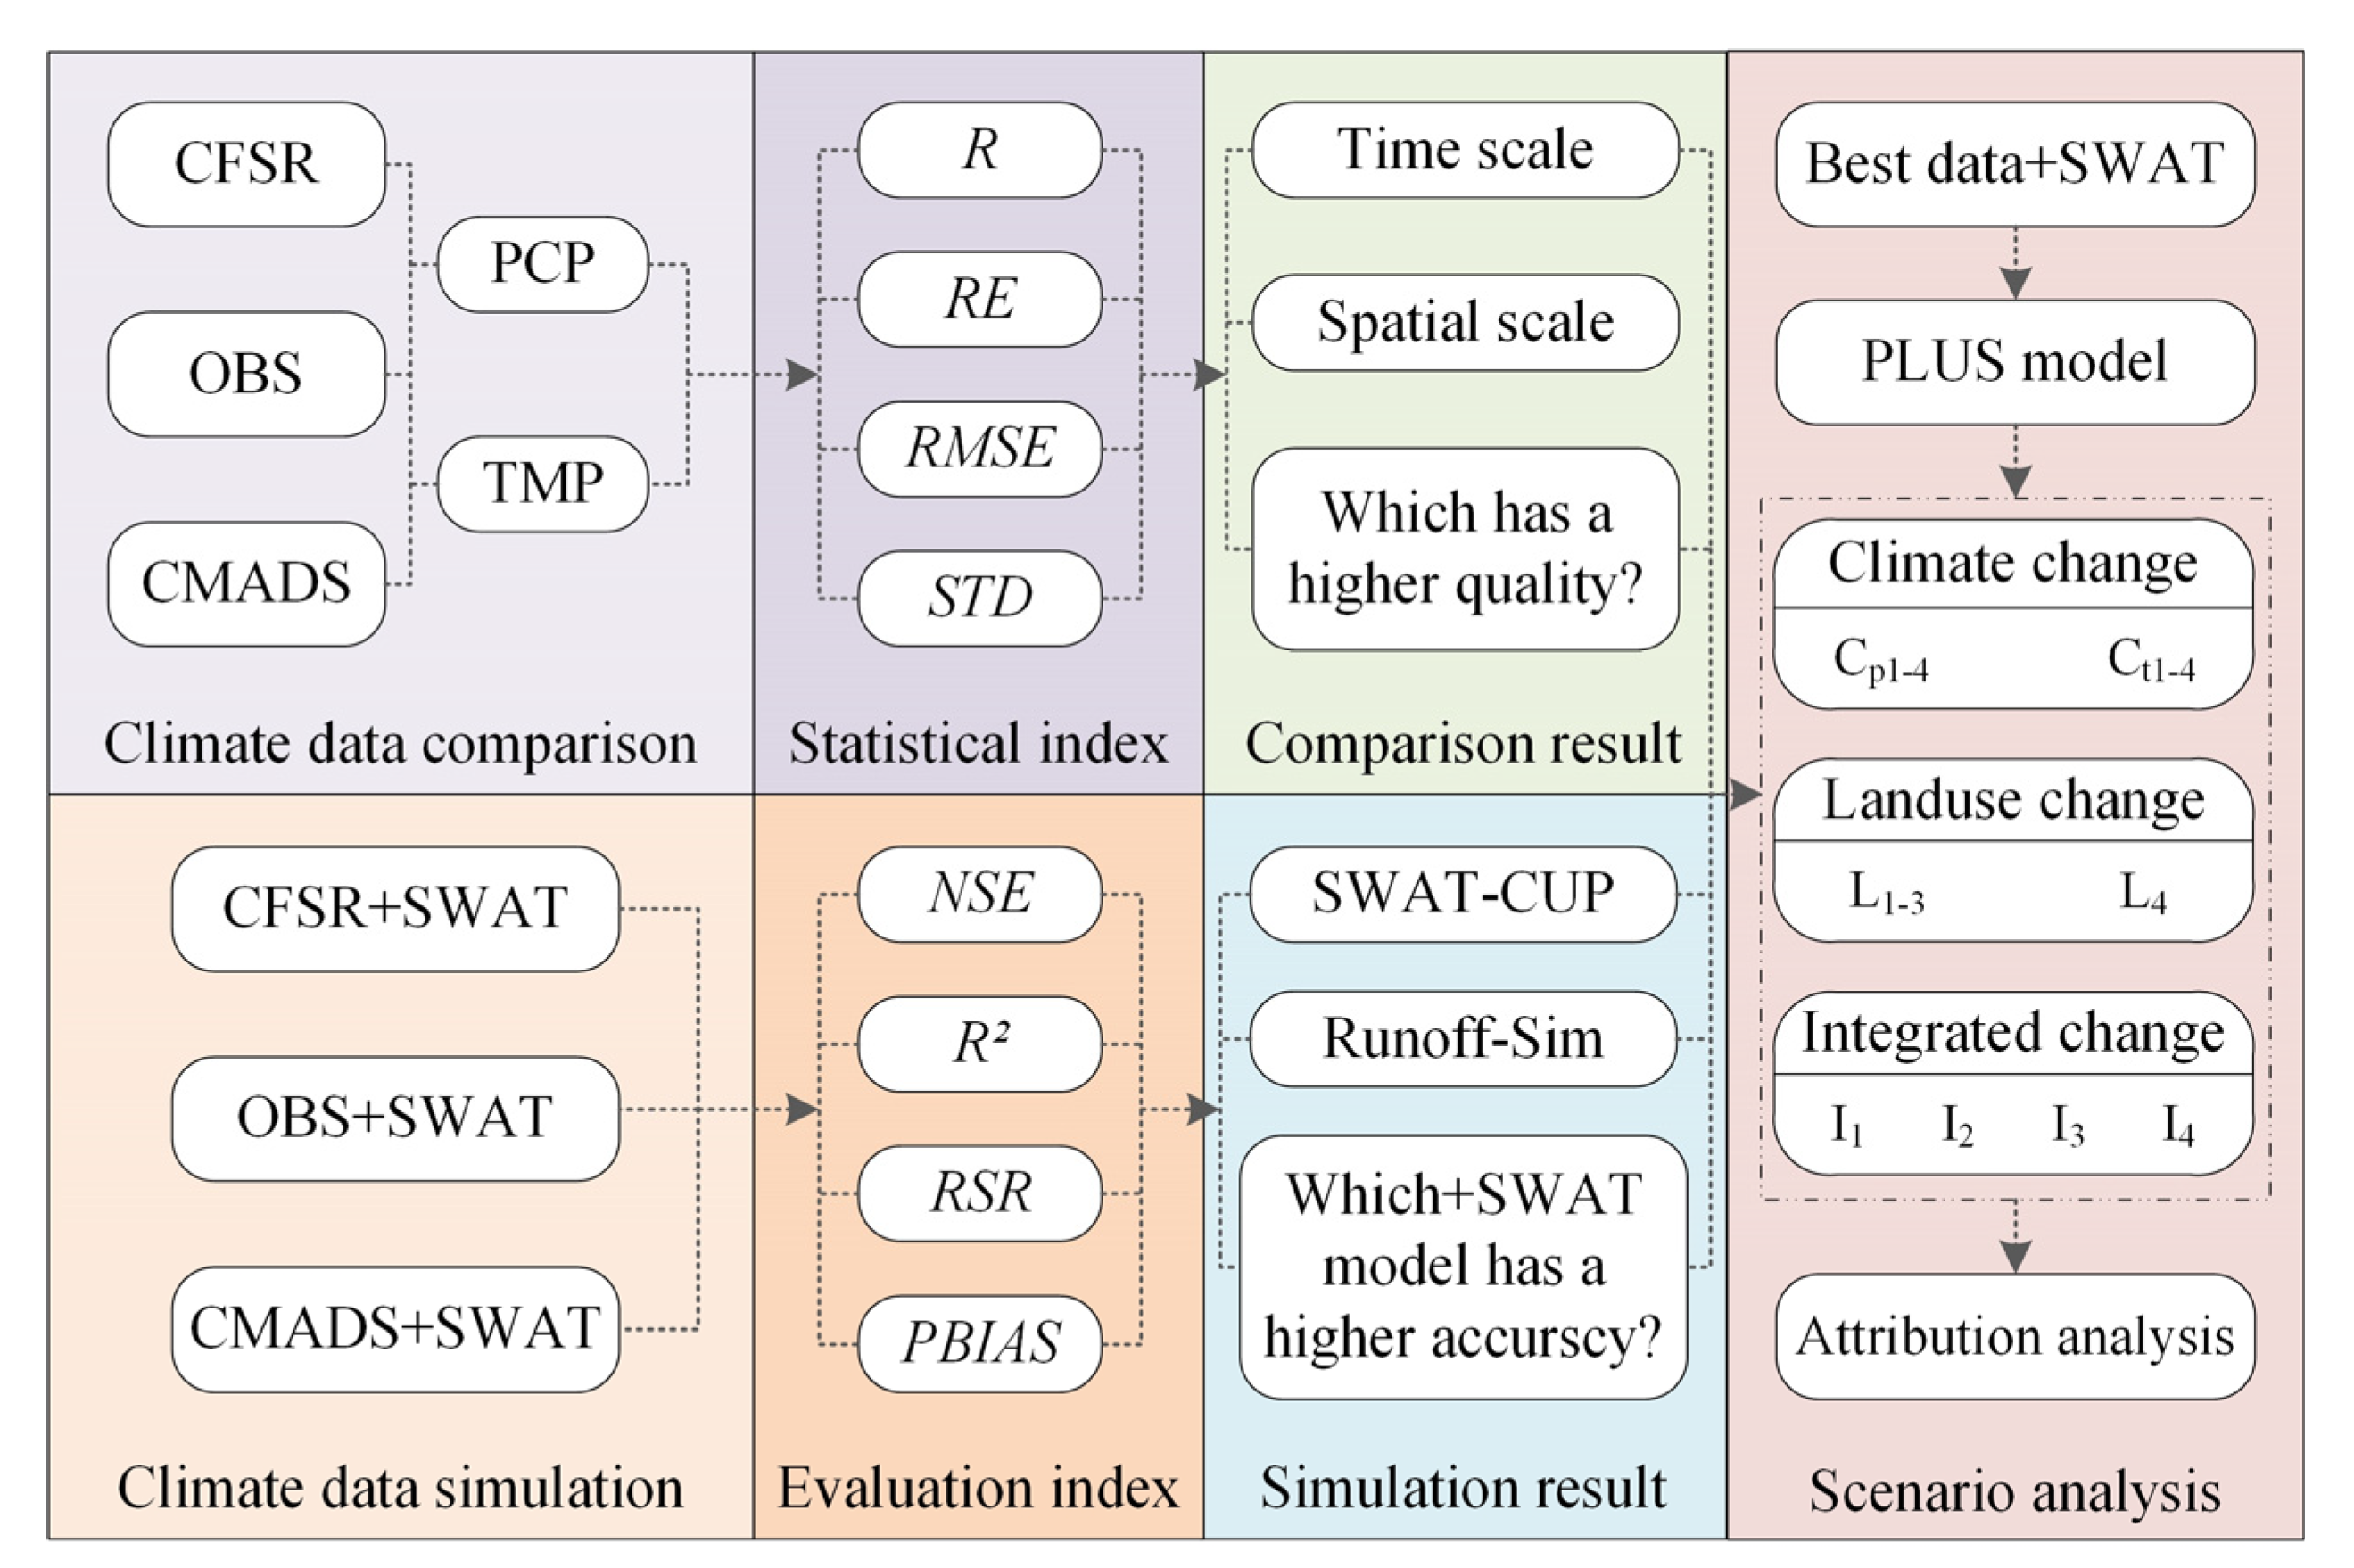
2.1.2. Data and Technical Framework
2.2. Spatial Interpolation Method
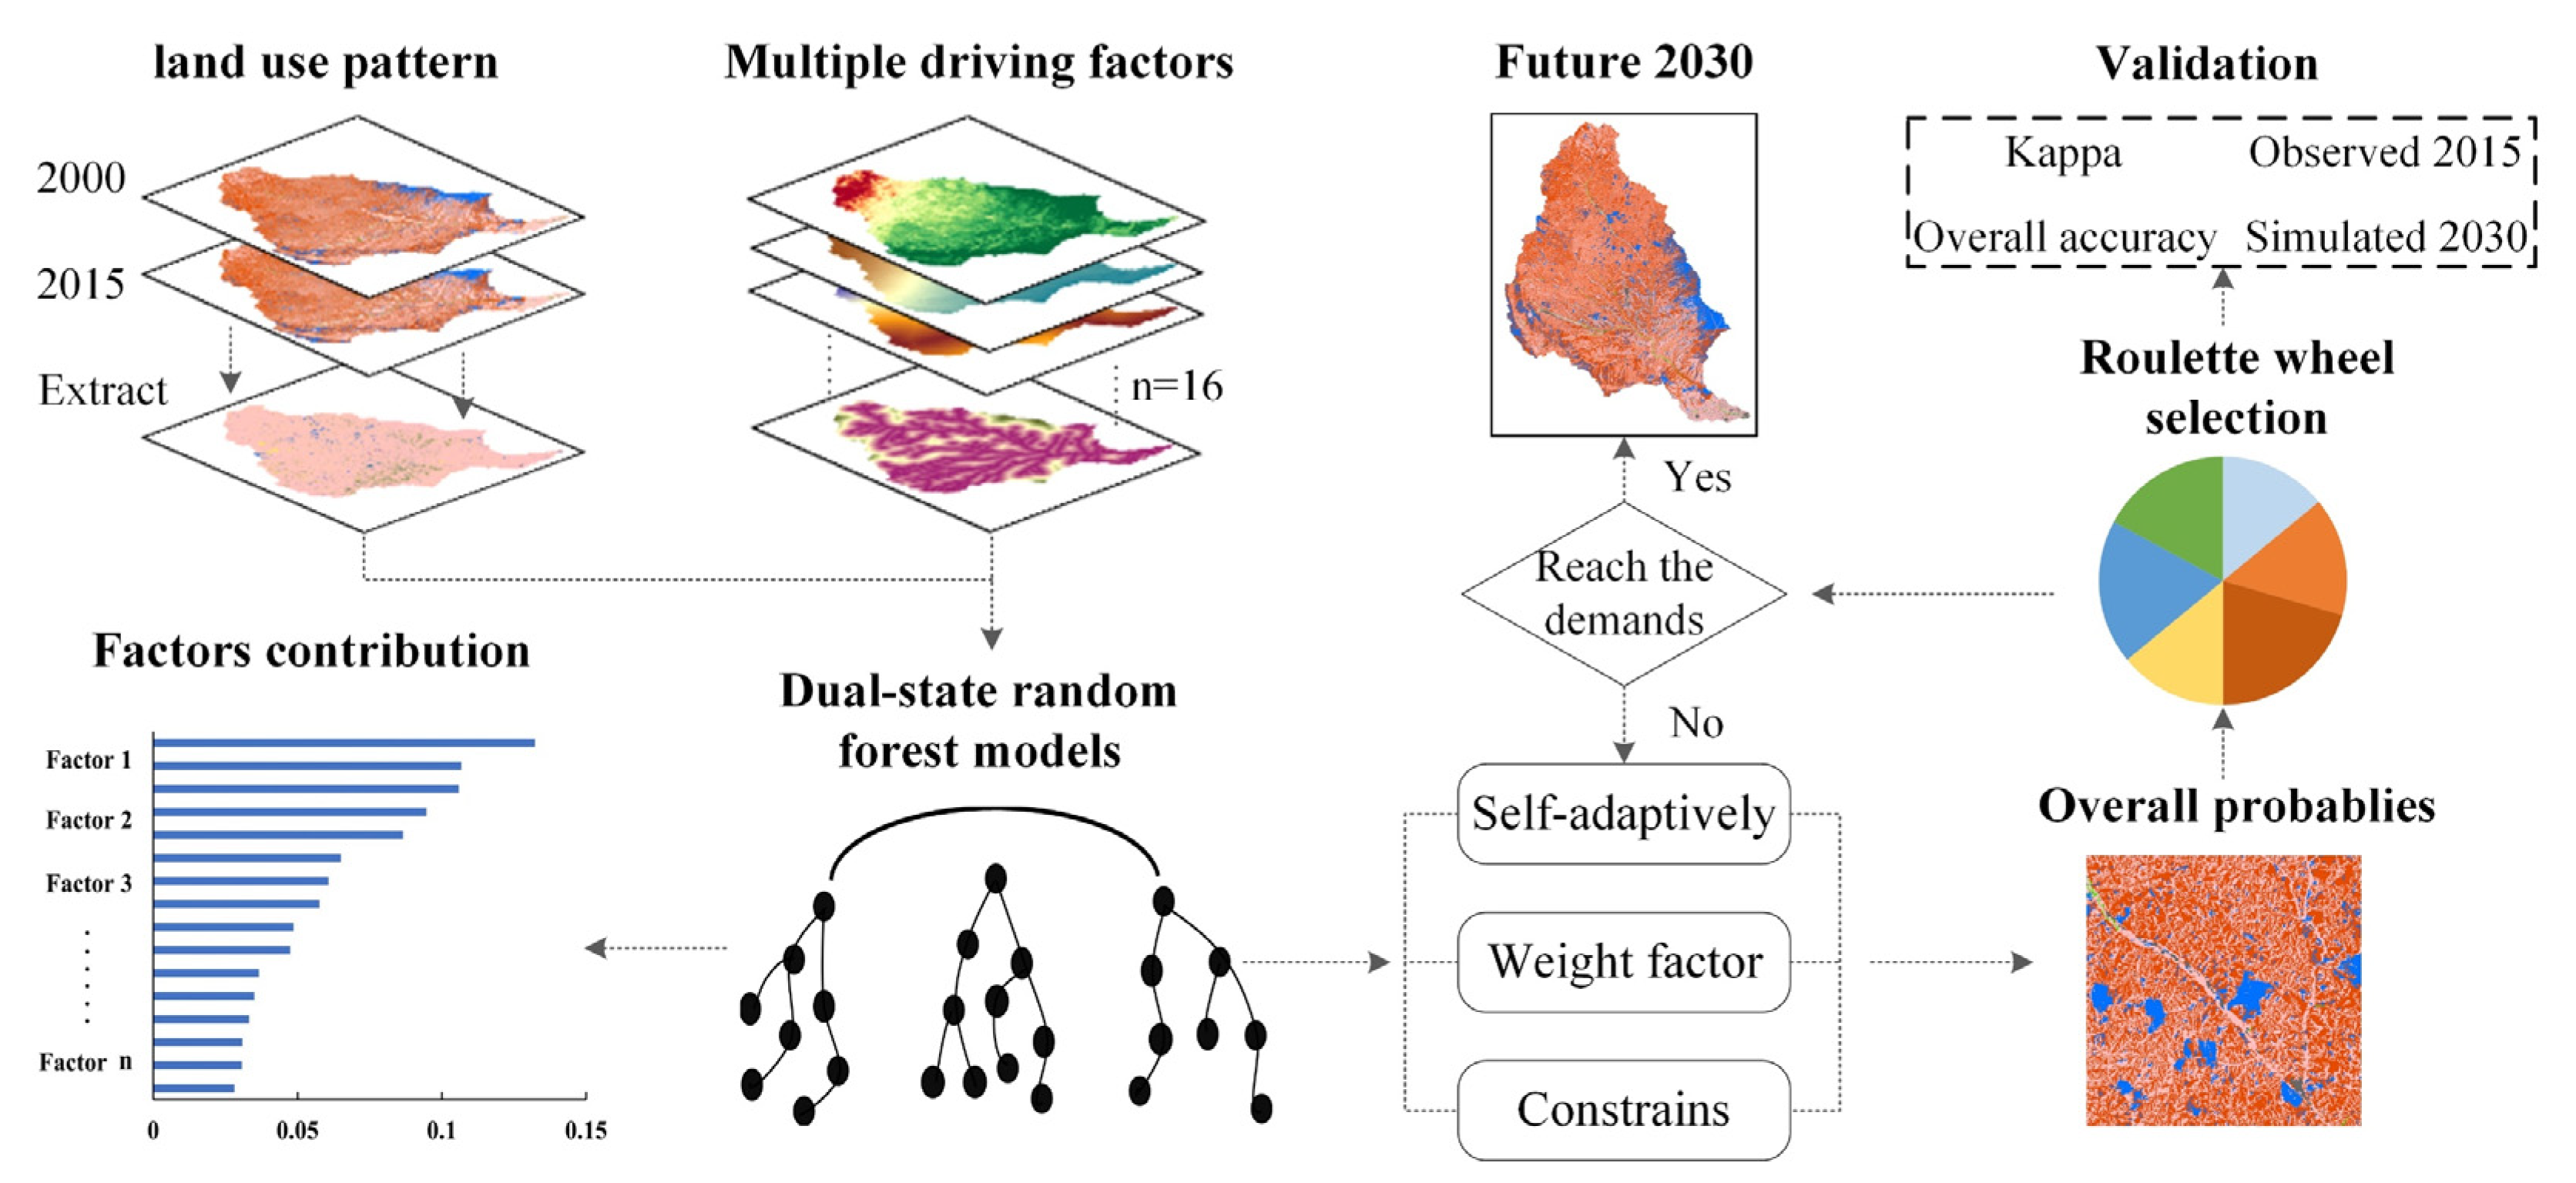
2.3. PLUS Model
2.4. SWAT Model
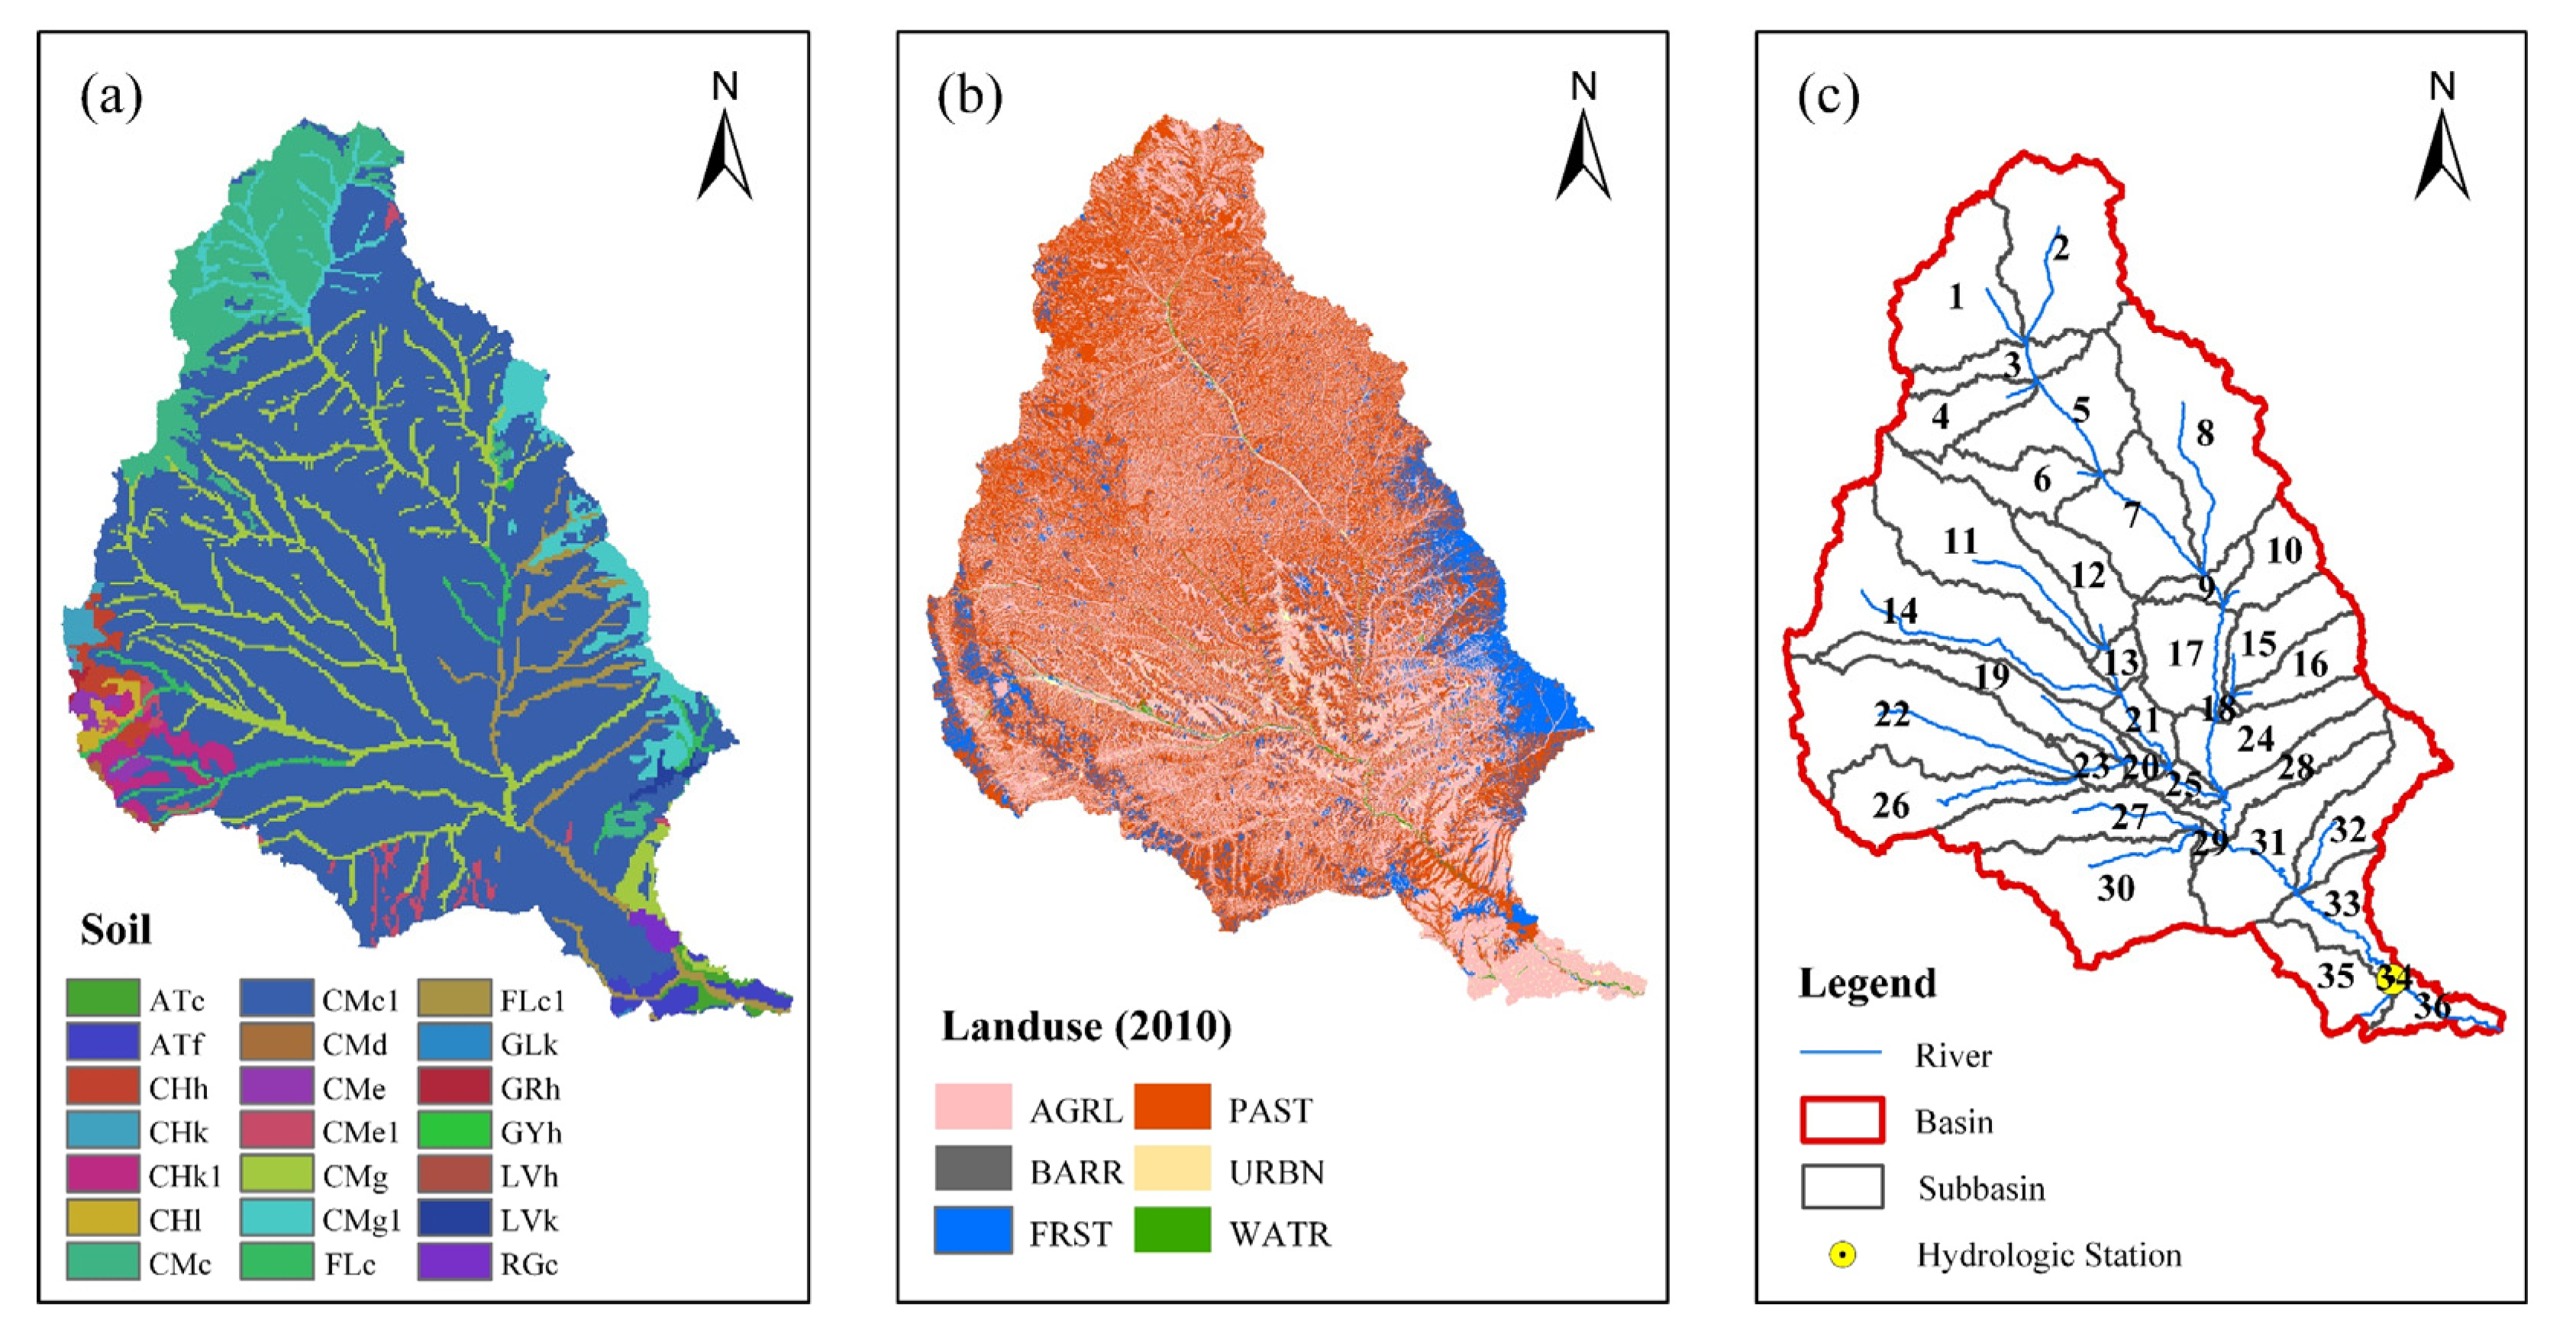
2.4.1. Model Setup
2.4.2. Model Calibration and Evaluation
2.5. Setting Climate and Land-Use Change Scenarios
3. Results
3.1. Comparison and Evaluation of CMADS and CFSR Data
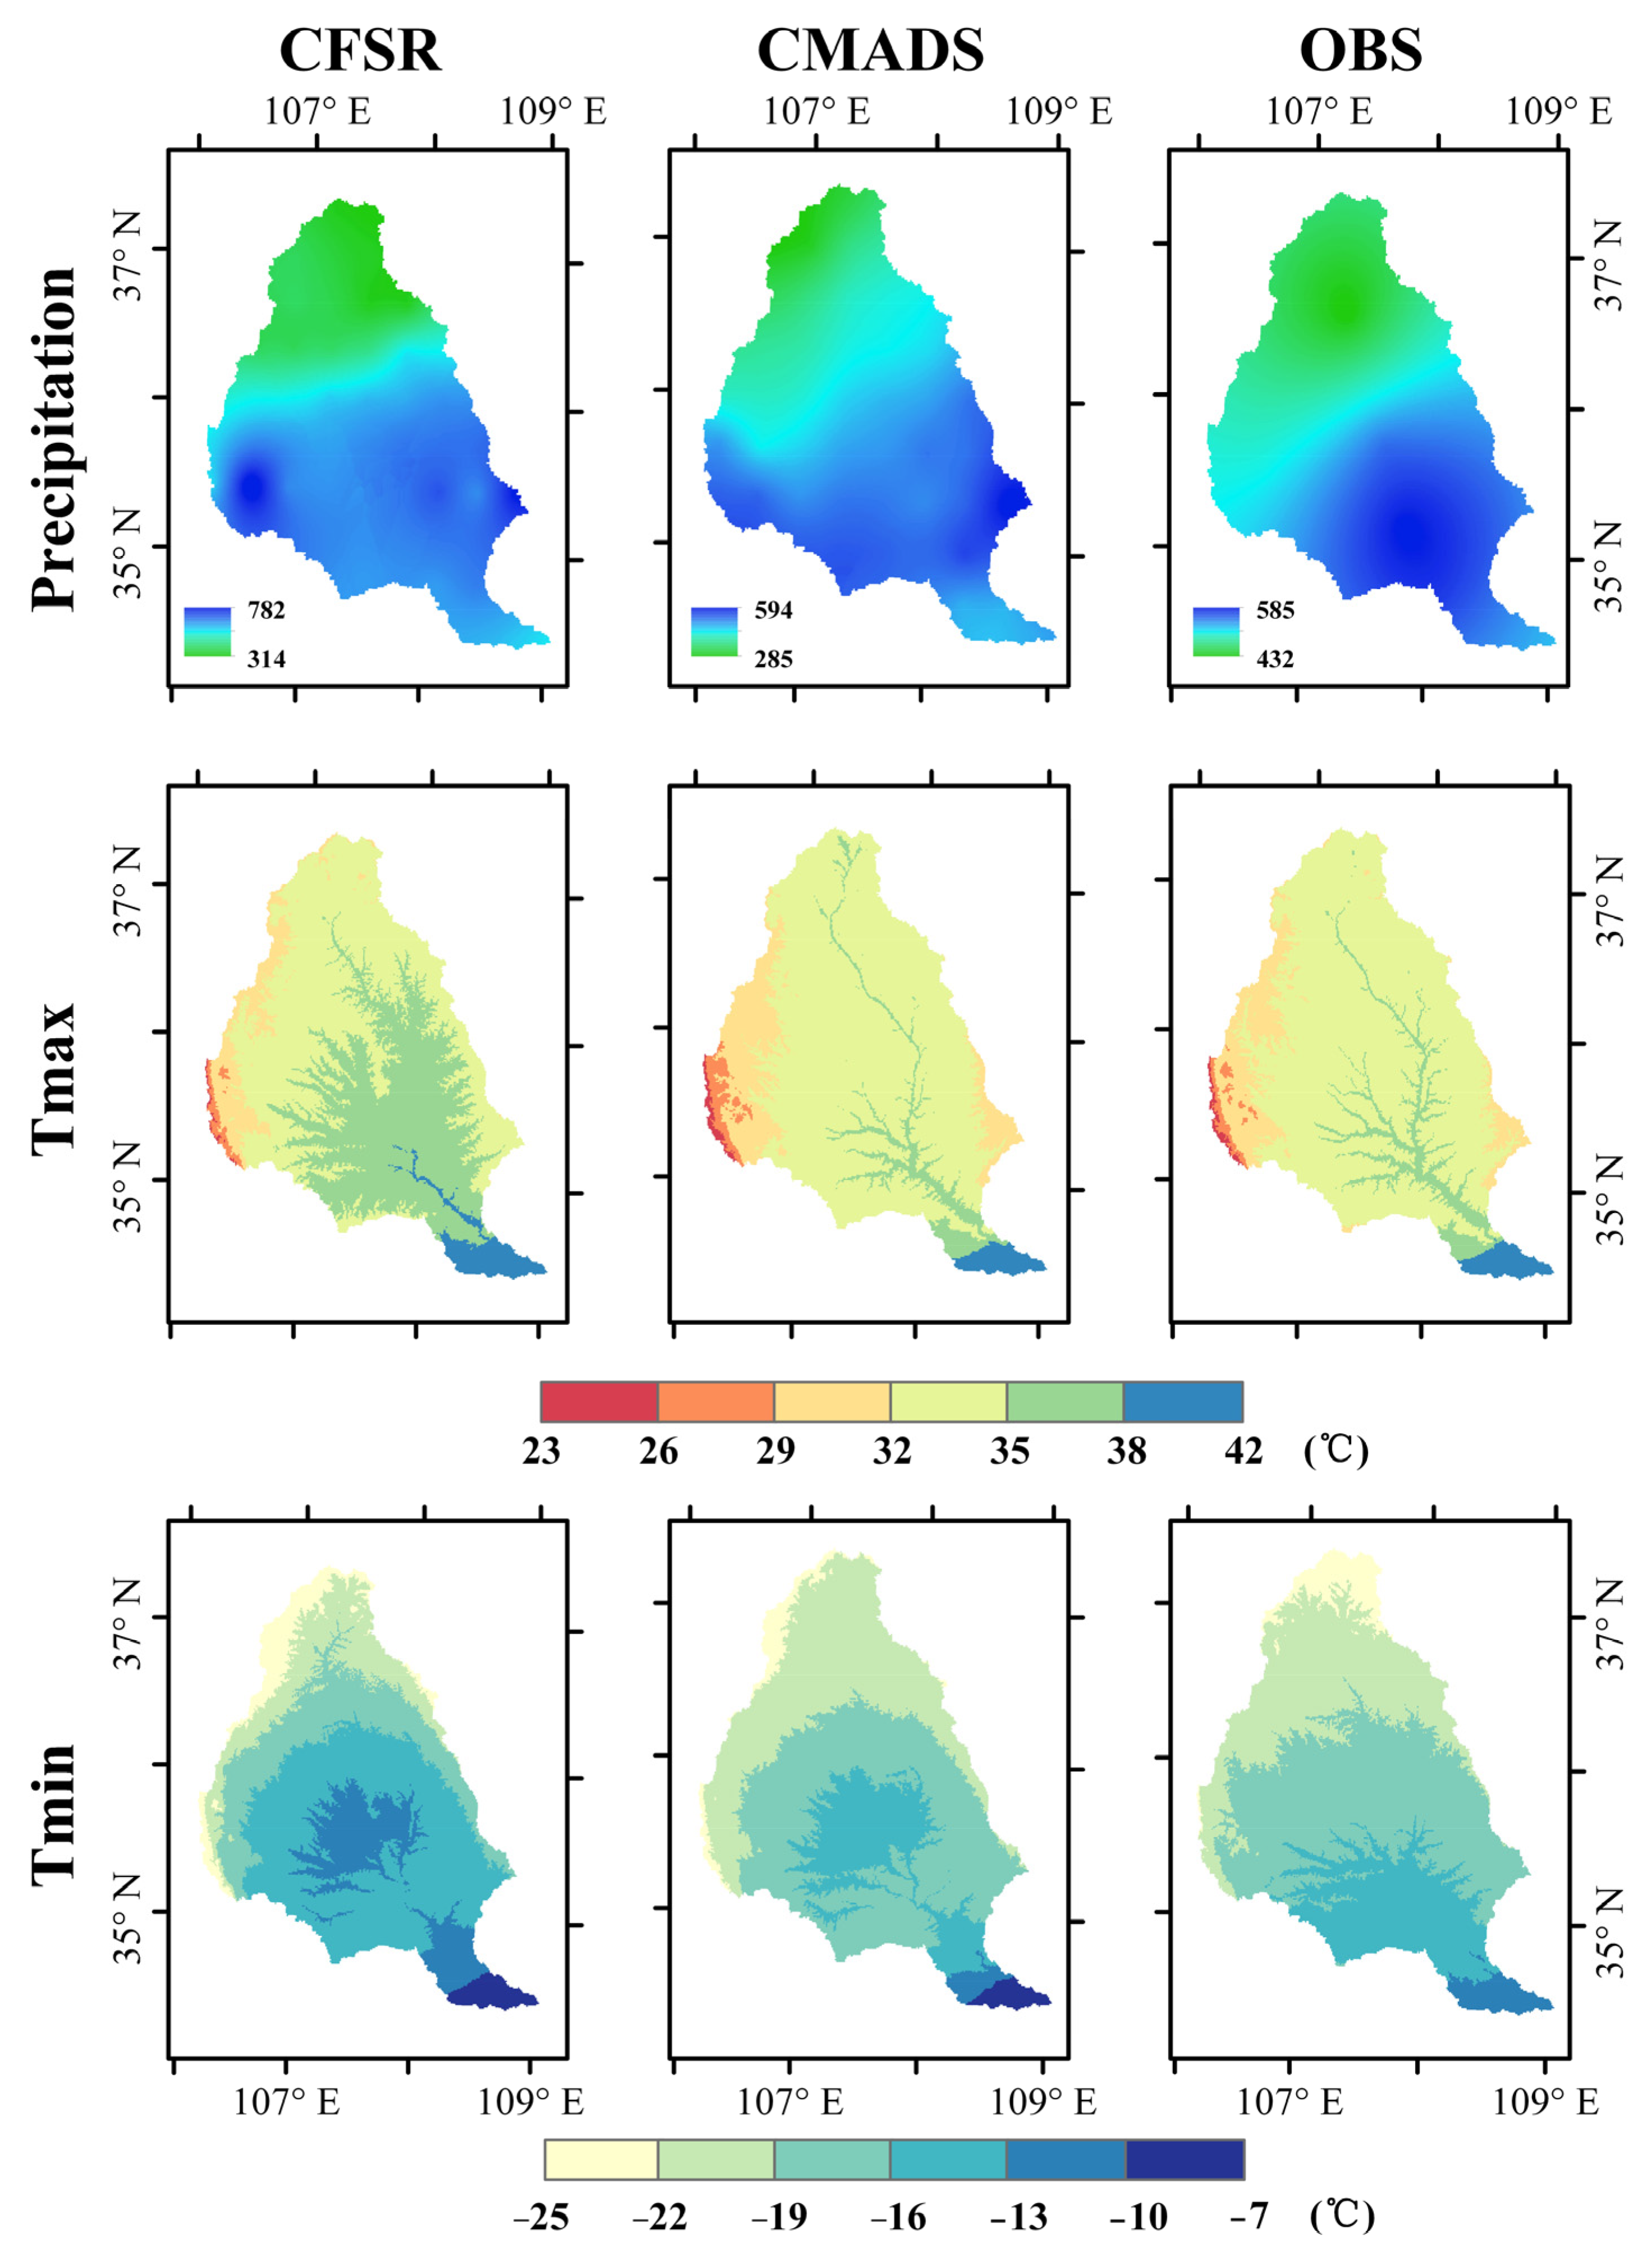
3.1.1. Spatial Distribution of Multi-Year Average Precipitation and Temperature
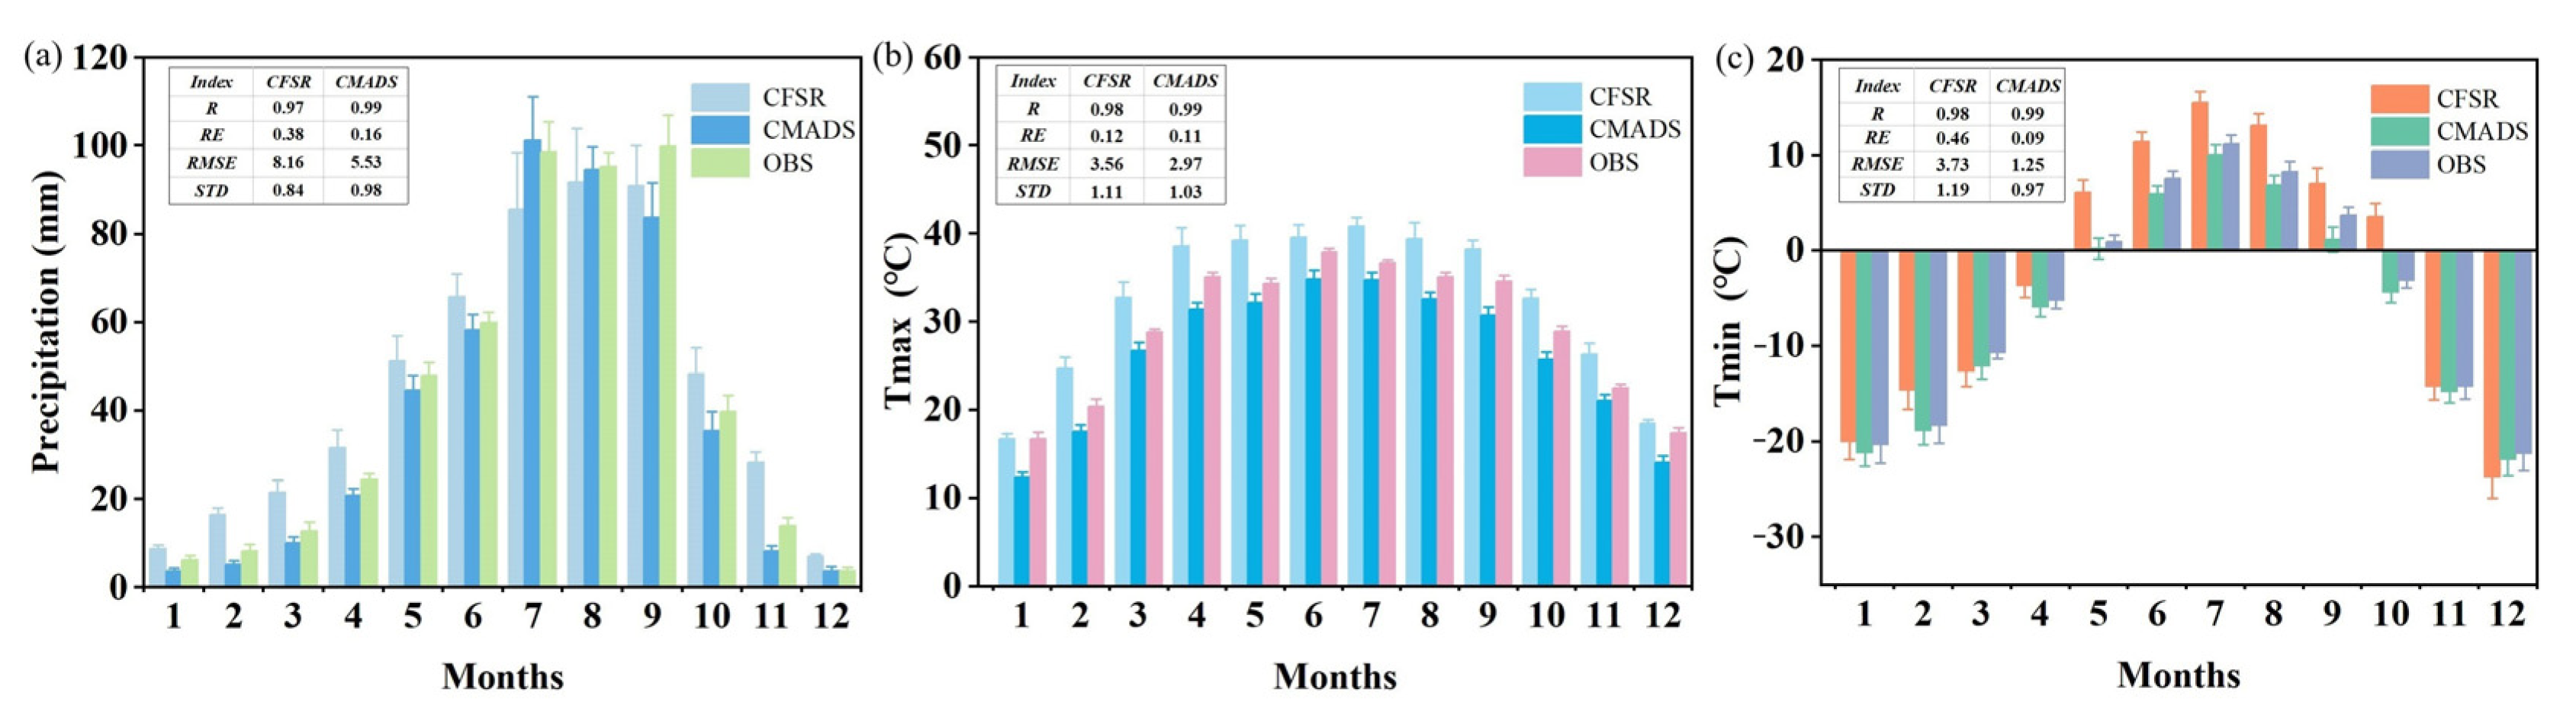
3.1.2. Intra-Annual Distribution of Precipitation and Temperature
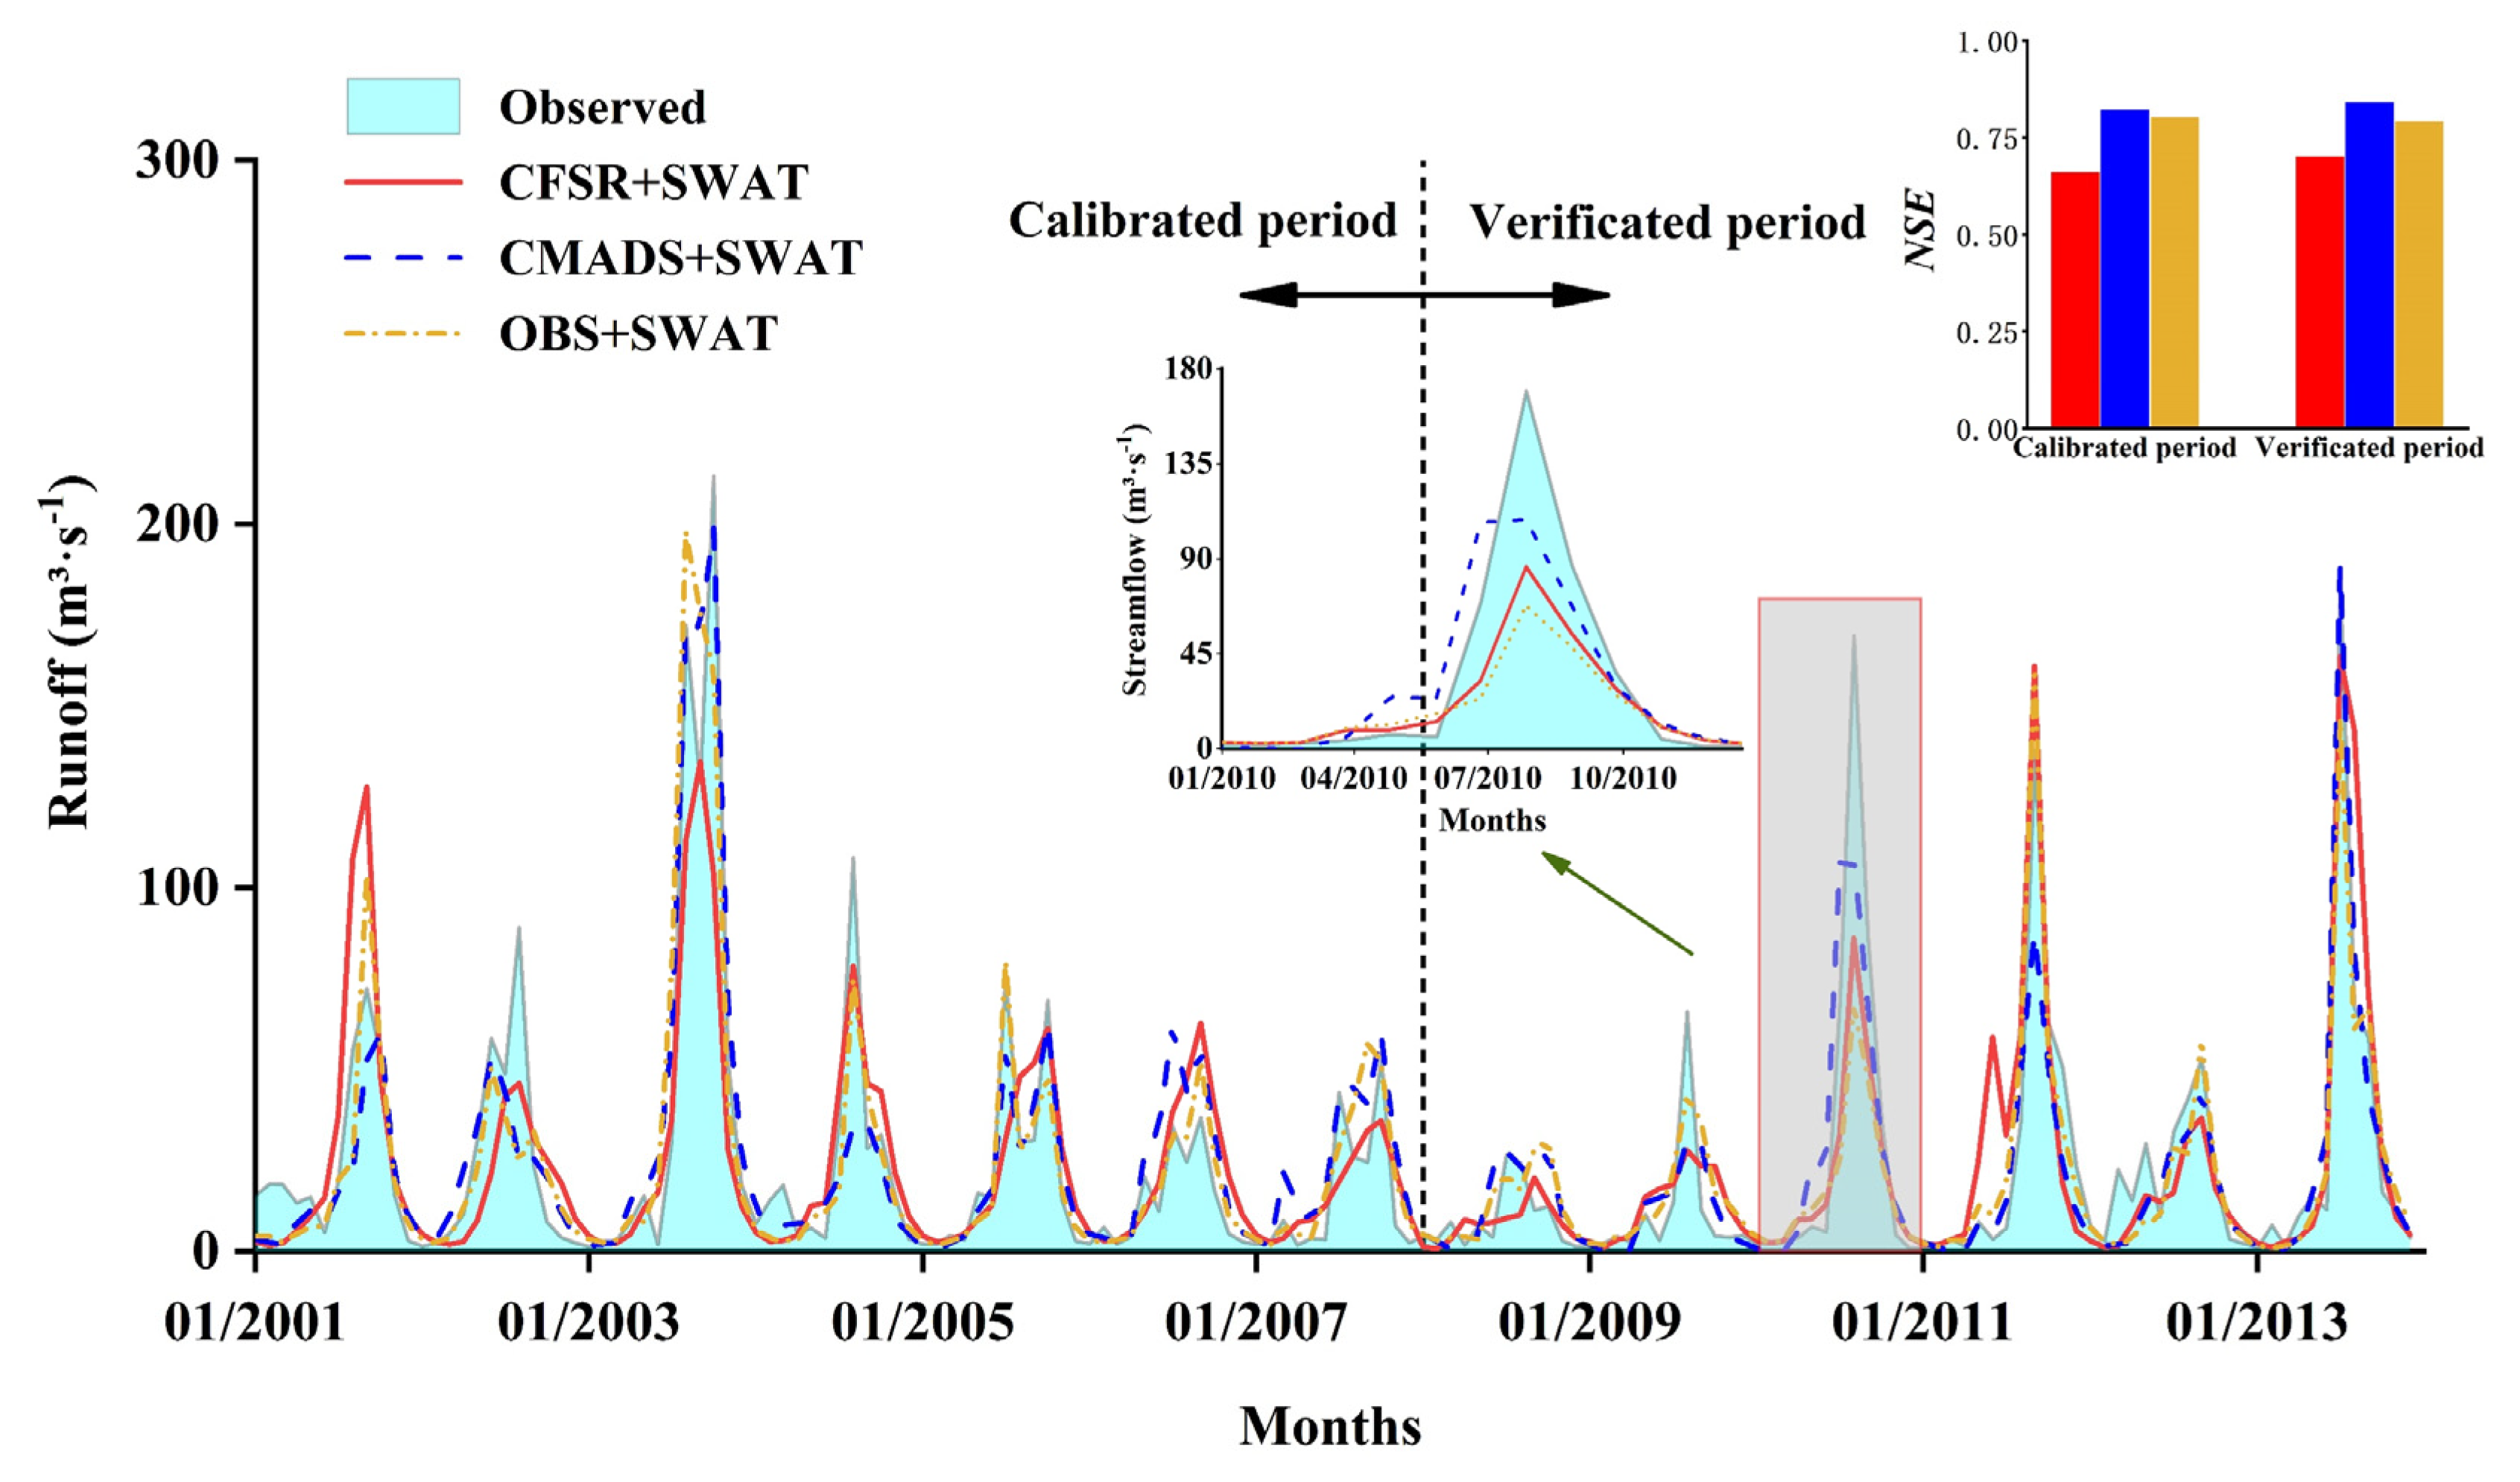
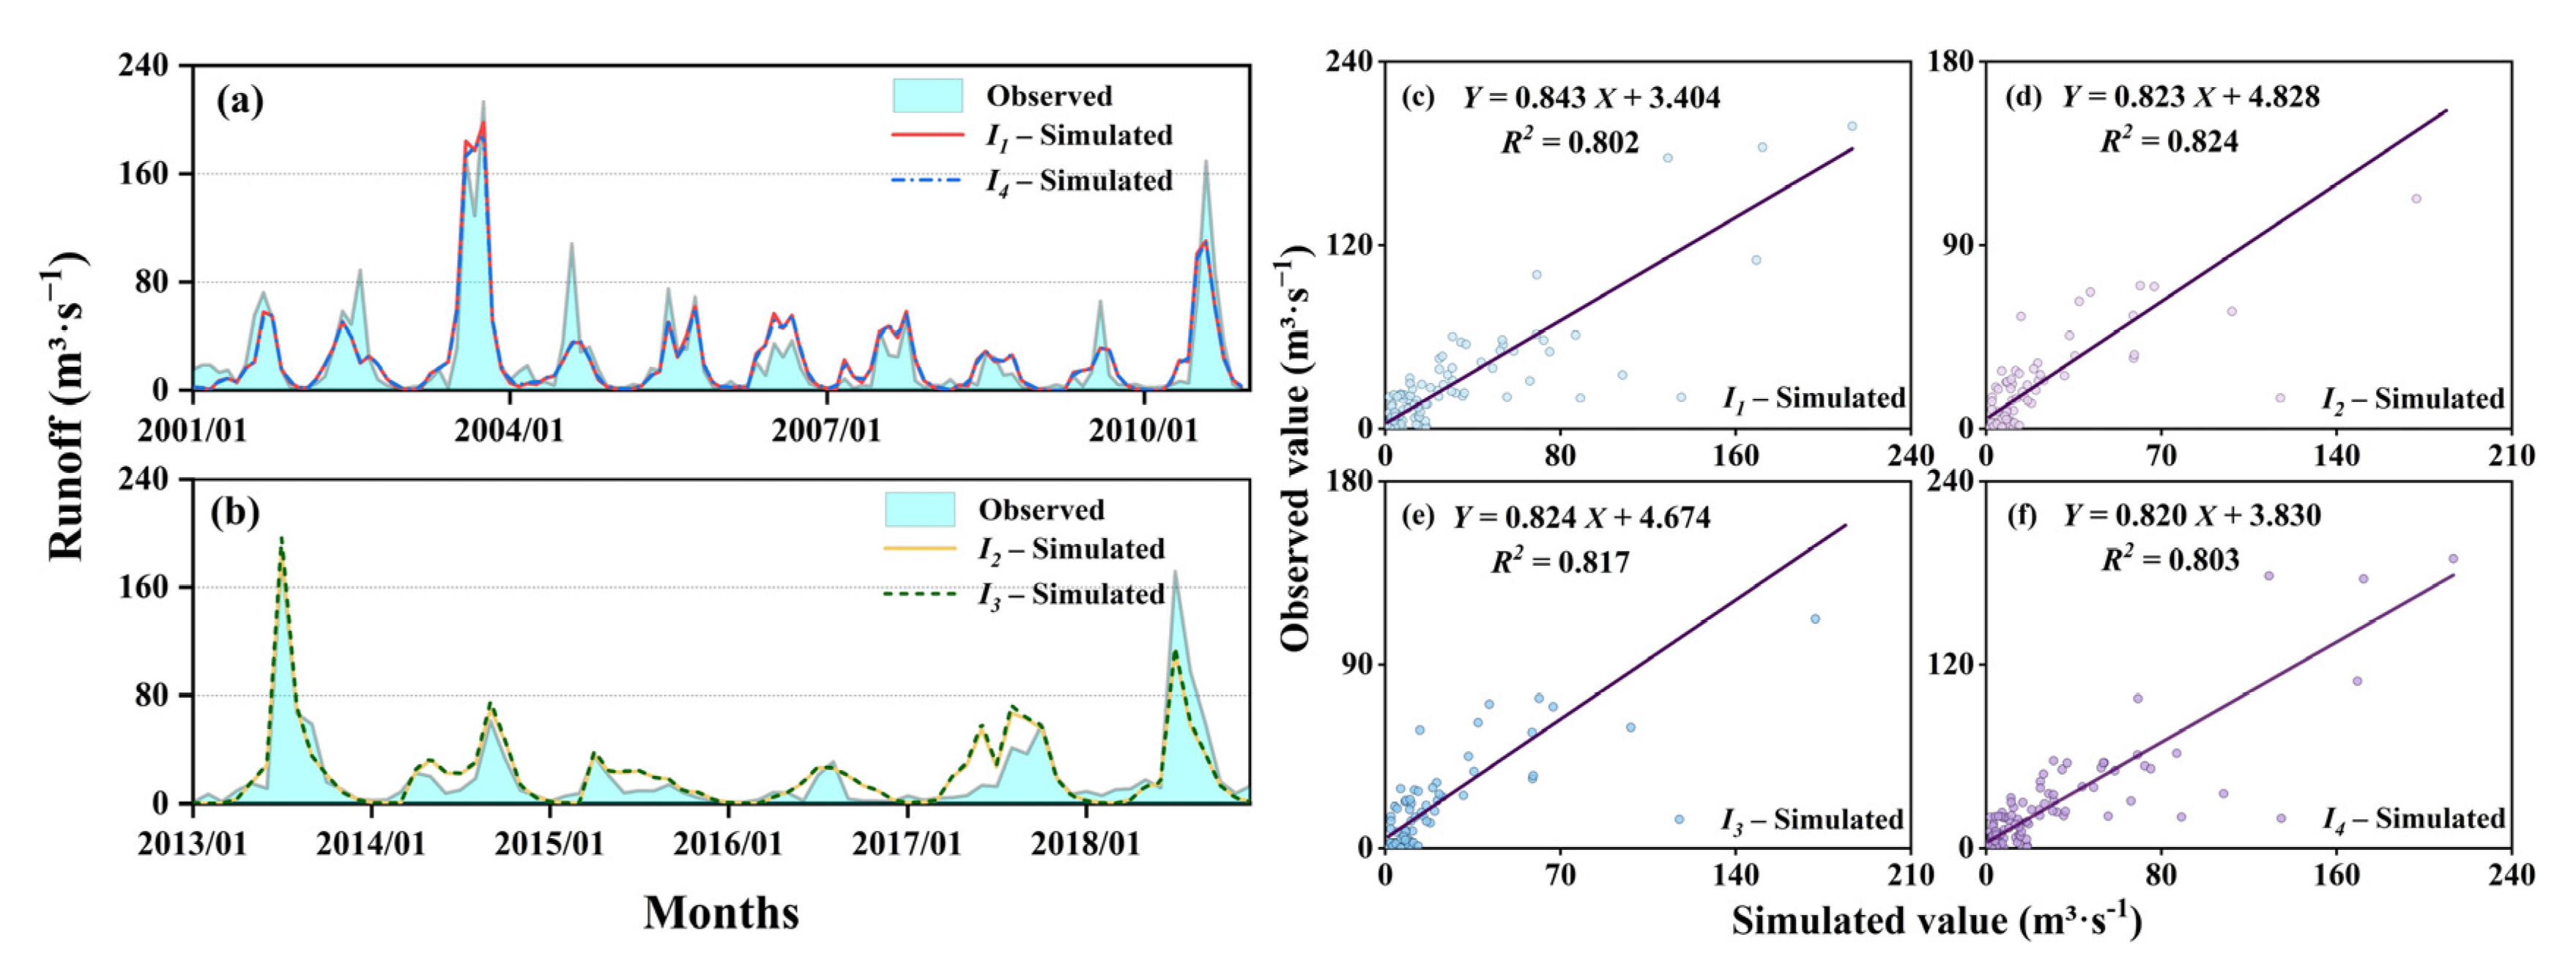
3.2. Effects of Runoff Simulation in SWAT Models Driven by Different Datasets
3.3. Impacts of Climate and Land-Use Change on Runoff
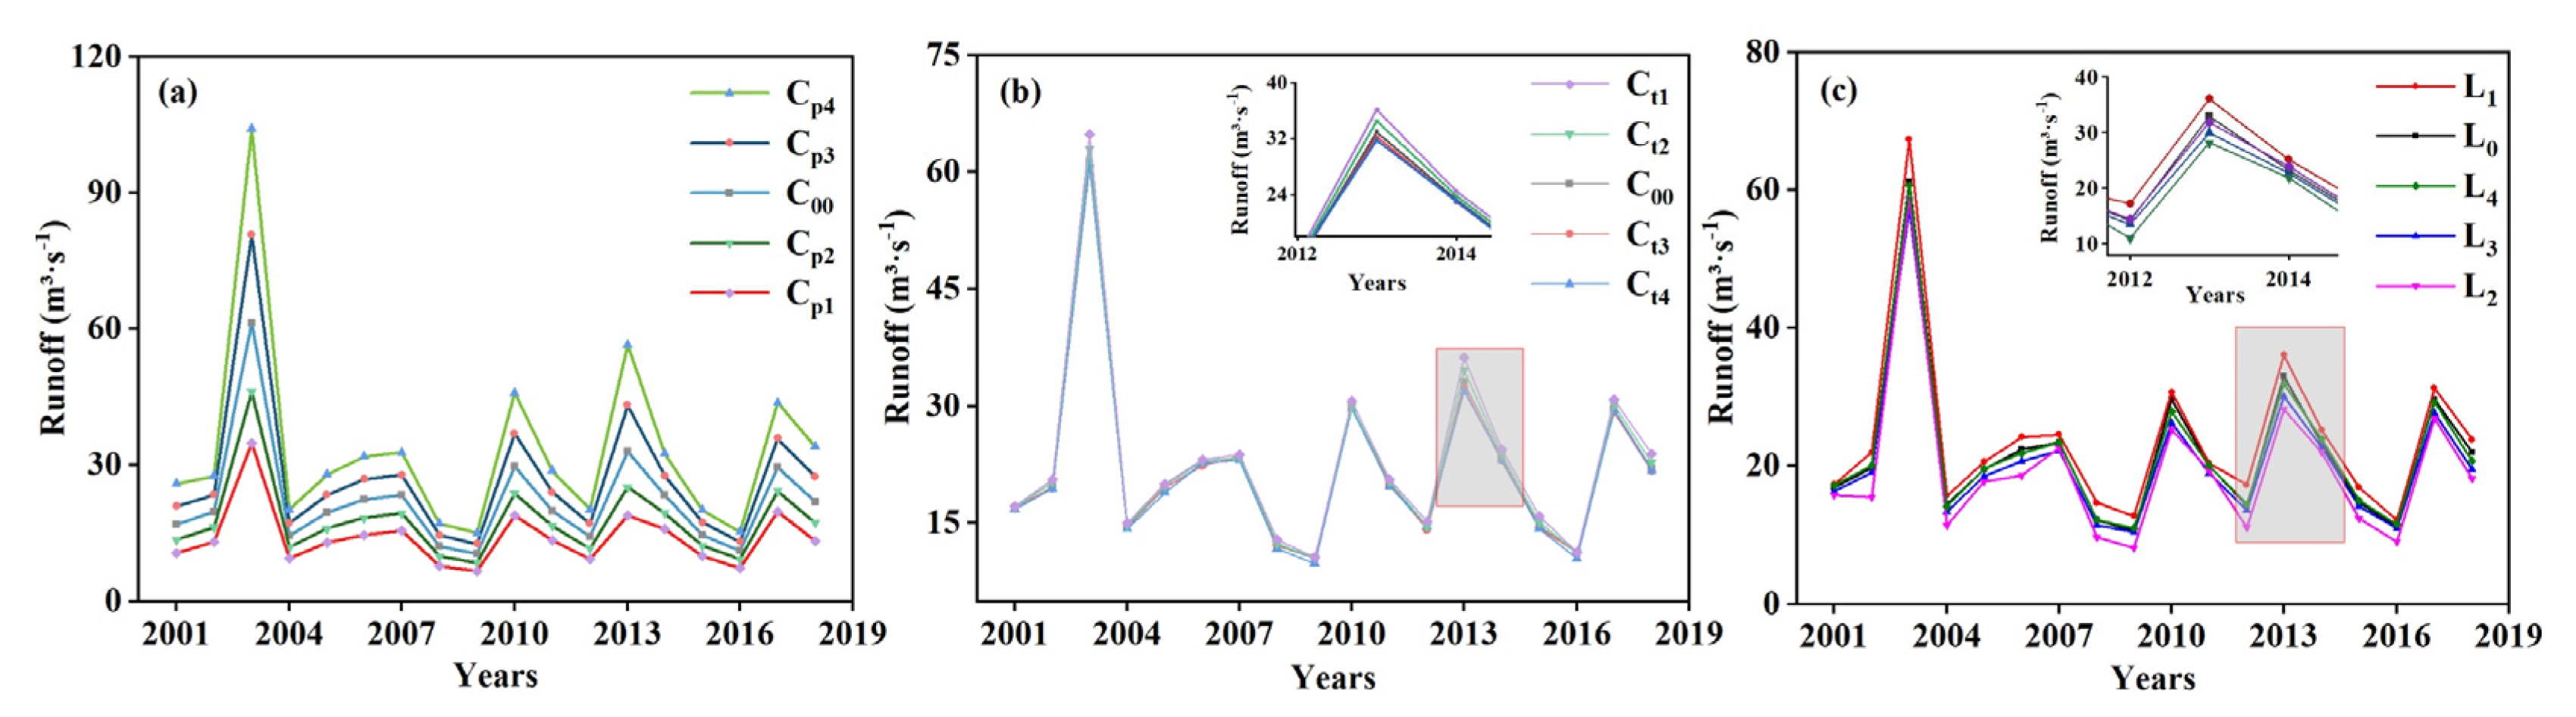
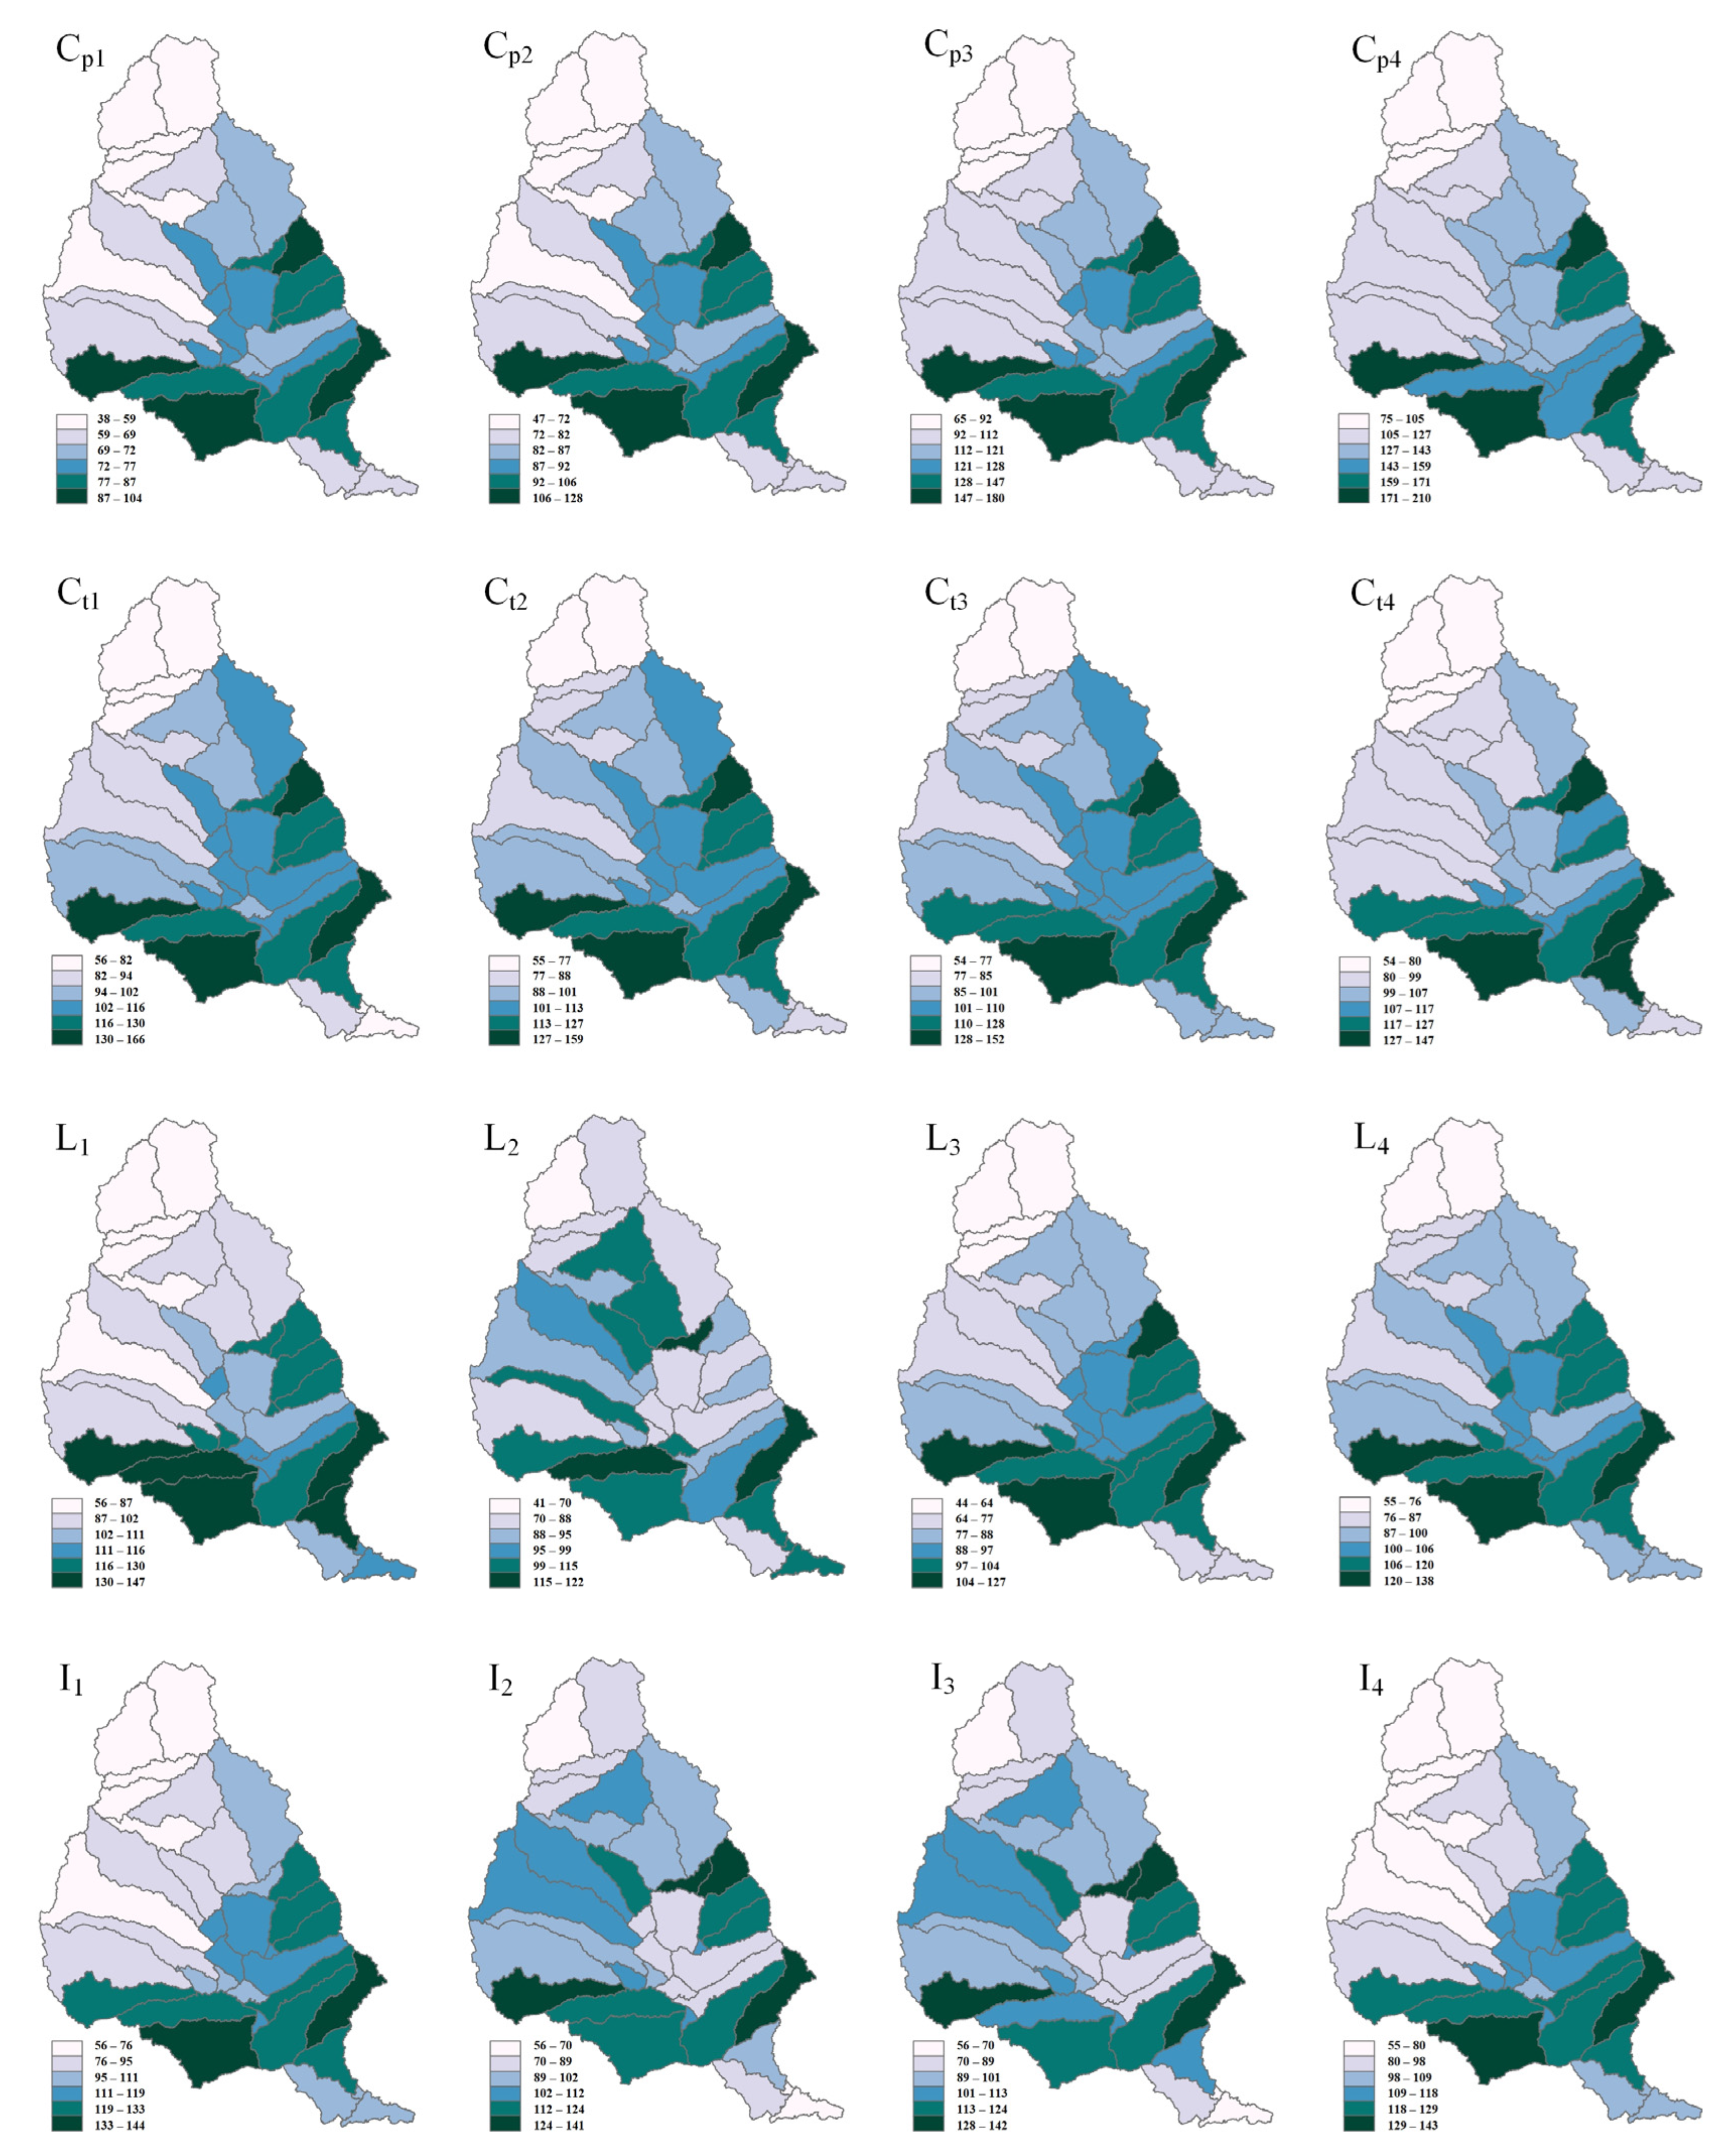
3.3.1. Climate Change Scenarios
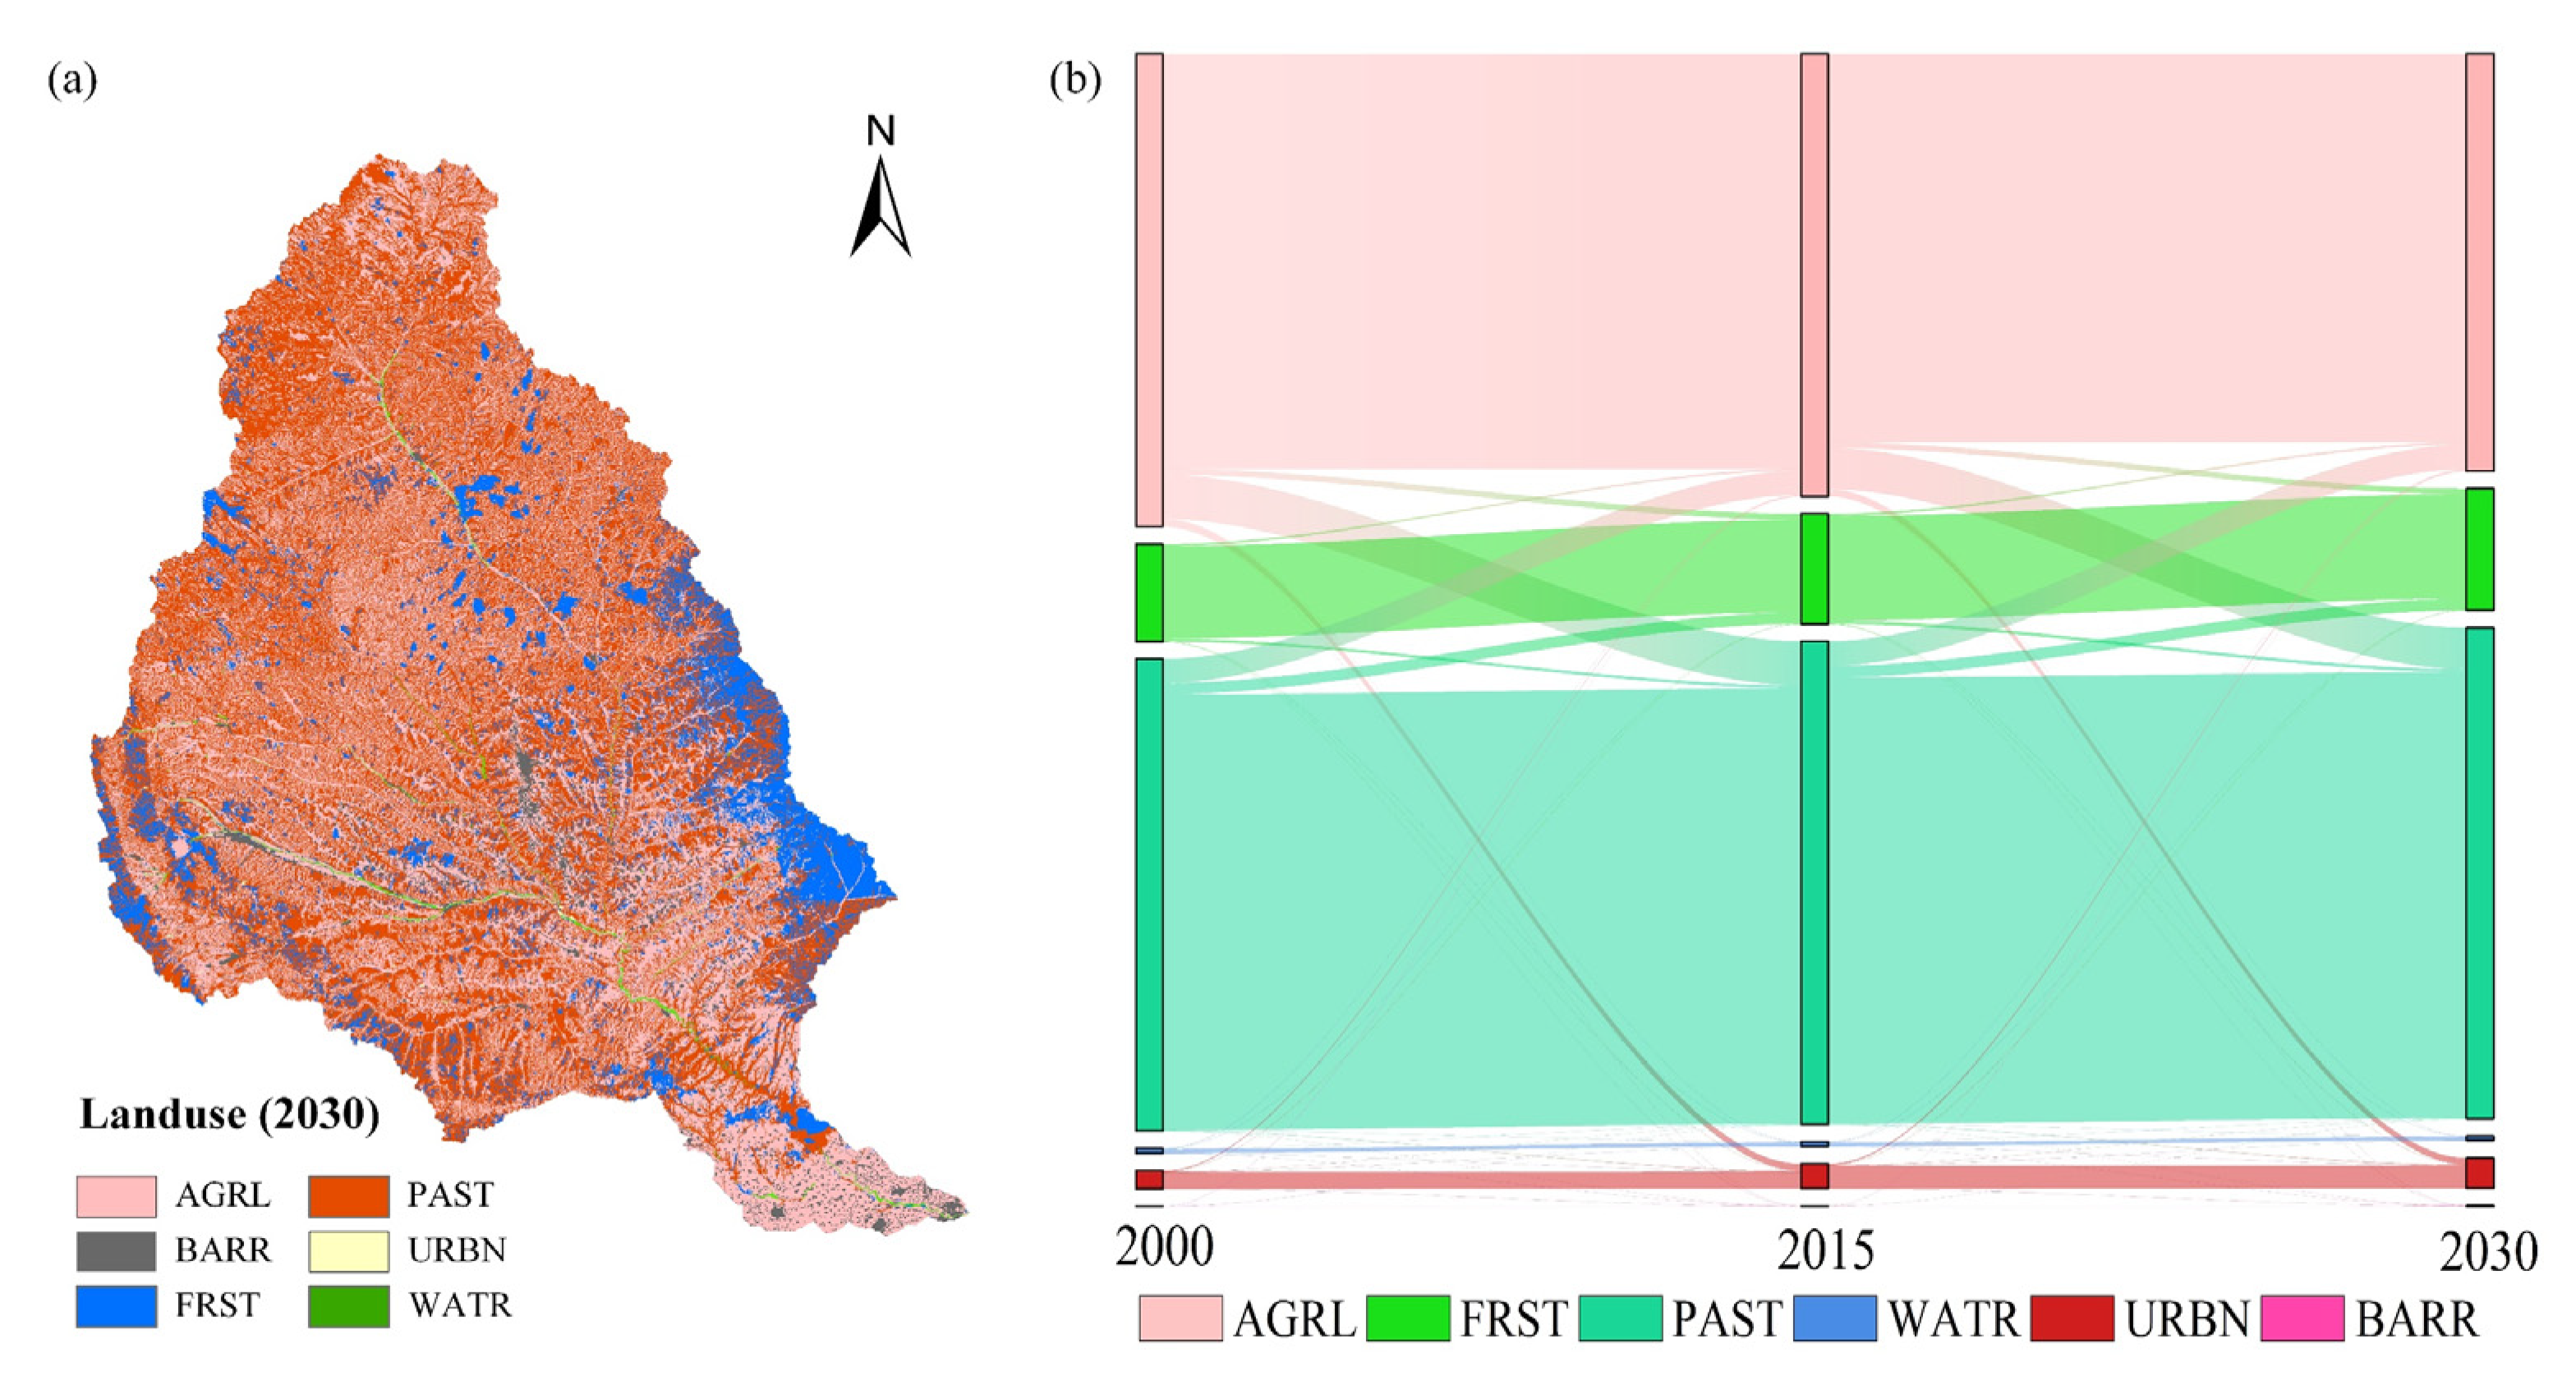
3.3.2. Land-Use Change Scenarios
3.3.3. Integrated Climate and Land-Use Change Scenarios
4. Discussion
4.1. Comparison and Evaluation of CMADS and CFSR Data in Runoff Modeling
4.2. Assessing Impacts of Climate and Land-Use Changes on Runoff Simulation
4.3. Limitations of This Study
5. Conclusions
Author Contributions
Funding
Data Availability Statement
Conflicts of Interest
References
- Mitiku, A.B.; Meresa, G.A.; Mulu, T.; Woldemichael, A.T. Examining the Impacts of Climate Variabilities and Land Use Change on Hydrological Responses of Awash River Basin, Ethiopia. HydroResearch 2023, 6, 16–28. [Google Scholar] [CrossRef]
- Shrestha, S.; Bhatta, B.; Talchabhadel, R.; Virdis, S.G.P. Integrated Assessment of the Landuse Change and Climate Change Impacts on the Sediment Yield in the Songkhram River Basin, Thailand. Catena 2022, 209, 105859. [Google Scholar] [CrossRef]
- Zhang, Y.; Xia, J.; Yu, J.; Randall, M.; Zhang, Y.; Zhao, T.; Pan, X.; Zhai, X.; Shao, Q. Simulation and Assessment of Urbanization Impacts on Runoff Metrics: Insights from Landuse Changes. J. Hydrol. 2018, 560, 247–258. [Google Scholar] [CrossRef]
- Wang, S.; Ding, Y.; Jiang, F.; Wu, X.; Xue, J. Identifying Hot Spots of Long-Duration Extreme Climate Events in the Northwest Arid Region of China and Implications for Glaciers and Runoff. Res. Cold Arid Reg. 2023, 16, 347–360. [Google Scholar] [CrossRef]
- Xue, P.; Zhang, C.; Wen, Z.; Park, E.; Jakada, H. Climate Variability Impacts on Runoff Projection under Quantile Mapping Bias Correction in the Support CMIP6: An Investigation in Lushi Basin of China. J. Hydrol. 2022, 614, 128550. [Google Scholar] [CrossRef]
- Zokaib, S.; Naser, G.H. A Study on Rainfall, Runoff, and Soil Loss Relations at Different Landuses—A Case in Hilkot Watershed in Pakistan. Int. J. Sediment Res. 2012, 27, 388–393. [Google Scholar] [CrossRef]
- Milly, P.C.D.; Dunne, K.A.; Vecchia, A.V. Global Pattern of Trends in Streamflow and Water Availability in a Changing Climate. Nature 2005, 438, 347–350. [Google Scholar] [CrossRef] [PubMed]
- Gray, L.C.; Zhao, L.; Stillwell, A.S. Impacts of Climate Change on Global Total and Urban Runoff. J. Hydrol. 2023, 620, 129352. [Google Scholar] [CrossRef]
- Li, Y.; Chen, A.; Mao, G.; Chen, P.; Huang, H.; Yang, H.; Wang, Z.; Wang, K.; Chen, H.; Meng, Y.; et al. Multi-Model Analysis of Historical Runoff Changes in the Lancang-Mekong River Basin—Characteristics and Uncertainties. J. Hydrol. 2023, 619, 129297. [Google Scholar] [CrossRef]
- Ni, Y.; Yu, Z.; Lv, X.; Qin, T.; Yan, D.; Zhang, Q.; Ma, L. Spatial Difference Analysis of the Runoff Evolution Attribution in the Yellow River Basin. J. Hydrol. 2022, 612, 128149. [Google Scholar] [CrossRef]
- Wu, L.; Yen, H.; Arnold, J.G.; Ma, X. Is the Correlation between Hydro-Environmental Variables Consistent with Their Own Time Variability Degrees in a Large-Scale Loessial Watershed? Sci. Total Environ. 2020, 722, 137737. [Google Scholar] [CrossRef] [PubMed]
- Zhao, G.; Tian, P.; Mu, X.; Jiao, J.; Wang, F.; Gao, P. Quantifying the Impact of Climate Variability and Human Activities on Streamflow in the Middle Reaches of the Yellow River Basin, China. J. Hydrol. 2014, 519, 387–398. [Google Scholar] [CrossRef]
- Wu, J.; Miao, C.; Zhang, X.; Yang, T.; Duan, Q. Detecting the Quantitative Hydrological Response to Changes in Climate and Human Activities. Sci. Total Environ. 2017, 586, 328–337. [Google Scholar] [CrossRef] [PubMed]
- Gao, X.; Yan, C.; Wang, Y.; Zhao, X.; Zhao, Y.; Sun, M.; Peng, S. Attribution Analysis of Climatic and Multiple Anthropogenic Causes of Runoff Change in the Loess Plateau—A Case-Study of the Jing River Basin. Land Degrad. Dev. 2020, 31, 1622–1640. [Google Scholar] [CrossRef]
- Sharifi, A.; Mirabbasi, R.; Ali Nasr-Esfahani, M.; Torabi Haghighi, A.; Fatahi Nafchi, R. Quantifying the Impacts of Anthropogenic Changes and Climate Variability on Runoff Changes in Central Plateau of Iran Using Nine Methods. J. Hydrol. 2021, 603, 127045. [Google Scholar] [CrossRef]
- Colucci, R.R.; Guglielmin, M. Precipitation–Temperature Changes and Evolution of a Small Glacier in the Southeastern European Alps during the Last 90 Years. Int. J. Climatol. 2015, 35, 2783–2797. [Google Scholar] [CrossRef]
- Faurès, J.-M.; Goodrich, D.C.; Woolhiser, D.A.; Sorooshian, S. Impact of Small-Scale Spatial Rainfall Variability on Runoff Modeling. J. Hydrol. 1995, 173, 309–326. [Google Scholar] [CrossRef]
- Golian, S.; Moazami, S.; Kirstetter, P.-E.; Hong, Y. Evaluating the Performance of Merged Multi-Satellite Precipitation Products over a Complex Terrain. Water Resour. Manag. 2015, 29, 4885–4901. [Google Scholar] [CrossRef]
- Wang, T.; Li, Z.; Ma, Z.; Gao, Z.; Tang, G. Diverging Identifications of Extreme Precipitation Events from Satellite Observations and Reanalysis Products: A Global Perspective Based on an Object-Tracking Method. Remote Sens. Environ. 2023, 288, 113490. [Google Scholar] [CrossRef]
- Germann, U.; Galli, G.; Boscacci, M.; Bolliger, M. Radar Precipitation Measurement in a Mountainous Region. Q. J. R. Meteorol. Soc. 2006, 132, 1669–1692. [Google Scholar] [CrossRef]
- Li, D.; Christakos, G.; Ding, X.; Wu, J. Adequacy of TRMM Satellite Rainfall Data in Driving the SWAT Modeling of Tiaoxi Catchment (Taihu Lake Basin, China). J. Hydrol. 2018, 556, 1139–1152. [Google Scholar] [CrossRef]
- Meng, X.; Zhang, X.; Yang, M.; Wang, H.; Chen, J.; Pan, Z.; Wu, Y. Application and Evaluation of the China Meteorological Assimilation Driving Datasets for the SWAT Model (CMADS) in Poorly Gauged Regions in Western China. Water 2019, 11, 2171. [Google Scholar] [CrossRef]
- Wang, N.; Liu, W.; Sun, F.; Yao, Z.; Wang, H.; Liu, W. Evaluating Satellite-Based and Reanalysis Precipitation Datasets with Gauge-Observed Data and Hydrological Modeling in the Xihe River Basin, China. Atmos. Res. 2020, 234, 104746. [Google Scholar] [CrossRef]
- Ma, D.; Xu, Y.-P.; Gu, H.; Zhu, Q.; Sun, Z.; Xuan, W. Role of Satellite and Reanalysis Precipitation Products in Streamflow and Sediment Modeling over a Typical Alpine and Gorge Region in Southwest China. Sci. Total Environ. 2019, 685, 934–950. [Google Scholar] [CrossRef]
- Tan, M.L.; Gassman, P.W.; Liang, J.; Haywood, J.M. A Review of Alternative Climate Products for SWAT Modelling: Sources, Assessment and Future Directions. Sci. Total Environ. 2021, 795, 148915. [Google Scholar] [CrossRef]
- Worqlul, A.W.; Yen, H.; Collick, A.S.; Tilahun, S.A.; Langan, S.; Steenhuis, T.S. Evaluation of CFSR, TMPA 3B42 and Ground-Based Rainfall Data as Input for Hydrological Models, in Data-Scarce Regions: The Upper Blue Nile Basin, Ethiopia. Catena 2017, 152, 242–251. [Google Scholar] [CrossRef]
- Yu, Z.; Wu, J.; Chen, X. An Approach to Revising the Climate Forecast System Reanalysis Rainfall Data in a Sparsely-Gauged Mountain Basin. Atmos. Res. 2019, 220, 194–205. [Google Scholar] [CrossRef]
- Bai, J.; Zhou, Z.; Li, J.; Liu, T.; Zhu, Q.; Zheng, T. Predicting Soil Conservation Service in the Jinghe River Basin under Climate Change. J. Hydrol. 2022, 615, 128646. [Google Scholar] [CrossRef]
- Liu, S.; Huang, S.; Xie, Y.; Leng, G.; Huang, Q.; Wang, L.; Xue, Q. Spatial-Temporal Changes of Rainfall Erosivity in the Loess Plateau, China: Changing Patterns, Causes and Implications. Catena 2018, 166, 279–289. [Google Scholar] [CrossRef]
- Jin, F.; Yang, W.; Fu, J.; Li, Z. Effects of Vegetation and Climate on the Changes of Soil Erosion in the Loess Plateau of China. Sci. Total Environ. 2021, 773, 145514. [Google Scholar] [CrossRef]
- Wang, B.; Wang, C.; Jia, B.; Fu, X. Spatial Variation of Event-Based Suspended Sediment Dynamics in the Middle Yellow River Basin, China. Geomorphology 2022, 401, 108115. [Google Scholar] [CrossRef]
- Yan, X.; Sun, J.; Huang, Y.; Xia, Y.; Wang, Z.; Li, Z. Detecting and Attributing the Changes in Baseflow in China’s Loess Plateau. J. Hydrol. 2023, 617, 128957. [Google Scholar] [CrossRef]
- Zheng, H.; Miao, C.; Zhang, G.; Li, X.; Wang, S.; Wu, J.; Gou, J. Is the Runoff Coefficient Increasing or Decreasing after Ecological Restoration on China’s Loess Plateau? Int. Soil Water Conserv. Res. 2021, 9, 333–343. [Google Scholar] [CrossRef]
- Li, Z.; Wang, Y.; Zhang, H.; Chang, J.; Yu, Y. Runoff Response to Changing Environment in Loess Plateau, China: Implications of the Influence of Climate, Land Use/Land Cover, and Water Withdrawal Changes. J. Hydrol. 2022, 613, 128458. [Google Scholar] [CrossRef]
- Hutchinson, M.F.; McKenney, D.W.; Lawrence, K.; Pedlar, J.H.; Hopkinson, R.F.; Milewska, E.; Papadopol, P. Development and Testing of Canada-Wide Interpolated Spatial Models of Daily Minimum–Maximum Temperature and Precipitation for 1961–2003. J. Appl. Meteorol. Climatol. 2009, 48, 725–741. [Google Scholar] [CrossRef]
- Hutchinson, M.F.; Gessler, P. Splines-More Than Just a Smooth Interpolator. Geoderma 1994, 62, 45–67. [Google Scholar] [CrossRef]
- Liang, X.; Guan, Q.; Clarke, K.C.; Liu, S.; Wang, B.; Yao, Y. Understanding the Drivers of Sustainable Land Expansion Using a Patch-Generating Land Use Simulation (PLUS) Model: A Case Study in Wuhan, China. Comput. Environ. Urban Syst. 2021, 85, 101569. [Google Scholar] [CrossRef]
- Abbaspour, K.C.; Rouholahnejad, E.; Vaghefi, S.; Srinivasan, R.; Yang, H.; Kløve, B. A Continental-Scale Hydrology and Water Quality Model for Europe: Calibration and Uncertainty of a High-Resolution Large-Scale SWAT Model. J. Hydrol. 2015, 524, 733–752. [Google Scholar] [CrossRef]
- Moriasi, D.; Arnold, J.; Van Liew, M.; Bingner, R.; Harmel, R.D.; Veith, T. Model Evaluation Guidelines for Systematic Quantification of Accuracy in Watershed Simulations. Trans. ASABE 2007, 50, 885–900. [Google Scholar] [CrossRef]
- Ning, T.; Li, Z.; Liu, W. Separating the Impacts of Climate Change and Land Surface Alteration on Runoff Reduction in the Jing River Catchment of China. Catena 2016, 147, 80–86. [Google Scholar] [CrossRef]
- Zhao, X.; Fang, K.; Chen, F.; Martín, H.; Roig, F.A. Reconstructed Jing River Streamflow from Western China: A 399-Year Perspective for Hydrological Changes in the Loess Plateau. J. Hydrol. 2023, 621, 129573. [Google Scholar] [CrossRef]
- Knoche, M.; Fischer, C.; Pohl, E.; Krause, P.; Merz, R. Combined Uncertainty of Hydrological Model Complexity and Satellite-Based Forcing Data Evaluated in Two Data-Scarce Semi-Arid Catchments in Ethiopia. J. Hydrol. 2014, 519, 2049–2066. [Google Scholar] [CrossRef]
- Shaowei, N.; Jie, W.; Juliang, J.; Xiaoyan, X.; Yuliang, Z.; Fan, S.; Linlin, Z. Comprehensive Evaluation of Satellite-Derived Precipitation Products Considering Spatial Distribution Difference of Daily Precipitation over Eastern China. J. Hydrol. Reg. Stud. 2022, 44, 101242. [Google Scholar] [CrossRef]
- Weinman, J.A.; Guetter, P.J. Determination of Rainfall Distributions from Microwave Radiation Measured by the Nimbus 6 ESMR. J. Appl. Meteorol. Climatol. 1977, 16, 437–442. [Google Scholar] [CrossRef]
- Lyu, J.; Yin, S.; Sun, Y.; Wang, K.; Luo, P.; Meng, X. Flood Runoff Simulation under Changing Environment, Based on Multiple Satellite Data in the Jinghe River Basin of the Loess Plateau, China. Remote Sens. 2023, 15, 550. [Google Scholar] [CrossRef]
- Ajaaj, A.; Mishra, A.; Khan, A. Evaluation of Satellite and Gauge-Based Precipitation Products through Hydrologic Simulation in Tigris River Basin under Data-Scarce Environment. J. Hydrol. Eng. 2019, 24, 05018033. [Google Scholar] [CrossRef]
- Lv, A.; Qi, S.; Wang, G. Multi-Model Driven by Diverse Precipitation Datasets Increases Confidence in Identifying Dominant Factors for Runoff Change in a Subbasin of the Qaidam Basin of China. Sci. Total Environ. 2022, 802, 149831. [Google Scholar] [CrossRef]
- Wang, Z.; Xu, M.; Liu, X.; Singh, D.K.; Fu, X. Quantifying the Impact of Climate Change and Anthropogenic Activities on Runoff and Sediment Load Reduction in a Typical Loess Plateau Watershed. J. Hydrol. Reg. Stud. 2022, 39, 100992. [Google Scholar] [CrossRef]
- Yang, L.; Zhao, G.; Tian, P.; Mu, X.; Tian, X.; Feng, J.; Bai, Y. Runoff Changes in the Major River Basins of China and Their Responses to Potential Driving Forces. J. Hydrol. 2022, 607, 127536. [Google Scholar] [CrossRef]
- Wu, L.; Liu, X.; Yang, Z.; Yu, Y.; Ma, X. Is Climate Dominating the Spatiotemporal Patterns of Water Yield? Water Resour. Manag. 2022, 37, 321–339. [Google Scholar] [CrossRef]
- Eini, M.R.; Rahmati, A.; Piniewski, M. Hydrological Application and Accuracy Evaluation of PERSIANN Satellite-Based Precipitation Estimates over a Humid Continental Climate Catchment. J. Hydrol. Reg. Stud. 2022, 41, 101109. [Google Scholar] [CrossRef]
- Wei, C.; Dong, X.; Ma, Y.; Gou, J.; Li, L.; Bo, H.; Yu, D.; Su, B. Applicability Comparison of Various Precipitation Products of Long-Term Hydrological Simulations and Their Impact on Parameter Sensitivity. J. Hydrol. 2023, 618, 129187. [Google Scholar] [CrossRef]
- Dash, S.S.; Sahoo, B.; Raghuwanshi, N.S. How Reliable Are the Evapotranspiration Estimates by Soil and Water Assessment Tool (SWAT) and Variable Infiltration Capacity (VIC) Models for Catchment-Scale Drought Assessment and Irrigation Planning? J. Hydrol. 2021, 592, 125838. [Google Scholar] [CrossRef]
- Jeyrani, F.; Morid, S.; Srinivasan, R. Assessing Basin Blue–Green Available Water Components under Different Management and Climate Scenarios Using SWAT. Agric. Water Manag. 2021, 256, 107074. [Google Scholar] [CrossRef]
- Song, Y.H.; Chung, E.-S.; Shahid, S. Differences in Extremes and Uncertainties in Future Runoff Simulations Using SWAT and LSTM for SSP Scenarios. Sci. Total Environ. 2022, 838, 156162. [Google Scholar] [CrossRef]
- Sun, G.; Wei, X.; Hao, L.; Sanchis, M.G.; Hou, Y.; Yousefpour, R.; Tang, R.; Zhang, Z. Forest Hydrology Modeling Tools for Watershed Management: A Review. For. Ecol. Manag. 2023, 530, 120755. [Google Scholar] [CrossRef]
- Faye, B.; Webber, H.; Gaiser, T.; Müller, C.; Zhang, Y.; Stella, T.; Latka, C.; Reckling, M.; Heckelei, T.; Helming, K.; et al. Climate Change Impacts on European Arable Crop Yields: Sensitivity to Assumptions about Rotations and Residue Management. Eur. J. Agron. 2023, 142, 126670. [Google Scholar] [CrossRef]

| Data Type | CFSR | CMADS | OBS |
|---|---|---|---|
| Elements | (i). Daily maximum/minimum temperature; (ii). Daily accumulative precipitation; (iii). Daily accumulative solar radiation; (iv). Daily average wind speed; (v). Daily average relative humidity. | ||
| Data spatial range of this study | 34.19°~37.63° N, 105.94°~109.02° E | 34.66°~37.33° N, 106.33°~108.66° E | 34.46°~37.19° N, 106.20°~108.42° E |
| Data time range of this study | 1 January 1999~31 December 2013 (daily) | 1 January 1999~31 December 2018 (daily) | 1 January 1999~31 December 2013 (daily) |
| Resolution ratio of this study | 0.313° | 0.333° | – |
| No. of stations applied by SWAT model | 132 | 41 | 5 |
| Download URL | https://swat.tamu.edu/data/cfsr (accessed on 15 March 2022) | http://www.cmads.org (accessed on 7 March 2022) | https://data.cma.cn (accessed on 12 January 2022) |
| Parameter | Range | Final Value | ||
|---|---|---|---|---|
| CFSR+SWAT | CMADS+SWAT | OBS+SWAT | ||
| TRNSRCH.bsn | 0–1 | 0.590 | 0.283 | 0.460 |
| TIMP.bsn | 0–1 | 0.855 | 0.598 | 0.782 |
| SMFMX.bsn | 0–20 | 10.005 | 7.814 | 17.493 |
| SURLAG.bsn | 0.05–24 | 16.876 | 12.463 | 15.552 |
| SMFMN.bsn | 0–20 | 11.940 | 18.300 | 19.084 |
| GWQMN.gw | 0–5000 | 2033.749 | 242.643 | 1127.715 |
| GW_DELAY.gw | 0–500 | 211.570 | 43.784 | 484.343 |
| RCHRG_DP.gw | 0–1 | 0.352 | 0.379 | 0.370 |
| ALPHA_BF.gw | 0–1 | 0.969 | 0.733 | 0.346 |
| GW_REVAP.gw | 0.02–0.2 | 0.036 | 0.148 | 0.105 |
| LAT_TTIME.hru | 0–180 | 7.313 | 28.178 | 30.277 |
| EPCO.hru | 0–1 | 0.777 | 0.815 | 1.000 |
| SLSOIL.hru | 0–150 | 1.435 | 3.649 | 0.148 |
| OV_N.hru | 0.01–30 | 37.824 | 6.814 | 4.892 |
| ESCO.hru | 0–1 | 0.206 | 0.175 | 0.063 |
| CN2.mgt | 35–98 | 93.783 | 77.171 | 81.117 |
| CH_K2.rte | 0.01–500 | 16.728 | 26.281 | 25.839 |
| CH_N2.rte | 0.01–0.3 | 0.024 | 0.065 | 0.029 |
| ALPHA_BNK.rte | 0–1 | 0.072 | 1.192 | 0.573 |
| SOL_AWC().sol | 0–1 | 0.577 | 0.666 | 0.662 |
| SOL_K().sol | 0–2000 | 735.605 | 741.229 | 902.798 |
| TLAPS.sub | 0–10 | 7.468 | 3.547 | 2.235 |
| Index Name | Formula | Value Range | Optimal Value |
|---|---|---|---|
| Correlation Coefficient, R | [−1, 1] | 1 | |
| Relative Error, RE | [0, +∞] | 0 | |
| Root Mean Square Error, RMSE | [-∞, +∞] | 0 | |
| Standard deviation ratio, STD | [0, 1] | 1 | |
| Nash-Sutcliffe efficiency, NSE | [0, 1] | 1 | |
| Coefficient of determination, R2 | [0, 1] | 1 | |
| Ratio of the root mean square error to the standard deviation of observed data, RSR | [0, 1] | 0 | |
| Percent bias, PBIS | [0, 1] | 0 |
| Climate change | Scenario | C00 | Cp/t1 | Cp/t2 | Cp/t3 | Cp/t4 |
| Precipitation | 0 | −20% | −10% | +10% | +20% | |
| Temperature | 0 | −2 °C | −1 °C | +1 °C | +2 °C | |
| Land-use change (km2) | Scenario | L0 | L1 | L2 | L3 | L4 |
| AGRL | 20,164.2 | 44,438.4 | — | — | 17,800.3 | |
| FRST | 4160.9 | — | 44,438.4 | — | 5189.2 | |
| PAST | 20,111.8 | — | — | 44,438.4 | 20,925.4 | |
| WATR | 203.5 | 203.5 | 203.5 | 203.5 | 181.4 | |
| URBN | 779.1 | 779.1 | 779.1 | 779.1 | 1297.4 | |
| BARR | 1.5 | — | — | — | 27.2 | |
| Integrated change | Scenario | Land-use data | Meteorological data | |||
| I1 | 2000 | 1999–2010 | ||||
| I2 | 2015 | 2011–2018 | ||||
| I3 | 2000 | 2011–2018 | ||||
| I4 | 2015 | 1999–2010 | ||||
| Type | Scenario | Mean Annual Runoff | Runoff Change Rate | |||
|---|---|---|---|---|---|---|
| Precipitation change | Cp4 | 33.29 | 50.62% | |||
| Cp3 | 27.24 | 23.22% | ||||
| C00 | 22.10 | — | ||||
| Cp2 | 17.77 | −19.59% | ||||
| Cp1 | 14.03 | −36.50% | ||||
| Temperature change | Ct4 | 21.82 | −1.27% | |||
| Ct3 | 22.03 | −0.34% | ||||
| C00 | 22.10 | — | ||||
| Ct2 | 22.60 | 2.27% | ||||
| Ct1 | 23.17 | 4.83% | ||||
| Land-use change | L0 | 22.10 | — | |||
| L1 | 24.04 | 8.78% | ||||
| L2 | 19.46 | −11.95% | ||||
| L3 | 20.71 | −6.29% | ||||
| L4 | 21.92 | −0.81% | ||||
| Integrated change | Scenario | Mean annual | Effects of | Effects of | ||
| Precipitation | Temperature | Runoff | Land-use | climate | ||
| I1 | 488.51 mm | 9.76 °C | 22.89 | — | — | |
| I2 | 447.68 mm | 10.08 °C | 21.65 | −0.12 | −1.12 | |
| I3 | — | — | 21.77 | — | −1.12 | |
| I4 | — | — | 22.77 | −0.12 | — | |
Disclaimer/Publisher’s Note: The statements, opinions and data contained in all publications are solely those of the individual author(s) and contributor(s) and not of MDPI and/or the editor(s). MDPI and/or the editor(s) disclaim responsibility for any injury to people or property resulting from any ideas, methods, instructions or products referred to in the content. |
© 2023 by the authors. Licensee MDPI, Basel, Switzerland. This article is an open access article distributed under the terms and conditions of the Creative Commons Attribution (CC BY) license (https://creativecommons.org/licenses/by/4.0/).
Share and Cite
Du, B.; Wu, L.; Ruan, B.; Xu, L.; Liu, S. CMADS and CFSR Data-Driven SWAT Modeling for Impacts of Climate and Land-Use Change on Runoff. Water 2023, 15, 3240. https://doi.org/10.3390/w15183240
Du B, Wu L, Ruan B, Xu L, Liu S. CMADS and CFSR Data-Driven SWAT Modeling for Impacts of Climate and Land-Use Change on Runoff. Water. 2023; 15(18):3240. https://doi.org/10.3390/w15183240
Chicago/Turabian StyleDu, Bailin, Lei Wu, Bingnan Ruan, Liujia Xu, and Shuai Liu. 2023. "CMADS and CFSR Data-Driven SWAT Modeling for Impacts of Climate and Land-Use Change on Runoff" Water 15, no. 18: 3240. https://doi.org/10.3390/w15183240
APA StyleDu, B., Wu, L., Ruan, B., Xu, L., & Liu, S. (2023). CMADS and CFSR Data-Driven SWAT Modeling for Impacts of Climate and Land-Use Change on Runoff. Water, 15(18), 3240. https://doi.org/10.3390/w15183240