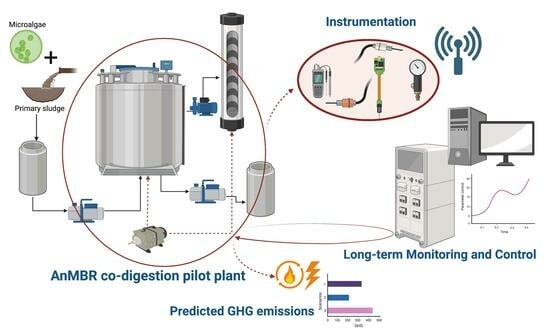
Article

Anaerobic Membrane Bioreactor for Microalgae and Primary Sludge Co-Digestion at Pilot Scale: Instrumentation, Control and Automation Implementation, and Performance Assessment

by
Juan Francisco Mora-Sánchez
1,2,
Rebecca Serna-García
1,*,
Alberto Bouzas
1,
Aurora Seco
1 and
Maria Victoria Ruano
1
1
CALAGUA—Unidad Mixta UV-UPV, Departament d’Enginyeria Química, Universitat de València, Avinguda de la Universitat s/n, 46100 Valencia, Spain
2
Direcció General de Canvi Climàtic, Generalitat Valenciana, C/Democràcia 77, 46018 Valencia, Spain
*
Author to whom correspondence should be addressed.
Water 2023, 15(18), 3225; https://doi.org/10.3390/w15183225
Submission received: 4 August 2023 / Revised: 2 September 2023 / Accepted: 7 September 2023 / Published: 11 September 2023

Abstract

:
Anaerobic membrane bioreactor (AnMBR) technology is gaining interest for circular economy integration in the water sector. However, its complexity, arising from the integration of anaerobic processes with membrane technology, poses a key challenge. Developing an appropriate instrumentation, control, and automation (ICA) system is essential for its reliable long-term operation. In this study, an ICA system was developed to successfully manage an AnMBR pilot plant co-digesting two waste streams (microalgae and primary sludge). The ICA implementation enabled its stable long-term operation for 576 days, ensuring the proper performance of biological and filtration processes and yielding 215 NmLCH4·gCODinf−1 at 35 °C. Variables such as temperature, oxidation-reduction potential, permeate flux and biogas flow were identified as key parameters and controlled. This included a 23% reduction in the integral of absolute error compared to a PID controller for permeate flow and the maintenance of a 0.5% standard deviation for digester temperature. These controls enabled AnMBR performance optimization, the rapid detection of process issues, and early corrective actions. As a start-up strategy to ensure proper filtration performance in the long term, critical flux tests were conducted, guaranteeing a competitive total annualized equivalent cost of 0.0016 EUR/m3 for optimal conditions. The study also calculated greenhouse gas emissions in different scenarios, proposing optimal and more sustainable pilot plant operations, mesophilic conditions, biogas upgrading through microalgae cultivation, and grid injection, reducing emissions by 423 kgCO2e·tCOD−1. To ensure the viability of emerging technologies such as AnMBR, proper start-up protocols are crucial, including favorable filtration and biological process operating conditions, ICA implementation, and key parameter control for technical, economic and environmental success.

Graphical Abstract

1. Introduction

Wastewater treatment plants (WWTPs) have faced growing demands to not only comply with effluent standards but also enhance energy efficiency, adopt resource recovery strategies, and actively monitor and mitigate greenhouse gas (GHG) emissions, and shift to Water Resource Recovery Facilities (WRRFs). Despite the advancements achieved in recent decades, a significant proportion of WWTPs still need to reach their full potential. Instrumentation, control, and automation (ICA) systems offer a viable opportunity to enhance the efficiency and environmental impact of current WWTPs.
In the search for more efficient, competitive, and eco-friendly technologies to replace conventional systems in WWTPs, anaerobic digestion (AD) and membrane filtration emerge as core processes of WRRFs. AD offers numerous advantages over aerobic processes, including low sludge production, reduced energy consumption, and organic matter valorization through methane production. Anaerobic membrane bioreactors (AnMBRs) are gaining recognition as they integrate AD with membrane filtration, providing additional benefits such as complete physical biomass retention, which allows for the decoupling of hydraulic retention time (HRT) and solids retention time (SRT), the efficient removal of organic matter and suspended solids, resource recovery potential, and lower energy costs [1,2,3]. Moreover, the compactness of membrane modules contributes to minimizing the footprint required for wastewater treatment facilities, making it possible to retrofit existing treatment plants with a limited available space. The feasibility of AnMBR application for urban wastewater treatment has been verified by previous studies and numerous large-scale applications [4,5,6,7,8], which have encompassed scale-up assessments [9,10,11]. AnMBRs have also been applied for co-digesting several substrates. Co-digesting two or more substrates offers multiple advantages, including enhancements in the C/N ratio, system buffer capacity, dilution of inhibitory compounds, nutrient balance, digestion performance, and biogas yield [12]. Cheng et al. [13] reported an enhanced biogas yield through the co-digestion of sewage sludge and food waste in a high-solid AnMBR. Co-digestion holds particular significance when dealing with challenging-to-degrade substrates such as microalgae.
Within the context of wastewater treatment, microalgae-based approaches hold great promise, especially in terms of generating biofuels through AD. For instance, the nutrient-rich effluent from urban wastewater treatment obtained using AnMBR technology was proven effective for cultivating microalgae, and the subsequent AD of the cultivated microalgae yielded substantial methane production [14]. This synergy underscores the potential of combining wastewater-based microalgae cultivation with AD, offering a mutually beneficial strategy that enables the simultaneous recovery of valuable nutrients and energy from wastewater sources. However, microalgae possess a cell wall that is highly resistant to degradation and a low C/N ratio that can lead to excessive ammonia levels and a decreased methane yield. These challenges can be addressed through the anaerobic co-digestion (AcoD) of microalgae with carbon-rich substrates such as sewage sludge and the integration of membrane filtration into the process. The ACoD of microalgae and primary sludge in AnMBRs has been demonstrated through pilot plant and laboratory-scale studies, resulting in higher methane yields [15,16]. Serna-García et al. [17] reported that membrane installation in a continuous stirred tank reactor (CSTR) co-digesting microalgae and primary sludge promoted a robust microbial community able to degrade the recalcitrant microalgae cell wall. The authors also observed that membrane installation allowed for thermophilic AcoD, avoiding ammonia inhibition and improving methane yields.
Due to the nature of the emerging technology and the added complexity of operating under anaerobic conditions while optimizing membrane filtration, the design and operation of AnMBRs are not yet fully developed for all applications, and there are currently limited full-scale implementations. As a result, further research is needed to maximize the process efficiency and broaden its applicability [18]. AnMBR operation can be enhanced with the implementation of a proper ICA system, which can minimize energy consumption, simplify system management, increase their robustness towards perturbations, and address the existing drawbacks [19]. Different control systems have been applied to anaerobic processes, including simple on/off control or advanced control systems such as fuzzy logic or neural networks [20,21]. When designing control systems for anaerobic processes, it is crucial to consider key process parameters such as HRT, SRT, and the flow rate of recycled biogas [22,23,24,25]. However, there are a very limited number of references in the literature concerning the start-up and ICA implementation to ensure the proper operation of the AnMBR technology [22]. Up to date, considerable efforts have been made to control membrane fouling in aerobic membrane technologies [26], but few control strategies have been developed to optimize the performance of the filtration process in AnMBRs [18,22,27].
In this work, an ICA system was developed to enhance energy efficiency and reduce manpower requirements while facilitating seamless system management in an AnMBR pilot plant co-digesting microalgae and primary sludge. The proposed ICA system aims to provide a valuable guide for the start-up and proper operation of an AnMBR co-digestion pilot plant. Its primary goal is to optimize the process performance of this emerging technology in terms of methanation and membrane filtration, ensuring its reliable and efficient long-term operation. By closely monitoring the process parameters that are sensitive to process disturbances, such as temperature, pH, biogas production rate, or oxidation-reduction potential (ORP), it effectively identifies the key process parameters essential for optimal operation and performance. Additionally, this study conducted a GHG emissions assessment to evaluate the economic and environmental feasibility of AnMBRs, considering various biological operating conditions (mesophilic and thermophilic) and biogas valorization scenarios.

2. Materials and Methods

An ICA system was proposed and validated in the long term to optimize the operation of an AnMBR co-digesting harvested microalgae and thickened primary sludge in proportions of 38% and 62%, respectively (according to [16]) at a pilot scale. Based on previous works [22], ICA was designed to manipulate the key operating variables for controlling the biological and physical separation processes: the daily feed volume, the daily sludge discharge volume, the permeate flow rate, the co-digester temperature and pressure, the biogas inflow to the membrane tank and the membrane operating stage control. AnMBR pilot plant operation, instrumentation, control, and monitoring are described in the following sections, providing information about all the data sources involved.

2.1. Pilot Plant Description and Biological Process Operation

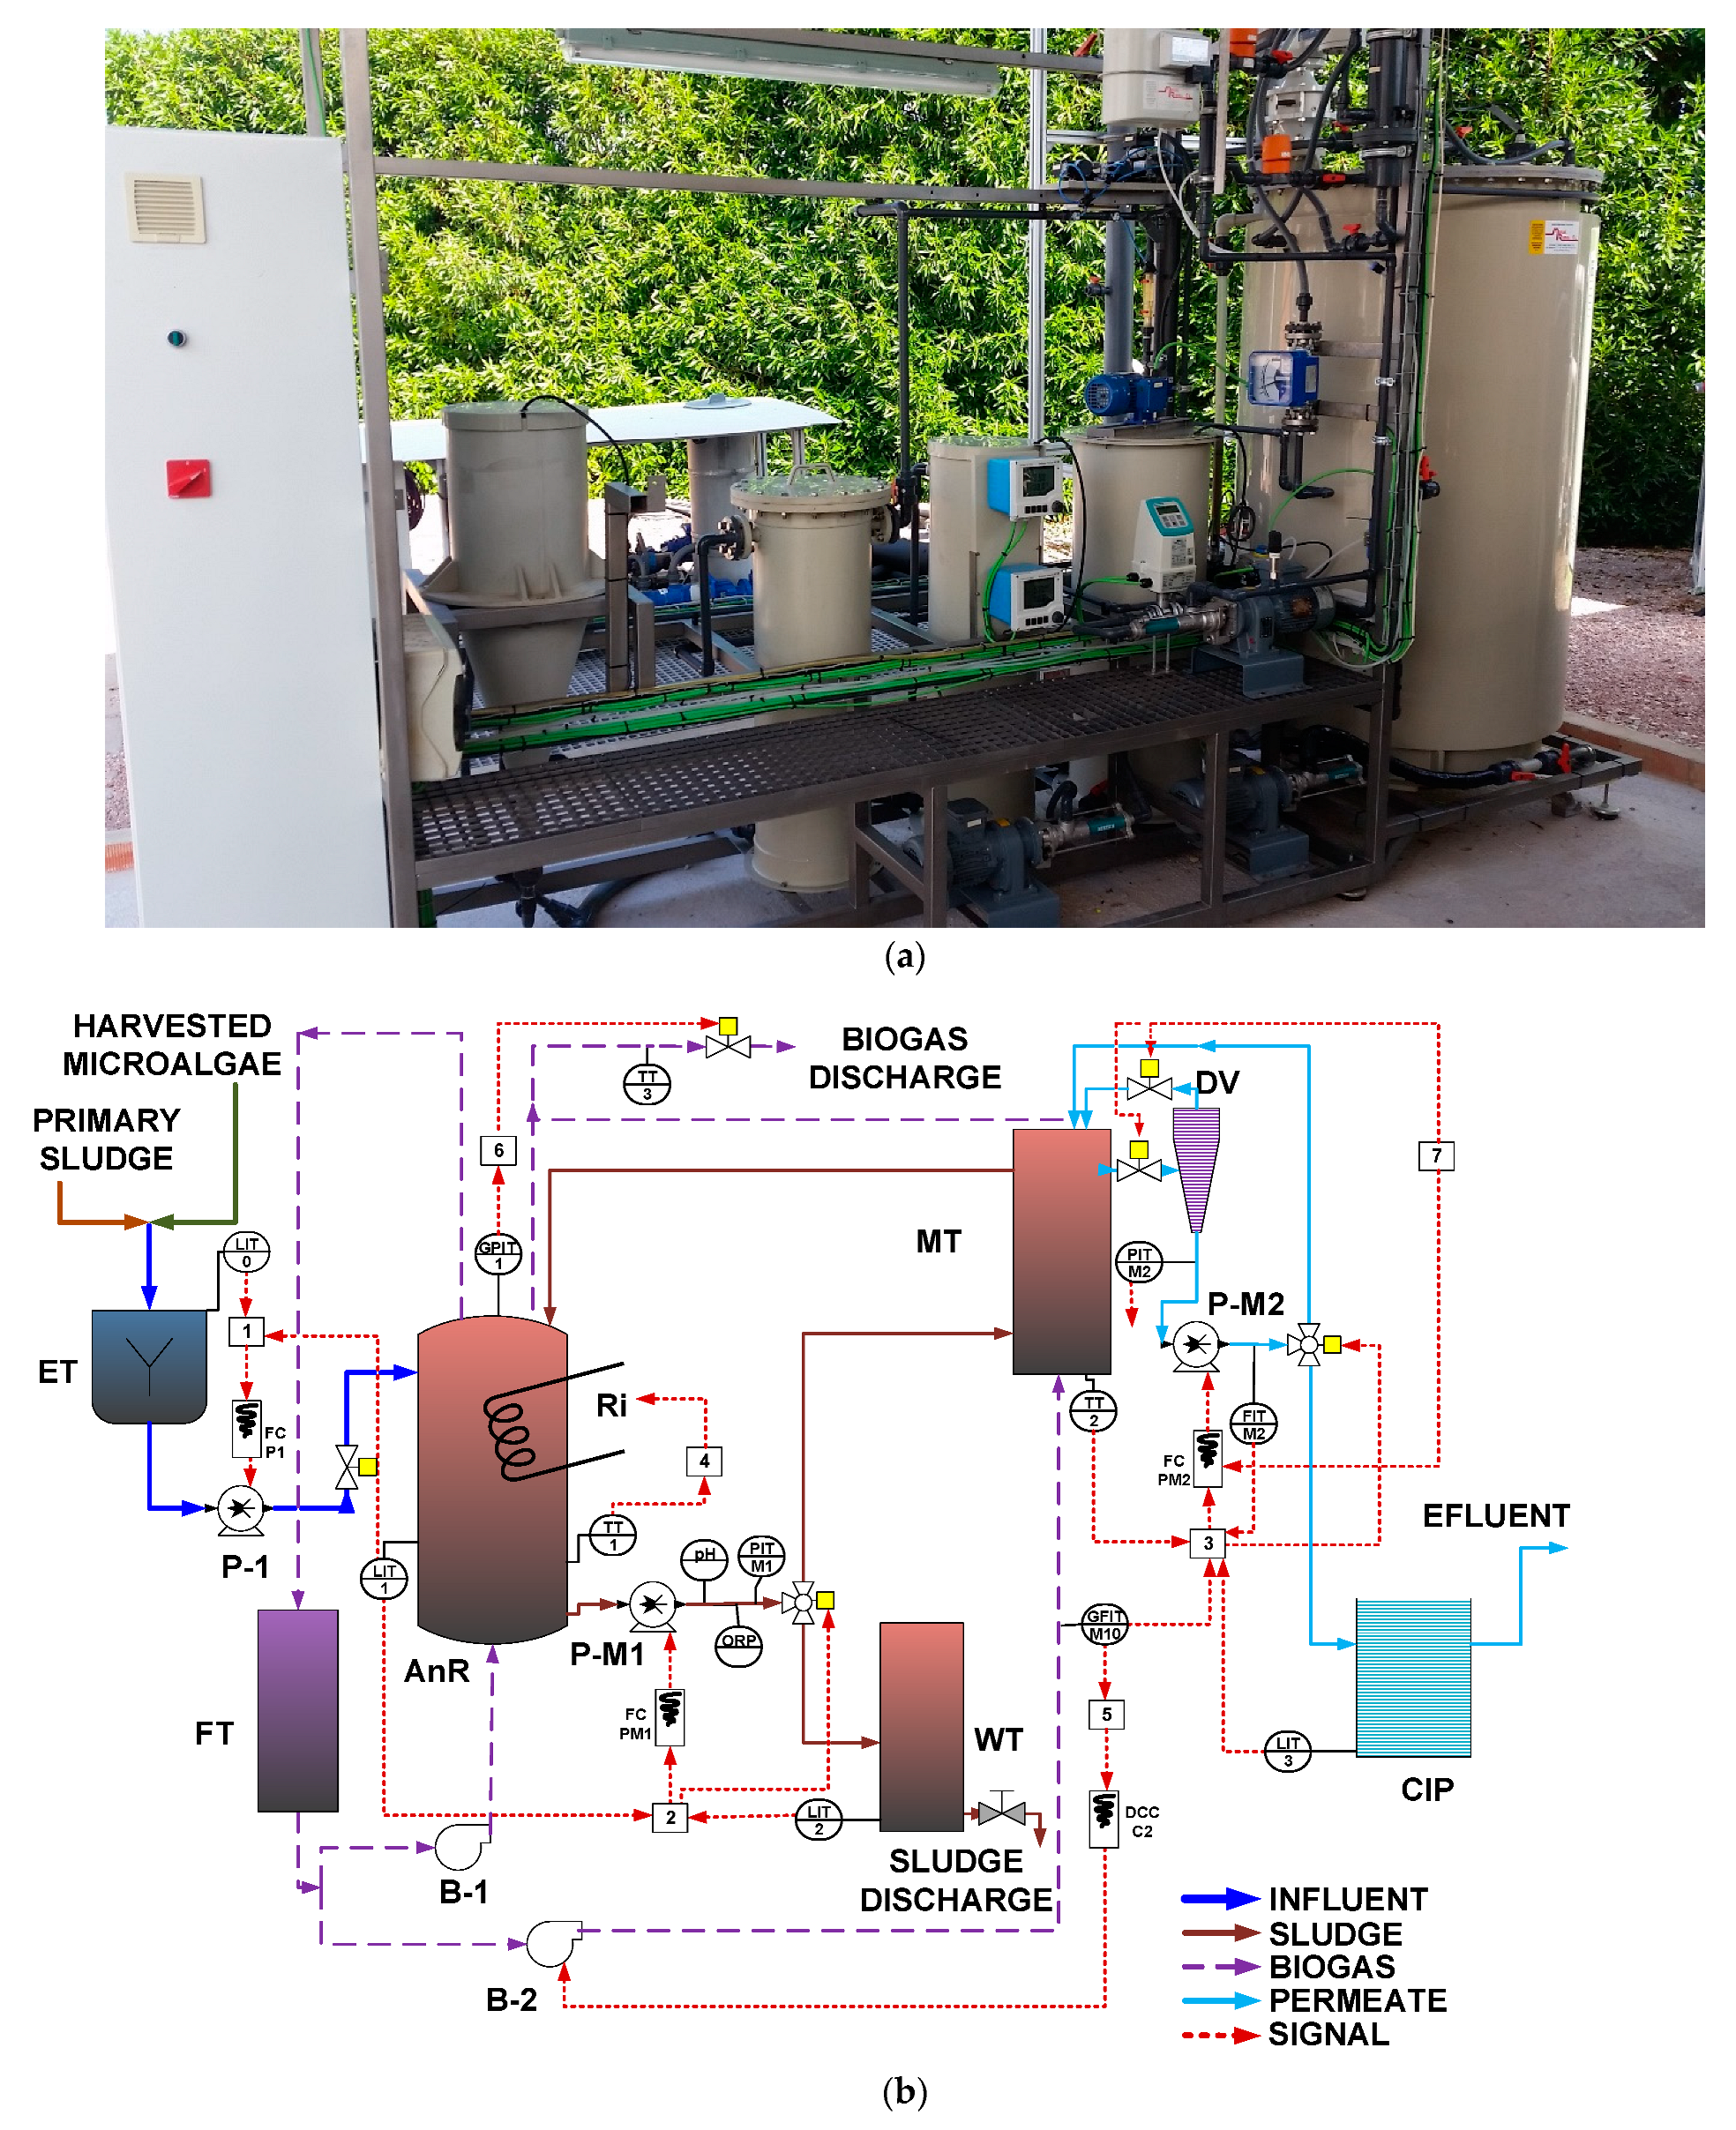
The pilot plant consisted of an anaerobic reactor (AnR) with a total volume of 1.01 m3 (up to 0.91 m3 working volume, rest head-space volume) connected to an external membrane tank (MT) with a total volume of 1 L (0.1 L head-space volume) (see [16] for the whole description). The MT included one hollow-fiber (HF) ultrafiltration membrane unit (PURON® KMS, Wilmington, MA, USA 0.03 µm pores). This module consisted of one HF bundle, 0.4 m long, giving a total membrane surface of 0.44 m2. A 125 L equalization tank (ET), a 42 L clean-in-place (CIP) tank, a 70 L waste tank (WT), and a 70 L foam trap (FT) were also included as main elements of the plant. A real-time photograph of the AnMBR pilot plant is shown in Figure 1a.
Figure 1b shows a simplified layout of the pilot plant, including lower-layer controllers. Primary sludge and microalgae were mixed in the ET and fed to the AnR. The primary sludge, sourced from the gravity thickener of the Carraixet WWTP (Alboraya, Spain), was sieved through a 0.5 mm aperture sieve before being fed to the ET. Microalgae were obtained from a membrane photobioreactor pilot plant that received the effluent of an AnMBR pilot plant treating wastewater from the Carraixet WWTP’s gravity-based primary clarifier (see [28] for an in-depth description). The microalgal biomass, dominated by Chlorella spp. and Scenedesmus spp., was concentrated via filtration in an external cross-flow, ultrafiltration HF membrane unit (HF 5.0–43-PM500, PURON® Koch Membrane Systems) before entering the ET. To improve the stirring conditions of the digester and to favor stripping of the produced gases from the liquid phase, a fraction of the produced biogas was recycled to the digester with a blower, and another fraction was recycled with a different blower to the external MT from the bottom of the fiber bundle to minimize cake-layer formation. Sludge was continuously recycled through the MT, where the effluent was obtained with vacuum filtration after passing through a degasification vessel (DV). The obtained permeate was stored in the CIP tank, where the effluent of the plant was obtained. Three external resistances were installed to control temperature. A fraction of the generated sludge was intermittently extracted from the co-digester throughout the day to achieve the desired SRT. The measurement of total biogas production was conducted using a biogas meter (BK-G4M, Elster, Raleigh, NC, USA). Gas volumes were normalized to standard conditions of 1 atm pressure and 0 °C temperature.
Two different experiments were conducted in the AnMBR co-digestion pilot plant. In Experiment 1, the digester was operated for 216 days (from Day 0 to 216) at thermophilic conditions (55.0 ± 0.9 °C), 69.7 ± 0.3 d SRT, 30.0 ± 0.3 d HRT, and 0.56 ± 0.05 gCOD·L−1·d−1 organic loading rate (OLR) [29]. In Experiment 2, the reactor was operated for 360 days (from Day 217 to 576) at mesophilic conditions (35.2 ± 0.5 °C), 70.2 ± 4 d SRT, 30.1 ± 0.3 d HRT, and 0.58 ± 0.12 gCOD·L−1·d−1 OLR [16].

2.2. Membrane Operation

Membrane operation was established based on the operation described in [
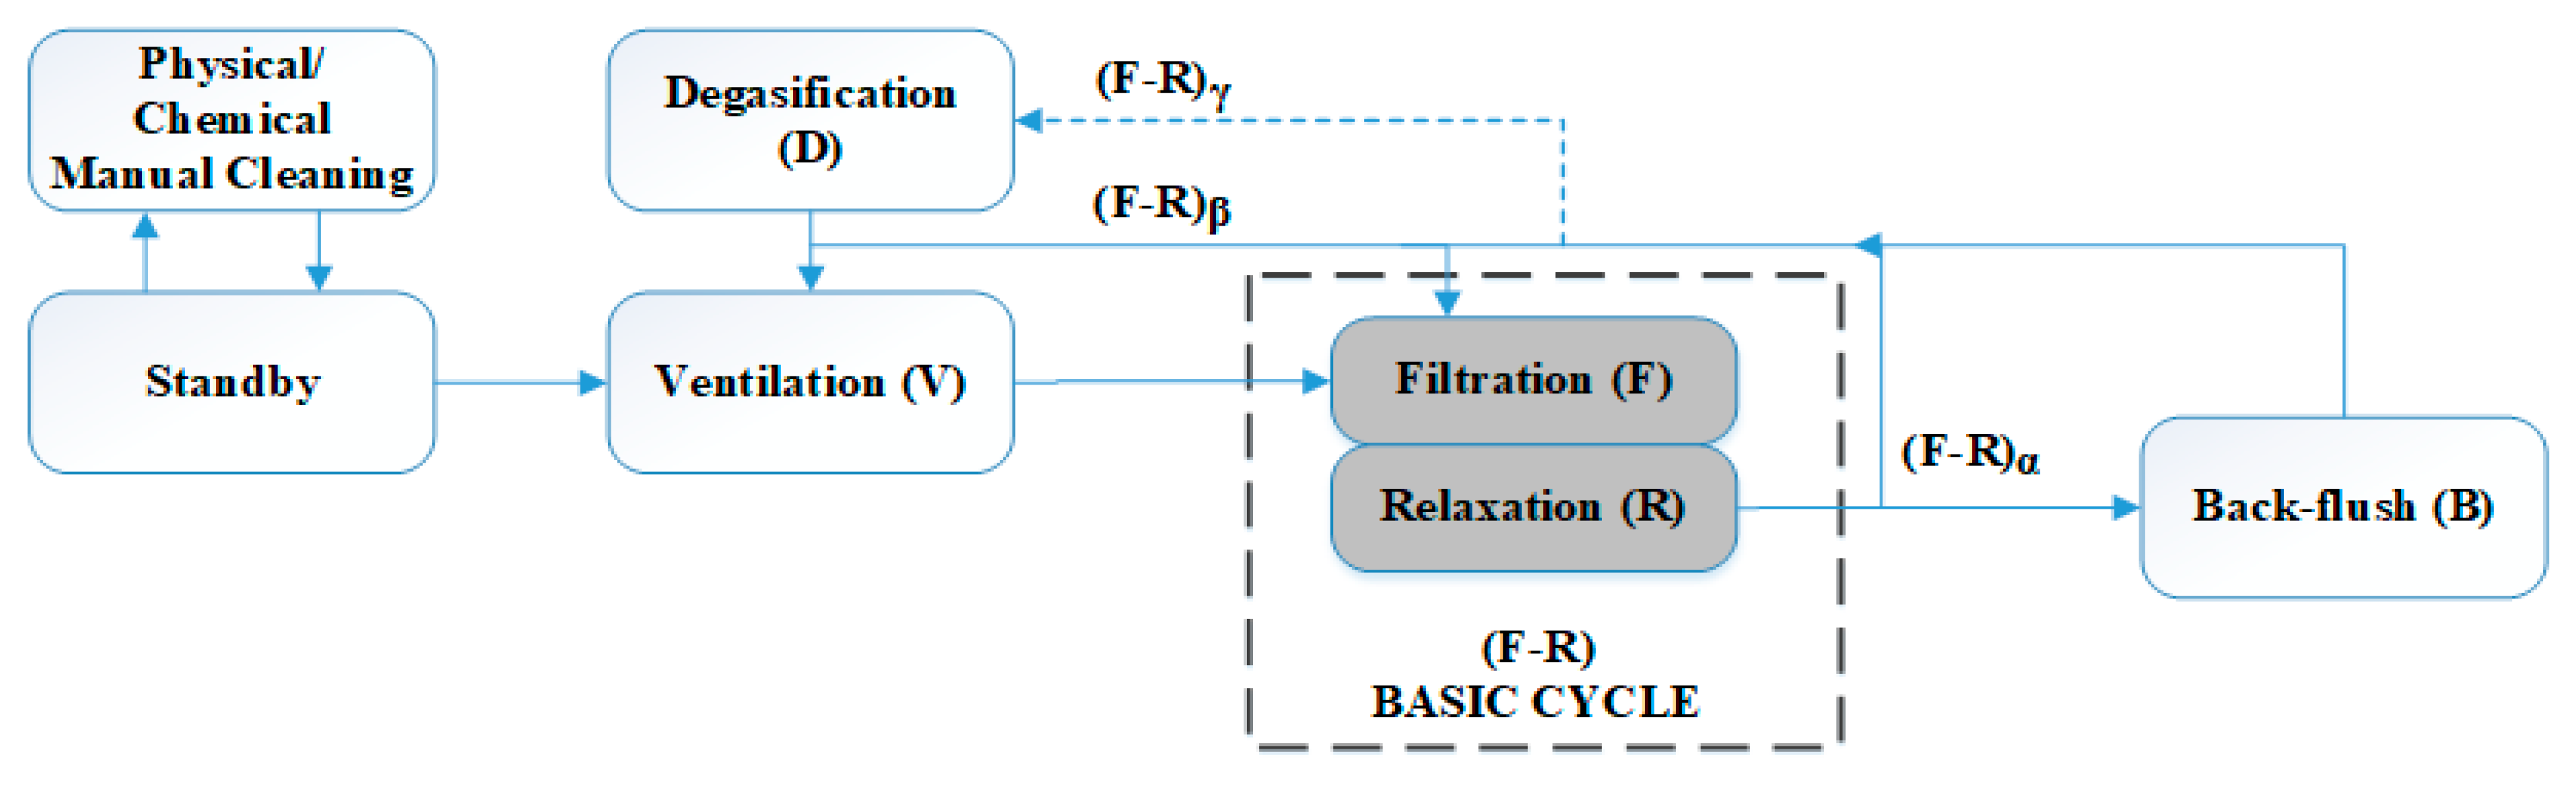
29] for a similar membrane filtration module in an AnMBR pilot plant. The classical operating stages were filtration, relaxation, and back flush. Two additional stages were considered to remove biogas accumulation on the top of the fibers (degasification) and inside the DV (ventilation). Degasification consisted of a short period of high-speed filtration to remove accumulated biogas and improve the efficiency of the filtration process. Ventilation was a stage similar to back flush, but with permeate being pumped to the MT through the DV. Figure 2 shows the possible modes in which the membrane module can be operated, based on the methodology described in [4]. A basic filtration–relaxation cycle was established and taken as the basis to schedule the frequency of the remaining stages. Different back-flush and relaxation frequencies and durations were studied to evaluate the effect on membrane operation.
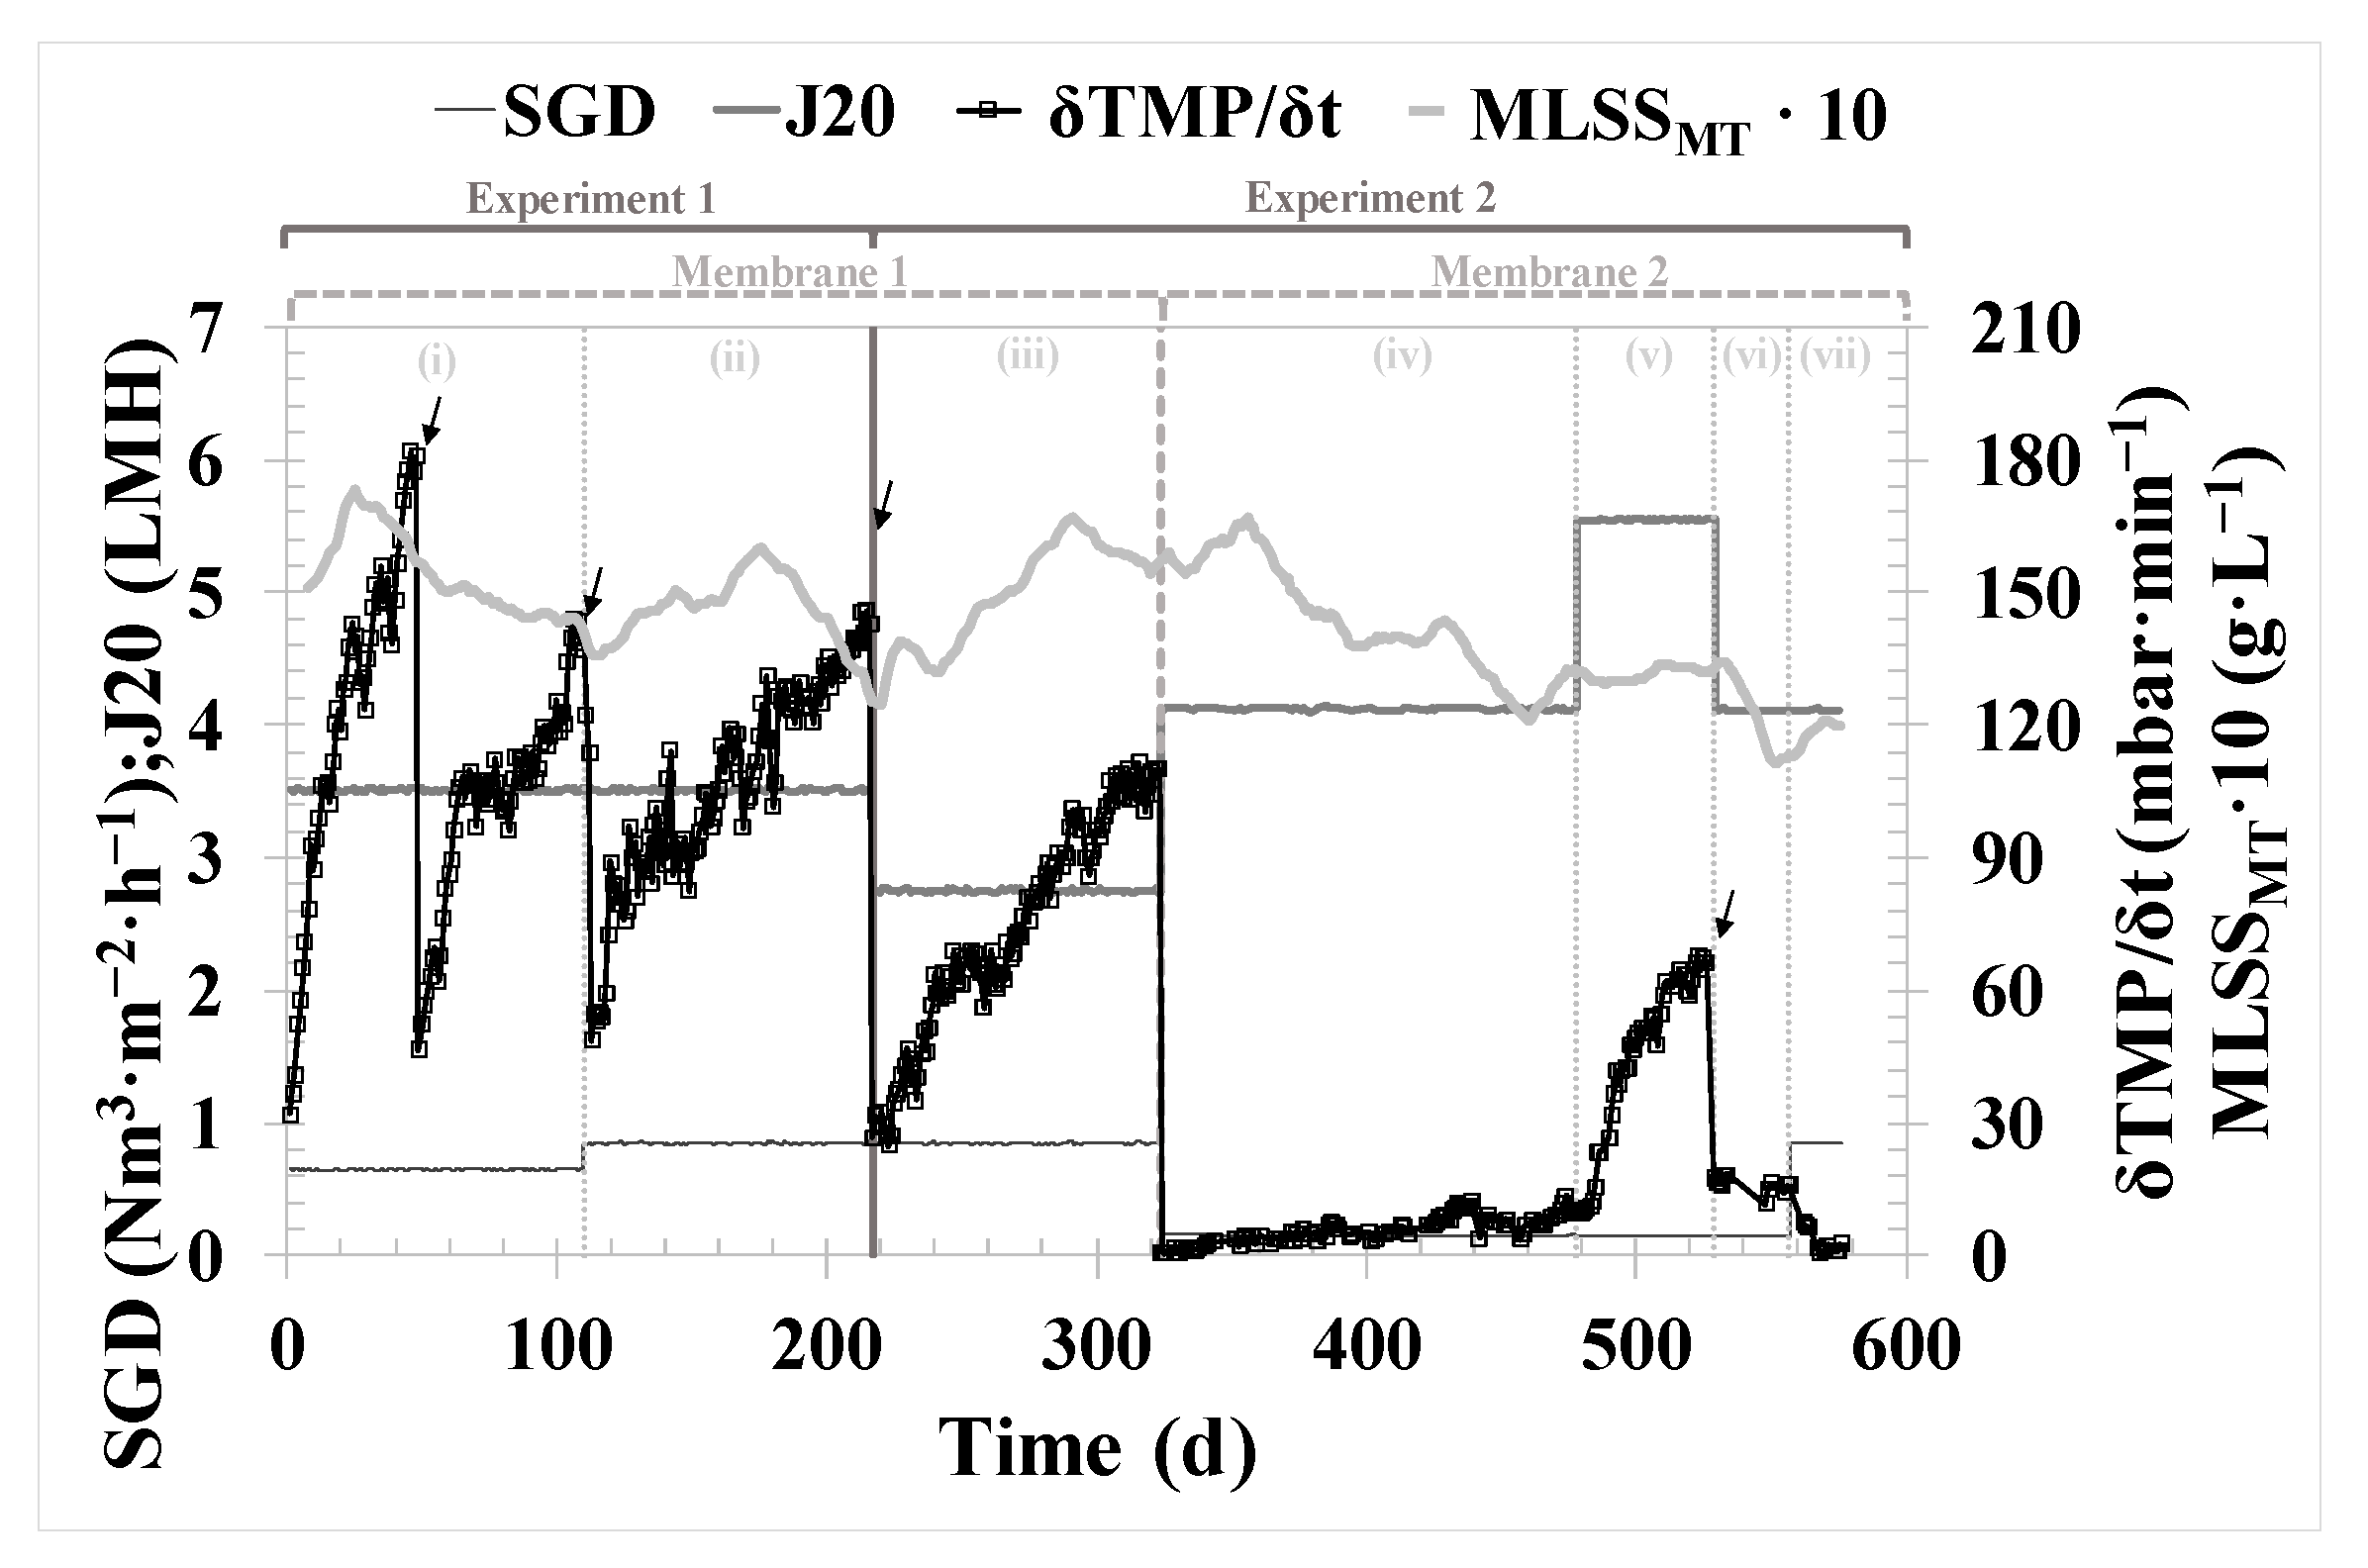
During Experiment 1 (thermophilic conditions of AnR), the filtration was performed using a membrane previously used in other experiments, i.e., with a non-negligible contribution of irreversible fouling. The membrane was cleaned chemically just before starting Experiment 1. The operating mode was α = 11; β = 13; γ = 50 (see Figure 2), which means a back flush was performed every eleven basic F-R cycles, ventilation was carried out every thirteen F-R cycles, and a double degasification stage followed by ventilation was conducted every fifty F-R cycles. Filtration was conducted with a filtration time of 150 s. The duration of the remaining stages was as follows: relaxation, 100 s; back-flush, 50 s; ventilation, 150 s; and degasification, 50 s. There were two operating periods, (i) and (ii), with different conditions of 20 °C-normalized permeate flux (J20), specific gas demand (SGD), and mixed liquor suspended solids in the membrane tank (MLSSMT), as shown in Table 1.
Experiment 2 (mesophilic conditions of AnR) started its operation with the same fouled membrane until Day 324 of operation (period iii), maintaining the same operating mode. On Day 325, a new membrane was installed, and short-term experiments were conducted to determine the critical flux (JCW). For the rest of the experimental time (from Day 325 to 576), the operating mode was α = 2; β = 13; γ = 50. Filtration was carried out with a filtration time of 200 s. The durations of the remaining stages were as follows: relaxation, 30 s; back-flush, 45 s; ventilation, 50 s and degasification, 30 s. There were four more operating periods, (iv) to (vii), with different conditions of J20, SGD, and MLSSMT, as can be observed in Table 1.
To assess the performance of the filtration process, the online recorded data of flow rate (J), TMP, and MT temperature were considered. Due to the significant impact of permeated viscosity on filtration performance, a temperature correction factor (fT) was included in the transmembrane flux control (Equation (1)), which was used to determine J20 (Equation (2)). Additionally, the evolution and performance of the filtration process were evaluated using the fouling rate (FR) (Equation (3)).
f T = e 0.0239 · ( T 20 )
J 20 = J · f T L M H
F R = δ T M P δ t T M P t = T M P j n f T M P j n i t j n f t j n i m b a r · m i n 1
JCW was determined by applying a modified flux-step method based on the methodology proposed by [29]. Successive flux steps were established, conducting the trials just in the upward direction. The filtration stage duration was set to 10 min. The flux-step size was fixed at a J20 of 0.65 LMH. To minimize the reversible fouling effect on JCW calculations, a relaxation stage of 30 s followed by a back-flush stage of 1 min was executed between each flux step. The relaxation stages were conducted using the same SGD as in the filtration stages. In this study, eleven flux-step tests were performed at an SGD of 0.15, 0.2, 0.25, 0.3, 0.35, 0.4, 0.45, 0.5, 0.55, 0.6, and 0.625 Nm3·h−1·m−2.
Following the approach suggested by [29], data processing of the flux-step method results used the average values of TMP for each flux step (jn) from Equation (4). The fouling rate was calculated based on Equation (3).
T M P j n A V E = j = 1 z T M P j n i z
To evaluate the technical-economic optimum of the membrane module after critical flow testing, the total annualized equivalent cost (TAEC) was calculated by adding the annualized cost of capital expenditure (CAPEX) to the annual cost of operating expenditure (OPEX) for different operating conditions, employing the methodology of [30].

2.3. Pilot Plant Instrumentation

Several online sensors and actuators were installed to achieve the control and automation of the plant operation. The online sensors installed were a pH transmitter; an ORP transmitter; four-level transmitters (LIT), one for each tank except for the FT; a liquid-flow transmitter (FIT) in the MT permeate; a gas-flow transmitter (GFIT) for biogas inflow to the MT; two liquid pressure transmitters (PIT), one to determine the pressure in the MT and the other for permeate; a biogas pressure transmitter (GPIT) in the AnR head space; and three temperature transmitters (TT) for monitoring the AnR, the MT and the biogas discharge temperatures. Additionally, a rotameter was installed in the biogas inflow to the AnR.
The group of actuators included three frequency converters (FC) responsible for controlling the rotating speed of three pumps (feed pump, sludge recycling pump, and permeate pump); one direct current converter (DCC) that controlled the voltage of the MT blower; two three-way valves that controlled sludge wastage and permeate recirculation to the AnR; and four on–off valves used to control the feeding to the AnR, biogas discharges, and the different membrane operating stages.

2.4. Pilot Plant Automation

Anaerobic processes and membrane technology in general, and AnMBR systems in particular, present a high level of complexity, so a complete network system was needed to ensure a safe and robust performance against disturbances. The instrumentation was connected to a network system that included several transmitters, a programmable logic controller (VIPA S7-317-DP PLC), a PC to perform multi-parameter control and data acquisition, and a SCADA. This system showed a high degree of process autonomy and allowed for minimal human supervision.

2.5. Pilot Plant Control

The pilot plant included several control loops organized in lower-layer controllers (see Figure 1b).
HRT control [1] was achieved by operating the feed pump (P-1) at a fixed frequency. The controller allowed for the total daily feed volume to be reached, which was distributed in several cycles per day. These cycles were determined based on LIT-0 variation, allowing precise HRT control.
SRT control [2] was accomplished by operating the recycling sludge pump (P-M1) at a fixed frequency. The controller allowed for the total daily wasting volume to be reached, which was distributed in several cycles per day, opening a three-way valve to the waste tank. These cycles were determined by monitoring LIT-2 variation and allowing effective SRT control.
Permeate flow/flux control [3] was achieved through the utilization of a permeate pump (P-M2) controlled by a PID controller. The controller manipulated the pump’s frequency to maintain the desired transmembrane flow rate, which was determined based on the flow obtained from the FIT-M2 sensor. This controller was also able to operate in a ‘J20 mode’. In this mode, the controller maintained a specific J20 set point considering the temperature measured by the TT-2 sensor instead of directly controlling the flow rate.
AnR temperature [4] was controlled by adjusting the operation time of three resistances. Two different controllers were tested: an on–off controller and a PID controller.
Biogas MT flow [5] was achieved through a PID controller. The controller was used to ensure a set point for the biogas inflow to the MT, measured by GFIT-M10. The independent variable was the blower B-2 voltage through DCC.
Pressure control [6] was achieved by maintaining an operating pressure with hysteresis in the AnR and MT head space. An on–off controller was used to control the V-3 valve.
MT operating stage control [7] consisted of one on–off controller determining the membrane operating stage. This control was achieved by changing both the position of the corresponding on–off valves and the flux direction of the P-M2.

2.6. GHG Emissions Assessment

To determine the GHG emissions generated in the AnMBR pilot plant, the methodology proposed by [31] was considered. This methodology consists of estimating direct and indirect emissions for different combinations of the AnMBR co-digestion pilot plant operation, considering mesophilic or thermophilic conditions, and the various biogas valorization systems proposed. Three scenarios were established for biogas valorization: (i) Scenario 1, which involved the use of high-efficiency co-generation technology with a combined heat and power (CHP) system; (ii) Scenario 2, in which biogas was upgraded to biomethane using conventional membrane technology and subsequently injected into the grid; and (iii) Scenario 3, in which biogas was upgraded to biomethane using microalgae with high CO2 tolerance in a specialized reactor to absorb the CO2 contained in the biogas. The upgraded biomethane was then injected into the grid. Notably, this process led to the absorption of CO2 into the algal biomass, consequently increasing methane production during the AD stage.
Direct emissions (GHGdirect) are defined as methane losses, which vary depending on the valorization system. As for indirect emissions (GHGindirect), it is necessary to perform an energy assessment to calculate the total consumption and recovery of electrical energy, the consumption and recovery of thermal energy, and, in scenarios that include it, the thermal energy contained in the biomethane injected into the grid. To determine the avoided GHGindirect, it was considered that co-generated electrical energy avoids the use of electricity from the grid. In the case of thermal energy and biomethane injected into the grid, it was considered that the use of fossil natural gas was being avoided.
The lower specific heat of natural gas and pure methane values were taken from [31]. The specific emission factor for fossil natural gas from the grid (EFnatural_gas) was 0.238 kg CO2e/kWh and was taken from [32]. The specific emission factor of European power companies (EFelectricity) was 0.224 kg CO2e/kWh and was taken from [33].
GHGdirect, (Equation (5) for Scenario 1 and Equation (6) for Scenarios 2 and 3), GHGindirect (Equation (7) for Scenario 1 and Equation (8) for Scenarios 2 and 3), and total emissions, GHGtotal, (Equation (9)) were calculated according to the following equations.
G H G d i r e c t , s c . 1 = Q B G · E F C H 4 · 28 g C O 2 e · t C O D 1
G H G d i r e c t , s c 2 & 3 = Q B M · E F C H 4 · 28 g C O 2 e · t C O D 1
G H G i n d i r e c t , s c . 1 = Q d e m a n d · E F n a t u r a l   g a s + W d e m a n d · E F e l e c t r i c i t y g C O 2 e · t C O D 1
G H G i n d i r e c t , s c . 2 & 3 = Q B M · E F n a t u r a l   g a s + W d e m a n d · E F e l e c t r i c i t y g C O 2 e · t C O D 1
G H G t o t a l = G H G d i r e c t + G H G i n d i r e c t g C O 2 e · t C O D 1
where QBG is the registered gross production of raw biogas; E F C H 4 is the methane loss emission factor; QBM is the biomethane production; Qdemand is the total thermal energy demand balance; Wdemand is the total electrical energy demand balance; EFnatural_gas is the specific emission factor for fossil natural gas from the grid; and EFelectricity is the specific emission factor of European power companies.
To calculate GHGindirect, the [4,29] methodologies were employed to determine energy consumption. The consumption ratios in upgrading and grid injection systems were obtained from [34], while the CHP efficiencies were obtained from [35]. The total thermal energy demand balance (Qdemand) and the total electrical energy demand balance (Wdemand) were calculated according to Equation (10) and Equation (11), respectively. Biomethane production (QBM) was calculated for both Scenarios 2 and 3 using Equation (12), considering that raw biogas was utilized to meet the Qdemand, and the remaining fraction was upgraded for injection into the natural gas grid. A net efficiency of the upgrading system (φupgrading) of 99.5% was considered for Scenario 2 [36] and 97.6% for Scenario 3 [37]. In both scenarios, normalization was carried out, considering a 97% methane content for injection into the natural gas grid. Net energy assessment (E) was calculated for Scenario 1 using Equation (13) and for Scenarios 2 and 3 using Equation (14). The results indicated a net energy consumption if the value was positive and a net energy recovery if the value was negative for each respective stage.
Q d e m a n d = Q T O T Q r e c o v e r e d k W h · t C O D 1
W d e m a n d = W T O T W r e c o v e r e d k W h · t C O D 1
Q B M = Q d e m a n d Q B G · φ u p g r a d i n g k W h · t C O D 1
E s c . 1 = Q d e m a n d + W d e m a n d k W h · t C O D 1
E s c . 2 & 3 = W d e m a n d + Q B M k W h · t C O D 1
where QTOT is the total heat required by the AnR process; Qrecovered is the recovered heat in the CHP for Scenario 1 or the heat recovered in the upgrading stage for scenario 2; WTOT is the result of adding all the electrical consumptions of the plant equipment; Wrecovered is the electricity recovered in the CHP stage; QBG is the registered gross production of raw biogas; Qdemand is the total thermal energy demand balance; Wdemand is the total electrical energy demand balance; φupgrading is the net efficiency of the upgrading system; and QBM is the biomethane production.
To calculate GHGdirect, methane losses were considered and expressed as an emission factor ( E F C H 4 ). An E F C H 4 of a 1.5% loss of CH4 burnt in CHP was considered for Scenario 1, while an E F C H 4 of a 1% loss of upgraded CH4 was considered for Scenarios 2 and 3 [31].

3. Results

The results obtained from the AnMBR co-digestion pilot plant operation and ICA implementation, including the controller performance, key parameter monitoring, long-term operation, filtration assessment and performance, and GHG assessment, are presented in the following sections.

3.1. Lower-Layer Control Performance

The results obtained through the operation of the lower-layer controllers are presented below. After the implementation of lower-layer controllers in the pilot plant, two issues were found: maintaining the AnR temperature was challenging due to thermal lag, and the PID controller for permeate flow (tuned using the Ziegler-Nichols method) exhibited an initial overshoot.
The AnR temperature was maintained by controlling the operating time of three resistances. Initially, an on–off controller was tested to maintain a temperature set point with a small hysteresis, which gave poor results due to thermal lag. Then, a PID controller was implemented to divide the day into several cycles and manipulate the operating time of each cycle. This approach led to an adequate temperature control, as illustrated in Figure 3.
The permeate flow rate was controlled using a PID controller that manipulated the frequency of the P-M2. However, a critical concern arose during the AnMBR plant’s performance, as an initial overshoot was observed when the permeate flow rate of PID controller was initiated. The membrane operating mode involved multiple stages, and consequently, the PM-2 was continuously turned on and off. Thus, a flow overshoot (see Figure 4) derived from the initiation of each membrane operation stage was observed, critically affecting the filtration process’s performance, especially in the filtration stage. Robles et al. [22] found that a starting-up correcting action can be implemented for controllers by employing a frequency converter as a final element, which modifies the rotation speed of continuously turned-on and off permeate pumps. A similar correcting action was programmed in the AnMBR co-digestion pilot plant, specifically in the filtration stage, where the initial time (t1) was set to 15 s in accordance with the ramp-up time set for the frequency converter. The frequency converter operated at a fixed frequency (FF) prior to activating the PID controller. This FF was determined by calculating the average output of the frequency converter during a specific time interval (t2), which was set to one quarter of the total filtration operating time, immediately following the initial FF time from the preceding filtration operation stage (see Figure 4a). The integral of absolute error (IAE) operating in the PID controller with and without initial an FF resulted in 0.00176 and 0.00229, respectively, corresponding to an IAE reduction of 23%, which means that the filtration process was working correctly.
As described in Section 2.5., the permeate flow controller could function in a ‘J20 mode’, which aims to maintain a J20 set point, based on the permeate temperature measured using the TT-2 probe, rather than controlling the flow rate directly. An example of the performance of this mode is shown in Figure 4b, where the J20 stability is ensured by adjusting the permeate flow rate in response to temperature variations.
The HRT controller allowed for the distribution of daily feeding into different cycles, calculating the volume supplied in each cycle based on the level difference measured by the LIT-0 sensor. The set-point control was twofold: individual set points for each cycle and an additional check of the total daily set point to enhance precision. Similarly, the SRT controller allowed the distribution of the waste volume into several cycles throughout the day based on the level difference recorded by the LIT-2 sensor. The performance of these controllers, which proved to be very stable, can be observed in Figure 5a.
The pressure controller in the AnR headspace can be observed in Figure 5b. The plant was operated under various conditions throughout the operation, with a set point within the range of 0.007–0.02 bar and a hysteresis between 0.002 and 0.005 bar. The discharge valve was designed to open when the value of the set point plus hysteresis was reached and closed when it dropped to that of the set point minus hysteresis. In Figure 5b, the specific conditions used were a set point of 0.02 bar and a hysteresis of 0.005 bar.
The biogas flow controller was used to maintain the SGD in the membrane module by manipulating the voltage of the blower B2 operating on direct current. It functioned similarly to a frequency converter for alternating current (AC) electromechanical equipment. The performance shown in Figure 5c is consistent and exhibits an oscillation around the set point of less than 5%.
Finally, the operation of the MT operating stage controller is shown in Figure 5d, where a scheme with α = 2, β = 13, and γ = 50 can be observed.

3.2. Long-Term Biological Process Performance

The plant operated for 576 days, with thermophilic conditions for the first 216 days (Experiment 1) and mesophilic conditions for the last 360 days (Experiment 2). The experimental periods were set in order to ensure that pseudo-steady state conditions were reached, i.e., between 3 and 4 times the SRT. The results of the main process parameters are shown in Table 2 according to [16,29].
The pilot plant’s long-term monitoring results are shown in Figure 6 for the most relevant parameters: AnR temperature, biogas discharge flow rate, pH, and ORP. The data for Experiment 1 and Experiment 2 have been separated with a vertical line in all cases. Regarding temperature, the values remained essentially stable (see Figure 6a), at 55.0 ± 0.2 °C during Experiment 1 and 35.0 ± 0.2 °C during Experiment 2. In Figure 6b, it can be observed that the pH values were similar for both experiments in pseudo-steady state conditions.
Figure 6c presents the biogas discharge flow rate values as a 24 h moving average, representing the daily trend in biogas production. During the initial 80 days, which matched with the commissioning of both the plant equipment and the biological process, there was virtually no biogas production. The reason for the lack of biogas production during the initial months of the system start-up may be attributed to the gas leaks that occurred in the biogas lines, which were gradually addressed over time, eventually allowing the process to stabilize.
The recorded biogas production for Experiment 1 was 41 ± 37 NL·d−1, while for Experiment 2, it was 57 ± 20 NL·d−1. Thermophilic anaerobic processes of this type should exhibit higher biogas production than mesophilic processes [38]. However, in this case, the opposite occurred, as a lower biogas production was observed in the thermophilic process, along with an accumulation of VFA around 523 mg·L−1, which did not occur in the mesophilic process. This could be explained by a partial inhibition of the anaerobic process due to the presence of high concentrations of ammonium, characteristic of the microalgae substrate, a fact that has already been confirmed at the laboratory scale [17].
Figure 6d represents the ORP values in the AnR, showing highly negative ORP values that correlate with anaerobic conditions. Concerning the detection of operational issues, it is remarkable that the ORP values correlate with the presence of leaks and the decrease in biogas production. This can be observed in the first 75 days of operation, during which no biogas production was detected, and there were numerous peaks in the ORP value. Similarly, the decrease in biogas production between Days 400 and 440 is reflected in the observed peaks in ORP. Therefore, this parameter is key to allowing the early detection of gas line leaks and facilitating their repair.

3.3. Filtration Process Performance

To ensure long-term proper filtration performance, critical flux tests were conducted as part of the start-up strategy. The filtration process was evaluated in the long term during the entire operation of the AnMBR pilot plant.

3.3.1. Critical Flux Short-Term Trials

Short-term critical flux trials were performed when the fouled membrane was replaced with a new one. Figure 7 compares the effect of SGD on fouling rate for the two extreme cases of higher and lower MLSSMT concentration. In the case of Figure 7a, with a MLSSMT concentration of 25.2 g·L−1, all tests showed very similar values, with the fouling rate ranging from 5 to 35 mbar·min−1 for a J20 range of 2–5 LMH. However, for the case shown in Figure 7b, with a MLSSMT concentration of 13.9 g·L−1, there is a greater variability in the results of the different tests, with most fouling rate values falling within the range of 0–15 mbar·min−1 for J20 values between 2 and 8 LMH.
Figure 8a illustrates the effects of SGD on critical flux. Consistent with the results shown for fouling rate, there was greater variability with SGD in critical flux values for lower MLSSMT concentrations. In the case of 13.9 g·L−1 of MLSSMT, the J20 values increased from around 5 LMH to approximately 8 LMH when the SGD was increased from 0.153 to 0.625 Nm3·m−2·h−1. However, for the concentration of 25.2 g·L−1, the J20 values remained essentially constant at around 2 LMH, regardless of the applied SGD.
Concerning economic assessment, Figure 8b shows lower operating costs in terms of TAEC for the minimum applied SGD, 0.153 Nm3·m−2·h−1, and for intermediate MLSSMT concentrations between 17 and 21 g·L−1. From both Figure 8a,b, it can be inferred that at high concentration levels of MLSSMT (25.2 g·L−1), the effect of SGD is very small, limiting J20 to very low values that would practically hinder the operation. These results suggest that the maximum operating range for the parameter MLSSMT in this type of AnMBR co-digestion pilot plants would fall between 21 and 25 g·L−1.

3.3.2. Long-Term Operation

The evolution of the ultrafiltration membrane operation over nearly two years is shown in Figure 9. The results are presented in terms of fouling rate. It should be noted that the main objective of the filtration was to maintain the HRT of the co-digestion process experiments. Additionally, the membrane’s optimal technical-economic operating conditions were also studied for long-term performance.
The long-term filtration operation yielded interesting results. Firstly, during the first 217 days, a fouled membrane was used. On Day 42 of operation, the need for a thorough cleaning of the membranes arose, leading to the decision to conduct a physical cleaning using a high-pressure water hose. The result was excellent, with the fouling rate reduced by 75%, leading to the decision to operate using only physical cleanings instead of chemical cleanings, resulting in significant savings in chemical reagents and costs.
During periods (i) and (ii), similar conditions of J20 and MLSSMT were employed, but the SGD was increased from 0.65 in period (i) to 0.85 Nm3·m−2·h−1 during period (ii), leading to a 50% reduction in the requirement for physical cleanings and a 6% lower fouling rate on average for the period. In period (iii), the conditions of the biological process changed to mesophilic, and J20 was reduced by 20% to prevent the higher fouling rate foretold due to the increase in solids expected under mesophilic conditions, as was indeed observed. This J20 reduction led to a 30% reduction in the average fouling rate compared to period (ii).
After replacing the fouled membrane with a new one and conducting critical flow tests, the working conditions for period (iv) were set within the range of an MLSSMT of 13 ± 2 g·L−1, similar to period (iii). SGD conditions of approximately 0.15 Nm3·m−2·h−1, the lowest possible, and a J20 around 4.1 LMH were established. Therefore, the set conditions corresponded to the technical and economic optimum obtained in the critical flow tests. The filtration performance during period (iv) proved to be extremely reliable over the 153 days of operation, with excellent fouling rate values of only 6 ± 3 mbar·min−1, representing a 92% reduction compared to period (iii), which could be explained by the probable presence of irreversible fouling in the case of the fouled membrane. These results validated the optimal conditions obtained in the critical flow trials.
Due to the favorable values obtained in period (iv), it was decided to operate in period (v) by increasing the J20 by 35% to supercritical values. The fouling rate experienced a notable increase to 44 ± 19 mbar·min−1, so a physical cleaning of the membranes was performed. In period (vi), the working conditions of period (iv) were reinstated, resulting in a significantly lower recorded fouling rate of 16 ± 2 mbar·min−1. Finally, at the end of Experiment 2, the SGD was increased to 0.85 Nm3·m−2·h−1 during period (vii), allowing for the recovery of fouling rate values similar to those observed in period (iv), 3 ± 3 mbar·min−1.

3.4. Greenhouse Gas Emissions Assessment for Different Biogas Valorization Scenarios

A GHG emissions analysis was carried out to evaluate the environmental impact of the microalgae and primary sludge AcoD process in an AnMBR, considering different biogas valorization scenarios. Figure 10 shows the results in terms of net energy and GHG assessment for both Experiments 1 and 2, as well as for the three proposed scenarios (see Section 2.6).
As observed in Figure 10a, in all cases, the results obtained for Experiment 2 (mesophilic) were higher than those obtained for Experiment 1 (thermophilic) in terms of net recovered energy balance. Upgrading to biomethane, either through membranes (Scenario 2) or through microalgae cultivation (Scenario 3), proved to be superior in terms of net energy recovery compared to co-generation (Scenario 1). The same trend is observed in terms of GHG emissions in Figure 10b. Although all experiments and scenarios resulted in negative process emissions, the most favorable case is Scenario 3 from Experiment 2.

4. Discussion

The results derived from monitoring and controlling the AnMBR pilot plant for microalgae and primary sludge AcoD and utilizing the implemented ICA system exhibit remarkable stability during long-term operation. Mesophilic and thermophilic conditions were evaluated, both yielding high methane production and demonstrating the effective AD of microalgae biomass despite its challenging biodegradability. The co-digestion of microalgae with primary sludge and the integration of the ultrafiltration membrane into the system further enhanced the microalgae’s degradability [12,18]. In addition, the employed harvesting system (cross-flow ultrafiltration membranes) has previously shown a significant pretreatment effect in enhancing microalgae biodegradability [39].
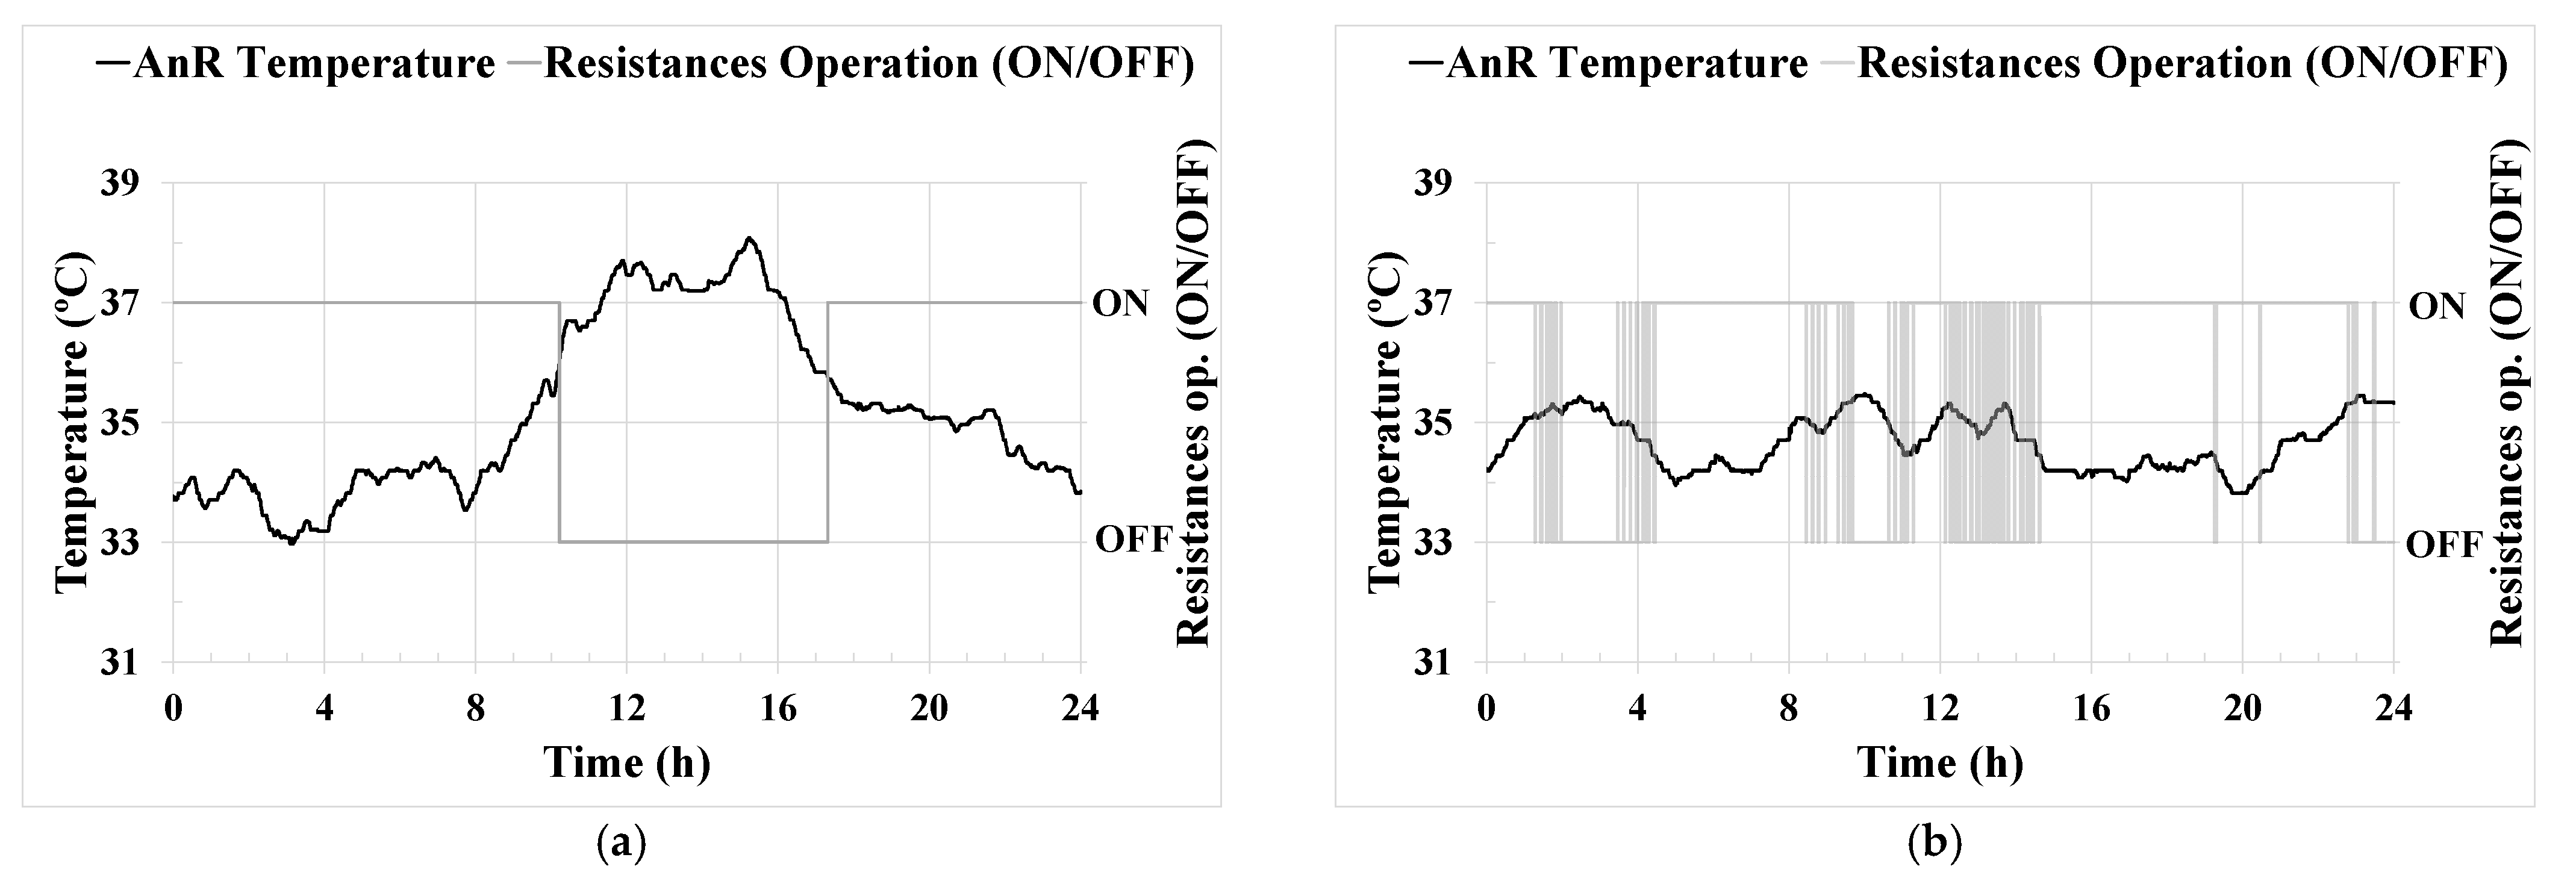
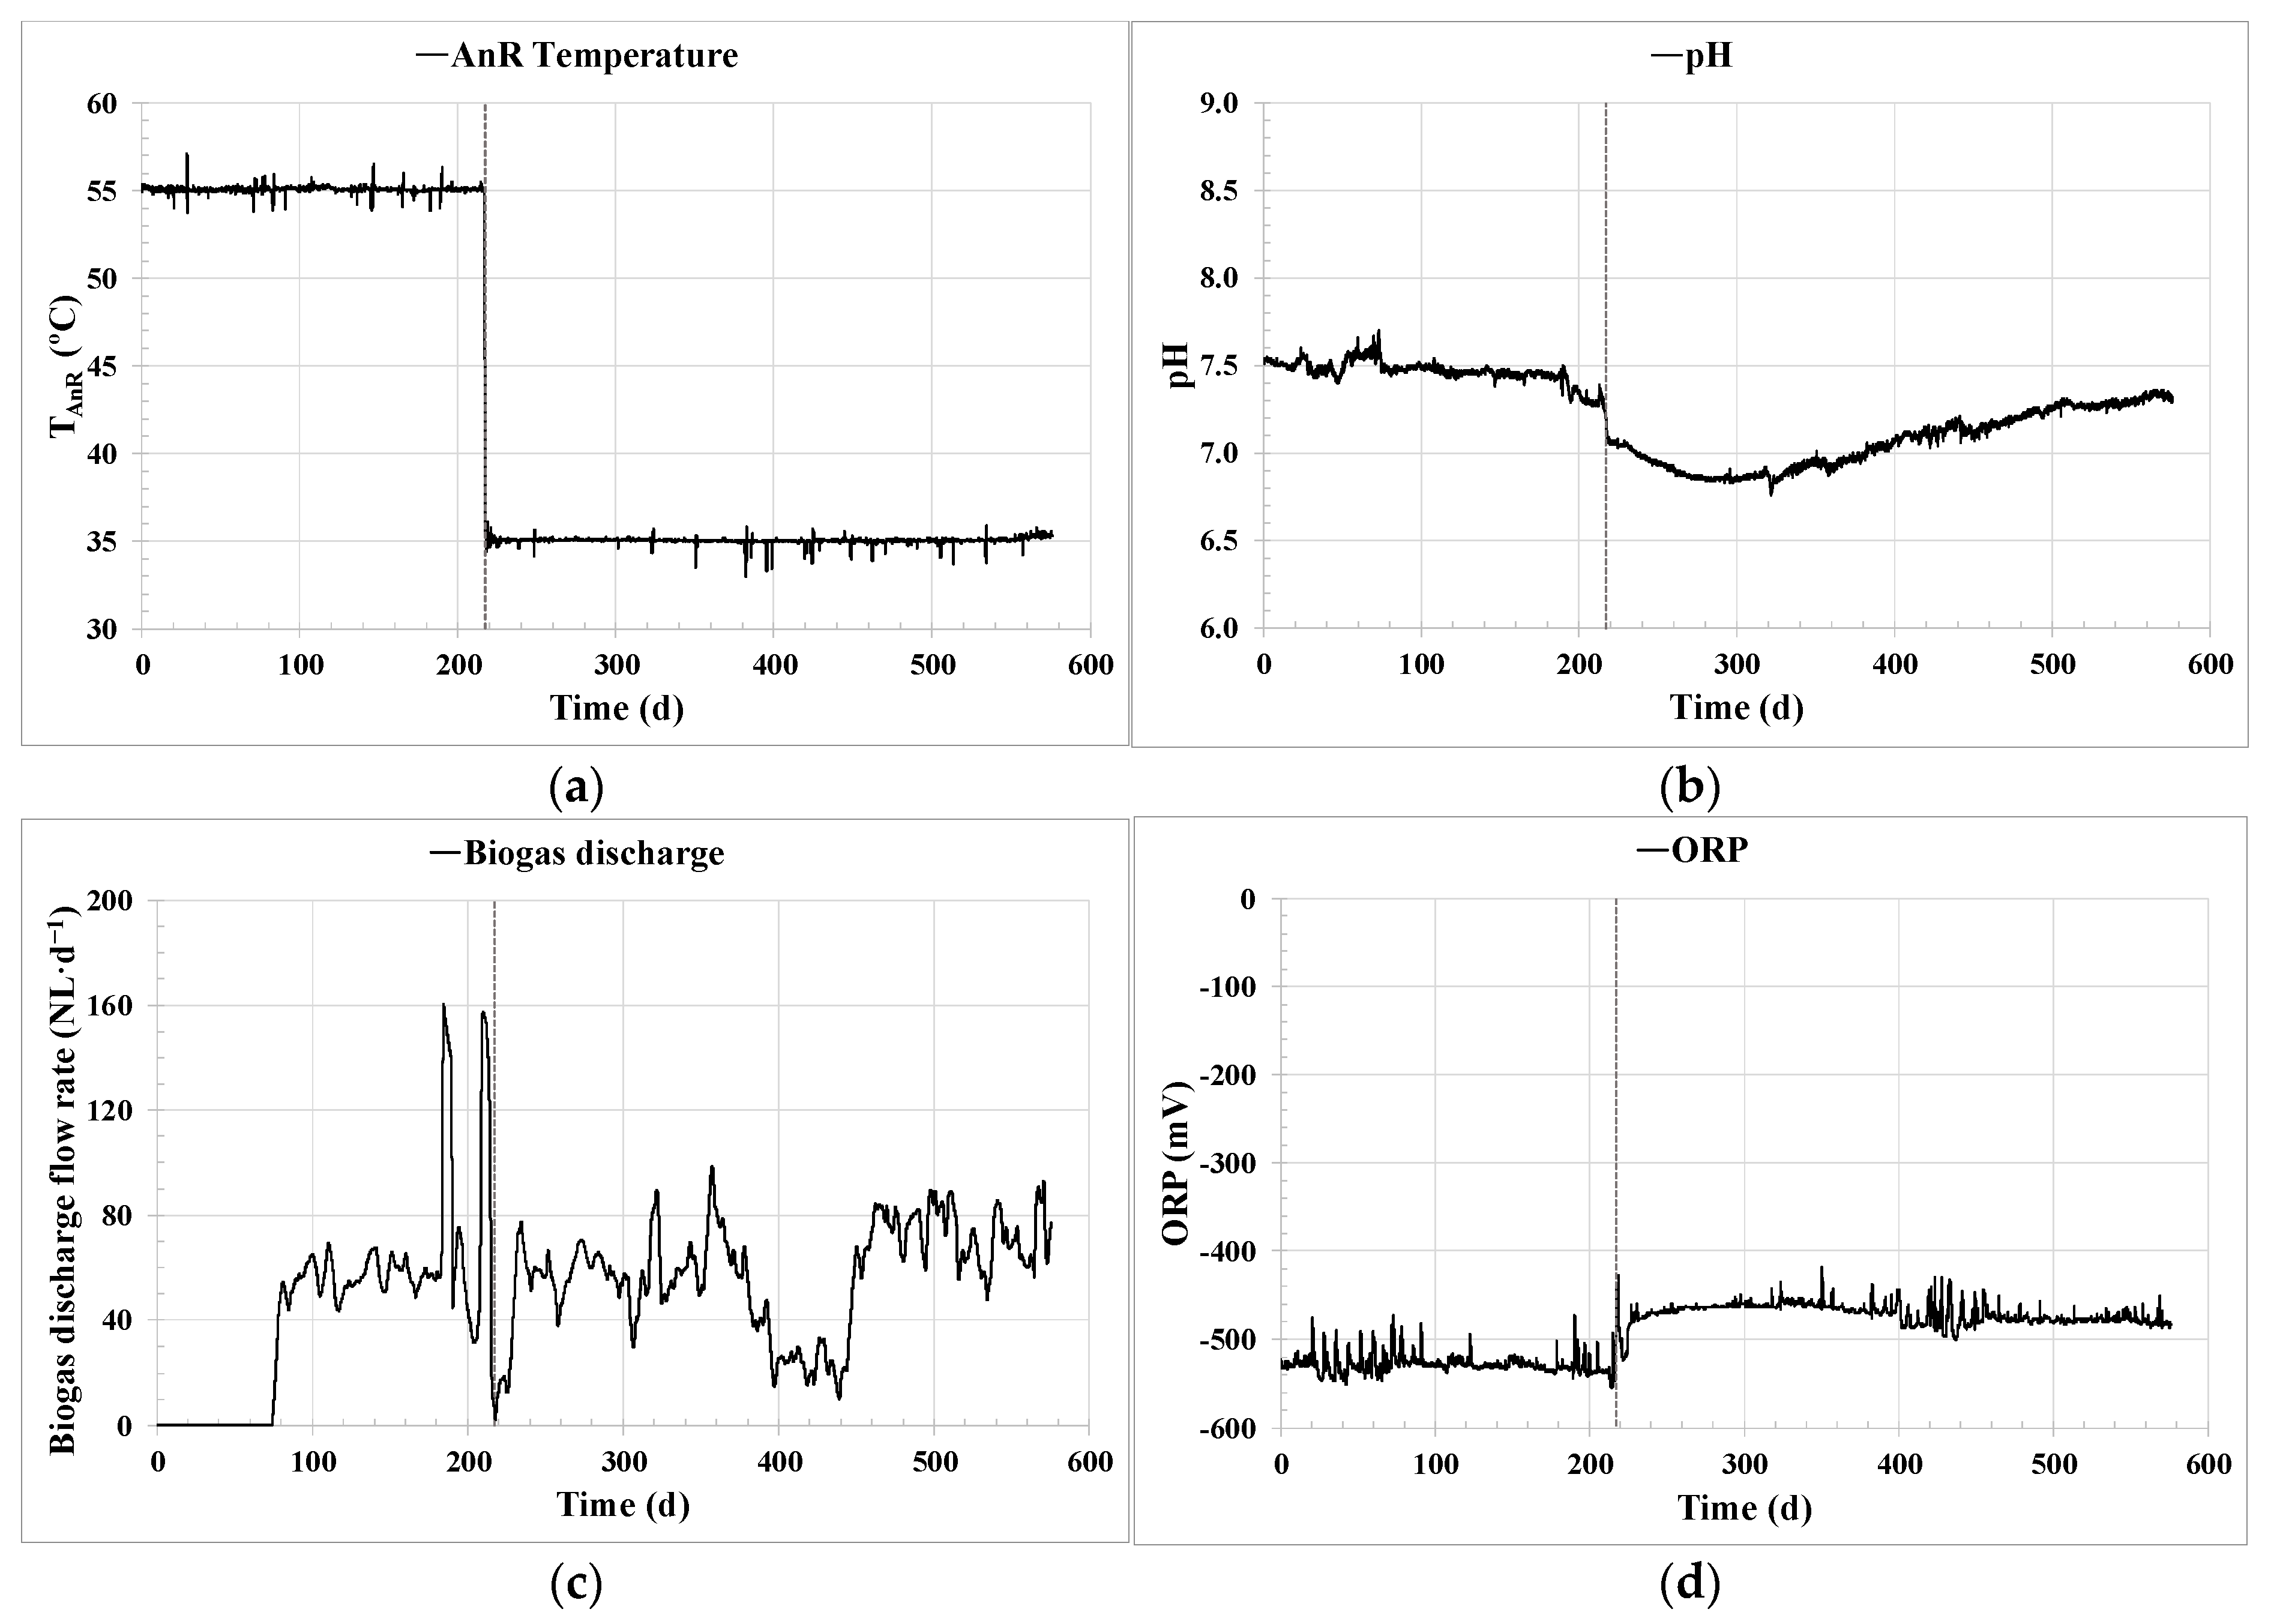
Effective key parameter control was achieved through the implemented ICA system. Regarding the control of the AnR temperature, Figure 3b shows the significant improvement in temperature stability achieved around the set point established by the PID controller. The temperature maintained in the pilot plant was in the optimum operational range found in the literature [21], and the PID controller performance was similar to other comparable monitoring processes [40], reaching a standard deviation of only 0.5%. This steady temperature control corresponds to the consistent long-term operation demonstrated in Figure 6a. Likewise, optimizing energy consumption to maintain the AnR process temperature prevents unnecessary oscillations and peaks. Temperature control is vital for maintaining a stable microbial community in the digester, as previously reported in [17]. In this study [17], an important effect on the microbial community was observed at a peak of 30 °C during the operation of a thermophilic anaerobic co-digester at the lab scale.
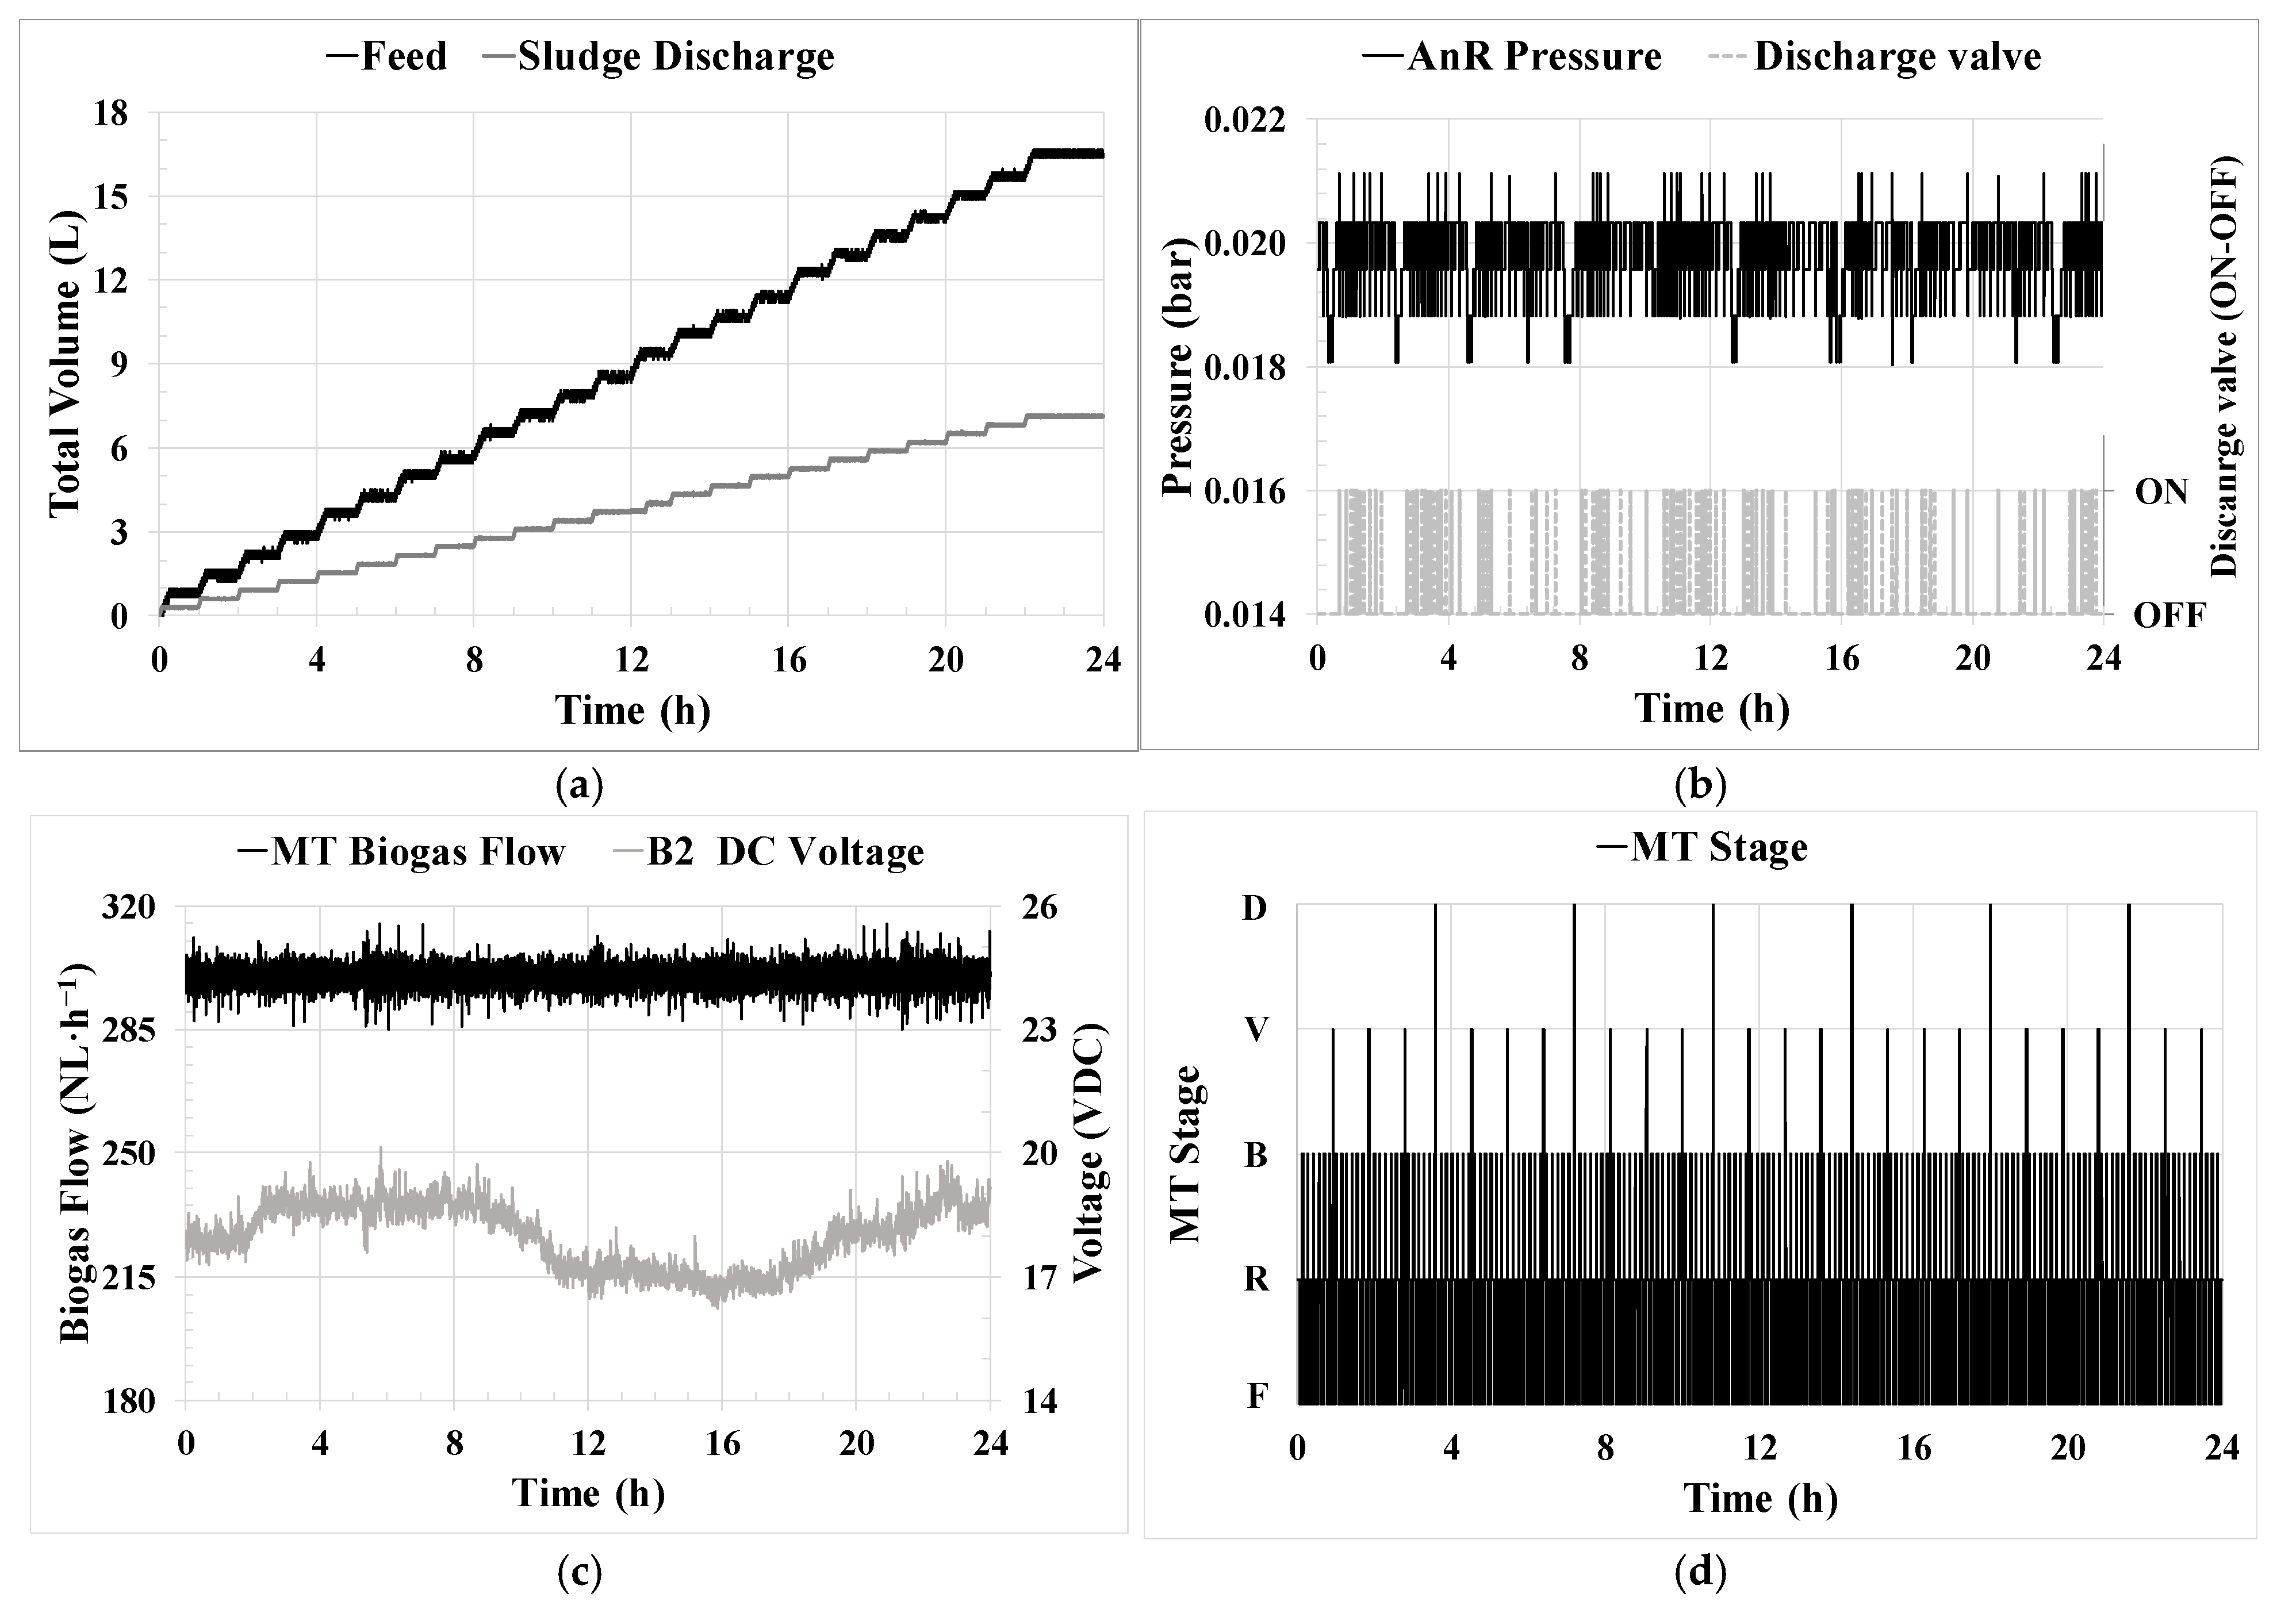
Similarly, the control philosophy implemented in the ICA for the SRT and HRT parameters (Figure 5a) ensured the regulation of feed and waste flows by distributing them in various cycles throughout the day. This also contributes to the microbiological stability of the process by avoiding load peaks that can induce a redistribution in the microbial community [41,42], and it enables efficient pump operation through the use of frequency converters.
The steadiness and optimization achieved in the process using ICA are also reflected in the observed stability in maintaining the AnR head pressure, as shown in Figure 5b, as well as the highly robust values observed throughout Experiments 1 and 2 for the pH (Figure 6b) and ORP (Figure 6d), showing a similar trend to other monitoring processes found in the literature [21]. ORP proved to be of great importance for the early detection and immediate repair of possible leaks in the biogas line, which is one of the major issues that can occur in anaerobic systems.
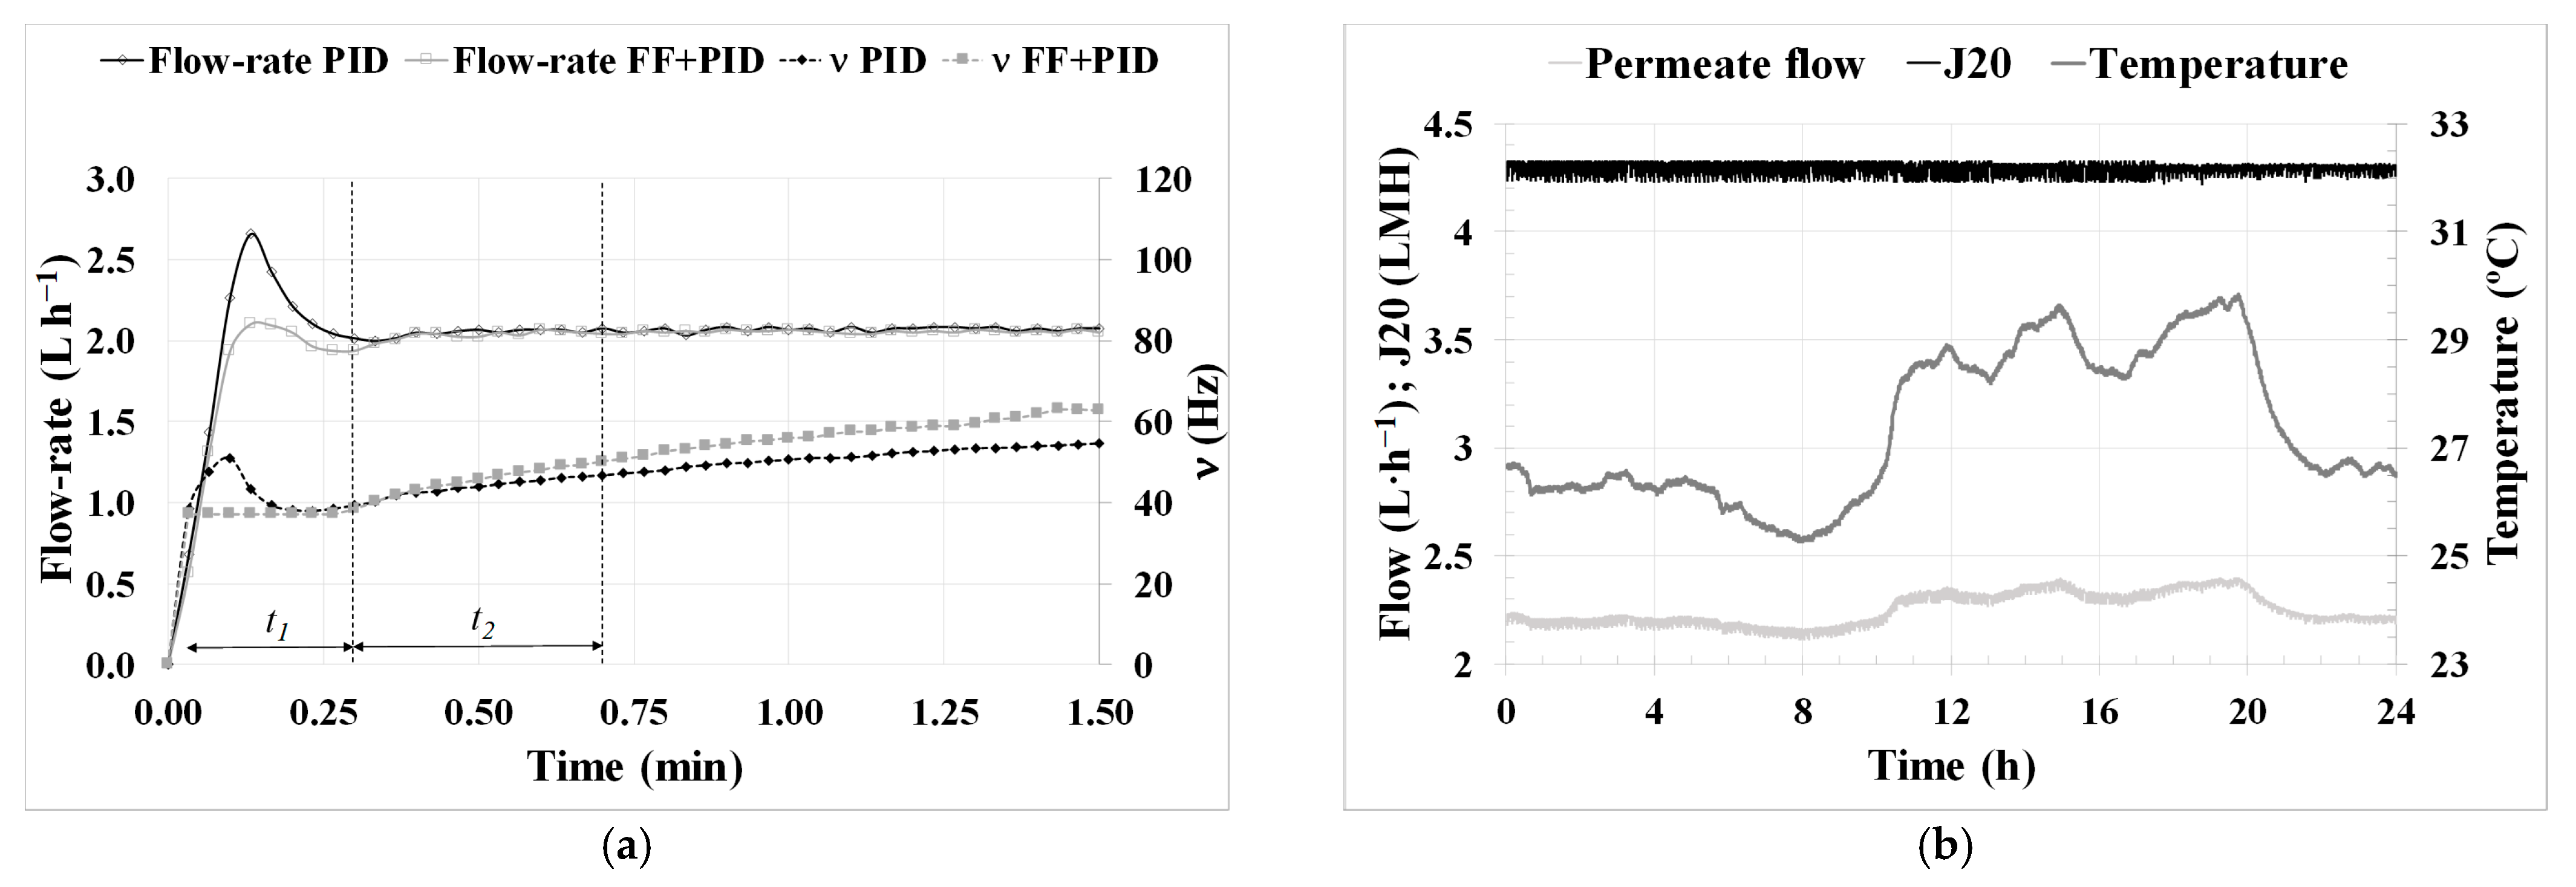
Regarding the lower-layer controllers related to permeate flow, the use of an FF in the PID control and the use of a ‘J20 mode’ enabled the reliable execution of critical flow tests and the determination of the optimal technical and economic conditions for filtration in an AnMBR co-digestion pilot plant, as can be observed in Figure 4a.
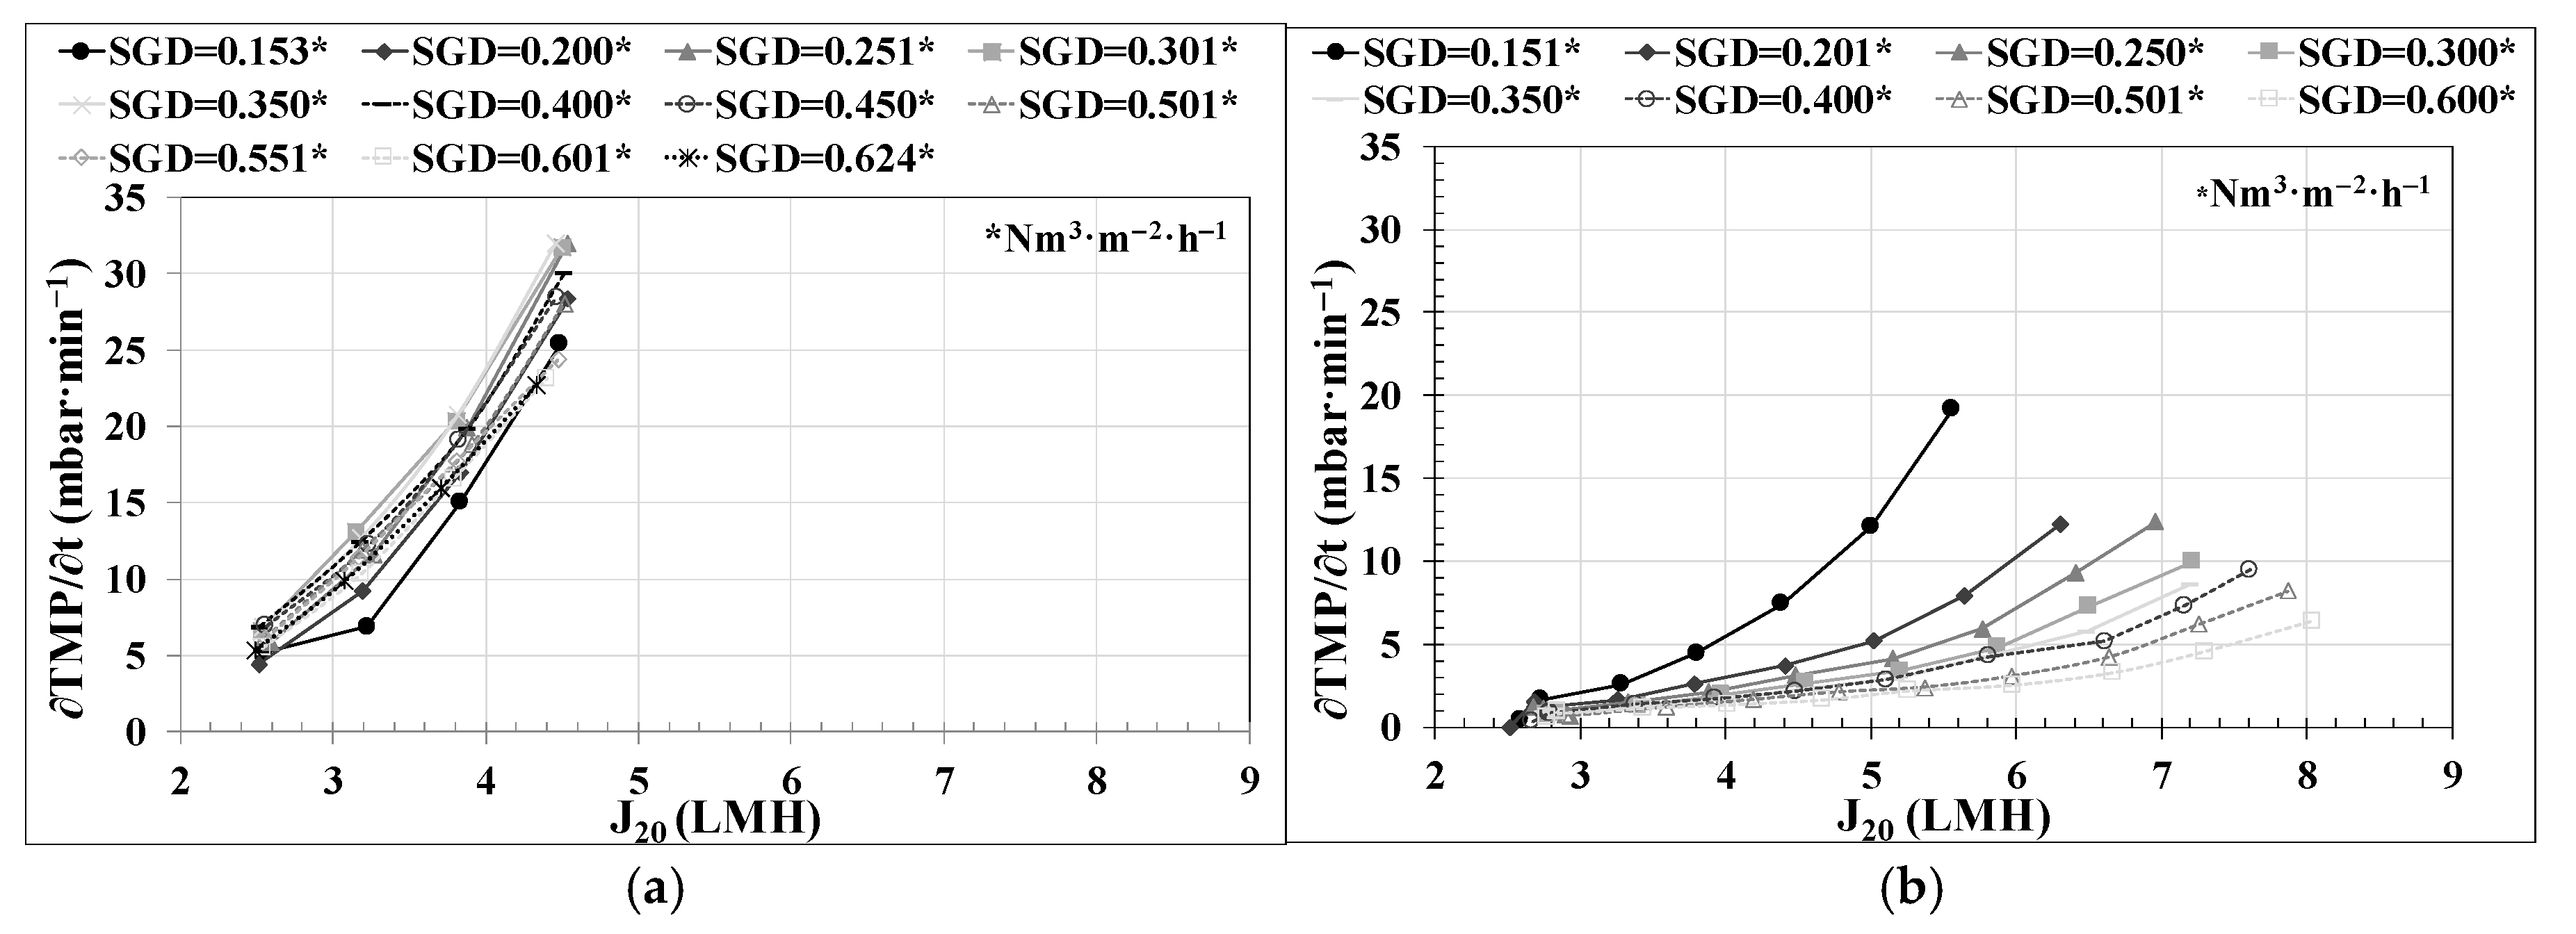
The performance of the filtration process was assessed over the entire experimental period while employing two different membranes, as detailed in Section 2.2. The fouled membrane used during periods (i) to (iii) (Table 1) enabled a good filtration performance, conducting only physical cleanings when necessary. However, it exhibited a 33% higher fouling rate compared to periods when a new membrane was employed (from (iv) to (vii)). This increase in fouling rate, aside from using a previously fouled membrane, could also be attributed to the J20, which averaged 23% higher in periods from (i) to (iii).
The validation of the results obtained during critical flux testing over the 154 days of long-term operation in period (v) highlights the remarkable filtration performance. The system was operated under subcritical conditions, even reducing the SGD to the lowest possible level. Building on this success, an experiment (vi) was conducted to test an increase in flux up to supercritical conditions. However, this led to a significant increase in the fouling rate, which could negatively impact filtration performance if sustained over time. From the analysis of the performance of the new membrane throughout Experiment 2, it can be confirmed that operating it with a back flush every two basic filtration-relaxation cycles, maintaining subcritical flow conditions, and keeping SGD low ensure optimal technical and economic operating conditions that guarantee proper long-term operation.
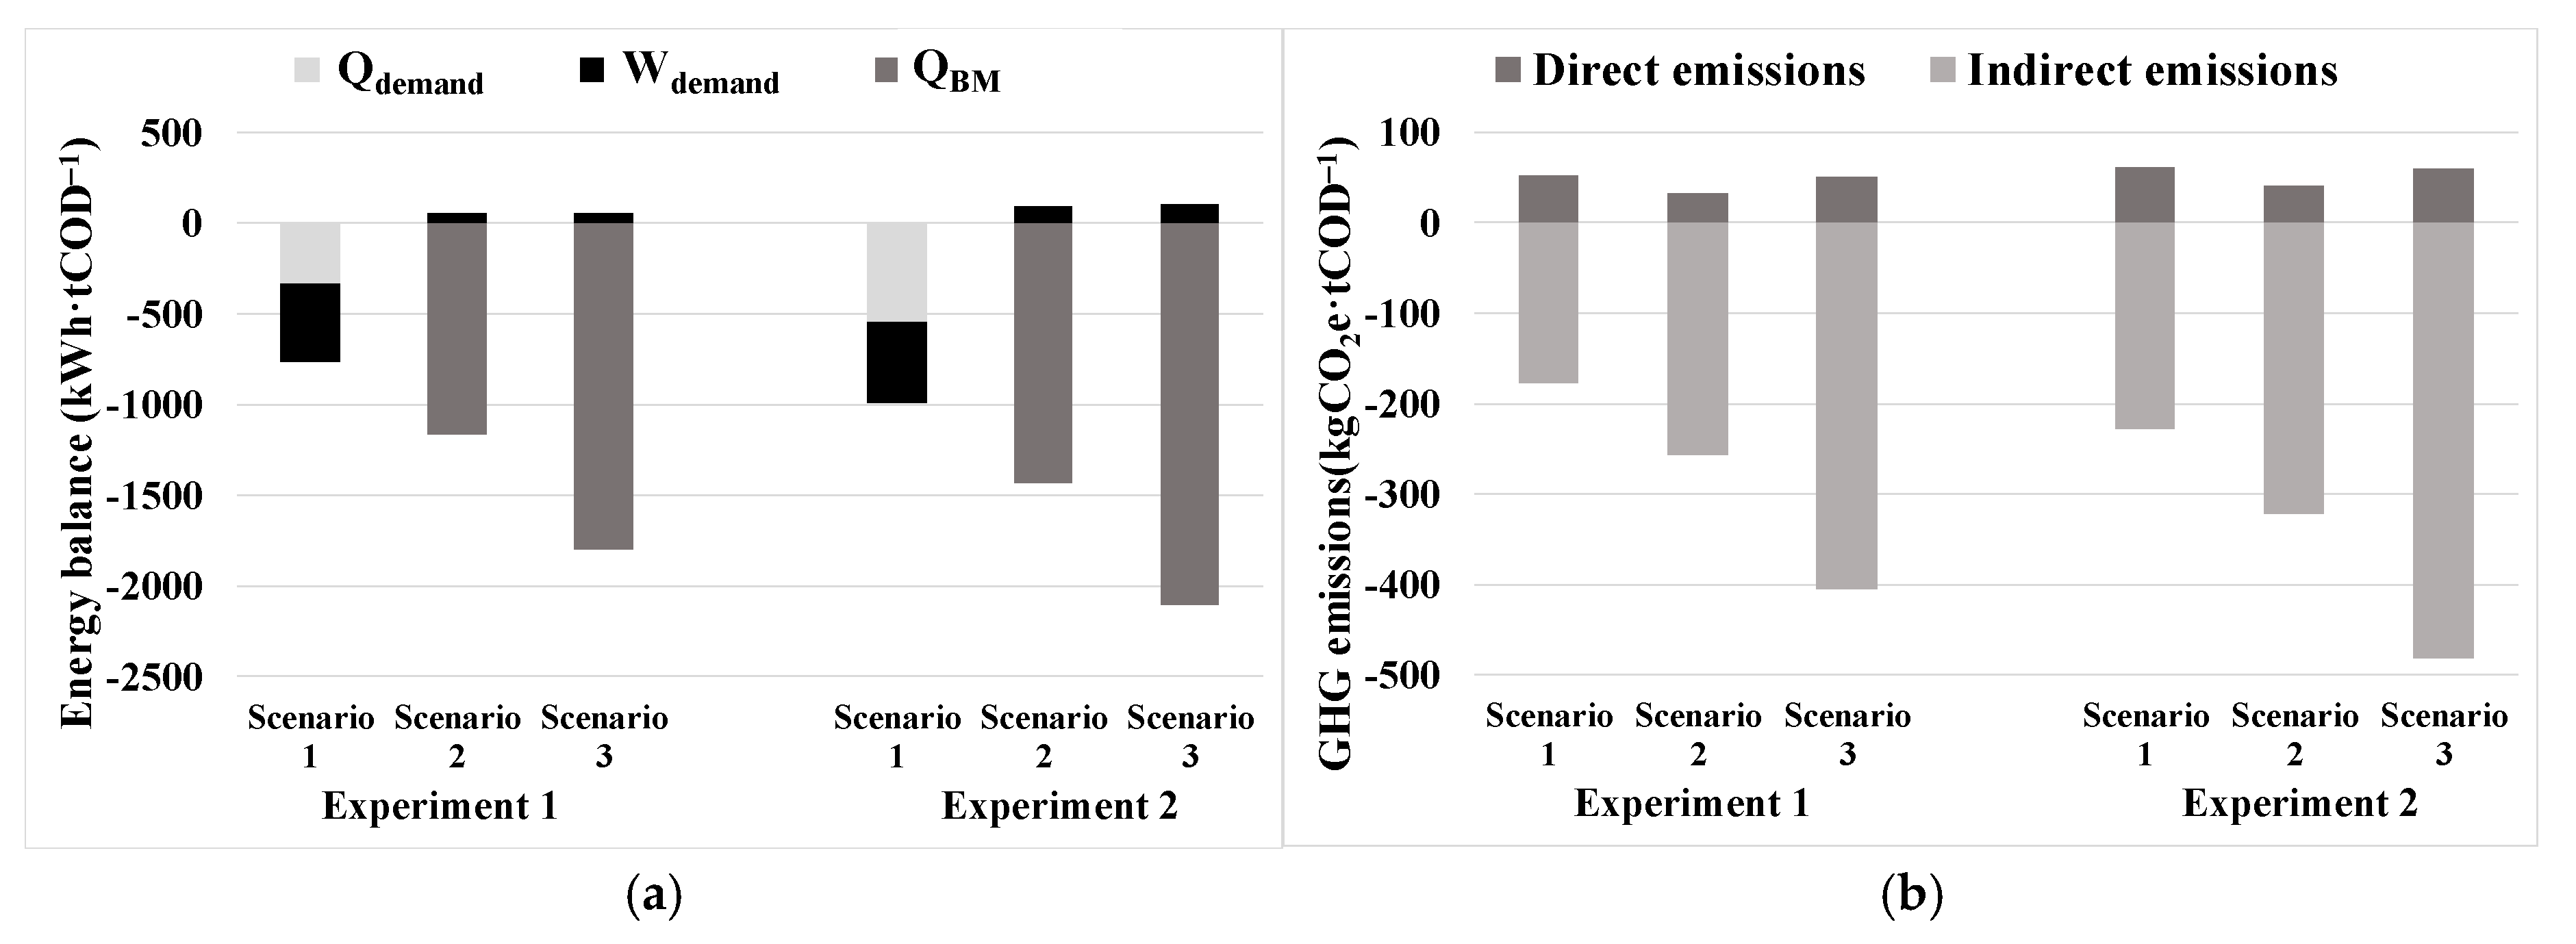
The energy and GHG assessments revealed the significant superiority of Scenarios 2 and 3, which included biogas upgrading to biomethane and its injection into the natural gas grid, over Scenario 1, which included co-generation. The mesophilic conditions (Experiment 2) also outperformed the thermophilic ones (Experiment 1), showcasing promising results. In terms of energy recovery, the values for the different scenarios of Experiment 2 would be 22–34% higher than in Experiment 1, and in terms of GHG emissions, the total avoided emissions would be 19–34% higher in Experiment 2. Scenario 2 appears to be a good alternative, as it involves the separation of CO2 from biogas using membranes. This separation results in two streams: one containing biomethane and another containing biogenic CO2. Both streams could be valorized productively, contributing to resource recovery. Nevertheless, Scenario 3 emerges as the most favorable option concerning both energy recovery and GHG emission avoidance, as microalgae would capture the CO2 from biogas in their biomass during the upgrading stage, resulting in higher CH4 production in the AnR.
The significance of GHG emission reduction is highlighted by the comparison of results between Scenario 3 of Experiment 2, the most favorable case, and Scenario 1 of Experiment 1, the least favorable case. Scenario 3 in Experiment 2 would produce a recovery of 2001 kWh·tCOD−1 treated in the AnMBR pilot plant, a remarkable 161% higher than Scenario 1 in Experiment 1. Moreover, in terms of GHG emissions, Scenario 3 in Experiment 2 would avoid the emission of 423 kgCO2e·tCOD−1 treated in the AnMBR pilot plant, a substantial 238% higher reduction compared to the least favorable Scenario 1 of Experiment 1. This value corresponds to 513 kgCO2e·tDM−1, which is consistent with the order of magnitude seen in other similar experiments [43]. These findings emphasize the crucial importance of reducing GHG emissions in AnMBR technology for environmental sustainability and its potential impact on the circular economy by maximizing energy recovery and minimizing GHG.
AnMBR systems combine two complex processes: AD and membrane filtration. Establishing the most suitable operating parameters for both the start-up and long-term operation of these facilities is challenging. The definition of the ICA system presented in this work, coupled with the analysis and validation of the appropriate conditions for long-term ultrafiltration membrane operation, as well as the GHG assessment to determine the most favorable biogas valorization scenario, serve as valuable guidelines for the implementation of such technological solutions. The guidelines provided in this work for AnMBRs’ long-term operation play a crucial role in effectively introducing circularity into the wastewater treatment sector, enabling the integration of AnMBR technology and promoting sustainable practices for resource recovery in WRRFs.

5. Conclusions

A robust ICA system for AnMBR co-digestion pilot plants is presented in this paper. It has been implemented and tested in a continuously operated pilot plant for almost two years. Several lower-layer control loops were implemented and described, allowing for suitable, stable, and optimized process performance. The improved permeate flow-rate controller reduced the IAE by a 23% with respect to the regular PID, and the AnR temperature controller reached a standard deviation of only 0.5%. The high level of flexibility provided by the developed ICA system enabled the optimization of the AnMBR performance, the rapid detection of any process issues, and allowed operators to take early corrective actions. The remarkable methane yield of 215 NmLCH4·gCODinf−1 achieved in Experiment 2 could not have been obtained without the implemented ICA. Similarly, the ICA system ensured optimal and reliable membrane performance, facilitating a technical-economic assessment through critical flow tests in terms of TAEC and showing a competitive cost of 0.0016 EUR/m3. These operating conditions that were established as optimal in the critical flow tests were validated in the long term, demonstrating that the operation was viable and could be sustained over time for a J20 of around 4.2 LMH, an SGD of 0.15 Nm3·m−2·h−1, and the performance of a back-flush stage every two basic cycles of filtration-relaxation. However, further analyses are required to optimize the functioning of the membranes. Finally, different scenarios were established for the net energy and GHG assessment. The results confirmed that the most favorable scenario is the combination of the AnMBR co-digestion pilot plant under mesophilic conditions (35 °C) with microbiological upgrading of biogas to biomethane based on microalgae technology, followed by its injection into the natural gas grid. This scenario would avoid the emission of 423 kgCO2e·tCOD−1. The presented optimal scenario, along with the key guidelines provided throughout the manuscript for AnMBR operation and ICA implementation, offers a promising approach to maximize energy recovery and reduce GHG, highlighting the potential of the emerging AnMBR technology for promoting sustainable practices in the circular economy context of the wastewater sector.

Author Contributions

J.F.M.-S.: conceptualization, methodology, investigation, formal analysis, writing—original draft. R.S.-G.: conceptualization, methodology, writing—original draft. A.B.: supervision; writing—review and editing. A.S.: supervision, writing—review and editing, funding acquisition. M.V.R.: supervision, writing—review and editing. All authors have read and agreed to the published version of the manuscript.

Funding

This research work was supported by the Science and Innovation Spanish Ministry (Projects CTM2014-54980-C2-1-R/C2-2-R) and the European Regional Development Fund (ERDF), which are gratefully acknowledged. Generalitat Valenciana supported this study via fellowship APOTI/2016/56 to the first author. The Science and Innovation Spanish Ministry have also supported this study via a pre-doctoral FPI fellowship to the second author (BES-2015-071884, Project CTM2014-54980-C2-1-R). The authors would also like to acknowledge the support received from the Universitat Politècnica de València (C13182).

Data Availability Statement

The datasets generated during and/or analysed during the current study are confidential.

Conflicts of Interest

The authors declare no conflict of interest.

References

  1. Smith, A.L.; Stadler, L.B.; Cao, L.; Love, N.G.; Raskin, L.; Skerlos, S.J. Navigating Wastewater Energy Recovery Strategies: A Life Cycle Comparison of Anaerobic Membrane Bioreactor and Conventional Treatment Systems with Anaerobic Digestion. Environ. Sci. Technol. 2014, 48, 5972–5981. [Google Scholar] [CrossRef] [PubMed]
  2. Aslam, A.; Khan, S.J.; Shahzad, H.M.A. Anaerobic membrane bioreactors (AnMBRs) for municipal wastewater treatment- potential benefits, constraints, and future perspectives: An updated review. Sci. Total Environ. 2022, 802, 149612. [Google Scholar] [CrossRef]
  3. Abdelrahman, A.M.; Ozgun, H.; Dereli, R.K.; Isik, O.; Ozcan, O.Y.; Van Lier, J.B.; Ozturk, I.; Ersahin, M.E. Anaerobic membrane bioreactors for sludge digestion: Current status and future perspectives. Crit. Rev. Environ. Sci. Technol. 2020, 51, 2119–2157. [Google Scholar] [CrossRef]
  4. Robles, A.; Jiménez-Benítez, A.; Giménez, J.B.; Durán, F.; Ribes, J.; Serralta, J.; Ferrer, J.; Rogalla, F.; Seco, A. A semi-industrial scale AnMBR for municipal wastewater treatment at ambient temperature: Performance of the biological process. Water Res. 2022, 215, 118249. [Google Scholar] [CrossRef] [PubMed]
  5. Hu, Y.; Cai, X.; Du, R.; Yang, Y.; Rong, C.; Qin, Y.; Li, Y.Y. A review on anaerobic membrane bioreactors for enhanced valorization of urban organic wastes: Achievements, limitations, energy balance and future perspectives. Sci. Total Environ. 2022, 820, 153284. [Google Scholar] [CrossRef] [PubMed]
  6. Kong, Z.; Wu, J.; Rong, C.; Wang, T.; Li, L.; Luo, Z.; Ji, J.; Hanaoka, T.; Sakemi, S.; Ito, M.; et al. Large pilot-scale submerged anaerobic membrane bioreactor for the treatment of municipal wastewater and biogas production at 25 °C. Bioresour. Technol. 2021, 319, 124123. [Google Scholar] [CrossRef]
  7. Shin, C.; Bae, J. Current status of the pilot-scale anaerobic membrane bioreactor treatments of domestic wastewaters: A critical review. Bioresour. Technol. 2018, 247, 1038–1046. [Google Scholar] [CrossRef]
  8. Smith, A.L.; Stadler, L.B.; Love, N.G.; Skerlos, S.J.; Raskin, L. Perspectives on anaerobic membrane bioreactor treatment of domestic wastewater: A critical review. Bioresour. Technol. 2012, 122, 149–159. [Google Scholar] [CrossRef]
  9. Moreira, V.R.; Carpanez, T.G.; Dos Santos, F.S.; Santos, L.S.; Dos Santos-Fernandes, D.; França-Neta, L.S.; Lange, L.C.; Santos Amaral, M.C. Circular economy in biorefineries: Scale-up of anaerobic/aerobic membrane bioreactors for vinasse recycling. J. Clean. Prod. 2022, 377, 134448. [Google Scholar] [CrossRef]
  10. Bianco, F.; Race, M.; Forino, V.; Pacheco-Ruiz, S.; Rene, E.R. Chapter 4: Bioreactors for wastewater to energy conversion: From pilot to full scale experiences. In Waste Biorefinery: Value Addition through Resource Utilization; Elsevier: Amsterdam, The Netherlands, 2021; pp. 103–124. [Google Scholar] [CrossRef]
  11. Jimenez-Benitez, A.; Ferrer, J.; Rogalla, F.; Vazquez, J.R.; Seco, A.; Robles, A. 12-Energy and environmental impact of an anaerobic membrane bioreactor (AnMBR) demonstration plant treating urban wastewater. In Current Developments in Biotechnology and Bioengineering: Advanced Membrane Separation Processes for Sustainable Water and Wastewater Management—Case Studies and Sustainability Analysis; Elsevier: Amsterdam, The Netherlands, 2020; pp. 289–310. [Google Scholar] [CrossRef]
  12. Saratale, R.G.; Kumar, G.; Banu, R.; Xia, A.; Perisayasamy, S.; Saratale, G.D. A critical review on anaerobic digestion of microalgae and macroalgae and co-digestion of biomass for enhanced methane generation. Bioresour. Technol. 2018, 262, 319–332. [Google Scholar] [CrossRef]
  13. Cheng, H.; Li, Y.; Hu, Y.; Guo, G.; Cong, M.; Xiao, B.; Li, Y.Y. Bioenergy recovery from methanogenic co-digestion of food waste and sewage sludge by a high-solid anaerobic membrane bioreactor (AnMBR): Mass balance and energy potential. Bioresour. Technol. 2021, 326, 124754. [Google Scholar] [CrossRef]
  14. Greses, S. Anaerobic Degradation of Microalgae Grown in the Effluent from an Anaerobic Membrane Bioreactor (AnMBR) Treating Urban Wastewater. Universitat de València. 2017. Available online: http://roderic.uv.es/handle/10550/65377 (accessed on 2 June 2023).
  15. Olsson, J.; Feng, X.M.; Ascue, J.; Gentili, F.G.; Shabiimam, M.A.; Nehrenheim, E.; Thorin, E. Co-digestion of cultivated microalgae and sewage sludge from municipal waste water treatment. Bioresour. Technol. 2014, 171, 203–210. [Google Scholar] [CrossRef] [PubMed]
  16. Serna-García, R.; Mora-Sánchez, J.F.; Sanchis-Perucho, P.; Bouzas, A.; Seco, A. Anaerobic membrane bioreactor (AnMBR) scale-up from laboratory to pilot-scale for microalgae and primary sludge co-digestion: Biological and filtration assessment. Bioresour. Technol. 2020, 316, 123930. [Google Scholar] [CrossRef] [PubMed]
  17. Serna-García, R.; Borrás, L.; Bouzas, A.; Seco, A. Insights in the biological process performance and microbial diversity during thermophilic microalgae co-digestion in an Anaerobic Membrane Bioreactor (AnMBR). Algal Res. 2020, 50, 101981. [Google Scholar] [CrossRef]
  18. Robles, A.; Ruano, M.V.; Charfi, A.; Lesage, G.; Heran, M.; Harmand, J.; Seco, A.; Steyer, J.-P.; Batstone, D.J.; Kim, J.; et al. A review on anaerobic membrane bioreactors (AnMBRs) focused on modelling and control aspects. Bioresour. Technol. 2018, 270, 612–626. [Google Scholar] [CrossRef]
  19. Steyer, J.P.; Bernard, O.; Batstone, D.J.; Angelidaki, I. Lessons learnt from 15 years of ICA in anaerobic digesters. Water Sci. Technol. 2006, 53, 25–33. [Google Scholar] [CrossRef]
  20. Jimenez, J.; Latrille, E.; Harmand, J.; Robles, A.; Ferrer, J.; Gaida, D.; Wolf, C.; Mairet, F.; Bernard, O.; Alcaraz-Gonzalez, V.; et al. Instrumentation and control of anaerobic digestion processes: A review and some research challenges. Rev. Environ. Sci. Biotechnol. 2015, 14, 615–648. [Google Scholar] [CrossRef]
  21. Nguyen, D.; Gadhamshetty, V.; Nitayavardhana, S.; Kumar Khanal, S. Automatic process control in anaerobic digestion technology: A critical review. Bioresour. Technol. 2015, 193, 513–522. [Google Scholar] [CrossRef]
  22. Robles, A.; Durán, F.; Ruano, M.V.; Ribes, J.; Rosado, A.; Seco, A.; Ferrer, J. Instrumentation, control, and automation for submerged anaerobic membrane bioreactors. Environ. Technol. 2015, 36, 1795–1806. [Google Scholar] [CrossRef]
  23. Van Lier, J.; Tilche, A.; Ahring, B.K.; Macarie, H.; Moletta, R.; Dohanyos, M.; Hulshoff Pol, L.W.; Lens Pand Verstraete, W. New perspectives in anaerobic digestion. Water Sci. Technol. 2001, 43, 1–18. [Google Scholar] [CrossRef] [PubMed]
  24. Steyer, J.P.; Bouvier, J.C.; Conte, T.; Gras, P.; Sousbie, P. Evaluation of a four year experience with a fully instrumented anaerobic digestion process. Water Sci. Technol. 2002, 45, 495–502. [Google Scholar] [CrossRef] [PubMed]
  25. Korres, N.; Nizami, A.S. Variation in anaerobic digestion: Need for process monitoring. In Bioenergy Production by Anaerobic Digestion Using Agricultural Biomass and Organic Waste; Taylor and Francis; Routledge: London, UK, 2013; pp. 194–231. [Google Scholar] [CrossRef]
  26. Ferrero, G.; Rodriguez-Roda, I.; Comas, J. Automatic control systems for submerged membrane bioreactors: A state-of-the-art review. Water Res. 2012, 46, 3421–3433. [Google Scholar] [CrossRef] [PubMed]
  27. Nabi, M.; Liang, H.; Zhou, Q.; Cao, J.; Gao, D. In-situ membrane fouling control and performance improvement by adding materials in anaerobic membrane bioreactor: A review. Sci. Total Environ. 2023, 865, 161262. [Google Scholar] [CrossRef] [PubMed]
  28. González-Camejo, J.; Serna-García, R.; Viruela, A.; Pachés, M.; Durán, F.; Robles, A.; Ruano, M.V.; Barat, R.; Seco, A. Short and long-term experiments on the effect of sulphide on microalgae cultivation in tertiary sewage treatment. Bioresour. Technol. 2017, 244, 15–22. [Google Scholar] [CrossRef] [PubMed]
  29. Seco, A.; Aparicio, S.; González-Camejo, J.; Jiménez-Benítez, A.; Mateo, O.; Mora-Sánchez, J.F.; Noriega-Hevia, G.; Sanchis-Perucho, P.; Serna-García, R.; Zamorano-López, N.; et al. Resource recovery from sulphate-rich sewage through an innovative anaerobic-based water resource recovery facility (WRRF). Water Sci. Technol. 2018, 78, 1925–1936. [Google Scholar] [CrossRef]
  30. Pretel, R.; Robles, Á.; Ruano, M.V.; Seco, A.; Ferrer, J. Filtration process cost in submerged anaerobic membrane bioreactors (AnMBRs) for urban wastewater treatment. Sep. Sci. Technol. 2012, 51, 517–524. [Google Scholar] [CrossRef]
  31. Parravicini, V.; Nielsen, P.H.; Thornberg, D.; Pistocchi, A. Evaluation of greenhouse gas emissions from the European urban wastewater sector, and options for their reduction. Sci. Total Environ. 2022, 838, 156322. [Google Scholar] [CrossRef]
  32. Eriksson, O. Environmental Technology Assessment of Natural Gas Compared to Biogas. In Natural Gas; Potocnik, P., Ed.; InTechOpen: London, UK, 2010; pp. 127–146. [Google Scholar]
  33. Muller, O.; Bricker, P.; Laurin, B.; Mouton, L. Climate Change and Electricity, European Carbon Factor, Benchmarking of CO2 Emissions by Europe’s Largest Electricity Utilities, 21st ed.; INIS-FR--22-0804; International Atomic Energy Agency: Vienna, Austria, 2022. [Google Scholar]
  34. Ardolino, F.; Cardamone, G.F.; Parrillo, F.; Arena, U. Biogas-to-biomethane upgrading: A comparative review and assessment in a life cycle perspective. Renew. Sustain. Energy Rev. 2021, 139, 110588. [Google Scholar] [CrossRef]
  35. Riley, D.M.; Tian, J.; Güngör-Demirci, G.; Phelan, P.; Villalobos, J.R.; Milcarek, R.J. Techno-Economic Assessment of CHP Systems in Wastewater Treatment Plants. Environments 2020, 7, 74. [Google Scholar] [CrossRef]
  36. Bright Biomethane; Purepac Grand: Enschede, The Netherlands, 2023. Available online: https://www.brightbiomethane.com/ (accessed on 28 June 2023).
  37. Mendez, L.; Garcia, D.; Perez, E.; Blanco, S.; Munoz, R. Photosynthetic upgrading of biogas from anaerobic digestion of mixed sludge in an outdoors algal-bacterial photobioreactor at pilot scale. J. Water Process Eng. 2022, 48, 102891. [Google Scholar] [CrossRef]
  38. Zamalloa, C.; Boon, N.; Verstraete, W. Anaerobic digestibility of Scenedesmus obliquus and Phaeodactylum tricornutum under mesophilic and thermophilic conditions. Appl. Energy 2012, 92, 733–738. [Google Scholar] [CrossRef]
  39. Giménez, J.B.; Bouzas, A.; Carrere, H.; Steyer, J.-P.; Ferrer, J.; Seco, A. Assessment of cross-flow filtration as microalgae harvesting technique prior to anaerobic digestion: Evaluation of biomass integrity and energy demand. Bioresour. Technol. 2018, 269, 188–194. [Google Scholar] [CrossRef] [PubMed]
  40. Logan, M.; Safi, M.; Lens, P.; Visvanathan, C. Investigating the performance of internet of things based anaerobic digestion of food waste. Process Saf. Environ. Prot. 2019, 127, 277–287. [Google Scholar] [CrossRef]
  41. Greses, S.; Zamorano-López, N.; Borrás, L.; Ferrer, J.; Seco, A.; Aguado, D. Effect of long residence time and high temperature over anaerobic biodegradation of Scenedesmus microalgae grown in wastewater. J. Environ. Manag. 2018, 218, 425–434. [Google Scholar] [CrossRef] [PubMed]
  42. Braz, G.H.R.; Fernandez-Gonzalez, N.; Lema, J.M.; Carballa, M. Organic overloading affects the microbial interactions during anaerobic digestion in sewage sludge reactors. Chemosphere 2019, 222, 323–332. [Google Scholar] [CrossRef] [PubMed]
  43. Niu, D.-J.; Huang, H.; Dai, X.-H.; Zhao, Y.-C. Greenhouse gases emissions accounting for typical sewage sludge digestion with energy utilization and residue land application in China. Waste Manag. 2013, 33, 123–128. [Google Scholar] [CrossRef]
Figure 1. Anaerobic membrane bioreactor co-digestion pilot plant: (a) real photograph; (b) simplified layout, including the lower-layer controllers. Nomenclature: ET: equalization tank; AnR: anaerobic reactor; FT: foam trap; MT: membrane tank; DV: degasification vessel; CIP: clean-in-place; tank WT: waste tank; P: pump; P-M: membrane-related pump; B: blower; Ri: resistances; pH: pH transmitter; ORP: oxidation-reduction potential transmitter; FIT: liquid-flow-rate transmitter; GFIT: gas-flow-rate transmitter; LIT: level transmitters; PIT: liquid pressure transmitters; GPIT: gas pressure transmitters; TT: temperature transmitters; FC: frequency converter; DCC: direct current converter; [1]: HRT controller; [2]: SRT controller; [3]: permeate flow/flux controller; [4]: AnR temperature controller; [5]: biogas MT flow controller; [6]: pressure controller; [7]: MT operating stage control.
Water 15 03225 g001
Figure 2. Arrangement of individual steps in a regular-membrane operating mode.
Water 15 03225 g002
Figure 3. Action of the lower-layer controllers governing the anaerobic reactor (AnR) temperature by regulating the operation time of a resistance. Evolution of (a) AnR temperature using an on–off controller, maintaining a temperature set point of 35 °C with a hysteresis of 0.25 °C and (b) AnR temperature using a PID controller that divides the day into several cycles and manipulates the operation time of each cycle, maintaining a temperature set point of 35 °C.
Water 15 03225 g003
Figure 4. Performance of the lower-layer controller governing the permeate flow (set point of 2.05 L·h−1), with a filtration time of 1.5 min. (a) Evolution of permeate flow, operating with a PID controller and a PID controller with an initial fixed frequency (FF) (t1 = 0.25 min and t2 = 0.375 min), and frequency order (ν); (b) performance of the 20 °C-normalized flux (J20) mode for permeate flow controller.
Water 15 03225 g004
Figure 5. Performance of lower-layer controllers. (a) Hydraulic retention time (HRT) controller (set point: 16.67 L·d−1) and solids retention time (SRT) controller (set point: 7.14 L·d−1); (b) anaerobic reactor (AnR) pressure control (set point:0.02 bar; hysteresis:0.005 bar); (c) membrane tank (MT) biogas flow controller acting over direct current (DC) voltage (set point: 300 L·h−1); (d) MT operation stage controller (scheme: α = 2, β = 13, γ = 50).
Water 15 03225 g005
Figure 6. Long-term monitoring of biological process: (a) anaerobic reactor (AnR) temperature; (b) AnR pH; (c) biogas discharge flow rate; (d) AnR oxidation-reduction potential (ORP). All vertical dashed lines indicate the start of Experiment 2 at Day 217.
Water 15 03225 g006
Figure 7. Short-term critical flux trials. Effect of specific gas demand (SGD) and 20°-normalized permeate flux (J20) on fouling rate at (a) 25.2 g·L−1 of mixed liquor suspended solids in the membrane tank (MLSSMT) and (b) 13.9 g·L−1 of MLSSMT.
Water 15 03225 g007
Figure 8. Short-term critical flux trials. (a) Effect of specific gas demand (SGD) on the weak form of critical flux (JCW20); (b) total annualized equivalent cost (TAEC) of the different filtration conditions vs. mixed liquor suspended solids in the membrane tank (MLSSMT).
Water 15 03225 g008
Figure 9. Performance of ultrafiltration membranes in long-term operation. SGD: specific gas demand; J20: 20 °C-normalized permeate flux; δTMP/δt: fouling rate; MLSSMT: mixed liquor suspended solids in the membrane tank. A dark gray vertical line has been used to separate processes of Experiments 1 and 2. An intermediate gray dashed line indicates the moment when the fouled membrane was removed and a new membrane was installed. The remaining boundaries between membrane operation periods under different conditions have been marked using vertical dotted lines in a light gray color. Red arrows indicate the implementation of each physical membrane cleaning.
Water 15 03225 g009
Figure 10. Energy balance and GHG assessment in the AnMBR co-digestion pilot plant: (a) energy balance in terms of Qdemand, Wdemand, and QBM; (b) direct and indirect GHG emissions.
Water 15 03225 g010
Table 1. Operational conditions for the different filtration periods.
Filtration PeriodOperation Period (Days)AnR
Experiment
MembraneJ20
(LMH)
SGD
(Nm3·m−2·h−1)
MLSSMT
(g·L−1)
(i)1–1101Fouled *3.51 ± 0.010.650 ± 0.00515.4 ± 0.9
(ii)111–2171Fouled *3.50 ± 0.070.850 ± 0.00714.6 ± 0.8
(iii)218–3232Fouled *2.75 ± 0.010.849 ± 0.00715 ± 1.0
(iv)324–4772New4.12 ± 0.010.153 ± 0.00214 ± 1.0
(v)478–5282New5.543 ± 0.0050.150 ± 0.00213.1 ± 0.1
(vi)529–5572New4.115 ± 0.0020.150 ± 0.00112.3 ± 0.9
(vii)558–5762New4.115 ± 0.0010.850 ± 0.00311.8 ± 0.3
Notes: AnR: anaerobic reactor; J20: 20 °C-normalized permeate flux; SGD: specific gas demand; MLSSMT: mixed liquor suspended solids in the membrane tank. * Membrane previously used in other experiments, i.e., with a non-negligible contribution of irreversible fouling.
Table 2. Anaerobic co-digestion pilot plant performance data.
Experiment 1Experiment 2
Biogas production and removal efficiencies
Biodegradability (%)52.6 ± 1.961.7 ± 2.0
Methane yield (NmlCH4·gCODinf−1)189 ± 8215 ± 6
Methane biogas content (%)62 ± 569.1 ± 1.2
Influent
NH4-N (mg·L−1)154 ± 4597 ± 20
TS (mg·L−1)11,872 ± 104813,100 ± 2000
TSS (mg·L−1)9797 ± 100511,558 ± 1323
Effluent
pH7.5 ± 0.17.2 ± 0.1
VFA (mg CH3COOH·L−1)523 ± 3513.1 ± 15.4
Alk (mg CaCO3·L−1)1906 ± 672060 ± 110
TS (mg·L−1)14,013 ± 92911,450 ± 660
NH4-N (mg·L−1)508 ± 20397 ± 33
Reference[29][16]
Notes: CH4: methane; NH4-N: ammonium; TS: total solids; TSS: total suspended solids; VFA: volatile fatty acids; Alk: alkalinity.
Disclaimer/Publisher’s Note: The statements, opinions and data contained in all publications are solely those of the individual author(s) and contributor(s) and not of MDPI and/or the editor(s). MDPI and/or the editor(s) disclaim responsibility for any injury to people or property resulting from any ideas, methods, instructions or products referred to in the content.

