Article

Bentonite-Clay/CNT-Based Nano Adsorbent for Textile Wastewater Treatment: Optimization of Process Parameters

1
Department of Chemical Engineering, University of Engineering and Technology, GT Road, Lahore 54890, Pakistan
2
Institute of Environmental Engineering and Research (IEER), University of Engineering and Technology, GT Road, Lahore 54890, Pakistan
3
Biotechnology Research Center, Technology Innovation Institute, Masdar City, Abu Dhabi P.O. Box 9639, United Arab Emirates
4
Department of Civil and Environmental Engineering, United Arab Emirates University, Al Ain P.O. Box 15551, United Arab Emirates
5
National Water and Energy Center, United Arab Emirates University, Al Ain P.O. Box 15551, United Arab Emirates
*
Author to whom correspondence should be addressed.
Water 2023, 15(18), 3197; https://doi.org/10.3390/w15183197
Submission received: 4 August 2023 / Revised: 25 August 2023 / Accepted: 30 August 2023 / Published: 7 September 2023
(This article belongs to the Special Issue Advanced Applications of Nanoparticles in Water and Wastewater)

Abstract

:
Dyes are the most carcinogenic organic compounds that are discarded by most of the textile industries without any prior treatment, which is harmful for the environment. This study aims to develop a bentonite-clay/carbon-nanotube (CNT)-based adsorbent to treat textile wastewater for water sustainability. The preliminary and post-characterization of adsorbent involves scanning electron microscopy (SEM), Fourier transform infrared spectroscopy (FTIR), and Brunauer–Emmett–Teller (BET) and energy-dispersive X-ray (EDX) analysis to determine the changes in surface morphology, functional group, and surface area of the adsorbent. Linear and nonlinear isotherms and kinetic studies were performed to explore the sorption mechanism. The results show that the nonlinear form of the Langmuir isotherm best fits adsorption with a qmax of 550 mg/g. The adsorption followed the nonlinear pseudo-first-order kinetics, favoring chemisorption with R2 ≈ 1 and X2 = 0.22. Maximum dye removal (89.9%) was achieved under the optimum conditions of pH 3, an adsorbent dose of 100 mg, and a contact time of 120 min, with an initial COD concentration of 1140 mgL−1. This study has demonstrated the successful application of a bentonite-clay/CNT-based adsorbent on textile wastewater treatment.

1. Introduction

Rapid urbanization and industrialization necessitate the investigation of low-cost, environmentally friendly wastewater treatment techniques [1]. The textile sector is the second largest among the industries, producing high volumes of wastewater. The dyes used in the textile for coloring are toxic and carcinogenic for marine life and humans. Almost 20% of the dyes are released in the wastewater without further treatment, which may also harm crops and agriculture [2]. Scarcity and water pollution are serious global problems affecting public health and the environment. Various biological, physical, and chemical methods are used for treating textile wastewater [3]. The biological techniques include trickling filters. Activated sludge provides efficient dye removal but produces a massive amount of sludge that may require special sludge handling and safe disposal [4]. Physical methods, including membrane filtration, dialysis, electrodialysis, and ion exchange, are the most effective for removing persistent dyes. Still, they are unsuitable on a bulk or industrial scale because of the associated fouling problems [5]. Chemical methods like ion exchange, disinfection, and coagulation–flocculation are time-consuming and do not provide efficient removal. The above-mentioned methods are expensive, time-consuming, inefficient, and do not totally remove organic compounds from wastewater.
There are several disadvantages of the adsorption process reported in the literature such as the slow rate of adsorption, chemisorption seldom being reversible, recovery of active sites, active site poisoning, competition of adsorption in multiple pollutants, etc. Therefore, it is indeed important to study the effectiveness of an adsorbent in challenging conditions such as real-world wastewater matrixes. However, adsorption is a simple, easy, and economical wastewater treatment method, compared with other available methods. Adsorption has excellent potential for treating textile wastewater due to its enhanced adsorption capacity compared to ozonation and other advanced treatment methods that may be expensive, time-consuming, and lead to the formation of by-products which is, in some cases, may be more toxic than the initial pollutant [6].
Adsorption demonstrates high removal efficiency compared to other conventional treatment methods. Due to the extremely small size of the adsorbent and the enhanced sorption capacity, nanomaterials have proven to be a promising tool for wastewater treatment. Carbon nanotubes can remove biological contaminants from wastewater more effectively than activated carbon, specializing their use towards biological pollutants. Carbon nanotubes (CNTs) are usually expensive to apply in such settings; CNTs are combined with different adsorbents to increase their sorption capacity. Further studies are still required to overcome the most recent challenges regarding nanomaterials [7]. CNTs are sp2 hybridized and are combined with different adsorbents due to the strong van-der Waals and intermolecular form of attraction; thus, a supporting material is required to assist the dispersion of CNTs in the clay matrix for a better adsorption performance [8]. Carbon-based CNTs (carbon fibers, graphene) are utilized for the waste treatment due to their tremendous adsorption capacity. Clay minerals (bentonite) have also been used independently because of their high adsorption ability. The adsorption properties of bentonite have been extensively investigated, including its surface area, pore size, pore volume, and the pros and cons of clay minerals. To improve adsorption capacity and remove bulky organic adsorbate microorganisms, clay-based nanocomposites and CNTs have been developed. Bacteria would be efficient adsorbents for wastewater treatment, unlike activated carbon, which is costly and limited to removing bulky organic adsorbate, due to its microporous structure [9].
Carbon-based CNTs (carbon fibers, graphene) are widely used for wastewater treatment. Activated carbon, due to its substantial adsorption capacity, has been widely used for wastewater treatment but is costly, which limits its usage on a large commercial scale. The reusability, adsorption capacities, and desorption rates of CNTs are far better than that of other adsorbents. CNT-based adsorbents have been widely studied with regard to their ability to remove dyes from wastewater [10], and their removal efficiencies are comparable to those of the carbon-dependent sorbents used for commercial purposes. A maximum sorption capacity of 76.92 mg.g−1 was observed for acid-functionalized MWCNTs in removing Ismate violet 2R at 120 min and a pH of 4, with an initial concentration of 10 mgL−1 [11]. The 98.7% of cationic dyes were removed by using 40 mg of MWCNTs with an initial concentration of 10 mgL−1 in 80 min [12]. A total of 95% of methylene red dye was removed from an aqueous solution with an initial concentration of 35 mgL−1 and a pH of 6 in 30 min [13]. The treatment of organic pollutants with MWCNTs, involving mechanisms such as π–π interactions, electrostatic interactions, hydrophobic interactions, hydrogen bonding, and Lewis acid–base interactions have demonstrated the need for additional investigation [14]. CNTs are expensive and hydrophobic and when combined with different adsorbents via strong van-der Waals and intermolecular forms of attraction provides better dispersion of CNTs in aqueous solution [15]. Nanoclays (bentonite) have been widely independently used because of their availability, low cost, high adsorption ability, and removal efficiency. Many researchers have tried to increase the adsorption properties of bentonite, such as its surface area, pore size, and pore volume, along with addressing the pros and cons of other clay minerals [16]. Acid treatment, treatment with organic and inorganic compounds, and calcination mainly enhance the surface area, porosity, and adsorption capacity [17]. More than 90% removal of methylene blue was achieved using 0.0 g of Iraqi bentonite with an initial concentration of 10 mgL−1, a sorption capacity of 256 mgg−1, and a pH of 5.60 in 120 min [18]. A comparative study has investigated the adsorption capacities of acidified and raw bentonite clay for the adsorption of Congo red dye under operating conditions of pH, time, adsorbent dose, and dye concentration. After treatment with citric acid, the pore diameter increased from 8.06 nm to 11.7 nm, increasing the adsorption capacity from 250 mgg−1 to 384 mgg−1 [19]. Due to the swelling properties, and aggregation issues of clay limits its usage for large and bulk-scale operations that’s why clay is modified with some acids base or immobilized on some surface of metal oxides to enhance surface area and adsorption capacity.
Moreover, the adsorption process involves the nonlinear interaction of various process variables; thus, the classical and conventional method for process optimization is no longer effective because it takes a lot of effort, time, and experimental runs. Additionally, the method does not explain the interaction of all operating variables. To overcome such limitations, scientists provide statistical, mathematical, and experimental designs like response surface methodology (RSM) to optimize all the process variables involved in the sorption process. RSM is a mathematical and statistical tool for the design of experiments. The statistical model was developed by studying the effect of various process variables by varying the process variables simultaneously. The prime focus of RSM is to provide the optimum process conditions in a limited time by reducing number of the experimental runs [20].
The five-level central composite design and three-level Box-Behnken in RSM are the most commonly used fractional factorial designs. CCDs are more accurate, robust, and non-ratable designs, containing axial points outside the cube. With CCD, we can quickly estimate the second-order and first-order terms. The face-centered CCD is the most commonly selected in the adsorption as per the literature, where all of the central or axial points lie in the center, ensuring repeatability and reproducibility by reducing the five-level CCD design to three-level, thus reducing the number of experimental runs, cost, effort, and time [21].
The present research involves the treatment of real textile wastewater via modified bentonite clay CNT adsorbent in a batch mode. The operational parameters (pH, adsorbent dose, and contact time) were optimized using the RSM-CCD approach. The adsorption kinetics and equilibrium, both linear and nonlinear, were studied and compared. The thermodynamic study has been performed to check the feasibility and economics of the absorbent. The effects of adsorption on surface roughness, porosity, and size distribution have been evaluated using an image processing technique. The parametric conditions for dye removal and COD reduction in real wastewater were studied. It is essential to mention that clay-based carbon nanotubes were utilized as an effective adsorbents for various pollutants in previous studies. However, in previous studies, only synthetic aqueous solutions were used to investigate the effectiveness of the proposed adsorbent.
On the other hand, in the current study, for the first time, we have examined the adsorption of the proposed material in real textile wastewater. Real textile wastewater is more complex and challenging than aqueous solutions in investigating the effectiveness of an adsorbent. Moreover, we have also applied response surface methodology (RSM) for process modeling and optimization. This research may bring about environmental and economic benefits, bringing us closer to achieving the United Nations’ sustainable development goals.

2. Materials and Methods

2.1. Materials

The textile wastewater sample was obtained from Siddiqsons Dyeing and Printing Industries (Pvt) Ltd., from the dying sector of Lahore, Pakistan. The sample was stored in the refrigerator at 4 °C until used. The bentonite clay (natural montmorillonite, particle size less than 2 µm) was purchased from Merck (Darmstadt, Germany), and commercial MWCNTs OD (20–40 nm), 90% purity, and 0.07 g cm−3 bulk density were purchased from Sigma-Aldrich (Burlington, VT, USA) and used raw material. Alumina (Al2O3, ≥90%), manganese dioxide (MNO2 ≥ 90%, 5.03 g/cm3 density), ethanol (≥98%, 0.789 g/mL), and dimethylformamide (DMF, ≥99.5%, 0.949 g/cm3) were purchased from Merck (Darmstadt, Germany); 0.1 M hydrochloric acid (37% purity) and 0.1 M sodium hydroxide were used to maintain the pH of the solution. The initial characterization of textile wastewater was performed and is shown in Table 1.

2.2. Adsorbent Preparation

2.2.1. Fabrication of MWCNTs with Bi-Metallic Oxide

The multiwall CNTs were modified via the wet impregnation method, as shown in Figure 1. An amount of 1.5 g of multiwall carbon nanotubes were modified with a 5 g mixture of bi-metallic oxides (Al2O3 and MnO2, 1:1), by adding in a 150 mL of ethanol (as a solvent for both CNTs and metal oxides), and the sample was sonicated in an ultrasonic bath for one hour. After impregnation, the solvent evaporated when placed in a beaker in a convection oven at 80 °C for drying. For four hours, put the solid product in a muffle furnace for calcination at 350 °C. This leads to the attachment of metal oxides (Al2O3 and MnO2) on the surface of CNTs [10]. The oxide phase is generated after calcination [22].

2.2.2. Acid Activation of Bentonite Clay

For acid functionalization of clay, 200 g of bentonite clay was soaked in 271.5 mL of 5 M sulfuric acid for 24 h at 25 °C in a beaker and washed thoroughly with distilled water several times until the pH was neutralized. The resultant mixture was centrifuged at 3000 rpm for 10 min and allowed to dry in an oven at 105 °C for 24 h to separate the bentonite clay from the resultant mixture. This modification increases the Si/Al ratio and solubility of Al cations from the octahedral layer of bentonite clay. The composition altered with the acid functionalization; this decreased the content of Al2O3, MgO, K2O, CaO, etc., in the treated clay. The decrease in the Al2O3 in the treated sample was attributed to the leaching Al+3 due to hydrolysis increasing the Si/Al ratio. This rapid removal of Al+3 ion from the octahedral layer of bentonite clay leads to an increase in silica content. The cations are replaced with the H+ ions of the mineral acid with the dissolution of the structural cations, i.e., Si4+ and Al3+. This results in the development of new pores and strongly protonated surfaces, resulting in a considerable rise in the surface with enhanced surface area and adsorption capacity [23].

2.2.3. Synthesis of Bentonite/CNT-Al2O3-MnO2

The fabrication of Clay-CNT nanocomposite was carried out via the solution-blending method. The composite provides better adsorption capacity even if it is in the trace levels and causes -CONH bonding, as confirmed by the reflection at 1500 cm−1 in the FTIR spectrum [10]. Bentonite clay is a supporting material for the impregnation of MWCNTs. To overcome the hydrophobic and aggregation issues of MWCNTs for this purpose, combine equal volumes of both acidified bentonite clay and impregnated MWCNTs with 500 mL of DMF [24]; a common solvent was selected to assist the uniform dispersion and high solubility for clay and MWCNTs (MWCNTs show better dispersion and stability with DMF in comparison to other solvents). Sonicate the mixture for 40 min and heat to 90 °C.
The mixture was placed in a round-bottomed flask equipped with a reflux condenser and placed on a hot plate to maintain the temperature at 90 °C, then refluxed for 24 h. The residue was then washed with distilled water, removed via centrifuging at 3000 rpm, and dried in an oven at 90 °C.

2.3. Design of Experiments

Batch experiments were performed in 250 mL Erlenmeyer flasks containing 50 mL of real textile wastewater at room temperature by varying the pH (3–8), adsorbent dosage (50–100) mg, and contact time (30–120 min at a 250 rpm in an orbital shaker (220 V/50 Hz, OS-1400)). After each run, the residual solution was centrifuged at 3000 rpm for 10 min and the absorbance value was analyzed using a UV-Vis spectrophotometer (Shimadzu UV-3100PC, Kyoto, Japan). A maximum absorbance wavelength of λmax of 535 nm was considered a reference or initial absorbance at time = 0. Figure 1b illustrates further analysis to determine the conditions for percentage of dye removal. These process variables and value ranges were selected based on the literature reports for the adsorption of dye [25]. The pH was adjusted using the portable pH meter, using the 0.1 M HCl and 0.1 M NaOH solutions. The percentage of dye removal here does not explain the amount of dye removed per unit of mass (qe) and the adsorption capacity of the adsorbent at equilibrium. Thus, the adsorption isotherm and kinetics study were performed by repeating the experiments at optimum conditions of adsorbent dose, pH, and time to evaluate the adsorption capacity, nature, and adsorption mechanism, as shown in Table 2. However, additional batch experiments were also performed on optimized conditions to investigate the influence of various process variables on the percentage of color removal measured via Equation (1). All experiments were repeated in duplicate, and the average of two values was considered for all calculations.
Dye   Removal   ( % ) = A 0 A I A o × 100
where Ao and Ai are the initial and equilibrium absorbance. The adsorption capacity was also determined via the following equation.
q e = ( C i C f )   V M
Ci and Cf are initial and final COD concentrations found using the standard HACH method, using the 8000 reactor digestion method [16]. The initial COD was 1140 ± 15 mg/L with 10 times dilution (DF = 10) [26]. M is the adsorbent amount in grams, V is the solution volume in liters, and qe is the adsorption capacity (mg/g) [18].

2.4. Response Surface Methodolofy for the Dye Removal from Textile Wastewater

Central Composite Design (CCD)

The focus of CCD is to set up and perform the experiments in such a way as to extract maximum data from the minimum number of experimental trials. The central idea is to alter all the relevant variables in a designed experimental series and then to interpret and relate the results simultaneously through mathematical modeling and statistical analysis. CCD is a combination of statistical and mathematical techniques which uses the data to analyze and provides significance to the data. The response of interest is influenced by three independent variables: solution pH, adsorbent dose, and contact time in the dye removal [20]. In this study, statistical analysis was performed using Design Expert 7 (STATE-EASE Ince., Minneapolis, MN, USA). Table 3 shows the variable ranges selected in the experiment design, while the statistical analysis of the response is mentioned in Table 4. All the experiments were conducted according to the CCD matrix, at random to avoid the possibility of any systematic errors in measurement. Therefore, randomization was used to mitigate the effect of unwanted factors such as noise. The variables were compared in the standard order: a sequenced, non-random combination of factors and levels.
The CCD contains eight factorial runs with six axial runs (six center runs) and six replicates at the center to verify the repeatability and reproducibility of the experimental data and generate twenty runs [27]. The axial points are located at the center where α = ±1. α is the distance of axial points from the center, making the design rotatable. We selected the CCD face-centered mode, where all the axial points are at the center. The design required three levels for each factor. N is the required number of experiments, and n is the number of variables.
N = 2 n + 2 n + n = 2 3 + 2 × 3 + 6 = 20
The second-order regression polynomial equation was selected to predict the dye removal efficiency based on the experimental analysis given by Equation (4):
Y = β + i = 1 3 β i x i + 1 3 β i i x i 2 + i = 1 3 β i j x 3 O + i = 1 3 β i j x i x j + ε
Here, y is the predicted response (dye removal); xi and xj are the coded independent variables; β0 is the constant and βi, βii, and βij, are the linear, quadratic, and interaction coefficients of adsorption respectively, and the term ε as the error. The experimental results of the effects of process variables on the response (% of decolorization) are shown in Table 4. The statistical significance of the fitted model, factors and their interactions, and validity were analyzed.

2.5. Characterization of Adsorbent

Chemical structural changes before and after adsorption were determined using a Fourier-transform infrared spectrophotometer (FTIR) (Shimadzu FTIR-8400 S spectrophotometer, Kyoto, Japan) in the 4000–500 cm−1 range. Scanning electron microscopy (SEM) (Zeiss, Supra, 35 VP, FESEM, Oberkochen, Germany,) at the accelerating voltage of 10 kV, was used to analyze the surface morphological changes before and after adsorption. Energy dispersive X-ray spectroscopy (EDS) was used to measure the elemental composition before and after adsorption. The surface area, pore size distribution, average pore volume, and pore diameter of the adsorbent before and after adsorption was measured from adsorption-desorption isotherms of liquid nitrogen at 77 K using BET apparatus (Brunauer-Emmett-Teller) porosity analyzer micrometric ASP 2020, V3.04H). The sample weight (0.1–0.2 g) was degassed for 12 h under a vacuum using nitrogen gas as a probe gas. The pHzc was measured via the typical salt addition method and was recorded as 4.5. For this purpose, the aliquot of 0.1 M NaNO3 (40 mL) was collected in six different Erlenmeyer flasks. The pH was adjusted between (3–8) using 0.1 M HCl and 0.1 M NaOH solutions. The absorbent quantity of 0.1 g in each flask was added and placed in an orbital shaker at 150 rpm for 24 h at room temperature. At equilibrium, filter the samples using Whatman filter paper No. 41. The filtrate’s pH was recorded, and the graph was plotted between the changed and initial pH values. The point where the difference in pH becomes zero would provide the pHzc [28].

3. Results

3.1. Fourier-Transform Infrared Spectroscopy

The changes in a functional group of modified clay CNT before and after adsorption were identified via the FTIR spectra shown in Figure 2. The sharp peaks at 1120–1000 cm−1 in the raw clay are due to the Si-O-Si bending. Two sharp peaks appear at 914 cm−1 and 990 cm−1 in the raw clay, showing the Al-Al-OH vibrations and Si-O-Al in the clay sheets [29]. The peaks at 778 cm−1, 688 cm−1, and 528 cm−1 are due to Al-Mg-OH, Si-O-Al, and Si-O-Al stretching present in the octahedral and tetrahedral sheets of raw bentonite. The absence of any peaks below 3000–1800 indicates there being no organic impurities present in the raw clay, pristine MWCNTs, or clay CNT, and no changes were observed after adsorption. A sharp peak at 1030 cm−1 represents the C-O bending in the pristine MWCNT structure [30]. The peaks from 1100–1200 cm−1 in the pristine CNTs show the C-H stretching of MWCNTs. Two sharp peaks were observed at 996 cm−1 and 900 cm−1, which were attributed to the C-C carbonyl stretching of pristine MWCNTs in the plane [31]. The sharp peaks at 517 cm−1, 520 cm−1 correspond to Si-Si, Si-O-Al stretching, and Si-Mn tetrahedral bending in the clay CNT due to the impregnation of metal oxides onto the surface of MWCNTs [31]. The different peaks from 520–800 cm−1 with varying intensities depict the loading of metal oxides, depending upon the nature of metals in clay CNT before adsorption [31]. After adsorption, the vibrational peaks become more intense and shift towards the right because of surface convergence due to dye molecules from real textile wastewater. The peak shifts after adsorption in the FTIR results show that the adsorption of dyes onto the nanoparticles may be due to electrostatic interaction and the π-π stacking of aromatic rings. This interaction may be due to the hydroxyl bonding (OH) between the oxygen-containing functional groups of clay CNT and the carbonyl functional groups of dyes, respectively. Hence, the appearance of the characteristic peaks below 700 cm−1 indicate the successful loading of metal oxides; the peaks at 996 cm−1 and 900 cm−1 clay-CNT indicate the successful synthesis of composite nanoparticles.
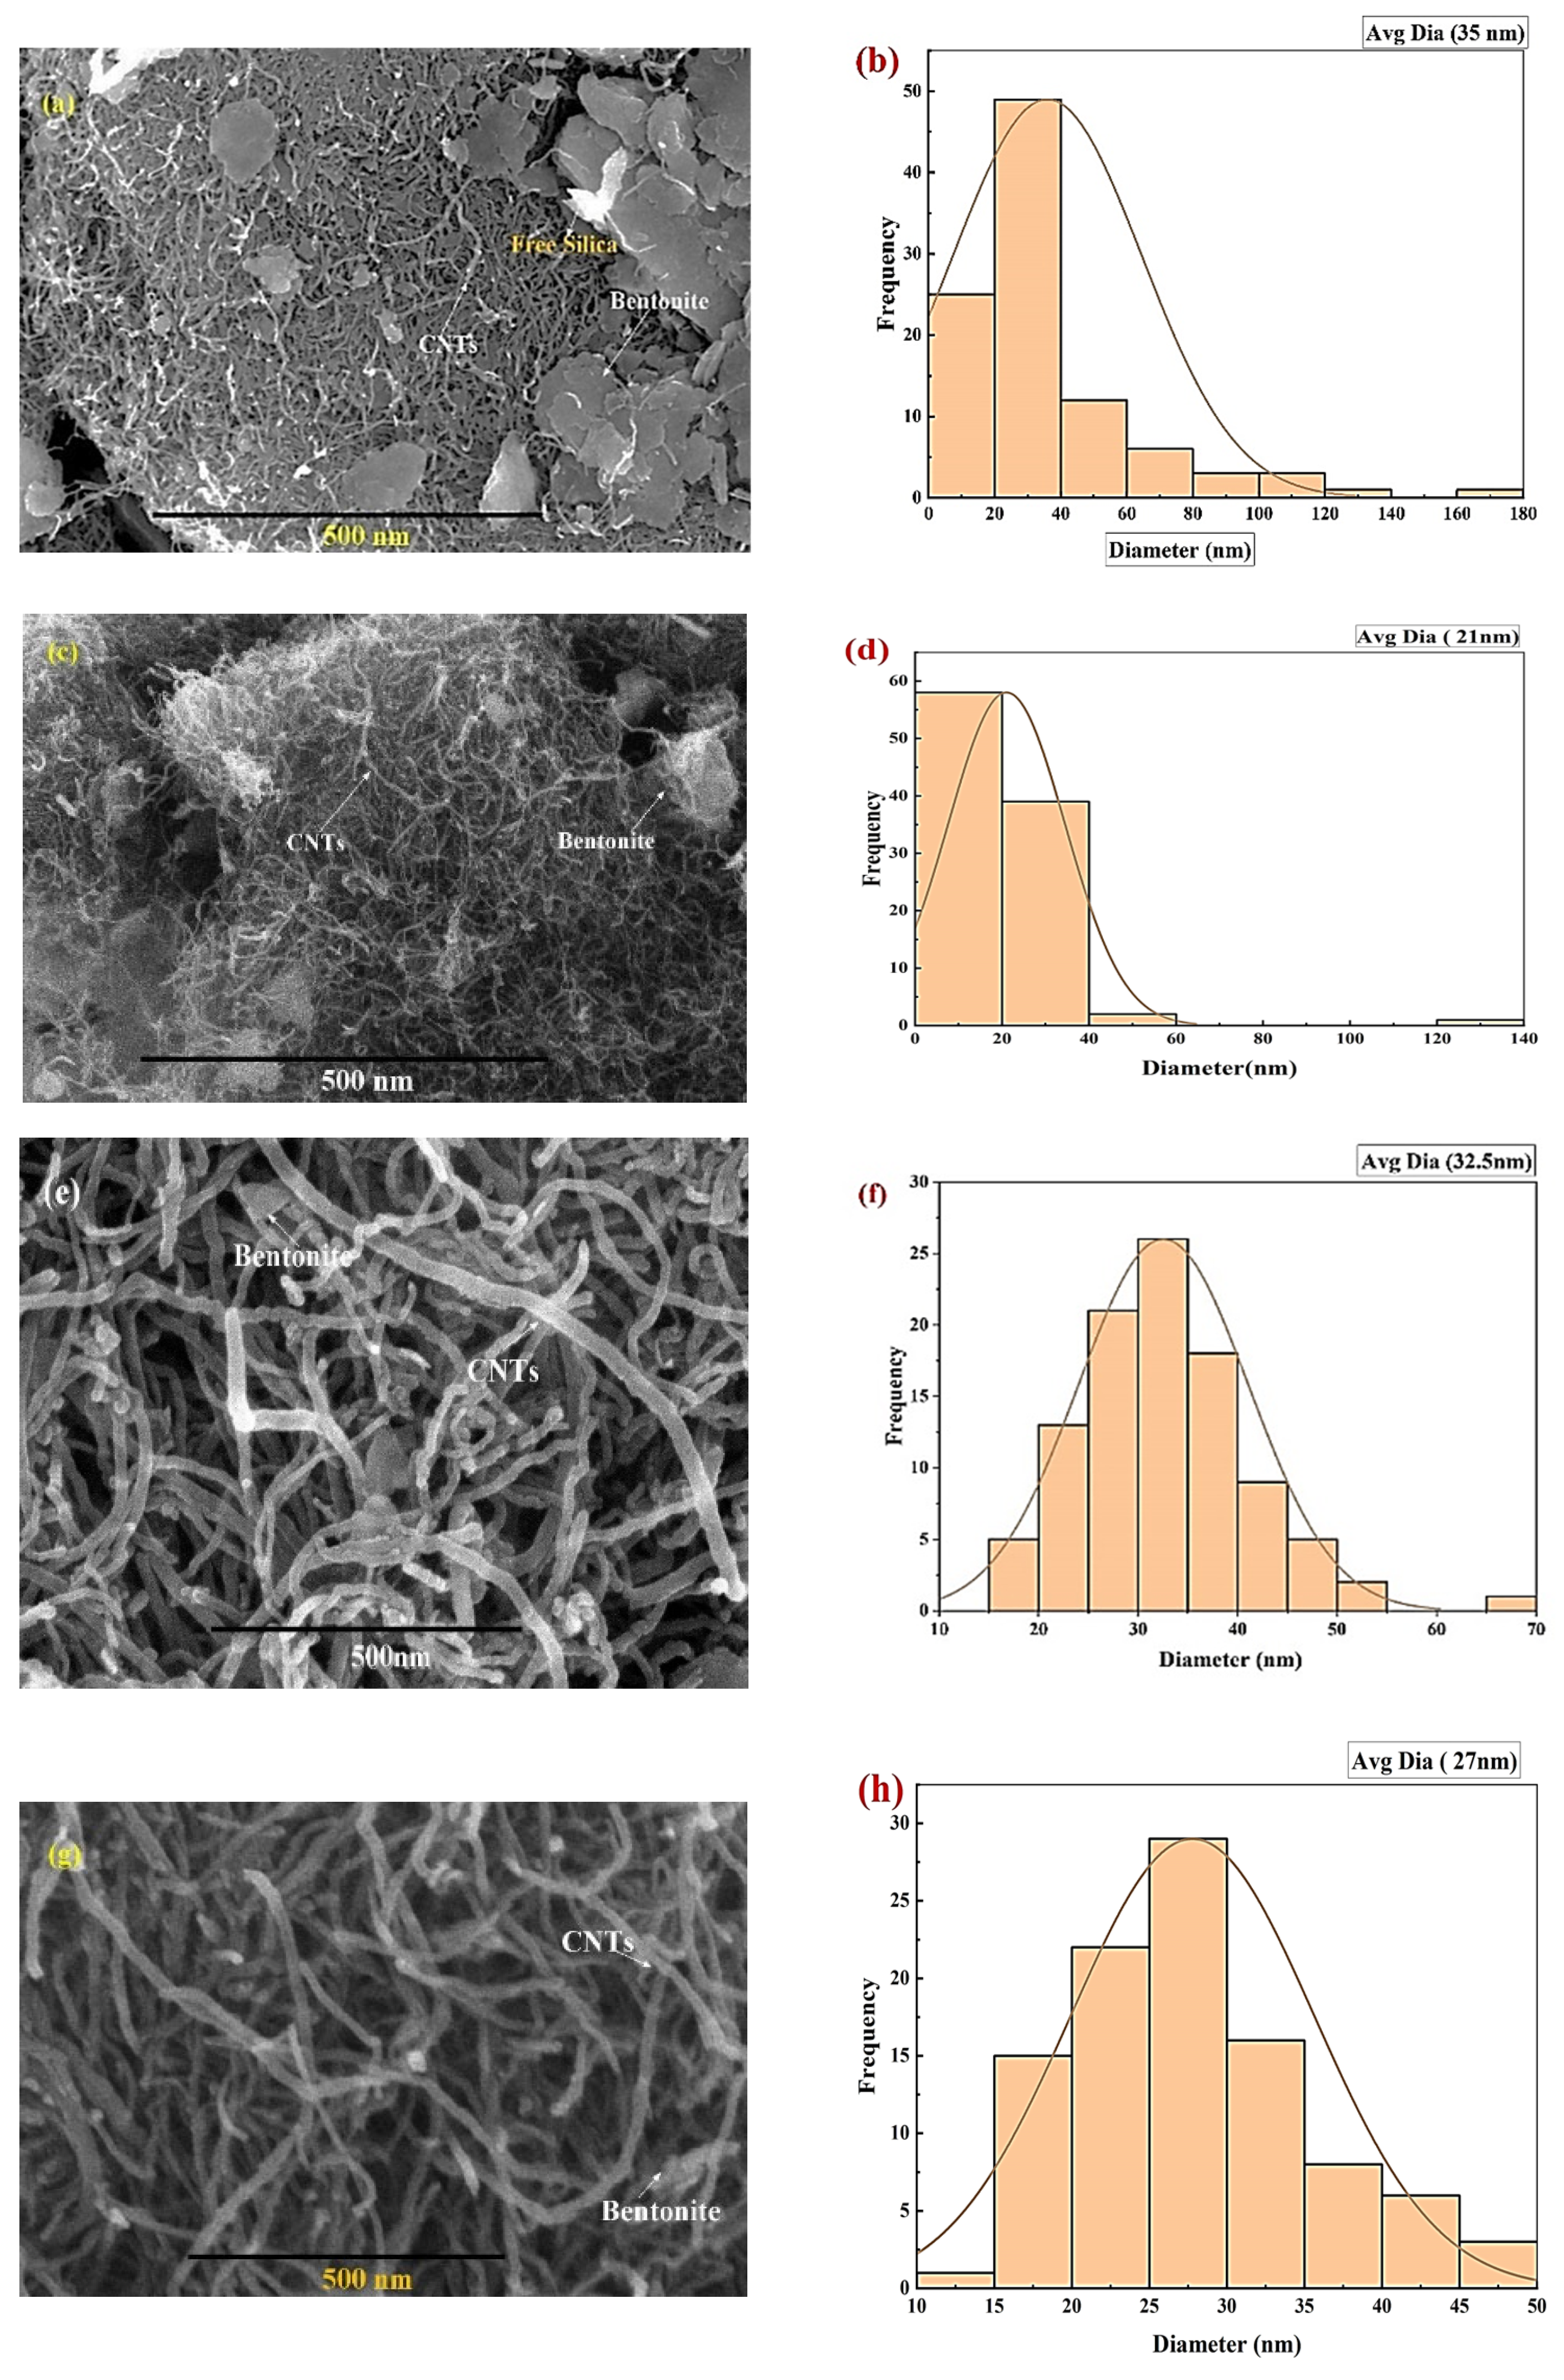
The surface morphology for the synthesized composite before and after adsorption is shown in Figure 3. The average size distribution histogram of 100 particles was calculated using the open-source image processing Image (1.53p) software [32]. Figure 3a shows the heterogeneous aggregation of large bentonite flakes and fibrous CNTs, representing the linking-network-like structure. The luminous crystallite is settled at the outer surfaces of the samples, representing free silica in the structure of the bentonite, due to the rapid leaching of Al ions from its octahedral layer while being treated with 5 M sulphuric acid. Fibers are uniformly distributed in the range of 10–60 nm, with an average diameter of 35 nm, as shown in Figure 3b. Figure 3e shows the carbon nanofibers tubular, entangled, randomly oriented, and highly tangled surfaces. The diameter of nanofibers ranges from 10–180 nm, with an average diameter of 32.5 nm, as shown in Figure 3f. This confirms the uniform dispersions of CNTs. However, after adsorption, the irregular, non-uniform, and poor dispersion of MWCNTs can be seen in Figure 3c. This may be due to the coordination between oxygen and the carbonyl group of dyes present in textile wastewater. After adsorption, the distribution histogram becomes narrow, representing the uniform size distribution of particles. The average diameter is reduced to 21 nm and 27 nm.
The distribution curves indicate that the higher removal efficiency was found in particles with smaller diameters. The relative increase in adsorption with particles of a smaller size may be because they have a larger surface area. Small particles will have a shorter diffusion path, thus allowing the adsorbate to penetrate deeper into the adsorbent particle more quickly, resulting in a higher adsorption rate. In the case of large particles, the internal diffusion path is increased, and therefore, so is the probability of encountering smaller pores [25]. However, the tube diameter is about 20–60 nm, and the strands of the tubes are flexible. The tube structure was not broken after the adsorption process.
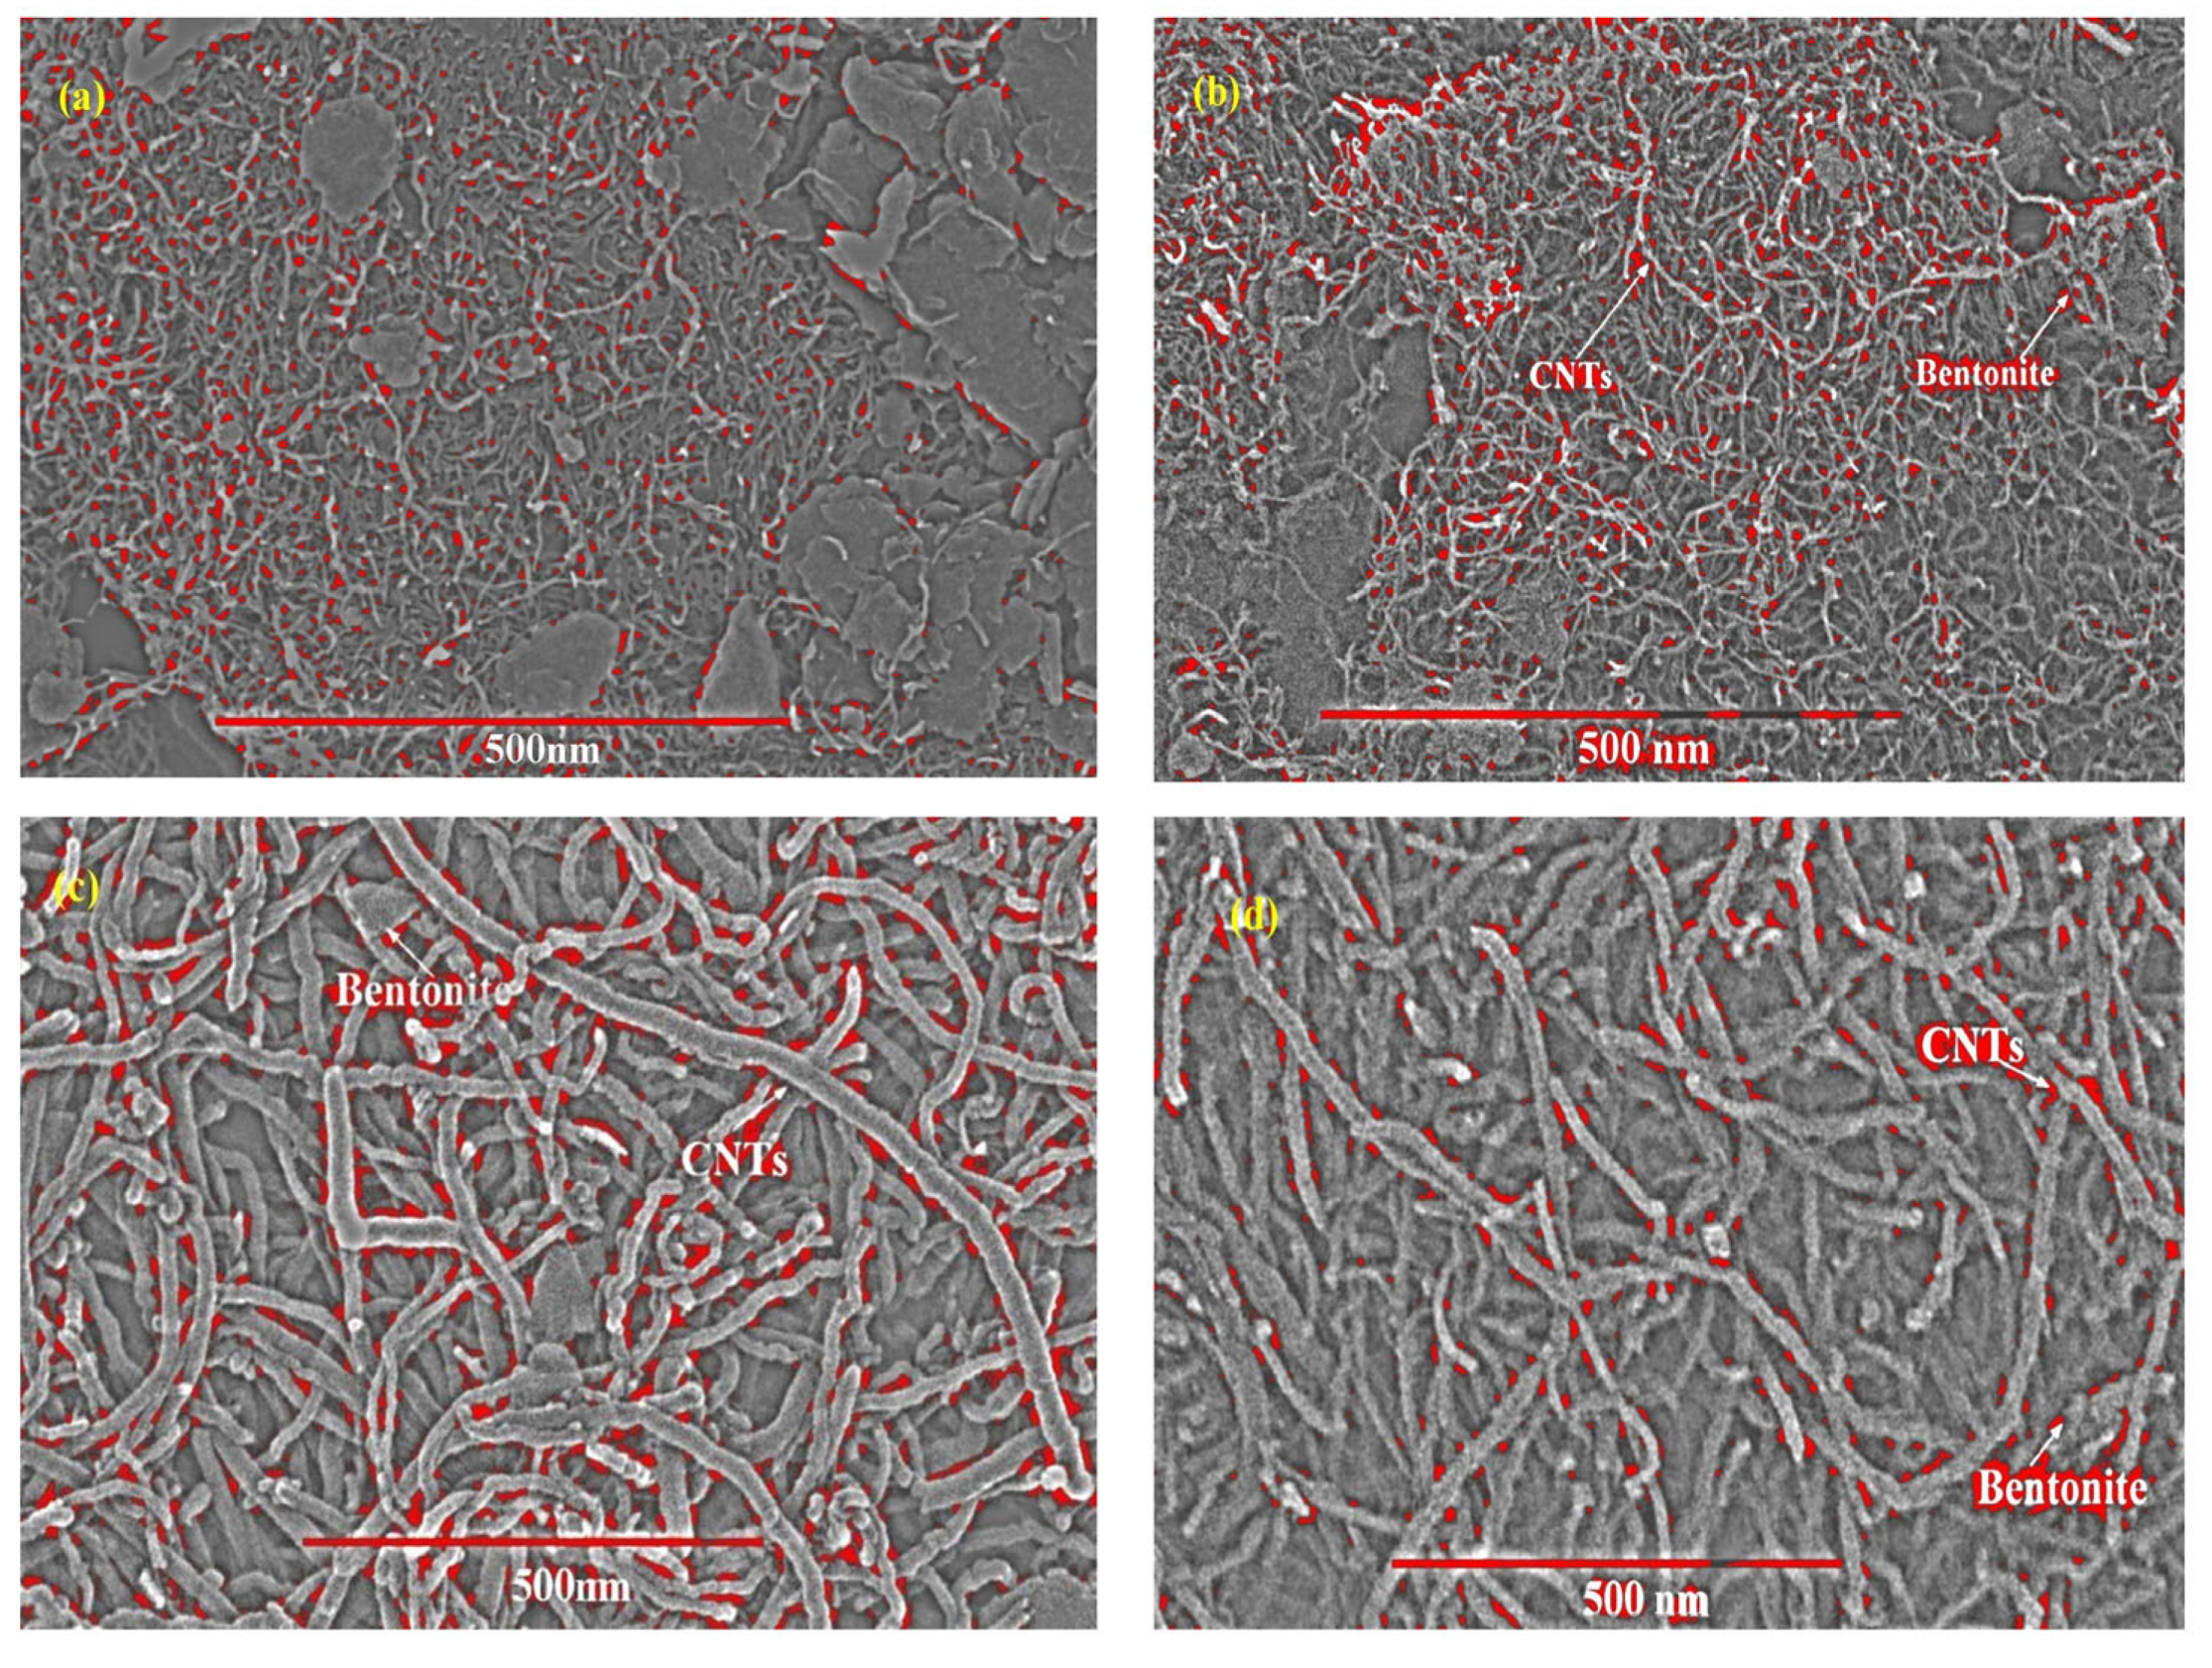
The image-processing technique evaluates the porosity and pore size distribution from SEM images. This technique is used for repetitive computational processes and for reducing the processing time of thresholding algorithms using ImageJ software. The percentages of porosity and pore size distribution were obtained via image thresholding of SEM images before and after adsorption, as shown in Figure 3. The SEM image was converted to an 8-bit grayscale pixel with integer values of 0–255 by applying the bandpass filter; the red region shows the porosity, as shown in Figure 4. The porosity % was found to be 6.57% and 5.36%. After adsorption, the porosity % was reduced to 5.14% and 3.57%, as given in Table 5.
The average pore radius is 1.61 nm and 1.72 nm, less than 2 nm (microspores), which is in agreement with the BET results shown in Figure 5a,c. After adsorption, the pore radius decreased to 1.42 nm and 0.58 nm, as shown in Figure 5b,d. The adsorption capacity of any adsorbent highly influences pore size distribution. If the adsorbent has a suitable pore radius or diameter, the adsorbate can achieve a good diffusion into the channels and be effectively adsorbed. When the pore diameter is enormous, the specific surface area will be small, and the adsorbent will have a low adsorption capacity.
On the other hand, if the pore radius is too small, it will limit the diffusion of solvents and adsorbates, enhancing the shielding effect for large-size molecules. When the radius is less than many times the diameter of the adsorbate, a potential shielding effect enhances the interaction between gas molecules and solid surfaces, thus increasing adsorption. The pore radius distribution curve before and after adsorption is shown in Figure 5. The pore size distribution becomes relatively narrow, indicating uniform pore size distribution after adsorption, as shown in Figure 5b,d [33].
Figure 6 shows the surface roughness of clay/CNTs before and after adsorption. The 3D surface plots of synthesized nanocomposites are composed of undulating valleys and peaks. The surface roughness (Ra) and root mean square roughness (Rq) were calculated using image processing. Figure 6a,c shows an aggregation of MWCNTs due to the loading of metal oxides, and a rougher surface can be seen due to the three-dimensional hybrid structure of nanotubes. The average roughness was calculated to be 35 nm and 23.4 nm, as shown in Figure 6. After adsorption, the surface becomes more brittle due to van der Waals forces of attraction and pi-pi interaction between the dye molecules. This decrease in surface roughness (Ra) after adsorption is due to the better dispersion of MWCNTs and poor electrostatic interaction between carbon nanotubes and the dye molecules [34]. The fluctuations and distribution of valleys and hills can be seen in the images in Figure 6b,d [35].
Figure 7a,b shows the comparison of surface roughness before after adsorption, it can be estimated from the figure that the surface become comparatively smooth after sorption however, there is no remarkably change is seen for Ra after adsorption.
The pore volume, pore diameter, and specific surface area of the adsorbent were found using a BET Analyzer. The BET-specific surface area of bentonite clay/CNT is 99.23 m2/g and 4.223 × 10⁻². The pore diameter is 1.847 nm; <2 nm shows microspores according to IUPAC.
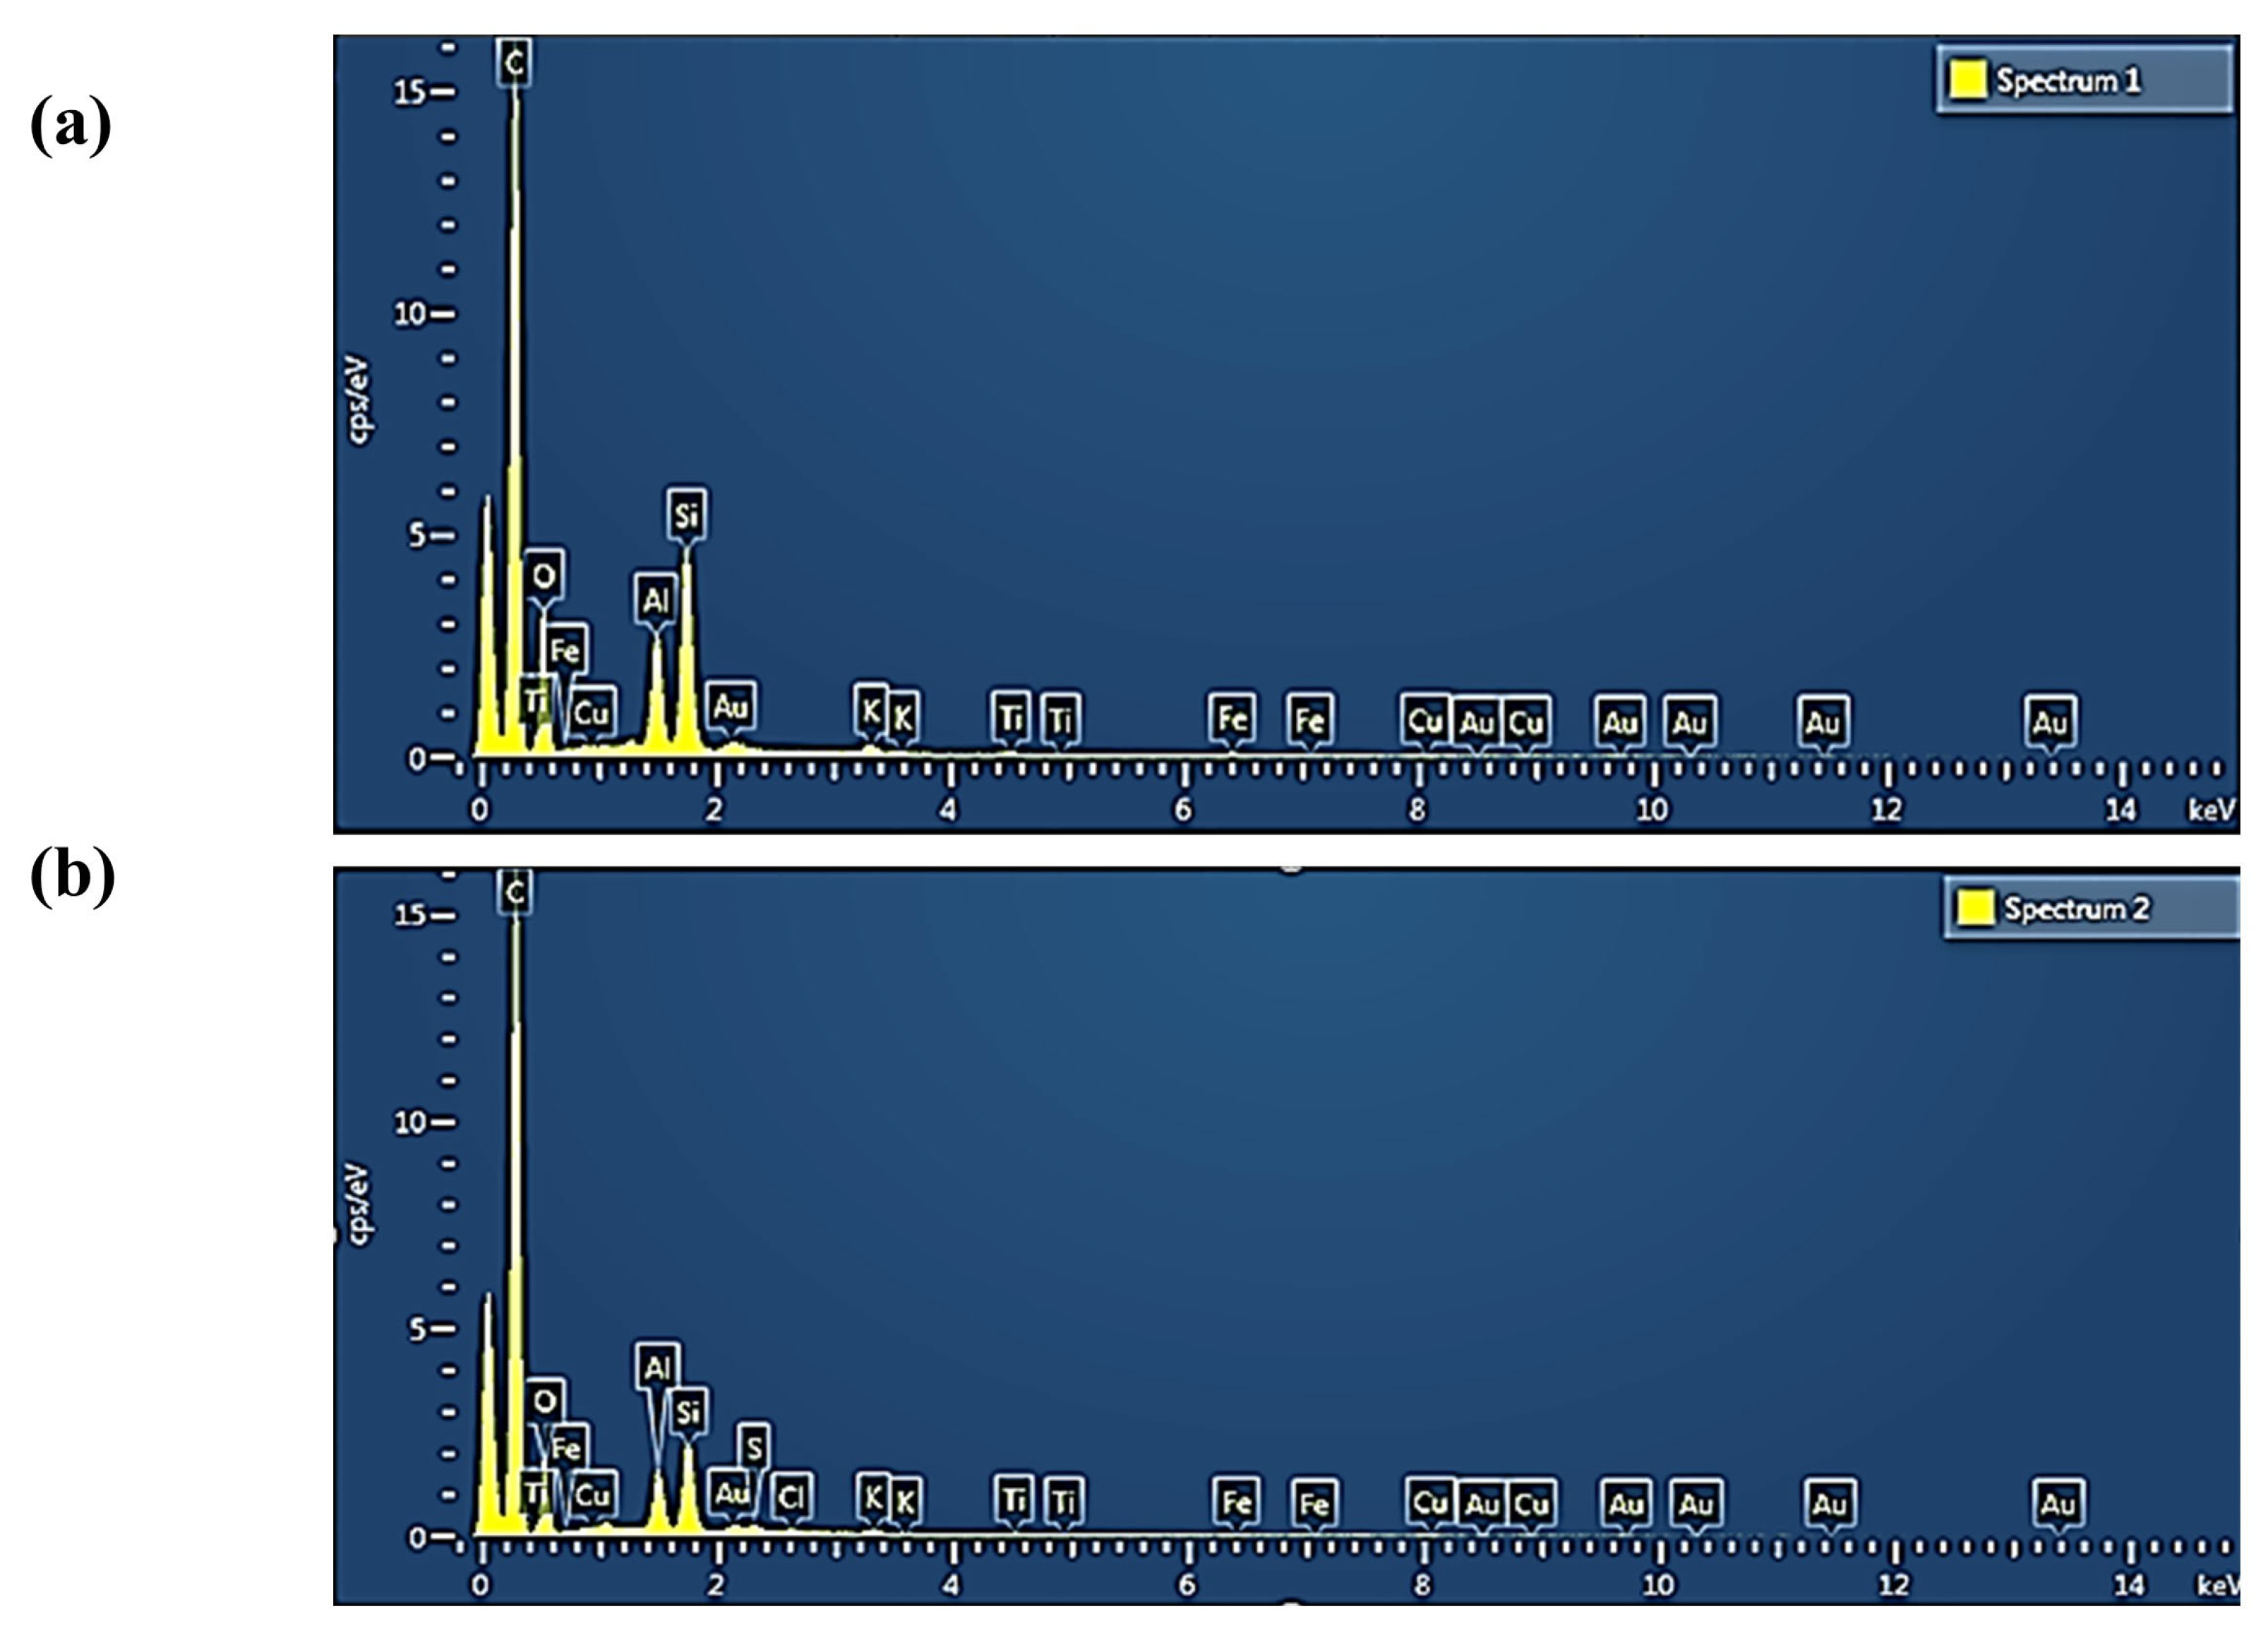
Figure 8a,b shows the EDX analysis of the synthesized nanocomposite before and after dye adsorption. The EDX spectrum is mainly composed of C, O, Al, Si, K, and Fe as a significant constituent of clay and CNTs, along with traces of Au, present as an impurity in the clay-CNTs, which may come from a coating of the sample with gold to avoid any accumulation of electric charges on the sample by placing the specimen in a sputter coater (AGB7340, Agar-UK) for one minute under vacuum.
In the composition of EDX, the analysis contains a significant portion of carbon (75%), oxygen (16%) adsorbent, and a small concentration of aluminum (4%). The weight % of C is 75.24, indicating the presence of major portion of carbon in the clay CNT structure. After adsorption, the percentage rose to 82.01, suggesting that carbonyl groups were present in dye molecules [36]. The element Al, Si, Fe, and K are present in the structure of bentonite clay. The slight decline in the peaks of oxygen and aluminum shown in Figure 8a,b indicates that the amount of oxygen was reduced from 16% to 11%, and Al from 4% to 2%, due to oxidation. The Al/Si ratio was found to be 0.55, and after adsorption, this ratio was reduced to 0.53% due to increasing Si content and decreasing Al and O peaks when treated with 5 M sulfuric acid. The silica to alumina ratio was increased, thus creating more pores, acidity, surface area, and available active sites for adsorption; hence, the rate of adsorption increased by increasing the Si/Al ratio. This molar ratio decreased after adsorption due to a decline in acid active sites of adsorbent available for adsorption [33,37] and can be seen in Figure 8b after adsorption, as shown in Table 6.

3.2. ANOVA for Experimental Results Using CCD

The adequacy of the model developed was justified via the analysis of variance (ANOVA) [9]. Table S1 (Supplementary Data) also provides the statistical analysis of empirical data using the significant factors; Fischer’s test (F-value) for ANOVA gives detailed information about the p-values for every independent variable. The model F value of 37.04 and the p-value less than 0.05 (>95% confidence level) were obtained. The value of the determination coefficient (R2) was found to be 0.9447, showing that the suggested model could explain 94.47% of dye removal variability but could not explain 5.53% of the whole variability. However, the predicted R2 value of 0.8463 is also very high, providing an inequitable agreement with the adjusted R2 (0.9192). This shows the validity of the suggested model. The higher value of R2 reveals that the model fitting was successful with the given dataset. Moreover, the adjusted R2 and the predicted R2 value should be less than 20% for a model to be significant. In this study, the adjusted R2 value of 0.9192 was in reasonable agreement with the predicted R2 of 0.8463, showing the model’s validity. The lack of fit with an F-value of 1.94 was insignificant. The non-significance of the lack of fit test indicated the good adequacy of the predicted model.
The regression coefficients equation and the experimental data were fitted onto the given second-order polynomial equation, Equation (5). The actual factor percentage removal can be explained, as presented in Equation (6).
Y (% Removal) = 70.54 + 12.49 A − 1.45 B + 7.72 C − 2.98 AB − 1.06 AC + 256 BC in terms of coded factor
Y (% Removal) = 7.77 + 0.83297 A + 1.29159 B + 0.11749 C − 0.0467680 AB − 9.56533 × 10⁻⁴ AC + 0.022725 BC in terms of actual factor
A is the adsorbent dose in mg, B is pH, and C is Time in minutes. Increasing the pH above pHZC negatively affects the percentage of dye removal. However, increasing the time and adsorbent dose positively affects the percentage of dye removal. Moreover, all the factors having negative regression coefficients negatively affect dye removal. A maximum response of 89.41% was obtained under the optimum conditions of a pH of 3, a time of 120 min, and an adsorbent dose of 100 mg. The ANOVA response and model results from response surface plots have been presented in the Supplementary Data File (Table S1). At the same time, Figure S1 indicates the residuals of the plots from the prediction and actual datasets (Supplementary Data File).

3.3. Optimization of Process Parameters

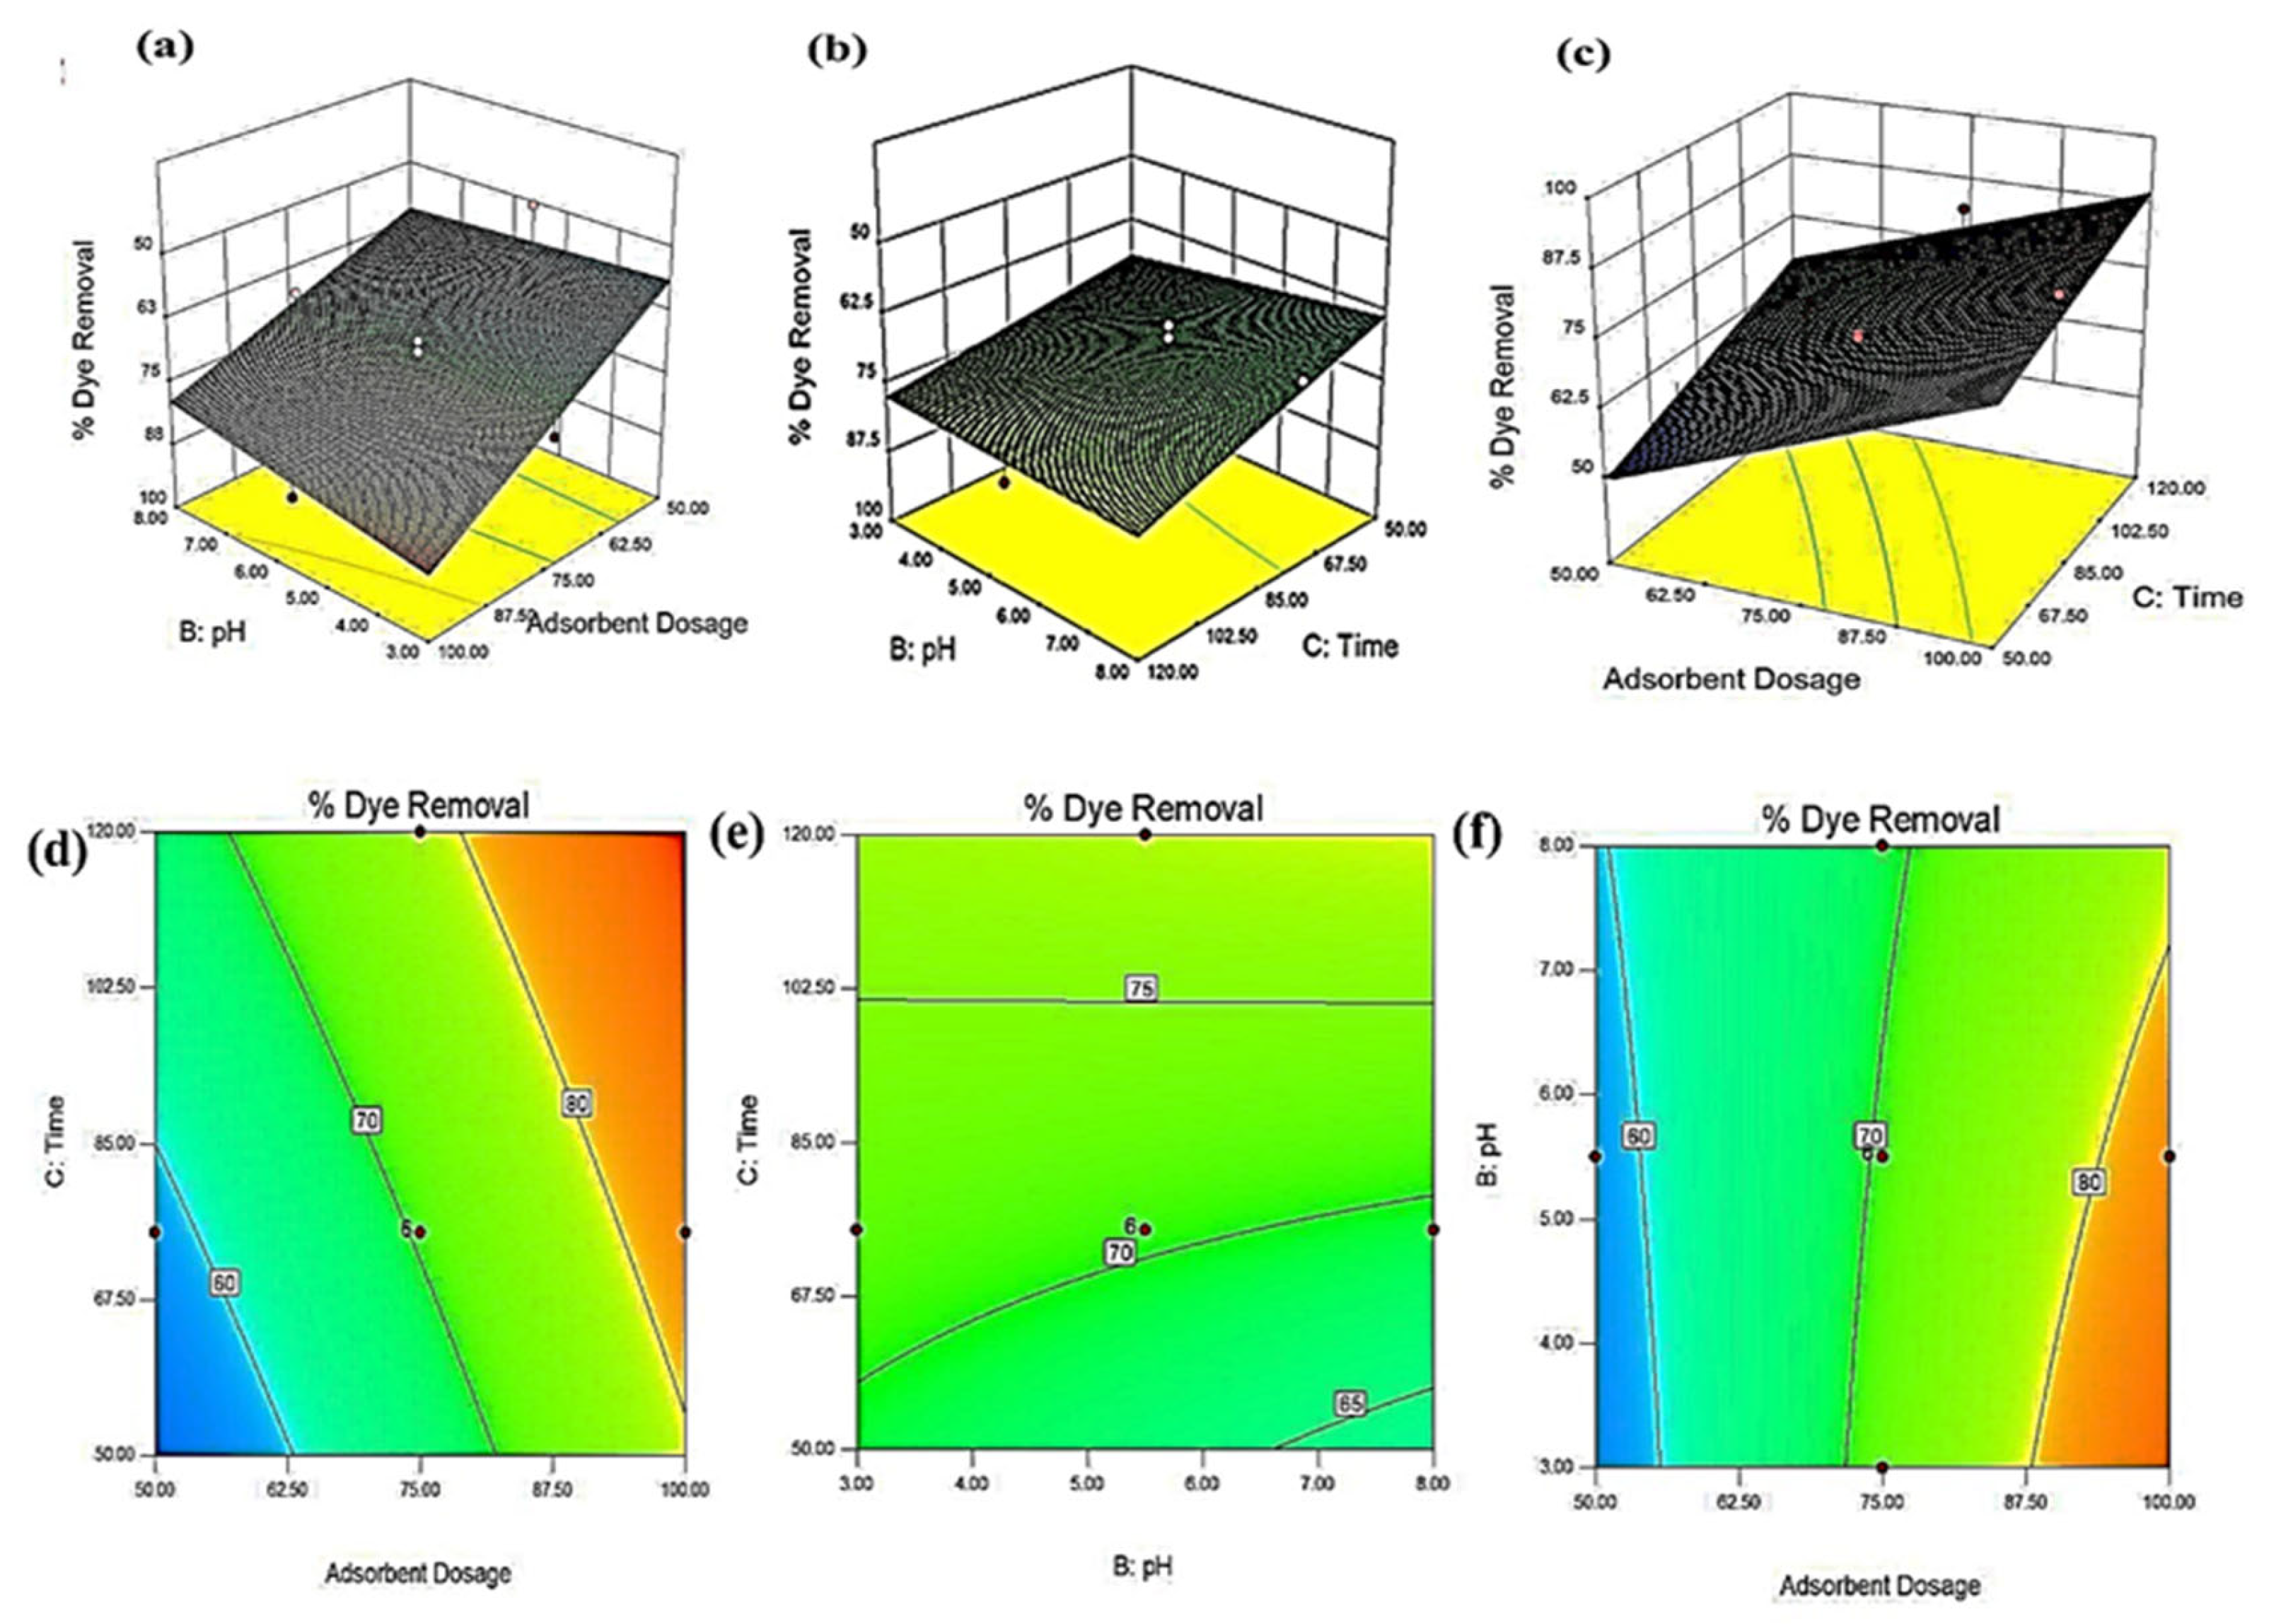
The 3D surface plots illustrate the dependent and independent variables that influenced the percentage of dye removal. The 3D response plots of the process variable as a function of the two input variables are shown in Figure 9a. pH had a profound effect on dye removal. The optimal dye removal was found to be 89.9%, which was achieved at a pH of 3, an adsorbent dose 100 mg, and a contact time of 120 min. It was noticed that at pH < pHzc, the surface of the adsorbent became protonated; the resulting protons at the interface (adsorbate-adsorbent) repel the cationic dyes and attract the anionic ones. The electrostatic attractions of dye molecules increased by pi–pi interactions, hydrogen bonding, and dipole interactions [30]. An increase in the pH resulting the decrease of (H+) ion concentration, favoring more cation adsorption on the negative adsorption sites with strong electrostatic interactions. The pHzc of modified bentonite clay CNT was determined to be 4.5. If pH = pHzc, the positive and the negative charges of the adsorbent surface would become equal, whereas if pH > pHzc, the adsorbent surface has a more negative charge due to deprotonation of functional groups, i.e., -OH and –COOH, which repels the anionic dye [38].
Figure 9b shows the relationship between pH and adsorbent dose; increasing the pH and adsorbent dose increased the removal efficiency at a certain point, but further increasing the pH would not appreciably increase the dye removal efficiency due to fewer available active sites for adsorption [39]. Figure 9c shows that by increasing the adsorbent dose, more of the effluents are adsorbed on the surface of the adsorbent due to an increase in the interaction between adsorbent and adsorbate. However, by increasing the contact time along with the adsorbent dose, the adsorbate may diffuse on the surface of the adsorbent. Figure 9d indicates that the removal efficiency is increased by increasing the adsorbent dose and time. The red region offers the maximum dye removal of 89.9% due to more interaction of adsorbent and adsorbate. Hence, the adsorbent dosage and time were the significant parameters for the dye removal. Figure 9e shows that by increasing time, the color removal was increased due to more interactions of adsorbent and adsorbate, and the surface became deprotonated, which increased the number of active sites available for adsorption. Figure 9f shows a significant reduction caused by increasing time and pH.

3.4. Model Validation

For model validation, additional experiments were performed. The points mentioned below were selected within the design area and were not superimposed at any former experimental conditions used for model development. The model was negated if the actual or experimental result for any points were not in the corresponding range. Here, all the results were validated. The predicted value is 91.56%, and the experimental value is 89.41%; hence, the model shows a 2.14% error with 95% confirmation of results, as shown in Table 7 [40].

3.5. Process Modelling

Adsorption Isotherms

The distribution of the dye molecules at the solid–liquid interface and sorption mechanism was modelized using the adsorption isotherm models. The equilibrium data of the adsorption of MB dye on the bentonite/CNT surface were analyzed via linear and nonlinear regression forms of Langmuir, Freundlich, and Temkin isotherm models as shown in Figure 10 [38]. The Langmuir models sown in Figure 10a were developed for both linear and nonlinear isotherms. The values of sorption capacity (qe) and the Langmuir constant (RL) were calculated from the slope and intercept from linear regression analysis. The closeness of qe (550.30 mg.g−1) to the experimental data (550 mg.g−1) confirms the applicability of this model. The value of the regression coefficient in the case of linear one is R2 = 0.9726, with RL = 0.428 confirming that the favorable sorption in the case of nonlinear regression provides a high regression coefficient of R2 = 0.999; qeexp = 550.30 mg.g−1 with reduced chi-square error of 0.001, as shown in Table 8. The values of R2 and qe are higher than that of the clay-based adsorbent used in treating reactive dyes in the literature [41], as 0.96 and 452 mg.g−1. This shows the good fitness of the developed model. It also shows the monolayer formation of the dyes that may saturate the homogenous sites of the synthesized composite. The Freundlich isotherm (Figure 10b) given in Table 2 assumes the adsorption of the dyes on the heterogeneous surface of the synthesized adsorbent. The Freundlich constants and the Freundlich exponent, KF and 1/n, are 607 mg.g−1 and 0.04837, respectively (Table 8). In this study, the value of 1/n is less than 1 for both linear and nonlinear studies, which shows the usefulness of synthesized adsorbent for the studied dye removal. However, this model (Table 8) revealed a poor fit (R2 = 0.993) compared to the Langmuir constant, which was 0.997, reflecting the homogeneous distribution of sorption sites and monolayer coverage of clay/CNTs. The qeexp is far away from the calculated qe, which shows that the developed model fits with the experimental data. The Temkin model as shown in Figure 10c values given in Table 2 shows a good fit to the present study, with an R2 value of 0.965 (Table 8). The fitness of this developed model with the experimental data indicates the uniform binding energies of the clay/CNTs. The R2 value is improved In the case of nonlinear regression (as 0.998, which is closer to that of the Langmuir); however, the value of sorption capacities (qeexp) for the nonlinear Langmuir model is more closed to the experimental data compared to both the Freundlich and Temkin models, with a least chi-square error of 0.0001. In comparison, the non-linear regression provides higher regression coefficient (R2) values of 0.9999, 0.9999, and 0.9987 compared to linear ones as shown in Figure 10d. Similar results were obtained by using a clay-based adsorbent while treating methylene blue and Congo red dyes with R2 of 0.998 and a CNT-based adsorbent, with regression coefficient of R2 value of 0.919 and adsorption capacities of 22.4 mg.g−1 [29,42] when treating crystal violet and brilliant green dyes from an aqueous solution. However, the present study revealed higher sorption capacities than other clay-based adsorbents [43].
The availability, abundance, high adsorption capacity, and high removal efficacy of the synthesized adsorbent, compared to raw bentonite, modified bentonite or other clay-based adsorbents, has made this adsorbent an excellent alternative for removing dyes from textile wastewater under real-world conditions.

3.6. Adsorption Kinetics

The kinetics modeling was used to examine the rate of uptake of dyes and COD removal, which describes the adsorption capacity of adsorbate on the adsorbent surface at each equilibrium contact time. The difference between the calculated and actual qe values and correlation coefficients was used to determine the best-fitted kinetics model for COD and the percentage of dye removal. In the case of linear study, the second-order kinetics showed the best fit, as the regression coefficient value for the pseudo-second-order kinetics is R2 > 0.999 with a low error margin (X2 = 0.22) compared to the pseudo-first-order kinetics showing the chemisorption. Thus, overall chemisorption could provide the possible adsorption mechanism for optimal COD and color removal. Whereas in the case of nonlinear kinetics, despite the high value of K2 (0.155), the pseudo-second-order kinetics fitted better to the data in terms of both (R2 = 1) and error (X2 = 0.34). The adsorption rate-control mechanism was estimated for the adsorption of real textile effluents on modified bentonite clay/CNTs with the help of the (intra-particle) diffusion model. It is important to note that adsorbate with high COD values would indicate a high boundary layer resistance to the IPDM. The regression results of the IPDM fittings, as shown in Figure 11, reveal that IPDM mainly controlled the adsorption of textile dyes on bentonite clay/CNTs with high R2 = 0.938 [44]. This complexity was attributed to the diverse nature of bentonite clay adsorbent due to various types of aluminosilicates clay minerals. The equation can be seen in Table 6, where C was the intercept reflected the boundary layer thickness and Kdiff (mg·g−1. min−0.5) reflected the fractional equilibrium attainment, which was calculated through the slope [2]. Thus, the intraparticle model also shows better results in the case of nonlinear modeling (R2 = 0.945 and X2 = 0.01). The nonlinear kinetics was used to examine the color removal, COD removal, and the uptake capacity of adsorbate on the adsorbent surface. The differences between the experimental and calculated qe values and correlation coefficients were used to determine the best-fitted kinetics model for removing COD and color. Nonlinear, pseudo-first-order kinetics provided the best fit, with R2 = 1 closer to unity compared to non-linear, pseudo-second-order kinetics, with R2 = 0.995 favoring chemisorption. The calculated value of qe is more close to the actual one in the case of non-linear, pseudo-first-order kinetics, with a higher-rate constant value than the nonlinear pseudo-second-order kinetics. The chi-square error for non-linear, first-order kinetics was reduced compared to the pseudo-second-order. More data on the adsorption kinetics model can be found in the Supplementary Data (Table S2).

3.7. Thermodynamics Study

For an evaluation of feasibility and the nature of adsorption, the thermodynamic study was performed under the optimum conditions of a pH of 3 and an adsorbent dose of 0.1 g for one hour. The Van’t Hoff equation (Equations (7)–(9)) and plots in Figure 11f for the adsorption of textile dyes on hybrid composites represent the calculated values of thermodynamic parameters. Entropy change (ΔS), Gibbs free energy change (ΔG°), and enthalpy change (ΔH°) are shown in Table 9. At all the studied temperatures (308, 318, and 328 K), the (ΔG°) Gibbs free energy values were negative, indicating that the adsorption of adsorbate on adsorbent was spontaneous and feasible. The positive value of enthalpy change (ΔH), i.e., (69.69 kJ/mol) was found from the slope of the straight line being plotted, indicating that the process was spontaneous and endothermic. The positive value of (ΔS) was found from the intercept, which showed the increased randomness during the dye’s desorption on the adsorbent surface. During desorption, the adsorbed molecules are replaced by the adsorbate ions, resulting in more randomness and translational entropy in the system [45].
The coefficient, R2, was found to be 0.95, and the trend straight line indicates that the adsorption capacity and degree of spontaneity were enhanced at elevated temperatures. The R is rate constant in kjmol−1 [46].
Δ G ο = R T L n K
Δ G ο = Δ H T Δ S
L n K = Δ S ο R Δ H R T

3.8. Effect of Process Variables on Percentage Color Removal

3.8.1. Effect of Time

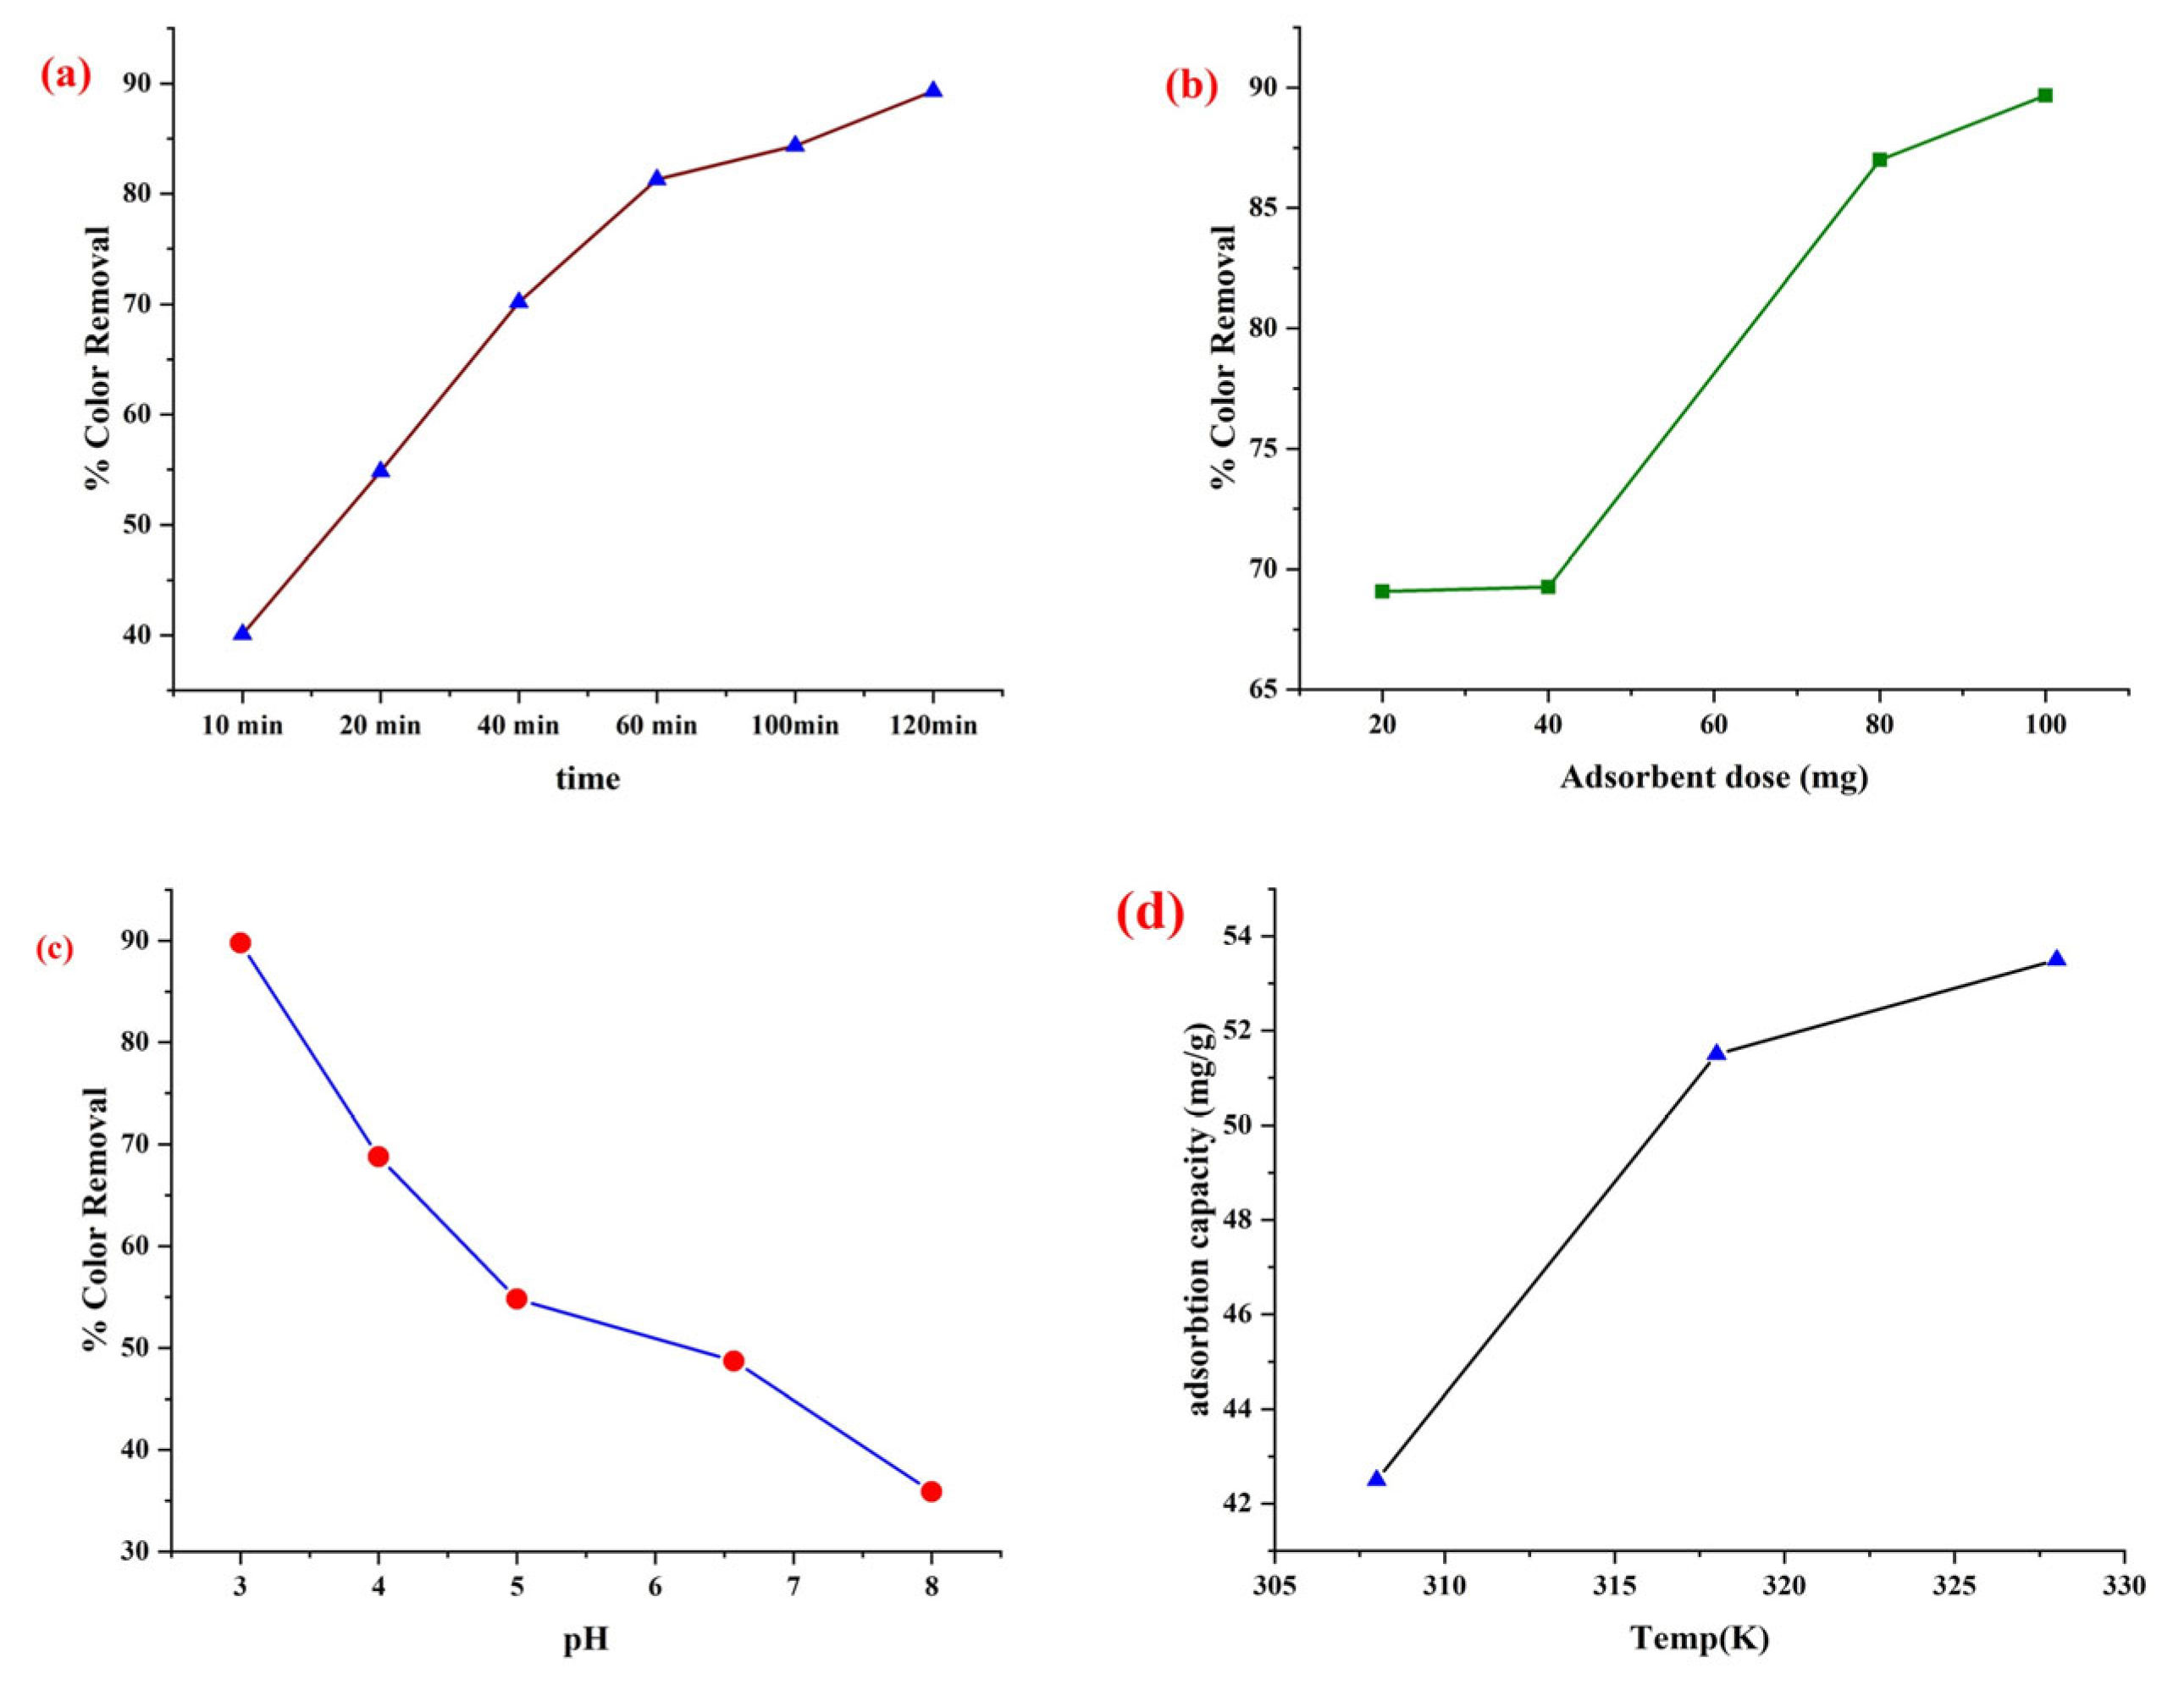
The effect of process variables on percentage color removal was investigated by repeating the adsorption experiment under the optimum conditions of a pH of 3 and adsorbent dose of 100 mg at 250 rpm for two hours. The sample was collected at regular intervals. The faster process of color removal may be attributed to the presence of many empty sites available for adsorption [47]. The maximum color removal rate of 89.41% can be seen at 120 min, as shown in Figure 12a.

3.8.2. Effect of Adsorbent Dose

The percentage of color removal was increased by increasing the adsorbent dose from (20–100 mg) this trend was attributed to an increased number of available adsorption sites and enhanced pore surface areas. This led to increased penetration of adsorbent molecules into adsorption sites, due to the availability of large vacancy sites accessed by the dye molecules in the textile wastewater [48]. The maximum color removal rate of 89.9% was achieved at 100 mg, as shown in Figure 12b.

3.8.3. Effect of pH

The percentage of color removal was increased by increasing the pH of the solution. By increasing the pH, the surface of the sorbent becomes protonated due to the release of H+ ions, which favors the adsorption of anionic dyes; however, with further increases in pH, the surface of the sorbent becomes deprotonated, which reduces the adsorption of anionic dyes due to the electrostatic repulsion between the dye molecules and the adsorbent, as shown in Figure 12c.

3.8.4. Effect of Temperature

Additional adsorption experiments were performed under optimum conditions in order to study the effect of temperature on the unit mass of the adsorbent. It can clearly be seen that by increasing the temperature, the adsorption capacity was increased due to more particles being diffused on the pores of the adsorbent. Adsorption capacity has increased as a result of increasing the temperature, favoring the endothermic process, as shown in Figure 12d [49].

3.9. Cost Estimation

The feasibility and selection of an adsorbent is highly depend upon the overall preparation cost [50]. The preparation cost of bentonite/CNT-Al2O3-MnO2 at the laboratory scale can be calculated by using the following equation, as reported by Chakraborty and colleagues [51,52].
C O S T A D = ( C O S T P + C O S T P R O + C O S T A C ) + O T H E R   C O S T
Here, COSTAD is the total cost for adsorbent preparation; COSTP is the cost of precursor procurement; COSTPRO is the cost incurred during precursor processing (including washing, drying, etc.); COSTAC is the cost of chemicals used in clay and CNT activation; COSTC is the electricity cost for drying); OTHER COST includes costs incurred during the adsorbent preparation, with 10% offset costs for any material loss occurred during the process.
COSTP = cost of chemicals + transportation cost + packing cost + storage cost = 0.35 USDkg−1
Cost of chemicals = (0.03$ + 0.0041$ + 0.001$ + 0.001$ + 0.74$) = 0.776$/kg
Transportation cost + packing cost = 0.023$ + 0.2$ = 0.223 kg−1 (this will be reduced for large procurement of precursor.
COSTAC = Cost of sulphuric acid activation + Cost of oven drying + cost of reflux for 24 h + sonication for 0.5 h = (0.65$ + 1$ + 0.35$) = 2 USD/kg
OTHER COST = 10% offset waste disposal and recycling cost = 0.2 us$/kg
COSTPRO = (cleaning by distil waster cost and drying cost) = 0.01$/kg as drying cost is added to the activation cost we consider only the cleaning cost here.
Thus, the cost for adsorbent preparation is found to be = (0.7765 USD +2 USD+ 0.2$ + 0.01 USD) = 2.986 USDKg−1. The overall process seems to be feasible.

3.10. Comparison with Other Adsorbents

Bentonite clay and MWCNTs have been studied widely for the removal of dyes from wastewater. It has been confirmed from the literature that when bentonite clay and MWCNTs are chemically modified and fabricated with other compounds, their removal efficiency and adsorption capacities are remarkably enhanced compared to their raw equivalents, as shown in Table 10. However, very little research has been conducted on removing dyes from industrial or real textile wastewater. Moreover, more low-cost and selective adsorbents are still needed for wastewater treatment.

4. Conclusions

This research has demonstrated the effective application of a novel bentonite-clay/CNT-based nanocomposite for treating real textile wastewater. The RSM approach was used to perform the parametric optimization of, i.e., adsorbent dose, pH, and time. An optimal color and COD removal of 89.9% and 96% was achieved at pH of 3, contact time 120 min, and an adsorbent dose of 100 mg with an adsorption capacity of 550 mg/g. The FTIR results show that COOH, C=C, and SI-Al were mainly present in the adsorbent. The nonlinear Langmuir isotherm model fit and sufficiently explained the equilibrium adsorption. The kinetics study showed that the adsorption process best fits nonlinear, pseudo-first-order kinetics. The effect of pH, time, temperature, and adsorbent dose on the color removal of real textile wastewater was also studied. Nonlinear regression analysis proved more suitable than linear analysis for predicting optimum kinetics, isotherms, and parameters with reduced errors (X2) and a high coefficient of determination (R2). The BET analysis showed a highly microporous surface of the composite with enhanced surface area after adsorption. Image analysis has been performed to analyze surface roughness parameters, Ra, Rq, and image thresholding was utilized to determine the percentages of porosity and pore size distribution before and after adsorption, using image processing software. The surface became smoother and less porous after adsorption, due to the poor interaction between dye molecules and the adsorbent. The novel modified bentonite clay/CNT nanocomposite proved a promising adsorbent for treating real textile wastewater. However, this clay-based nanocomposite might also perform well in separating various types of cationic and anionic dyes from an aqueous solution.

Supplementary Materials

The following supporting information can be downloaded at: https://www.mdpi.com/article/10.3390/w15183197/s1, Figure S1: (a) Normal plots of residuals (b) Predicted vs. actual.; Table S1: ANOVA for Response Surface 2F1 Model; Table S2: Adsorption kinetics.

Author Contributions

T.J.: Data Curation, Software, Formal Analysis, Visualization, Investigation, Validation, Writing—Original Draft. S.Y.: Conceptualization, Methodology, Supervision, Project Administration, Funding Acquisition, Writing—Review and Editing. N.R.: Validation, Writing—Review and Editing. H.M.Z.A.: Validation, Writing—Review and Editing. A.I.: Validation, Writing—Review and Editing. A.M.Z.: Funding Acquisition, Visualization, Validation, Writing—Review and Editing. A.A.H.: Funding Acquisition, Validation, Writing—Review and Editing. All authors have read and agreed to the published version of the manuscript.

Funding

The project was funded by the National Water Center, United Arab Emirates University, funding number G00003661.

Data Availability Statement

The data will be available upon request to authors.

Acknowledgments

We thanks all the CO-Authors and University of Engineering and Technology Lahore faculty and the United Arab Emirates University for conducting for their cooperation on this research.

Conflicts of Interest

The authors declare no conflict of interest.

References

  1. Samsami, S.; Mohamadi, M.; Sarrafzadeh, M.H.; Rene, E.R.; Firoozbahr, M. Recent advances in the treatment of dye-containing wastewater from textile industries: Overview and perspectives. Process. Saf. Environ. Prot. 2020, 143, 138–163. [Google Scholar] [CrossRef]
  2. Javed, F.; Ahmad, S.W.; Ikhlaq, A.; Rehman, A.; Saleem, F. Elimination of basic blue 9 by electrocoagulation coupled with pelletized natural dead leaves (Sapindus mukorossi) biosorption. Int. J. Phytoremediat. 2020, 23, 462–473. [Google Scholar] [CrossRef] [PubMed]
  3. Yu, J.; Zou, A.; He, W.; Liu, B. Adsorption of Mixed Dye System with Cetyltrimethylammonium Bromide Modified. Water 2020, 12, 981–995. [Google Scholar] [CrossRef]
  4. Composite, U.C.I.; Obulapuram, P.K.; Arfin, T.; Mohammad, F.; Khiste, S.K.; Chavali, M. Studies towards the Removal of Reactive Orange 16 Dye. Polymers 2021, 13, 3490. [Google Scholar]
  5. Campos, C.J.A.; Avant, J.; Lowther, J.; Till, D.; Lees, D.N. Human norovirus in untreated sewage and effluents from primary, secondary and tertiary treatment processes. Water Res. 2016, 103, 224–232. [Google Scholar] [CrossRef]
  6. Chen, M.; Bao, C.; Hu, D.; Jin, X.; Huang, Q. Facile and low-cost fabrication of ZnO/biochar nanocomposites from jute fibers for efficient and stable photodegradation of methylene blue dye. J. Anal. Appl. Pyrolysis 2019, 139, 319–332. [Google Scholar] [CrossRef]
  7. Kotia, A.; Yadav, A.; Raj, T.R.; Keischgens, M.G.; Rathore, H.; Sarris, I.E. Carbon Nanoparticles as Sources for a Cost-Effective Water Purification Method: A Comprehensive Review. Fluids 2020, 5, 230. [Google Scholar] [CrossRef]
  8. Han, D.; Yan, G.; Wang, C. Influence of multi-walled carbon nanotubes (MWCNTs) content on metal friction and wear in thermally cracked carbon black (CBp) formulation system during mixing. Polym. Test. 2022, 113, 107674. [Google Scholar] [CrossRef]
  9. Yadav, V.B.; Gadi, R.; Kalra, S. Adsorption of lead on clay-CNT nanocomposite in aqueous media by UV-Vis-spectrophotometer: Kinetics and thermodynamic studies. Emergent Mater. 2019, 2, 441–451. [Google Scholar] [CrossRef]
  10. Ihsanullah; Patel, F.; Khraisheh, M.; Atieh, M.A.; Laoui, T. Novel aluminum oxide-impregnated carbon nanotube membrane for the removal of cadmium from aqueous solution. Materials 2017, 10, 1144. [Google Scholar] [CrossRef]
  11. Abualnaja, K.M.; Alprol, A.E.; Ashour, M.; Mansour, A.T. Influencing multi-walled carbon nanotubes for the removal of ismate violet 2r dye from wastewater: Isotherm, kinetics, and thermodynamic studies. Appl. Sci. 2021, 11, 4786. [Google Scholar] [CrossRef]
  12. Shabaan, O.A.; Jahin, H.S.; Mohamed, G.G. Removal of anionic and cationic dyes from wastewater by adsorption using multiwall carbon nanotubes. Arab. J. Chem. 2020, 13, 4797–4810. [Google Scholar] [CrossRef]
  13. Zhao, B.; Zhao, Y.; Liu, P.; Men, Y.L.; Pan, Y.X. Boosting the adsorption and removal of dye from water by COOH-functionalized carbon nanotubes. Green Chem. Eng. 2023, 4, 88–98. [Google Scholar] [CrossRef]
  14. Saxena, M.; Lochab, A.; Saxena, R. Asparagine functionalized MWCNTs for adsorptive removal of hazardous cationic dyes: Exploring kinetics, isotherm and mechanism. Surf. Interfaces 2021, 25, 101187. [Google Scholar] [CrossRef]
  15. Gul, A.; Khaligh, N.G.; Julkapli, N.M. Surface modification of Carbon-Based Nanoadsorbents for the Advanced Wastewater Treatment. J. Mol. Struct. 2021, 1235, 130148. [Google Scholar] [CrossRef]
  16. Ewis, D.; Ba-Abbad, M.M.; Benamor, A.; El-Naas, M.H. Adsorption of organic water pollutants by clays and clay minerals composites: A comprehensive review. Appl. Clay Sci. 2022, 229, 106686. [Google Scholar] [CrossRef]
  17. Manna, S.; Das, P.; Basak, P.; Sharma, A.K.; Singh, V.K.; Patel, R.K.; Pandey, J.K.; Ashokkumar, V.; Pugazhendhi, A. Separation of pollutants from aqueous solution using nanoclay and its nanocomposites: A review. Chemosphere 2021, 280, 130961. [Google Scholar] [CrossRef]
  18. Jawad, A.H.; Saber, S.E.M.; Abdulhameed, A.S.; Farhan, A.M.; ALOthman, Z.A.; Wilson, L.D. Characterization and applicability of the natural Iraqi bentonite clay for toxic cationic dye removal: Adsorption kinetic and isotherm study. J. King Saud Univ. Sci. 2023, 35, 102630. [Google Scholar] [CrossRef]
  19. Zhang, H.; Zhou, J.; Muhammad, Y.; Tang, R.; Liu, K.; Zhu, Y.; Tong, Z. Citric acid modified bentonite for congo red adsorption. Front. Mater. 2019, 6, 5. [Google Scholar] [CrossRef]
  20. Gharsalli, A.; Bagane, M.; Porte, C.; Havet, J.L.; Ammar, S. Response Surface Optimization and Modeling of Ammonium Chloride Activation Process of Bentonite. Courrier Savoir 2017, 22, 61–68. [Google Scholar]
  21. Abdulsalam, K.A.; Giwa, A.R.A.; Adelowo, J.M. Optimization studies for decolourization of textile wastewater using a sawdust-based adsorbent. Chem. Data Collect. 2020, 27, 100400. [Google Scholar] [CrossRef]
  22. Qureshi, M.I.; Patel, F.; Al-Baghli, N.; Abussaud, B.; Tawabini, B.S.; Laoui, T. A comparative study of raw and metal oxide impregnated carbon nanotubes for the adsorption of hexavalent chromium from aqueous solution. Bioinorg. Chem. Appl. 2017, 2017, 1–10. [Google Scholar] [CrossRef] [PubMed]
  23. Yang, H.; Zhang, Y.; Ouyang, J. Physicochemical Properties of Halloysite, 1st ed.; Elsevier Ltd.: Amsterdam, The Netherlands, 2016; Volume 7. [Google Scholar]
  24. Sedaghat, S. Synthesis of clay-CNTs nanocomposite. J. Nanostruct. Chem. 2013, 3, 1–5. [Google Scholar] [CrossRef]
  25. López-Luna, J.; Ramírez-Montes, L.E.; Martinez-Vargas, S.; Martínez, A.I.; Mijangos-Ricardez, O.F.; González-Chávez, M.D.C.A.; Carrillo-González, R.; Solís-Domínguez, F.A.; Cuevas-Díaz, M.D.C.; Vázquez-Hipólito, V. Linear and nonlinear kinetic and isotherm adsorption models for arsenic removal by manganese ferrite nanoparticles. SN Appl. Sci. 2019, 1, 1–19. [Google Scholar] [CrossRef]
  26. Ngteni, R.; Hossain, M.S.; Kadir, M.O.A.; Asis, A.J.; Tajudin, Z. Kinetics and isotherm modeling for the treatment of rubber processing euent using iron (II) sulphate waste as a coagulant. Water 2020, 12, 1747. [Google Scholar] [CrossRef]
  27. Sajid, M.J.; Yu, Z.; Rehman, S.A. The Coal, Petroleum, and Gas Embedded in the Sectoral Demand-and-Supply Chain: Evidence from China. Sustainability 2022, 14, 1888. [Google Scholar] [CrossRef]
  28. Taylor, P.; Gulicovski, J.J.; Ljiljana, S.Č.; Milonji, S.K. Point of Zero Charge and Isoelectric Point of Alumina Point of Zero Charge and Isoelectric Point of Alumina. Mater. Manuf. Process. 2008, 23, 37–41. [Google Scholar]
  29. Moustafa, M.T. Preparation and Characterization of Low-Cost Adsorbents for the Efficient Removal of Malachite Green Using Response Surface Modeling and Reusability Studies; Nature Publishing Group: London, UK, 2023; Volume 13. [Google Scholar]
  30. Athari, M.; Fattahi, M.; Nikou, M.K.; Hajhariri, A. Adsorption of different anionic and cationic dyes by hybrid nanocomposites of carbon nanotube and graphene materials over UiO-66. Sci. Rep. 2022, 12, 20415. [Google Scholar] [CrossRef]
  31. Aslam, Z.; Qaiser, M.; Ali, R.; Abbas, A.; Ihsanullah; Zarin, S. Al2O3/MnO2/CNTs nanocomposite: Synthesis, characterization and phenol adsorption. Fullerenes Nanotub. Carbon Nanostruct. 2019, 27, 591–600. [Google Scholar] [CrossRef]
  32. Kéri, A.; Sápi, A.; Ungor, D.; Sebők, D.; Csapó, E.; Kónya, Z.; Galbács, G. Porosity determination of nano- and sub-micron particles by single particle inductively coupled plasma mass spectrometry. J. Anal. At. Spectrom. 2020, 35, 1139–1147. [Google Scholar] [CrossRef]
  33. Ravikumar, K.; Krishnan, S.; Ramalingam, S.; Balu, K. Optimization of process variables by the application of response surface methodology for dye removal using a novel adsorbent. Dye. Pigment. 2007, 72, 66–74. [Google Scholar] [CrossRef]
  34. Gholami, S.; Llacuna, J.L.; Vatanpour, V.; Dehqan, A.; Paziresh, S.; Cortina, J.L. Impact of a new functionalization of multiwalled carbon nanotubes on antifouling and permeability of PVDF nanocomposite membranes for dye wastewater treatment. Chemosphere 2021, 294, 133699. [Google Scholar] [CrossRef] [PubMed]
  35. Guo, J.; Zhang, Q.; Cai, Z.; Zhao, K. Preparation and dye filtration property of electrospun polyhydroxybutyrate–calcium alginate/carbon nanotubes composite nanofibrous filtration membrane. Sep. Purif. Technol. 2016, 161, 69–79. [Google Scholar] [CrossRef]
  36. Bello, O.S.; Adegoke, K.A.; Akinyunni, O.O. Preparation and characterization of a novel adsorbent from Moringa oleifera leaf. Appl. Water Sci. 2017, 7, 1295–1305. [Google Scholar] [CrossRef]
  37. Yuan, N.; Tan, K.; Zhang, X.; Zhao, A.; Guo, R. Synthesis and adsorption performance of ultra-low silica-to-alumina ratio and hierarchical porous ZSM-5 zeolites prepared from coal gasification fine slag. Chemosphere 2022, 303, 134839. [Google Scholar] [CrossRef] [PubMed]
  38. Titchou, F.E.; Akbour, R.A.; Assabbane, A.; Hamdani, M. Removal of cationic dye from aqueous solution using Moroccan pozzolana as adsorbent: Isotherms, kinetic studies, and application on real textile wastewater treatment. Groundw. Sustain. Dev. 2020, 11, 100405. [Google Scholar] [CrossRef]
  39. Javed, F.; Feroze, N.; Ikhlaq, A.; Kazmi, M.; Ahmad, S.W.; Munir, H.M.S. Biosorption potential of Sapindus mukorossi dead leaves as a novel biosorbent for the treatment of reactive red 241 in aqueous solution. Desalin. Water Treat. 2019, 137, 345–357. [Google Scholar]
  40. Eletta, O.A.A.; Mustapha, S.I.; Ajayi, O.A.; Ahmed, A.T. Optimization of dye removal from textile wastewater using activated carbon from sawdust. Niger. J. Technol. Dev. 2018, 15, 26. [Google Scholar] [CrossRef]
  41. Chauhdary, Y.; Hanif, M.A.; Rashid, U.; Bhatti, I.A.; Anwar, H.; Jamil, Y.; Alharthi, F.A.; Kazerooni, E.A. Effective Removal of Reactive and Direct Dyes from Colored. Water 2022, 14, 3604. [Google Scholar] [CrossRef]
  42. Althomali, R.H.; Alamry, K.A.; Hussein, M.A.; Guedes, R.M. An investigation on the adsorption and removal performance of a carboxymethylcellulose-based 4-aminophenazone@MWCNT nanocomposite against crystal violet and brilliant green dyes. RSC Adv. 2023, 13, 4303–4313. [Google Scholar] [CrossRef]
  43. Amalia, Z.; Efriza, S. Removal of Dye Waste by Green Adsorbent. Am. Inst. Phys. Conf. Ser. 2023, 2431, 060017. [Google Scholar]
  44. Elamin, M.R.; Abdulkhair, B.Y.; Algethami, F.K.; Khezami, L. Linear and nonlinear investigations for the adsorption of paracetamol and metformin from water on acid-treated clay. Sci. Rep. 2021, 11, 1–13. [Google Scholar]
  45. Tahir, S.S.; Rauf, N. Removal of a cationic dye from aqueous solutions by adsorption onto bentonite clay. Chemosphere 2006, 63, 1842–1848. [Google Scholar] [CrossRef] [PubMed]
  46. Hussain, M.S.; Rehman, R.; Imran, M. Isothermal and Kinetic Investigation of Exploring the Potential of Citric Acid-Treated Trapa natans and Citrullus lanatus Peels for Biosorptive Removal of Brilliant Green Dye from Water. J. Chem. 2021, 2021, 1–23. [Google Scholar] [CrossRef]
  47. SJaved, H.; Zahir, A.; Khan, A.; Afzal, S.; Mansha, M. Adsorption of Mordant Red 73 dye on acid activated bentonite: Kinetics and thermodynamic study. J. Mol. Liq. 2018, 254, 398–405. [Google Scholar]
  48. Assila, O.; Tanji, K.; Zouheir, M.; Arrahli, A.; Nahali, L.; Zerrouq, F.; Kherbeche, A. Adsorption studies on the removal of textile effluent over two natural eco-friendly adsorbents. J. Chem. 2020, 2020, 1–13. [Google Scholar] [CrossRef]
  49. Aslam, Z.; Yousaf, I.; Akhtar, A.; Zahi, A. Adsorptive performance of MWCNTs for simultaneous cationic and anionic dyes removal; kinetics, thermodynamics, and isotherm study. Turk. J. Chem. 2021, 45, 1189–1200. [Google Scholar] [CrossRef]
  50. Patel, M.; Chaubey, A.K.; Pittman, C.; Mohan, D. Aqueous ibuprofen sorption by using activated walnut shell biochar: Process optimization and cost estimation. Environ. Sci. Adv. 2022, 1, 530–545. [Google Scholar] [CrossRef]
  51. Chakraborty, P.; Show, S.; Banerjee, S.; Halder, G. Mechanistic insight into sorptive elimination of ibuprofen employing bi-directional activated biochar from sugarcane bagasse: Performance evaluation and cost estimation. J. Environ. Chem. Eng. 2018, 6, 5287–5300. [Google Scholar] [CrossRef]
  52. Chakraborty, P.; Banerjee, S.; Kumar, S.; Sadhukhan, S.; Halder, G. Elucidation of Ibuprofen Uptake Capability of Raw and Steam Activated Biochar of Aegle Marmelos Shell: Isotherm, Kinetics, Thermodynamics and Cost Estimation; Institution of Chemical Engineers: Colwall, UK, 2018; Volume 118. [Google Scholar]
  53. Ahmadi, M.; Ramezani, H.; Jaafarzadeh, N. Enhanced photocatalytic degradation of tetracycline and real pharmaceutical wastewater using MWCNT/TiO2 nano-composite. J. Environ. Manag. 2017, 186, 55–63. [Google Scholar] [CrossRef]
  54. Amin, M.T.; Alazba, A.A.; Shafiq, M. Adsorptive Removal of Reactive Black 5 from Wastewater Using Bentonite Clay: Isotherms, Kinetics and Thermodynamics. Sustainability 2015, 7, 15302–15318. [Google Scholar] [CrossRef]
  55. Momina; Rafatullah, M.; Ismail, S.; Ahmad, A. Optimization study for the desorption of methylene blue dye from clay based adsorbent coating. Water 2019, 11, 1304. [Google Scholar] [CrossRef]
  56. Kausar, A.; Sher, F.; Hazafa, A.; Javed, A.; Sillanpää, M.; Iqbal, M. Biocomposite of sodium-alginate with acidified clay for wastewater treatment: Kinetic, equilibrium and thermodynamic studies. Int. J. Biol. Macromol. 2020, 161, 1272–1285. [Google Scholar] [CrossRef] [PubMed]
  57. Fernandes, J.V.; Rodrigues, A.M.; Menezes, R.R.; de Araújo Neves, G. Adsorption of anionic dye on the acid-functionalized bentonite. Materials 2020, 13, 3600. [Google Scholar] [CrossRef] [PubMed]
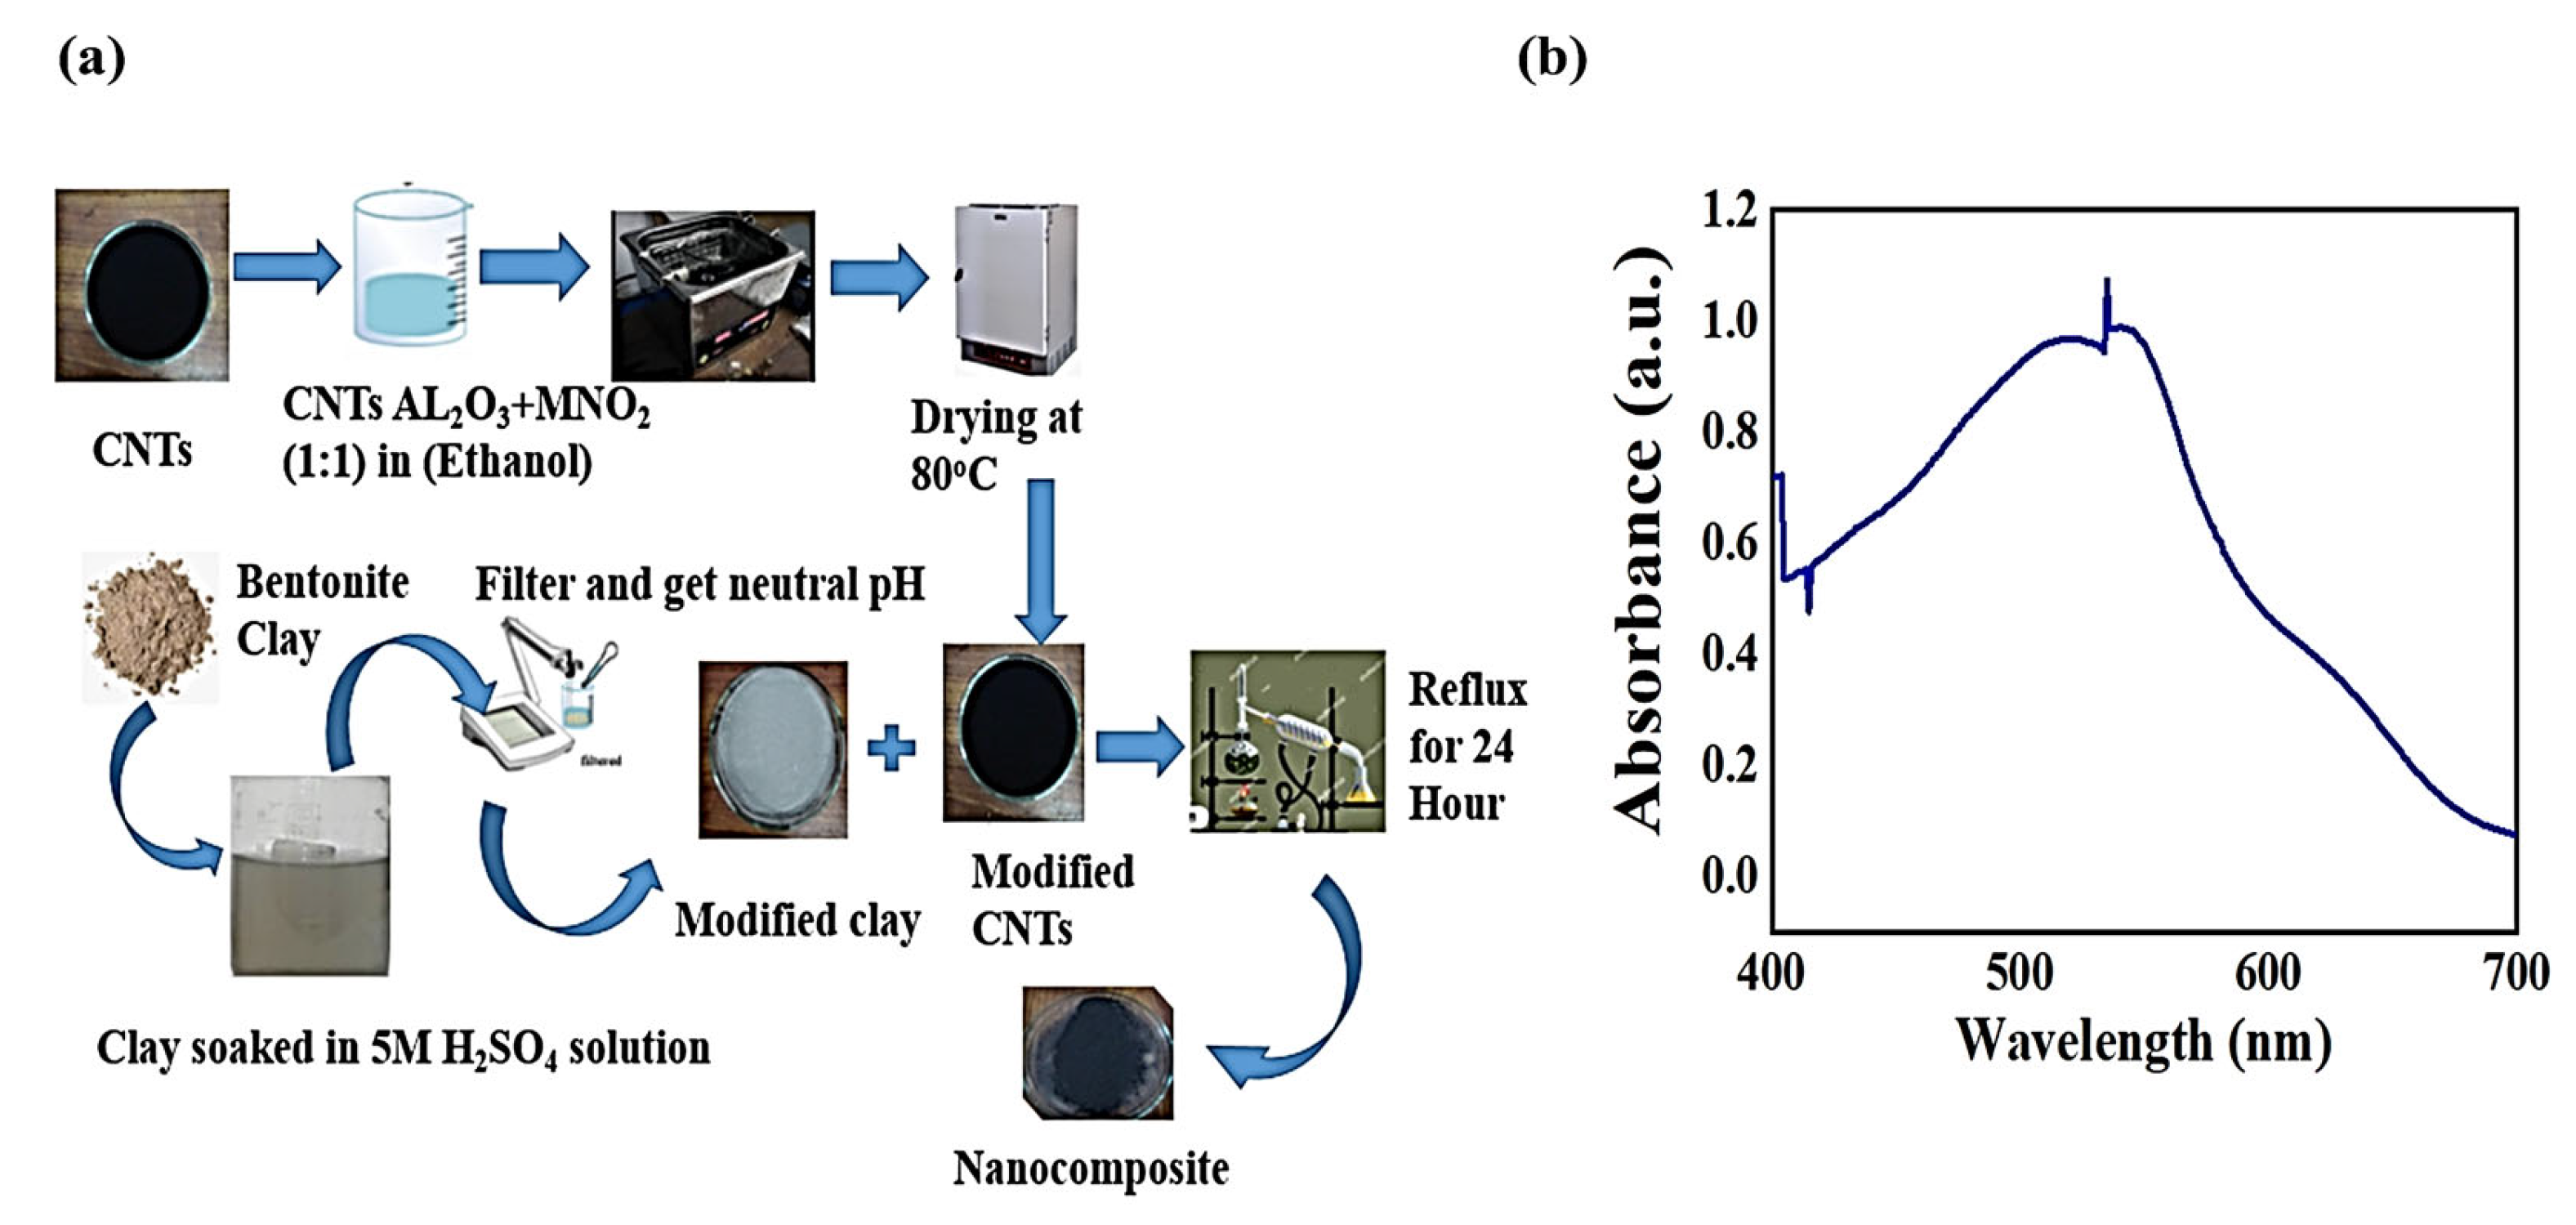
Figure 1. (a) Synthesis of modified bentonite clay/CNT nanocomposite. (b) UV spectra of textile wastewater.
Water 15 03197 g001
Figure 2. FTIR spectra before and after the adsorption experiment.
Water 15 03197 g002
Figure 3. Particle size distribution of SEM images before adsorption (a,b,e,f) and after adsorption (c,d,g,h).
Water 15 03197 g003
Figure 4. Image thresholding for SEM images before adsorption (a,c) and after adsorption (b,d).
Water 15 03197 g004
Figure 5. Pore size distribution of SEM images before adsorption (a,c) and after adsorption (b,d).
Water 15 03197 g005
Figure 6. The surface roughness of SEM images before adsorption (a,c) and after adsorption (b,d).
Water 15 03197 g006
Figure 7. (a) Comparison of surface roughness of nanocomposite before and after adsorption. (b) Surface roughness (a,b) before adsorption (c,d) after adsorption.
Water 15 03197 g007
Figure 8. (a) EDX Analysis before adsorption; (b) EDX analysis after adsorption.
Water 15 03197 g008
Figure 9. 3D surface (ac) and contour plots (df) before and after adsorption for the parameter optimization between the pH, contact time, and adsorbent dosage.
Water 15 03197 g009
Figure 10. (a) Langmuir adsorption, (b) Freundlich isotherm, and (c) Temkin isotherm models for removing COD at pH = 3, t = 60 min, adsorbent dose = 100 mg. (d) Non- linear Isotherms.
Water 15 03197 g010
Figure 11. (a) Linear pseudo-first-order; (b) linear pseudo-second-order; (c,d) Intraparticle diffusion model (e) non-linear kinetics study (f) thermodynamic parameters.
Water 15 03197 g011
Figure 12. (a) Effect of time (b) Effect of adsorbent dose (c) Effect of pH (d) Effect of Temperature.
Water 15 03197 g012
Table 1. Characterization of real textile wastewater.
ParametersBefore Treatment
pH10.1
TDS (mg/L)2750
Electrical conductivity (µS)5550
Chemical oxygen demand (mg/L)1140
Turbidity (NTU)0.79
ColorDark red
Dilution factor (DF)10
Table 2. Equations for isotherm and kinetic studies.
IsothermKinetics
LangmuirPseudo-First Order
C e q e = 1 b q max + C e q max ( L i n e a r )
q max K L C e 1   +   K L C e ( N o n - L i n e a r )
L n q e q t =   ln q e q t ( L i n e a r )
d q t d t =   K t ( q e q t ) ( N o n - L i n e a r )
FreundlichPseudo-Second order Kinetics
L o g q e   = L o g K F + log C e n ( L i n e a r )
q e   = K F C e 1 n ( N o n - L i n e a r )
t q t = 1 K q 2 e 2 + t q e (Linear)
d q t d t = K 2 ( q e q t ) 2 (Non-Linear)
TemkinIntraparticle Diffusion model
q e = R T b ln K T + R T b ln C e (Linear)
q e ` = R T b   ln ( A T   C e ) (No linear)
q t = K diff t 1 2 + C
Table 3. Experimental ranges for the central composite design.
FactorVariable−101−aa
AAdsorbent dose (mg)5075100−11
BpH35.58−11
CTime (minutes)3075120−11
Table 4. Experimental runs based on CCD.
RunFactor 1
A: Adsorbent Dose (mg)
Factor 2
B: pH
Factor
C: Time (Minute)
Response
% Decolorization
1755.507572.37
2505.507550.754
35083050.3256
4755.507567.455
51005.507585.78
6755.5012081.71
7755.507569.611
8755.507567.511
950812072.425
1010083069.215
11755.507573.11
121003.03081.796
13755.503063.057
14753.07575.21
15503.03051.475
16100812086.57
171003.012089.41
187587567.71
19503.012062.86
20755.507572.41
Table 5. Porosity for SEM images using ImageJ.
% porosity of SEM images of Figure 3.
Before AdsorptionAfter Adsorption
a. 6.597%c. 5.14%
b. 5.36%d. 3.578%
Table 6. Elemental composition of Clay/CNT before and after adsorption.
ElementWeight % before AdsorptionWeight% after Adsorption
C75.2482.01
O17.0212.52
Al2.271.53
Si4.072.32
K0.290.22
Fe0.430.22
Table 7. The experimental and numerical computed removal efficiency of dye removal via adsorbent.
Adsorbent Dose mgpHTime
Minute
Model DesirabilityRemoval%
PredictedExperimentalError%
10031200.94691.5589.412.14
Table 8. Adsorption isotherms.
Linear IsothermNonlinear Isotherm
Model and EquationsParameterValueValue
Langmuirqm (mg/g)518.13518.23
R20.997260.9999
RL0.4270.4287
qecal550.30550.1
X20.000090.0001
FreundlichKF601657
R20.9930.9999
1/n (g/L)0.048370.04837
qecal557550.25
X20.0870.0001
TemkinAT (L/mg)4.16 × 10−78.89 × 1042
BT49.158(j.mol)5.29
qecal542542
R20.96550.9987
X20.110.11
Table 9. Thermodynamic parameters for the removal of textile dyes.
Temperature (K)1/T(K−1)ΔG° (kJ/mol) KL(KL (L/g)LnKL (L/g)ΔH° (kJ/mol)ΔS° (kJ/mol/K)qe (mg/g)R2
3080.003247−0.978731.4655170.382208 -4250.95
3180.003145−4.081284.6818181.543687--515-
3280.003049−5.546087.6428572.03377269.69270.2300535-
Table 10. Comparison of different low-cost sorbents.
AdsorbentsTextile DyeRemoval Efficiency (%)Adsorption Capacity mg/gReferences
MWCNT/TiO2Indigo carmine dye83292[53]
Bentonite clayReactive Black 55829[54]
Bentinite clayMethylene Blue7023[55]
Biocomposite sodium alganite-acidified claydyes>908.39[56]
Acid-functionalized bentoniteMethyl Orange90237[57]
Mgo-impregnated clayMalachite green9817.3[29]
Acid-modified CNTsIsmate Violet 2R88.276.92[11]
COOH-MWCNTMethyl Red9580.33[13]
Modified clay/CNTTextile dyes89.9550Present study
Disclaimer/Publisher’s Note: The statements, opinions and data contained in all publications are solely those of the individual author(s) and contributor(s) and not of MDPI and/or the editor(s). MDPI and/or the editor(s) disclaim responsibility for any injury to people or property resulting from any ideas, methods, instructions or products referred to in the content.