Article

Quantitative Evaluation of Suspended Solid Runoff from Large-Scale Landslide Areas Presumed to Be the Source of Turbid Water

1
Faculty of Engineering, University of Miyazaki, Miyazaki 889-2192, Japan
2
Graduate School of Engineering, Nagoya Institute of Technology, Nagoya 466-8555, Japan
3
Taisei Corporation, Chigasaki 253-0001, Japan
*
Author to whom correspondence should be addressed.
Water 2023, 15(18), 3186; https://doi.org/10.3390/w15183186
Submission received: 7 August 2023 / Revised: 29 August 2023 / Accepted: 4 September 2023 / Published: 7 September 2023
(This article belongs to the Special Issue Challenges to Interdisciplinary Application of Hydrodynamic Models)

Abstract

:
In the uppermost stream of the Mimikawa River, in northern Miyazaki Prefecture, the contribution to river turbidity of a huge, collapsed slope alternating sandstone and mudstone layers was qualitatively shown in our previous study. In this study, the water level and turbidity were continuously observed, to obtain a quantitative estimation of this contribution. The conversion equation from the water level to the flow rate is required, but field measurements during the flooding term in the mountainous site are difficult. In this study, a high-resolution survey was conducted, and the relationship was determined via a small-scale hydraulic model shaped using a 3D printer from the survey results, to determine the relationship between the water level and the flow rate. The flow rate time series was reproduced with the distributed runoff model that is verified with the flow rate converted from the water level. The flow rate and turbidity load time series were also estimated from the long-term rainfall. The area of the bare soil surface of each small basin was obtained via satellite image analysis, and the soil yield from each surface condition was calculated. Furthermore, the amount of turbidity produced upstream of Kamishiiba Dam was calculated for each small basin. It was estimated that 24% of the turbidity was generated from the small basin covering 5.7% of the total catchment area. This study showed that it is possible to verify the hydrological model by obtaining the water-level–discharge relationship, even in the mountains, where it is difficult to observe the discharge on-site, via small-scale hydraulic model experiments.

1. Introduction

The Kamishiiba Dam, which is located in the uppermost stream of the Mimikawa River system in northern Miyazaki Prefecture, is a power generation dam managed by Kyushu Electric Power Company. Completed in 1995 as Japan’s first large-scale arch-type dam, it has a height of 111 m, a length of 341 m, and a total water storage capacity of 91.55 million m3. The dam is a power generation dam, without a flood control function, and surface water overflows from an emergency spillway, and is discharged during large-scale floods. At that time, the influent turbid water behaves as a bottom layer density flow, and intrudes into the secondary cline formed near the water intake at a depth of 45 m. Because it is a dam dedicated to power generation, it does not have a large-scale discharge function that can quickly discharge the inflow water from the middle layer at the time of flooding. It is likely to cause the effects of increased turbidity on downstream areas, including not only damage to the landscape of rivers, but also impediments to water treatment, damage to aquatic organisms, and adhesion of soil particles to agricultural products, due to the use of agricultural water. In the “Mimikawa river improvement master plan” [1], the long-term discharge of turbid water from the dam is listed as an issue that should be tackled. However, there is a limit to the possible elimination of the tendency of turbid water to prolong via changing the dam operation. In general, to deal with the problem of prolonged turbidity, it is conceivable to install a selective water intake facility that discharges the top layer of water downstream, or a bypass tunnel that diverts the turbid water, together with the sediment that flows into it at the time of flooding. The introduction of these countermeasures to the dam would incur enormous costs, and a long construction period.
On the other hand, almost all of the catchment area of Kamishiiba Reservoir is covered by planted forest on steep slopes. Sandstone and shale, and their alternation of the Shimanto Group, which is geologically prone to collapse, are widely distributed [2]. In addition, the headwater area is located in the central part of Kyushu, and the mountains over 1000 m above sea level centered around Mt. Kunimi and Mt. Ichifusa, which have the heaviest rainfall in Japan, with an annual precipitation exceeding 2000 mm. Due to these topographical, geological, and meteorological conditions, landslides in the forests occur everywhere during rainy seasons [2,3,4]. A large amount of sediment is yielded on the bare surface of the landslides, and it is presumed that large-scale landslides are the main source of turbid water in the basin. To implement countermeasures for controlling the turbid water inflow to the dam intensively, it is necessary to identify the location of the source, and to quantitatively evaluate the amount of soil yield from that source.
There is a case study of identifying the source of turbidity at the Hitotsuse reservoir catchment [5], adjacent to the Mimikawa River Basin, using the mineralogical tracing method [6,7,8]. The mineral characteristics of the particles vary depending on the area. Tracing the path, and identifying the source of the SSs, is possible through comparing the chemical composition of the sediment particles, and the mineralogical characteristics of the mineral composition. Higashi et al. [9] collected 13 soil samples from the landslides and the sediments in the river channels in the Kamishiiba dam catchment area, and compared the similarity of the chemical and mineral compositions with the influent turbid water and reservoir sediment, via mineralogical methods. As a result, the authors qualitatively indicated the possibility that the landslide area in the Fudono River basin highly contributed to the total soil yield in the catchment. There is a large-scale landslide with a slope length of about 500 m, and a maximum width of about 150 m, in the Fudono River basin. A large amount of sediment is yielded on the bare surface of the landslides, and it is presumed that large-scale landslides are the main source of turbid water in the basin. However, mineralogical methods only evaluated the similarity in the mineral properties of the sediment collected in the dam and on the slopes in the upstream area, and the SS yield from the local slope could not be quantitatively evaluated. Another quantitative evaluation of the amount of soil yield from the bare surface of the landslide is required in the process of taking measures.
Kawaguchi et al. [10] also estimated the sediment yield volume from the erosion volume survey. They found that the ratio of the annual volume of sediment runoff between good, well-managed forest land and bare land was about 1:100, and the annual volume of soil erosion on the devastated land surface is 101~102 m3/ha/year. Kobayashi et al. [11] trapped all the eroded sediment from their study plots on the collapsed land with a slope length of about 40 m in the catchment area of Matsukawa Dam, Nagano Prefecture, Japan. The amount of eroded sediment in the landslide area was 857 m3/ha/year, which was nearly one order larger than that of the previous study. In these studies, not only the fine grain fraction, but also rocks and pebbles, are included in the sediment production, which is different from the focus of our study, which is only on the fine fraction that contributes to the suspension of river water. The geological characteristics of our study site are that the yield of the fine fraction is dominant, and the scale of the landslide area is much larger. A long and fragile steep slope blocks our access, and further collapse should also be considered. It is difficult to carry out surveys of the ground surface at the landslide site.
In this study, a turbidity meter and a water level gauge were installed in the downstream section of the identified landslide site, for the quantitative evaluation of the SS load. There are a lot of examples [12,13,14] of the evaluation of sediment production via on-site observation. However, most of them were carried out at observatories in flat areas that are easily accessible, even at the time of flooding. It is very difficult to build a discharge observation network including points in mountainous areas, in terms of labor and funds, and it is limited to cases such as national projects [15]. Yokoyama et al. [13] installed turbidity meters at 17 flow observatories arranged longitudinally along the Chikugo River, to study the characteristics of the SS yield. They found that the SS yield was dominant in the uppermost reaches of steep slopes. However, the flow rate at the uppermost stream was roughly estimated from the morphological outline of the river channel, based on Manning’s equation.
Our study site, the upper reaches of the Kamishiiba reservoir, is also located in a mountainous area that is practically impossible to access during a flooding term, for safety reasons. Even though there are many landslide areas in the forest, and the area is expanding, they only comprise around several percent of the vast water catchment area. On the other hand, as the amount of turbidity produced per unit area is presumed to be extremely high, as mentioned above, an observation point should be placed close to the landslide site, to measure the flow rate and the concentration of the suspended solids (SSs), to thus determine the soil yield. A hydrological model is usually calibrated using stream discharge stations. However, when discharge data are not available, remotely sensed data offer an alternative solution for calibration purposes [16]. Recent studies proved that the SWAT model can be calibrated using evapotranspiration data, whether actual or estimated from satellite data [17,18,19,20,21]. These examples illustrate the application of hydrological models to estimate the water balances over a long term, so that the evapotranspiration could be the validation standard, while this study is concerned with the phenomenon during rainfall, when evapotranspiration is not active.
One of the choices regarding this issue is the application of a distributed run-off model, and the extraction of the simulated discharge at the observatory. A distributed run-off model can be tuned with the discharge data observed over a long term from the larger catchment; for example, at an official observatory, such as the inlet to a reservoir. The discharge from the target small basin in the mountainous area can be extracted from the simulated results of the whole catchment. In the case of the Kamishiiba reservoir, the dam administrator observed the inflow to the reservoir from the upper catchment. However, the extracted discharge data from the small catchment need to be verified using data observed in the field.
In this study, the water level was recorded over a short term, and the equation for the conversion from the water level to the discharge was determined via a hydraulic experiment. Kobatake et al. [22] built a small-scale model of a check dam, which could be used as a controlling cross-section for discharge measurement in mountainous areas. They obtained a highly accurate relational expression between the water level and discharge through hydraulic experiments with the model. Referring to their experiment, the location of the observatory was selected, focusing on the check dam near the landslide area of our study site. In this study, topographical information about the study sites was obtained using advanced surveying technology and, based on this, the detailed hydraulic model was shaped via a 3D printer. The relationship between the water level and discharge was identified via hydraulic experiments with the model, and the observed water level data were converted to discharge. At the same time, the turbidity was measured at the study sites, the time series of the wash-load flux was obtained, and the relational expression between the flow rate and the wash-load flux was determined. To evaluate the annual average suspended solid yield, the simulated runoff from the small basins over a long term, using the hydrological runoff model, which ensures reproducibility via comparison with the above observation discharge data, was obtained, and the total SS load was estimated, using the relational expression between the wash load flux and the discharge.

2. Material and Methods

2.1. Study Sites

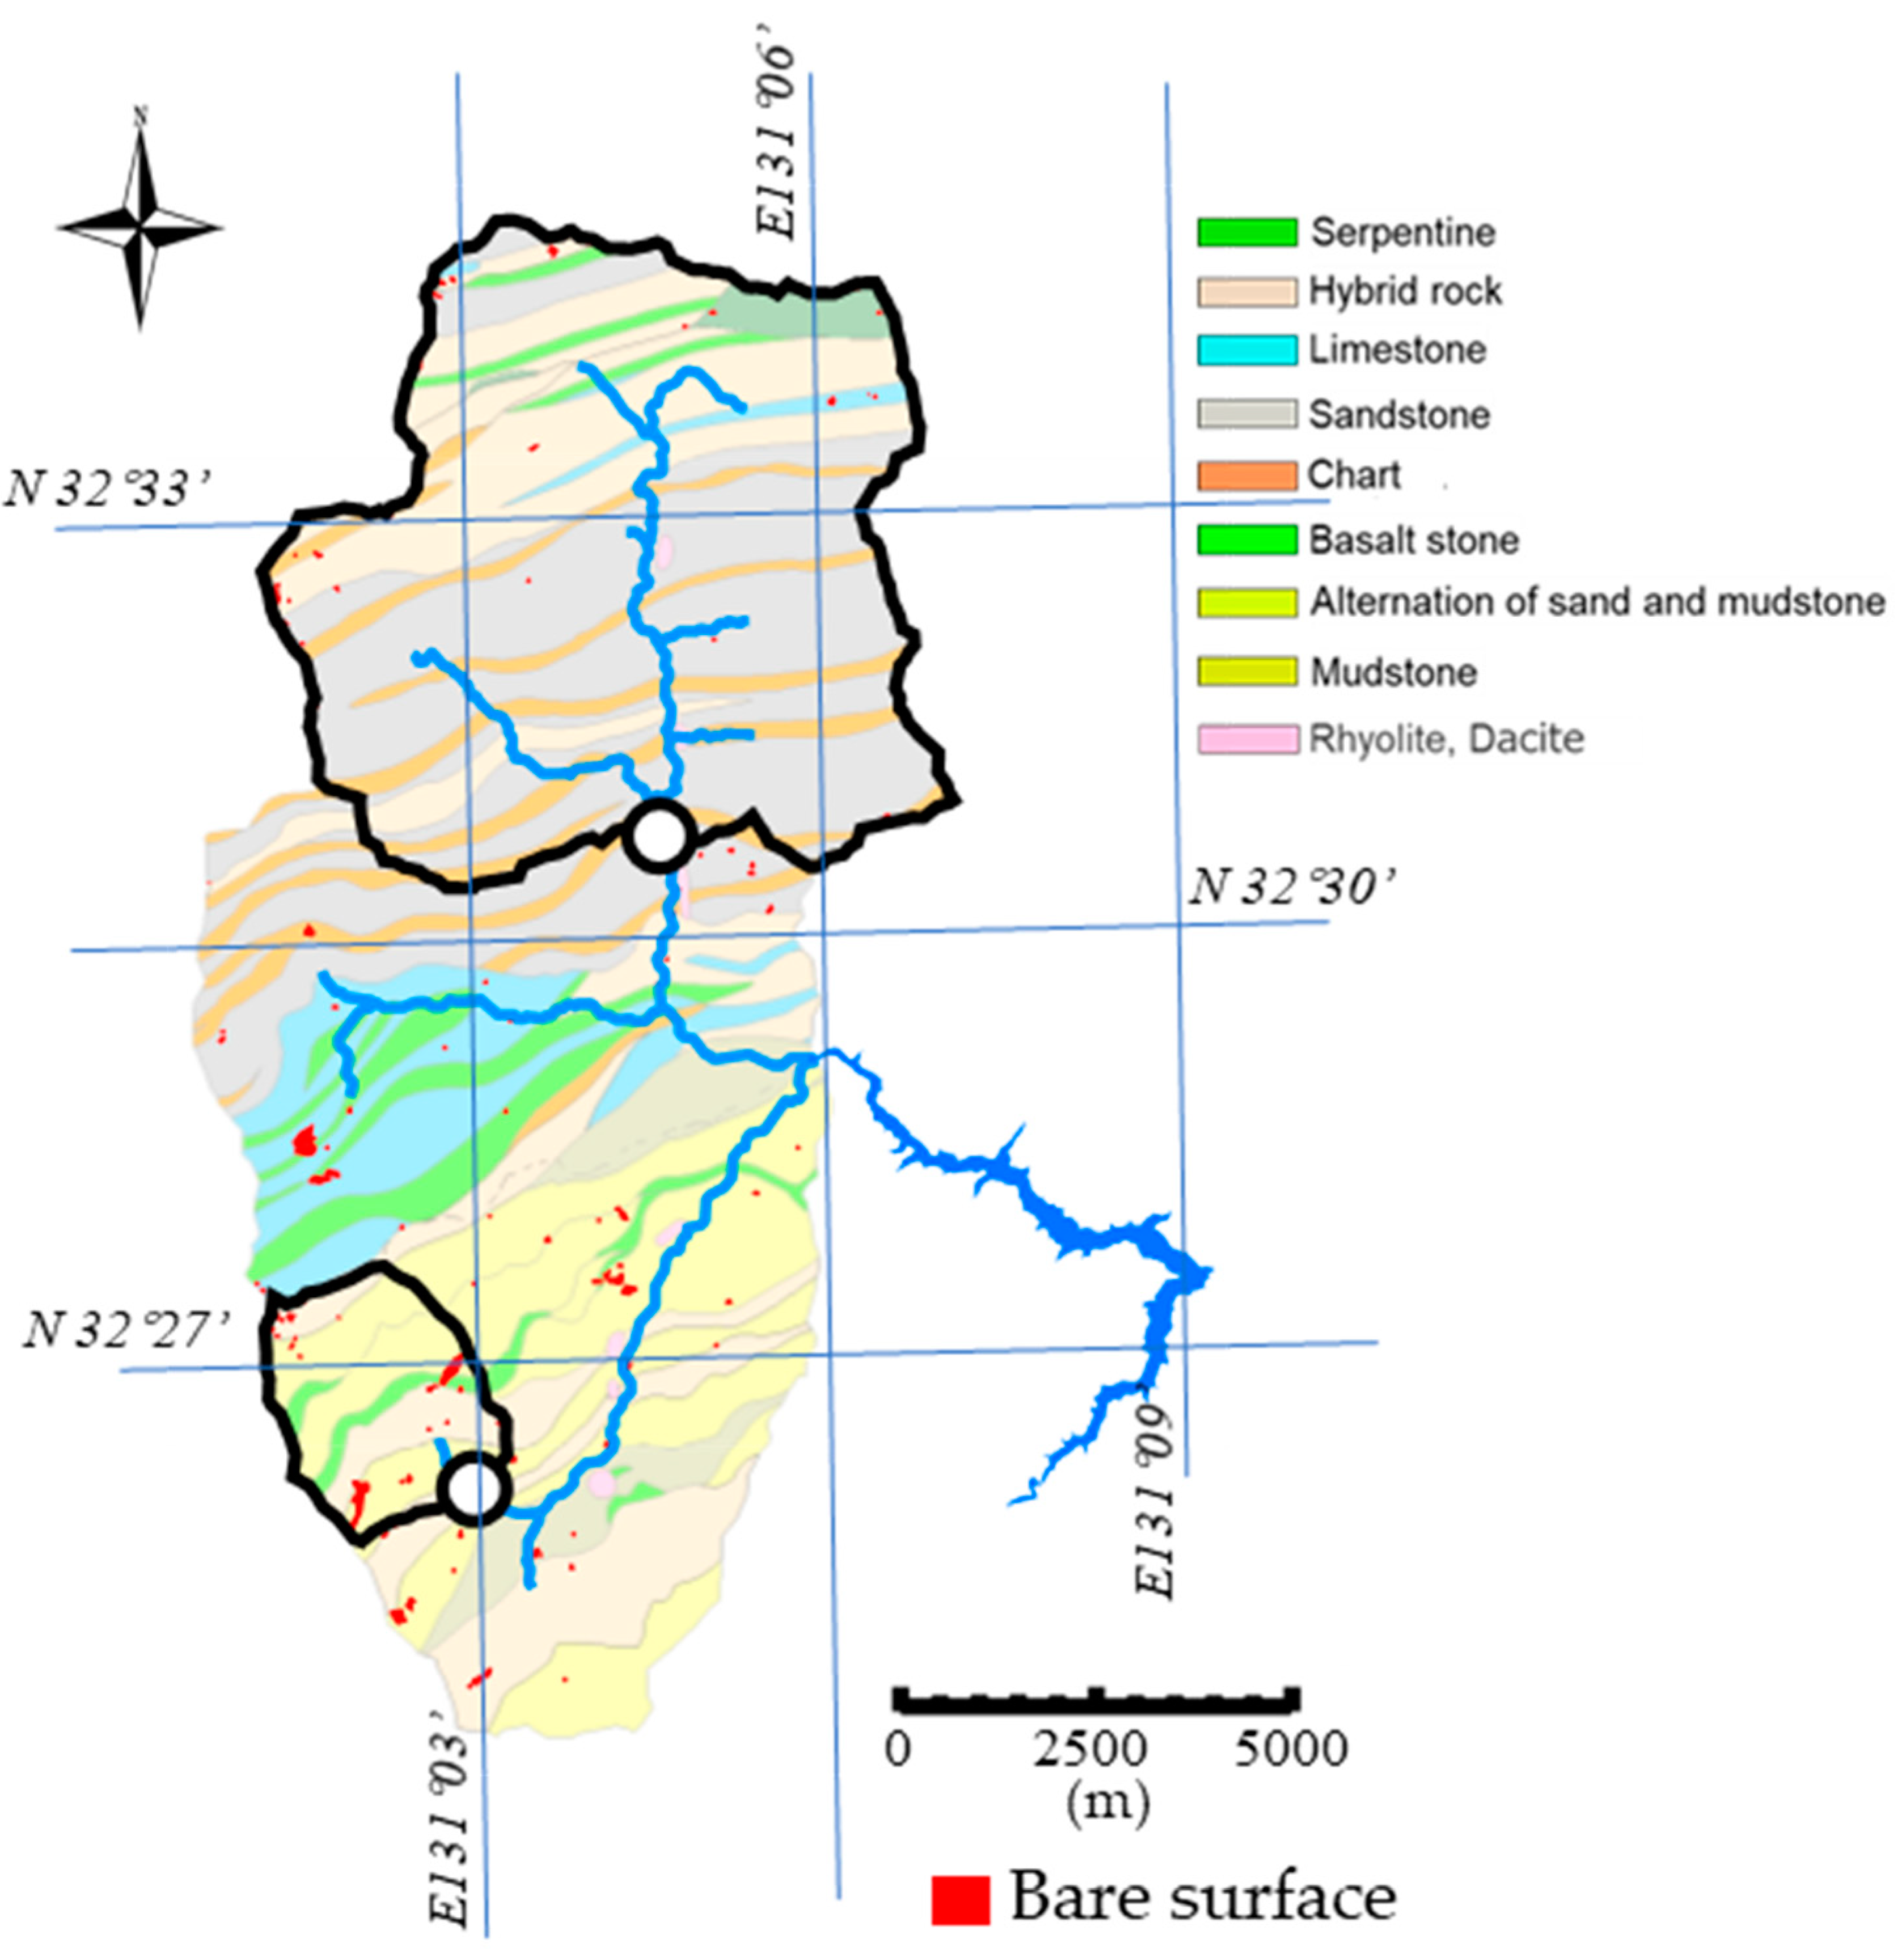
The study sites are in the catchment area of the Kamishiiba reservoir. Figure 1 shows the geological distribution of the catchment and the two observatories in the two main streams, the Mimikawa River main stream and the Fudono River, respectively. The geological conditions of the catchment areas of each observatory are different. The main geology of the Fudono River catchment is mudstone, and an alternation of sandstone and mudstone, while that of the Mimikawa River main stream is sandstone. The water level gauges (HOBO-U20: Onset Computer Corporation, Bourne, MA, USA) and turbidity meters (INFINITY-CLW: JFE Advantech, Hyogo, Japan) were installed at the points with check dams in the two streams. These instruments started observation on 4 June 2022, but the fixed turbidity meter was moved by the flood of Typhoon No. 14 on 19 September, and the continuity of observation was interrupted. The water level gauge was set to take one measurement every 30 min, and the same gauge was also installed on the ground near the observation points, to compensate for the atmospheric pressure. The turbidity meter worked in burst mode, measuring every 30 min at a frequency of 0.1 Hz. The turbidity meter is a backscattering type, and the measured value is indicated via the formazin turbidity unit (FTU). To prevent the turbidity meter from being affected by suspended obstacles, it was covered with a plastic strainer pipe, with 5 mm holes. Even so, the measured data contain abnormal values, so the lowest value among the six measurements was used as the representative value. At both points, the check dams were filled with sand, and the water was falling through the top of the weir, and the outflow from the drainage holes in the middle of the weir was negligible.
The surveys of the local topography around the check dams were conducted in October 2022. Sediment movement was observed, due to flooding from the large typhoon mentioned above, but the dams were full of sand, and there was no significant change in topography or slope from the situation before the typhoon. The topographic point clouds were obtained via laser scanner (GLS-2200: Topcon, Tokyo, Japan) and UAV-(Matrice-300-RTK: DJI Japan, Tokyo, Japan) mounted LiDAR (Zenmuse-L1: DJI Japan, Japan). The maximum scan speed of the laser scanner was 120,000 points/s, and the distance accuracy was 3.1 mm. LiDAR–UAV can acquire point clouds at an altitude of 100 m, with an accuracy of 3 cm. The correct coordination of the target of the scanner and the base station of real-time kinematic positioning (RTK) for the UAV was obtained using a GNSS receiver (HiPer HR: Topcon), with a horizontal accuracy of 5 mm, and a vertical accuracy of 10 mm. The scanning mode of the LiDAR was a repeat scanning (repeat) pattern, and the return mode was triple, to acquire the topography under the trees. The flight route was set at an altitude of about 80 m, with one survey line in the middle of the river channel, and an additional two survey lines parallel, along the bank. All the acquired point cloud data were synthesized on the same coordinates, using the software MAGNETCollage ver.2.10.0 (Topcon, Japan).

2.2. Preparation of a Miniature Model and Hydraulic Experiment

After creating 3D polygon data from the point clouds, a 3D terrain miniature model was shaped using a 3D printer (Da Vinci 1.0Pro: XYZprinting Japan, Tokyo, Japan). Figure 2 shows the point clouds acquired at the observation points and the miniature models. The scale was set to 1/250 in the horizontal direction, so that the width of the river channel in the completed model would be about 30 cm. As the maximum possible modeling size using the 3D printer is 20 × 20 cm, the polygon data were divided into several parts, and joined together after each shaping. The Tough PLA was used as the filament for the 3D printer, which has excellent processability, less heat shrinkage, and less warping after shaping. Due to the extremely small model, the water depth becomes very shallow, and there is concern that the viscosity will greatly affect the results. To reduce the effect of the viscosity, and facilitate the water level measurement, distorted models, which have a larger scale in the vertical direction (3/250, 6/250, 10/250), were also prepared.
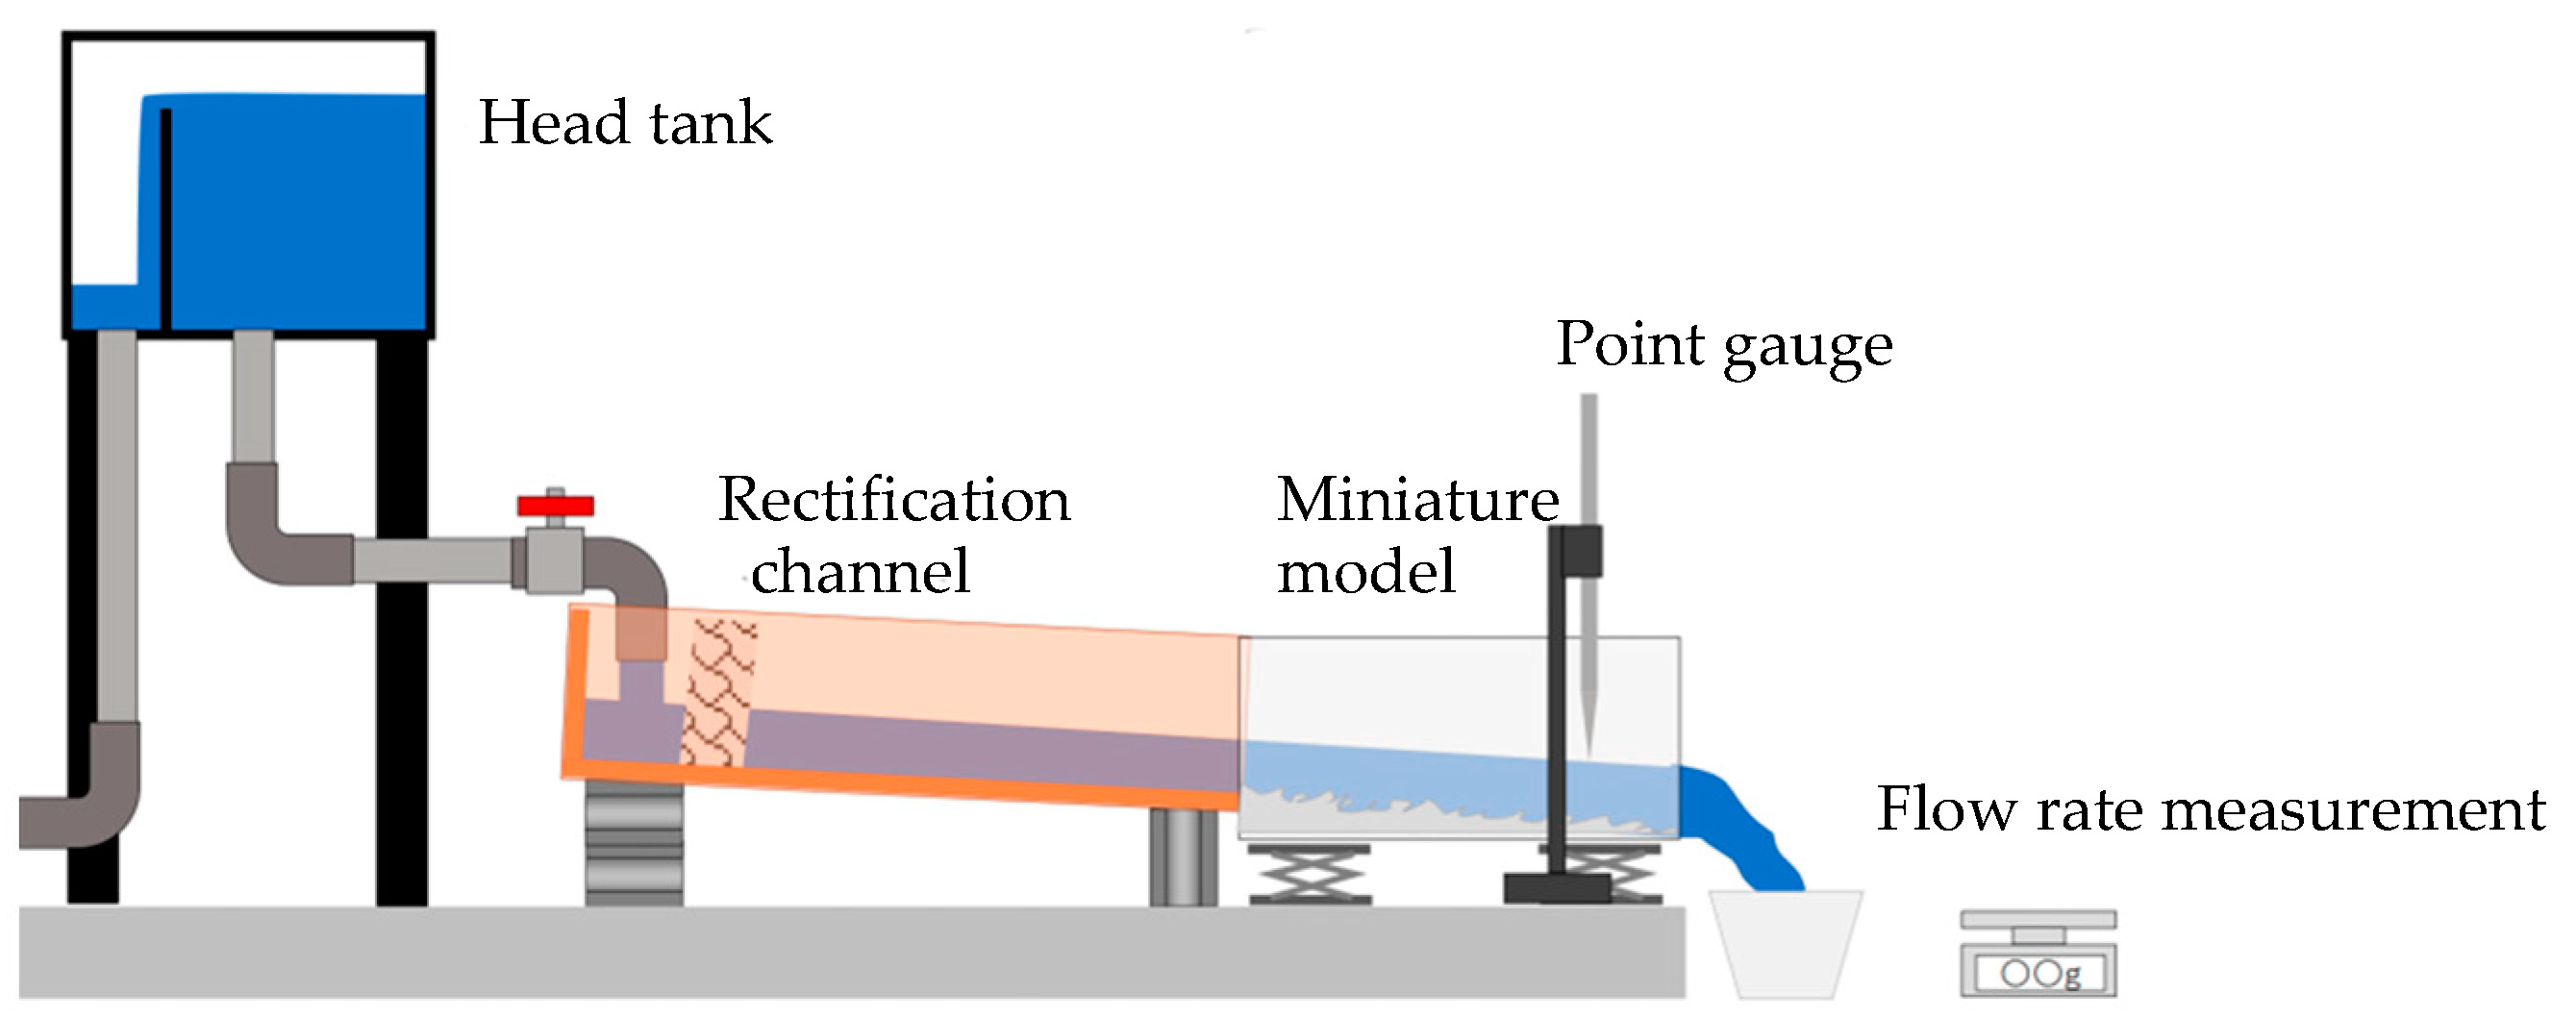
Figure 3 shows an overview of the experimental hydraulic channel. The upper end of the miniature model was connected to a rectification channel that had the same gradient as the average gradient of the models. The water level was measured with a resolution of 10−2 mm, via the placing of a point gauge at the same location as the water level gauge in the field. The discharges measured in the experiments were converted to the discharge in the actual scale, based on Froude’s law of similarity. The relationship between the water level and the discharge in the actual scale was obtained for each model.
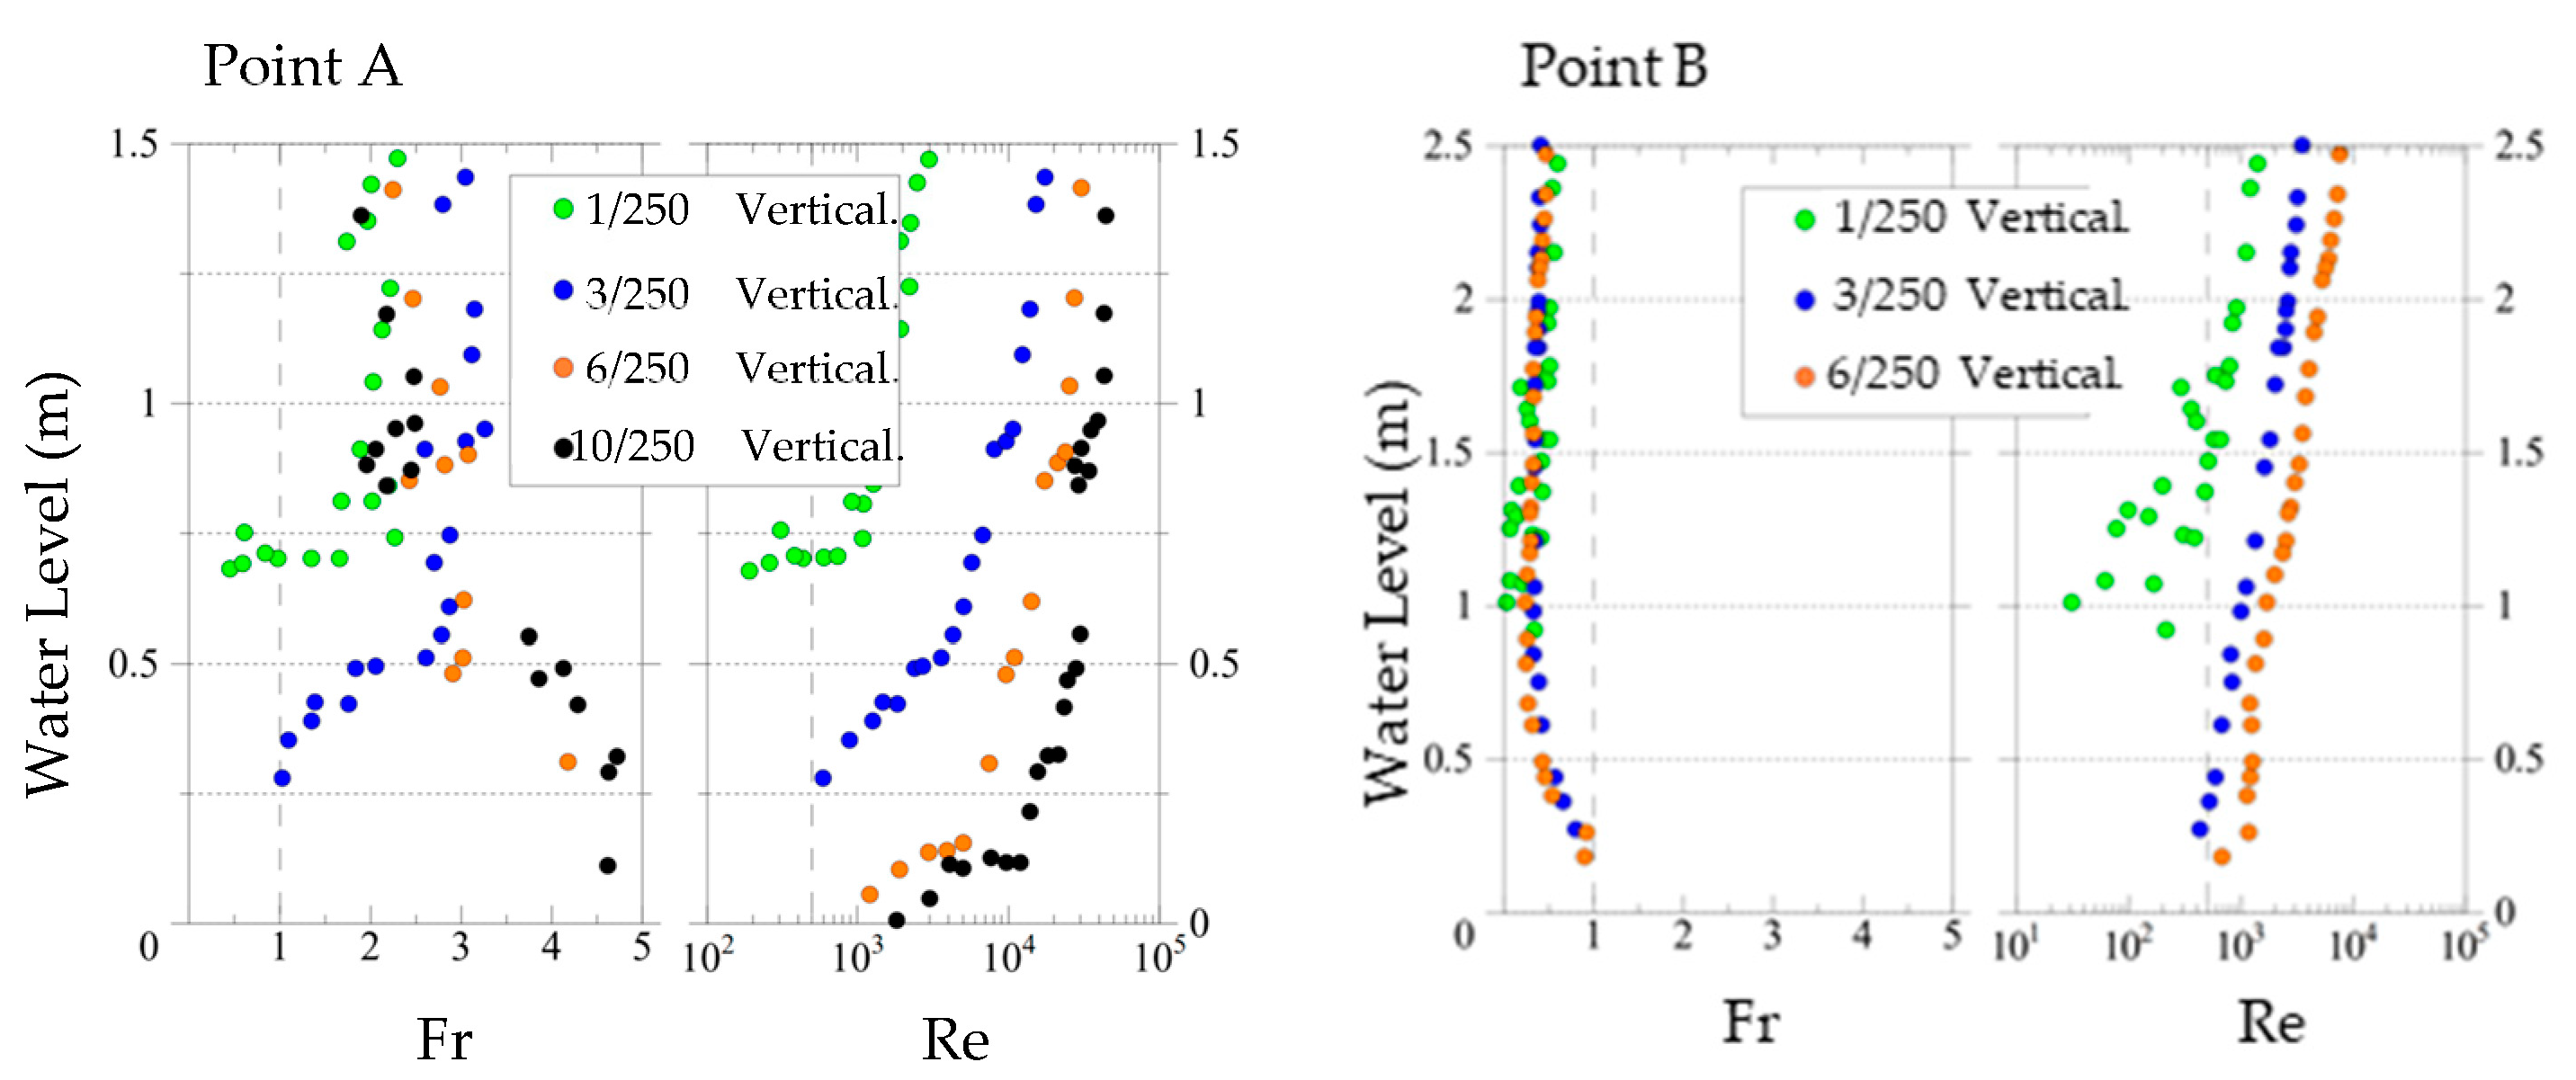
Figure 4 shows the relationships between the water level (H) and the discharge (Q) of each site, obtained from the hydraulic experiment. Figure 5 shows the relationship between the water level in each case and the Froude number or Reynolds number, which are estimated from the cross-sectional average flow velocity, and the water depth over the weir.
Regarding the relationship between the water level and the discharge at point A, the results of the non-distorted model, with a 1/250 scale in the vertical direction, show a slightly higher water level than that using the distorted scales for the same discharge. It is considered that the Reynolds number is small at low water levels, the viscosity is dominant, and the flow is laminar. On the other hand, the water depth of the distorted models is relatively large, and their Reynolds numbers exceed 500, which is the threshold between the laminar flow and the transition region. The natural river flow in the field is turbulent, so the Reynolds numbers in the experiment are required to exceed 500, meaning that the results of the non-distorted model could not duplicate the actual flow. The Froude numbers are all greater than 1, indicating a rapid state. In other words, the check dam does not function as a control section, and is affected by the gradient and roughness of the upstream side. A larger-scale distorted model naturally has a larger gradient, so it is thought that a distorted model with a smaller scale represents the actual situation better. Finally, the H–Q relation obtained from the model with the vertical scale of 3/250 was used for point A. Its R2 was 0.88.
Concerning the relationship between the water levels and the discharges at point B, the results with vertical scales of 3/250 and 6/250 show good agreement, while those of the non-distorted model are scattered, especially for the low-water-level range less than 1.5 m. This is also due to the strong influence of the viscosity. When the flow rate and water level are increased with the distorted models, the relationship is almost the same as in the other cases. It can be seen that the check dam functions as a controlling section. Both sides of the check dam at point B are high, and the width of the flow narrows above the dam, resulting in a laminar flow. Finally, the relationship between the water level and the discharge for point B, obtained from the distorted models with the vertical scales of 6/250 and 3/250, was used for the conversion from the water level observed in the field to the estimated discharge. Its R2 was 0.99.

2.3. Run-Off Simulation and Validation

The Soil and Water Assessment Tool (SWAT) [23] model (ArcSWAT 2012.10_2.18) was used for the simulation of the discharge over the long term. The parameters of the model were adjusted via SWAT–CUP [17], based on the inflow of the dam management daily report for the entire Kamishiiba Dam catchment area for 2017, when the observed data were provided by the electric power company. To assess the performance of the SWAT model, three of the most commonly used statistical indices were selected: the Nash–Sutcliffe efficiency (NSE) [24], the percent bias (PBIAS), and the coefficient of determination (R2), as shown in Equations (1)–(3), respectively. The calibrated result was validated with
N S E = 1 i = 1 n Y o b s   i Y s i m   i 2 i = 1 n Y o b s   i Y o b s   i ¯ 2
P B I A S = i = 1 n Y o b s   i Y s i m   i i = 1 n Y o b s   i × 100
R 2 = i = 1 n Y o b s   i Y o b s   i ¯ Y s i m   i Y s i m   i ¯ i = 1 n Y o b s   i Y o b s   i ¯ 2 i = 1 n Y s i m   i Y s i m   i ¯ 2
where Y o b s   i   and Y s i m   i are the observed and simulated flow rate values. Y o b s   i ¯   and Y s i m   i ¯ are the average observed and simulated flow rate values, and n is the total number of observations. The NSE ranges from −∞ to 1, where 1 is the optimal value, PBIAS is the mass balance error in percent, with 0 being the optical value, and R2 ranges from 0 to 1, with 1 being the optimal value, respectively.

3. Results and Discussion

3.1. Correlation between SS Flux and Discharge

In this study, measurement of the soil yield in the target basin via field measurements was attempted, but the observed data were obtained only for three and a half months (June–September 2022) continuously, including the flood from the typhoon. To evaluate the contribution of the specific area to the soil yield quantitatively, the annual average values of the soil yield, estimated from the long-term data of discharge and the suspended solid, are required.
A run-off simulation with a distributed hydrological model for the whole catchment to Kamishiiba reservoir was performed over the long term. The discharges from the target catchments were extracted from the simulated results, and they were verified with the observed data for the short term. A load of suspended solid was estimated from the correlation with the flow rate, found from the observed data.
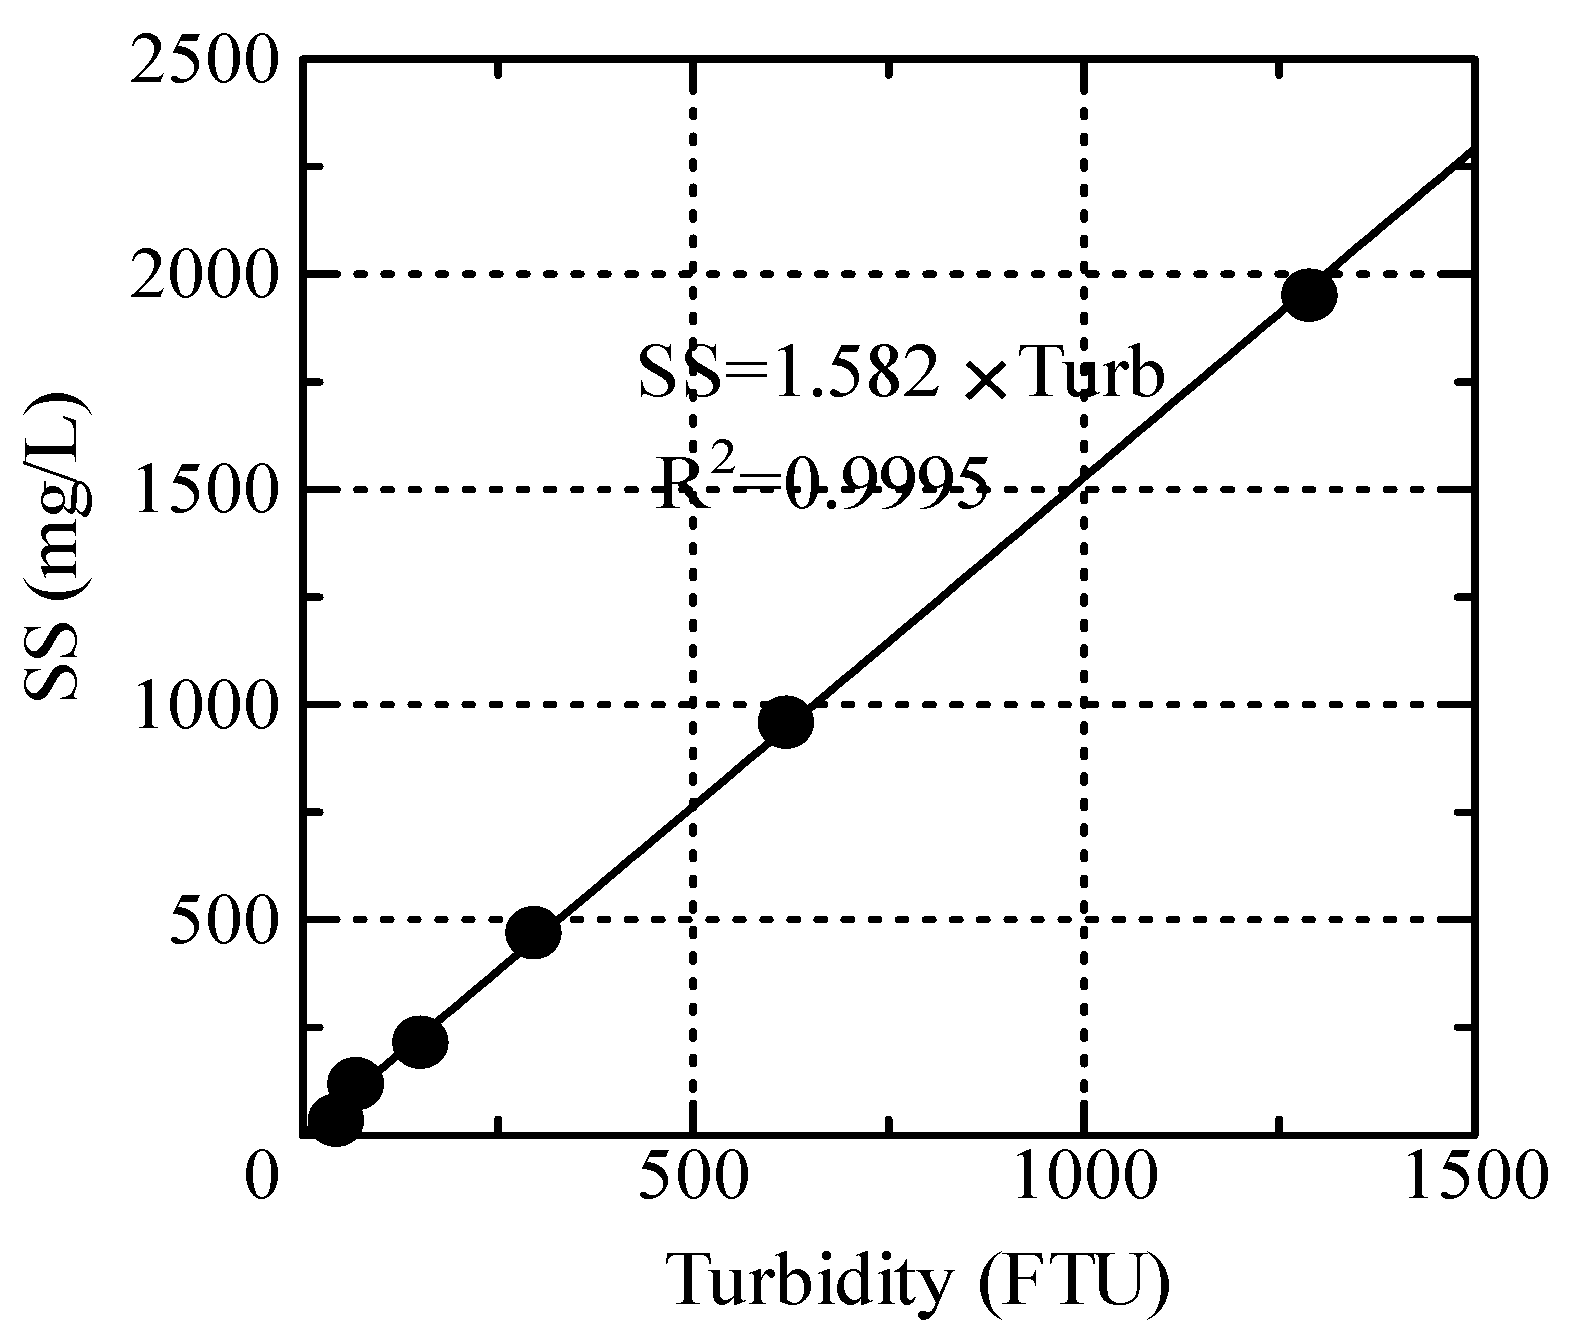
To find a conversion equation from the measured formazin-equivalent turbidity to the SSs, turbid water was sampled near the inflow of the reservoir at the time of flooding. The samples were diluted and concentrated, and then the relationship between the concentration of suspended solids (SSs: mg/L) and the formazin turbidity observed using the turbidity meter (FTU) was identified (Figure 6).
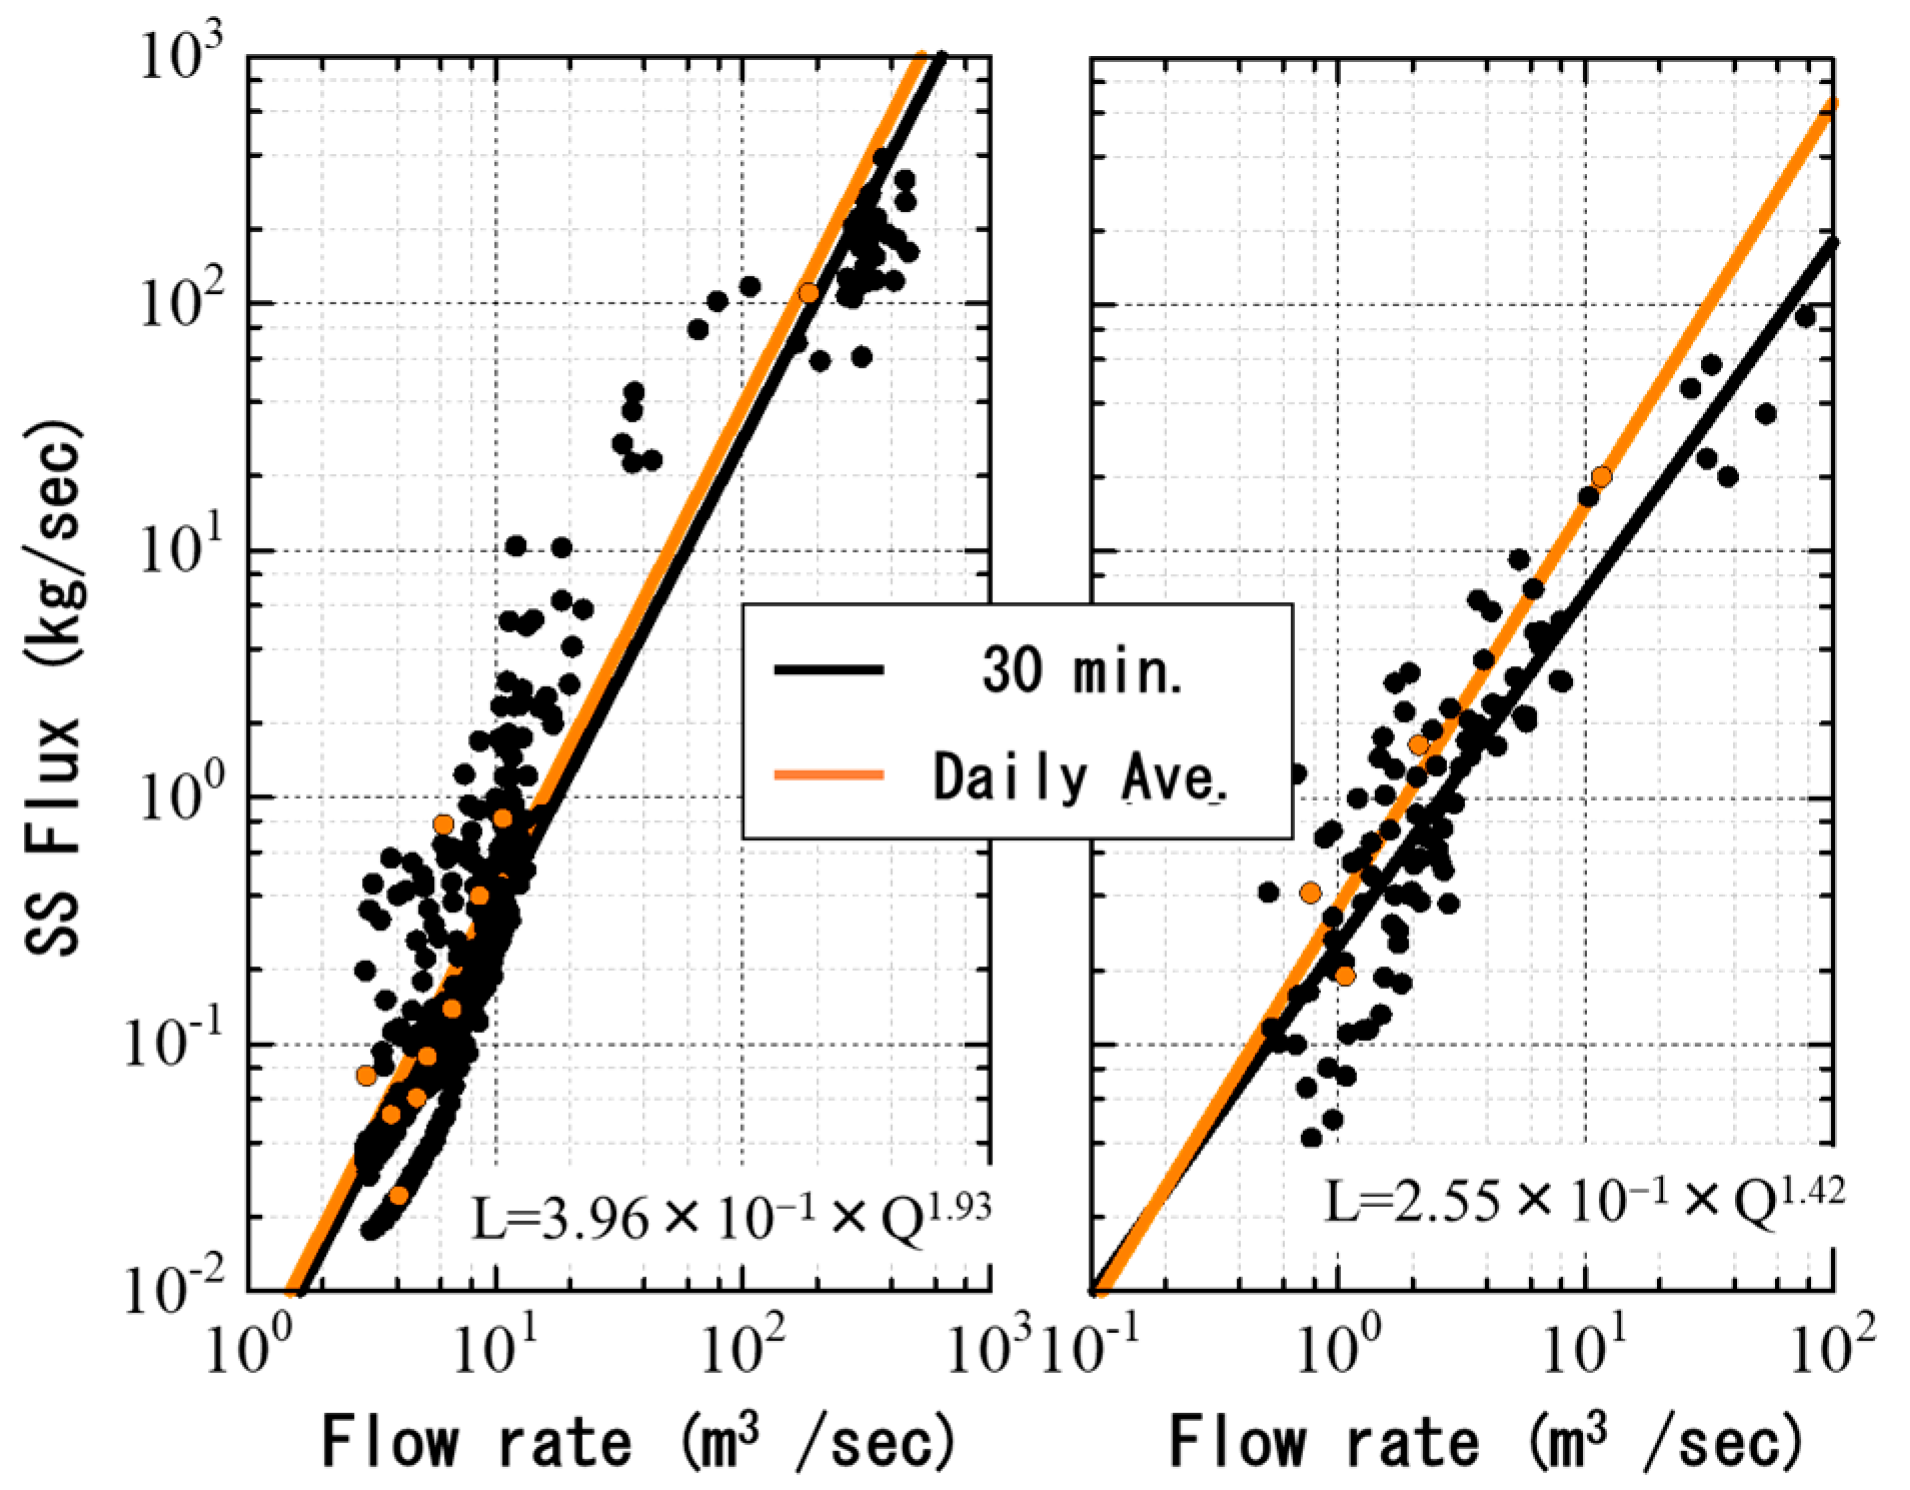
The water level data were converted to the flow rate, using the above-mentioned water-level–flow-rate relationship. Through multiplying it by the concentration of SSs, the loading amount was obtained, and the relationship between the SS flux (L) and the flow rate (Q) was identified. Although it has been reported that a hysteresis loop appears in the L–Q relationship at the time of the first flash, this was not confirmed for our study site. In the following research, The Soil & Water Assessment Tool (SWAT) was used to calculate the runoff from rainfall data with long-term records, and to obtain the discharge time series. Furthermore, based on this L–Q relationship, the time series of the SS load was obtained, and then the annual average soil yield was evaluated.
As the SWAT model is calculated daily, the relationship between the daily data of L and Q must be the same as that in the observed results. Figure 7 shows the relationship between L and Q, which are converted to the daily mean values for L and Q obtained from the observations at 30 min intervals, which are shown in orange in Figure 7. There is also a high correlation between L and Q daily, and the same relationship can be used to evaluate the daily SS load from the daily discharge obtained via SWAT, below.

3.2. Discharge Simulation with SWAT over Long-Term

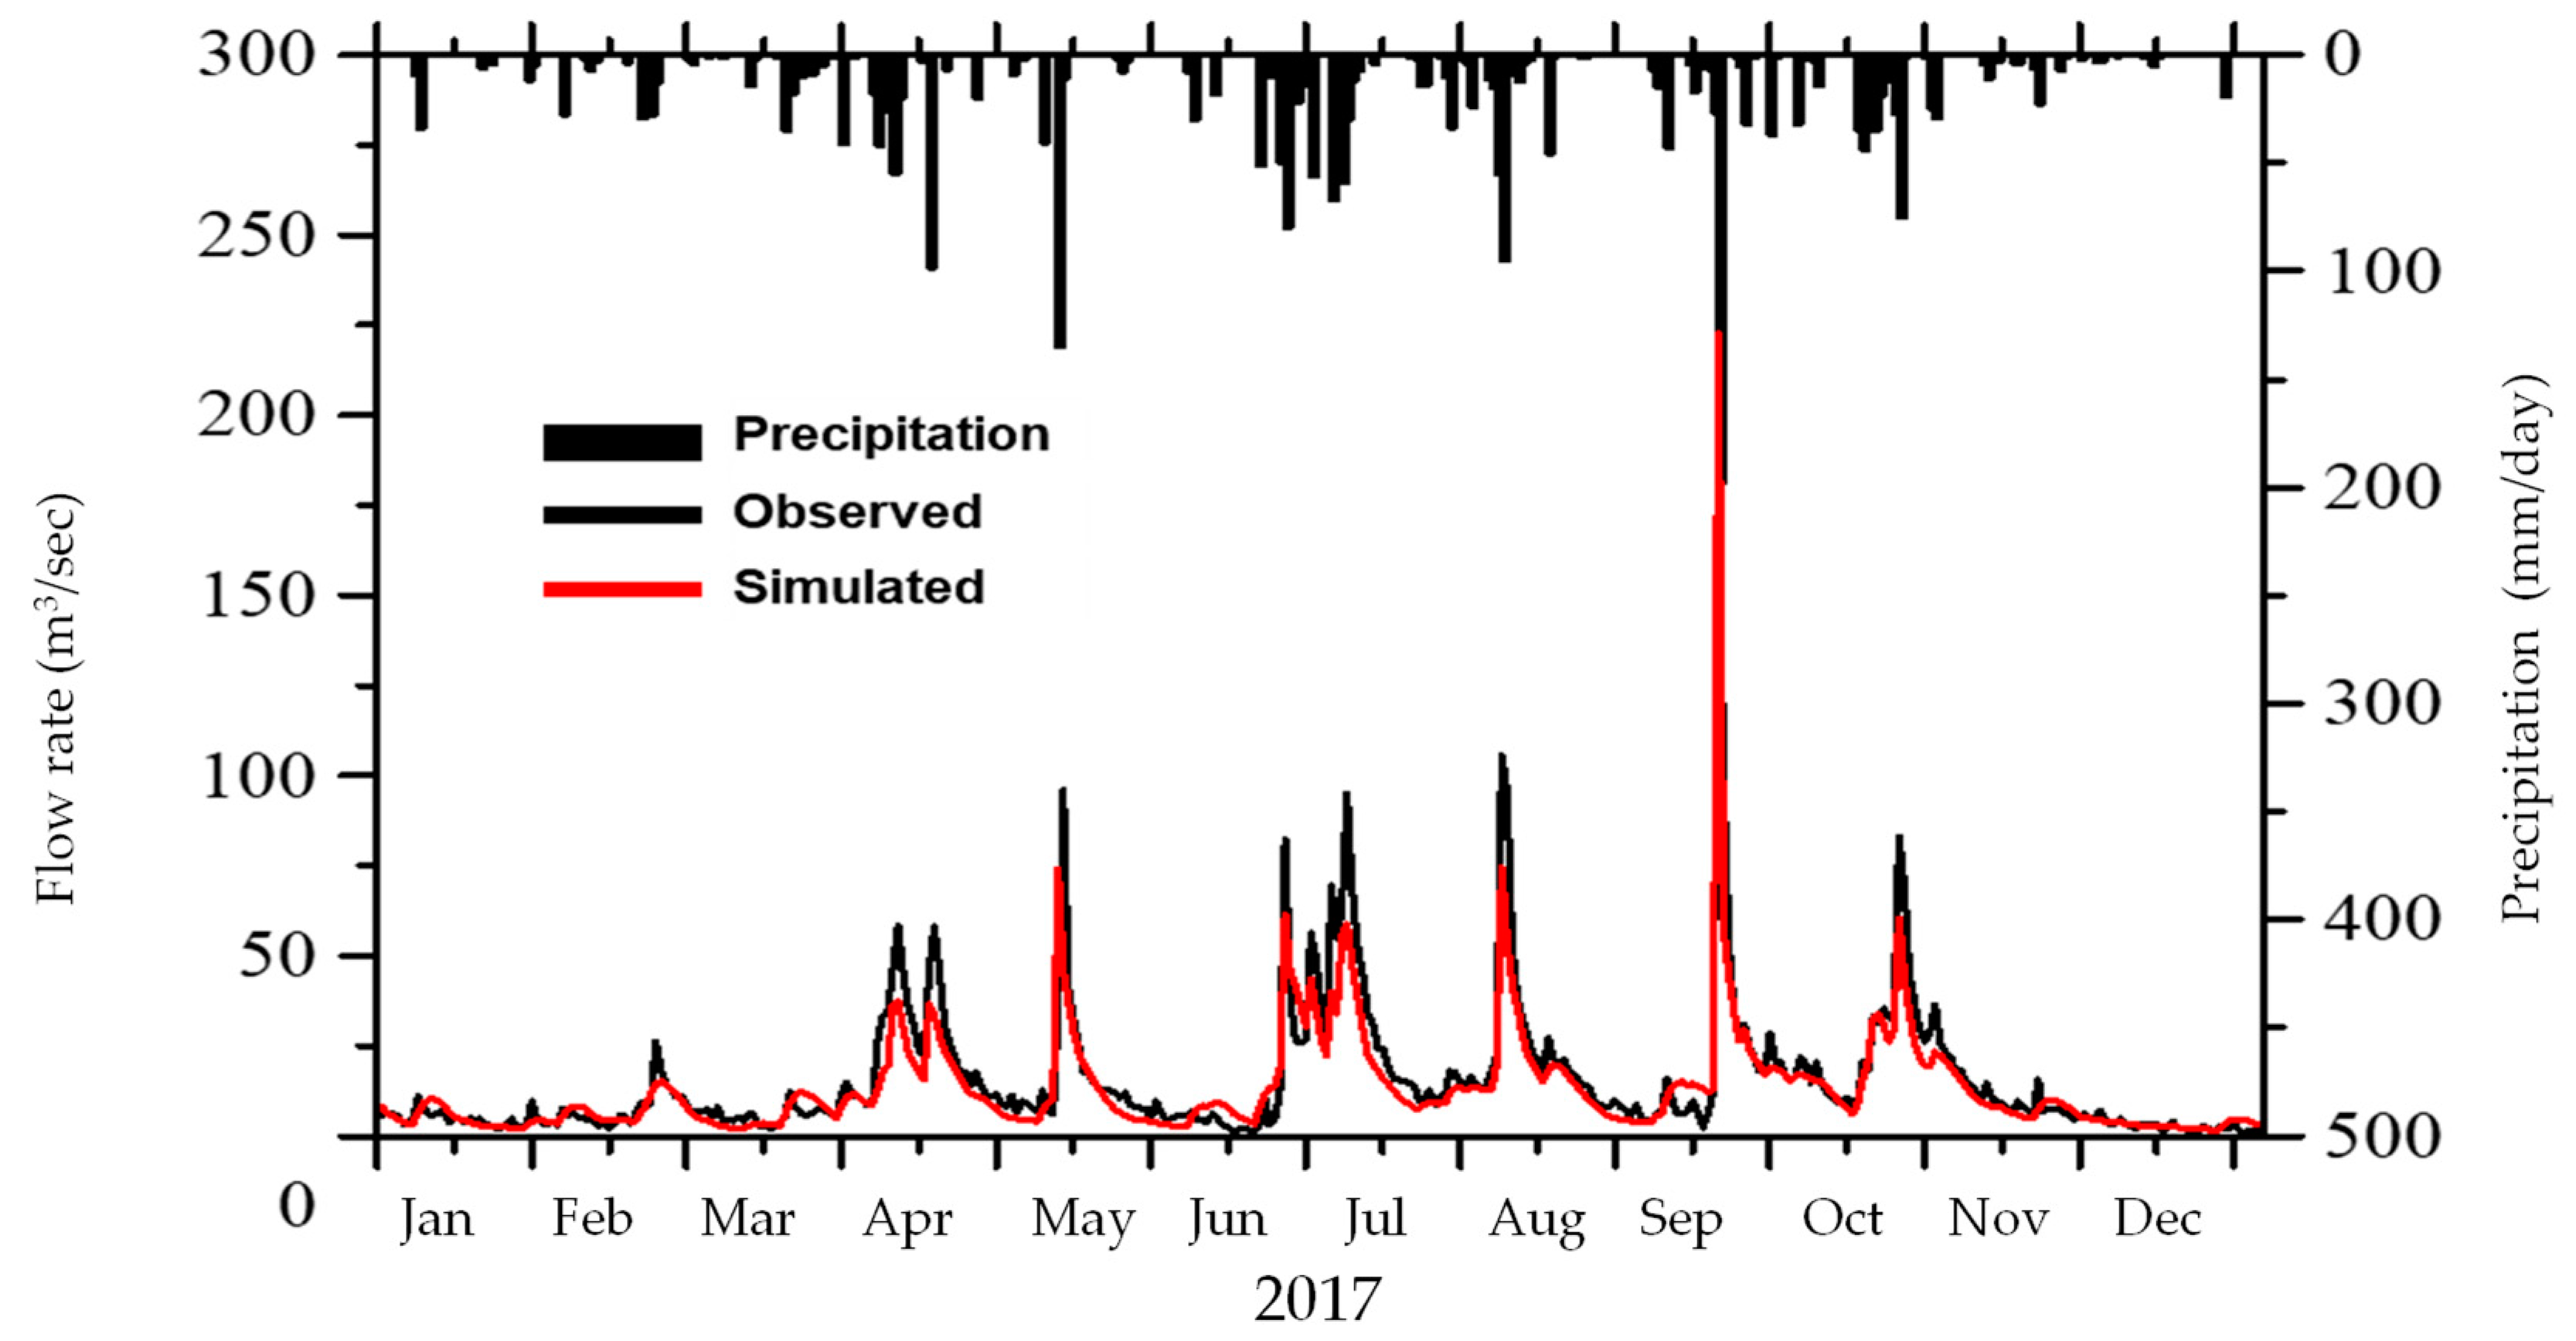
The SWAT (ArcSWAT 2012.10_2.18) was applied to the study site. The parameters of the model were adjusted via SWAT–CUP [25], based on the inflow of the dam management daily report for the entire Kamishiiba Dam catchment area (Table 1). The basic distributed parameters are given in Figure 8. Points A and B were added as outflow points for comparison with the observation data. In the model evaluation, generally, a good accuracy was observed, with NSE = 0.83, PBIAS = 14.6%, and R² = 0.85 during the calibration period (2017). The meteorological data [26,27,28] were collected as input data to the model. In this study, the simulation period was set from 1 January 2010 to 31 December 2022, and the warm-up period was set from 1 January 2010 to 31 December 2012.
Figure 9 shows the comparison of the run-off simulated via the SWAT model, and the observed values for the whole catchment area in 2017, and Figure 10 depicts points A and B in 2022. The rainfall shown in the figure is the daily rainfall at the Shiiba Observatory of the Japan Meteorological Agency. While the SWAT outputs the daily discharge, the observed value is converted to the daily average. At point A, although the data were underestimated as a whole, small flood events could be reproduced. In addition, even large-scale flooding during a typhoon could be evaluated with high accuracy. Point B is slightly overestimated throughout the whole period. It was supposed that the rainfall distribution in the mountainous study site was the reason. The reason why small rainfall events were not reproduced, while certain scale flooding was reproduced, is that the rainfall changes from valley to valley. Such a small catchment as Catchment B reflects that effect. Seeing the certain scale rainfall event, it is considered that the SWAT model applied this time can generally reproduce the discharge, even in a small catchment area, within the dam catchment area.
The SWAT is also capable of modeling sediment runoff with information on geological types, soil yield from a unit area of each land cover, etc. It is possible to obtain a time series of the SS run-off by assuming predetermined parameters. However, as the purpose of this study is to estimate the annual average soil yield from a unit area of a bare surface of a specific soil based on field observation, the model for sediment transport is not applied.
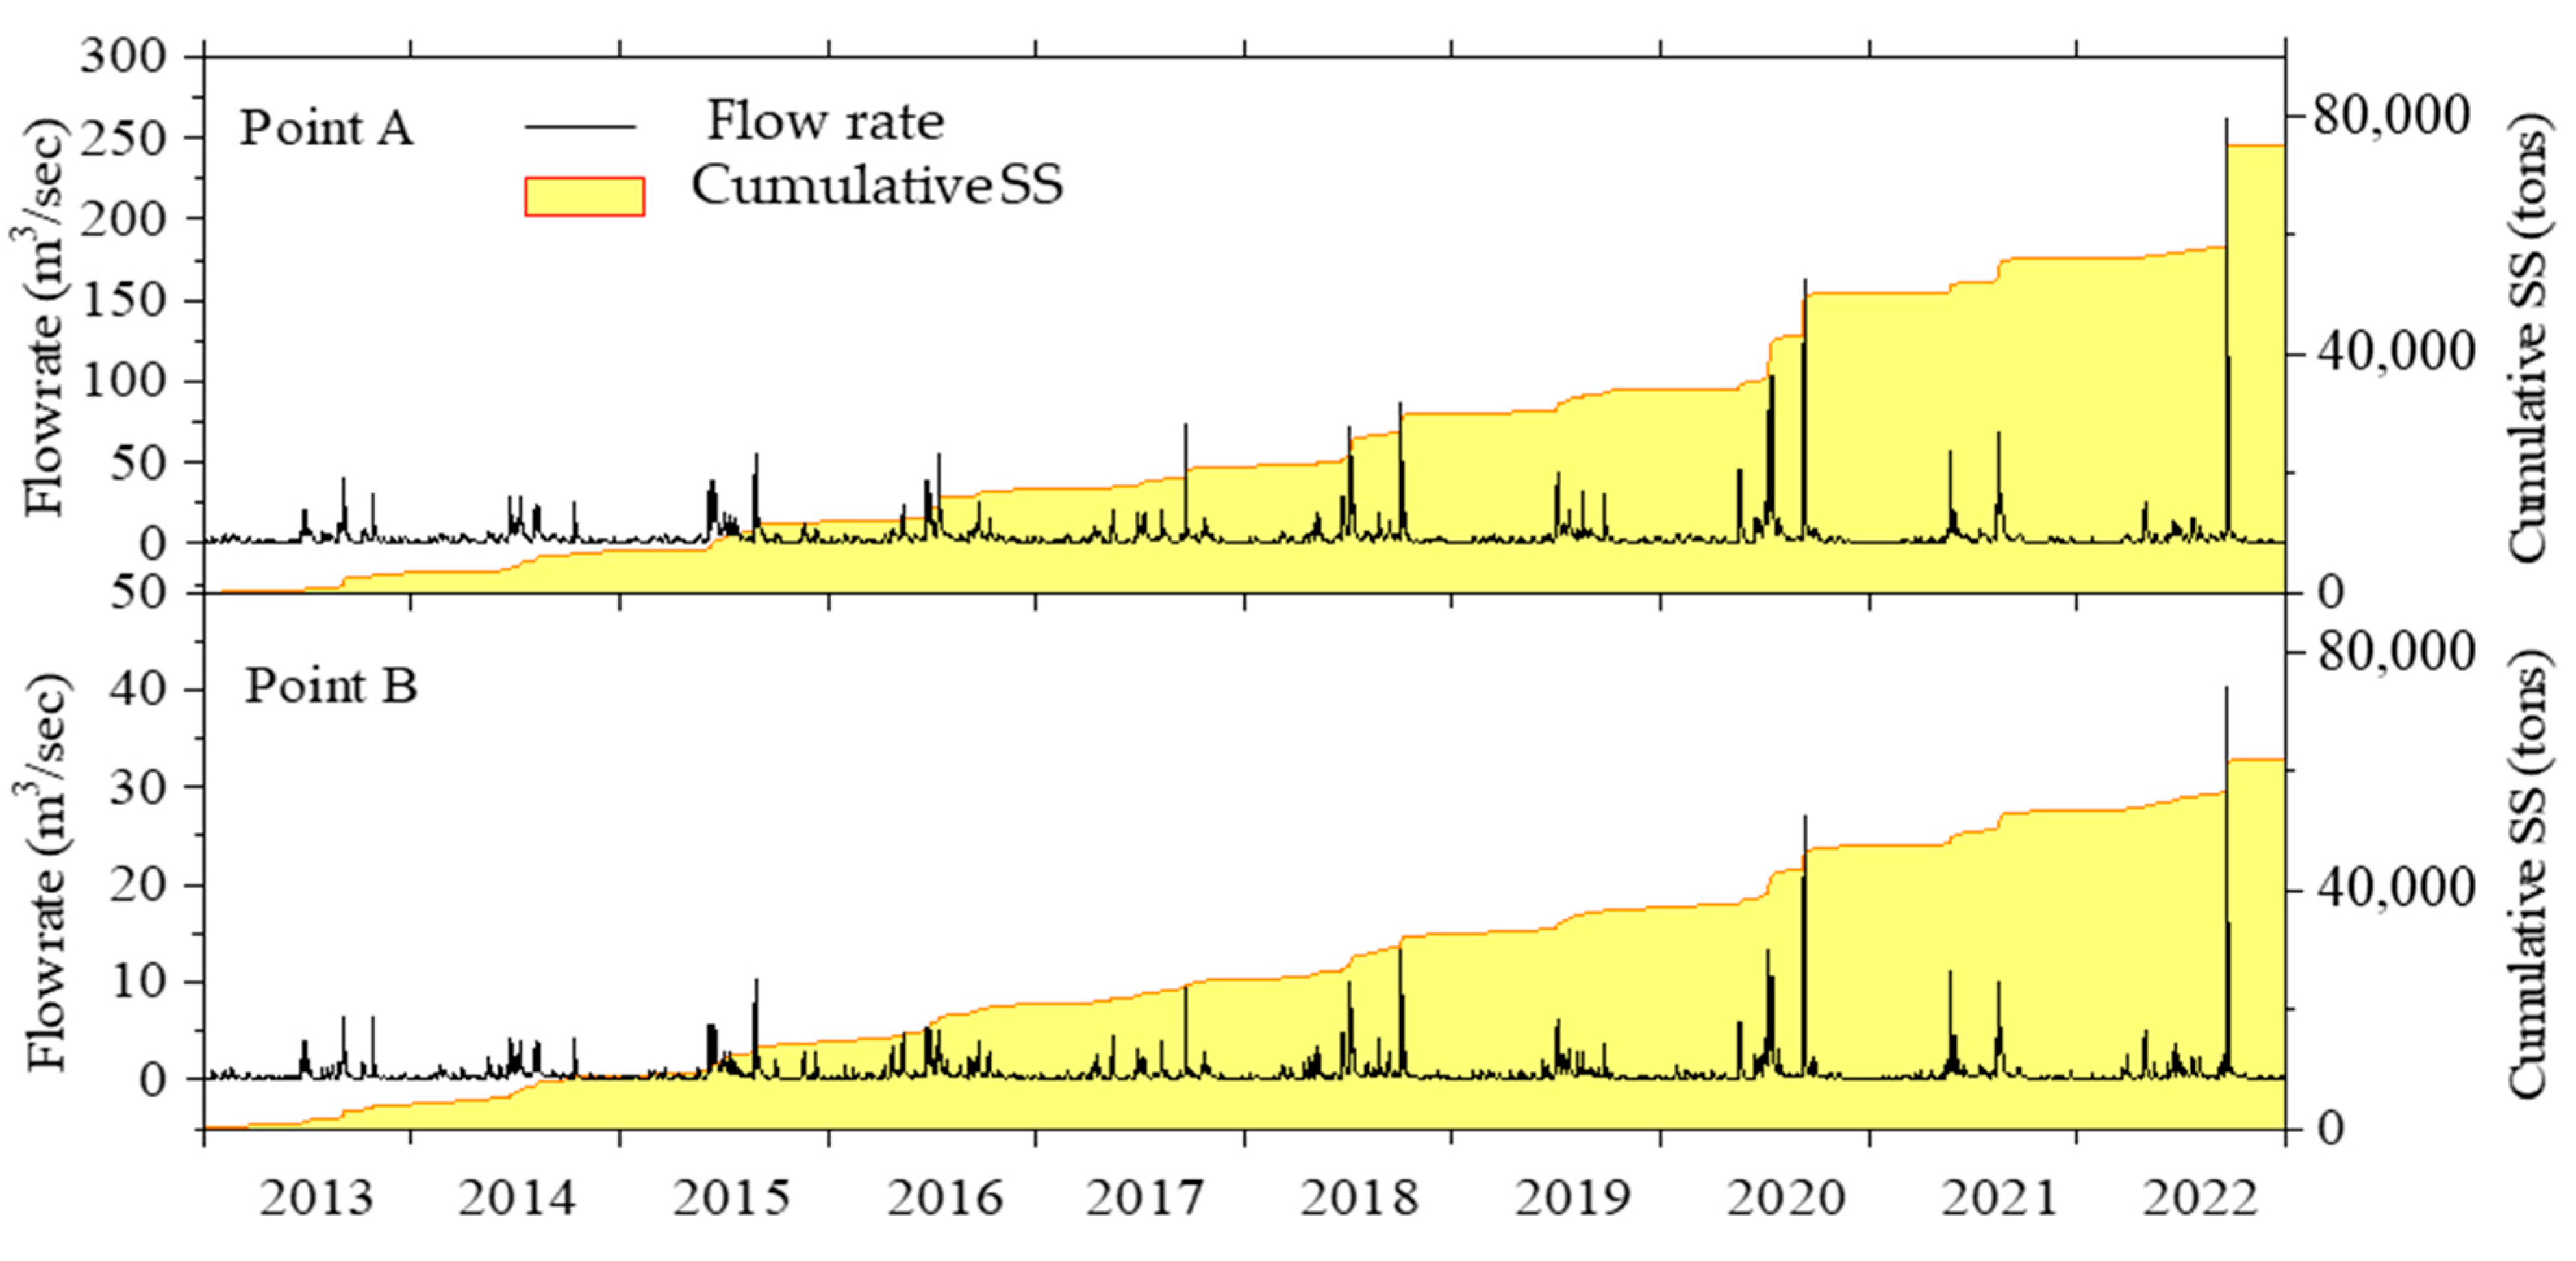
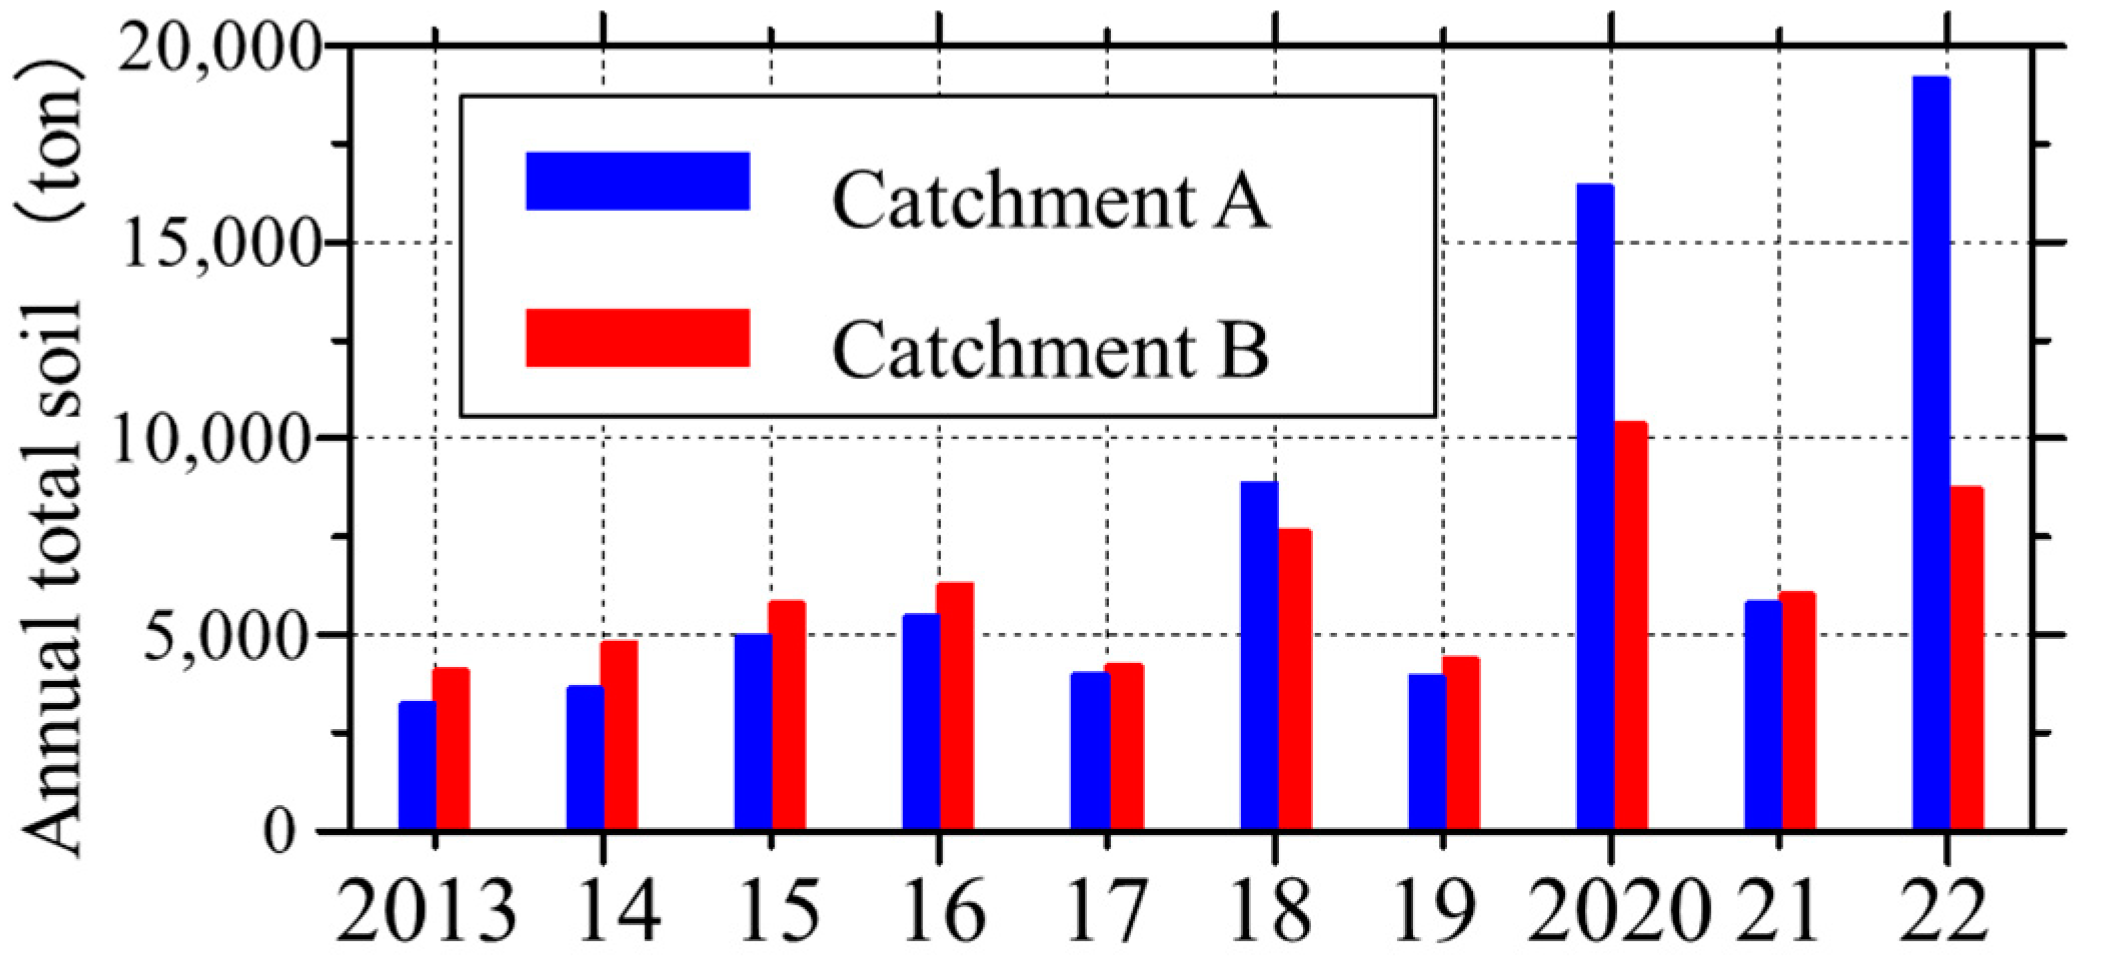
The long-term simulated results of the flow rate time series, and the cumulative SSs for 10 years from 2013 to 2022 for catchment areas A and B, are shown in Figure 11. The rainfall is the daily rainfall at the Shiiba Observatory of the Japan Meteorological Agency. Figure 12 shows the annual total soil yield in each catchment area. The mean soil yield was 6.2 × 10³ tons in catchment area A, and 7.5 × 10³ tons in catchment area B. Although the total catchment area of A is much larger than that of B, the production amounts were estimated to be almost the same. In 2020 and 2022, there were large rainfall events exceeding 300 mm/day caused by the large typhoons and, on that occasion, both catchment areas had a huge amount of soil yield. In these years, the annual production of SSs in catchment A, which has a large flow, was larger than that in catchment B, which has a much smaller catchment area. Due to the characteristics of the L–Q relationship, the SS flux from catchment A is low during the days of ordinary water discharge, while the SS flux from catchment B is high even during the days of ordinary water discharge. Therefore, catchment area B is considered to have a high contribution rate of turbidity production that flows into the dam.

3.3. Unit SS Yield from the Bare Land Surface

To calculate the soil yield intensity of the bare soil surface, it is necessary to classify the land cover in the catchment area. As the dam catchment area is mostly occupied by planted forests, the land cover is simply divided into two types: forest and bare land. Bare land includes landslide areas and deforested land. The normalized difference soil index (NDSI) [29] was used for bare land extraction.
N D S I = S W I R N I R S W I R + N I R
where SWIR: short-wave infrared; NIR: luminance value of near-infrared. The satellite image was taken by LANDSAT-8 on 10 February 2022 [30]. In this study, pixels with positive NDSI values were classified as bare land, and negative pixels as forest (Figure 13). As a result, 0.08 km2 and 0.13 km2 of the bare land were extracted in catchments A and B, respectively.
The soil yield differs depending on the geological feature, even if the land cover is the same bare surface [31]. The Kamishiiba Dam catchment area can be divided into the Fudono River basin, which is mainly composed of sandstone and mudstone alternations, and the Mimikawa River basin of sandstone. Assuming the annual average soil yield from a unit area of the forest to 0.072 kg/m2/year [32], the average annual soil yield from a unit area of bare land in each catchment was calculated. Here, 2022 was not included, as it is a special case, because it saw the heaviest rain that had occurred in several decades.
The unit soil yields of each bare land area were 25.98 kg/m2/year and 40.65 kg/m2/year in catchment areas A and B, respectively, which were significantly higher than those of the forest. The values obtained in this study are, approximately, from 1/6 to 1/3, compared with the previous studies in the other basins [11] cited in the introduction. This is because the previous study captured the entire amount of sediment, including gravel and pebbles eroded from the surface of the landslide [11], whereas, in this study, only the fine particles that form the suspended solids in the discharge were measured. Various factors are considered to be different for each catchment area but, among them, it was shown that geological features have a great influence.
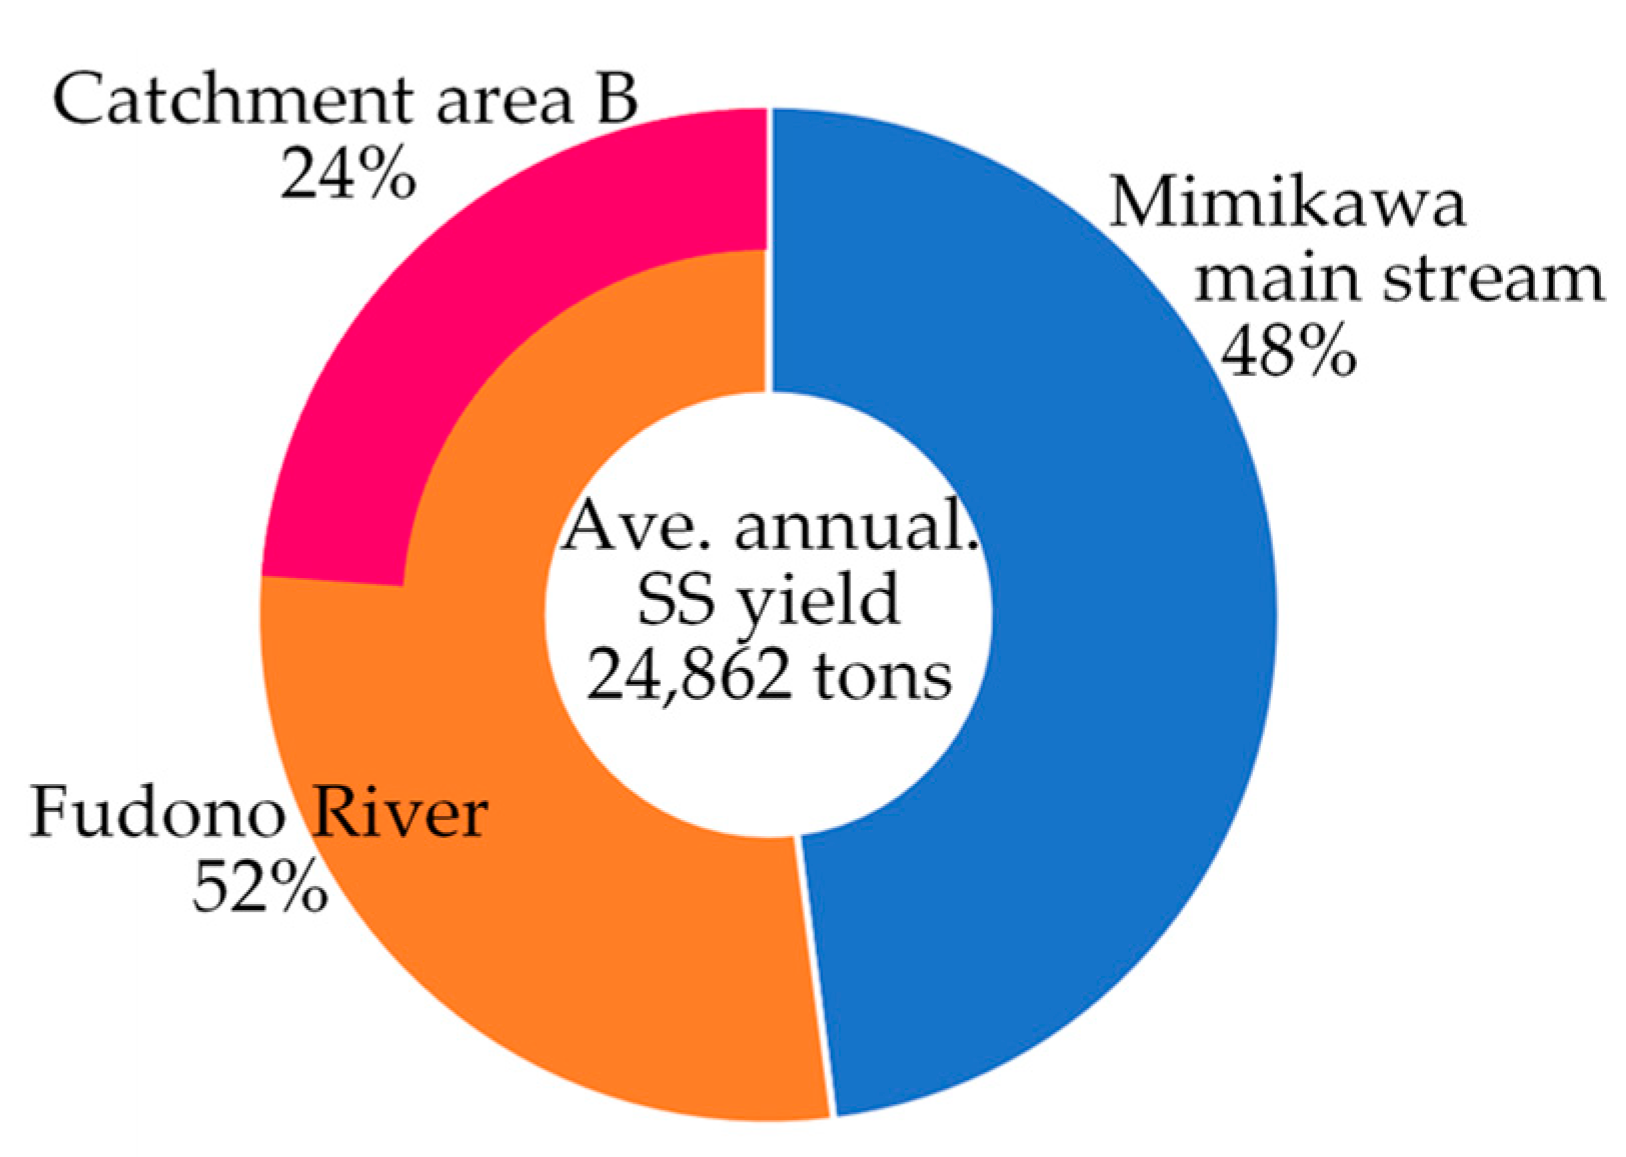
The total amount of SS flux flowing into the reservoir from the entire catchment area was calculated using the respective soil yield in the sandstone formation catchment and the alternation rocks catchment, respectively. As a result, the Mimikawa River mainstream basin and the Fudono River basin annually produced 11,925 tons and 12,937 tons, respectively (Figure 14). In the Fudono River basin, which is composed of alternate layers of sandstone and mudstone, more landslide occurs, and the unit yield of SSs from that bare surface is higher. Catchment area B, in particular, has a large bare land area, and is suspected to be a considerable source, accounting for 24% of SSs flowing into the reservoir. Therefore, it was quantitatively shown that the contribution rate of inflow SSs due to slope failure, in catchment area B, is high.

4. Conclusions

In this study, focusing on the large landslide area, which was suspected to be the source of the SSs supplying long-term turbidity to the Kamishiiba Dam in the previous study, the annual average soil yield from a unit area of the bare surface of each geological condition was evaluated. The study site is in a deeply mountainous area, so it is difficult to access the location for the measurement of the flow rate in situ, which is needed for the calibration/validation of runoff simulations, and the identification of correlations with the turbidity load. In this study, the relationship between the water levels and the discharges was identified via hydraulic experiments, using a hydraulic model reflecting the detailed topography of the observatory. The measured water level was converted to discharge via the identified relationship with the models. Based on the results of the long-term runoff simulation, verified with the flow rate time series as mentioned above, the relational expression between the discharge and SS load, the annual average SS yield from a unit area of the bare surfaces were calculated. As a result of the alternating layer of sandstone and mudstone, including the large landslide, the SS production rate is large. In addition, a high number of landslides were found intensively in that formation, so there is a possibility that the amount of SS production in the catchment can be greatly reduced via intensive measures, such as fixing the topsoil of the bare surface.
With distributed runoff models, it is possible to extract the runoff of some small basins from the analysis results, but they have been difficult to validate. This study showed that the measured water level was converted to discharge using a hydraulic model that reproduces the local topography with a high accuracy, and that it was used for the verification of the discharge data extracted from the hydrological model. At the same time, the relationship with the SS load, based on the turbidity measured, was also identified and, together with the long-term runoff analysis results, the annual average SS production intensity could be evaluated. The series of processes using the hydraulic model and hydrological model presented in this study is a new runoff evaluation method for mountainous areas, where discharge observation is not conducted, due to access reasons.

Author Contributions

Conceptualization, M.I.; methodology, M.I.; validation, A.N. and T.H.; formal analysis, M.I. and A.N.; investigation, M.I., A.N. and T.H.; resources, M.I.; data curation, M.I., A.N. and T.H.; writing—original draft preparation, M.I., A.N. and T.H.; writing—review and editing, M.I.; visualization, M.I., A.N. and T.H.; supervision, M.I.; project administration, M.I.; funding acquisition, M.I. All authors have read and agreed to the published version of the manuscript.

Funding

This research was partially supported by the Ministry of Land, Infrastructure, Transportation and Tourism, KASENSABO GIJUTSUKAIHATSU R3-R4.

Data Availability Statement

Not applicable.

Conflicts of Interest

The authors declare no conflict of interest.

References

  1. Miyazaki Prefecture, Mimikawa River Improvement Master Plan. Available online: https://www.pref.miyazaki.lg.jp/documents/4313/000053077.pdf (accessed on 12 January 2023). (In Japanese).
  2. Hayashi, N.; Tanaka, K.; Yoshitake, H. Geological Study of Underground Geological Structure of Deep-Seated Landslides Occurred in 2005 at Tsukabaru Site in Mimikawa Basin, Miyazaki Prefecture. J. Jpn. Soc. Eng. Geol. 2015, 55, 290–306. (In Japanese) [Google Scholar] [CrossRef]
  3. Takaya, S.; Suzuki, K. Huge mountain failure caused by Typhoon No.14 In Miyazaki Prefecture in 2005. J. Jpn. Landslide Soc. 2007, 44, 90–96. (In Japanese) [Google Scholar]
  4. Chiba, M.; Mori, T.; Uchikawa, T.; Mizuyama, T.; Satofuka, Y. Bursting process of landslide dam caused by Typhoon 0514 (Nabi) in the Mimi River, Miyazaki prefecture, Japan and suggestions regarding evacuation procedures when a landslide dam bursts. J. Jpn. Soc. Eros. Control. Eng. 2007, 60, 43–47. (In Japanese) [Google Scholar]
  5. Murakami, T.; Suzuki, Y.; Oishi, H.; Ito, K.; Nakao, T. Tracing the source of difficult to settle fine particles which cause turbidity in the Hitotsuse reservoir. Jpn. J. Environ. Manag. 2013, 120, 37–47. (In Japanese) [Google Scholar] [CrossRef]
  6. Nukazawa, K.; Itakiyo, T.; Ito, K.; Sato, S.; Oishi, H.; Suzuki, Y. Mineralogical fingerprinting to characterize spatial distribution of coastal and riverine sediments in southern Japan. Catena 2021, 203, 105323. [Google Scholar] [CrossRef]
  7. Suzuki, Y.; Arao, Y.; Ito, K.; Yoshitake, H.; Hamaguchi, K. Using mineral compositions to indicate the origin of sediments in a tidal flat of an estuarine marsh. Coast. Eng. J. 2019, 61, 354–362. [Google Scholar] [CrossRef]
  8. Ito, K.; Matsunaga, M.; Itakiyo, T.; Oishi, H.; Nukazawa, K.; Irie, M.; Suzuki, Y. Tracing sediment transport history using mineralogical fingerprinting in a river basin with dams utilizing sediment sluicing. Int. J. Sediment Res. 2022, 38, 469–480. [Google Scholar] [CrossRef]
  9. Higashi, T.; Irie, M. Identification of the origin of turbid water flowing into Kamishiiba dam and soil erosion control with flocculants. J. Jpn. Soc. Civ. Eng. Ser. B1 2021, 77, I_583–I_588. (In Japanese) [Google Scholar] [CrossRef]
  10. Kawaguchi, T. Study on the Forest and Forestry Conservancy as a Measure against Sediment Runoff from Mountainous Area. Water Sci. 2002, 45, 52–68. (In Japanese) [Google Scholar] [CrossRef]
  11. Kobayashi, Y.; Kitahara, H.; Ono, H. Surface Erosion from Landslide Site in Weathered Granite Area and the Analysis by Using USLE. J. Jpn. For. Soc. 2004, 86, 365–371. (In Japanese) [Google Scholar] [CrossRef]
  12. Mizugaki, S. Observation of water and sediment runoff in the Soshubetsu Creek catchment, northern Japan. J. Jpn. Soc. Eros. Control Eng. 2018, 71, 53–57. (In Japanese) [Google Scholar]
  13. Yokoyama, K.; Fujizuka, S.; Nakazawa, T.; Takashima, S. Sediment yield and suspended sediment transport in the Chikugogawa River basin. Proc. Jpn. Conf. Hydraul. 2008, 67, 553–558. (In Japanese) [Google Scholar] [CrossRef]
  14. Ishida, T.; Nakayama, K.; Maruya, Y.; Omori, M.; Sugawara, Y.; Abulizi, A.; Ueno, Y. Field experiment and modeling of production of suspended sediment due to impact of rainfall and its transport. J. Jpn. Soc. Civ. Eng. Ser. B1 2011, 67, I_1315–I_1320. (In Japanese) [Google Scholar] [CrossRef] [PubMed]
  15. Abbaspour, K.C.; Yang, J.; Maximov, I.; Siber, R.; Bogner, K.; Mieleitner, J.; Zobrist, J.; Srinivasan, R. Modelling hydrology and water quality in the pre-alpine/alpine Thur watershed using SWAT. J. Hydrol. 2007, 333, 413–430. [Google Scholar] [CrossRef]
  16. Herman, M.R.; Hernandez-Suarez, J.S.; Nejadhashemi, A.P.; Kropp, I.; Sadeghi, A.M. Evaluation of multi- and many-objective optimization techniques to improve the performance of a hydrologic model using evapotranspiration remote-sensing data. J. Hydrol. Eng. 2020, 25, 04020006. [Google Scholar] [CrossRef]
  17. Tobin, K.; Marvin, E.B. Constraining SWAT calibration with remotely sensed evapotranspiration data. J. Am. Water Resour. Assoc. 2017, 53, 593–604. [Google Scholar] [CrossRef]
  18. Ha, L.; Bastiaanssen, W.G.M.; van Griensven, A.; van Dijk, A.I.J.M.; Senay, G.B. Calibration of spatially distributed hydrological processes and model parameters in SWAT using remote sensing data and an auto-calibration procedure: A case study in a Vietnamese River Basin. Water 2018, 10, 212. [Google Scholar] [CrossRef]
  19. Odusanya, A.; Mehdi, B.; Schürz, C.; Oke, A.O.; Awokola, O.S.; Awomeso, J.A.; Adejuwon, J.O.; Schulz, K. Multi-site calibration and validation of SWAT with satellite-based evapotranspiration in a data-sparse catchment in southwestern Nigeria. Hydrol. Earth Syst. Sci. 2018, 23, 1113–1144. [Google Scholar] [CrossRef]
  20. Lopez-Ballesteros, A.; Senent-Aparicio, J.; Srinivasan, R.; Perez-Sanchez, J. Assessing the impact of best management practices in a highly anthropogenic and ungauged watershed using the SWAT model: A case study in the El Beal watershed (Southeast Spain). Agronomy 2019, 9, 576. [Google Scholar] [CrossRef]
  21. Senent-Aparicio, J.; López-Ballesteros, A.; Nielsen, A.; Trolle, D. A holistic approach for determining the hydrology of the mar menor coastal lagoon by combining hydrological & hydrodynamic models. J. Hydrol. 2021, 603, 127150. [Google Scholar] [CrossRef]
  22. Kobatake, S.; Shimizu, Y.; Obokata, K.; Arai, R.; Okamoto, Y. Study on the relation between water stage and discharge of sabo dam. Proc. Jpn. Conf. Hydraul. 1999, 43, 55–60. (In Japanese) [Google Scholar] [CrossRef]
  23. Van Liew, M.W.; Garbrecht, J. Hydrologic Simulation of the Little Washita River Experimental Watershed Using SWAT. J. Am. Water Resour. Assoc. 2003, 39, 413–426. [Google Scholar] [CrossRef]
  24. Nash, J.E.; Sutcliffe, J.V. River flow forecasting through conceptual models part I—A discussion of principles. J. Hydrol. 1970, 10, 282–290. [Google Scholar] [CrossRef]
  25. SWAT-CUP. Available online: https://www.2w2e.com/home/SwatCup (accessed on 31 March 2023).
  26. Japan Meteorological Agency. Available online: https://www.data.jma.go.jp/obd/stats/etrn/index.php (accessed on 12 January 2023).
  27. Ministry of Land, Infrastructure, Transportation and Tourism, Water Information System. Available online: http://www1.river.go.jp/ (accessed on 12 January 2023).
  28. National Agriculture and Food Research Organization, Meteocrop DB. Available online: https://meteocrop.dc.affrc.go.jp/real/top.php (accessed on 12 January 2023).
  29. Chen, F.; Van de Voorde, T.; Roberts, D.; Zhao, H.; Chen, J. Detection of ground materials using normalized difference indices with a threshold: Risk and ways to improve. Remote Sens. 2021, 13, 450. [Google Scholar] [CrossRef]
  30. USGS Landsat Look. Available online: https://landsatlook.usgs.gov/explore (accessed on 12 January 2023).
  31. Mizugaki, S.; Abe, T.; Murakami, Y.; Maruyama, M.; Kubo, M. Fingerprinting suspended sediment sources in the Nukabira River, northern Japan. Int. J. Jpn. Eros. Control Eng. 2012, 5, 60–69. [Google Scholar] [CrossRef]
  32. Kuroda, H.; Tabuchi, T.; Kikuchi, H.; Suzuki, M. Nutrient outflow from a forest area. Trans. Jpn. Soc. Irr. Drain. Reclam. Eng. 1991, 154, 25–35. [Google Scholar] [CrossRef]
Figure 1. The catchment area of the Kamishiiba reservoir, and a geological map of the study sites.
Water 15 03186 g001
Figure 2. Point clouds images and terranean models of the observatories.
Water 15 03186 g002
Figure 3. The experimental channel set-up.
Water 15 03186 g003
Figure 4. The relationships between the water level (H) and the discharge (Q).
Water 15 03186 g004
Figure 5. The Reynolds number and Froude number for each water level.
Water 15 03186 g005
Figure 6. The correlation between the formazin-equivalent Turbidity and the SSs of the catchment.
Water 15 03186 g006
Figure 7. The correlation between the SS flux (L) and the flow rate (Q).
Water 15 03186 g007
Figure 8. The distributed parameters for the SWAT.
Water 15 03186 g008
Figure 9. Run-off simulation of the whole catchment of Kamishiiba reservoir, via the SWAT.
Water 15 03186 g009
Figure 10. The discharges extracted from the simulation results for Point A and B, verified using the observed data.
Water 15 03186 g010
Figure 11. The simulated flow rate and cumulative SS flux at point A and B.
Water 15 03186 g011
Figure 12. The annual total soil yield in each catchment area.
Water 15 03186 g012
Figure 13. The distribution of bare surface area, distinguished via NDSI.
Water 15 03186 g013
Figure 14. The SS yield from each catchment.
Water 15 03186 g014
Table 1. The calibrated parameters for the SWAT.
ParameterCalibrated Value
Saturated hydraulic conductivity0.604
Available water capacity of soil layer0.076
Average slope length46.46
Depth from soil surface to bottom layer0.897
Baseflow alpha factor0.791
Effective hydraulic conductivity in main channel allv.136.2
Max. Canopy storage1.605
Manning’s coef. for main channel0.232
Soil evapo. compensation factor0.965
Surface runoff lag time2.625
SCS runoff curve number f0.877
Threshold depth of water in the shallow aquifer619.2
Plant uptake compensation factor0.334
Groundwater revap coeff.0.789
Groundwater delay31.42
Disclaimer/Publisher’s Note: The statements, opinions and data contained in all publications are solely those of the individual author(s) and contributor(s) and not of MDPI and/or the editor(s). MDPI and/or the editor(s) disclaim responsibility for any injury to people or property resulting from any ideas, methods, instructions or products referred to in the content.