Cross-Comparison of the “BathySent” Coastal Bathymetry to Sonar Measurements and Ratio Model Technique: Pilot Sites in the Aegean Sea (Greece)
Abstract
:1. Introduction
- (i)
- Optimization of dredging operations (e.g., identification of the migration of sandbanks hindering navigation). The coastal zone is a dynamic environment and modern echosounders have not yet been designed to perform routine monitoring of shallow bathymetry, while the survey vessels equipped with bathymetric sonar systems very often cannot approach shallow-water areas (even up to 30 m) due to reef occurrence or hummocky seafloor.
- (ii)
- Natural hazard assessment. Naturally occurring physical phenomena, e.g., storm waves, tsunamis, and mass wasting events, are a great threat to several very shallow, densely populated coastal areas whose monitoring is of key importance for the understanding of the hazards and their principal causal agents (i.e., climatic, meteorological, and geophysical). This can be only accomplished by remote sensing techniques.
- (iii)
- Surveillance of aquaculture, fisheries, and benthic habitats. Shallow bathymetry maps produced by the repeated satellite passes over areas not accessible to humans may reveal evolving ecosystems.
- (iv)
- Assessment of the condition of accessibility/disembarkation in remote coastal zones for military/humanitarian operations.
- (v)
- Major contribution to the planning of a successful archaeological survey in very shallow submerged prehistoric landscapes.
2. Review of Imagery Analysis Techniques for Coastal Bathymetry Estimation
2.1. The Multispectral Approach (Direct Method)
2.2. Depth Inversion Approach: The Wave Dispersion Relationship (Indirect Method)
- Frequency domain inversions or time domain inversions;
- Theoretical or full approaches;
- Inversions based on depth-induced spatial water surface variation;
- Inversions based on depth-induced wave property or based on wave-breaking generated dissipation patterns;
- Inversions based on field or synthetic data.
2.3. Satellite Methodology Based on the Wavelength and Surface Wave Parameters
3. The BathySent Algorithm
3.1. Innovative Aspects
- Adaptation of the produced algorithm as a Python code for its convenient implementation;
- Identification of additional functionalities required for easy use; i.e., the capability of selecting co-registered images featured by decreased cloud cover and clearly visible wave fields with diverse wavelengths and directions.
- The resolution of Sentinel-2 imagery is 10 m, while that of SPOT-5 is 2.5 and 10 m for panchromatic and multispectral images, respectively. Hence, the Sentinel-2 data resolution is a limitation for the precision of image correlation, which is expected to be between 1/2 and 1/10 pixels. In addition, the theoretically detected wavelength is restricted by Shannon’s threshold to twice the pixel size;
- The longer (5-day) repeat cycle of Sentinel-2 is of major interest because it enhances image precision by cumulating wave states of different dates (i.e., using waves with different directions and wavelengths) and allows the acquisition of a larger archive that can provide images with reduced cloud cover and good visibility of significant waves;
- The time span between the sensors’ bands is 0.6 s for Sentinel-2 (between B2 and B4) and 2 s for SPOT-5 (between the panchromatic and multispectral images).
3.2. The Joint Use of Wave Celerity and Wavelength
3.3. Prerequisites for the Combined Application of Wave Celerity and Wavelength
- Absence of clouds.
- Occurrence of turbid water. If the seawater is transparent the swell might not be clearly visible in the satellite dataset.
- Favourable geometry between the sun, sensor, and wave fronts (see [23]) as well as imagery of swells with diverse periods or wavelengths.
- Optimum image resolution as well as the existence of two pixels at least for the measurement of the smallest wavelengths.
- Satellite dataset including more than 20 acquisitions.
3.4. Sentinel-2 Data Suitability for the BathySent Algorithm
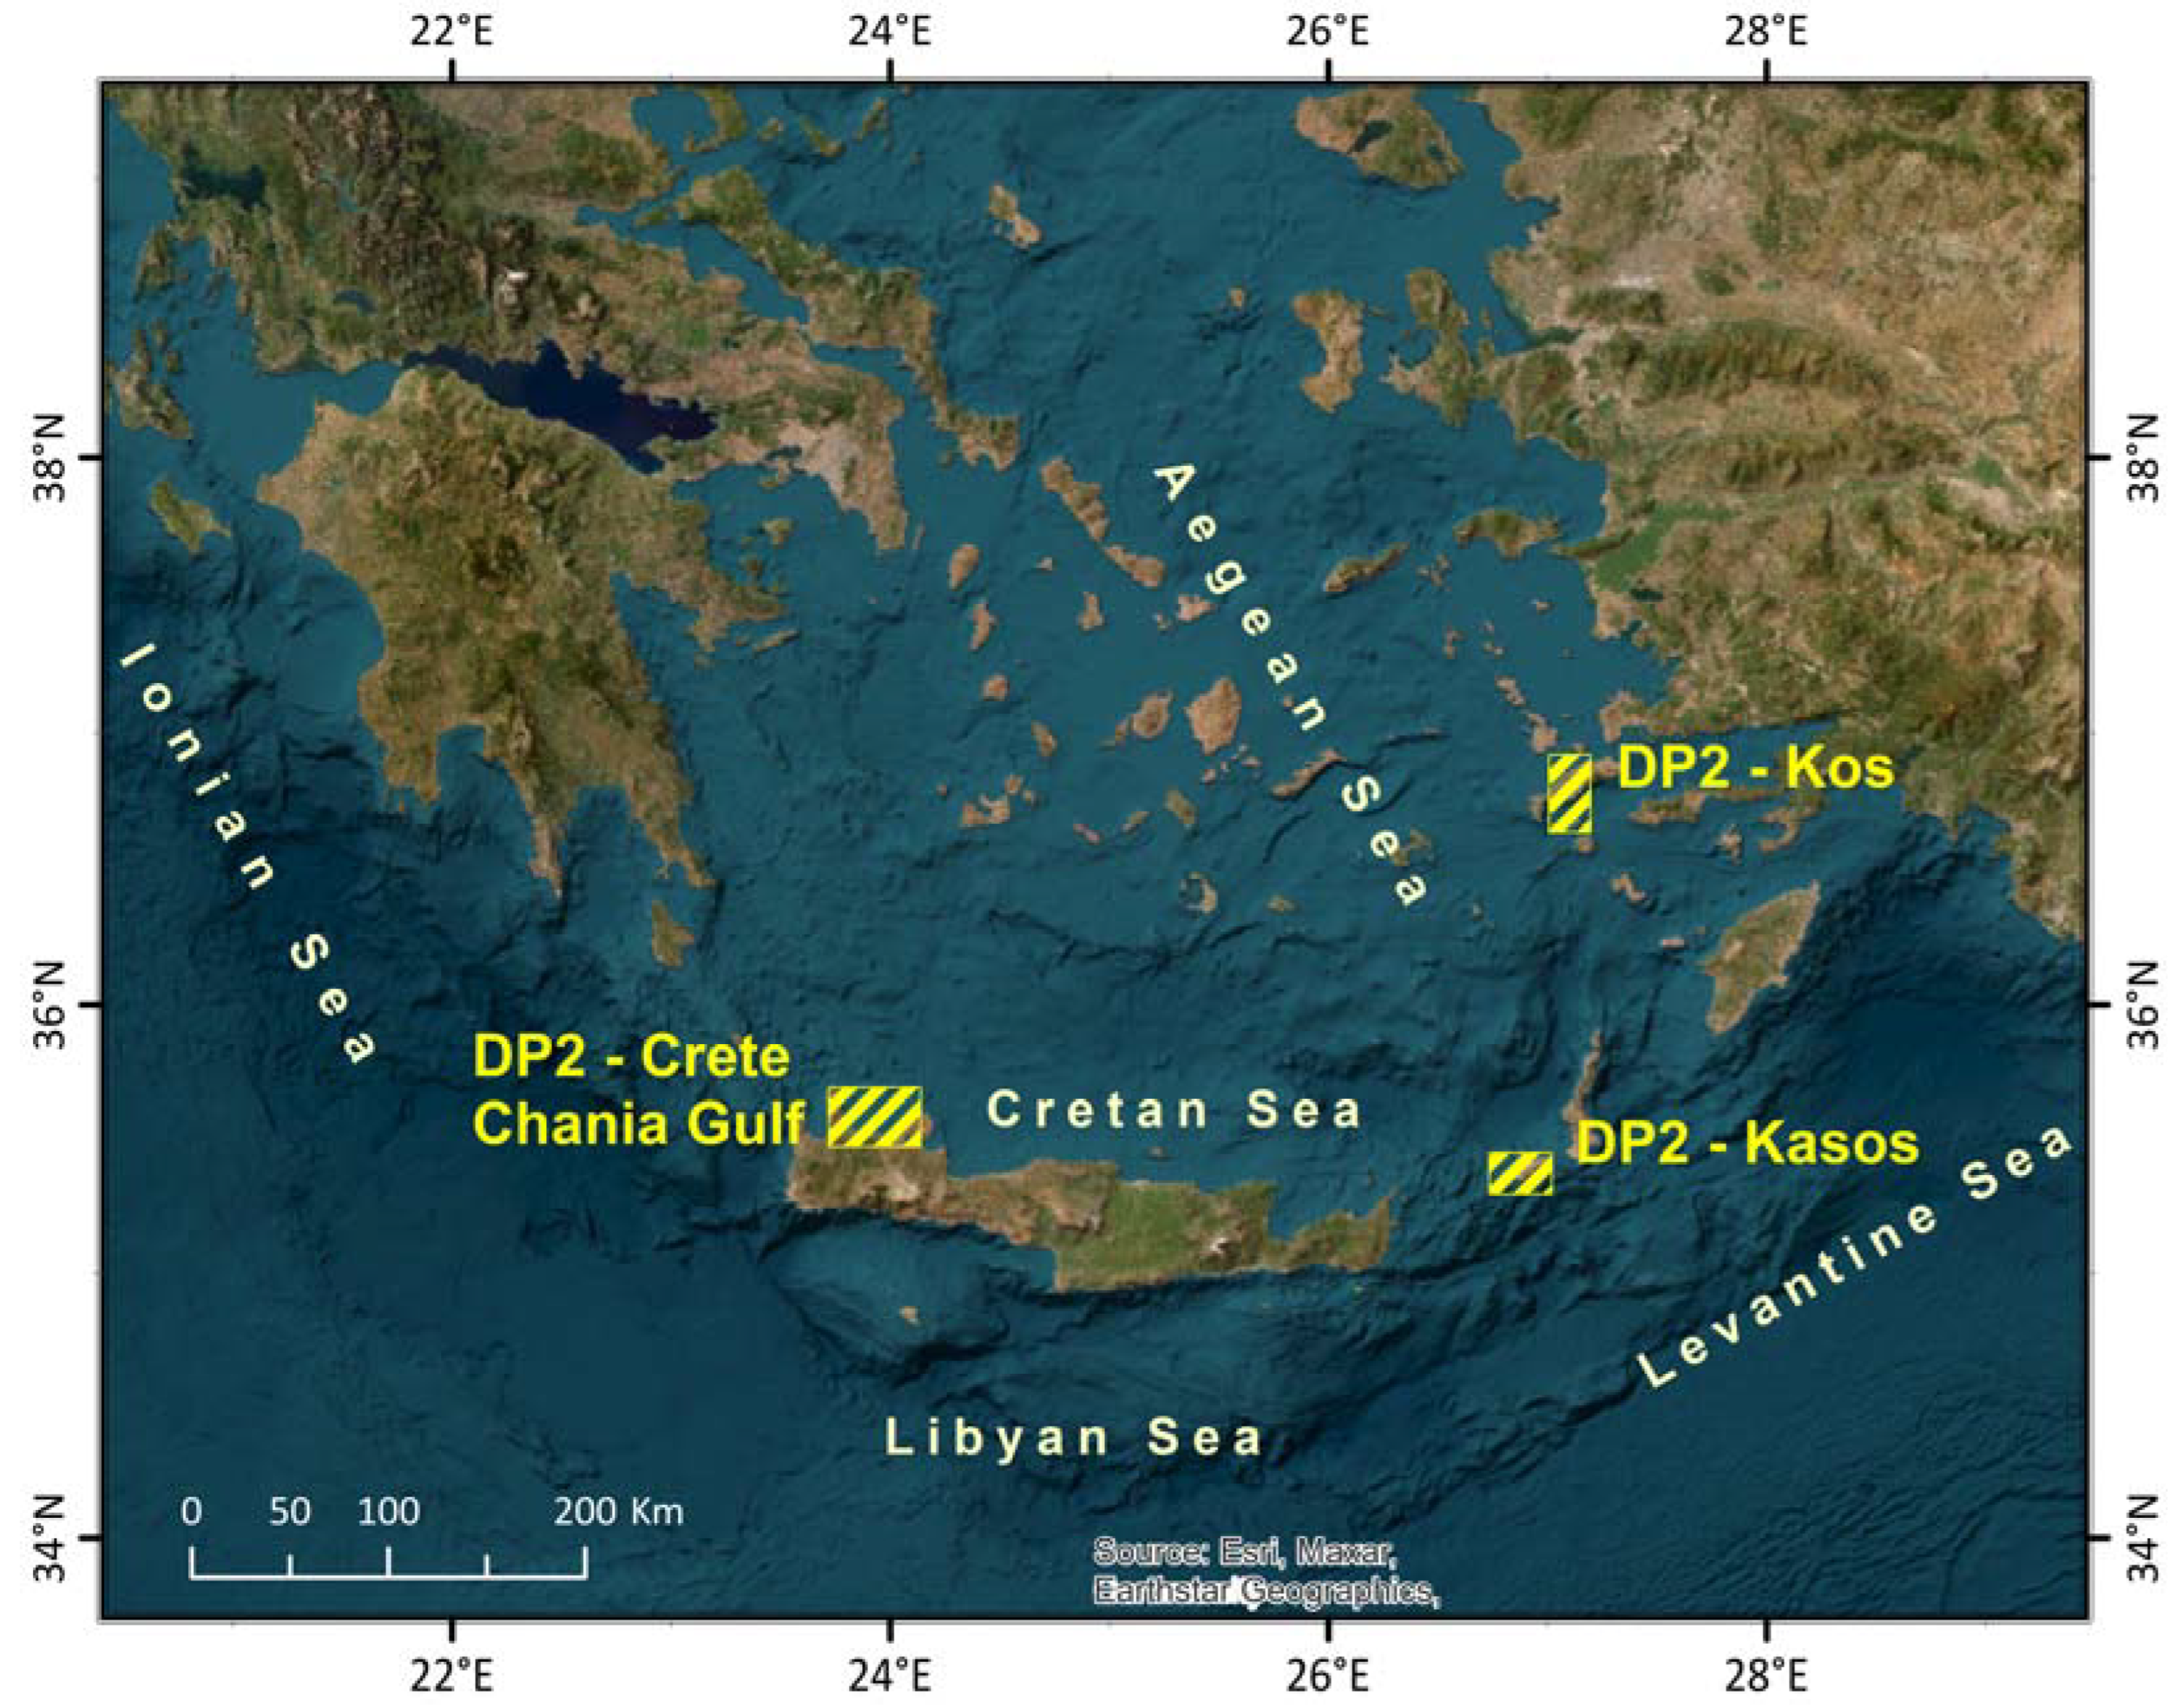
4. Materials and Methods: Study Area and Reference Bathymetric Data
- The EMODnet digital terrain model (DTM) of 2018 (for DP1 and DP2) at a resolution of 1/16 arc minute (~120 m), downloaded from the EMODnet portal (https://portal.emodnet-bathymetry.eu/, accessed on 14 September 2018).
- Survey data from the repository of the Hellenic Centre for Marine Research (HCMR) (for DP2);
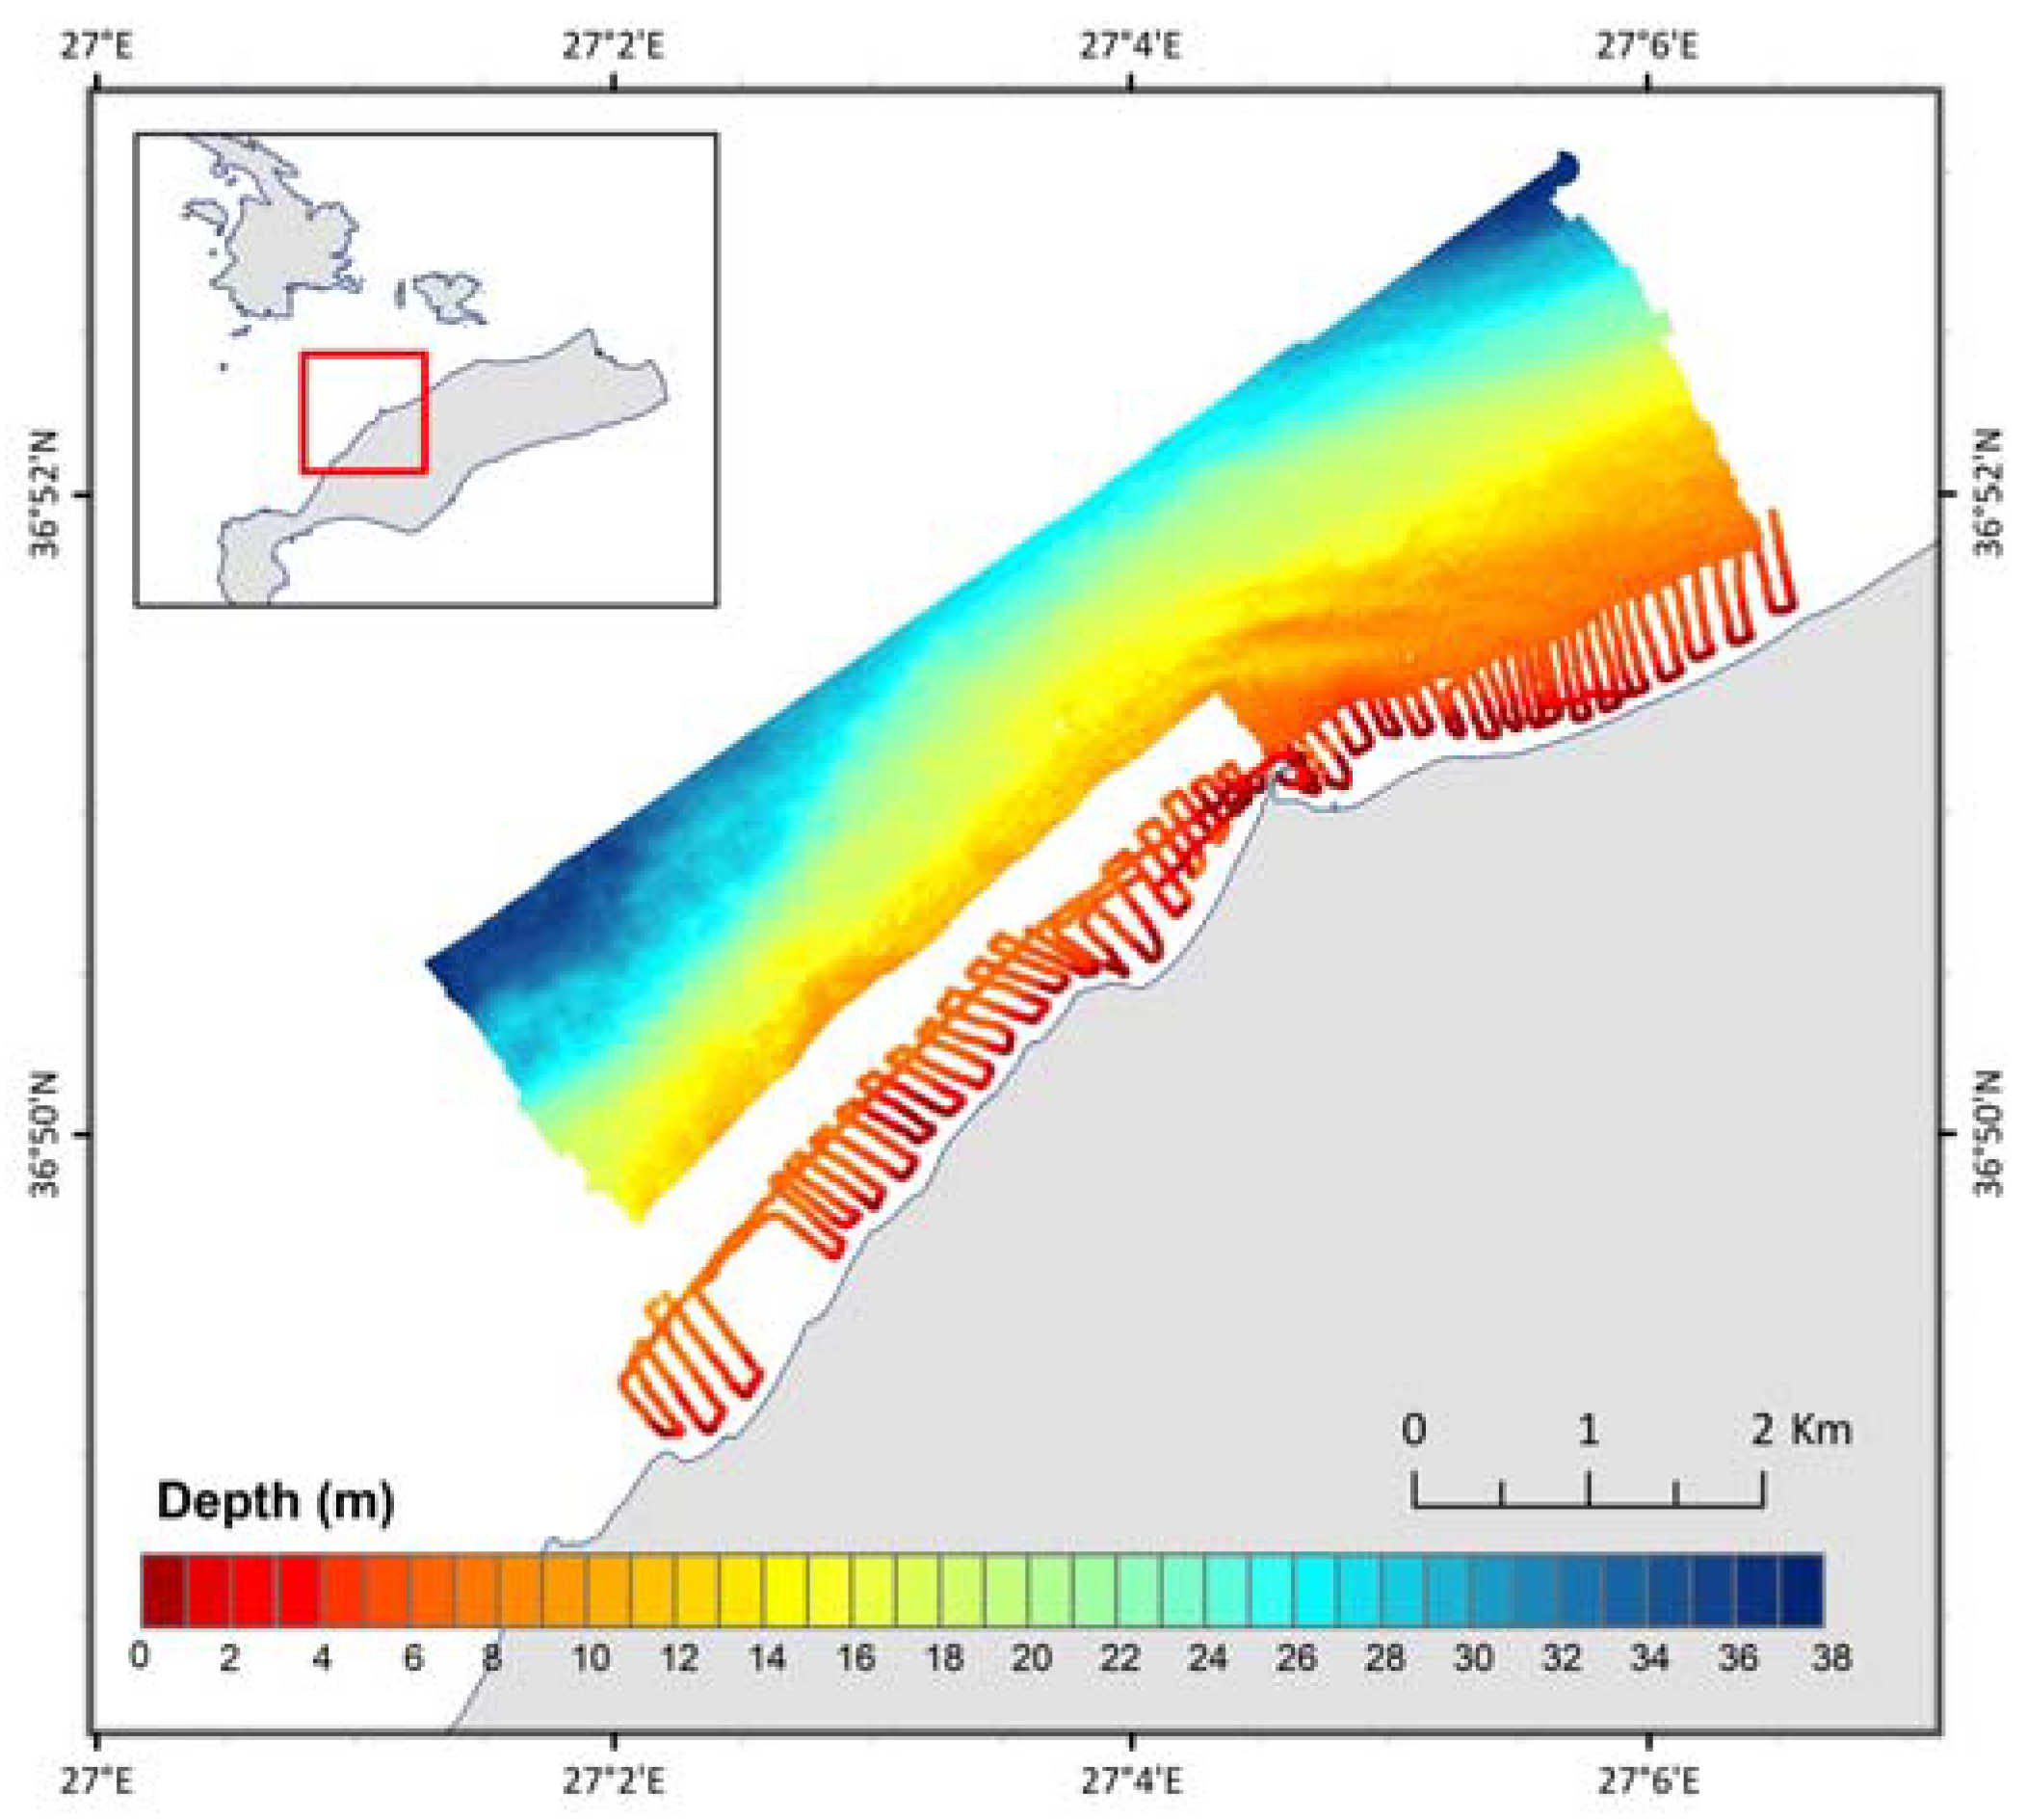
- Data from recent bathymetric surveys (for DP3) carried out by HCMR.
- Datasets from multibeam and single-beam surveys were carried out by HCMR in 2015, while their metadata are available from https://cdi-bathymetry.seadatanet.org/report/edmo/269/gn36201500007_269_g74 (accessed on 20 July 2023) and https://cdi-bathymetry.seadatanet.org/report/edmo/269/gn36201409922_269_g74 (accessed on 20 July 2023), respectively.
- Satellite-derived bathymetry provided by EOMAP (https://sextant.ifremer.fr/record/SDN_CPRD_4667_greece1001/, accessed on 20 July 2023).
- GEBCO 30 arc-second global grid, upsampled to 3.75 arc seconds
5. Results—Assessment of the BathySent Algorithm Performance over the Pilot Sites in the Aegean Sea
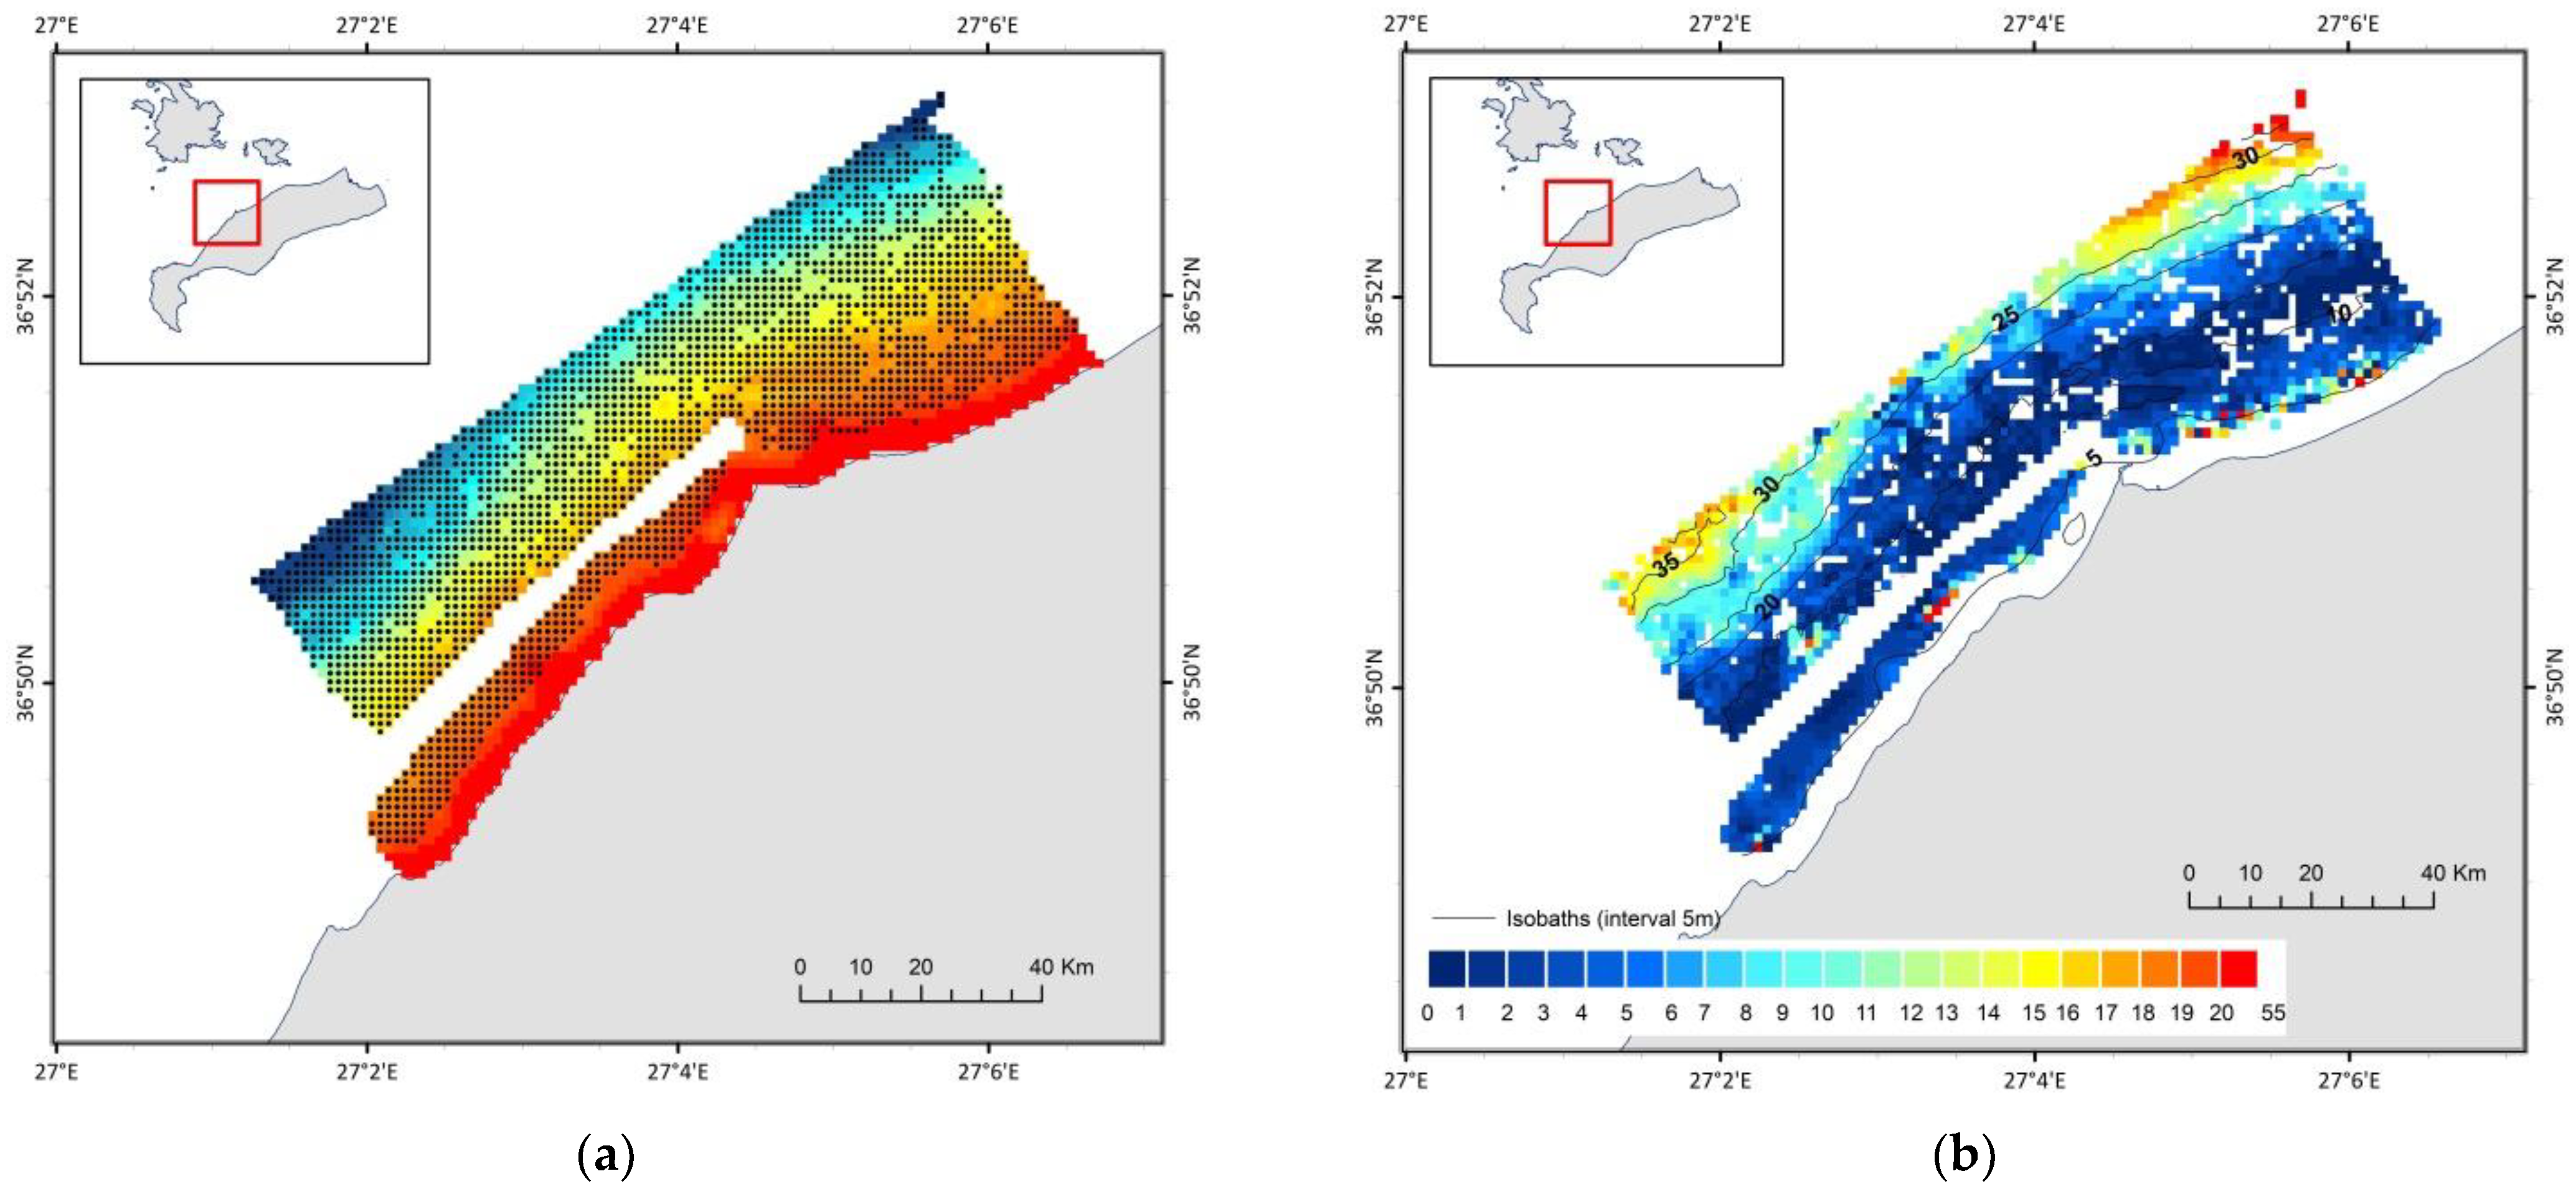
5.1. Kasos Island Bathymetric Data Package (DP1)
5.2. Crete Island Bathymetric Data Package (DP2)
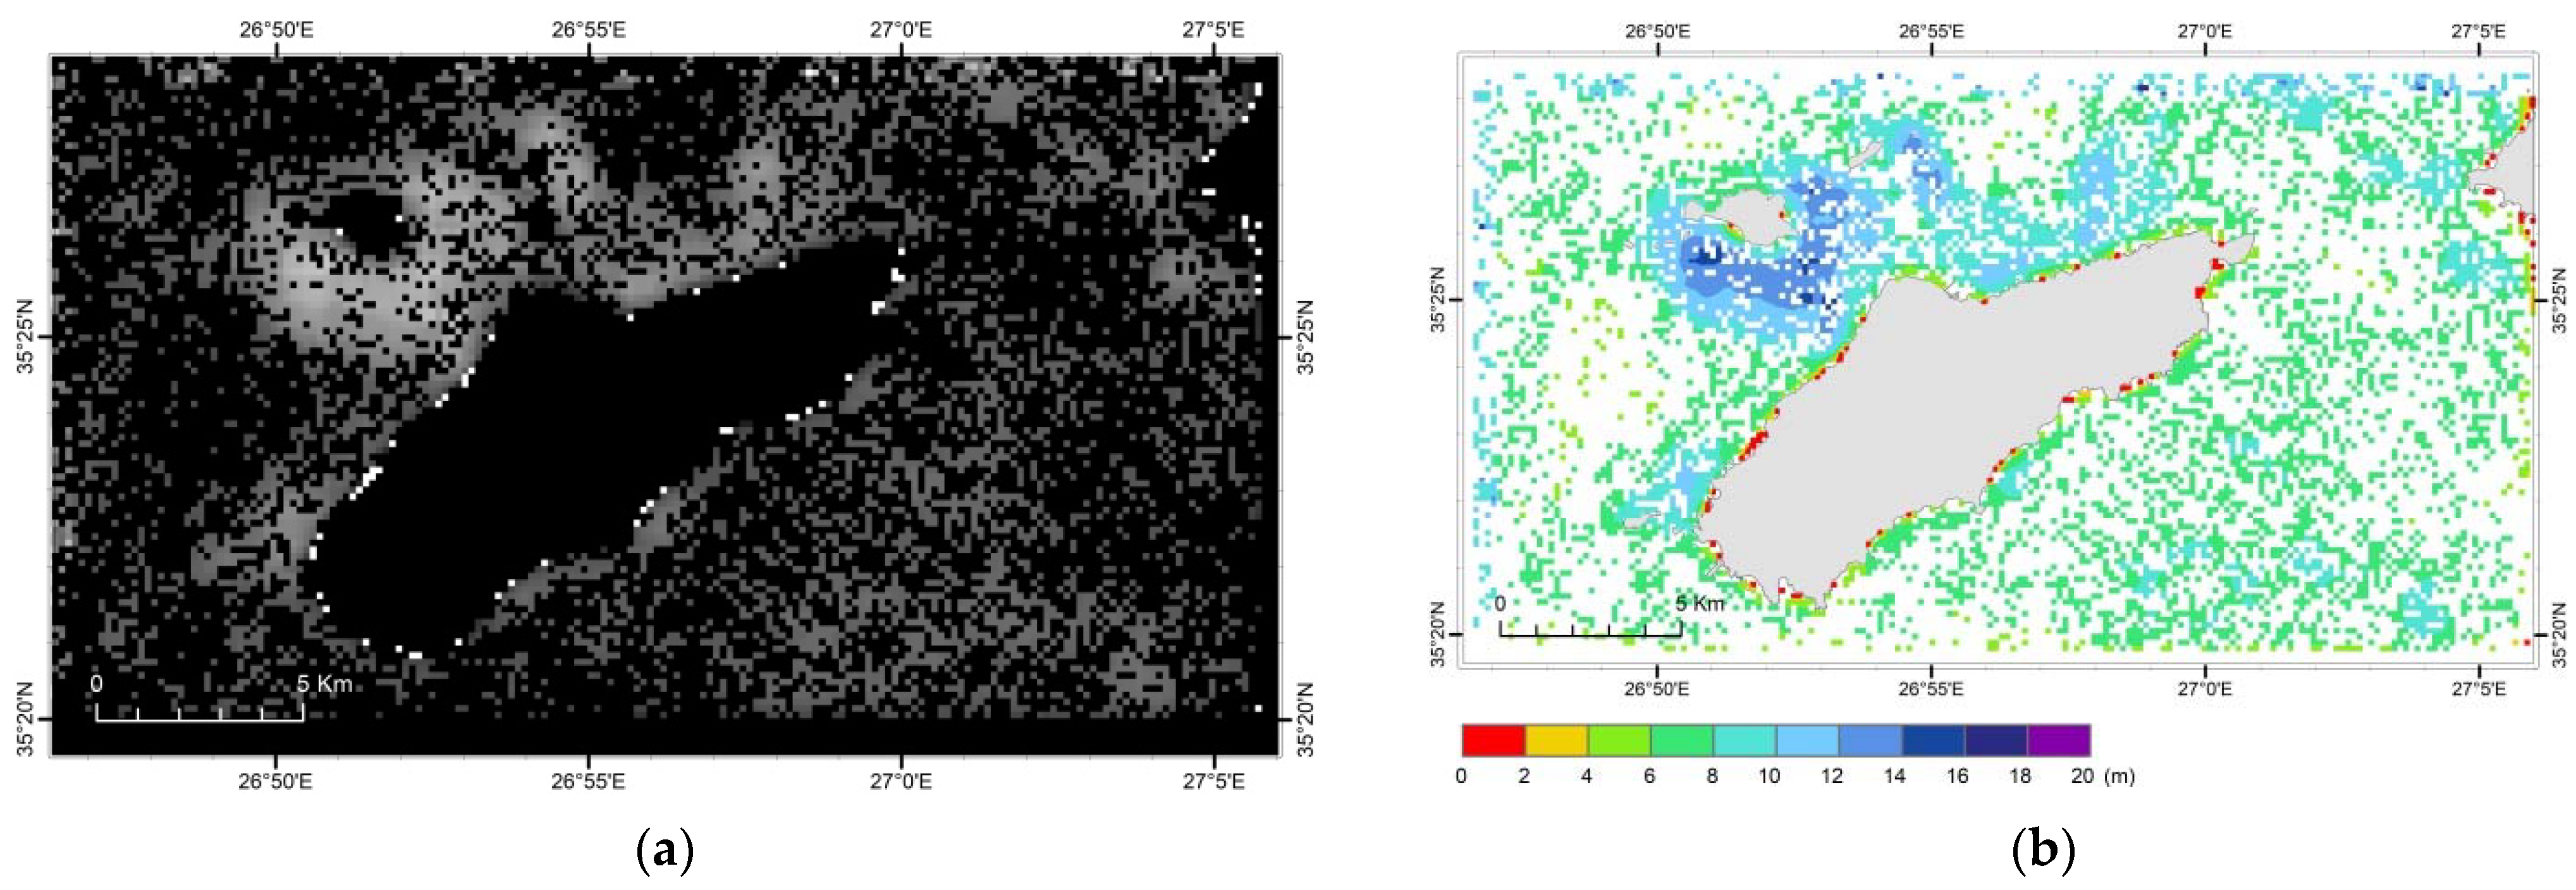
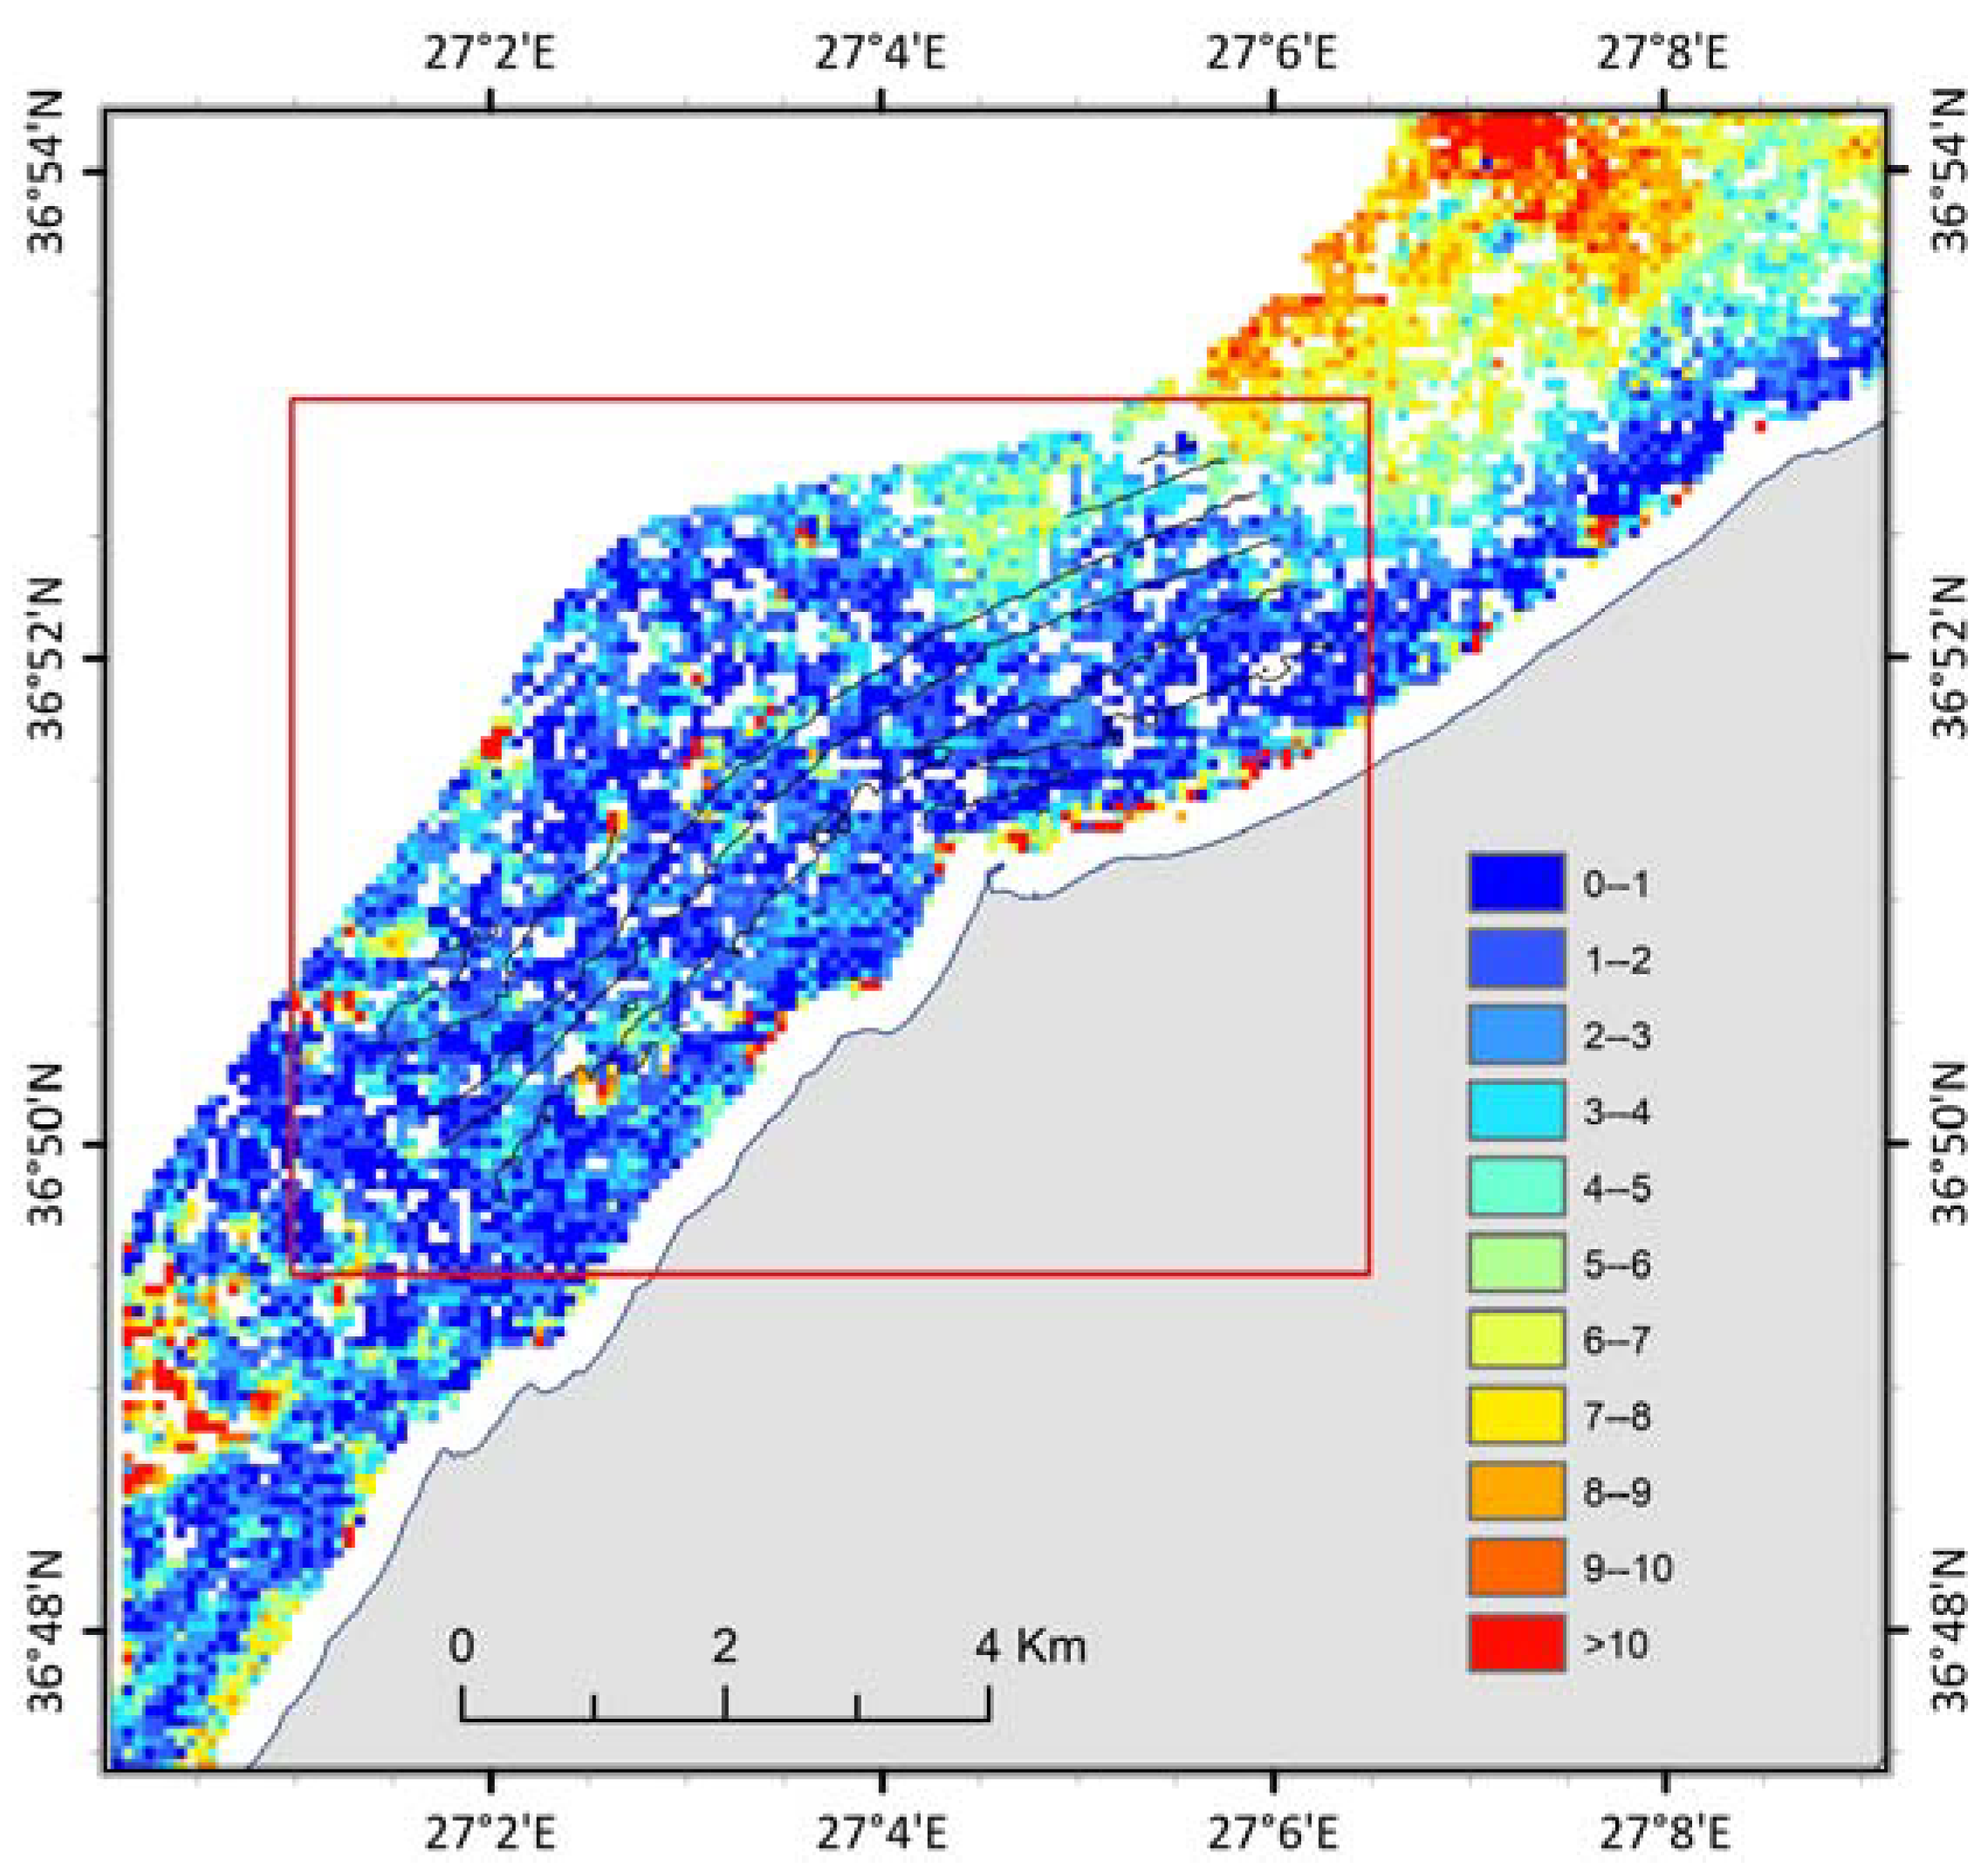
- The reference DTM was reprojected and resampled to the resolution (80 m) of the Sentinel-2 DTM to make their comparison appropriate.
- The Sentinel-2 DTM was converted into a vector-point feature and superimposed with the corresponding dataset of the reference DTM (Figure 8a). Depth values for both Sentinel-2 and reference DTM were included in the attribute table of this point feature and, finally, the absolute differences between the two depth fields were calculated. Figure 8b presents the spatial distribution of the absolute values of the above differences, in combination with depth zones defined by the isobath lines (5 m interval) extracted from the reference DTM.
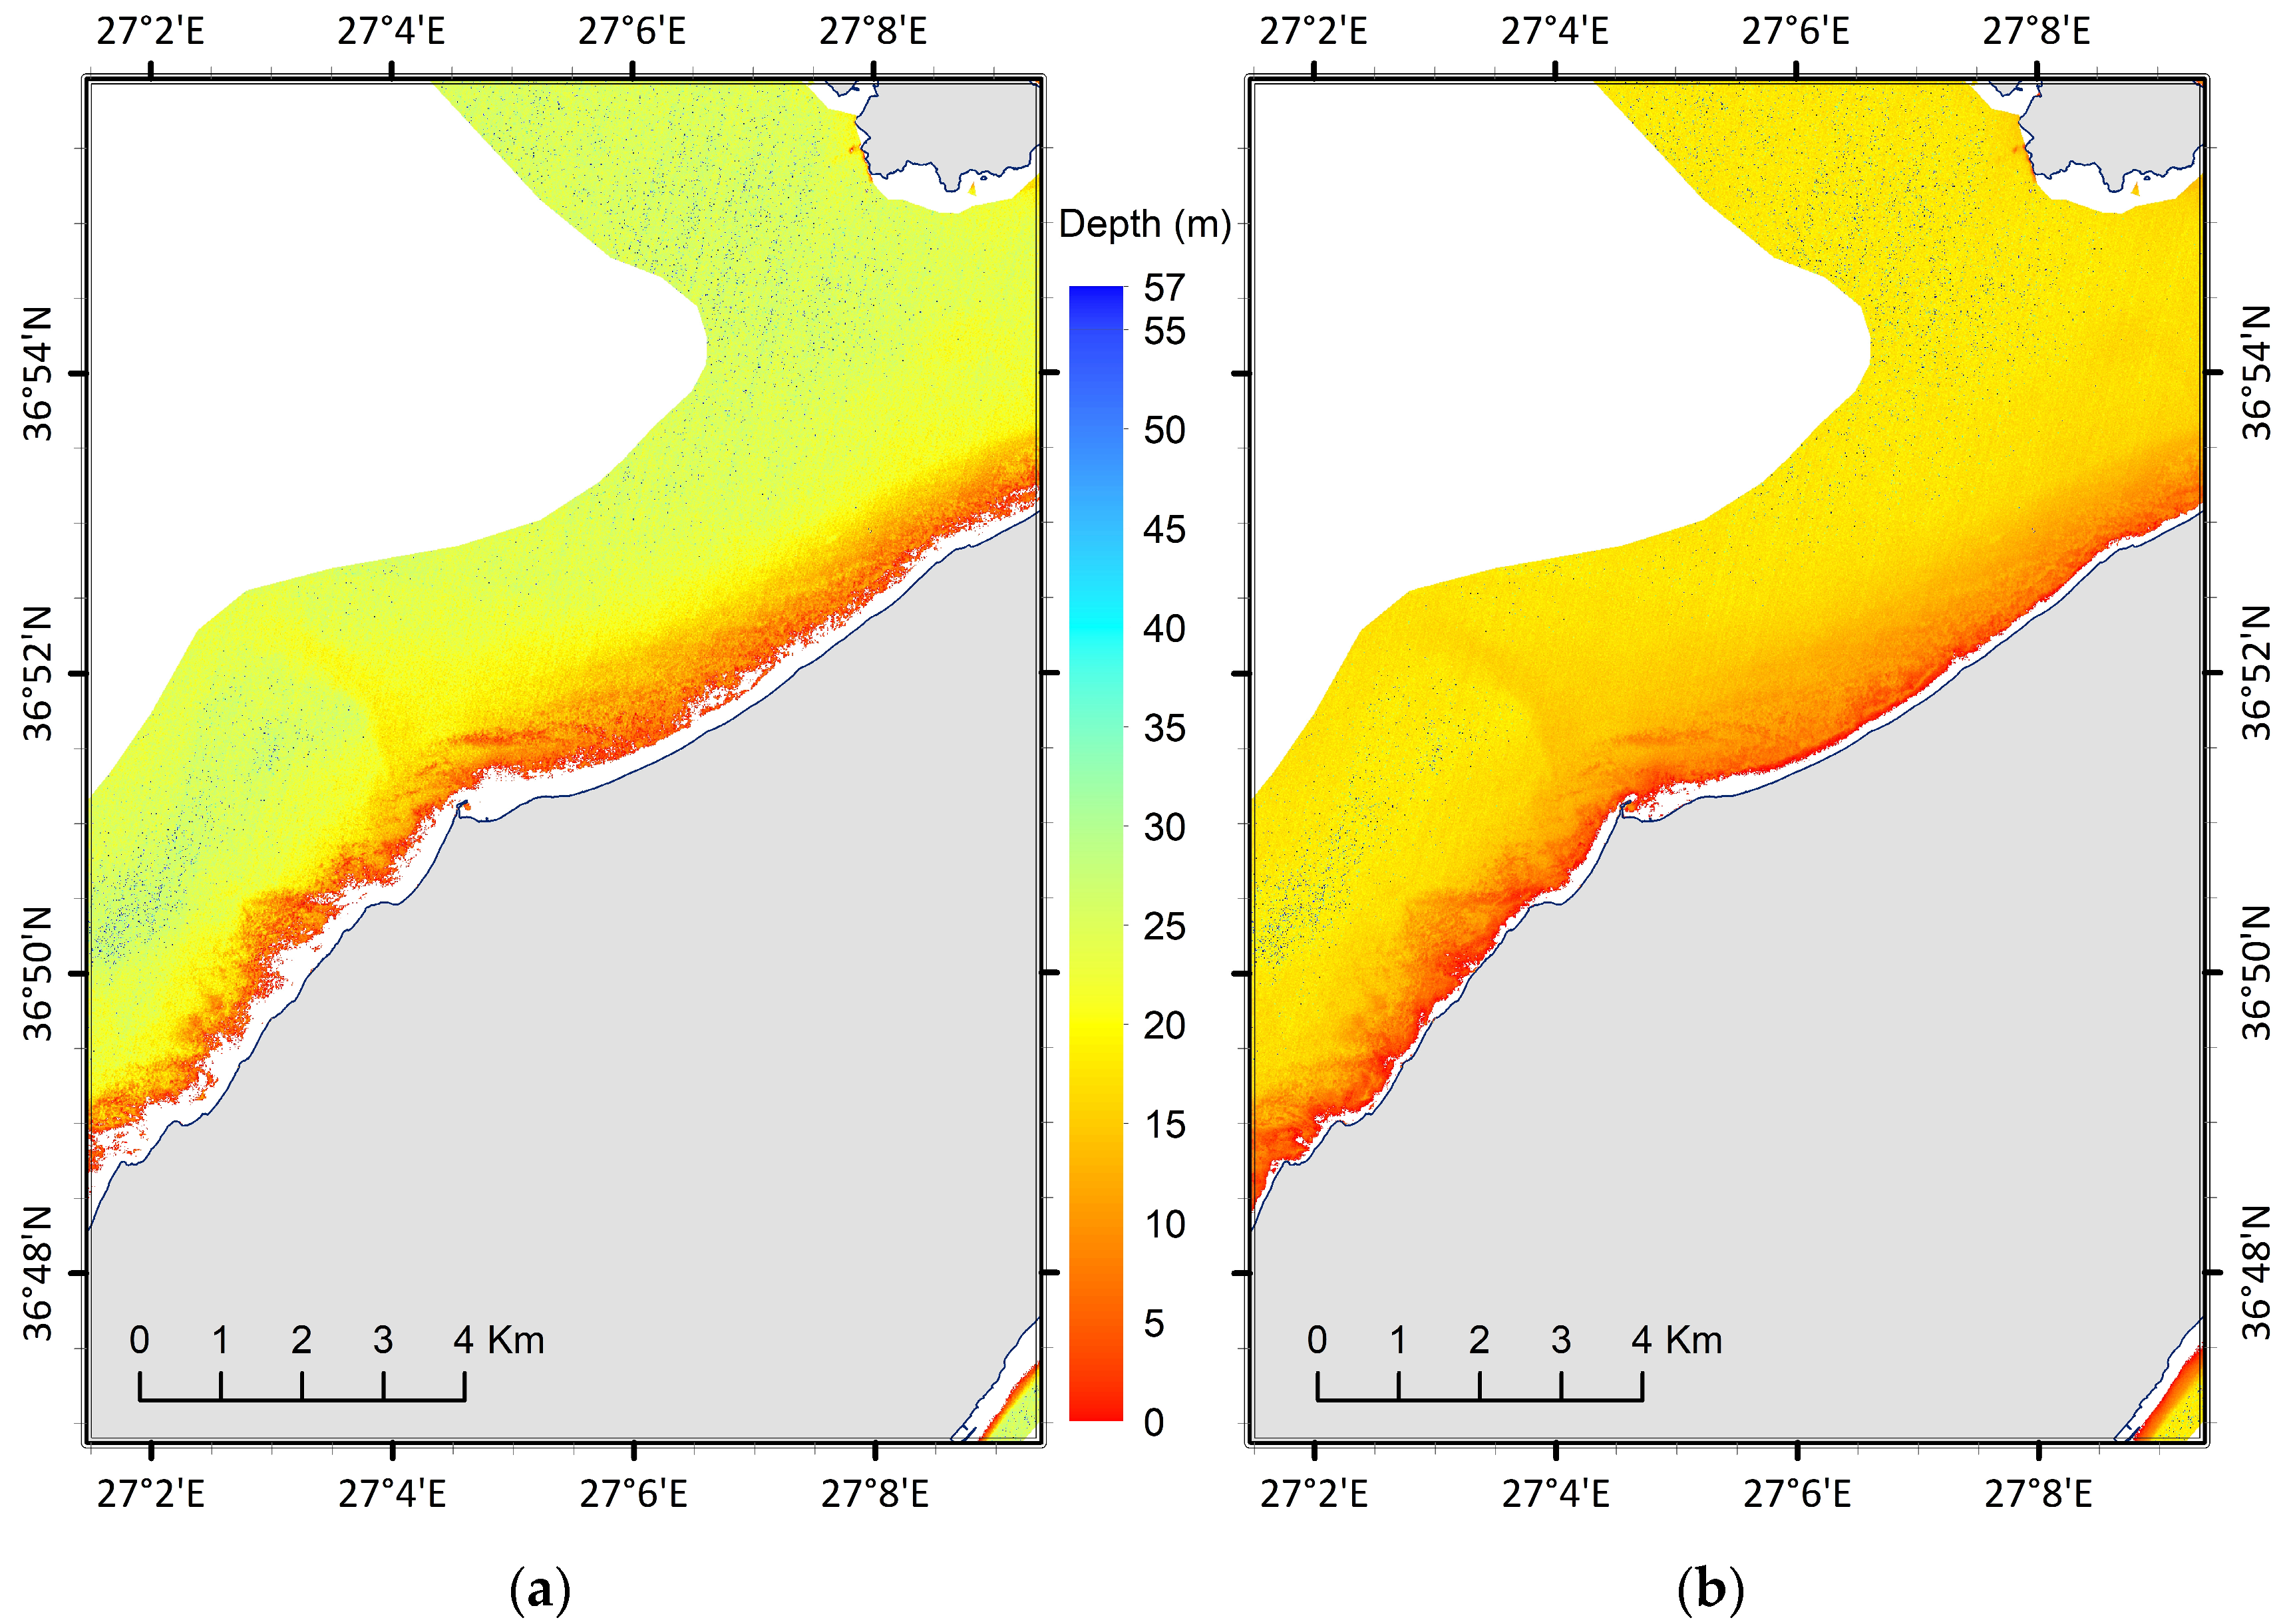
5.3. Kos Island Bathymetric Data Package (DP3)
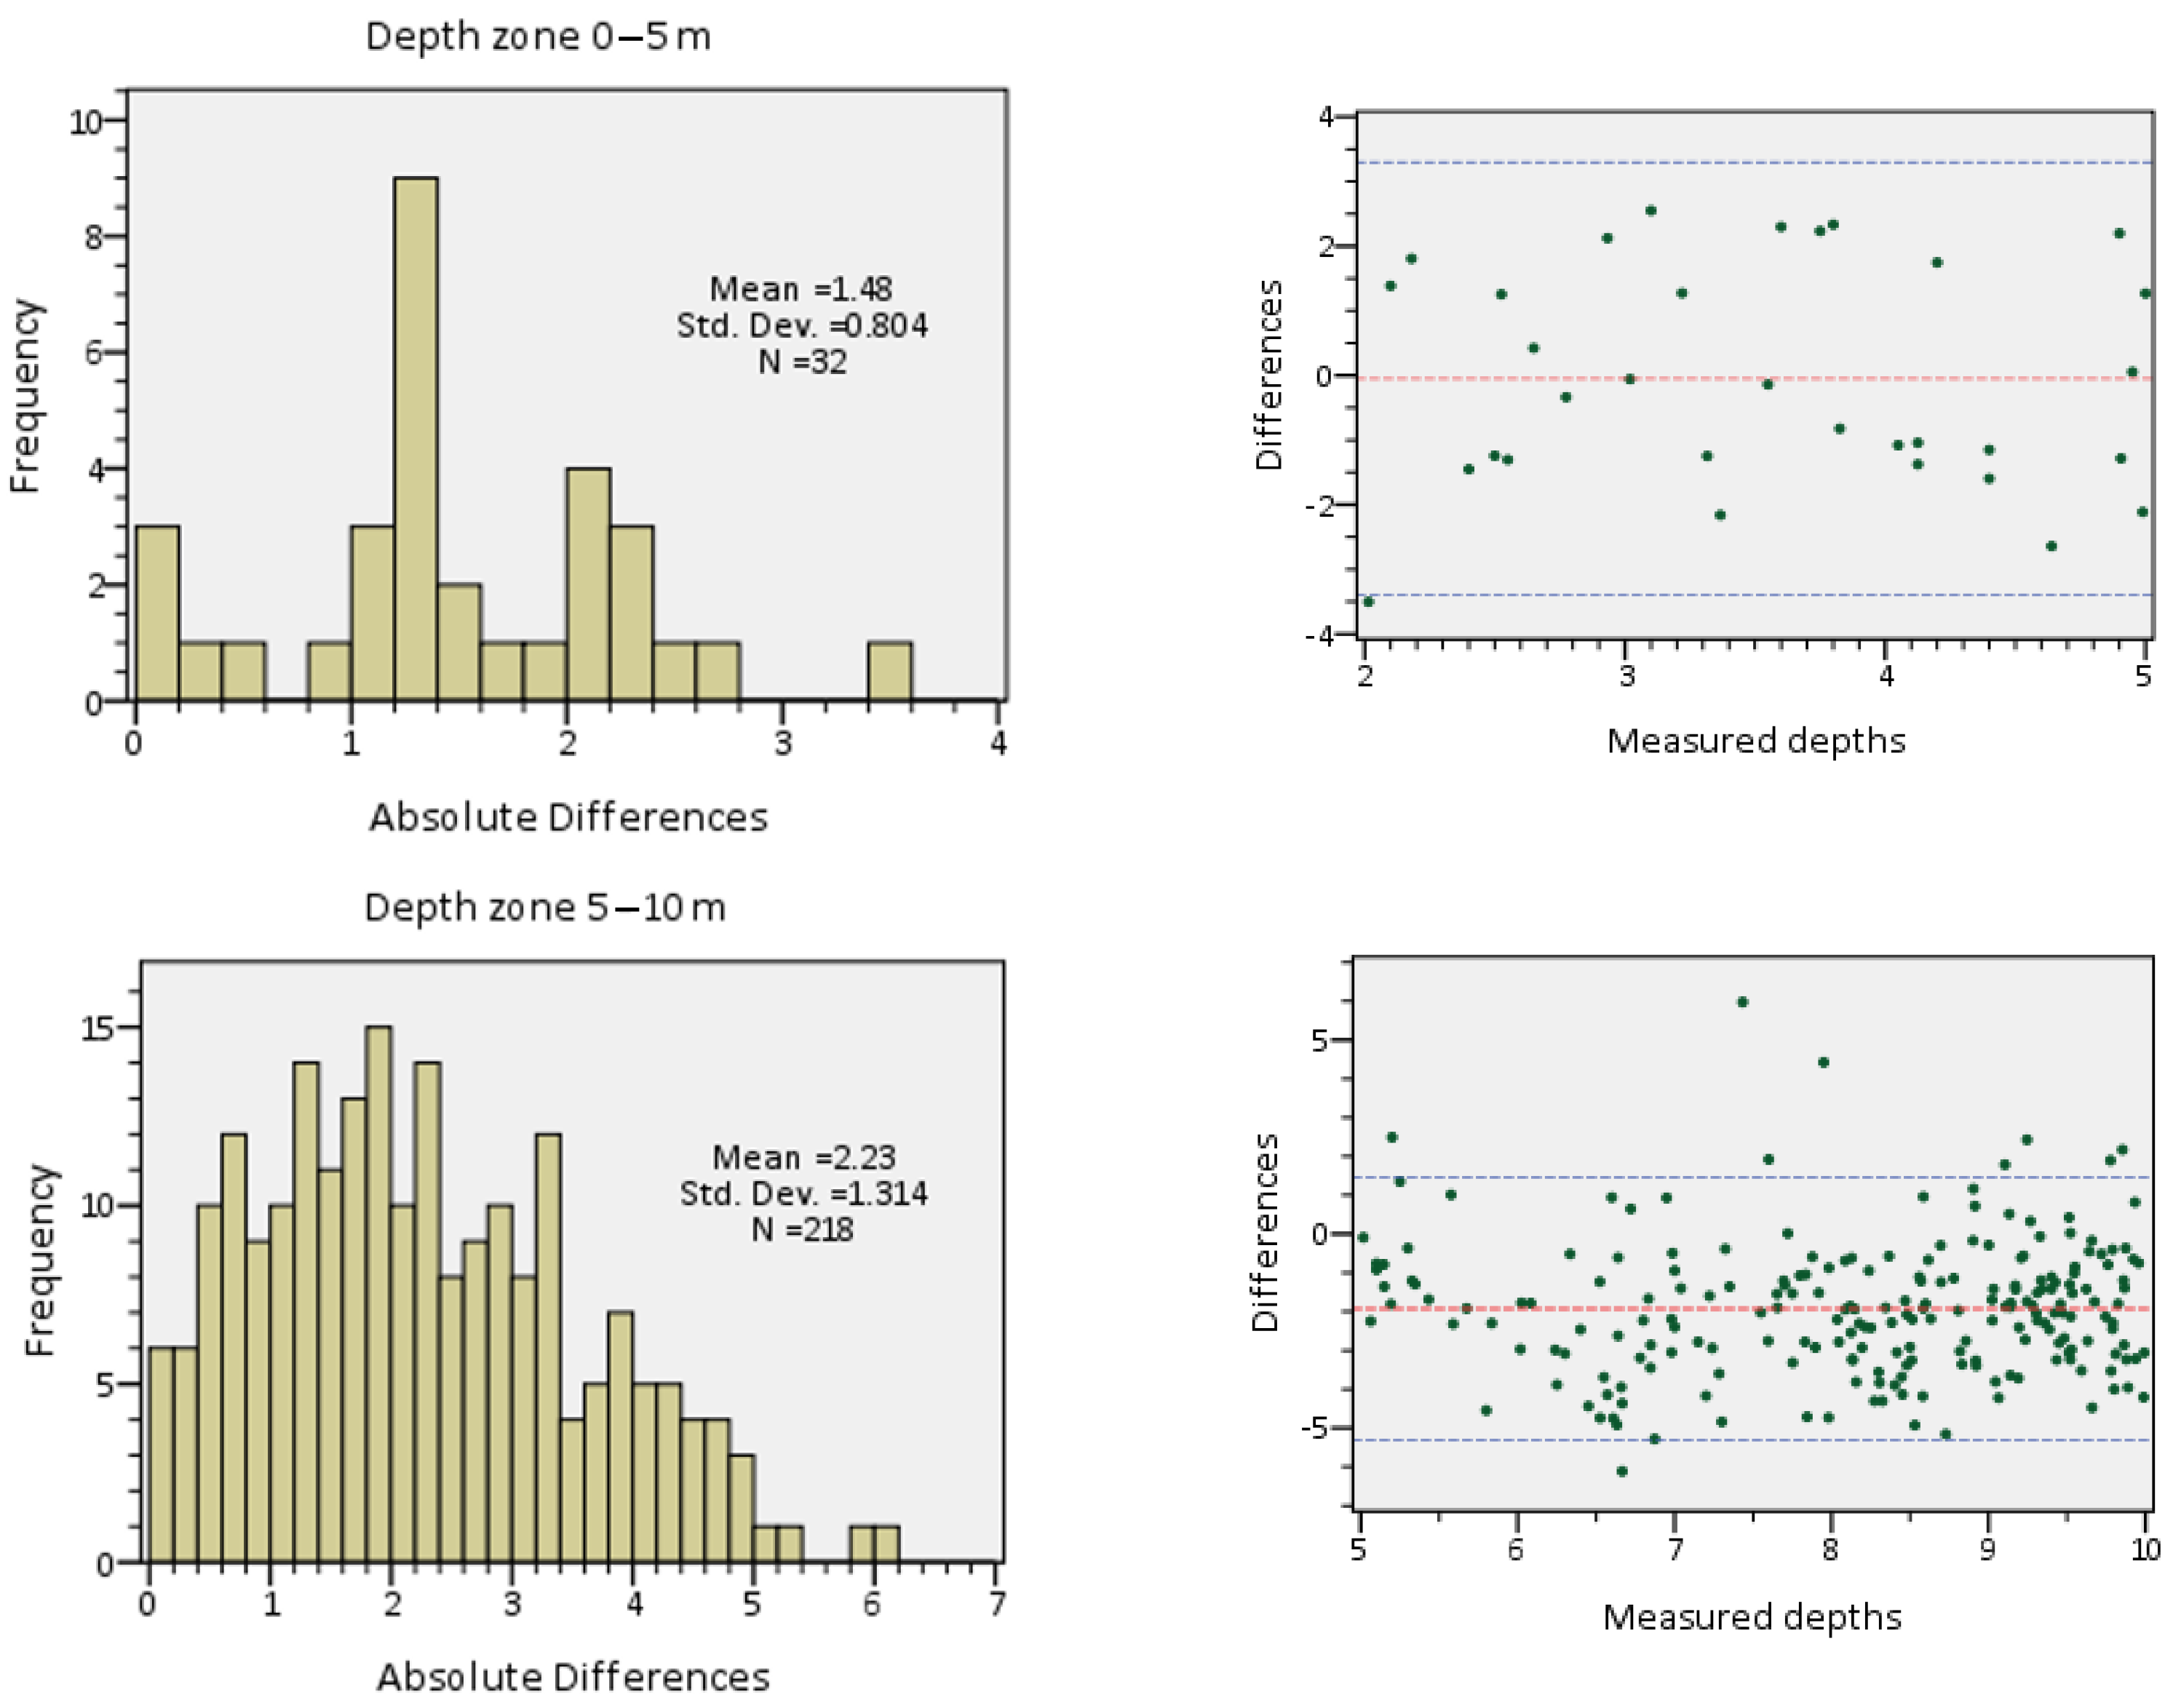
5.4. Kos Island: Conventional EO-Based Bathymetry Retrieval Approach vs. the BathySent Application to Sentinel-2 Data
6. Discussion
- Swell wavelength: The actual resolution of the final output is in the order of the observed wavelength. The theoretical minimum detectable wavelength is twice the pixel size (i.e., 20 m for the Sentinel-2 data). The shorter wavelengths are less sensitive to deeper bathymetry than the larger ones. To improve all previous limitations, an analysis of both short and large wavelengths has to be performed.
- Wave direction: It needs to be adapted to coast geometry. The ideal condition for the wave direction is to be perpendicular to the coastline, but in the case of complex coast geometry, several wave regimes of variable direction have to be used for the analysis of the wave interaction with obstacles.
- Wave visibility: The observed waves must be easily identifiable.
- Water turbidity: The water transparency is a limitation when seabed features are visible in the image, because they can affect the wave celerity estimation. However, extreme surface turbidity may result in patterns with a motion different from the wave motion, which could have an impact on the wave celerity estimation.
- Cloud masking: The presence of clouds, even partially transparent, can affect the wave celerity estimation due to their own motion.
7. Conclusions
- The access to the full archive of the Sentinel-2 missions, combining multiple Sentinel-2 acquisitions;
- The occurrence of swell for reliable depth estimates, particularly, at deeper waters. This can be feasible globally, but the local conditions usually play a vital role.
- Wind-generated waves or currents can affect the precision of the bathymetric retrievals by the BathySent solution, which is primarily based on the imagery of swell waves. Therefore, the proposed algorithm should be further developed in order to automatically select the reliable bathymetries.
- The spatial resolution of the final bathymetric output has to be improved as the FFT window approaches the shallower zone. This issue is critical for the algorithm’s validity and could be addressed by the adaptation of window sizes in a proper interaction scheme.
- To improve the precision of the bathymetric estimates, a combination of multiple sensors, multiple pixel resolutions, and multiple swell regimes should be used (e.g., a combination of Landsat-8, Pleiades, and Sentinel-2 datasets).
Author Contributions
Funding
Data Availability Statement
Acknowledgments
Conflicts of Interest
References
- Lyzenga, D.R. Passive Remote Sensing Techniques for Mapping Water Depth and Bottom Features. Appl. Opt. 1978, 17, 379. [Google Scholar] [CrossRef] [PubMed]
- Philpot, W.D. Bathymetric Mapping with Passive Multispectral Imagery. Appl. Opt. 1989, 28, 1569. [Google Scholar] [CrossRef] [PubMed]
- Lafon, V. Methodes de Bathymetrie Satellitale Appliques a l’environnement Cotier: Exemple des Passes d’Arcachon. Ph.D. Thesis, University of Bordeaux 1, Talence, Bordeaux, France, 1999. [Google Scholar]
- Lafon, V.; Froidefond, J.M.; Lahet, F.; Castaing, P. SPOT Shallow Water Bathymetry of a Moderately Turbid Tidal Inlet Based on Field Measurements. Remote Sens. Environ. 2002, 81, 136–148. [Google Scholar] [CrossRef]
- Adler-Golden, S.M.; Acharya, P.K.; Berk, A.; Matthew, M.W.; Gorodetzky, D. Remote Bathymetry of the Littoral Zone from AVIRIS, LASH, and QuickBird Imagery. IEEE Trans. Geosci. Remote Sens. 2005, 43, 337–347. [Google Scholar] [CrossRef]
- Benny, A.H.; Dawson, G.J. Satellite Imagery as an Aid to Bathymetric Charting in the Red Sea. Cartogr. J. 1983, 20, 5–16. [Google Scholar] [CrossRef]
- Bierwirth, P.N.; Lee, T.J.; Burne, R.V. Shallow Sea-Floor Reflectance and Water Depth Derived by Unmixing Multispectral Imagery. Photogramm. Eng. Remote Sens. 1993, 59, 331–338. [Google Scholar]
- Lee, Z.; Carder, K.L.; Chen, R.F.; Peacock, T.G. Properties of the Water Column and Bottom Derived from Airborne Visible Infrared Imaging Spectrometer (AVIRIS) Data. J. Geophys. Res. Ocean. 2001, 106, 11639–11651. [Google Scholar] [CrossRef]
- Sandidge, J.C.; Holyer, R.J. Coastal Bathymetry from Hyperspectral Observations of Water Radiance. Remote Sens. Environ. 1998, 65, 341–352. [Google Scholar] [CrossRef]
- He, J.; Lin, J.; Ma, M.; Liao, X. Mapping Topo-Bathymetry of Transparent Tufa Lakes Using UAV-Based Photogrammetry and RGB Imagery. Geomorphology 2021, 389, 107832. [Google Scholar] [CrossRef]
- He, J.; Lin, J.; Liao, X. Fully-Covered Bathymetry of Clear Tufa Lakes Using UAV-Acquired Overlapping Images and Neural Networks. J. Hydrol. 2022, 615, 128666. [Google Scholar] [CrossRef]
- Irish, J.L.; Lillycrop, W.J. Scanning Laser Mapping of the Coastal Zone: The SHOALS System. ISPRS J. Photogramm. Remote Sens. 1999, 54, 123–129. [Google Scholar] [CrossRef]
- Dalrymple, R.A.; Kennedy, A.B.; Kirby, J.T.; Chen, Q. Determining Depth from Remotely-Sensed Images. In Coastal Engineering 1998; American Society of Civil Engineers: Reston, VA, USA, 1999; pp. 2395–2408. [Google Scholar]
- Leu, L.-G.; Kuo, Y.-Y.; Liu, C.-T. Coastal Bathymetry from the Wave Spectrum of Spot Images. Coast. Eng. J. 1999, 41, 21–41. [Google Scholar] [CrossRef]
- Leu, L.-G.; Chang, H.-W. Remotely Sensing in Detecting the Water Depths and Bed Load of Shallow Waters and Their Changes. Ocean. Eng. 2005, 32, 1174–1198. [Google Scholar] [CrossRef]
- Wu, J.; Juang, J.T. Application of Satellite Images to the Detection of Coastal Topography. Coast. Eng. Proc. 1997, 1, 3762–3769. [Google Scholar]
- Danilo, C.; Melgani, F. Wave Period and Coastal Bathymetry Using Wave Propagation on Optical Images. IEEE Trans. Geosci. Remote Sens. 2016, 54, 6307–6319. [Google Scholar] [CrossRef]
- Poupardin, A.; Idier, D.; de Michele, M.; Raucoules, D. Water Depth Inversion From a Single SPOT-5 Dataset. IEEE Trans. Geosci. Remote Sens. 2016, 54, 2329–2342. [Google Scholar] [CrossRef]
- de Michele, M.; Raucoules, D.; Idier, D.; Smai, F.; Foumelis, M. Shallow Bathymetry from Multiple Sentinel 2 Images via the Joint Estimation of Wave Celerity and Wavelength. Remote Sens. 2021, 13, 2149. [Google Scholar] [CrossRef]
- Abileah, R. Mapping Shallow Water Depth from Satellite. In Proceedings of the ASPRS Annual Conference, Reno Nevada, NV, USA, 1–5 May 2006; pp. 1–7. [Google Scholar]
- Mancini, S.; Olsen, R.C.; Abileah, R.; Lee, K.R. Automating Nearshore Bathymetry Extraction from Wave Motion in Satellite Optical Imagery. In Algorithms and Technologies for Multispectral, Hyperspectral, and Ultraspectral Imagery XVIII; Shen, S.S., Lewis, P.E., Eds.; SPIE: Bellingham, WA, USA, 2012; p. 83900P. [Google Scholar]
- de Michele, M.; Leprince, S.; Thiébot, J.; Raucoules, D.; Binet, R. Direct Measurement of Ocean Waves Velocity Field from a Single SPOT-5 Dataset. Remote Sens. Environ. 2012, 119, 266–271. [Google Scholar] [CrossRef]
- Danilo, C.; Binet, R. Bathymetry Estimation from Wave Motion with Optical Imagery: Influence of Acquisition Parameters. In Proceedings of the 2013 MTS/IEEE OCEANS-Bergen, Bergen, Norway, 10–14 June 2013; pp. 1–5. [Google Scholar]
- Poupardin, A.; de Michele, M.; Raucoules, D.; Idier, D. Water Depth Inversion from Satellite Dataset. In Proceedings of the 2014 IEEE Geoscience and Remote Sensing Symposium, Quebec City, QC, Canada, 13–18 July 2014; pp. 2277–2280. [Google Scholar]
- Abileah, R. Mapping near Shore Bathymetry Using Wave Kinematics in a Time Series of WorldView-2 Satellite Images. In Proceedings of the 2013 IEEE International Geoscience and Remote Sensing Symposium-IGARSS, Melbourne, VIC, Australia, 21–26 July 2013; pp. 2274–2277. [Google Scholar]
- Bergsma, E.W.J.; Almar, R.; Maisongrande, P. Radon-Augmented Sentinel-2 Satellite Imagery to Derive Wave-Patterns and Regional Bathymetry. Remote Sens. 2019, 11, 1918. [Google Scholar] [CrossRef]
- Almar, R.; Bergsma, E.W.J.; Maisongrande, P.; de Almeida, L.P.M. Wave-Derived Coastal Bathymetry from Satellite Video Imagery: A Showcase with Pleiades Persistent Mode. Remote Sens. Environ. 2019, 231, 111263. [Google Scholar] [CrossRef]
- Kudryavtsev, V.; Yurovskaya, M.; Chapron, B.; Collard, F.; Donlon, C. Sun Glitter Imagery of Ocean Surface Waves. Part 1: Directional Spectrum Retrieval and Validation. J. Geophys. Res. Ocean. 2017, 122, 1369–1383. [Google Scholar] [CrossRef]
- Kudryavtsev, V.; Yurovskaya, M.; Chapron, B.; Collard, F.; Donlon, C. Sun Glitter Imagery of Surface Waves. Part 2: Waves Transformation on Ocean Currents. J. Geophys. Res. Ocean. 2017, 122, 1384–1399. [Google Scholar] [CrossRef]
- Bland, J.M.; Altman, D.G. Statistical Methods for Assessing Agreement Between Two Methods of Clinical Measurment. Lancet 1986, 327, 307–310. [Google Scholar] [CrossRef]
- Bland, J.M.; Altman, D.G. Comparing Methods of Measurement: Why Plotting Difference against Standard Method Is Misleading. Lancet 1995, 346, 1085–1087. [Google Scholar] [CrossRef] [PubMed]
- Bland, J.M.; Altman, D.G. Measuring Agreement in Method Comparison Studies. Stat. Methods Med. Res. 1999, 8, 135–160. [Google Scholar] [CrossRef]
- Chavez, P.S. An Improved Dark-Object Subtraction Technique for Atmospheric Scattering Correction of Multispectral Data. Remote Sens. Environ. 1988, 24, 459–479. [Google Scholar] [CrossRef]
- Hedley, J.D.; Harborne, A.R.; Mumby, P.J. Technical Note: Simple and Robust Removal of Sun Glint for Mapping Shallow-water Benthos. Int. J. Remote Sens. 2005, 26, 2107–2112. [Google Scholar] [CrossRef]
- Stumpf, R.P.; Holderied, K.; Sinclair, M. Determination of Water Depth with High-Resolution Satellite Imagery over Variable Bottom Types. Limnol. Oceanogr. 2003, 48, 547–556. [Google Scholar] [CrossRef]







| Depth Interval (m) | RMSE | MAE |
|---|---|---|
| 0–5 | 3.87 | 3.03 |
| 5–10 | 1.84 | 1.32 |
| 10–15 | 1.89 | 1.50 |
| 15–20 | 4.34 | 4.06 |
| 20–25 | 9.00 | 8.68 |
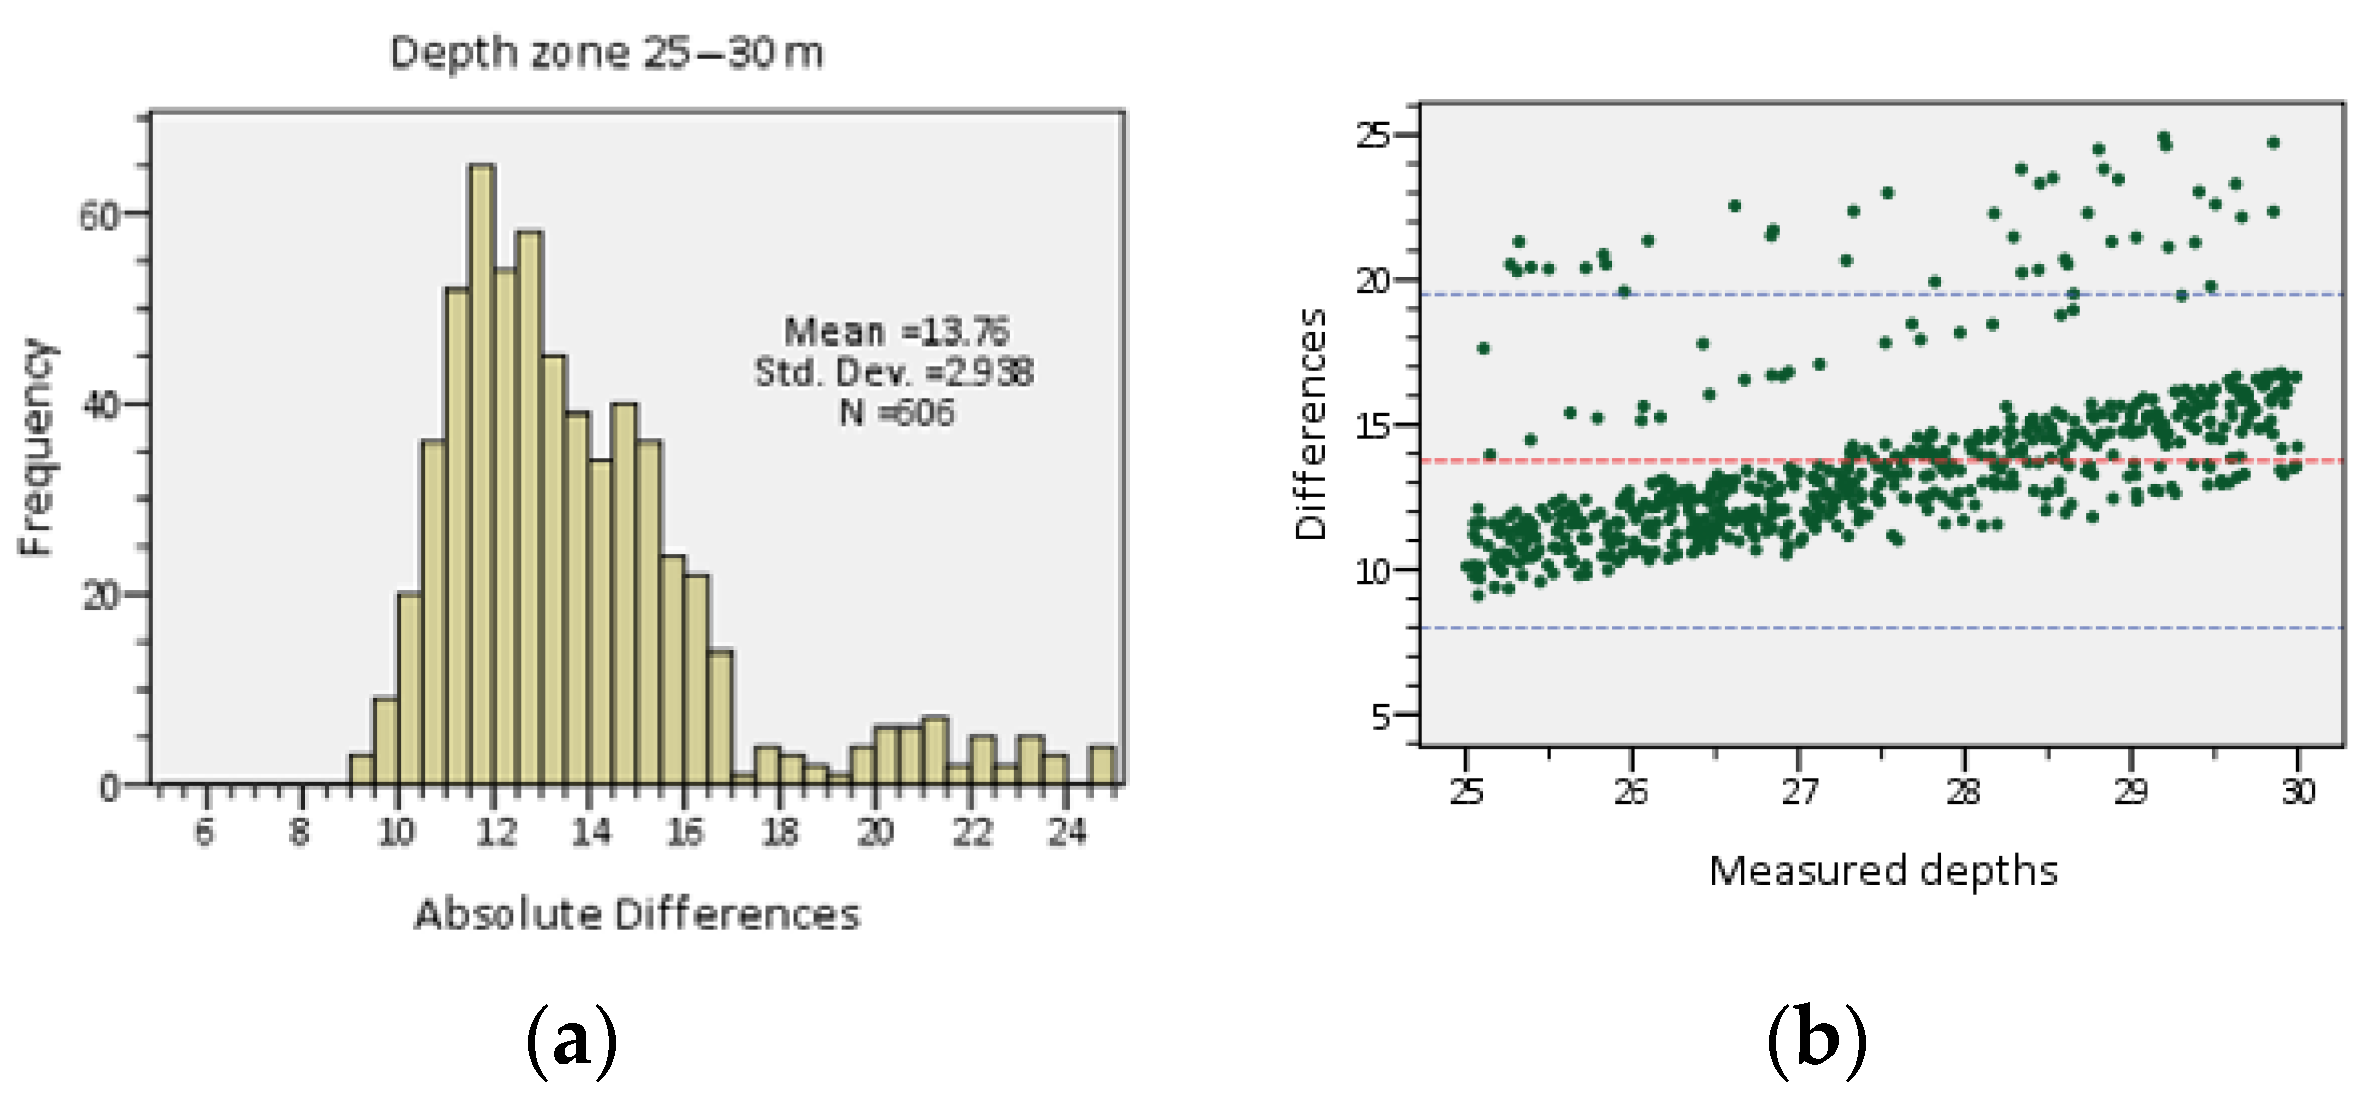
| 25–30 | 14.07 | 13.76 |
| 30–35 | 19.77 | 19.52 |
| 35–40 | 23.14 | 23.08 |
| 40–45 | 28.17 | 28.12 |
| 45–50 | 33.32 | 33.27 |
| 50–55 | 37.61 | 37.59 |
| Depth Interval (m) | RMSE | MAE |
|---|---|---|
| 0–5 | 6.18 | 5.37 |
| 5–10 | 3.58 | 2.99 |
| 10–15 | 2.41 | 1.58 |
| 15–20 | 4.14 | 3.74 |
| 20–25 | 8.06 | 7.85 |
| 25–30 | 10.54 | 10.22 |
| 30–40 | 12.87 | 12.78 |
| R | R2 | Adjusted R2 | Std. Error of the Estimate |
|---|---|---|---|
| 0.781 | 0.61 | 0.608 | 4.796 |
| D = −508.302 [ln(1000 R’2)/ln(1000 R’3)] + 549.108 | |||
| R | R2 | Adjusted R2 | Std. Error of the Estimate |
|---|---|---|---|
| 0.912 | 0.831 | 0.830 | 2.313 |
| D = −231.543 [ln(1000 R’2)/ln(1000 R’3)] + 244.338 | |||
| Depth Interval (m) | RMSE | MAE |
|---|---|---|
| 0–5 | 1.68 | 1.48 |
| 5–10 | 2.58 | 2.23 |
| 10–15 | 1.85 | 1.50 |
| 15–20 | 2.54 | 2.12 |
| 0–20 | 2.32 | 1.92 |
Disclaimer/Publisher’s Note: The statements, opinions and data contained in all publications are solely those of the individual author(s) and contributor(s) and not of MDPI and/or the editor(s). MDPI and/or the editor(s) disclaim responsibility for any injury to people or property resulting from any ideas, methods, instructions or products referred to in the content. |
© 2023 by the authors. Licensee MDPI, Basel, Switzerland. This article is an open access article distributed under the terms and conditions of the Creative Commons Attribution (CC BY) license (https://creativecommons.org/licenses/by/4.0/).
Share and Cite
Drakopoulou, P.; Panagiotopoulos, I.P.; de Michele, M.; Kapsimalis, V.; Raucoules, D.; Foumelis, M.; Morfis, I.; Livanos, I.; Sakellariou, D.; Vandarakis, D. Cross-Comparison of the “BathySent” Coastal Bathymetry to Sonar Measurements and Ratio Model Technique: Pilot Sites in the Aegean Sea (Greece). Water 2023, 15, 3168. https://doi.org/10.3390/w15183168
Drakopoulou P, Panagiotopoulos IP, de Michele M, Kapsimalis V, Raucoules D, Foumelis M, Morfis I, Livanos I, Sakellariou D, Vandarakis D. Cross-Comparison of the “BathySent” Coastal Bathymetry to Sonar Measurements and Ratio Model Technique: Pilot Sites in the Aegean Sea (Greece). Water. 2023; 15(18):3168. https://doi.org/10.3390/w15183168
Chicago/Turabian StyleDrakopoulou, Paraskevi, Ioannis P. Panagiotopoulos, Marcello de Michele, Vassilios Kapsimalis, Daniel Raucoules, Michael Foumelis, Ioannis Morfis, Isidoros Livanos, Dimitris Sakellariou, and Dimitrios Vandarakis. 2023. "Cross-Comparison of the “BathySent” Coastal Bathymetry to Sonar Measurements and Ratio Model Technique: Pilot Sites in the Aegean Sea (Greece)" Water 15, no. 18: 3168. https://doi.org/10.3390/w15183168


