Abstract
Groundwater function zoning is an important means to ensure that groundwater plays its various functions, which can provide a scientific basis for the protection and development of groundwater resources. Water resources are scarce in the Central Plains Urban Agglomeration (CPUA), so it is of great significance to evaluate groundwater vulnerability and to zone groundwater function in this area. In this study, the resource supply function (RSF), eco-environment function (EEF), and geo-environment function (GEF) of groundwater were analyzed using the analytic hierarchy process (AHP), maximum method, and dominant mark method, so as to divide the shallow groundwater function in the plain of the CPUA. The results show that the reservation areas (32.0%) are distributed in the areas from Luoning County to Yanjin County, Changyuan County to Xinzheng County, and the areas near mountainous in the south of the CPUA. The geological-disaster-prone areas (29.5%) are distributed in the areas from Ruyang County to Luohe City, Weihui County to Jiyuan City, Xingyang County to Changge County, Changyuan County to Yuanyang County, and Kaifeng City. The development and utilization areas (6.4%) are distributed near mountainous areas in the CPUA. The ecologically vulnerable areas (7.5%) are distributed in the east of Kaifeng City and the northeast of Xinxiang City. The conservation areas (24.6%) are distributed in the areas from Ruyang County to Wuyang County, Xinzheng County to Xingyang County, the north of Xuchang City, the east of Luohe City, Kaifeng City, and Xinxiang City. In order to better manage the groundwater, this study evaluates the vulnerability of the groundwater using the DRASTIC model and makes a single indicator sensitivity analysis. The results show that the accuracies of indicators D, A, and I are particularly important for this vulnerability evaluation. According to the groundwater vulnerability and the land use types, some suggestions were put forward. The research results can provide a reference for groundwater management and development in the CPUA and other areas.
1. Introduction
As a natural resource, groundwater is very important to the development of regions and countries. Under the conditions of increasing world population and increasing climate change, human society is facing a series of serious groundwater problems, such as a deterioration in the water quality and increasing scarcity, which seriously affect the sustainable development of human society. Groundwater function zoning is an important basis for sustainable utilization and management of groundwater, which is of great significance to the sustainable development of human society.
Groundwater function refers to the effect of groundwater in quality, quantity, and temporal and spatial distribution on society and environment, mainly including the resource supply function (RSF), eco-environment function (EEF), and geo-environment function (GEF) [1]. RSF refers to the groundwater that has certain conditions of recharge, storage and renewal, and has relatively independent and stable recharge source and groundwater resource supply guarantee ability [2]. EEF refers to the effect of groundwater on the benign maintenance of surface vegetation, lake, wetland or land quality, and a change in the groundwater results in a corresponding change in the eco-environment. GEF refers to the fact that groundwater supports and protects the stability of the geo-environment it exists in, and the geo-environment changes accordingly when groundwater changes [1]. Groundwater function zoning refers to the scientific and comprehensive analysis and estimation of the quantity, quality, temporal, and spatial distribution characteristics and development and utilization conditions of groundwater resources in a certain system, aiming at groundwater development, utilization, and protection planning. It combines with regional hydrogeology and water resources administrative division boundaries, to carry out reasonable function evaluation and zoning of groundwater resource protection, development, and utilization. At the beginning of the 21st century, groundwater function evaluation and zoning began, and corresponding technical specifications have been introduced successively. However, the selection and rating criteria of indicators remain to be discussed [3]. For example, Qu et al. [4] used the dissipation theory to carry out groundwater function zoning in Puyang City, and believed that the evaluation results better represented the main geo-environment problems in this area. Wang et al. [5] created a theoretical method for groundwater function evaluation and regionalization in arid and semi-arid regions in view of how to determine the needs of groundwater ecological function protection areas, basic farmland quality protection areas, and function areas of mining resources in the middle and lower reaches of inland basins in northwest China, and carried out groundwater function zoning in Shiyang River Basin.
The Central Plains Urban Agglomeration (CPUA) is an area lacking in water resources in China. Surface water is not abundant and the degree of groundwater exploitation and utilization is high. After the 1990s, groundwater exploitation accounted for more than 60% of the total water. According to statistics [6,7], in 2021, the per capita water resource of the CPUA was 506.23 m3, which is close to the international water shortage standard (500 m3 per person), and the CPUA belongs to a severely water-scarce region. With the rapid economic development and continuous population growth in the CPUA, the unreasonable exploitation of groundwater and the massive discharge of “three wastes” have led to increasingly serious groundwater pollution. It has become a major challenge for the plain area of the CPUA in the future to ensure that groundwater can meet the water supply demand of the rapidly growing population in the short or long term. In order to reasonably protect and develop the water resources of the CPUA, ensuring the sustainable development of society, economy, resources, and the environment in this area, it is necessary to carry out groundwater vulnerability evaluation to judge the possibility of groundwater pollution and groundwater function zoning to determine the functional use of groundwater.
Therefore, in this study, the plain of the CPUA will be studied, in this area the shallow groundwater function zoning will be conducted by RSF, EEF, and GEF. Thus, providing a scientific basis for the protection, development, and utilization of groundwater in the CPUA, and also providing a reference for the management and development of groundwater in other regions.
2. Study Area
The CPUA is located in the northwest of Henan Province, China, and includes nine cities of Zhengzhou, Luoyang, Kaifeng, Xinxiang, Jiaozuo, Xuchang, Jiyuan, Pingdingshan, and Luohe, with an area of 58,809 km2. The location coordinates are roughly 111°00′–115°30′ E, 33°00′–35°55′ N (Figure 1). The study area belongs to the warm temperate subhumid climate area with obvious continental monsoon climate characteristics. The average annual precipitation is 524–766 mm, which is smaller in the eastern plain and the plain north of the Yellow River, and decreases from south to north (Figure 2a). There are mainly loamy clay, silty sandy clay, silty clayey loam, sandy clayey loam, silty loam, sandy loam, and sandy soils. Loam and sandy soils are the most widely distributed, followed by silty clayey loam and sandy loam (Figure 2b).
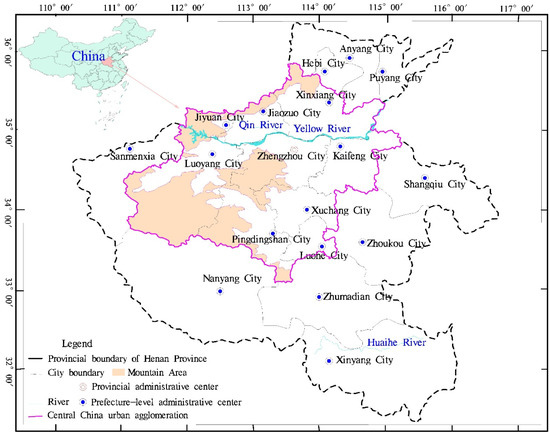
Figure 1.
Location of the study area.
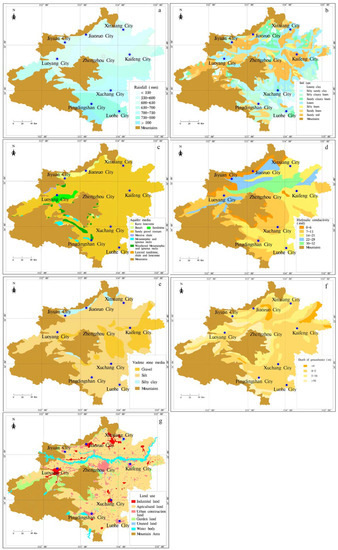
Figure 2.
Conditions of the study area: (a) annual average rainfall; (b) soil type; (c) shallow aquifer; (d) hydraulic conductivity of shallow aquifer; (e) vadose zone media; (f) depth of groundwater; (g) land use.
Shallow aquifers in the study area are mainly composed of sandy gravel strata (Figure 2c). The shallow aquifers have a hydraulic conductivity of 0–32 m/d (Figure 2d), and are mainly recharged by rainfall, and mainly discharged by evaporation, artificial mining, and runoff drainage. The vadose zone above the shallow aquifer is composed of silty clay, silt, and gravel, among which silt is the most widely distributed, followed by gravel (Figure 2e). The depth of groundwater in the west of Xinxiang City and the northeast of Kaifeng City is less than 4 m, and in most areas is 4–8 m, followed by more than 16 m, and then 8–16 m (Figure 2f).
In recent years, the economic development of the study area has been relatively rapid, human activities are frequent, land use types are diverse. Land use types in the study area mainly include industrial land, agricultural land, urban construction land, garden land, and unused land (Figure 2g).
The shallow groundwater pollution in the study area is generally moderate and mild, local groundwater pollution is severe, and there is a small amount of serious pollution. The characteristics of the groundwater pollution are as follows: urban domestic pollution causes groundwater hardness, total dissolved solids and “tri-nitrogen” (ammonia nitrogen, nitrate, and nitrite) exceeding the standard; industrial pollution caused by volatile phenol, chromium, cyanide, and other harmful components exceeded the standard; agricultural pollution caused an increase in ammonia nitrogen, organic nitrogen, heavy metals, and harmful substances. Among these, the nitrogen pollution caused by agricultural activities mainly comes from the application of agricultural fertilizer. When the fertilizer is applied, part of it is absorbed by crops, while the other part stays in the soil and seeps into the ground with the atmospheric precipitation and crop irrigation water, polluting groundwater.
At the same time, a large amount of groundwater exploitation leads to the formation of groundwater depression cones, which further leads to geo-environment problems such as land subsidence and land desertification [8]. Since the 1970s, groundwater overexploitation in the study area has formed different degrees of groundwater level funnels. In Xuchang City, Shangqiu County, Zhengzhou City, and other places, local groundwater depression cones have been formed due to serious overexploitation of groundwater, and overexploitation of groundwater has appeared in most areas. Centralized exploitation has affected the water consumption in the areas adjacent to the water supply source. In addition, land subsidence is caused by overexploitation of groundwater in some areas. According to the preliminary evaluation, land subsidence has occurred in Kaifeng City, Luoyang City, and Xuchang City, with the maximum accumulated subsidence reaching 170 mm [9]. In the area surrounding the saltwater zone, groundwater exploitation is causing the water table to fall, leading to saltwater intrusion into freshwater aquifers.
3. Method
Groundwater resources refer to the groundwater stored in the crust surface for human utilization [10], which is an important part of water resources. Groundwater not only provides water for human production and life, but also plays an important role in ensuring eco-environment safety and maintaining the stability of the geo-environment [11]. In recent years, the over-concentrated exploitation of groundwater in the CPUA has led to the formation of groundwater depression cones in this area, and different degrees of land subsidence have occurred in many areas, and the shallow pore water, deep confined water, and karst water in most cities have been polluted to varying degrees [12], which is different from the previous emphasis on the RSF. Therefore, the RSF, EEF, and GEF of groundwater are considered comprehensively in the groundwater function zoning in this study. As groundwater development and utilization is mainly in the plain area, so this study is aimed at the groundwater function zoning in the plain area.
Taking the shallow groundwater of the plain of the CPUA as the study object, based on the conditions (among them, the data of the geology, hydrogeology, engineering geology, water quantity, and water quality come from Henan Geological Environment Monitoring Institute. The status quo of land desertification and vegetation cover index were derived from the cloud platform of geographical conditions monitoring in 2016) of the CPUA. The shallow groundwater function is evaluated through the three functions of groundwater (RSF, EEF, GEF) and the comprehensive index method, the analytic hierarchy process (AHP), the dominant mark method, and the maximum method. Finally, MapGIS software is used to map the function zoning of shallow groundwater in the study area, and suggestions will be put forward for the development and protection of groundwater.
3.1. RSF Evaluation
To evaluate the RSF, the groundwater quantity should be considered first to ensure the sustainable development and utilization of groundwater. Secondly, we should also consider the groundwater quality requirements, groundwater quality protection is also an important factor to achieve resource security. Therefore, the RSF is evaluated from two aspects: quantity and quality.
3.1.1. Groundwater Quantity Evaluation
Groundwater can be divided into renewable and nonrenewable, and the nonrenewable is mainly deep groundwater [10,13]. This study mainly focuses on shallow groundwater, so the groundwater exploitable modulus is used to evaluate the water quantity of RSF. The groundwater exploitable modulus is defined as the quantity of exploitable groundwater per unit area. The quantity of exploitable groundwater refers to the maximum amount of water allowed to be extracted from aquifers within a foreseeable period of time, under the condition that eco-environment deterioration and geo-environment problems are not caused by economically reasonable and technically feasible measures. To determine the quantity of exploitable groundwater is to seek the balance point between the benefits obtained from groundwater resources exploitation and environmental losses [10,14,15]. Considering that most of the groundwater in mountains is discharged on the surface in the form of river base flow and spring outcrops, and most mountains do not have the conditions for large-scale exploitation and utilization of groundwater, and so the exploitation and utilization of groundwater in mountains will not increase the total amount of water resources available, this study only calculates the shallow groundwater availability in the plain area of the CPUA. The groundwater exploitable modulus in the plain area is calculated using the exploitable coefficient method (Equation (1)):
where is the annual average groundwater recharge (m3/a), is the exploitable coefficient, is the groundwater exploitable modulus (104 m3/km2), and is the area of water resources (km2).
3.1.2. Groundwater Quality Evaluation
Groundwater quality is evaluated according to the national standard “groundwater quality standard” [16]. First of all, this consists of the evaluation of single components, including pH value, total hardness, total dissolved solids, sulfate, chloride, iron, manganese, copper, zinc, molybdenum, cobalt, volatile phenols, permanganate index, nitrate, nitrite, ammonia nitrogen, fluoride, iodide, cyanide, etc., with 19 items in total. According to the classification and limit indicators listed in this standard, the indicator is divided into the classes I, II, III, IV, and IV, from the best to the worst, and the corresponding ratings are 0, 1, 3, 6, and 10, respectively. According to , the comprehensive score of all indicators of a groundwater sample is calculated (Equations (2) and (3)), and the groundwater quality level is divided by this value. Finally, according to the of all shallow groundwater samples, GIS technology is used for spatial interpolation, and then the shallow groundwater quality classification map in the study area is obtained.
where and are the mean and maximum of , respectively, and is the total number of indicators.
According to the groundwater quality and the size of the exploitable modulus, the RSF is evaluated and mapped.
3.2. EEF Evaluation
- (1)
- Indicator selection and rating
The groundwater EEF refers to the function or effect of groundwater on the benign maintenance of terrestrial vegetation, lakes, wetlands, or land quality. In other words, the stronger the EEF is, the more the eco-environment is dependent on groundwater and the more sensitive it is to changes in groundwater. As a result of groundwater overexploitation and the decline in the groundwater table in the CPUA, the eco-environment has deteriorated in some areas, mainly including spring depletion, wetland shrinkage, and land quality change [17]. Baiquan of Huixian County is a natural drainage point of karst water. Since 1978, more than 140 karst wells have been built in the spring domain, and the karst water exploitation has reached 7.360 × 10⁷ m3/a. As a result, the groundwater table has dropped, resulting in frequent flow interruption in Baiquan. Some areas have also seen the disappearance of rivers and swamps, which has made some fish and other creatures lose their habitats. Therefore, the development and utilization of groundwater affects the eco-environment mainly through the decline of the groundwater table. The main effects of groundwater development and utilization on land quality change include land desertification and soil salinization. According to the actual situation of the study area, only land desertification is considered in the evaluation.
Based on the above analysis of the eco-environment problems caused by groundwater overexploitation in the CPUA, considering the relationship between eco-environment problems and groundwater resource development and utilization, depth of groundwater, land desertification situation, ecological function, and vegetation cover index are selected as the evaluation indicators of EEF. The lowering of the groundwater table will lead to the severing of river flow in some areas, and the reduction or disappearance of marshland and wetland areas, leading to the deterioration of the eco-environment. Furthermore, when the depth of groundwater is small, the groundwater is very vulnerable to pollution. Therefore, the lower the depth of the groundwater, the stronger the dependence of the eco-environment above the groundwater on the groundwater. The more serious land desertification is, the more easily the eco-environment is affected by groundwater change. The land desertification area of the CPUA is mainly distributed in Zhengzhou City, Kaifeng City, and Xinxiang City. Different ecological functions have different demands for water resources. The more important the ecological function is, the greater its demand for groundwater, that is, the more dependent it is on groundwater. The environmental maintenance of vegetation reflects the maintenance effect of groundwater on the survival and development of the surface vegetation ecosystem (artificial grassland, natural vegetation, and oasis). In this study, the vegetation cover index is adopted to show the interaction between groundwater and the surface vegetation ecosystem. The lower the vegetation cover index is, the more sensitive the eco-environment of the area is to changes in the groundwater.
- (2)
- Determination of weight
AHP is used to determine the weight of evaluation indicators. The process is carried out in the Yaahp software. AHP is a multi-objective decision-making analysis method combining quantitative and qualitative analysis. Based on in-depth analysis of the nature, influencing factors, and internal relations of complex decision-making problems, it quantifies the decision-making thinking process of decision makers using less quantitative information. It not only considers the subjective judgment of evaluators, but also quantifies the decision-making thinking process of decision makers. In addition, various complex factors of the evaluation object are expressed in a hierarchical structure and evaluated and analyzed layer by layer, which is suitable for application in complex multi-factor problems that are interrelated and mutually restricted [18]. AHP first divides the problem into a target layer, criterion layer, and indicator layer, and then constructs the indicators judgment matrix according to the importance of indicators, and preliminarily calculates the weights of the indicators. Then, the consistency ratio (CR) of the judgment matrix is determined to verify the rationality of the weight obtained (when CR < 0.1, the weight is reasonable), and the weights of the indicators are finally determined.
Groundwater overexploitation is serious in the CPUA which has produced groundwater depression cones to varying degrees, resulting in common eco-environment problems. Therefore, the depth of groundwater has a relatively large impact on the EEF, that is, it takes a larger weight in the EEF evaluation. The study area has a small area of land desertification, so it is less affected by land desertification, and the impact of land desertification on groundwater EEF is relatively small. Firstly, a judgment matrix of the evaluation indicators is established according to the importance of each indicator analyzed above, and then the CR value is calculated to obtain the final weights.
According to the ratings and weights, the of EEF is calculated by the comprehensive index method (Equation (4)) and graded equally from large to small and mapped.
where is the comprehensive index and is the rating of indicator ; is the weight of indicator ; and is the total number of indicators.
3.3. GEF Evaluation
The influence of groundwater on the geo-environment is mainly that the development and utilization of groundwater affects the stability of the crust and the occurrence of geo-environment problems. The stronger the GEF, the more the change in groundwater can affect the geo-environment, that is, the more sensitive the geo-environment is to the change in groundwater. In the study area, the geo-environment problems caused by unreasonable groundwater development mainly include groundwater pollution, saline water intrusion, and land subsidence. Therefore, this study selected depth of groundwater, salt water situation, regional crustal stability, and type of rock and soil mass as the evaluation indicators of GEF. According to certain grading standards, the four evaluation indicators are divided into three classes and rated, which correspond to the strong, moderate, and weak GEFs, respectively.
AHP is used to calculate the weight of each evaluation indicator. In the study area, the main geo-environment problems caused by the continuous lowering of the groundwater table include salt water intrusion and land subsidence, so the depth of the groundwater is relatively important. The influence of groundwater development and utilization on the crust stability is mainly due to the development of groundwater during the implementation of major projects, so the influence is relatively small for the whole study area. Similarly, a judgment matrix is established and verified to obtain the final weight.
According to the ratings and weights of the indicators, the of GEF is calculated (Equation (4)) and graded equally into three classes from high to low and mapped.
3.4. Groundwater Function Zoning
Different classes of RSF, EEF, and GEF correspond to different groundwater development and utilization prospects (Table 1). Groundwater function is evaluated using the dominant mark method. The dominant mark method, also known as the dominant factor method, refers to the selection of dominant factors that have symbolic significance for zoning on the basis of a comprehensive analysis of the combination or the interaction of factors. It is the most commonly used method in zoning studies [1,19]. On the basis of the evaluation of three groundwater functions, the relationship between groundwater functions is comprehensively compared to determine the dominant function of groundwater utilization in the evaluation area and the development and utilization prospect. According to the needs of exploitation and utilization of groundwater resources and the objectives of protection and maintenance of the eco-environment and geo-environment, refer to relevant studies [20,21], groundwater function zoning criteria are established, and groundwater function zoning is implemented.

Table 1.
Prospects of development and utilization for three groundwater functions at different categories.
4. Results
4.1. RSF
4.1.1. Groundwater Quantity Evaluation Results
The exploitable coefficient adopts empirical values, which are generally related to lithology and the characteristics of the groundwater. The values for loose rock pore water areas are generally 0.75 to 0.85, carbonate rock karst fissure water areas are generally 0.45 to 0.55, and bedrock fissure water areas are generally 0.35 to 0.45 [22]. According to the obtained data, the exploitable coefficient method (Equation (1)) is used to calculate the groundwater exploitable quantity of each calculation unit in the CPUA, and the groundwater exploitable modulus of each water resource unit (Table 2). The exploitable modulus is divided into three classes (Figure 3): large (>200,000 m3/km2), moderate (150,000–200,000 m3/km2) and small (<150,000 m3/km2).
Table 2.
Exploitable modulus of groundwater in the study area.
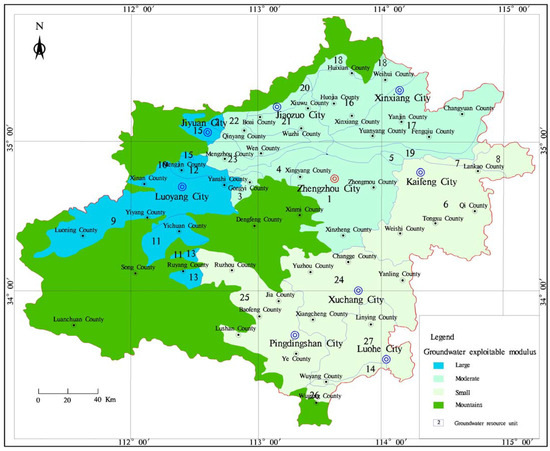
Figure 3.
Groundwater resource units and exploitable modulus of the study area.
It can be seen from Figure 3 that the areas with a small groundwater exploitable modulus are in the south of the study area, mainly Kaifeng City, Xuchang City, Luohe City, and Pingdingshan City. The areas with a moderate groundwater exploitable modulus are in the north of the study area, mainly including Jiaozuo City, Xinzheng County, and Zhengzhou City. The areas with a large groundwater exploitable modulus are mainly Jiyuan City and Luoyang City.
4.1.2. Groundwater Quality Evaluation Results
Based on the comprehensive water quality rating F (calculated by Equations (2) and (3)), the groundwater quality is graded (good: 0.80–2.50; moderate: 2.50–4.25; relatively poor: 4.25–7.2; poor: >7.2) and mapped (Figure 4). According to Figure 4, areas with good and moderate water quality, accounting for 36.2% of the study area, are mainly distributed in the areas from Luoning County to Yanshi County, Xingyang County to Changge County, Ruzhou City to Changping County, Jiyuan City, and Linying County. The areas with relatively poor water quality are the largest, accounting for 60.8%, mainly distributed in the plain area north of the Yellow River, the areas from Zhengzhou City to Luohe City, and Ruyang County to Wuyang County. The areas with poor water quality are the smallest, accounting for 3.0%, mainly distributed in the areas from Huojia County to Xinxiang County, Wen County, and Weihui City.
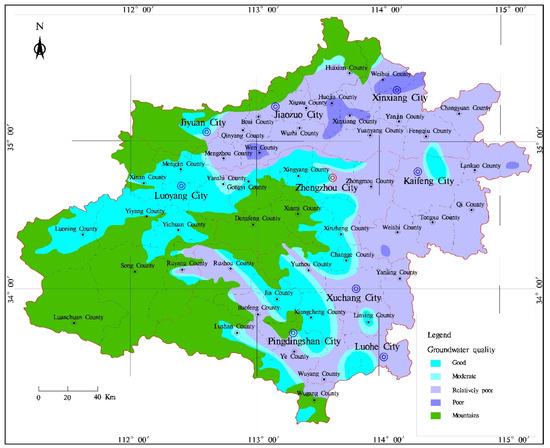
Figure 4.
Groundwater quality of the study area.
4.1.3. RSF Evaluation Results
The groundwater quality is rated as 4, 3, 2, and 1 from good to extremely poor. The groundwater exploitable modulus is graded from large to small as 3, 2, and 1. The RSF is rated as 3, 2, and 1 from strong to weak. After overlaying the groundwater quality evaluation map and the groundwater exploitable modulus classes map, the RSF is evaluated and mapped (Figure 5) based on the evaluation rules (Table 3).
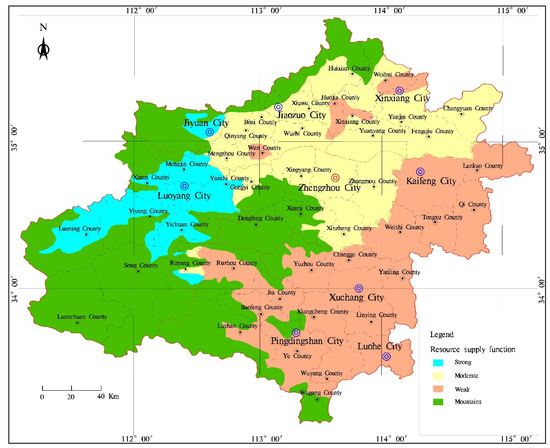
Figure 5.
Groundwater RSF of the study area.
Table 3.
Groundwater RSF evaluation criteria of the study area.
As can be seen from Figure 5, areas with strong RSF are the smallest area, accounting for 14.4% of the study area, distributed in Luoyang City and Jiyuan City. Areas with moderate RSF are the second, accounting for 37.6%, mainly distributed in Jiaozuo City, Xinxiang City, Zhengzhou City, and Ruyang County. Areas with weak RSF are the largest, accounting for 48.0%, mainly distributed in Pingdingshan City, Luohe City, Xuchang City, Kaifeng City, Wen County, Huojia County, Xinxiang County, and Weihui County.
4.2. EEF
Referring to the relevant literature [3,4], the indicators are graded as 3, 2, and 1 based on their impact on the EEF of groundwater, from large to small (Table 4). The weight values of the depth of groundwater, land desertification, ecological function zoning, and vegetation cover index calculated by AHP are 0.395, 0.141, 0.232, and 0.232, respectively. Using the comprehensive index method, the of the EEF is calculated to be 1.0 to 3.0, which is evenly divided into three classes from large to small, corresponding to strong, moderate, and weak EEFs of groundwater (Figure 6). As can be seen from Figure 6, areas with a strong EEF of groundwater are the smallest, accounting for 8.4% of the CPUA, distributed in Kaifeng City and Xinxiang City. Areas with a moderate EEF of groundwater are the largest, accounting for 46.5% of the CPUA, mainly located in the southeast and northeast of the study area. The low EEF areas of groundwater, accounting for 45.1% of the CPUA, are mainly distributed in the middle and west of the CPUA.
Table 4.
Indicator ratings of groundwater EEF.
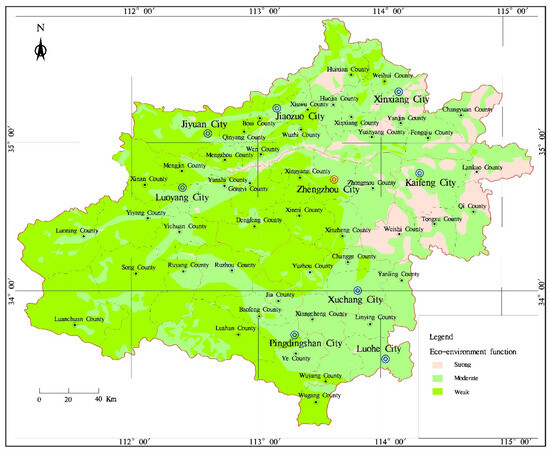
Figure 6.
Groundwater EEFs of the study area.
4.3. GEF
According to the contribution to the GEF, the depth of groundwater, salt water distribution, regional crustal stability, and rock and soil mass types are divided into three classes, with ratings of 3, 2, and 1, respectively. The greater the contribution, the higher the rating (Table 5).
Table 5.
Indicator ratings of groundwater GEF.
The weights of the depth of groundwater, salt water distribution, regional crustal stability, and rock and soil mass type calculated using the Yaahp software are 0.391, 0.195, 0.138, and 0.276, respectively. Using the comprehensive index method, the of the groundwater GEF is calculated to be 1.0 to 3.0, which is divided into three classes from large to small, corresponding to strong, moderate, and weak GEFs, respectively (Figure 7).
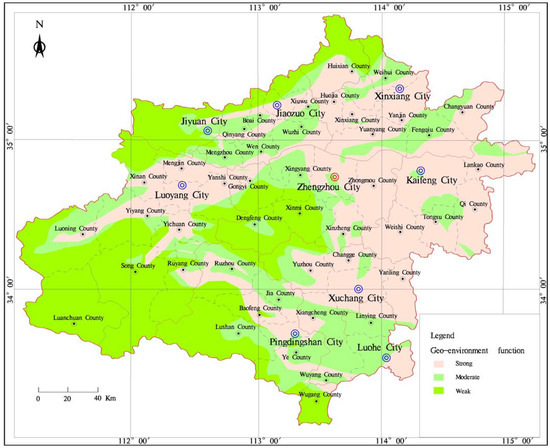
Figure 7.
Groundwater GEFs of the study area.
As can be seen from Figure 7, most of the areas with a weak GEF of groundwater, accounting for 33.0% of the CPUA, are distributed in mountainous areas. Areas with a moderate GEF of groundwater, accounting for 25.4% of the CPUA, are mainly distributed in the areas from Mengzhou County to Xiuwu County, Yuanyang County to Changyuan County, Yichuan County to Luohe City, Tongxu County to Qi County, and in the vicinity of mountains. Areas with a strong GEF of groundwater are the largest, accounting for 41.6% of the CPUA, and are basically distributed in the plain areas.
4.4. Groundwater Function Zoning Results
The RSF, EEF, and GEF of the CPUA are rated 3, 2, and 1 from strong to weak. With reference to relevant literature [3,23,24,25], using the dominant mark method, the criteria for groundwater function zoning of the study area are obtained (Table 6), and the study area is divided into development and utilization areas, ecologically vulnerable areas, conservation areas, geological-disaster-prone areas, and reservation areas (Figure 8).
Table 6.
Criteria for groundwater function zoning of the study area.
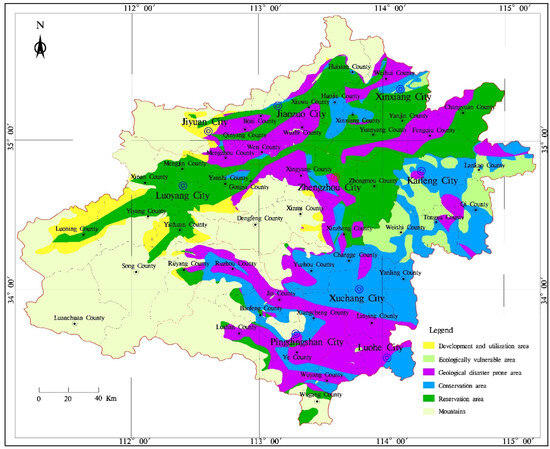
Figure 8.
Groundwater functions of the study area.
It can be seen (Figure 8) that the reservation areas are the largest, accounting for 32.0% of the study area, and distributed in the areas from Luoning County to Yanjin County, Changyuan to Xinzheng County, and in the vicinity of the mountains in the south. The geological-disaster-prone areas are the second largest, accounting for 29.5% of the study area, distributed in the areas from Ruyang County to Luohe City, Changyuan County to Yuanyang County, and Kaifeng City. The development and utilization areas accounting for 6.4%, are distributed in the vicinity of the mountains. The ecologically vulnerable areas accounting for 7.5%, are distributed in Kaifeng City and the east of Xinxiang City. The conservation areas accounting for 24.6%, are distributed in the areas from Ruyang County to Wuyang County, Xinzheng to Xingyang County, Kaifeng City, Xinxiang City, the east of Luohe City, and the north of Xuchang City.
5. Discussions
5.1. Groundwater Vulnerability
Groundwater vulnerability refers to the possibility of groundwater pollution under the action of natural conditions or human activities [26]. Groundwater vulnerability evaluation can classify the groundwater vulnerability in different regions and identify the potential of groundwater pollution, which is an important basic work for rational development, utilization, and protection of groundwater resources and an important basis for prevention and control measures of groundwater pollution [27,28,29,30]. The evaluation methods of groundwater vulnerability mainly include the overlay index method, process simulation method, and statistical methods [30,31,32]. Among them, the overlay index method is a commonly used method with advantages such as simplicity and easy acquisition of data [30,31]. The DRASTIC model is the most widely applied and mature model in the overlay index method [33,34]. It selects seven representative indicators (depth of groundwater (D), net recharge (R), aquifer media (A), soil media (S), topography (T), impact of vadose zone (I), and hydraulic conductivity of aquifer (C), and their weights are 5, 4, 3, 2, 1, 5, 3, respectively. Different categories of each evaluation indicator are rated on a scale of 1–10. The smaller the rating, the lower the groundwater vulnerability [27]. Then, groundwater vulnerability index is calculated to evaluate the groundwater vulnerability.
Usually, net recharge is replaced by rainfall because data are difficult to obtain [35,36]. Among the seven indicators, D determines the shortest path for pollutants to enter the groundwater from the surface. The deeper the depth of the groundwater is, the harder it is for pollutants to reach the groundwater, that is, the lower the groundwater vulnerability is. R and T determine the infiltration amount of water from the surface. As the carrier of pollutants, the infiltration amount of water determines that of pollutants. The smaller the R is and the larger the topographic slope is, the smaller the pollutant infiltration is and the lower the groundwater vulnerability is. S, I, and A affect the transport rate of pollutants from the surface, mainly through the type and size of media particles, thus affecting the groundwater vulnerability. The finer the particles are, the smaller the rate of pollutants passing through, and the longer they stay in the surface water, the more likely they are to be degraded. As a result, the groundwater is less susceptible to pollution, that is, the lower the groundwater vulnerability. C is considered to be an important factor affecting the diffusion of pollutants in groundwater. The smaller C is, the less easily the pollutants in groundwater diffuse, that is, the lower the groundwater vulnerability.
Based on the situation of the study area and referring to the relevant literature [28,35,37,38], each evaluation indicator of the DRASTIC model is rated as 1, 3, 5, and 7, corresponding to different categories of indicators. The greater the rating, the greater the contribution to groundwater vulnerability (Table 7). The groundwater vulnerability indexes calculated by the comprehensive index method (Equation (4)) are 47–145 for the DRASTIC model, which is divided into four classes from low to high, corresponding to extremely low, low, moderate, and high vulnerability. It can be seen from the groundwater vulnerability map (Figure 9) that the extremely low vulnerability areas are distributed in the northeast of Jiyuan City, Lushan County, the areas from Xin’an County to Mengjin County, and the areas near the mountains in the middle of CPUA, with an area of 365.2 km2, accounting for 1.0% of the study area. The low vulnerability areas are distributed in the areas from Fengqiu County to Changyuan County and the areas near mountains, with an area of 5773.3 km2, accounting for 15.0% of the study area. The moderate vulnerability areas are distributed in Xinxiang City, Luoyang City, Xuchang City, Jiaozuo City, and Luohe City, with an area of 23,321.3 km2, accounting for 60.6%. The high vulnerability areas are distributed in the east and south of Kaifeng City, northeast of Luoyang City, south of Xuchang City, north of Luohe City, east of Zhengzhou City, and southeast of Pingdingshan City, covering an area of 9004.8 km2, accounting for 23.4%.
Table 7.
Ratings of DRASTIC model indicators.
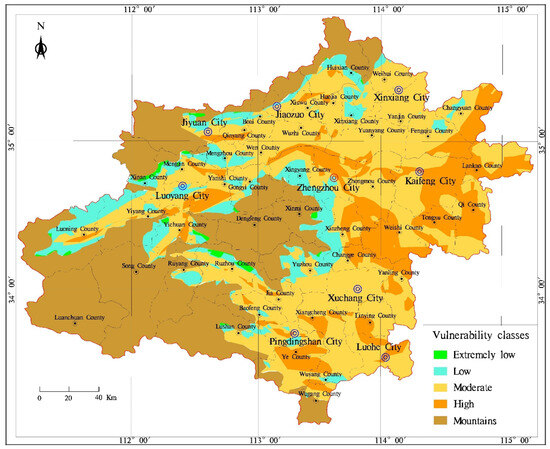
Figure 9.
Groundwater vulnerability from DRASTIC model.
Single indicator sensitivity can indicate the contribution of a single indicator to the evaluation result using an effective weight, and judge the importance of the indicator’s accuracy to the evaluation. The effective weight of indicator is calculated using Equation (5). Sensitivity analysis of single indicators for the DRASTIC model (Table 8) show that the effective weights of A, S, T, and I (18.49%, 8.87%, 7.01%, and 25.14%, respectively) are higher than the theoretical weights (13.04%, 8.70%, 4.35%, and 21.74%, respectively). The effective weights of other indicators are lower than their theoretical weights. The theoretical and effective weights of D, A, and I are high, indicating that these indicators have a great influence on the groundwater vulnerability, and their accuracy is more important for the groundwater vulnerability evaluation.
Table 8.
Single indicator sensitivity analysis of DRASTIC model.
5.2. Human Activities, Groundwater Vulnerability, and Groundwater Function Zoning
Groundwater vulnerability indicates the possibility of groundwater pollution, while land use types indicate certain human activities and possible pollution sources. Combining groundwater vulnerability, land use types, and groundwater function zoning can manage and utilize groundwater more reasonably.
Geological-disaster-prone areas are widely distributed, and in these areas possible geological disasters include ground subsidence, land desertification, and other groundwater-related disasters. Therefore, in these areas, special attention should be paid to the exploitation of groundwater, and groundwater cannot be allowed to be overexploited to form groundwater depression cones. Measures should be taken to improve the situation in areas where groundwater depression cones have formed, such as saving water and collecting precipitation during the rainy season. The groundwater vulnerability in the geological-disaster-prone areas is mainly low, moderate, and high. In these areas, the land types are mainly urban construction land and agricultural land. The low vulnerability of groundwater does not mean that it will not be polluted, and attention should also be paid to preventing groundwater pollution when paying attention to preventing geological disasters.
The ecology of ecologically vulnerable areas is relatively vulnerable, and the main land used type is agricultural land. During agricultural irrigation, more water should be saved, and attention should be paid not to cause ecological damage when developing and utilizing groundwater. The groundwater vulnerability in these areas is moderate or high. While protecting the ecology from damage, it is necessary to strictly control the discharge of pollutants to avoid causing groundwater pollution.
Reservation areas are areas where the current level of groundwater development is not high and are reserved for the sustainable use of water resources in the future. In these areas, the land use types are agricultural land and industrial land, and the groundwater vulnerability is low, moderate, and high, attention should be paid to the use of fertilizers, and the discharge of industrial pollutants.
The development and utilization areas are designed to meet industrial and agricultural production, urban life, etc. The land use types in these areas are mainly garden land and agricultural land. Despite the low groundwater vulnerability in this area, attention should be paid to the use of fertilizers, etc.
Conservation areas are areas where groundwater development is restricted in order to maintain a certain amount of gushing water from important springs or to conserve water sources. In these areas, the land use type is agricultural land and the groundwater vulnerability classes are moderate and high; attention should be paid to the use of fertilizers and pesticides.
6. Conclusions
This study conducts a function zoning of shallow groundwater in the plain area of the CPUA using the RSF, EEF and GEF. The results show that the reservation areas are the largest (32.0%), and distributed in the areas from Luoning County to Yanjin County, Changyuan to Xinzheng County, and in the vicinity of mountainous regions in the south. The geological-disaster-prone areas (29.5%) are distributed in the areas from Ruyang County to Luohe City, Changyuan County to Yuanyang County, and Kaifeng City. The development and utilization areas (6.4%) are distributed in the vicinity of mountainous areas. The ecologically vulnerable areas (7.5%) are distributed in Kaifeng City and the east of Xinxiang City. The conservation areas (24.6%) are distributed in the areas from Ruyang County to Wuyang County, Xinzheng to Xingyang County, Kaifeng City, Xinxiang City, the east of Luohe City, and the north of Xuchang City.
In order to better manage groundwater, this study used the DRASTIC model to evaluate the vulnerability of shallow groundwater in the study area and made a single indicator sensitivity analysis. The results show that the high, medium, low, and extremely low vulnerability areas account for 23.4%, 60.6%, 15.0%, and 1.0%, respectively, and the accuracies of D, A, and I are particularly important for groundwater vulnerability evaluation.
Based on the land use type, the groundwater vulnerability map, and groundwater function zoning map, scientific and reasonable suggestions for groundwater development and protection are proposed in the CPUA.
Author Contributions
Conceptualization, C.M. and X.H.; methodology, C.M. and X.H.; software, X.H., X.G. and Y.L.; validation, X.H., X.G. and Y.L.; formal analysis, H.X.; investigation, X.H. and C.M.; resources, C.M.; data curation, C.M.; writing—original draft preparation, X.H.; writing—review and editing, X.H., X.G., H.X. and Y.L.; visualization, X.H., H.X., Y.Q. and H.C.; supervision, X.H.; project administration, C.M.; funding acquisition, C.M. All authors have read and agreed to the published version of the manuscript.
Funding
This study was supported by the National Natural Science Foundation of China (No. 41572212).
Data Availability Statement
Where data is unavailable due to privacy.
Acknowledgments
This study was supported by the project of Comprehensive Evaluation and Zoning of Resources and Environment Carrying Capacity of Central Urban Agglomeration and the National Natural Science Foundation of China (No. 41572212).
Conflicts of Interest
The authors declare no conflict of interest.
References
- Zhang, G.; Shen, J.; Nie, Z.; Wang, J.; Yan, M.; Hao, M. Theory and methodology of regional groundwater function and sustainable utilization assessment in China. Hydrogeol. Eng. Geol. 2006, 71, 62–66. [Google Scholar]
- Sherif, M.; Sefelnasr, A.; Ebraheem, A.A.; Mulla, M.A.; Alzaabi, M.; Alghafli, K. Spatial and Temporal Changes of Groundwater Storage in the Quaternary Aquifer, UAE. Water 2021, 13, 864. [Google Scholar] [CrossRef]
- Tan, M. Research on the Shallow Groundwater Functional Zoning of Jinjiang Based on GIS; Nanjing Normal University: Nanjing, China, 2011. [Google Scholar]
- Qu, J.; Zhang, Y.; Zou, X. Evaluation of groundwater function in Puyang City based on dissipation theory. Water Resour. Hydropower Eng. 2019, 50, 70–77. [Google Scholar]
- Wang, J.; Zhang, G.; Cui, H.; Wang, Q.; Dong, H.; Hao, J. System index attribute and application of groundwater function zoning in northwest inland area of China. J. Hydraul. Eng. 2020, 51, 796–804. [Google Scholar]
- Chen, H.; Cui, G. Henan Statistical Yearbook 2022. China Statistics Press: Beijing, China, 2023. [Google Scholar]
- Yang, M.; Zhang, H.; Li, Y.; Zhou, Z.; Wu, X.; Wu, Y.; Xiao, H.; Xia, Q.; Yang, S.; Wang, W.; et al. 2021 He Nan Water Resources Bulletin; Henan Water Conservancy Department: Zhengzhou, China, 2022. [Google Scholar]
- Zhou, Z.; Xu, Z. Research on the Exploitation and Utilization of Groundwater in Henan Province. China Rural. Water Hydropower 2014, 12, 27–30. [Google Scholar]
- Du, J.; Jin, M.; Luo, Y.; Wei, X. Assessment index system for shallow groundwater function: A case study on the plain and hummock of Henan Province. Water Resour. Prot. 2007, 96, 89–92. [Google Scholar]
- Zhang, R. Characteristics of groundwater resources and their reasonable development. Hydrogeol. Eng. Geol. 2003, 30, 1–5. [Google Scholar]
- Guo, Z.; Liu, H. Eco-depth of Groundwater Table for Natural Vegetation in Inland Basin, Northwestern China. J. Arid. Land Resour. Environ. 2005, 19, 157–161. [Google Scholar]
- Cui, X.; Xu, Z. Evaluation of groundwater-overdraft regions in main cities of Henan Province. Water Resour. Prot. 2008, 27, 17–22. [Google Scholar]
- Chen, Z.; Hao, H.; Wei, W.; Chen, J.; Zhang, F.; Wang, Y. Groundwater Renewal and Characteristics in the Deep Confined Aquifer in North China Plain. Resour. Sci. 2009, 31, 388–393. [Google Scholar]
- Roseta-Palma, C. Joint Quantity/Quality Management of Groundwater. Environ. Resour. Econ. 2003, 26, 89–106. [Google Scholar] [CrossRef]
- Wang, J.; Wang, C.; Teng, Y. Review on assessment methods of groundwater sustainable yield. J. Hydraul. Eng. 2006, 37, 525–533. [Google Scholar]
- MLRMWR (The Ministry of Land and Resources and the Ministry of Water Resources of the People’s Republic of China). Quality Standards for Groundwater; General Administration of Quality Supervision, Inspection and Quarantine of the People’s Republic of China; China National Standardization Administration: Beijing, China, 2017. [Google Scholar]
- Xu, Z. Development and Utilization of Underground Water Resources and Ecological Environment in Henan Province. In Proceedings of the Forum on Water Environment of Some Cities in the Yellow River Basin; 2008; pp. 32–43. [Google Scholar]
- Saaty, T.L. Decision making—The Analytic Hierarchy and Network Processes (AHP/ANP). J. Syst. Sci. Syst. Eng. 2004, 13, 1–35. [Google Scholar] [CrossRef]
- Geng, S. The Method Study on Integrated Physicogeographical Regionalization of Fengxian Based on GIS; Xi’an University of Science and Technology: Xi’an, China, 2018. [Google Scholar]
- Chen, X.; Fan, J.; Sun, W.; Tao, A.; Liang, Y. A Literature Review of Research on Territorial Function ldentifying. Geogr. Geo-Inf. Sci. 2013, 29, 72–79. [Google Scholar]
- Nian, P.; Cai, Y.; Ma, S.; Zhuang, L.; Zhang, L. Review of Spatial Comprehensive Zoning in China. China Land Sci. 2014, 28, 20–25. [Google Scholar]
- Jiang, X. The Study of Groundwater Resources Evaluation and Development Mode in Eastern Mountain of Jilin Province Zone; Jilin University: Changchun, China, 2017. [Google Scholar]
- Guo, X.; Ma, C.M.; Hu, X.J.; Hu, X.J.; Yan, W. Application of groundwater functional zoning to coastal groundwater management: A case study in the plain area of Weifang City, China. Environ. Earth Sci. 2019, 78, 525. [Google Scholar] [CrossRef]
- Xie, J.; You, J.; Jiang, J. Using level difference maximization method to calculate combined weights for groundwater function evaluation. Water Resour. Prot. 2021, 37, 54–59. [Google Scholar]
- MHURD (Ministry of Housing and Urban-Rural Development of the People’s Republic of China). Standard for Water Function Zoning; Ministry of Housing and Urban-Rural Development of the People’s Republic of China; General Administration of Quality Supervision, Inspection and Quarantine of the People’s Republic of China: Beijing, China, 2010. [Google Scholar]
- Vrba, J.; Zaporozec, A. Guidebook on mapping groundwater vulnerability. Int. Contrib. Hydrogeol. 1994, 16, 131p. [Google Scholar]
- Association, N.W.W. DRASTIC: A Standardized System for Evaluating Ground ater Pollution Potential Using Hydrogeologic Settings; U. S. Environmental Protection Agency: Washington, DC, USA, 1987. [Google Scholar]
- Chen, H. Groundwater Vulnerability Assessment Based on Thecombine of DRASTIC Model and ArcGIS; China University of Geosciences (Beijing): Beijing, China, 2018. [Google Scholar]
- Guo, J.; Zhao, L.; Liu, N. Study on the ability of blocking pollutants in the vadose zone based on DRASTIC. Environ. Pollut. Control 2011, 33, 52–55. [Google Scholar]
- Zhan, J.; Qu, J. Establishment of Groundwater Vulnerability Index System. J. Anhui Agric. Sci. 2016, 44, 59–61. [Google Scholar]
- Hu, X.; Ma, C.; Qi, H.; Guo, X. Groundwater vulnerability assessment using the GALDIT model and the improved DRASTIC model: A case in Weibei Plain, China. Environ. Sci. Pollut. Res. 2018, 25, 32524–32539. [Google Scholar] [CrossRef] [PubMed]
- Kumar, P.; Bansod, B.K.S.; Debnath, S.K.; Thakur, P.K.; Ghanshyam, C. Index-based groundwater vulnerability mapping models using hydrogeological settings: A critical evaluation. Environ. Impact Assess. Rev. 2015, 51, 38–49. [Google Scholar] [CrossRef]
- Beaujean, J.; Lemieux, J.M.; Dassargues, A.; Therrien, R.; Brouyère, S. Physically Based Groundwater Vulnerability Assessment Using Sensitivity Analysis Methods. Groundwater 2014, 52, 864–874. [Google Scholar] [CrossRef] [PubMed]
- Nadiri, A.A.; Norouzi, H.; Khatibi, R.; Gharekhani, M. Groundwater DRASTIC vulnerability mapping by unsupervised and supervised techniques using a modelling strategy in two levels. J. Hydrol. 2019, 574, 744–759. [Google Scholar] [CrossRef]
- Jamrah, A.; Al-Futaisi, A.; Rajmohan, N.; Al-Yaroubi, S. Assessment of groundwater vulnerability in the coastal region of Oman using DRASTIC index method in GIS environment. Environ. Monit. Assess. 2008, 147, 125–138. [Google Scholar] [CrossRef] [PubMed]
- Sherif, M.M.; Ebraheem, A.M.; Al Mulla, M.M.; Shetty, A.V. New System for the Assessment of Annual Groundwater Recharge from Rainfall in the United Arab Emirates. Environ. Earth Sci. 2018, 77, 412. [Google Scholar] [CrossRef]
- Norouzi, H.; Moghaddam, A.A.; Celico, F.; Shiri, J. Assessment of groundwater vulnerability using genetic algorithm and random forest methods (case study: Miandoab plain, NW of Iran). Environ. Sci. Pollut. Res. 2021, 28, 39598–39613. [Google Scholar] [CrossRef]
- Guo, X.; Yang, Z.; Li, C.; Xiong, H.; Ma, C. Combining the classic vulnerability index and affinity propagation clustering algorithm to assess the intrinsic aquifer vulnerability of coastal aquifers on an integrated scale. Environ. Res. 2023, 217, 114877. [Google Scholar] [CrossRef]
Disclaimer/Publisher’s Note: The statements, opinions and data contained in all publications are solely those of the individual author(s) and contributor(s) and not of MDPI and/or the editor(s). MDPI and/or the editor(s) disclaim responsibility for any injury to people or property resulting from any ideas, methods, instructions or products referred to in the content. |
© 2023 by the authors. Licensee MDPI, Basel, Switzerland. This article is an open access article distributed under the terms and conditions of the Creative Commons Attribution (CC BY) license (https://creativecommons.org/licenses/by/4.0/).