Article

Snow Albedo Reduction in the Colombian Andes Mountains Due to 2000 to 2020 Saharan Dust Intrusions Events

by
Tomás R. Bolaño-Ortiz
1,*,
Viverlys L. Díaz-Gutiérrez
2,3,*,
Andrés M. Vélez-Pereira
4,5,
Eliana L. Vergara-Vásquez
2,3,* and
Yiniva Camargo-Caicedo
2,3
1
School of Natural Resources Engineering, Department of Agricultural Science, Universidad Católica del Maule, Curicó 3341695, Chile
2
Programa de Ingeniería Ambiental y Sanitaria, Facultad de Ingeniería, Universidad del Magdalena, Santa Marta 470004, Colombia
3
Grupo de Investigación en Modelación de Sistemas Ambientales (GIMSA), Facultad de Ingeniería, Universidad del Magdalena, Santa Marta 470004, Colombia
4
Departamento de Ingeniería Mecánica, Facultad de Ingeniería, Universidad de Tarapacá, Avenue 18 de Septiembre 2222, Arica 1000007, Chile
5
Laboratorio de Investigaciones Medioambientales de Zonas Áridas, Facultad de Ingeniería, Universidad de Tarapacá, Arica 1000007, Chile
*
Authors to whom correspondence should be addressed.
Water 2023, 15(17), 3150; https://doi.org/10.3390/w15173150
Submission received: 1 February 2023 / Revised: 20 August 2023 / Accepted: 22 August 2023 / Published: 3 September 2023
(This article belongs to the Special Issue The Role of Snow in High-Mountain Hydrologic Cycle)

Abstract

:
This article investigates the snow albedo changes in Colombian tropical glaciers, namely, Sierra Nevada de Santa Marta (SNSM), Sierra Nevada del Cocuy (NSC), Nevado del Ruíz (NDR), Nevado Santa Isabel (NDS), Nevado del Tolima (NDT), and Nevado del Huila (NDH). They are associated with the possible mineral dust deposition from the Sahara Desert during the June and July months using snow albedo (SA), snow cover (SC), and land surface temperature (LST) from the Moderate Resolution Imaging Spectroradiometer (MODIS) aboard NASA’s Terra and Aqua satellites. And mineral dust (MD) from The Modern-Era Retrospective Analysis for Research and Applications, version 2 (MERRA-2), both of them during 2000–2020. Results show the largest snow albedo reductions were observed at 39.39%, 32.1%, and 30.58% in SNC, SNSM, and NDR, respectively. Meanwhile, a multiple correlation showed that the glaciers where MD contributed the most to SA behavior were 35.4%, 24%, and 21.4% in NDS, NDC, and NDR. Results also display an increasing trend of dust deposition on Colombian tropical glaciers between 2.81 × 10⁻³ µg·m−2·year−1 and 6.58 × 10⁻³ µg·m−2·year−1. The results may help recognize the influence of Saharan dust on reducing snow albedo in tropical glaciers in Colombia. The findings from this study also have the potential to be utilized as input for both regional and global climate models. This could enhance our comprehension of how tropical glaciers are impacted by climate change.

1. Introduction

Atmospheric mineral dust is a vital component of the Earth’s climate system [1]. It is an important source of trace metals, nutrients, and biological material for mountain ecosystems [2] and is mobilized and transported under specific climatic regimes [3]. Mineral dust can absorb and scatter incoming solar radiation and outgoing thermal radiation, which is known as direct radiative forcing of dust [4,5]. A positive radiative forcing causes a warming of the atmosphere; a negative radiative forcing, a cooling of the atmosphere [6]. However, dust radiative forcing causes a faster and earlier peak outflow of melted snow [7].
Glaciers, as the largest component of the cryosphere, are currently experiencing dramatic melting attributed to increasing temperatures and decreasing snow accumulation [8]. Aeolian dust is one of the key factors for accelerated glacier melting [9], dust loading significantly reduces albedo [8,10,11], what influences the magnitude and timing of snowmelt runoff [12], and ferric oxide minerals and carbonaceous matter appear to be the main influences on snowpack albedo reduction [13]. This is because dust and carbonaceous particles are heated by the absorption of solar radiation and, in turn, heat the surrounding snow mainly through conduction to adjoining snow grains [14], which influences regional water resources, ecological environmental security, and climate change [15].
On the glacier surface, especially in the ablation zone, wind-blown dust particles, often combined with biogenic materials, can aggregate to form cryoconite after melting [16]. Cryoconites are airborne sediments that accumulate on the surface of glaciers [17], and they are formed by mycobial activity [8]. The formation of mineral cryoconite deposited on glaciers depends on the sources and transport processes of aeolian dust surrounding glaciers [18]. A study conducted by Stibal et al. (2017) [19] concluded that ablation of the Greenland ice sheet surface is amplified by surface darkening caused by light-absorbing impurities such as mineral dust, among others. However, little research has been done on the effects of dust particles (mainly wind dust deposition on snow and ice from atmospheric transport) on the physicochemistry of glacier meltwater runoff [20].
Wind processes are important sources of particulate matter [21], the Sahara Desert is the main source of dust for the Earth’s atmosphere [22,23], and North African dust hotspots located in the Sahara are responsible for 50% to 70% of the global mineral dust budget. Dust-laden air masses originating from these sources can be transported over long distances and can also affect remote areas, such as North and South America, Europe, and the Middle East [1]. Saharan dust inputs affect current ecosystems and biogeochemical cycles on a global scale [24]. A study conducted in Mediterranean mountain lakes concluded that the Sierra Nevada lakes have experienced lacustrine alkalinization due to Saharan dust [25]. In Greenland, the presence of Saharan dust caused an increase in surface temperature of about 10 °C for more than three consecutive days, with implications for snowmelt [3,26]. In the European Alps, the role of Saharan dust events on snowmelt was analyzed, concluding that a reduction in snow cover was expected through snow albedo feedback [27].
Airborne dust deposition in the snow cover has been shown to decrease surface snow albedo [28,29,30]. The Sahara Desert contributes more than 50% of global dust emissions, making it the world’s largest source of dust [31]. Also, in appropriate meteorological scenarios, Sahara dust particles could climb to an altitude of approximately 1.5 to 8 km [32]. It then crosses long distances, reaching the Atlantic Ocean, America, and Europe [33,34,35]. Throughout the world, mineral dust in seasonal snow and glaciers negatively affects their surface albedo, namely in the northern hemisphere [36], Asia [37,38,39,40], Europe [27,41], and North America [42]. In South America, studies of the impact of dust on snow albedo in the extratropical mountains of the Chilean Central Andes have also been analyzed [43]. While other studies on tropical South American glaciers have analyzed mineral dust and its potential effect on snow albedo in Peru [44] and Bolivia [45,46].
In tropical glaciers in South America [47,48], measurements of light-absorbing particles in surface snow are mainly concentrated in the Cordillera Blanca, and limited information is available on their chemical composition (carbonaceous or mineral components), whereas records of powdered ice cores have been investigated in several sectors of the Andes, including in the Cordillera Blanca, Cordillera Oriental, and Cordillera Real [49]. Meteorological measurements at glacier elevation (>4800 m a.s.l.) are still very scarce and often limited to short time periods [50], and there are no established regional networks for monitoring aeolian dust deposition on snow [51]. Studies have revealed that glaciers in the tropical Andes have been retreating rapidly during the last few decades [52]. Therefore, they should be monitored systematically [53], because their quantification facilitates the prediction of meltwater runoff as well as the distribution and availability of freshwater in the Andes region [54]. Also, studies conducted by Méndez et al. (2018) [48] showed that Saharan dust intrusion was present in approximately 95% of the Colombian territory. However, the impact of mineral dust on snow albedo variation in Colombian glaciers has been little studied. Only one study carried out in the Sierra Nevada de Santa Marta (northern Colombia) for the months of June (2000–2020) has been reported in the literature, which found a negative correlation of 31% (p < 0.05) between snow albedo and mineral dust (p < 0.05) [47].
Therefore, the main objective of this study is to analyze the impact of Saharan intrusions on the snow albedo reduction in the tropical glaciers of Colombia through the 2000–2020 period. The results can be used to understand how the dust that arrives from the Sahara Desert in North Africa is darkening the snow on the glaciers and, consequently, the glaciers lost in Colombia. This article is ordered as follows. Section 2 shows the materials and methods used to calculate the snow albedo reduction associated with Saharan intrusion events in Colombian tropical glaciers. Section 3 details the results and discussion of the snow albedo reduction analysis for each of the glaciers studied in Colombia. Finally, Section 4 reports the main conclusions and proposes future studies.

2. Materials and Methods
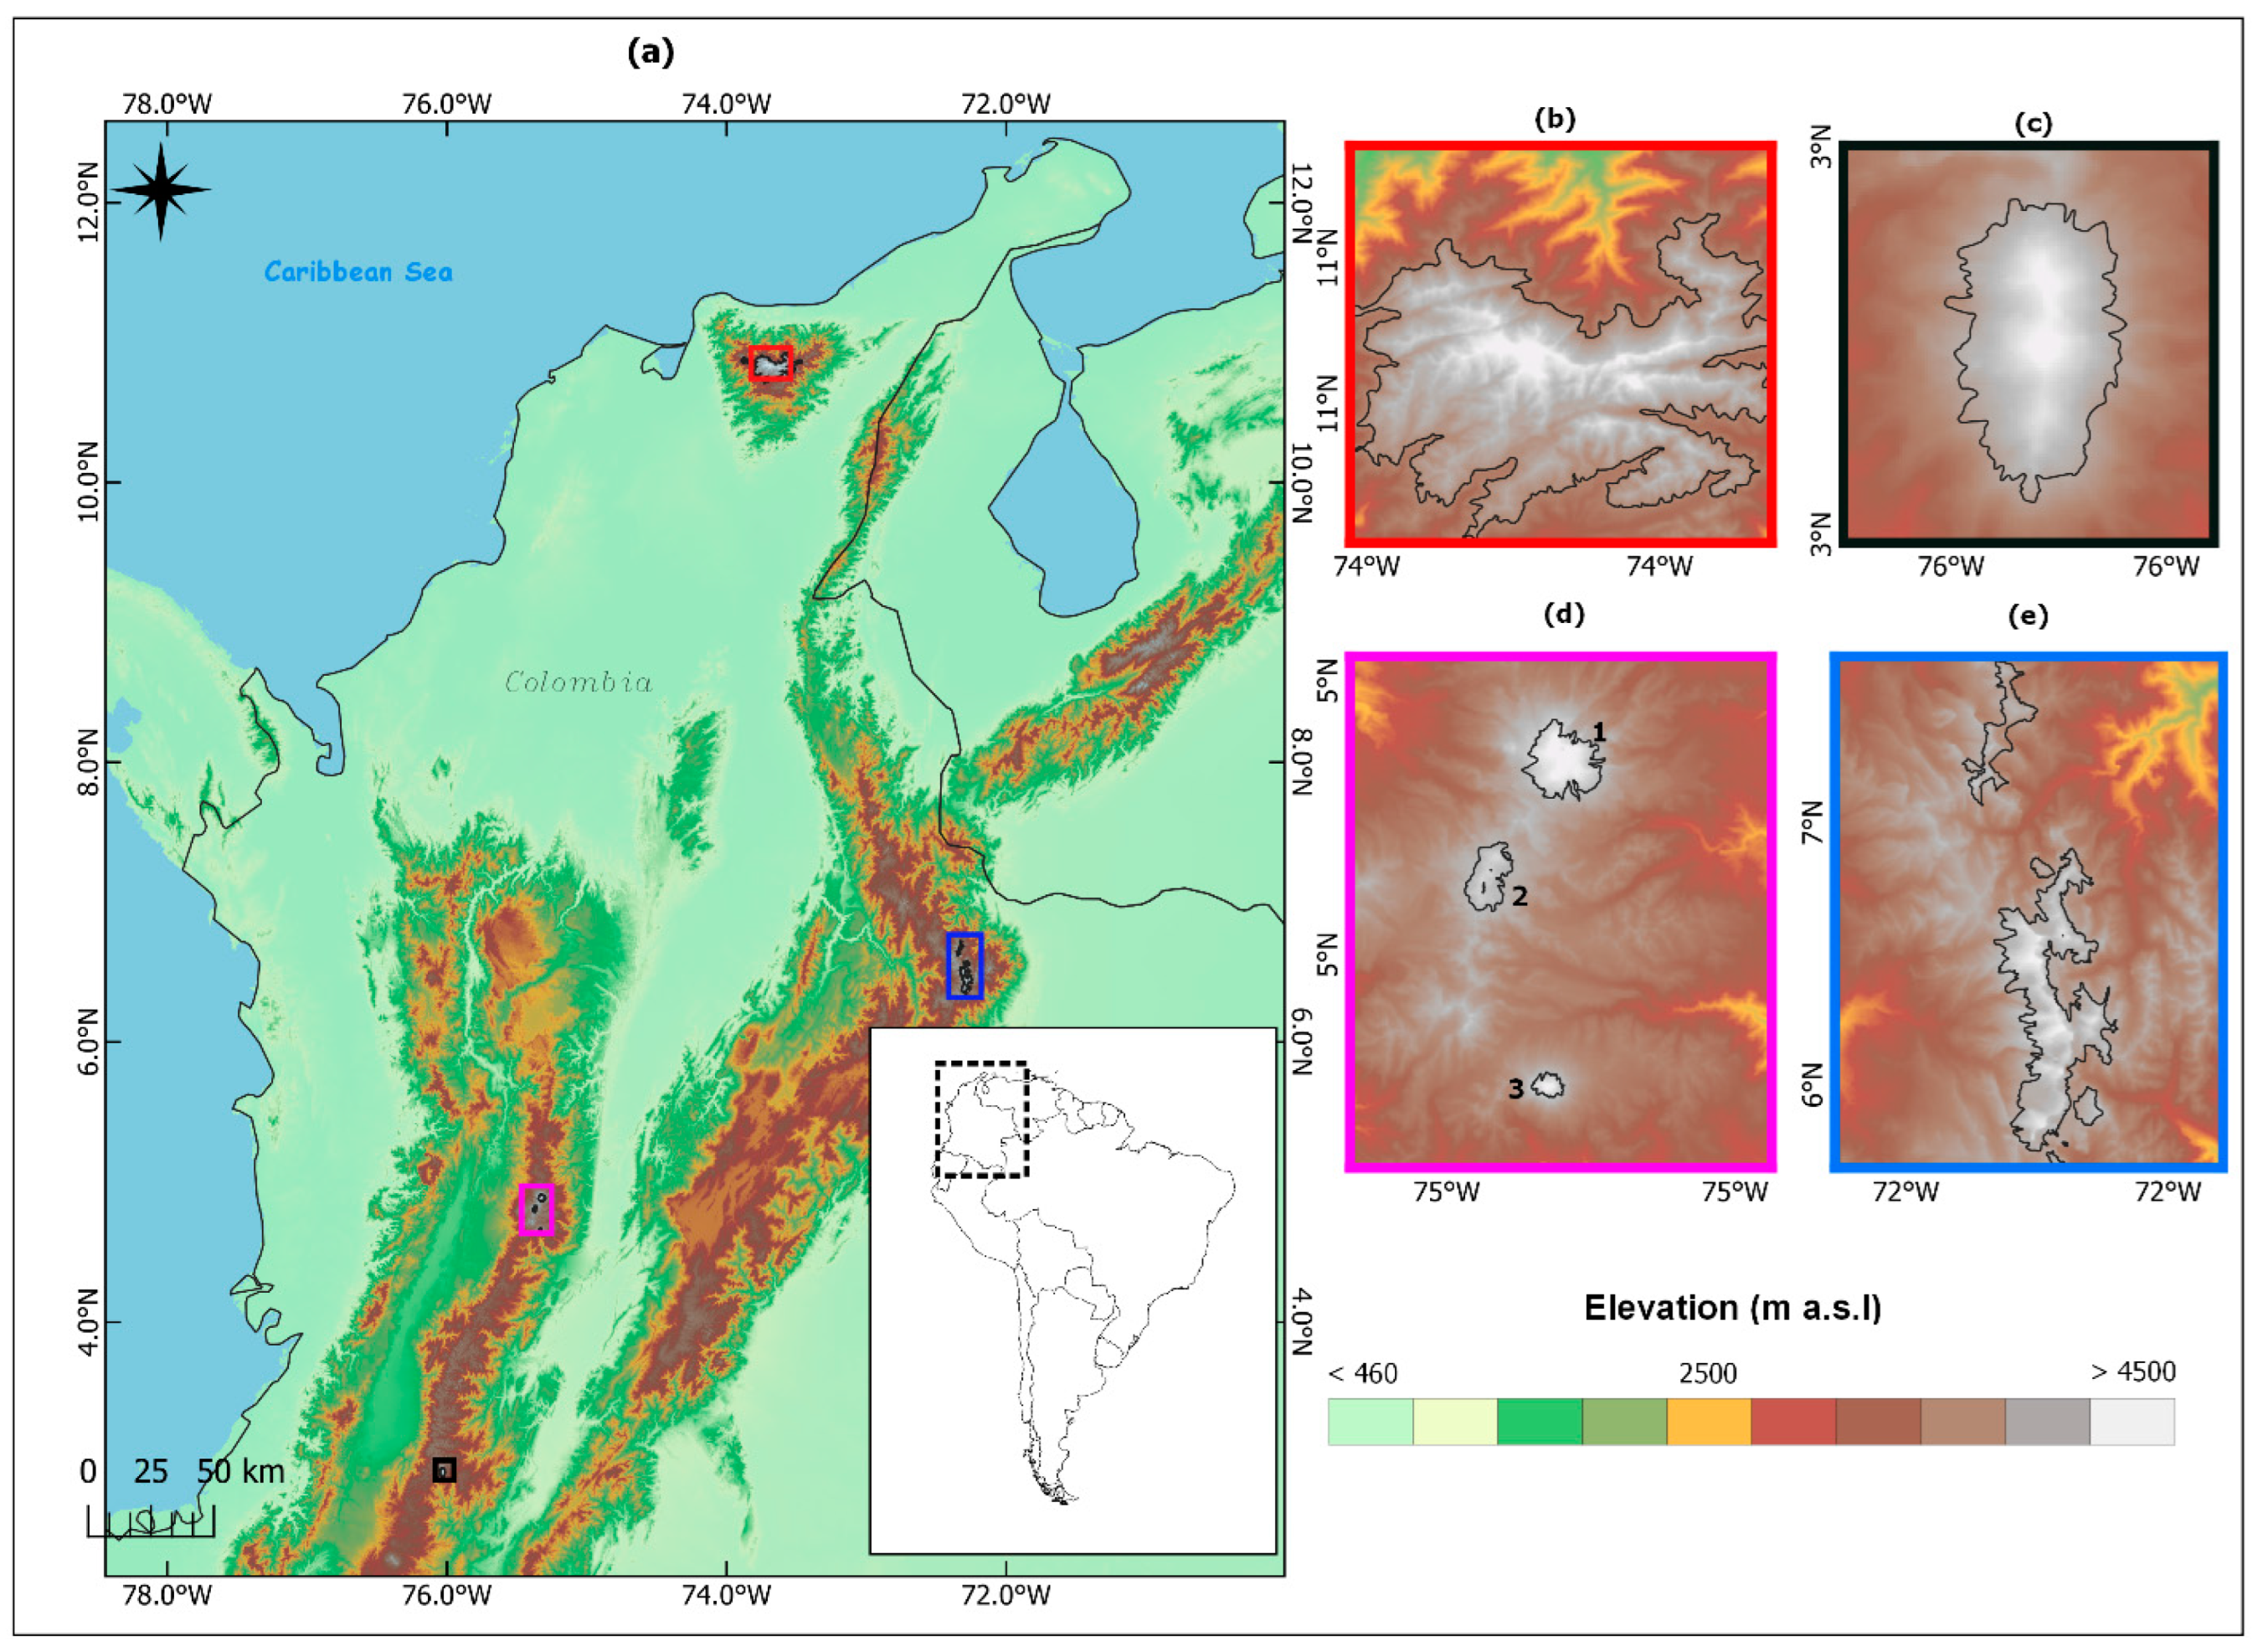
2.1. Studied Area

Colombia is the northernmost country in South America (Figure 1). It covers an area of 1,141,748 km², making it the twenty-fifth largest country in the world and the seventh largest in the Americas [55]. Latitudinally, Colombia is crossed by the Andes mountain range, which is the main and longest mountain range in South America [56]. This mountain is very important for Colombia. It generates more than 70% of its gross domestic product and provides fresh water and energy for most of its inhabitants [57]. Colombian glacier areas are in the higher parts of this mountain (>4850 m a.s.l.). They reside within a tropical zone, enabling them to experience the effects of the Intertropical Convergence Zone rather than being subjected to the seasonal variations that define regions at higher latitudes [58]. Currently, there are only six zones’ glaciers in Colombia (Table 1), namely, Sierra Nevada de Santa Marta (SNSM), Sierra Nevada del Cocuy (NSC), Nevado del Ruíz (NDR), Nevado Santa Isabel (NDS), Nevado del Tolima (NDT), and Nevado del Huila (NDH). Previous studies indicate that Colombian glaciers have shrunk from 374 km2 in the Little Ice Age (17th–19th centuries) to 34.85 ± 0.54 km2 in 2020. This means that Colombia has lost 92% of its glacier area [59,60]. Thus, these glaciers are extremely fragile, very sensitive to climate variability, changes in precipitation, and temperature, and respond to global climate dynamics [61]. The glacier areas of Colombia present an important relationship between the glacier system ecosystems and the moorlands, lagoon systems, and main water sources and their contribution to the water cycle [62,63].
Table 1 shows the glacier areas of Colombia from north to south. SNSM is the northernmost glacier area in Colombia and the highest (5775 m a.s.l.). NDS is the lowest glacier area (4968 m a.s.l.) and covers the smallest area (0.45 km2). While SNC is the second highest glacier area (5380 m a.s.l.) and covers the largest area (13.19 km2).

2.2. Data

Dust data were obtained from the Modern-Era Retrospective analysis for Research and Applications, version 2 (MERRA-2), namely, Average Dust Extinction AOT 550 nm to analyze a spatial analysis of the dust plume from the Sahara Desert to the American Caribbean was performed by means of a 12-months and June and July months (2000–2020); mineral dust (MD) as well as Dust Deposition (M2TMNXADG v5.12.4) to analyze the presence of month during the 12-month period over Colombia, estimate the dust deposition anomalies in each glacier and was used as an independent variable in the multiple regression analysis applied to each glacier; and Dust Deposition data were also used to estimate the Sen’s Slope (median trend) which has proven robust against outliers [64] for each glacier studied. Then, a delimitation of six glacial areas of the Colombian Andes was carried out on the heights covered by snow. In fact, all analyzed areas were delimited using the same shapefile format file, its mean, a geospatial vector data format for geographic information systems (GIS) for each Colombian glacier. For a better analysis, snow cover and surface temperature data from MODIS were used for June-July as the period of intrusion of Saharan dust into Colombia. We mainly used daily MODIS data (https://modis.gsfc.nasa.gov/data/ (accessed on 21 December 2022)) combining TERRA and AQUA satellite data with a special resolution of 0.5 km and 1 km. The MODIS data used were the M*D10A1 C6 products for snow albedo (SA) and normalized difference snow index (NDSI) as snow cover (SC) using both the MODIS snow algorithm [65] and the M*D11C1 C6 products for land surface temperature (LST). This LST product is generated by the generalized split-window LST algorithm [66]. A selection of quality data was made, taking pixels of better resolution and avoiding a larger amount of biased data. While images from Cloud-Aerosol Lidar and Infrared Pathfinder Satellite Observations (CALIPSO) were used to observe dust in the atmospheric column over the study area. Finally, the wind rose was analyzed for each Colombian tropical glacier studied, showing how many hours per year the wind blows from the indicated direction. (https://www.meteoblue.com/en/weather/historyclimate/climatemodelled/ (accessed on 1 August 2023)).

2.3. Methods

For the data analysis, a multidimensional spatial analysis was performed with multidimensional raster layers generated by HDF files. The raster data were entered for a computational analysis using the Python console of QGis software(version 3.16), by which we proceeded to calculate outliers (2000–2020) of dust and albedo data, for which a calculation of multidimensional anomalies was performed in order to analyze the alterations of snow albedo with the intrusion of Saharan dust in the glacial areas of Colombia.
Mathematically, anomalies can be calculated using the mean or median as the definition of the mean (as shown in Equation (1)). If the data distribution is skewed, outliers can greatly affect the mean, so median or z-score methods may be more appropriate for such data:
Z = x µ S ,
where x is the pixel value in a raster slice, µ is the mean value of the pixel values over the given time interval, and S is the standard deviation of the pixel values over the time interval. It is taken into account that for each variable, the raster to be analyzed must have the same extension, cell size, and spatial reference. The average or median value is provided directly as raster input in the parameter average calculation interval. The input of each raster is performed, and the difference from the mean is calculated by comparing the pixel values in each sector with the corresponding pixel values in the outer raster. The Z score of each pixel will be calculated. A Z score of 0 indicates that the pixel value is identical to the mean value. A Z score of 1 indicates that the pixel value has a standard deviation of 1 from the mean value. If the Z score is 2, the pixel value has a standard deviation of 2 from the mean value, and so on.
To estimate the effect of mineral dust deposition (MD) on the reduction of snow albedo (SA) on each glacier, a linear multiple correlation of SA with land surface temperature (LST), MD, and snow cover (SC) was performed using a multiple regression analysis for the monthly averages of June and July 2000–2020 on each glacier. Finally, four passes from the CALIPSO satellite on 22 June 2006, 2 July 2010, 30 June 2015, and 30 June 2020 were visualized and confirmed the presence of mineral dust in the atmospheric column between 0 and 5 km altitude in Colombia during the analyzed months [67] (as shown in Appendix A).

3. Results and Discussion

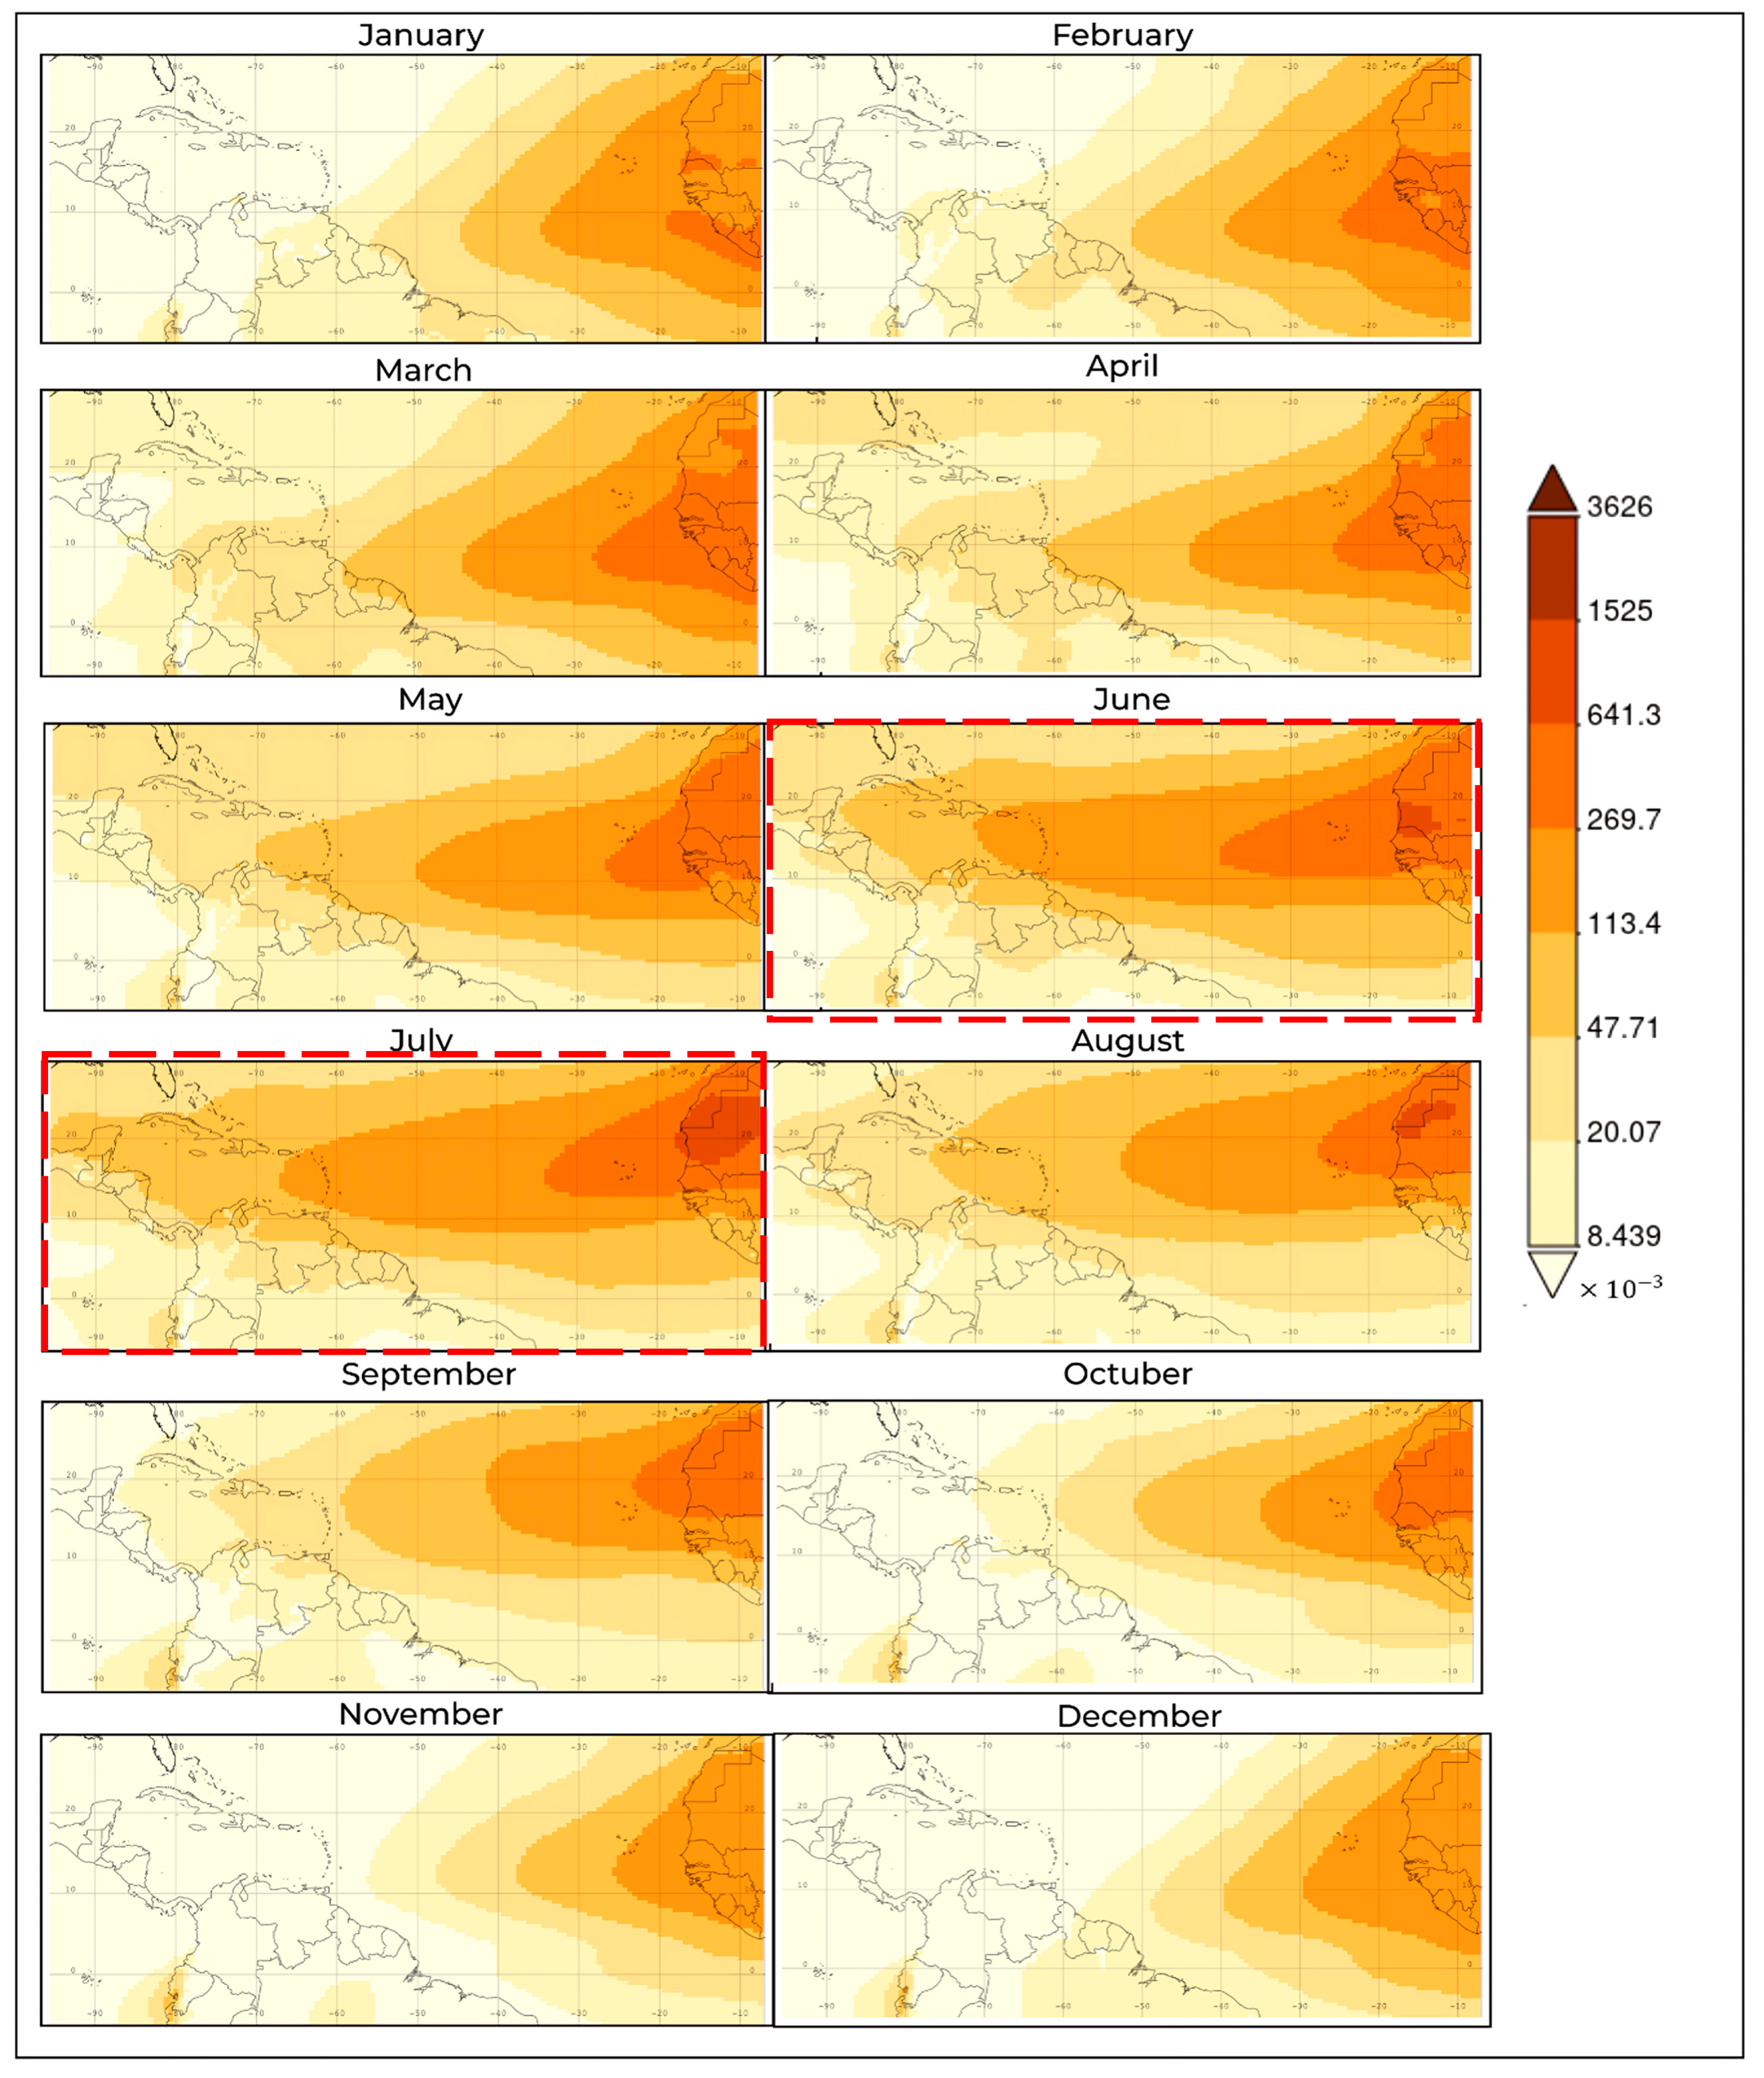
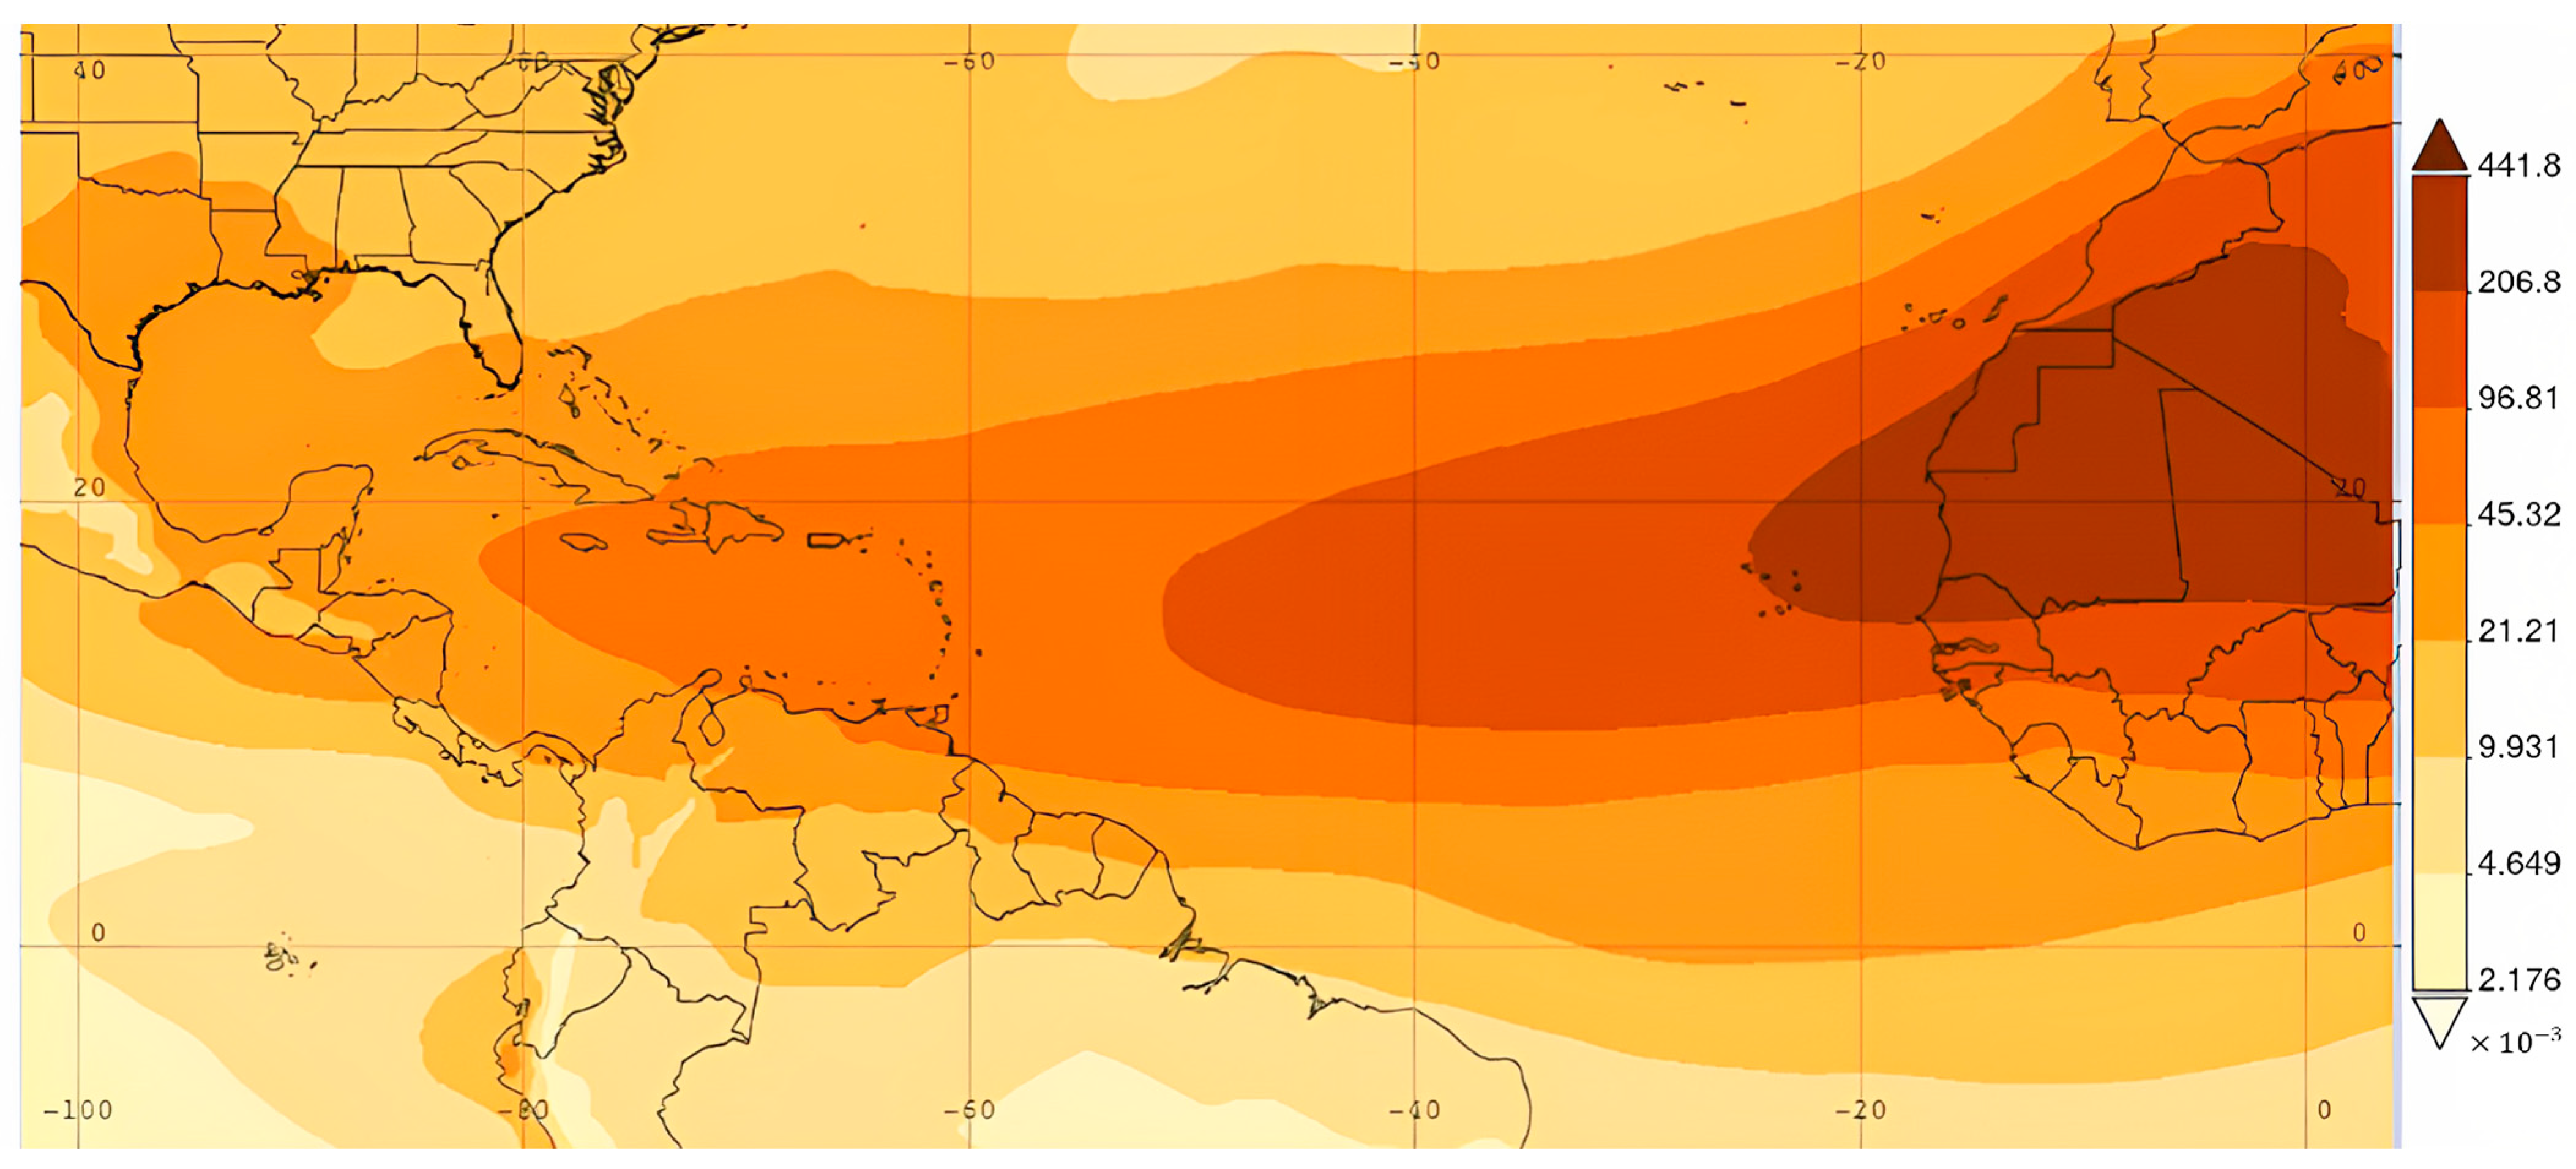
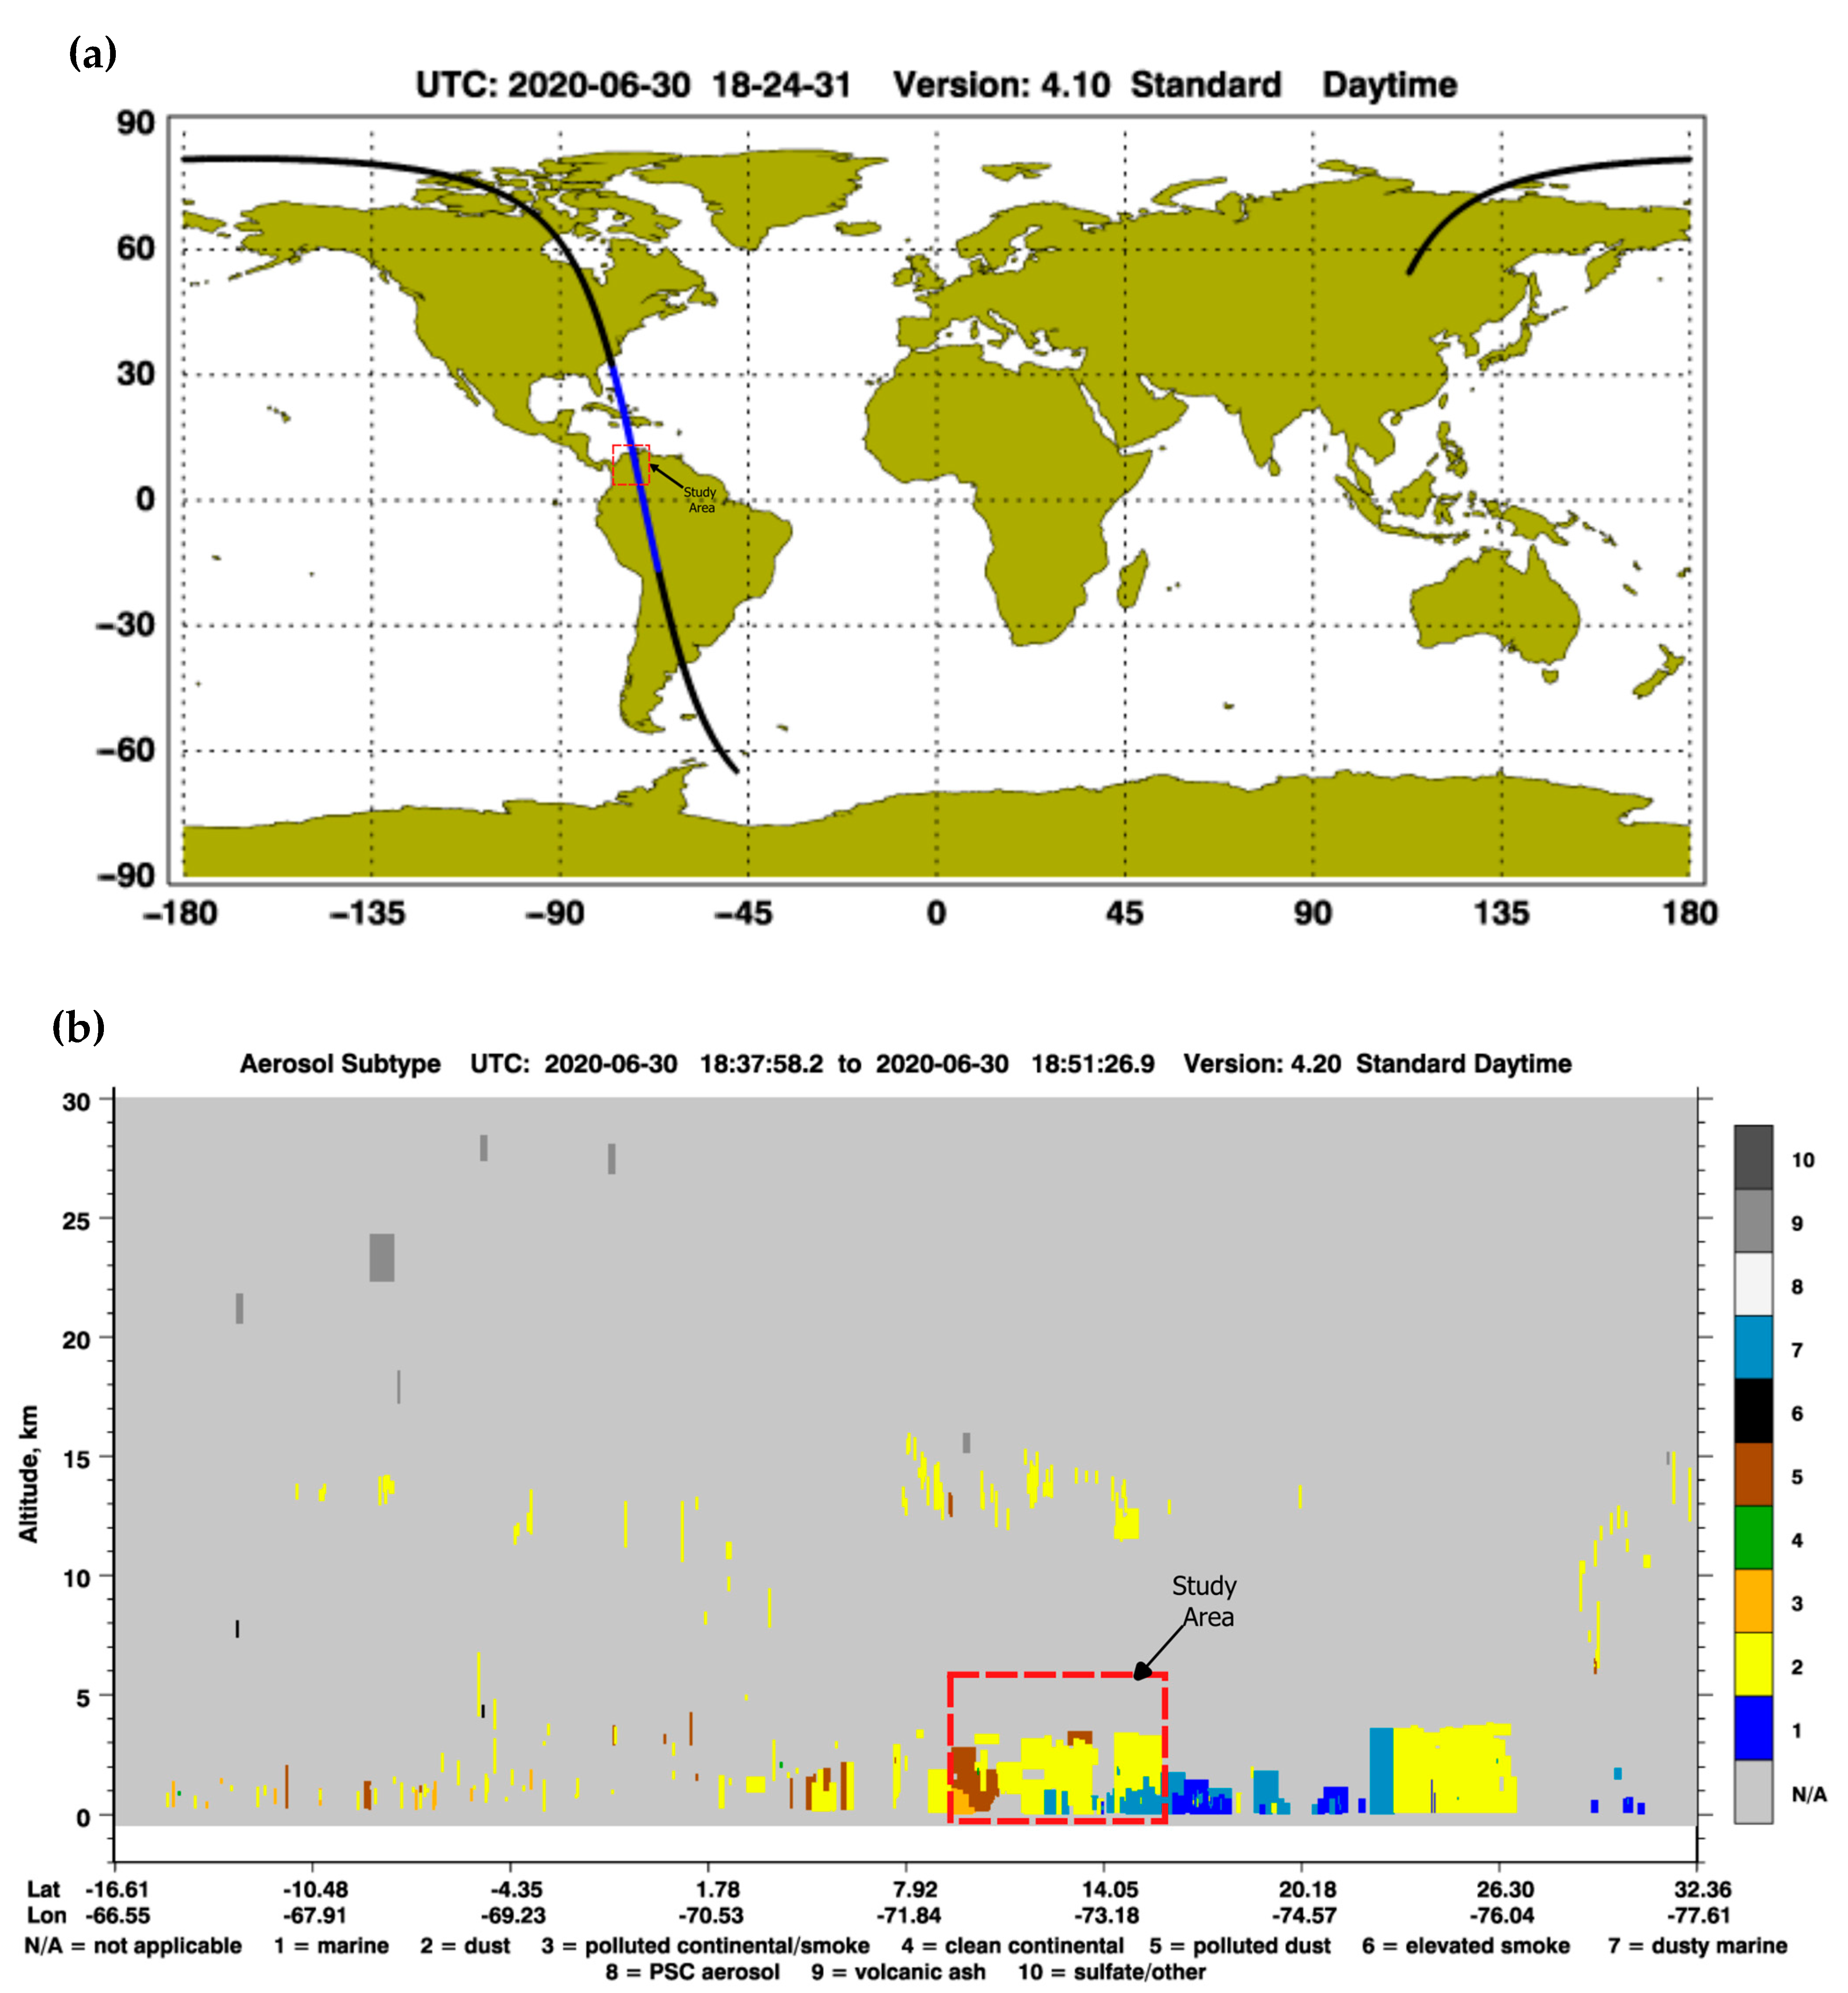
3.1. Saharan Dust Intrusion Event in Colombia

Figure 2 shows the average monthly data of dust deposition in Colombia in the period from 2000 to 2020. It can be observed that the highest average concentrations were 18.9 and 19.22 mg·m−2 (extreme values up to 39.17 and 36.9 mg·m−2) for the months of June and July, respectively. In addition, it is observed that these average values are above the mean values, which indicates a positively skewed distribution of these values. In this sense, as shown in Figure 3, the high dust concentrations would be the effect of the Saharan intrusion, which arrives in Colombia from North Africa. These results were consistent with previous studies that showed increases in mineral dust due to Saharan intrusion in the middle of each year [68,69,70,71,72,73].

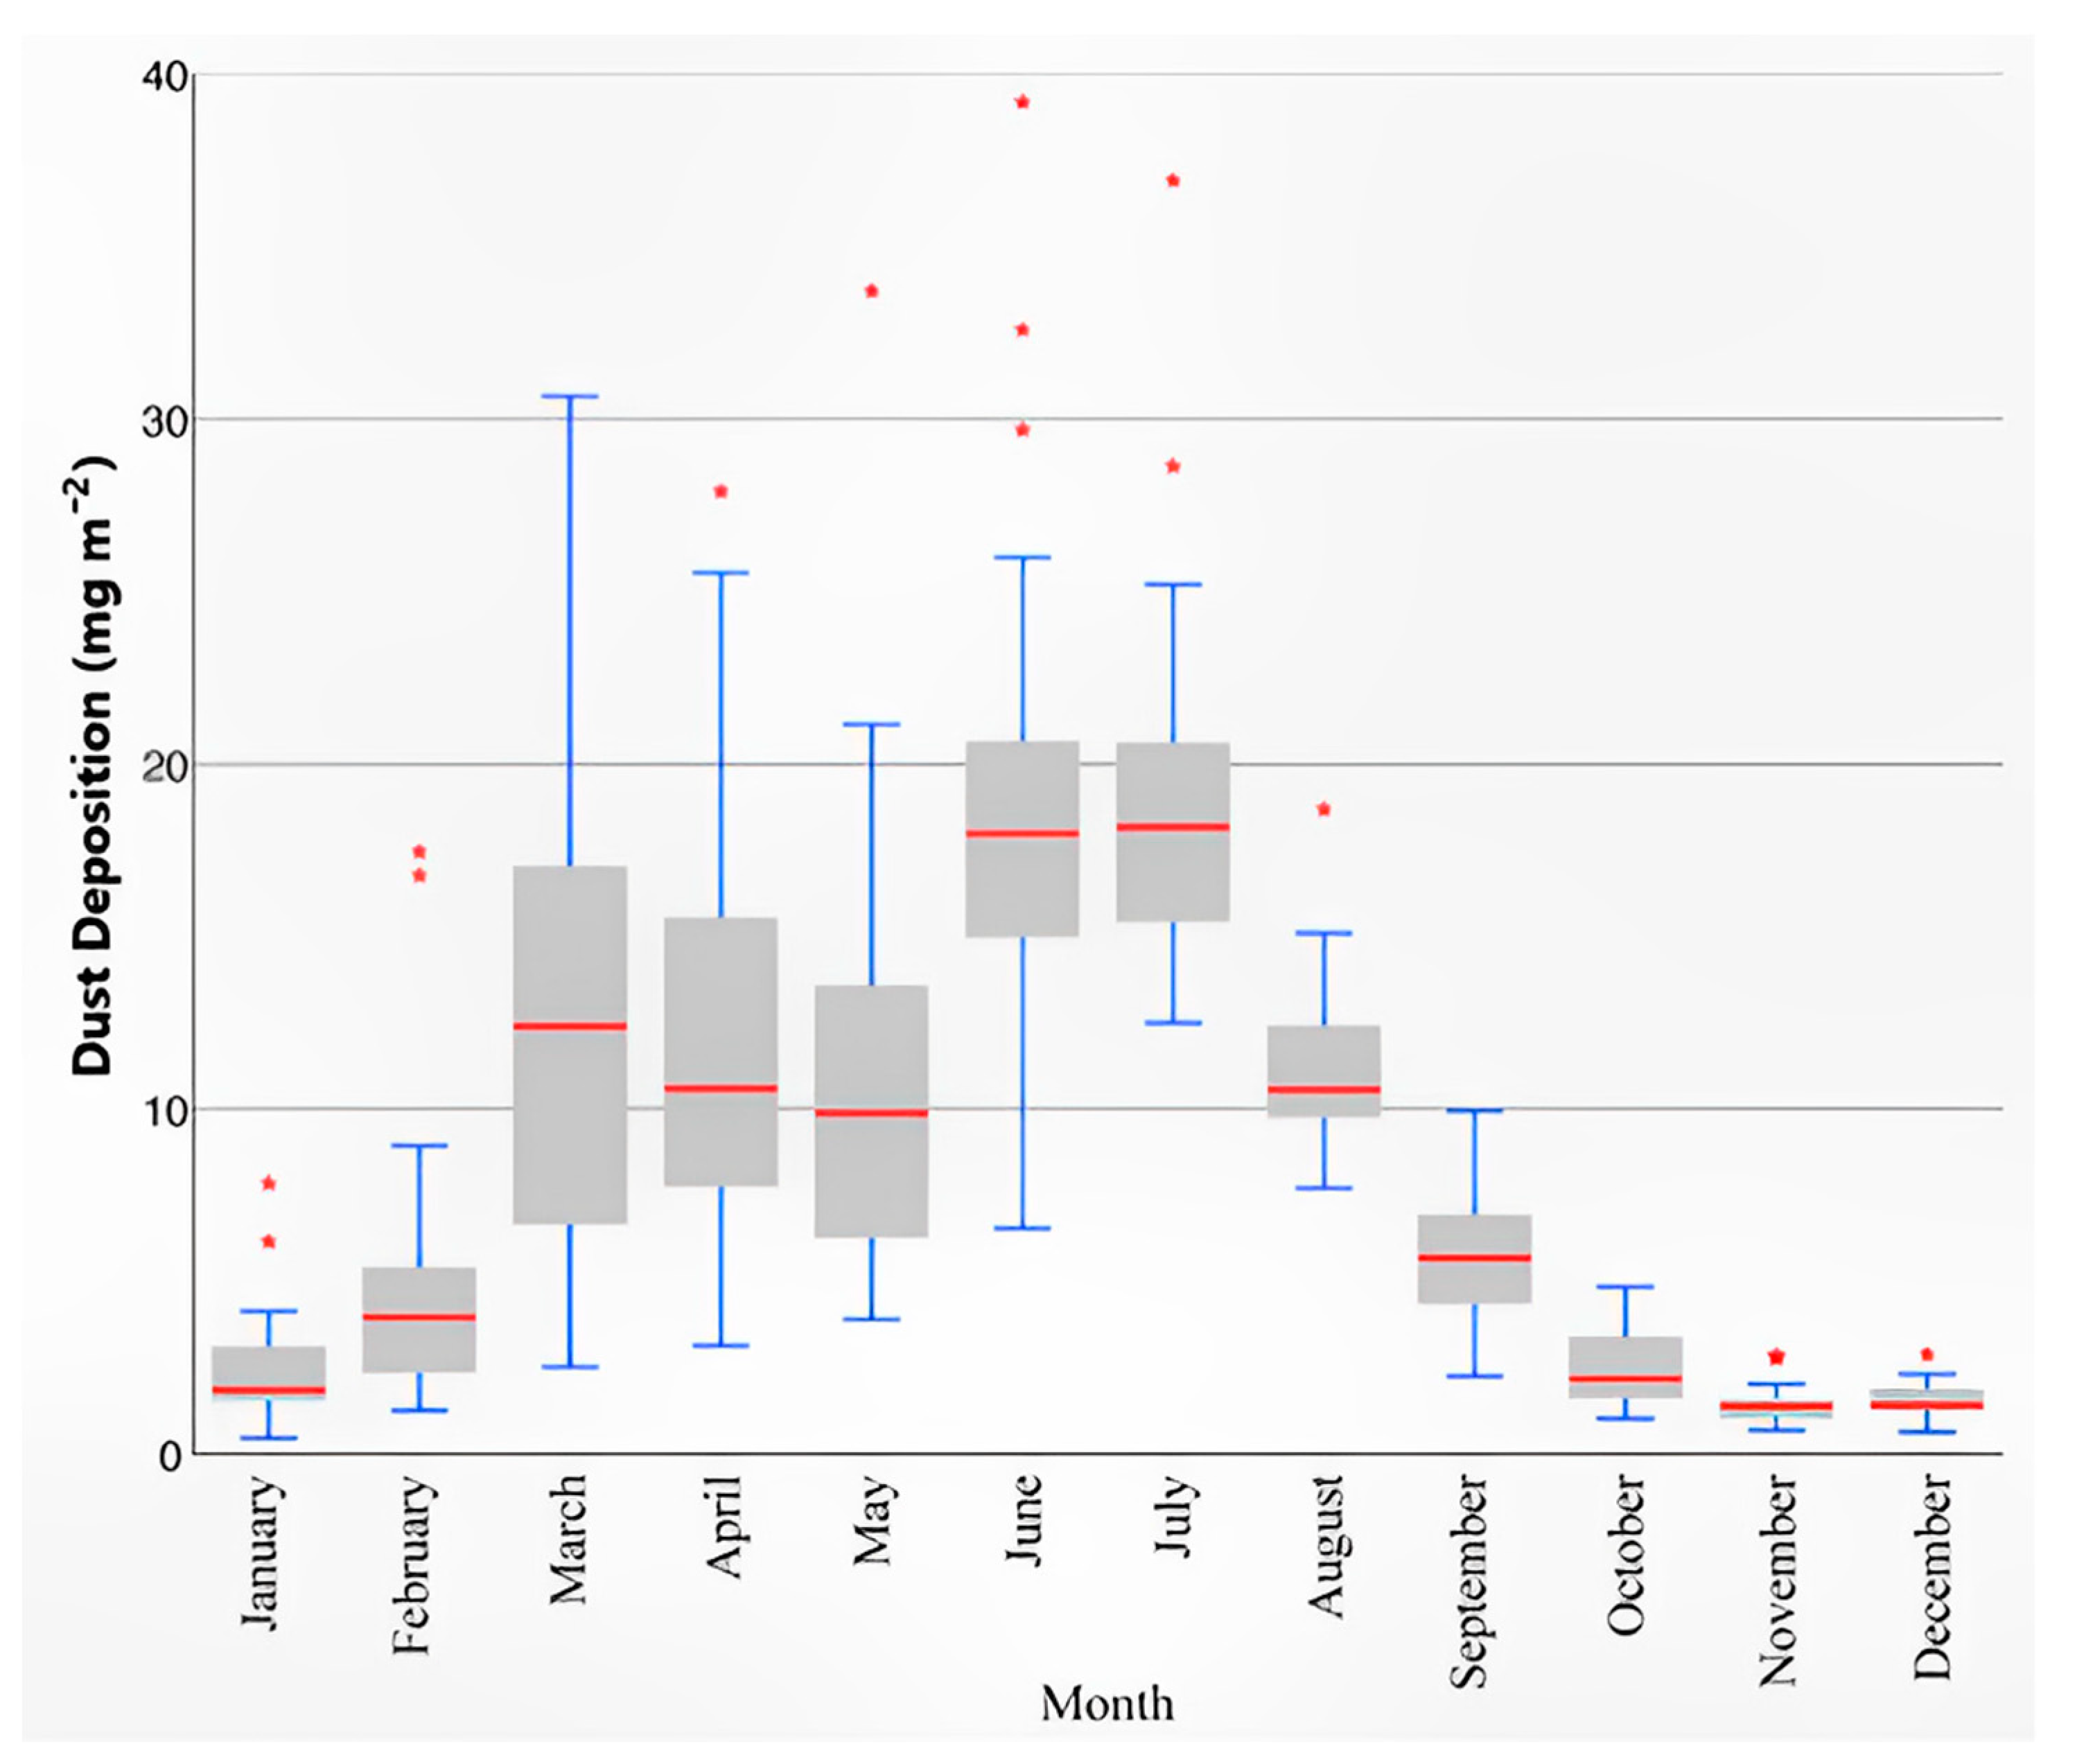
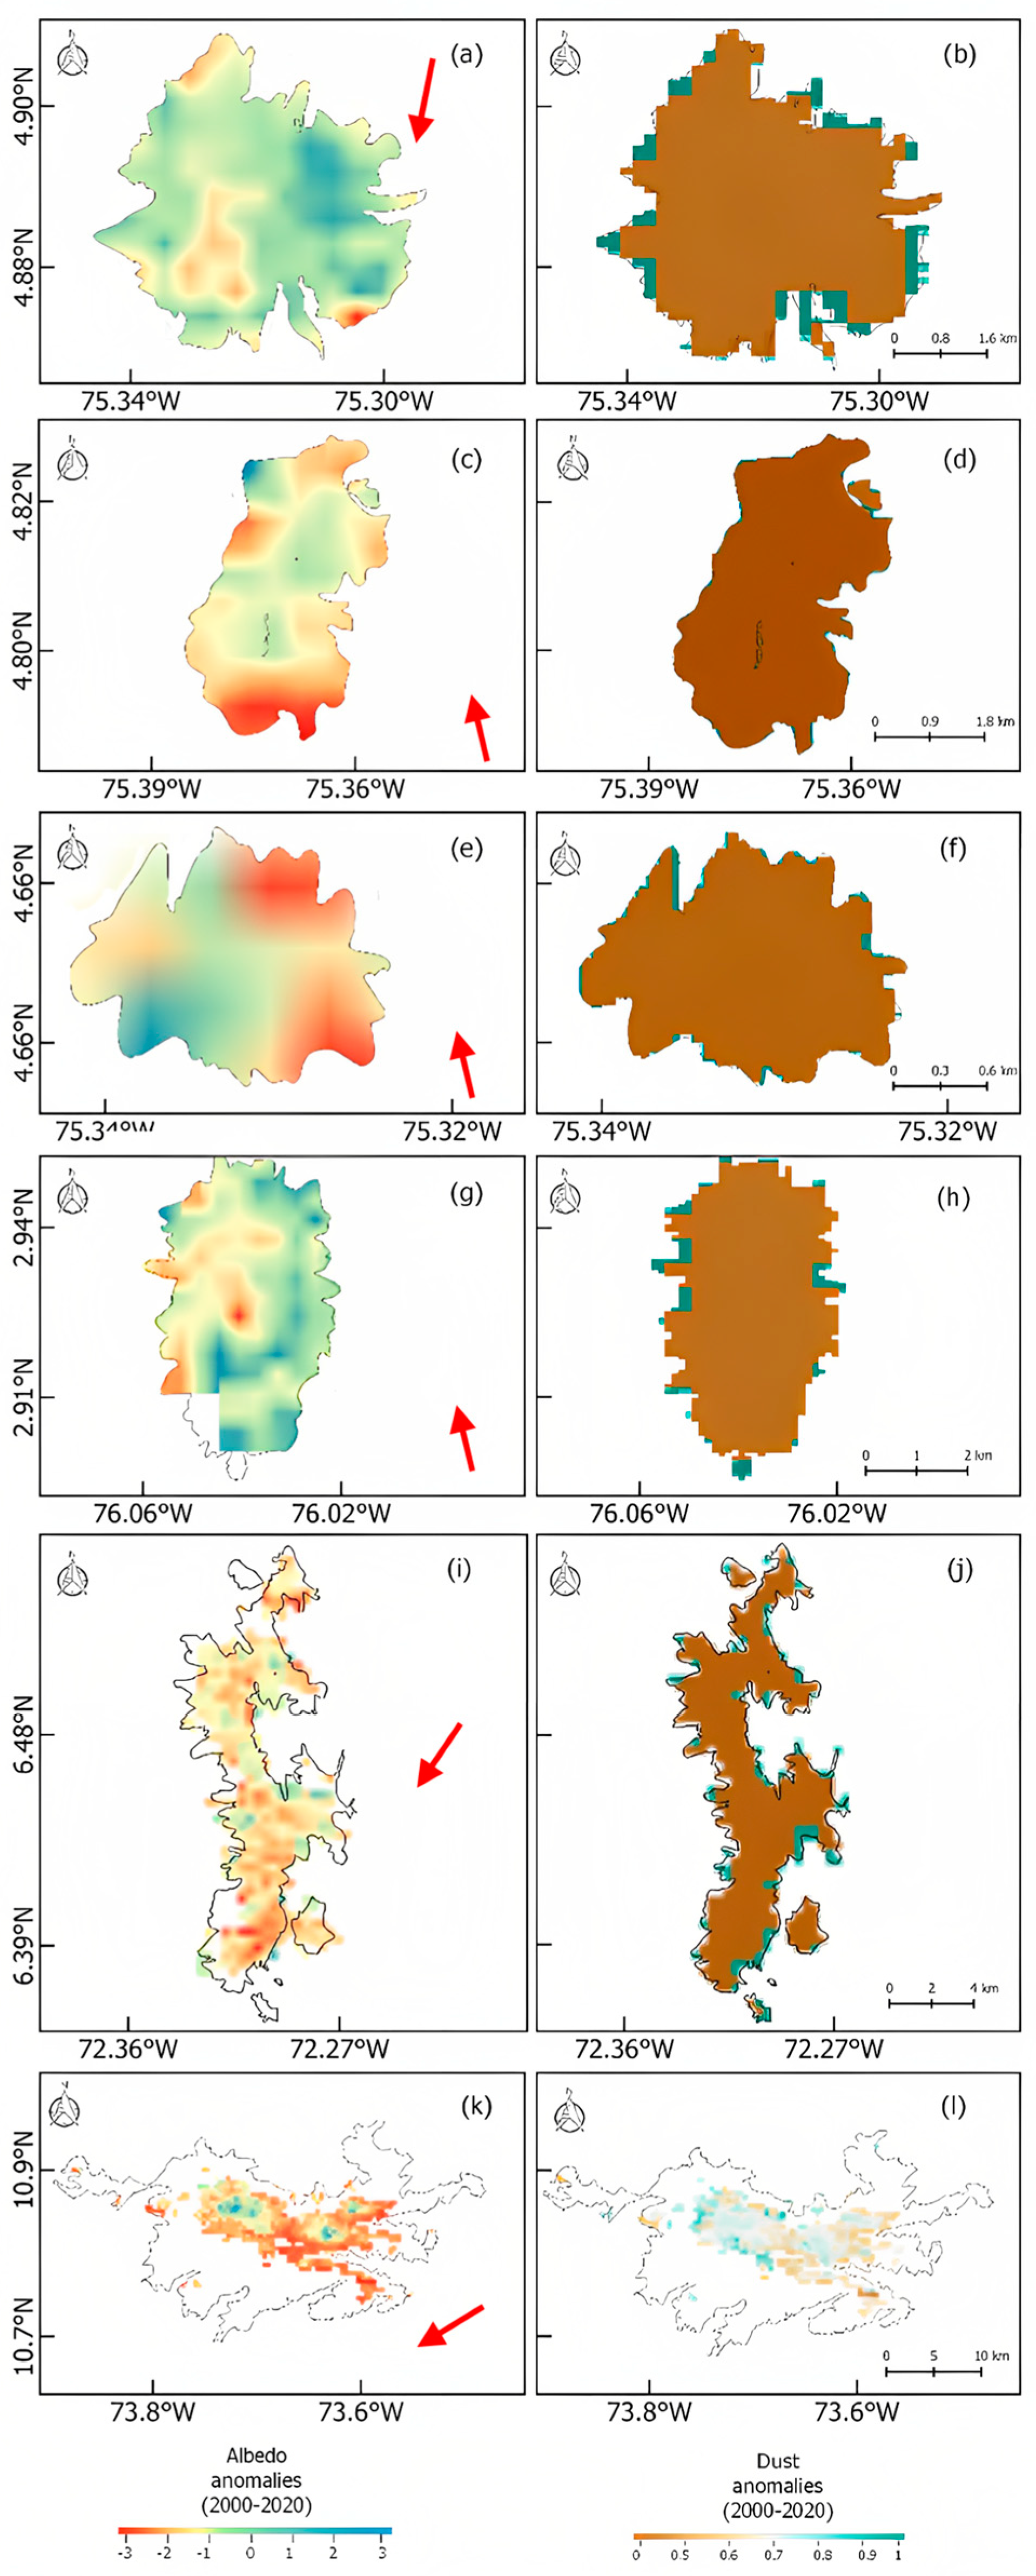
3.2. Snow Albedo and Dust Deposition Variation in Colombian Glacial Areas

Figure 4 shows the results of the calculation of snow albedo and dust deposition anomalies in each of the Colombian glaciers studied during the June–July months from 2000 to 2020. The largest snow albedo reductions (associated with increased dust deposition) were observed at 39.39% (15.84 mg·m−2), 32.1% (88.52 mg·m−2) and 30.58% (49.89 mg·m−2) in SNC (Figure 4j), SNSM (Figure 4k), and NDR (Figure 4b), respectively. While glaciers with less snow albedo reduction (associated with increased dust deposition) were observed at 17.28% (10.07 mg·m−2), 25.64% (26.18 mg·m−2), and 30.24% (13.98 mg·m−2) in NDH (Figure 4g), NDT (Figure 4e), and NDR (Figure 4a), respectively. In addition, these results also show that the northernmost glaciers with the highest dust deposition have predominantly northerly winds. While the southernmost glaciers, where there is less dust deposition, have prevailing winds with a southerly wind component. This could indicate that the average values of dust deposited in the Colombian glacial areas for the June and July periods have an impact on the albedo decrease by darkening snowy surfaces. These results are consistent with what is shown in Figure 3, which shows that the Saharan intrusion arrives with greater concentration in the north and is diluted as it reaches the south of Colombia. Additional 12-month analysis also shows that the largest dust intrusions from the Sahara into Colombia occur during the months of June–July each year (as shown in Figure A5).
The results of this work are consistent with previous studies showing that Saharan dust reaching (see Appendix A) Colombian tropical glaciers reduces their snow albedo.

3.3. Saharan Dust Intrusions Effects on Snow Albedo Decrease in Colombia

Although the most important LAPs in the reduction of Albedo snow are Black Carbon and Organic Carbon and Mineral Dust [74,75,76,77,78]. Previous studies in the Sierra Nevada de Santa Marta, Colombia [47] have shown that dust can reduce snow albedo up to 41% (p < 0.001), while the combination of Black Carbon and Organic Carbon and Mineral Dust only 29% (p < 0.05). This shows the importance that Mineral Dust can have in the reduction of snow albedo in Colombian tropical glaciers. In this sense, the relationship between SA and LST, MD and SC, was analyzed, and the coefficients of determination (R2) were calculated using their monthly averages. These parameters underwent initial mean subtraction followed by normalization using their corresponding standard deviations. Subsequently, a multiple linear regression analysis was conducted for every glacier, utilizing these normalized parameters for the months of June and July within the timeframe of 2000–2020 in Colombian glaciers, as shown in the following equations:
SA SNSM = 2.27 × 10 15 0.54 LST SNSM 0.13 MD SNSM + 0.27 SC SNSM R SNSM 2 = 0.71 ( p < 0.001 )
SA SNC = 0.09 0.35 LST SNC 0.16 MD SNC + 0.38 SC SNC R SNC 2 = 0.56 ( p < 0.001 )
SA NDR = 7.88 × 10 17 0.61 LST NDR 0.18 MD NDR + 0.40 SC NDR R NDR 2 = 0.64 ( p < 0.001 )
SA NDS = 1.27 × 10 15 0.37 LST NDS 0.20 MD NDS + 0.41 SC NDS R NDS 2 = 0.59 ( p < 0.001 )
SA NDT = 8.67 × 10 17 0.10 LST NDT 0.08 MD NDT + 0.09 SC NDT R NDT 2 = 0.15 ( p = 0.85 )
SA NDH = 0.48 + 0.23 LST NDH + 0.04 MD NDH + 0.19 SC NDH R NDH 2 = 0.49 ( p = 0.07 )
Furthermore, to test the relationship between LST, MD, and SC, the square and square root of LST, as well as the product of LST, MD, and SC. They were used in the regression analysis of each glacier. Results revealed that all their regression coefficients in each multiple regression equation was insignificant at 99% confidence level. In most of the multiple correlation Equations (2)–(5) it was found that the LST, MD, and SC coefficients have the expected physical behavior on the snow albedo (SA). This means that increasing temperature and dust reduce the albedo, while increasing snow cover is associated with increased snow albedo [79,80]. However, Equation (7) shows that the MD would increase the SA in NDH, which would not be physically expected. Equation (6) was the one that showed the lowest coefficient of determination. In addition, the results of NDH are due to the fact that it is the southernmost tropical glacier in Colombia as shown in Figure 3, it is the area of Colombia where the Saharan intrusion arrives weak. In addition, Sen’s Slope de Sen shows a positive trend of increasing dust deposition on all glaciers studied. However, this trend shows a decreasing pattern from north to south. That is, while the northernmost glaciers show higher dust deposition trends of 6.58 × 10⁻³ µg·m−2·year−1 and 5.19 × 10⁻³·µg·m−2·year−1 in SNSM and SNC, respectively. Those further south present the lowest dust deposition trends of 2.81 × 10⁻³ µg·m−2·year−1 and 3.53 × 10⁻³ µg·m−2·year−1 for NDH and NDT, respectively (as shown in Table 2). In particular, NDT, which has the lowest R2 at the same time presented the highest number of hours per year with velocities > 12 km h−1 from the southeast (Figure A6). At that point, the north-south deposition pattern is consistent with research carried out in France, which found regional patterns of African dust deposition decreasing with distance from the North African coasts according to a south-north gradient [41]. Then, these results show that there are regional effects as climatic variables due to the high spatial variability in mineral dust and snow properties [81]. Therefore, considering the lowest Sen’s Slope, the lowest values of R2, and the non-significant p-values of Equations (6) and (7) of NDH and NDT, respectively, these are discarded for the following calculation. Then, the contributions of LST, MD, and SC to the SA behavior of each glacier in Colombia were estimated using the difference of the normalized mean values of LST, MD, and SC for the months of June and July 2000–2020. In this way, the percentage of SA reduction due to deposition was estimated. These results showed that the glaciers where MD contributed the most to SA behavior were 35.4%, 24%, and 21.4% in NDS, NDC, and NDR, respectively. Using regression equations to analyze the impact of aerosol optical depth (AOD) on snow albedo behavior has been used previously in the Sierra Nevada in CA, United States. They found that approximately 26% of the snow albedo reduction from March to April over the Sierra Nevada is caused by an increase in AOD [82]. This technique was also used in the Central Andes of Chile, where they found that AOD contributed up to 13.59% to the variation of snow albedo in the 2000–2016 period [83]. Our results are also consistent with studies conducted by He et al. 2019, who applied a stochastic model of aerosol and snow albedo to simulate dust with snow grains. They found that internal mixing of dust and snow increases the magnitude of snow albedo reduction by 10% to 30% [84]. Thus, the results of this study would show that the MD is having an important impact on the snow albedo variation in most of the Colombian tropical glaciers analyzed.
In addition, considering the increasing trends of dust deposition on Colombian tropical glaciers between 2.81 × 10⁻³ µg·m−2·year−1 and 6.58 × 10⁻³ µg·m−2·year−1. This would suggest that under the effects of climate change [85,86,87,88,89], the increase of LAPs such as Mineral Dust would be negatively feeding back, together with the increase in surface temperature, the reduction of snow albedo in these glaciers, and therefore increasing the risk of the loss of these tropical glaciers [59]. In addition, the results of this work can serve as input for regional and global climate models to improve our understanding of the response of tropical glaciers to climate change [41,84,90,91]. However, this study has only been based on satellite observations and reanalysis data due to the absence of ground observations and LAP measurements on snow samples in the study area. Thus, a coordinated international network of field observations of the atmosphere and cryosphere at high mountain sites in Colombia could provide near-real-time measurements useful for supporting future climate [49].

4. Conclusions

The present work analyzes the relationship between Saharan intrusion and snow albedo reduction in tropical glaciers in Colombia for the period 2000–2020. Mineral dust appears to have an impact on the reduction of snow albedo in Colombian glaciers of up to 39.39%. It is also appreciated that the northernmost glaciers have a higher exposure to Saharan intrusions. The results may be useful for understanding the impact of Saharan dust on albedo reduction in Colombian tropical glaciers and, therefore, on the acceleration of their ablation rate. However, it is hoped that future work can analyze snow samples to determine the presence and quantification of light-absorbing particles in these glaciers.

Author Contributions

Conceptualization, T.R.B.-O., V.L.D.-G., A.M.V.-P., E.L.V.-V. and Y.C.-C.; Data curation, V.L.D.-G., A.M.V.-P. and Y.C.-C.; Formal analysis, T.R.B.-O., V.L.D.-G., A.M.V.-P., E.L.V.-V. and Y.C.-C.; Funding acquisition, E.L.V.-V. and Y.C.-C.; Investigation, T.R.B.-O., V.L.D.-G., A.M.V.-P. and E.L.V.-V.; Methodology, T.R.B.-O., V.L.D.-G., A.M.V.-P., E.L.V.-V. and Y.C.-C.; Project administration, Y.C.-C.; Resources, Y.C.-C.; Supervision, T.R.B.-O. and Y.C.-C.; Validation, T.R.B.-O. and V.L.D.-G.; Visualization, A.M.V.-P.; Writing—original draft, T.R.B.-O., V.L.D.-G., A.M.V.-P. and Y.C.-C. All authors have read and agreed to the published version of the manuscript.

Funding

The work of T.R.B.-O. was funded in part by the ANID-FONDECYT 3230555 projects from Ministerio de Ciencia, Tecnología, Conocimiento e Innovación of Chile. Authors thanks the grants and fund research (AA N° 014–2015, AA N° 031–2016, Res N° 0388–2017, Res N° 0709–2017, Res N° 0119–2018, Res N° 0305–2018 and Res N° 0347–2020) from Universidad del Magdalena (Colombia). Also, the APC was funded by Universidad del Magdalena.

Data Availability Statement

Not applicable.

Acknowledgments

We would like to thank the MODIS, MERRA-2, and CALIPSO scientific teams, and their associated personnel for the production of the data used in this research effort.

Conflicts of Interest

The authors declare no conflict of interest.

Appendix A

During the last 20 years (2000–2020), it has been possible to observe different Saharan dust intrusion events over Colombia’s mainland through the CALIPSO satellite [67]. Particularly, vertical dust profiles were observed in the 5 km above the land surface in Colombia in the months of June and July, namely, 22 June 2006 (Figure A1), 2 July 2010 (Figure A2), 30 June 2015 (Figure A3), and 30 June 2020 (Figure A4). These observations of superficial atmospheric dust allow us to see that the Saharan dust intrusion events are arrive in Colombia each year. Thus, they can be deposited on Colombia’s glaciers and reduce its snow albedo. Figure A5 shows the monthly distribution of the Saharan dust plume crossing the Atlantic Ocean, reaching Colombia with the highest dust’s AOT values in June and July. Finally, Figure A6 shows the wind rose for each area studied to analyze the impact that this direction may have on the dust being deposited on the glaciers studied.
Figure A1. Nighttime pass of the CALIPSO satellite on 22 June 2006 [67]. (a) The orbit track locations around the planet. (b) The vertical profile of the dust as an aerosol subtype for the trajectory (pink color) shown in (a). The red dotted lines enclose the study area in the Colombian Caribbean.
Water 15 03150 g0a1
Figure A2. Daytime pass of the CALIPSO satellite on 2 July 2010 [67]. (a) The orbit track locations around the planet. (b) The vertical profile of the dust as an aerosol subtype for the trajectory (blue color) shown in (a). The red dotted lines enclose the study area in the Colombian Caribbean.
Water 15 03150 g0a2
Figure A3. Daytime pass of the CALIPSO satellite on 30 June 2015 [67]. (a) The orbit track locations around the planet. (b) The vertical profile of the dust as an aerosol subtype for the trajectory (blue color) shown in (a). The red dotted lines enclose the study area in the Colombian Caribbean.
Water 15 03150 g0a3
Figure A4. Daytime pass of the CALIPSO satellite on 30 June 2020 [67]. (a) The orbit track locations around the planet. (b) The vertical profile of the dust as an aerosol subtype for the trajectory (blue color) shown in (a). The red dotted lines enclose the study area in the Colombian Caribbean.
Water 15 03150 g0a4
Figure A5. Monthly distribution of Average Dust Extinction AOT 550 nm for (2000–2020), using data from MERRA-2 Model M2TMNXAER v5.12.4, which shows Saharan dust distribution from North Africa to the Caribbean Sea and Colombia. Red dotted line shows the highest monthly concentrations that reach the Colombian mainland arrive in June and July with AOT values between 47.71 × 10⁻³ and 113.4 × 10⁻³.
Water 15 03150 g0a5
Figure A6. Wind rose for the studied areas. The wind rose for each Colombian tropical glacier studied shows how many hours per year the wind blows from the indicated direction. Source: Simulated historical climate and weather (https://www.meteoblue.com/en/weather/historyclimate/climatemodelled/ (accessed on 1 August 2023)).
Water 15 03150 g0a6

References

  1. Varga, G. Changing Nature of Saharan Dust Deposition in the Carpathian Basin (Central Europe): 40 Years of Identified North African Dust Events (1979–2018). Environ. Int. 2020, 139, 105712. [Google Scholar] [CrossRef]
  2. Dastrup, D.B.; Carling, G.; Collins, S.A.; Nelson, S.; Fernandez, D.P.; Tingey, D.G.; Hahnenberger, M.; Aanderud, Z.T. Aeolian Dust Chemistry and Bacterial Communities in Snow Are Unique to Airshed Locations across Northern Utah, USA. Atmos. Environ. 2018, 193, 251–261. [Google Scholar] [CrossRef]
  3. Couto, F.T.; Cardoso, E.H.C.; Costa, M.J.; Salgado, R.; Guerrero-Rascado, J.L.; Salgueiro, V. How a Mesoscale Cyclonic Vortex over Sahara Leads to a Dust Outbreak in South-Western Iberia. Atmos. Res. 2021, 249, 105302. [Google Scholar] [CrossRef]
  4. Mamun, A.; Chen, Y.; Liang, J. Radiative and Cloud Microphysical Effects of the Saharan Dust Simulated by the WRF-Chem Model. J. Atmos. Sol.-Terr. Phys. 2021, 219, 105646. [Google Scholar] [CrossRef]
  5. Shen, J.; Xie, X.; Cheng, X.; Liu, X. Effects of Dust-in-Snow Forcing over the Tibetan Plateau on the East Asian Dust Cycle during the Last Glacial Maximum. Palaeogeogr. Palaeoclimatol. Palaeoecol. 2020, 542, 109442. [Google Scholar] [CrossRef]
  6. Cruz-Núñez, X.; Cruz-Núñez, X. Black Carbon Radiative Forcing in South Mexico City, 2015. Atmósfera 2019, 32, 167–179. [Google Scholar] [CrossRef]
  7. Skiles, S.M.; Painter, T.H.; Deems, J.; Landry, C.; Bryant, A. Dust Radiative Forcing in Snow of the Upper Colorado River Basin. Part II: Interannual Variability in Radiative Forcing and Snowmelt Rates. Water Resour. Res. 2012, 48, W07522. [Google Scholar] [CrossRef]
  8. Wei, T.; Dong, Z.; Kang, S.; Qin, X.; Guo, Z. Geochemical Evidence for Sources of Surface Dust Deposited on the Laohugou Glacier, Qilian Mountains. Appl. Geochem. 2017, 79, 1–8. [Google Scholar] [CrossRef]
  9. Jiao, X.; Dong, Z.; Brahney, J.; Parteli, E.J.R.; Li, F.; Marcelli, A.; Wei, T. Uranium Isotopes of Aeolian Dust Deposited in Northern Tibetan Plateau Glaciers: Implications for Tracing Aeolian Dust Provenance. Fundam. Res. 2022, 2, 716–726. [Google Scholar] [CrossRef]
  10. Francis, D.; Fonseca, R.; Nelli, N.; Bozkurt, D.; Picard, G.; Guan, B. Atmospheric Rivers Drive Exceptional Saharan Dust Transport towards Europe. Atmos. Res. 2022, 266, 105959. [Google Scholar] [CrossRef]
  11. Shi, T.; Cui, J.; Wu, D.; Xing, Y.; Chen, Y.; Zhou, Y.; Pu, W.; Wang, X. Snow Albedo Reductions Induced by the Internal/External Mixing of Black Carbon and Mineral Dust, and Different Snow Grain Shapes across Northern China. Environ. Res. 2022, 208, 112670. [Google Scholar] [CrossRef]
  12. Livneh, B.; Deems, J.S.; Buma, B.; Barsugli, J.J.; Schneider, D.; Molotch, N.P.; Wolter, K.; Wessman, C.A. Catchment Response to Bark Beetle Outbreak and Dust-on-Snow in the Colorado Rocky Mountains. J. Hydrol. 2015, 523, 196–210. [Google Scholar] [CrossRef]
  13. Reynolds, R.L.; Goldstein, H.L.; Moskowitz, B.M.; Bryant, A.C.; Skiles, S.M.; Kokaly, R.F.; Flagg, C.B.; Yauk, K.; Berquó, T.; Breit, G.; et al. Composition of Dust Deposited to Snow Cover in the Wasatch Range (Utah, USA): Controls on Radiative Properties of Snow Cover and Comparison to Some Dust-Source Sediments. Aeolian Res. 2014, 15, 73–90. [Google Scholar] [CrossRef]
  14. Painter, T.H.; Skiles, S.M.; Deems, J.S.; Bryant, A.C.; Landry, C.C. Dust Radiative Forcing in Snow of the Upper Colorado River Basin: 1. A 6 Year Record of Energy Balance, Radiation, and Dust Concentrations. Water Resour. Res. 2012, 48, W07521. [Google Scholar] [CrossRef]
  15. Zhang, F.; Zhang, L.; Pan, M.; Zhong, X.; Zhao, E.; Wang, Y.; Du, C. Black Carbon and Mineral Dust in Snow Cover across a Typical City of Northeast China. Sci. Total Environ. 2022, 807, 150397. [Google Scholar] [CrossRef]
  16. Wu, G.; Zhang, C.; Zhang, X.; Xu, T.; Yan, N.; Gao, S. The Environmental Implications for Dust in High-Alpine Snow and Ice Cores in Asian Mountains. Glob. Planet. Change 2015, 124, 22–29. [Google Scholar] [CrossRef]
  17. Tieber, A.; Lettner, H.; Bossew, P.; Hubmer, A.; Sattler, B.; Hofmann, W. Accumulation of Anthropogenic Radionuclides in Cryoconites on Alpine Glaciers. J. Environ. Radioact. 2009, 100, 590–598. [Google Scholar] [CrossRef]
  18. Dong, Z.; Kang, S.; Qin, D.; Li, Y.; Wang, X.; Ren, J.; Li, X.; Yang, J.; Qin, X. Provenance of Cryoconite Deposited on the Glaciers of the Tibetan Plateau: New Insights from Nd-Sr Isotopic Composition and Size Distribution. J. Geophys. Res. Atmos. 2016, 121, 7371–7382. [Google Scholar] [CrossRef]
  19. Stibal, M. Algae Drive Enhanced Darkening of Bare Ice on the Greenland Ice Sheet. Geophys. Res. Lett. 2017, 44, 11463–11471. [Google Scholar] [CrossRef]
  20. Dong, Z.; Qin, D.; Chen, J.; Qin, X.; Ren, J.; Cui, X.; Du, Z.; Kang, S. Physicochemical Impacts of Dust Particles on Alpine Glacier Meltwater at the Laohugou Glacier Basin in Western Qilian Mountains, China. Sci. Total Environ. 2014, 493, 930–942. [Google Scholar] [CrossRef]
  21. Redmond, H.E.; Dial, K.D.; Thompson, J.E. Light Scattering and Absorption by Wind Blown Dust: Theory, Measurement, and Recent Data. Aeolian Res. 2010, 2, 5–26. [Google Scholar] [CrossRef]
  22. Adame, J.A.; Notario, A.; Cuevas, C.A.; Saiz-Lopez, A. Saharan Air Outflow Variability in the 1980–2020 Period. Sci. Total Environ. 2022, 839, 156268. [Google Scholar] [CrossRef]
  23. Bigio, L.; Mayol-Bracero, O.L.; Santos, G.; Fishman, A.; Angert, A. Are the Phosphate Oxygen Isotopes of Saharan Dust a Robust Tracer of Atmospheric P Source? Atmos. Environ. 2020, 235, 117561. [Google Scholar] [CrossRef]
  24. Jiménez-Espejo, F.J.; García-Alix, A.; Jiménez-Moreno, G.; Rodrigo-Gámiz, M.; Anderson, R.S.; Rodríguez-Tovar, F.J.; Martínez-Ruiz, F.; Giralt, S.; Delgado Huertas, A.; Pardo-Igúzquiza, E. Saharan Aeolian Input and Effective Humidity Variations over Western Europe during the Holocene from a High Altitude Record. Chem. Geol. 2014, 374–375, 1–12. [Google Scholar] [CrossRef]
  25. Pérez-Martínez, C.; Rühland, K.M.; Smol, J.P.; Jones, V.J.; Conde-Porcuna, J.M. Long-Term Ecological Changes in Mediterranean Mountain Lakes Linked to Recent Climate Change and Saharan Dust Deposition Revealed by Diatom Analyses. Sci. Total Environ. 2020, 727, 138519. [Google Scholar] [CrossRef]
  26. Francis, D.; Eayrs, C.; Chaboureau, J.-P.; Mote, T.; Holland, D.M. A meandering polar jet caused the development of a Saharan cyclone and the transport of dust toward Greenland. Adv. Sci. Res. 2019, 16, 49–56. [Google Scholar] [CrossRef]
  27. Di Mauro, B.; Garzonio, R.; Rossini, M.; Filippa, G.; Pogliotti, P.; Galvagno, M.; Morra Di Cella, U.; Migliavacca, M.; Baccolo, G.; Clemenza, M.; et al. Saharan Dust Events in the European Alps: Role in Snowmelt and Geochemical Characterization. Cryosphere 2019, 13, 1147–1165. [Google Scholar] [CrossRef]
  28. Lawrence, C.R.; Painter, T.H.; Landry, C.C.; Neff, J.C. Contemporary Geochemical Composition and Flux of Aeolian Dust to the San Juan Mountains, Colorado, United States. J. Geophys. Res. Biogeosci. 2010, 115, G03007. [Google Scholar] [CrossRef]
  29. Deems, J.S.; Painter, T.H.; Barsugli, J.J.; Belnap, J.; Udall, B. Combined Impacts of Current and Future Dust Deposition and Regional Warming on Colorado River Basin Snow Dynamics and Hydrology. Hydrol. Earth Syst. Sci. 2013, 17, 4401–4413. [Google Scholar] [CrossRef]
  30. Fassnacht, S.R.; Duncan, C.R.; Pfohl, A.K.D.; Webb, R.W.; Derry, J.E.; Sanford, W.E.; Reimanis, D.C.; Doskocil, L.G. Drivers of Dust-Enhanced Snowpack Melt-Out and Streamflow Timing. Hydrology 2022, 9, 47. [Google Scholar] [CrossRef]
  31. Tanaka, T.Y.; Chiba, M. A Numerical Study of the Contributions of Dust Source Regions to the Global Dust Budget. Glob. Planet. Change 2006, 52, 88–104. [Google Scholar] [CrossRef]
  32. Pandis, S.N.; Wexler, A.S.; Seinfeld, J.H. Dynamics of Tropospheric Aerosols. J. Phys. Chem. 1995, 99, 9646–9659. [Google Scholar] [CrossRef]
  33. Niedermeier, N.; Held, A.; Müller, T.; Heinold, B.; Schepanski, K.; Tegen, I.; Kandler, K.; Ebert, M.; Weinbruch, S.; Read, K.; et al. Mass Deposition Fluxes of Saharan Mineral Dust to the Tropical Northeast Atlantic Ocean: An Intercomparison of Methods. Atmos. Chem. Phys. 2014, 14, 2245–2266. [Google Scholar] [CrossRef]
  34. Wang, Q.; Gu, J.; Wang, X. The Impact of Sahara Dust on Air Quality and Public Health in European Countries. Atmos. Environ. 2020, 241, 117771. [Google Scholar] [CrossRef]
  35. Ridley, D.A.; Heald, C.L.; Ford, B. North African Dust Export and Deposition: A Satellite and Model Perspective. J. Geophys. Res. Atmos. 2012, 117, D02202. [Google Scholar] [CrossRef]
  36. Shi, T.; He, C.; Zhang, D.; Zhang, X.; Niu, X.; Xing, Y.; Chen, Y.; Cui, J.; Pu, W.; Wang, X. Opposite Effects of Mineral Dust Nonsphericity and Size on Dust-Induced Snow Albedo Reduction. Geophys. Res. Lett. 2022, 49, e2022GL099031. [Google Scholar] [CrossRef]
  37. Zhao, D.; Chen, S.; Chen, Y.; Gong, Y.; Lou, G.; Cheng, S.; Bi, H. Influence of Dust Aerosols on Snow Cover Over the Tibetan Plateau. Front. Environ. Sci. 2022, 10, 839691. [Google Scholar] [CrossRef]
  38. Kaspari, S.; Painter, T.H.; Gysel, M.; Skiles, S.M.; Schwikowski, M. Seasonal and Elevational Variations of Black Carbon and Dust in Snow and Ice in the Solu-Khumbu, Nepal and Estimated Radiative Forcings. Atmos. Chem. Phys. 2014, 14, 8089–8103. [Google Scholar] [CrossRef]
  39. Zhang, Y.; Kang, S.; Sprenger, M.; Cong, Z.; Gao, T.; Li, C.; Tao, S.; Li, X.; Zhong, X.; Xu, M.; et al. Black Carbon and Mineral Dust in Snow Cover on the Tibetan Plateau. Cryosphere 2018, 12, 413–431. [Google Scholar] [CrossRef]
  40. Sarangi, C.; Qian, Y.; Rittger, K.; Ruby Leung, L.; Chand, D.; Bormann, K.J.; Painter, T.H. Dust Dominates High-Altitude Snow Darkening and Melt over High-Mountain Asia. Nat. Clim. Change 2020, 10, 1045–1051. [Google Scholar] [CrossRef]
  41. Réveillet, M.; Dumont, M.; Gascoin, S.; Lafaysse, M.; Nabat, P.; Ribes, A.; Nheili, R.; Tuzet, F.; Ménégoz, M.; Morin, S.; et al. Black Carbon and Dust Alter the Response of Mountain Snow Cover under Climate Change. Nat. Commun. 2022, 13, 5279. [Google Scholar] [CrossRef] [PubMed]
  42. Painter, T.H.; Barrett, A.P.; Landry, C.C.; Neff, J.C.; Cassidy, M.P.; Lawrence, C.R.; McBride, K.E.; Farmer, G.L. Impact of Disturbed Desert Soils on Duration of Mountain Snow Cover. Geophys. Res. Lett. 2007, 34, L12502. [Google Scholar] [CrossRef]
  43. Bolaño-Ortiz, T.R.; Castro, L.; Ruggeri, M.F.; Fadic, X.; Hernandez, T.G.; Vidal, V.; Flores, R.; Cereceda-Balic, F. Snow Albedo Variation Due to Light Absorbing Particles from the Period 2000 to 2020 in the El Yeso Basin, Chile. In Proceedings of the 114th (2021) A&WMA Annual Conference, Online, 14–17 June 2021. [Google Scholar]
  44. Schmitt, C.G.; All, J.D.; Schwarz, J.P.; Arnott, W.P.; Cole, R.J.; Lapham, E.; Celestian, A. Measurements of Light-Absorbing Particles on the Glaciers in the Cordillera Blanca, Peru. Cryosphere 2015, 9, 331–340. [Google Scholar] [CrossRef]
  45. Lindau, F.G.L.; Simões, J.C.; Delmonte, B.; Ginot, P.; Baccolo, G.; Paleari, C.I.; Di Stefano, E.; Korotkikh, E.; Introne, D.S.; Maggi, V.; et al. Giant Dust Particles at Nevado Illimani: A Proxy of Summertime Deep Convection over the Bolivian Altiplano. Cryosphere 2021, 15, 1383–1397. [Google Scholar] [CrossRef]
  46. de Magalhães, N.; Evangelista, H.; Condom, T.; Rabatel, A.; Ginot, P. Amazonian Biomass Burning Enhances Tropical Andean Glaciers Melting. Sci. Rep. 2019, 9, 16914. [Google Scholar] [CrossRef] [PubMed]
  47. Bolaño-Ortiz, T.R.; Diaz-Gutiérrez, V.L.; Camargo-Caicedo, Y. ENSO and Light-Absorbing Impurities and Their Impact on Snow Albedo in the Sierra Nevada de Santa Marta, Colombia. Geosciences 2020, 10, 437. [Google Scholar] [CrossRef]
  48. Mendez, J.F.; Herrera, L.C.P.; Cerón, L.C.B. Study of a Saharan Dust Intrusion into the Atmosphere of Colombia. Rev. Ing. Univ. Medellín 2018, 17, 17–34. [Google Scholar] [CrossRef]
  49. Gilardoni, S.; Di Mauro, B.; Bonasoni, P. Black Carbon, Organic Carbon, and Mineral Dust in South American Tropical Glaciers: A Review. Glob. Planet. Change 2022, 213, 103837. [Google Scholar] [CrossRef]
  50. Schauwecker, S.; Rohrer, M.; Huggel, C.; Endries, J.; Montoya, N.; Neukom, R.; Perry, B.; Salzmann, N.; Schwarb, M.; Suarez, W. The Freezing Level in the Tropical Andes, Peru: An Indicator for Present and Future Glacier Extents. J. Geophys. Res. Atmos. 2017, 122, 5172–5189. [Google Scholar] [CrossRef]
  51. Clow, D.W.; Williams, M.W.; Schuster, P.F. Increasing Aeolian Dust Deposition to Snowpacks in the Rocky Mountains Inferred from Snowpack, Wet Deposition, and Aerosol Chemistry. Atmos. Environ. 2016, 146, 183–194. [Google Scholar] [CrossRef]
  52. Vuille, M.; Carey, M.; Huggel, C.; Buytaert, W.; Rabatel, A.; Jacobsen, D.; Soruco, A.; Villacis, M.; Yarleque, C.; Elison Timm, O.; et al. Rapid Decline of Snow and Ice in the Tropical Andes—Impacts, Uncertainties and Challenges Ahead. Earth-Sci. Rev. 2018, 176, 195–213. [Google Scholar] [CrossRef]
  53. Veettil, B.K.; Kamp, U. Global Disappearance of Tropical Mountain Glaciers: Observations, Causes, and Challenges. Geosciences 2019, 9, 196. [Google Scholar] [CrossRef]
  54. Bohn, N.; Painter, T.H.; Thompson, D.R.; Carmon, N.; Susiluoto, J.; Turmon, M.J.; Helmlinger, M.C.; Green, R.O.; Cook, J.M.; Guanter, L. Optimal Estimation of Snow and Ice Surface Parameters from Imaging Spectroscopy Measurements. Remote Sens. Environ. 2021, 264, 112613. [Google Scholar] [CrossRef]
  55. IGAC. IGAC—Instituto Geográfico Agustín Codazzi. Available online: https://web.archive.org/web/20170306134231/http://www2.igac.gov.co/igac_web/contenidos/plantilla_general_titulo_contenido.jsp?idMenu=212 (accessed on 23 September 2021).
  56. López-Moreno, J.I.; Ceballos, J.L.; Rojas-Heredia, F.; Zabalza-Martinez, J.; Vidaller, I.; Revuelto, J.; Alonso-González, E.; Morán-Tejeda, E.; García-Ruiz, J.M. Topographic Control of Glacier Changes since the End of the Little Ice Age in the Sierra Nevada de Santa Marta Mountains, Colombia. J. South Am. Earth Sci. 2020, 104, 102803. [Google Scholar] [CrossRef]
  57. WWF. World Wildlife Fund—WWF. Available online: https://www.wwf.org.co/?364410/Por-que-los-Andes-son-esenciales-para-nuestra-salud-y-la-del-planeta (accessed on 21 September 2021).
  58. Ceballos, J.L.; Euscátegui, C.; Ramírez, J.; Cañon, M.; Huggel, C.; Haeberli, W.; Machguth, H. Fast Shrinkage of Tropical Glaciers in Colombia. Ann. Glaciol. 2006, 43, 194–201. [Google Scholar] [CrossRef]
  59. IDEAM. Instituto de Hidrología Meteorología y Estudios Ambientales Glaciares En Colombia. Available online: http://www.ideam.gov.co/web/ecosistemas/glaciares (accessed on 28 July 2021).
  60. IDEAM. Glaciares de Colombia Más Que Montañas Con Hielo; IDEAM Colombia: Bogotá, Columbia, 2012; ISBN 978-958-8067-57-5. [Google Scholar]
  61. SIAC. Sistema de Informacion Ambiental de Colombia. Available online: http://www.siac.gov.co/ (accessed on 9 August 2022).
  62. Ceballos, J.; Tobón, E. Glaciares Colombianos: Evolución Reciente Y Estado Actual. Boletín Geol. 2007, 29, 143–151. [Google Scholar]
  63. IDEAM. GLACIARES EN COLOMBIA. Available online: http://www.ideam.gov.co/web/ecosistemas/glaciares-colombia (accessed on 8 August 2022).
  64. Eastman, J.R. IDRISI Taiga Guide to GIS and Image Processing; Clark Labs Clark University: Worcester, MA, USA, 2009. [Google Scholar]
  65. NASA. MODIS Snow Products Collection 6.1 User Guide. Available online: https://modis-snow-ice.gsfc.nasa.gov/uploads/snow_user_guide_C6.1_final_revised_april.pdf (accessed on 20 February 2023).
  66. Wan, Z. A Generalized Split-Window Algorithm for Retrieving Land-Surface Temperature from Space. IEEE Trans. Geosci. Remote Sens. 1996, 34, 892–905. [Google Scholar] [CrossRef]
  67. NASA. CALIPSO Products. Available online: https://www-calipso.larc.nasa.gov/products/lidar/browse_images/show_v4_detail.php?s=production&v=V4-10&browse_date=2020-06-23&orbit_time=06-39-03&page=1&granule_name=CAL_LID_L1-Standard-V4-10.2020-06-23T06-39-03ZN.hdf (accessed on 10 June 2022).
  68. Duarte, A.L.; Schneider, I.L.; Artaxo, P.; Oliveira, M.L.S. Spatiotemporal Assessment of Particulate Matter (PM10 and PM2.5) and Ozone in a Caribbean Urban Coastal City. Geosci. Front. 2021, 13, 101168. [Google Scholar] [CrossRef]
  69. Dunion, J.P. Rewriting the Climatology of the Tropical North Atlantic and Caribbean Sea Atmosphere. J. Clim. 2011, 24, 893–908. [Google Scholar] [CrossRef]
  70. Buchard, V.; da Silva, A.M.; Colarco, P.R.; Darmenov, A.; Randles, C.A.; Govindaraju, R.; Torres, O.; Campbell, J.; Spurr, R. Using the OMI Aerosol Index and Absorption Aerosol Optical Depth to Evaluate the NASA MERRA Aerosol Reanalysis. Atmos. Chem. Phys. 2015, 15, 5743–5760. [Google Scholar] [CrossRef]
  71. Voss, K.K.; Evan, A.T. A New Satellite-Based Global Climatology of Dust Aerosol Optical Depth. J. Appl. Meteorol. Climatol. 2020, 59, 83–102. [Google Scholar] [CrossRef]
  72. Ramírez-Romero, C.; Jaramillo, A.; Córdoba, M.F.; Raga, G.B.; Miranda, J.; Alvarez-Ospina, H.; Rosas, D.; Amador, T.; Kim, J.S.; Yakobi-Hancock, J.; et al. African Dust Particles over the Western Caribbean—Part I: Impact on Air Quality over the Yucatán Peninsula. Atmos. Chem. Phys. 2021, 21, 239–253. [Google Scholar] [CrossRef]
  73. Petit, R.H.; Legrand, M.; Jankowiak, I.; Molinié, J.; Asselin de Beauville, C.; Marion, G.; Mansot, J.L. Transport of Saharan Dust over the Caribbean Islands: Study of an Event. J. Geophys. Res. Atmos. 2005, 110, D18S09. [Google Scholar] [CrossRef]
  74. Lau, W.K.M.; Sang, J.; Kim, M.K.; Kim, K.M.; Koster, R.D.; Yasunari, T.J. Impacts of Snow Darkening by Deposition of Light-Absorbing Aerosols on Hydroclimate of Eurasia During Boreal Spring and Summer. J. Geophys. Res. Atmos. 2018, 123, 8441–8461. [Google Scholar] [CrossRef]
  75. Moosmüller, H.; Chakrabarty, R.K.; Arnott, W.P. Aerosol Light Absorption and Its Measurement: A Review. J. Quant. Spectrosc. Radiat. Transf. 2009, 110, 844–878. [Google Scholar] [CrossRef]
  76. Qian, Y.; Yasunari, T.J.; Doherty, S.J.; Flanner, M.G.; Lau, W.K.M.; Ming, J.; Wang, H.; Wang, M.; Warren, S.G.; Zhang, R. Light-Absorbing Particles in Snow and Ice: Measurement and Modeling of Climatic and Hydrological Impact. Adv. Atmos. Sci. 2015, 32, 64–91. [Google Scholar] [CrossRef]
  77. Niu, H.; Kang, S.; Wang, Y.; Sarangi, C.; Rupakheti, D.; Qian, Y. Measurements of Light-Absorbing Impurities in Snow over Four Glaciers on the Tibetan Plateau. Atmos. Res. 2020, 243, 105002. [Google Scholar] [CrossRef]
  78. Li, X.; Kang, S.; Zhang, G.; Qu, B.; Tripathee, L.; Paudyal, R.; Jing, Z.; Zhang, Y.; Yan, F.; Li, G.; et al. Light-Absorbing Impurities in a Southern Tibetan Plateau Glacier: Variations and Potential Impact on Snow Albedo and Radiative Forcing. Atmos. Res. 2018, 200, 77–87. [Google Scholar] [CrossRef]
  79. Cuffey, K.M.; Paterson, W.S.B. The Physics of Glaciers; Academic Press: Cambridge, MA, USA, 2010. [Google Scholar]
  80. Flanner, M.G.; Zender, C.S. Linking Snowpack Microphysics and Albedo Evolution. J. Geophys. Res. 2006, 111, D12208. [Google Scholar] [CrossRef]
  81. Rohde, A.; Vogel, H.; Hoshyaripour, G.A.; Kottmeier, C.; Vogel, B. Regional Impact of Snow-Darkening on Snow Pack and the Atmosphere During a Severe Saharan Dust Deposition Event in Eurasia. J. Geophys. Res. Earth Surf. 2023, 128, e2022JF007016. [Google Scholar] [CrossRef]
  82. Lee, W.-L.; Liou, K.N. Effect of Absorbing Aerosols on Snow Albedo Reduction in the Sierra Nevada. Atmos. Environ. 2012, 55, 425–430. [Google Scholar] [CrossRef]
  83. Bolaño-Ortiz, T.R.; Pascual-Flores, R.M.; López-Noreña, A.I.; Ruggeri, M.F.; Lakkis, S.G.; Fernández, R.P.; Puliafito, S.E. Assessment of Absorbing Aerosols on Austral Spring Snow Albedo Reduction by Several Basins in the Central Andes of Chile from Daily Satellite Observations (2000–2016) and a Case Study with the WRF-Chem Model. SN Appl. Sci. 2019, 1, 1352. [Google Scholar] [CrossRef]
  84. He, C.; Liou, K.-N.; Takano, Y.; Chen, F.; Barlage, M. Enhanced Snow Absorption and Albedo Reduction by Dust-Snow Internal Mixing: Modeling and Parameterization. J. Adv. Model. Earth Syst. 2019, 11, 3755–3776. [Google Scholar] [CrossRef]
  85. Christensen, N.S.; Lettenmaier, D.P. A Multimodel Ensemble Approach to Assessment of Climate Change Impacts on the Hydrology and Water Resources of the Colorado River Basin. Hydrol. Earth Syst. Sci. 2007, 11, 1417–1434. [Google Scholar] [CrossRef]
  86. Vuille, M.; Francou, B.; Wagnon, P.; Juen, I.; Kaser, G.; Mark, B.G.; Bradley, R.S. Climate Change and Tropical Andean Glaciers: Past, Present and Future. Earth-Sci. Rev. 2008, 89, 79–96. [Google Scholar] [CrossRef]
  87. IPCC. Climate Change 2014: Synthesis Report. Contribution of Working Groups I, II and III to the Fifth Assessment Report of the Intergovernmental Panel on Climate Change; Cambridge University Press: Cambridge, UK, 2014. [Google Scholar]
  88. IPCC. Climate Change 2007: Impacts, Adaptation and Vulnerability: Contribution of Working Group II to the Fourth Assessment Report of the Intergovernmental Panel; Cambridge University Press: Cambridge, UK, 2007. [Google Scholar]
  89. Stocker, T.F.; Qin, D.; Plattner, G.-K.; Tignor, M.; Allen, S.K.; Boschung, J.; Nauels, A.; Xia, Y.; Bex, V.; Midgley, P.M. (Eds.) IPCC, 2013: Climate Change 2013: The Physical Science Basis; Cambridge University Press: Cambridge, UK, 2013; pp. 571–657. [Google Scholar]
  90. Shi, T.; Cui, J.; Chen, Y.; Zhou, Y.; Pu, W.; Xu, X.; Chen, Q.; Zhang, X.; Wang, X. Enhanced Light Absorption and Reduced Snow Albedo Due to Internally Mixed Mineral Dust in Grains of Snow. Atmos. Chem. Phys. 2021, 21, 6035–6051. [Google Scholar] [CrossRef]
  91. Xie, X.; Liu, X.; Che, H.; Xie, X.; Li, X.; Shi, Z.; Wang, H.; Zhao, T.; Liu, Y. Radiative Feedbacks of Dust in Snow over Eastern Asia in CAM4-BAM. Atmos. Chem. Phys. 2018, 18, 12683–12698. [Google Scholar] [CrossRef]
Figure 1. Location of the glacial areas under study in South America and Colombia. (a) Distribution of glacial areas in Colombia; (b) Sierra Nevada de Santa Marta; (c) Nevado del Huila; (d) Nevado del Ruíz (1), Nevado de Santa Isabel (2), and Nevado del Tolima (3); and (e) Sierra Nevada del Cocuy.
Water 15 03150 g001
Figure 2. Average monthly data of dust deposition (MERRA-2) in Colombia in the period from 2000 to 2020. Bars indicate quartile 1 and quartile 2, red lines is the median and red asterisks are extreme values outside of the interquartile range.
Water 15 03150 g002
Figure 3. Saharan dust distribution from North Africa to the Caribbean Sea and Colombia in America. Observed through the average dust extinction AOT 550 nm for June and July months (2000–2020), using data from MERRA-2 Model M2TMNXAER v5.12.4.
Water 15 03150 g003
Figure 4. Snow Albedo (left panels) and Dust Deposition (right panels) anomalies from June and July daily values (2000 to 2020) in all the Colombian glaciers studied. Values expressed as a function of the standard deviation—SD, namely, in the Nevado del Ruíz—NDR (SDSnowAlbedo = 14.4% (a); SDDustDeposition = 12.83 mg·m−2 (b)), the Nevado de Santa Isabel—NDS (SDSnowAlbedo = 14.7% (c); SDDustDeposition = 49.89 mg·m−2 (d)), the Nevado del Tolima—NDT (SDSnowAlbedo = 11.6% (e); SDDustDeposition = 12.12 mg·m−2 (f)), the Nevado del Huila—NDH (SDSnowAlbedo = 12% (g); SDDustDeposition = 9.97 mg m−2 (h)), the Sierra Nevada del Cocuy—SNC (SDSnowAlbedo = 13.13% (i); SDDustDeposition = 14.94 mg m−2 (j)) and, the Sierra Nevada de Santa Marta—SNSM (SDSnowAlbedo = 10.7% (k); SDDustDeposition = 44.26 mg m−2 (l)). Red arrows indicate prevailing wind direction (as shown in Figure A6).
Water 15 03150 g004
Table 1. Location and main geographical characteristics of glacial areas in Colombia, listings from north to south [59].
Glacial Areas in ColombiaGeographical CoordinatesMaximum Height
(m a.s.l.)
Glacier Area (km2)
Sierra Nevada de Santa Marta (SNSM)10°49′ N; 73°39′ W57755.81
Sierra Nevada del Cocuy (SNC)6°27′ N; 72°17′ W538013.19
Nevado del Ruíz (NDR)4°53′ N; 75°19′ W53308.14
Nevado de Santa Isabel (NDS)4°49′ N; 75°22′ W49680.45
Nevado del Tolima (NDT)4°39′ N; 75°22′ W52800.52
Nevado del Huila (NDH)2°55′ N; 76°03′ W53646.74
Table 2. Comparative summary of the main results listed from north to south for each tropical glacier studied in Colombia. Wind roses analyzed to determine the predominant wind direction are shown in Figure A6.
Colombian Tropical Glacier Studied Sen’s SlopeMultiple Regression AnalysisPrevailing Wind Direction
×10−3 µg·m−2·year−1p-ValueR2p-Value
SNSM6.58<0.0010.71<0.001East and Northeast
SNC5.19<0.0010.56<0.001Northeast
NDR3.54<0.0010.64<0.001Northeast
NDS3.54<0.0010.59<0.001Northeast and Southeast
NDT3.53<0.0010.150.85Southeast
NDH2.81<0.0010.490.07Southeast
Disclaimer/Publisher’s Note: The statements, opinions and data contained in all publications are solely those of the individual author(s) and contributor(s) and not of MDPI and/or the editor(s). MDPI and/or the editor(s) disclaim responsibility for any injury to people or property resulting from any ideas, methods, instructions or products referred to in the content.

