Article

Spatiotemporal Patterns of Heavy-Metal Pollution in Coastal Pinqing Lagoon (Southern China): Anthropogenic and Hydrological Effect

1
School of Geographical Sciences and Remote Sensing, Guangzhou University, Guangzhou 510006, China
2
Centre for Climate and Environmental Changes, Guangzhou University, Guangzhou 510006, China
3
Guangzhou Satellite Station, National Satellite Meteorological Center, Guangzhou 510640, China
4
Department of Infrastructure Engineering, University of Melbourne, Melbourne 3010, Australia
5
Department of Hydraulic Engineering, Tsinghua University, Beijing 100084, China
6
School of Geographical Sciences, Nanjing University of Information Science and Technology, Nanjing 210044, China
*
Authors to whom correspondence should be addressed.
Water 2023, 15(17), 3126; https://doi.org/10.3390/w15173126
Submission received: 7 August 2023 / Revised: 24 August 2023 / Accepted: 27 August 2023 / Published: 31 August 2023
(This article belongs to the Section Oceans and Coastal Zones)

Abstract

:
Coastal lagoons connecting the land and sea provide essential ecosystem services. However, emerging environmental issues such as environmental pollution and ecological degradation from rapid socio-economic development in coastal zones of south China are becoming increasingly prevalent. This study examined the spatiotemporal variation, sources, assessments, and driving forces of heavy metals based on core and surface sediments collected from Pinqing Lagoon, a coastal lagoon in South China. Sediment cores (PQ1, PQ2, and PQ3) showed distinct vertical variations in the content of Cu, Cd, Zn, Pb, As, and Sb with an average coefficient of variation (C.V.) of 0.25. However, a relatively lower vertical variation (C.V. mean = 0.13) was shown by the other elements (Mn, V, Ni, Cr, and Co). Although Cu was the chief pollutant heavy metal and it had mean values of 1.6 and 1.7 for the enrichment factor (EF) and contamination factor (CF), respectively, Cd posed the highest ecological risk ( E r i   mean = 36.34). A century-scale anthropogenic disturbance and growing industrial activities in the lagoon area have caused heavy-metal pollution in Pinqing Lagoon. Wastewater discharge into the lagoon over the past 30 years has further aggravated the pollution. The land-use pattern changes in the catchment and removal of polluting industries resulted in a shift in the center of gravity of heavy-metal pollution in the surface sediment of the lagoon. When integrated with the available data, significant pollution gradients were observed suggesting that the pollution level of Pinqing Lagoon was slightly higher than the marginal sea (Honghai Bay) but significantly lower than the adjacent inland water bodies (Gongping and Chisha Reservoirs). This difference attributes unique hydrodynamic conditions to the Pinqing Lagoon, which consistently mitigates environmental pollution by lying at the interface between inland water and the coastal sea in South China. These conditions resulted in the relatively low contamination degree (CD mean = 7.5) and the low ecological risk index (RI mean = 70) over the past 150 years in Pinqing Lagoon.

1. Introduction

Coastal lagoons, which are one of the distinctive ecosystems in coastal zones, play a crucial role in providing essential goods and services for society, including recreational, navigational, shipping platform, salt production and trade, and fish farming activities [1]. Coastal lagoons protect cities from storms and floods by acting as flood storage basins [2]. China contains many coastal lagoons. However, these lagoons are facing unprecedented anthropogenic disturbances due to the accelerated resource development activities occurring since 1960, resulting in size loss, heavy-metal pollution, and other environmental degradations including coastal erosion [3,4,5,6]. The ongoing impacts over the recent decades have largely constrained sustainable and healthy economic development of coastal regions in China. Hence, valuable scientific insights are becoming increasingly crucial for the restoration of baseline environments, the prevention and control of pollution, and the sustainable development of coastal lagoons in China during the 21st century. This requires a comprehensive assessment of the quality of the coastal environment by tracking pollution sources, followed by the determination of the major driving forces of long-term environmental change in the region [5,7].
Notably, environmental pollution issues in coastal lagoons, including heavy metals, have garnered significant attention worldwide [8,9]. Research on these issues has primarily focused on the Mediterranean Sea [10,11] and the coastal regions of the Americas [12,13], with limited studies conducted in China. Consequently, this study chose the largest coastal lagoon (Pinqing Lagoon) in mainland China, located in eastern Guangdong Province, as our research subject. Pinqing Lagoon is situated in one of the socio-economically advanced areas in South China, as the vicinity of the lagoon has undergone rapid industrialization and urbanization over the past 50 years. These changes have, however, increased ecological and environmental challenges in the lagoon, including increased eutrophication [14], overuse of environmental organochlorine pesticide residues [15], red tide [16], and heavy-metal contamination [17,18]. Among the environmental issues, heavy-metal contamination in the sediments of Pinqing Lagoon has had a potentially serious toxic effect on benthic organisms [17,18].
Although anthropogenic disturbances have been regarded as the key driving force for changes in the environmental quality of Pinqing Lagoon over recent decades [19,20], most studies on the lagoon are either limited to contemporary records or palaeoecological data comprising only a single sediment core to a shorter time scale [18,20,21]. Detecting long-term environmental pollution in a coastal lagoon requires high-resolution historical information recorded from sediments, which can potentially reveal the heavy-metal contamination over time [7,22]. The high-resolution study also identifies trends in heavy-metal concentration on an annual or sub-annual basis, spatial distribution [14,20], and metal baseline over the historical period [20] through analysis of PQ2, S18, and S29 cores, along with surface samples [14,20]. However, these studies in Pinqing Lagoon failed to clearly reveal the specific details of anthropogenic impacts. The spatial differences in the historical contamination of heavy metals within the lagoon, and the difference between Pinqing Lagoon and its adjacent water bodies (open sea and inland water bodies), remained unclear. This deficiency has impeded accurate pollution assessment and the source identification, and it complicates pollution management [23]. Therefore, a thorough and comprehensive study is imperative for resolving the issue of heavy-metal pollution in Pingqing Lagoon.
By analyzing multiple sedimentary proxies and records of watershed human activity (e.g., heavy metal, sedimentary rate, median grain size, population), this study aims to address some of the key questions of environmental pollution in Pinqing Lagoon: (1) How did the heavy-metal contamination level change from a spatial and historical view under the background of the Anthropocene? (2) What are the main sources and drivers of pollution at different stages of catchment development? (3) What are the differences in the heavy-metal pollution level between Pinqing Lagoon and its adjacent water bodies (outer seas, inland water bodies, and regional lagoons), and what caused these differences? The primary goal is to explore essential measures for managing environmental pollution in coastal lagoons and provide scientific support for the effective management and protection of typical lagoon ecosystems.

2. Materials and Methods

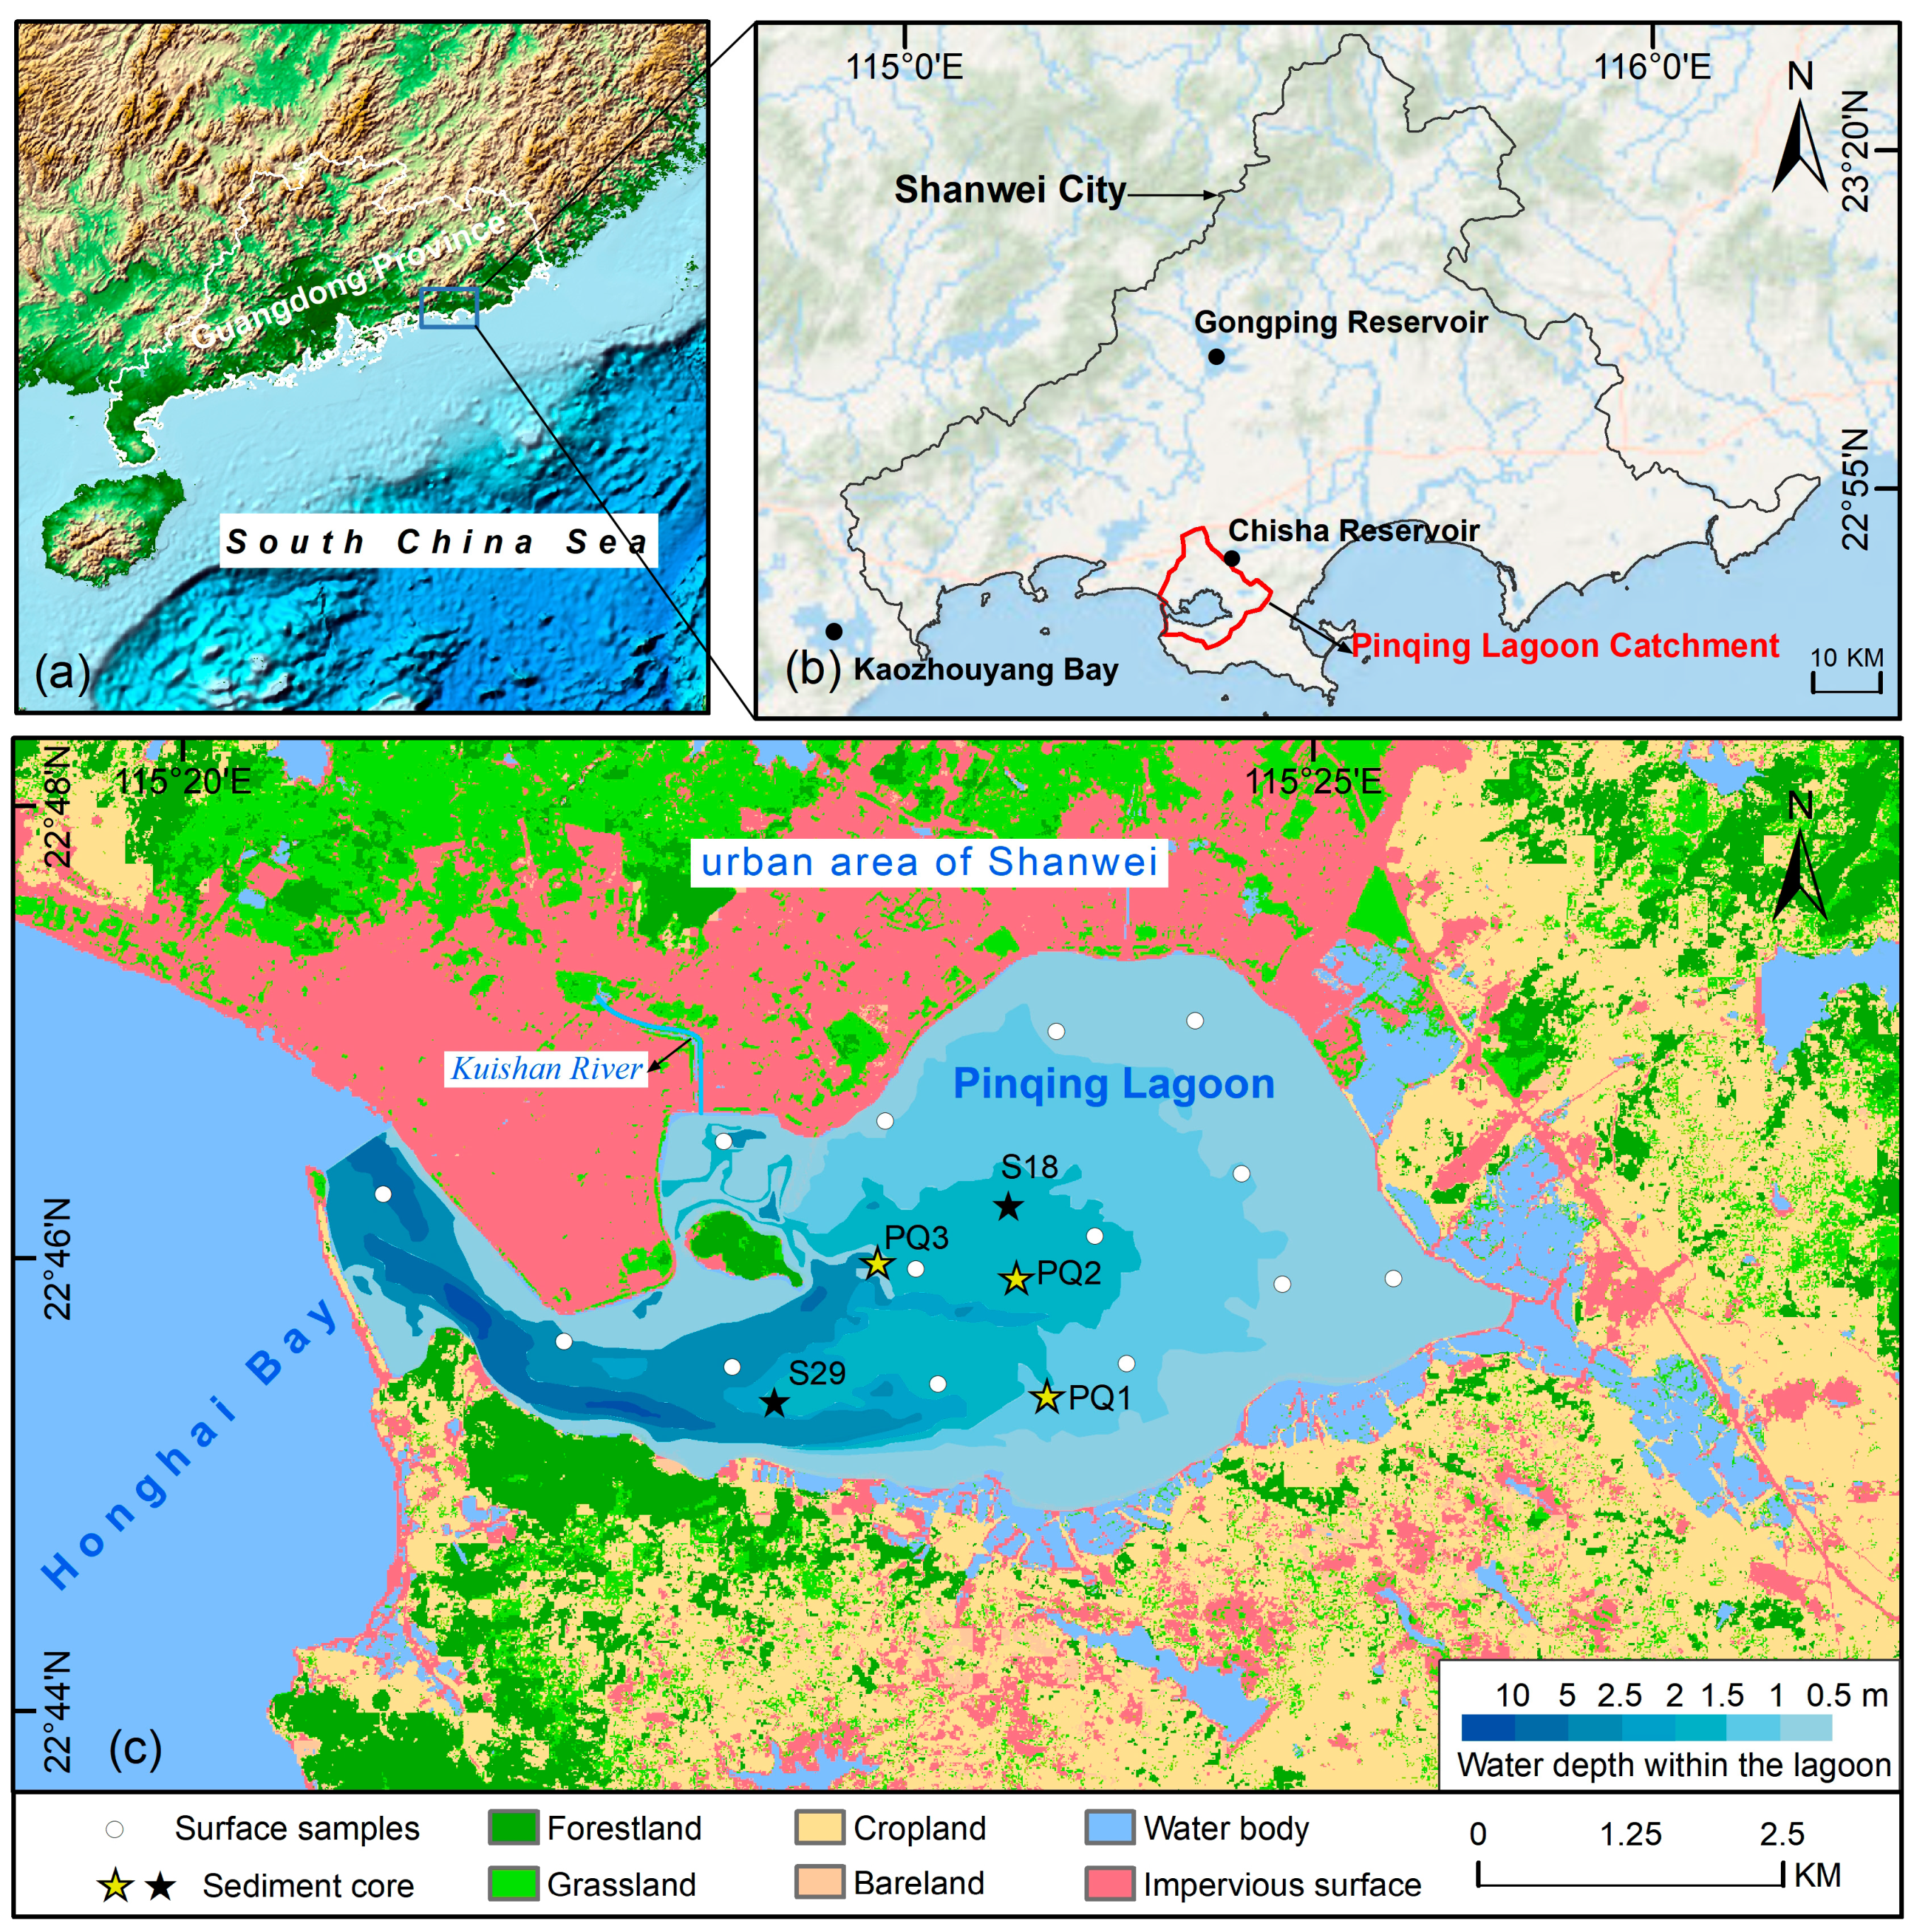
2.1. Regional Setting of the Study Area

Pinqing Lagoon (114°54′~116°13′ E, 22°27′~23°28′ N) is situated in the southeastern part of Shanwei City Center in Guangdong Province, South China. The lagoon has an area of about 23.16 km2 and a shoreline of about 39.62 km long. Also, it connects to Honghai Bay through a 650 m wide and 2 km long tidal channel in the west. This channel is separated from the open sea by a seawall made of a natural sand spit and an artificial dyke. The lagoon is mostly shallow, with a water depth of less than 1.5 m, except for the channel mouth and the southwest corner, where the maximum depth reaches 11.8 m (Figure 1c) [24].
With a subtropical monsoonal climatic zone, the lagoon is characterized by an average annual temperature of 21~22 °C, and an annual precipitation ranging from 1800 to 2400 mm [26]. Meanwhile, the watershed area of the lagoon is small, resulting in a limited runoff inflow (Figure 1b). The southeastern region features extensive cultivated land and fishery farming, while the northern area exhibits impervious surface land types along the shoreline, representing the core urban area of Shanwei City (Figure 1c). The Kuishan River (Figure 1c) serves as the primary discharge point for industrial wastewater and domestic sewage from the urban area into Pinqing Lagoon, emphasizing its significance as a pollution trapping area.
Numerous records of human activities, e.g., socio-economic development, in the watershed over the past century are well-documented in the Gazettes of Hai Feng County [27], the Gazettes of Shanwei City [26], and the Shanwei City Statistical Yearbook [28]. Over the past 70 years, Shanwei City has undergone rapid population growth and economic development. The population has increased from 380,000 in 1949 to 1.35 million in 2017, while the industrial output value of the urban area has surged from CNY 154 million in 1990 to CNY 20.140 billion in 2016 [26,27,28]. These records enable us to explore the influence of anthropogenic activities on the sedimentary environment of Pinqing Lagoon.

2.2. Field Sampling, Sedimentary Proxy Analysis, and Secondary Data Collection

In this study, three sediment cores, PQ1 (55 cm), PQ2 (64 cm), and PQ3 (132 cm), were collected from Pinqing Lagoon in May 2019 using an Austrian UWITEC gravity sampler (Figure 1c). During field sampling, PQ1 and PQ2 were divided into samples at 1 cm intervals, and PQ3 was divided into samples at 2 cm intervals. The samples were then sealed in polyethylene plastic bags and brought back to the laboratory, where they were kept in a refrigerator at 4 °C. Previous studies have reported that the PQ2 core spans from the 1850s to 2019 CE [29], and it has preserved several storm-induced layers with significant anomalies of geochemical elements. Consequently, the abnormal layers were excluded in heavy-metal pollution assessment and further analysis.
Samples from three cores were selected for metal element analysis. First, the sediments underwent tetra-acid digestion (HCl-HNO 3-HF-HClO 4) for the analysis of metal elements. Specifically, 0.125 g of each dried and ground sample was placed in a polytetrafluoroethylene tube, to which HCl-HNO 3-HF-HclO 4 was added. The mixture was digested using an automatic apparatus. The resulting digestion solution was cooled to room temperature, adjusted to a volume of 50 mL, and thoroughly mixed—the resultant solution was used for measurement. Next, a total of 12 elements were analyzed: Mn, V, Zn, and total phosphorus (TP) by inductively coupled plasma atomic emission spectrometry (ICP-AES); and Cr, Co, Ni, Cu, As, Cd, Sb, Ba, and Pb by inductively coupled plasma mass spectrometry (ICP-MS). Before the above analysis, the samples were naturally dried at room temperature, ground, and sieved through a 100 mu mesh and sealed. The saturation isothermal remanence (SIRM), indicating the content of magnetic minerals in the sediments to some extent [30], was obtained using an EUSCI DPM1 pulsed magnetometer in a field of 2000 mT, and measured on an AGICO JR-6A spinner magnetometer. The vertical variations in magnetic minerals reflected by SIRM are typically related to factors such as the anthropogenic inputs of magnetic minerals coexisting with heavy metals [31,32,33]. Meanwhile, after a preliminary correspondence analysis of sedimentary indicators, the study concluded that the area of the PQ2 sampling sites exhibits a relatively stable sedimentary sequence. Therefore, based on the results of the available PQ2 sedimentary age, SIRM was used for the stratigraphic comparison to date the two additional cores (PQ1 and PQ3) and human activities [29,33]. All of the above processes of pre-treatment and analysis basically followed the standard methods described in The Specification for Marine Monitoring (GB17378.4-2007) [34].
The study integrated surface and sedimentary core samples from multiple sampling sites in the lagoon, along with related metal-contamination data from the surrounding water bodies (Figure 1c). These data were used to analyze the spatial differences in the heavy-metal content of sediments among Honghai Bay, Pinqing Lagoon, and adjacent inland water bodies. Among them, the data of 14 surface sediment samples from Pinqing Lagoon are referred to in the research paper [20], and the historical sediment cores S18 and S29 are from the paper [19] (Figure 1c). Details of historical sediment samples data from Honghai Bay and inland waters are provided in the research papers [18,19,21,35,36].

2.3. Heavy-Metal Pollution Assessment

2.3.1. Enrichment Factor

Enrichment factor (EF) is a widely used index for assessing heavy-metal pollution [37,38]. It helps differentiate natural from anthropogenic sources of heavy metals and evaluate the degree of contamination in sediments. The index was calculated using the following Equation (1).
E F = C i / C F e C o i / C o F e
Fe was chosen as the normalizing element for this study because it is enriched in the Earth’s crust and remains less unaffected by anthropogenic disturbances [39,40]. Where C i / C F e   represents the ratio of the concentration of the heavy metal C i   to that of the reference metal element C F e in samples,   C o i / C o F e denotes the ratio of the background concentration of heavy metal C o i to that of the reference metal C o F e in the study area. The background used in this study followed the baseline values calculated based on the bottom four samples from the PQ2 core (corresponding to the years 1882 to 1930) [20]. The contamination level is classified into five classes with boundaries of 2, 5, 20, and 40, respectively [37]. Also, the background values of heavy metals used in the study for heavy-metal contamination assessment are shown in Table 1.

2.3.2. Degree of Contamination (CD) and Potential Ecological Risk Index (RI)

The contamination level of heavy metals was assessed using the contamination degree (CD) and contamination factor (CF). The degree of ecological risk pollution is measured by the potential ecological risk factor ( E r i ) and the potential ecological risk index (RI). The following equations were applied to calculate the indexes.
C F = C i / C o i    
C D = C F i
E r i = T r i × C f i    
R I = E r i    
where T r i   refers to the toxic-response factor for a given metal (Table 1), and E r i is the risk factor of the individual metal [41]. The critical ranges and grades of CD, CF, E r i , and RI follow those in the research paper [41].

2.4. Statistical Analysis Method

The possible sources of heavy metals were analyzed using Pearson correlation analysis and principal components analysis (PCA). Additionally, non-metric multidimensional scaling analysis (nMDS) was applied to visualize the temporal patterns of heavy metals [42,43]. Moreover, sedimentary proxies and human activity records were correlated and analyzed by redundancy analysis (RDA) to identify the causes of heavy-metal pollution. Sedimentary proxies (e.g., Cu, Cd, Pb, Zn, As, Sb, TP, LOI, sedimentary rate, and median grain size) were the response variable, and human activity factors (population, fertilizer application rate, total energy consumption, and gross domestic product) were the explanatory variable. Significant factors were selected by a Monte Carlo permutation test (p < 0.01; n = 499), and redundant factors with expansion coefficients less than 5 were removed [44]. The Monte Carlo permutation test (p < 0.05; n = 499 unrestricted permutation) was used in RDA analysis to analyze the significant level of explanatory variables, and all ordinal analyses were performed with CANOCO 5 software. The remaining data extraction, analysis, and visualization steps were completed using SPSS 28.0, Origin Pro 2023, Grapher 15, and ArcGIS 10.8.

3. Results

3.1. Spatial and Temporal Variations in Heavy Metals in Sediments

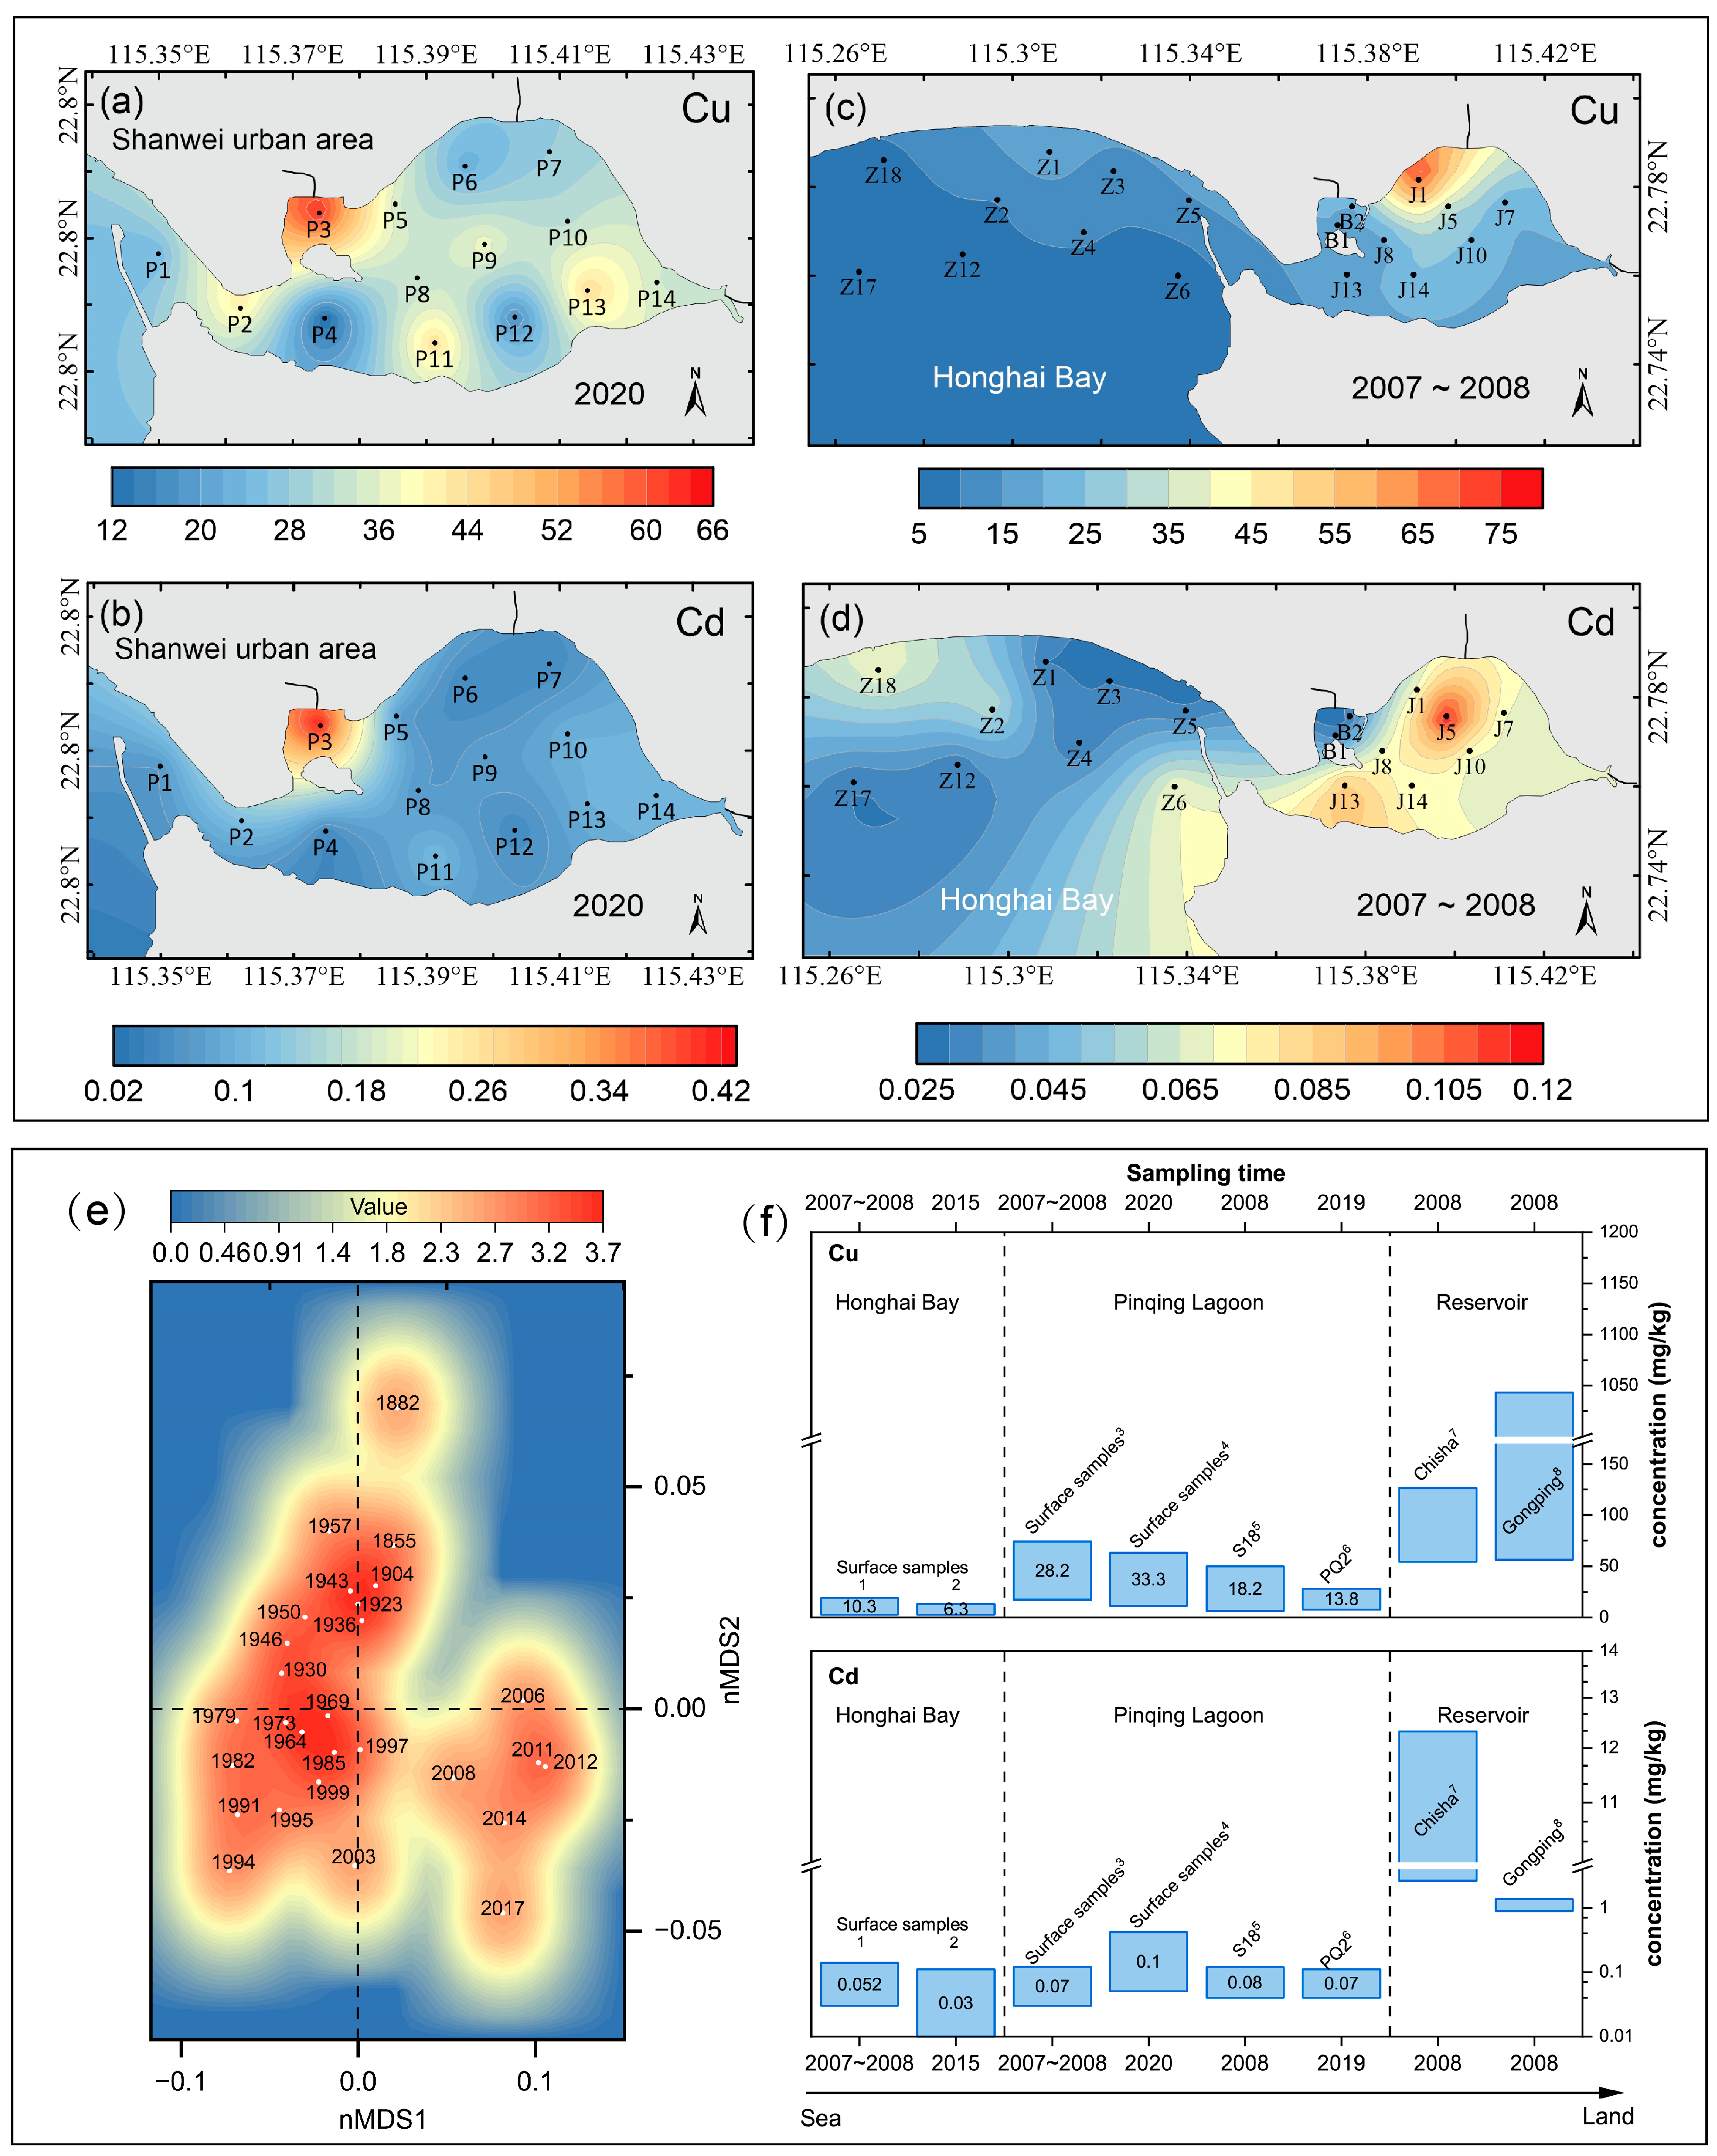
3.1.1. Spatial Distribution of Heavy Metals in Sediments

Heavy-metal concentrations differ among the three sedimentary cores (Table 1). PQ1, located in the southern part of the lagoon, exhibits a higher enrichment, with elevated concentrations of Cu, Mn, V, Ni, Cr, and Co. PQ2, situated in the lagoon’s center, has the second most concentrated element, with highly elevated levels of Pb and As. PQ3, found near the eastern side of the islet, shows a lower concentration, with slightly higher levels of Cu and Cd. Generally, upon comparing the historical sediment cores S18 and S29 [19], significant spatial variations in the heavy-metal content were observed in Pinqing lagoon sediments (Table 1). Specifically, the mean ± standard deviation of Cu in PQ1 (238.9 ± 66.6) is much higher than that in PQ2 (13.8 ± 6.5), PQ3 (157.7 ± 16.0), S18 (18.12 ± 8.7), and S29 (20.7 ± 10.4), with minimal overlap between sample intervals.
Importantly, the independent t-test demonstrates that the concentration of the metal Fe (t PQ1~3 = 6.6~14.9; p < 0.01) also exhibits spatial differentiation. Moreover, when the particle-size effect is eliminated by normalizing the results using Cu/Fe, the ratios of normalized values are found to be in the order of Cu: PQ1 > PQ3 > PQ2 (Figure 2c).

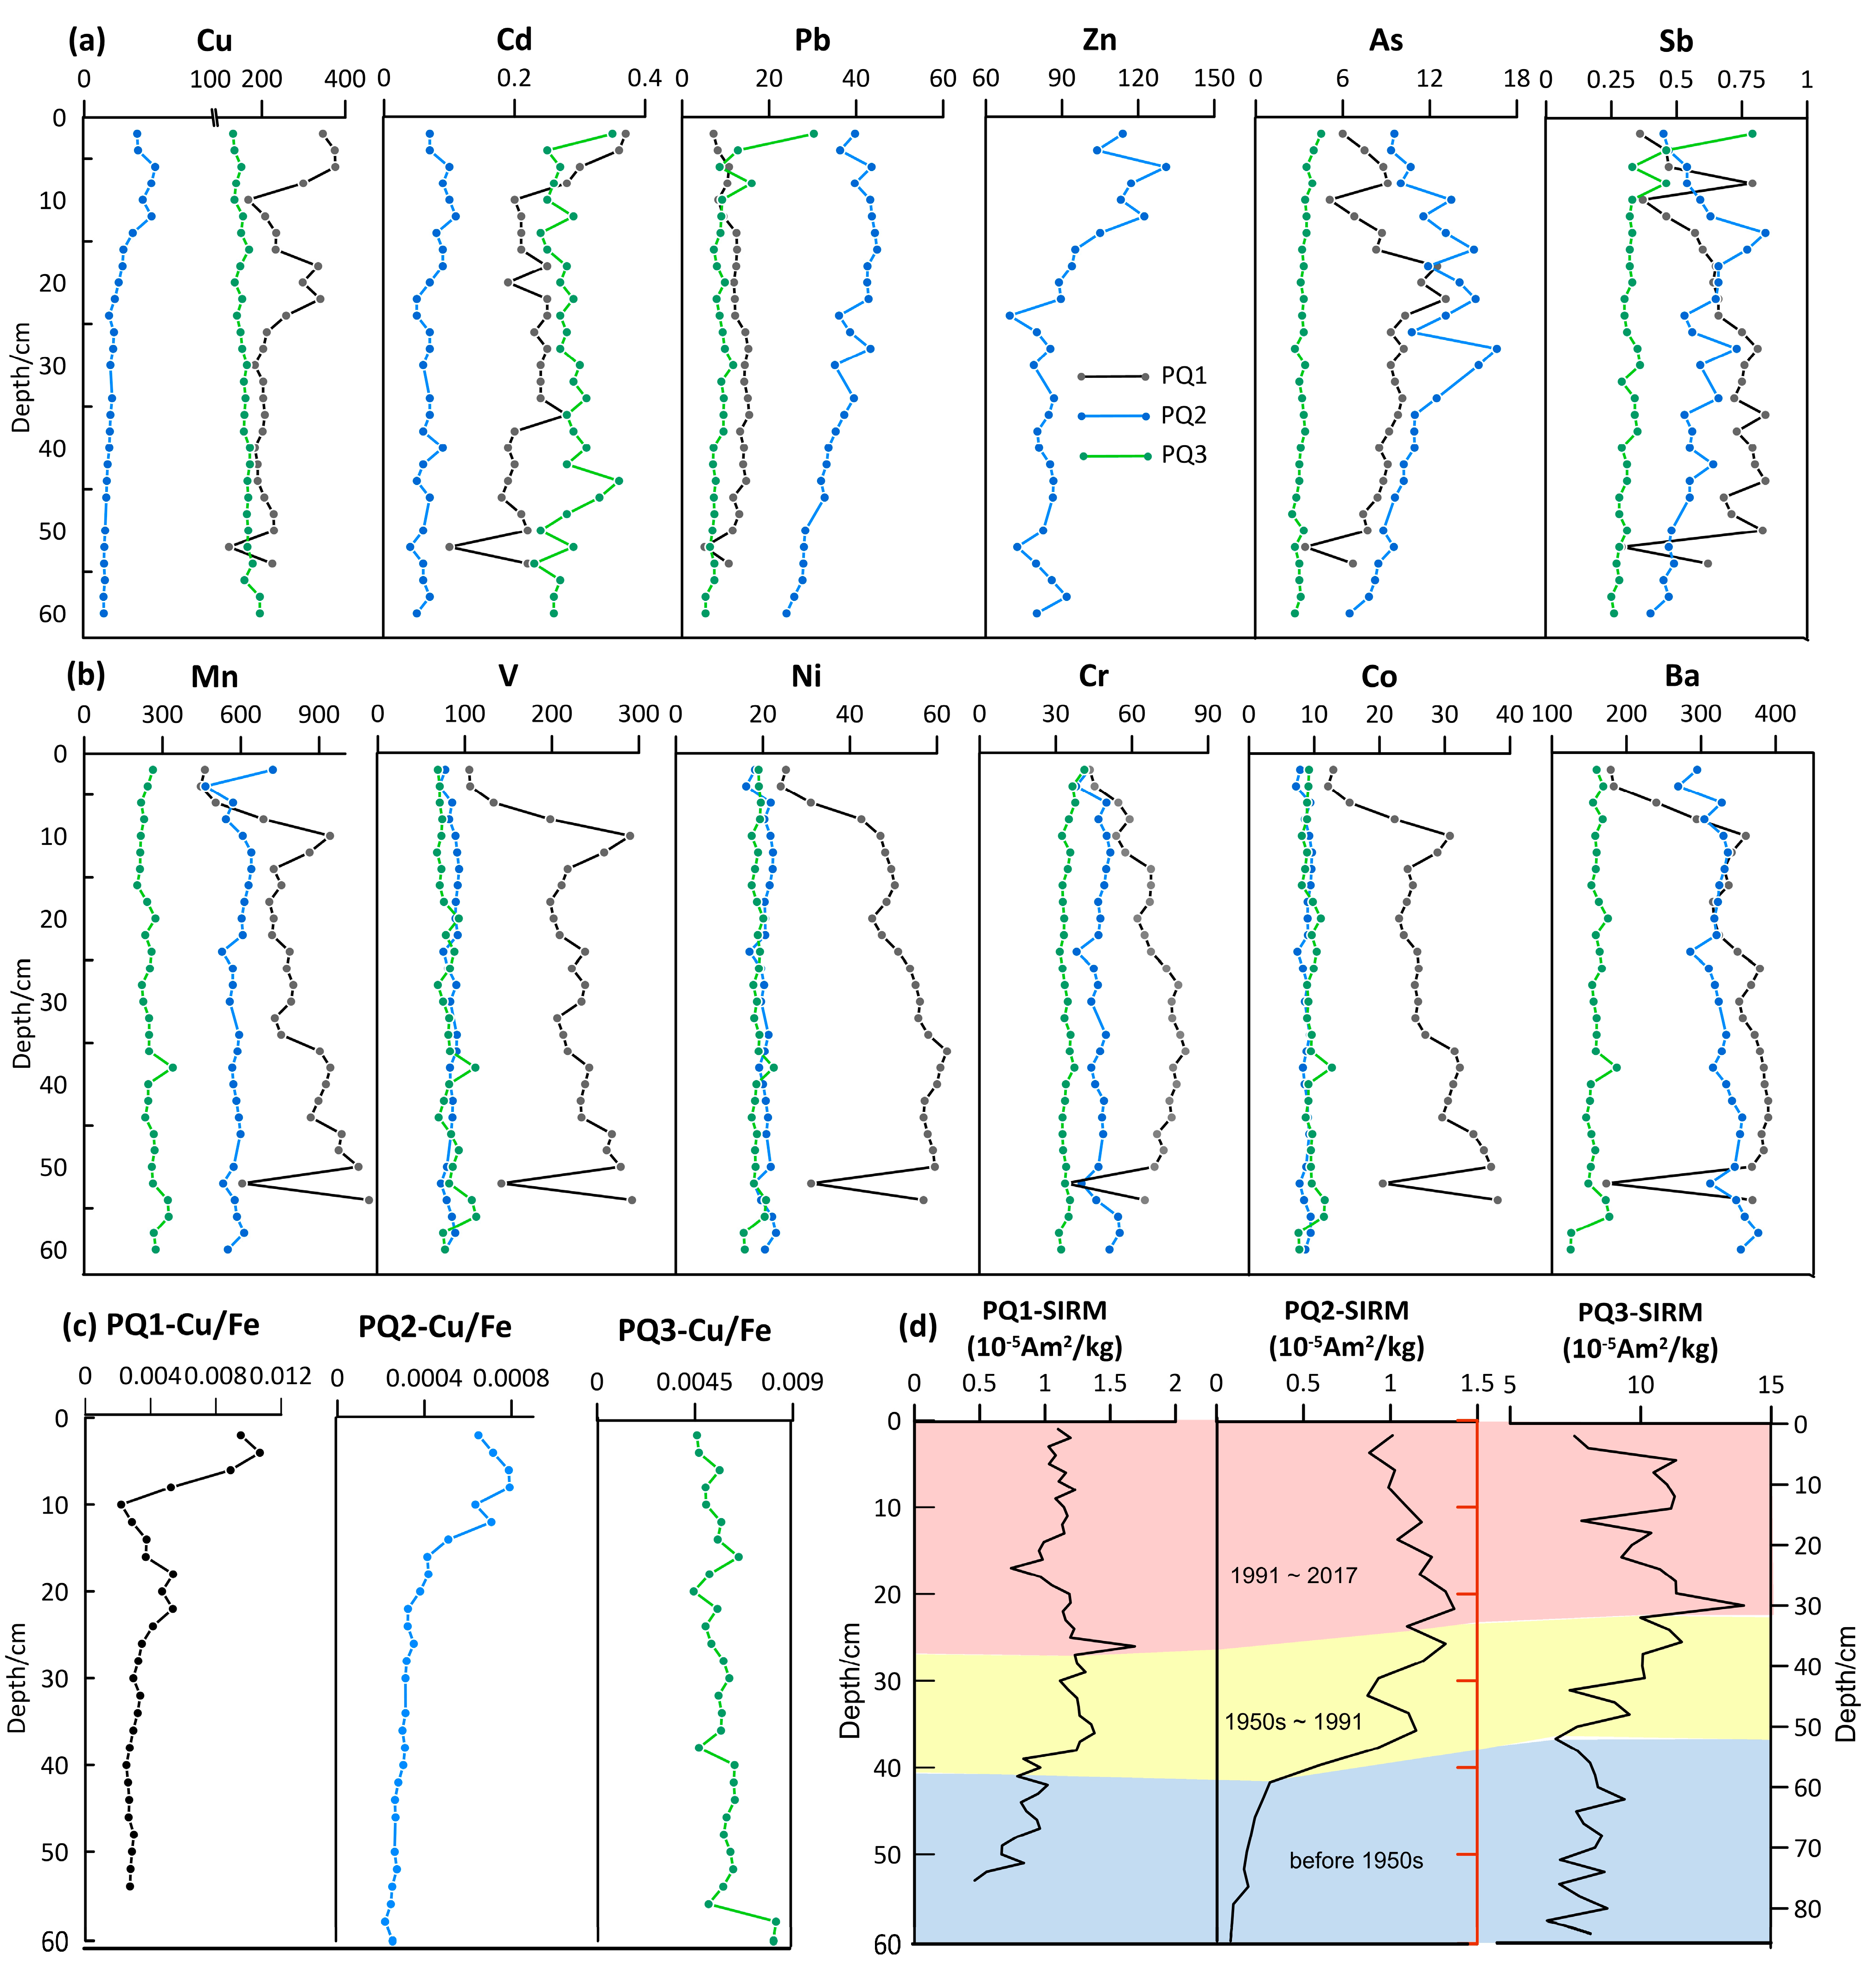
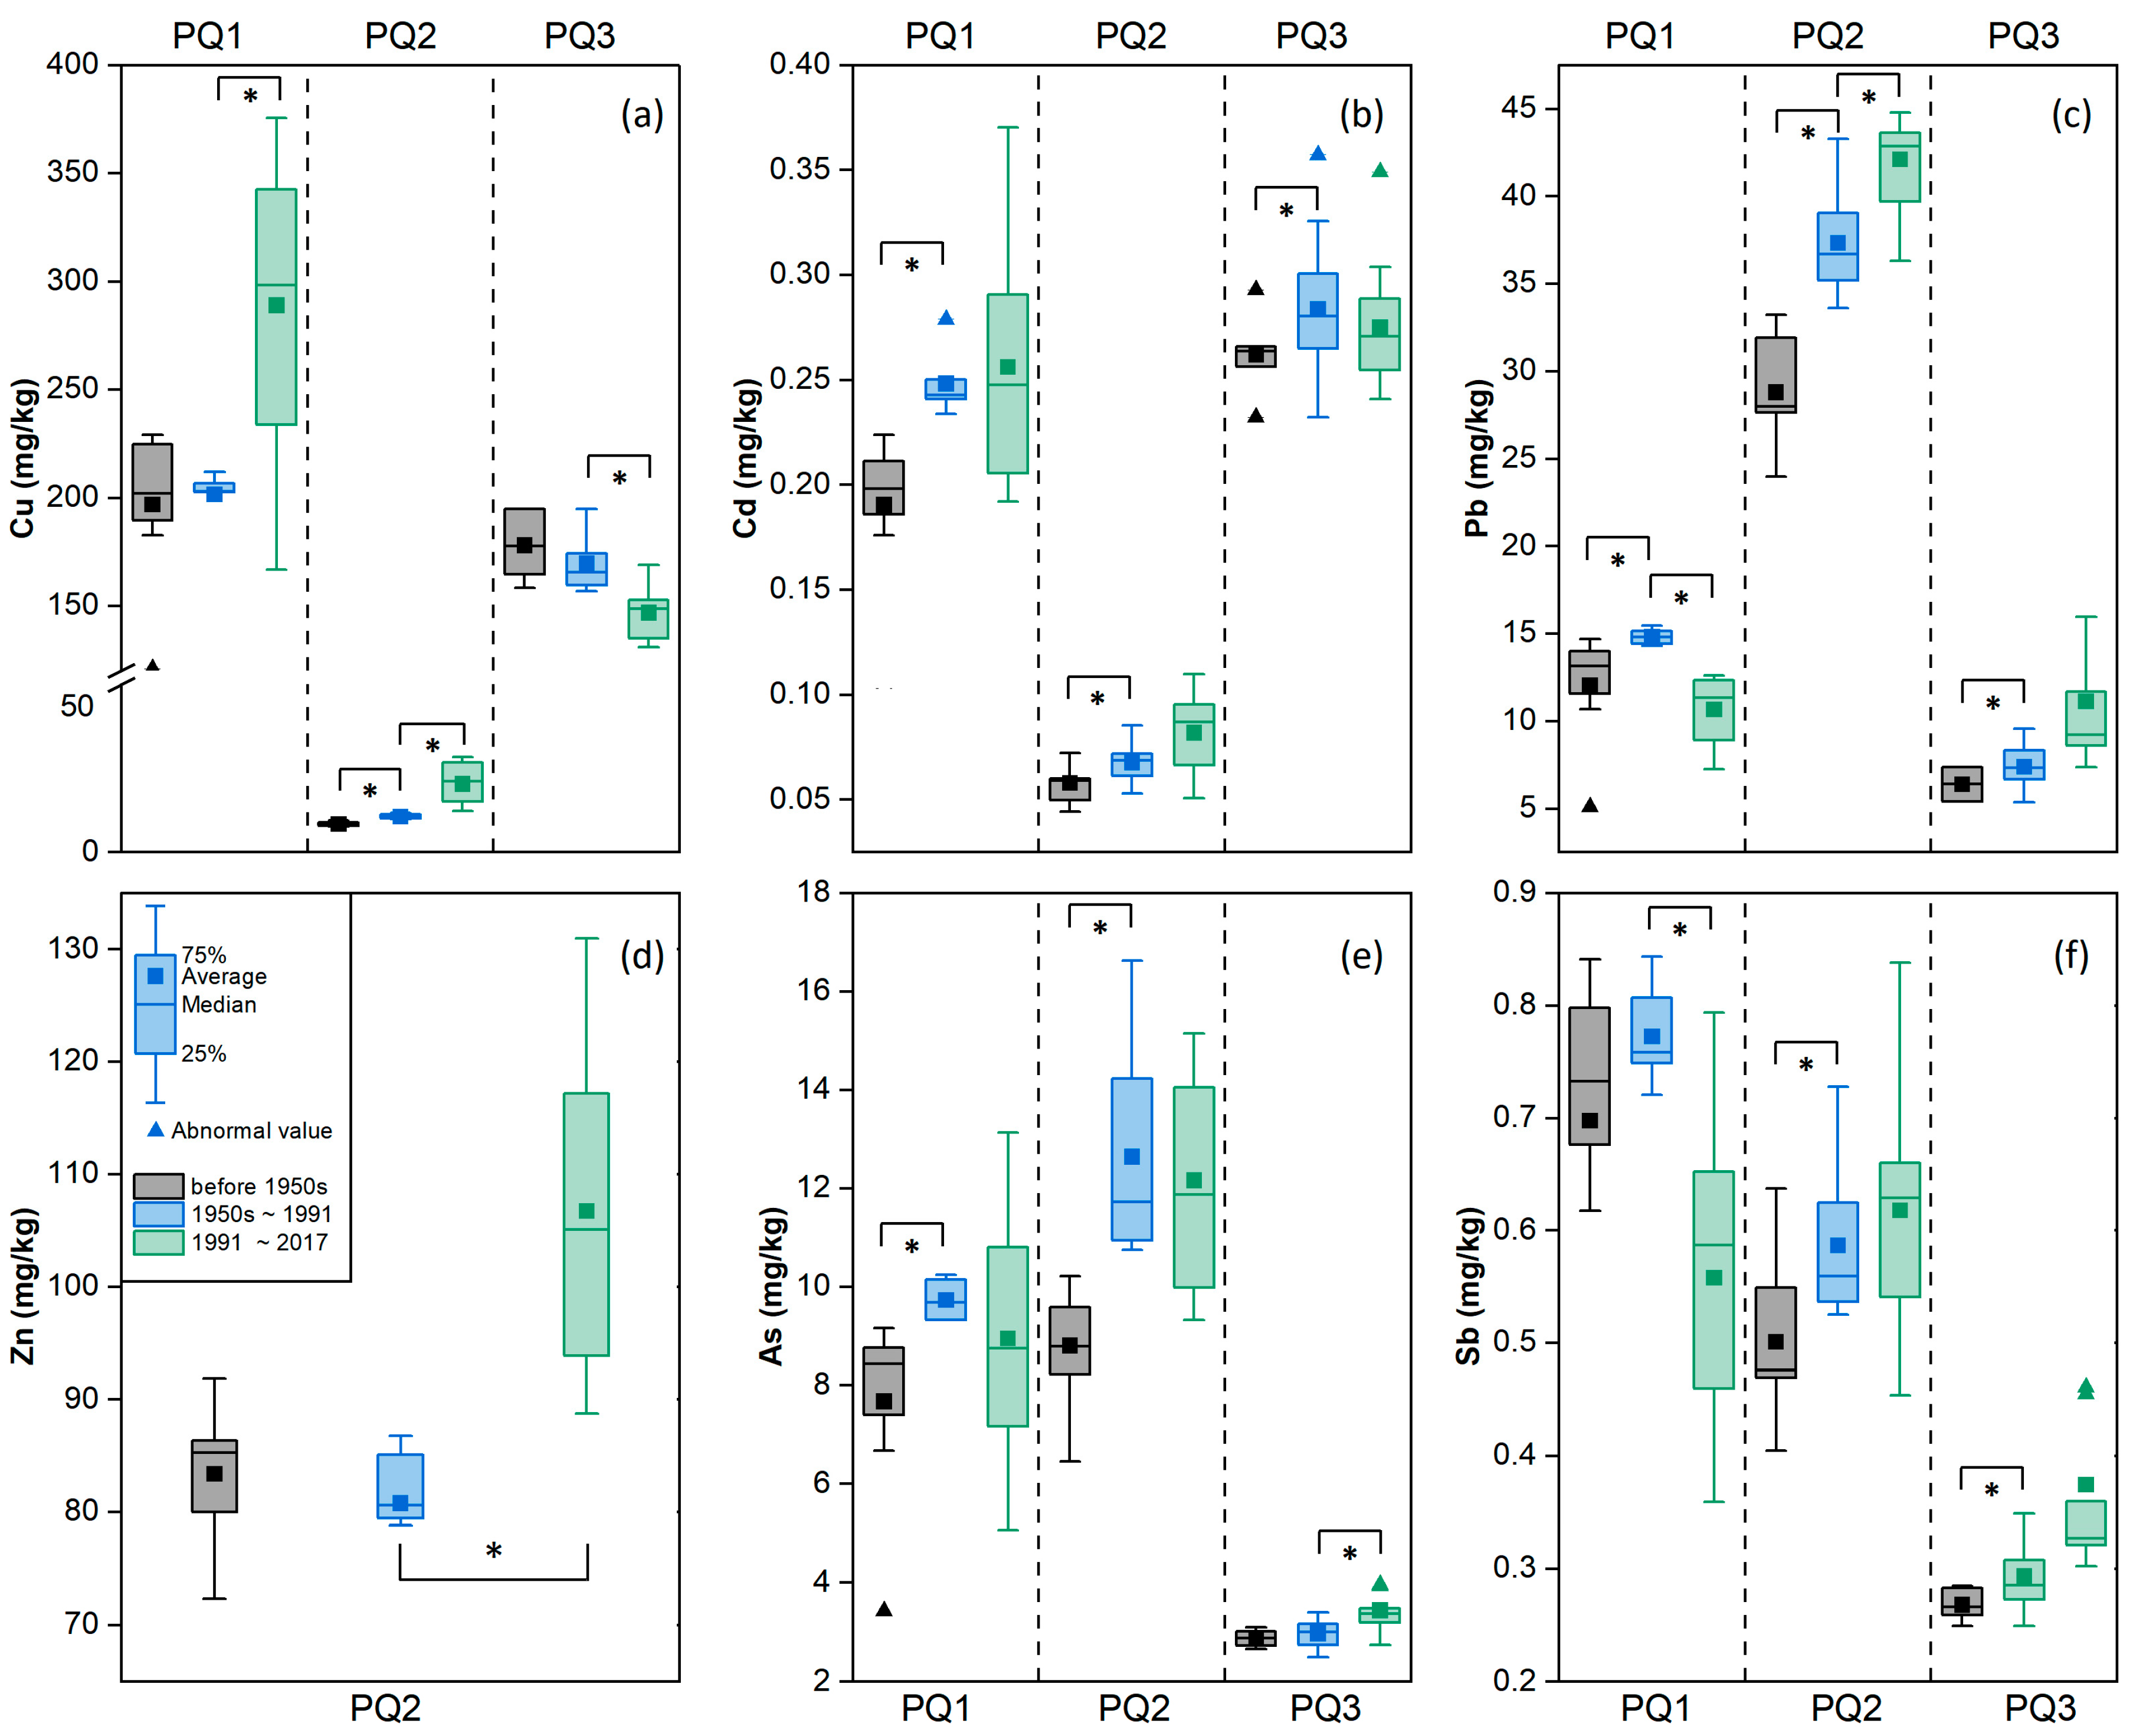
3.1.2. Vertical Variations in Heavy-Metal Content in Sediment

The heavy-metal concentrations in the three sedimentary cores exhibit distinct variations vertically (Figure 2). Based on the vertical trends of heavy-metal content, they can be classified into two groups: Group 1 (Cu, Cd, Pb, Zn, As, and Sb) show sharp vertical variations in concentration across the three core profiles (Figure 2a), and Group 2 (Mn, V, Ni, Cr, Co, and Ba) with a decreasing trend from the bottom to the surface (Figure 2b). This trend is similar to the behavior of the redox-sensitive metals such as Fe and Mn, which can become enriched in the surface layer through early diagenesis, leading to the remobilization and enrichment of other elements and thus influencing the vertical distribution of heavy metals in sediments [45]. Group 2 (Mn, V, Ni, Cr, Co, and Ba) exhibits comparable historical variations. Particularly, Mn and the other metals are located at approximately a 10 cm depth in the PQ1 profile, displaying a distinct peak with high values, and this correlates with the presence of redox laminations (Figure 2b). The enrichment of these metals is primarily associated with the dissolution of manganese hydroxide [46]. When comparing Cu, Zn, Cd, As, Sb, and Pb in Group 1 with Mn in Group 2, there is no notable resemblance in their vertical variations. This finding implies that Group 1 is minimally influenced by natural processes. The elements within Group 1 could potentially serve as indicators of heavy-metal pollution in Pinqing Lagoon.
The SIRM values of the three cores in this study exhibit relatively similar vertical change trends. These trends, when combined with the dating results of PQ2, allow for a rough stratigraphic comparison and chronological delineation of PQ1 and PQ3 (Figure 2d). Considering the vertical change characteristics of heavy-metal content, the contamination trends of the three cores were categorized into three stages: pre-1950s, 1950s~1991, and 1991~2019, respectively (Figure 2d and Figure 3).
Vertical trends in the concentration of Group 1 (Cu, Cd, Pb, Zn, As, and Sb) are divided into three stages, based on the vertical trends of the SIRM (Figure 3). Except for Cu in PQ3 and Pb, Sb in PQ1, all other metals in stages B (1950s~1991) and C (1991~2017) show higher concentrations than those in stage A (before 1950s). The increase in metal concentrations in the two later stages reflects, to a certain extent, the heavy-metal contamination in the lagoon resulting from significant anthropogenic activities. The independence t-test results reveal significant differences (p < 0.05) in the metals Cd, As, and Sb among the three sedimentary cores, mainly between stages A (before 1950s) and B (1950s~1991). Additionally, Cu, Pb, and Zn also display significant differences (p < 0.05), but this occurs between stages B and C. Notably, the differences in Cu and Pb in PQ2 are significant across all stages (Figure 3a,c). Cu in this core exhibits potentially strong anthropogenic disturbances, as its coefficient of variation (C.V. = 48%; Table 1) is the highest among the metals. The SIRM-based delineation reveals that its vertical trend is generally consistent, as the metal concentration rapidly increases from 1991 onwards (from 24 cm to the surface), reaching a high-value stage (Figure 2a).

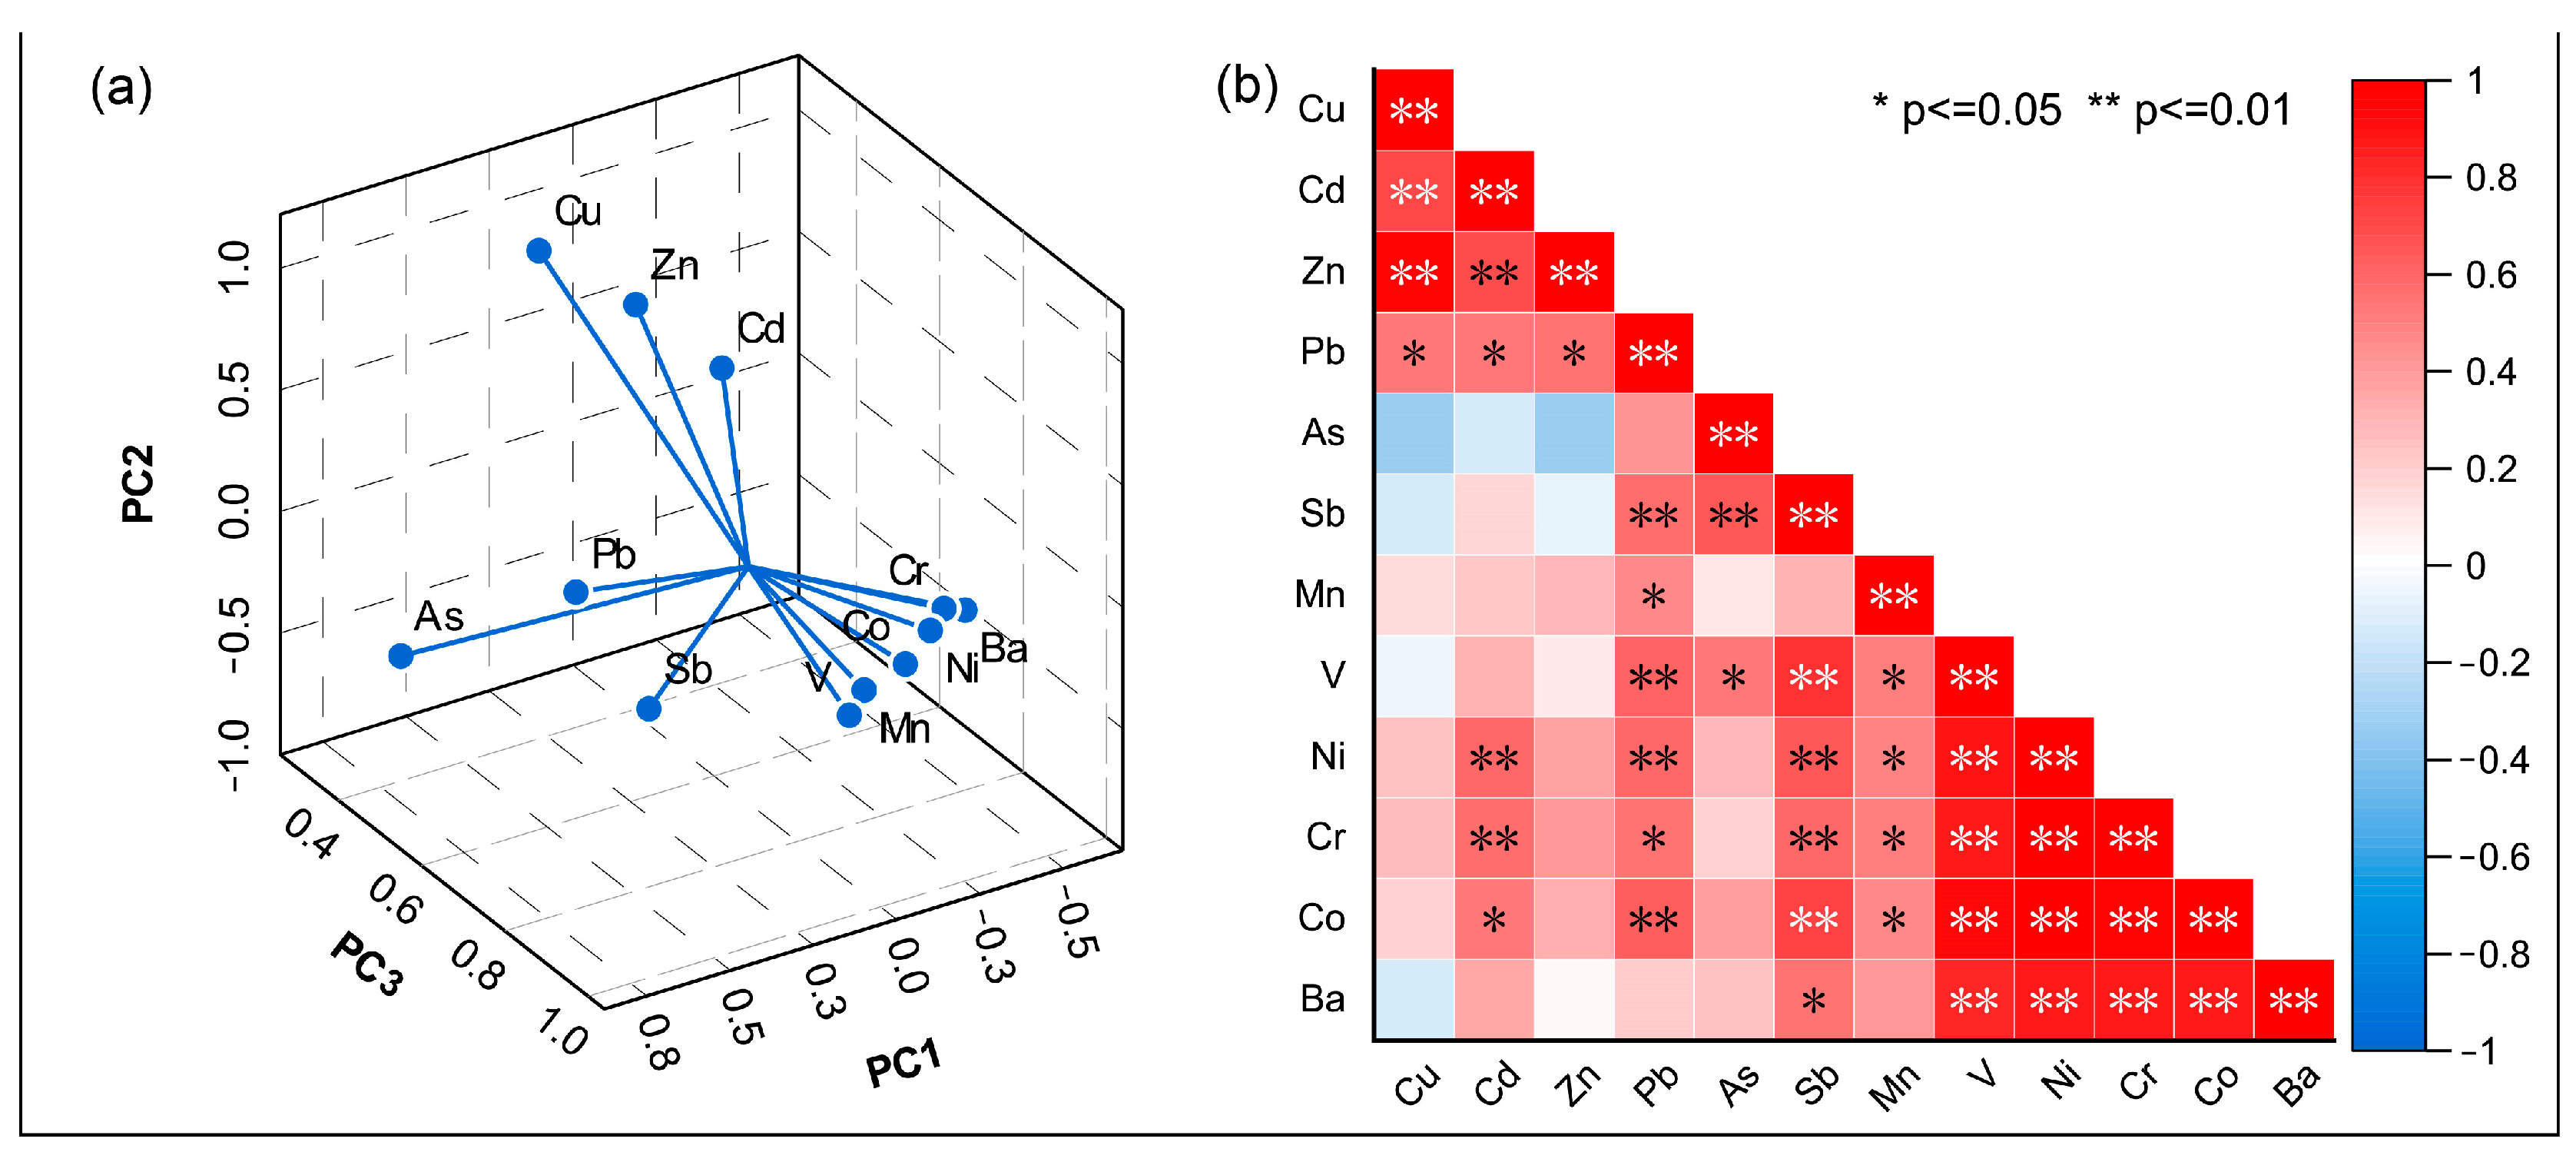
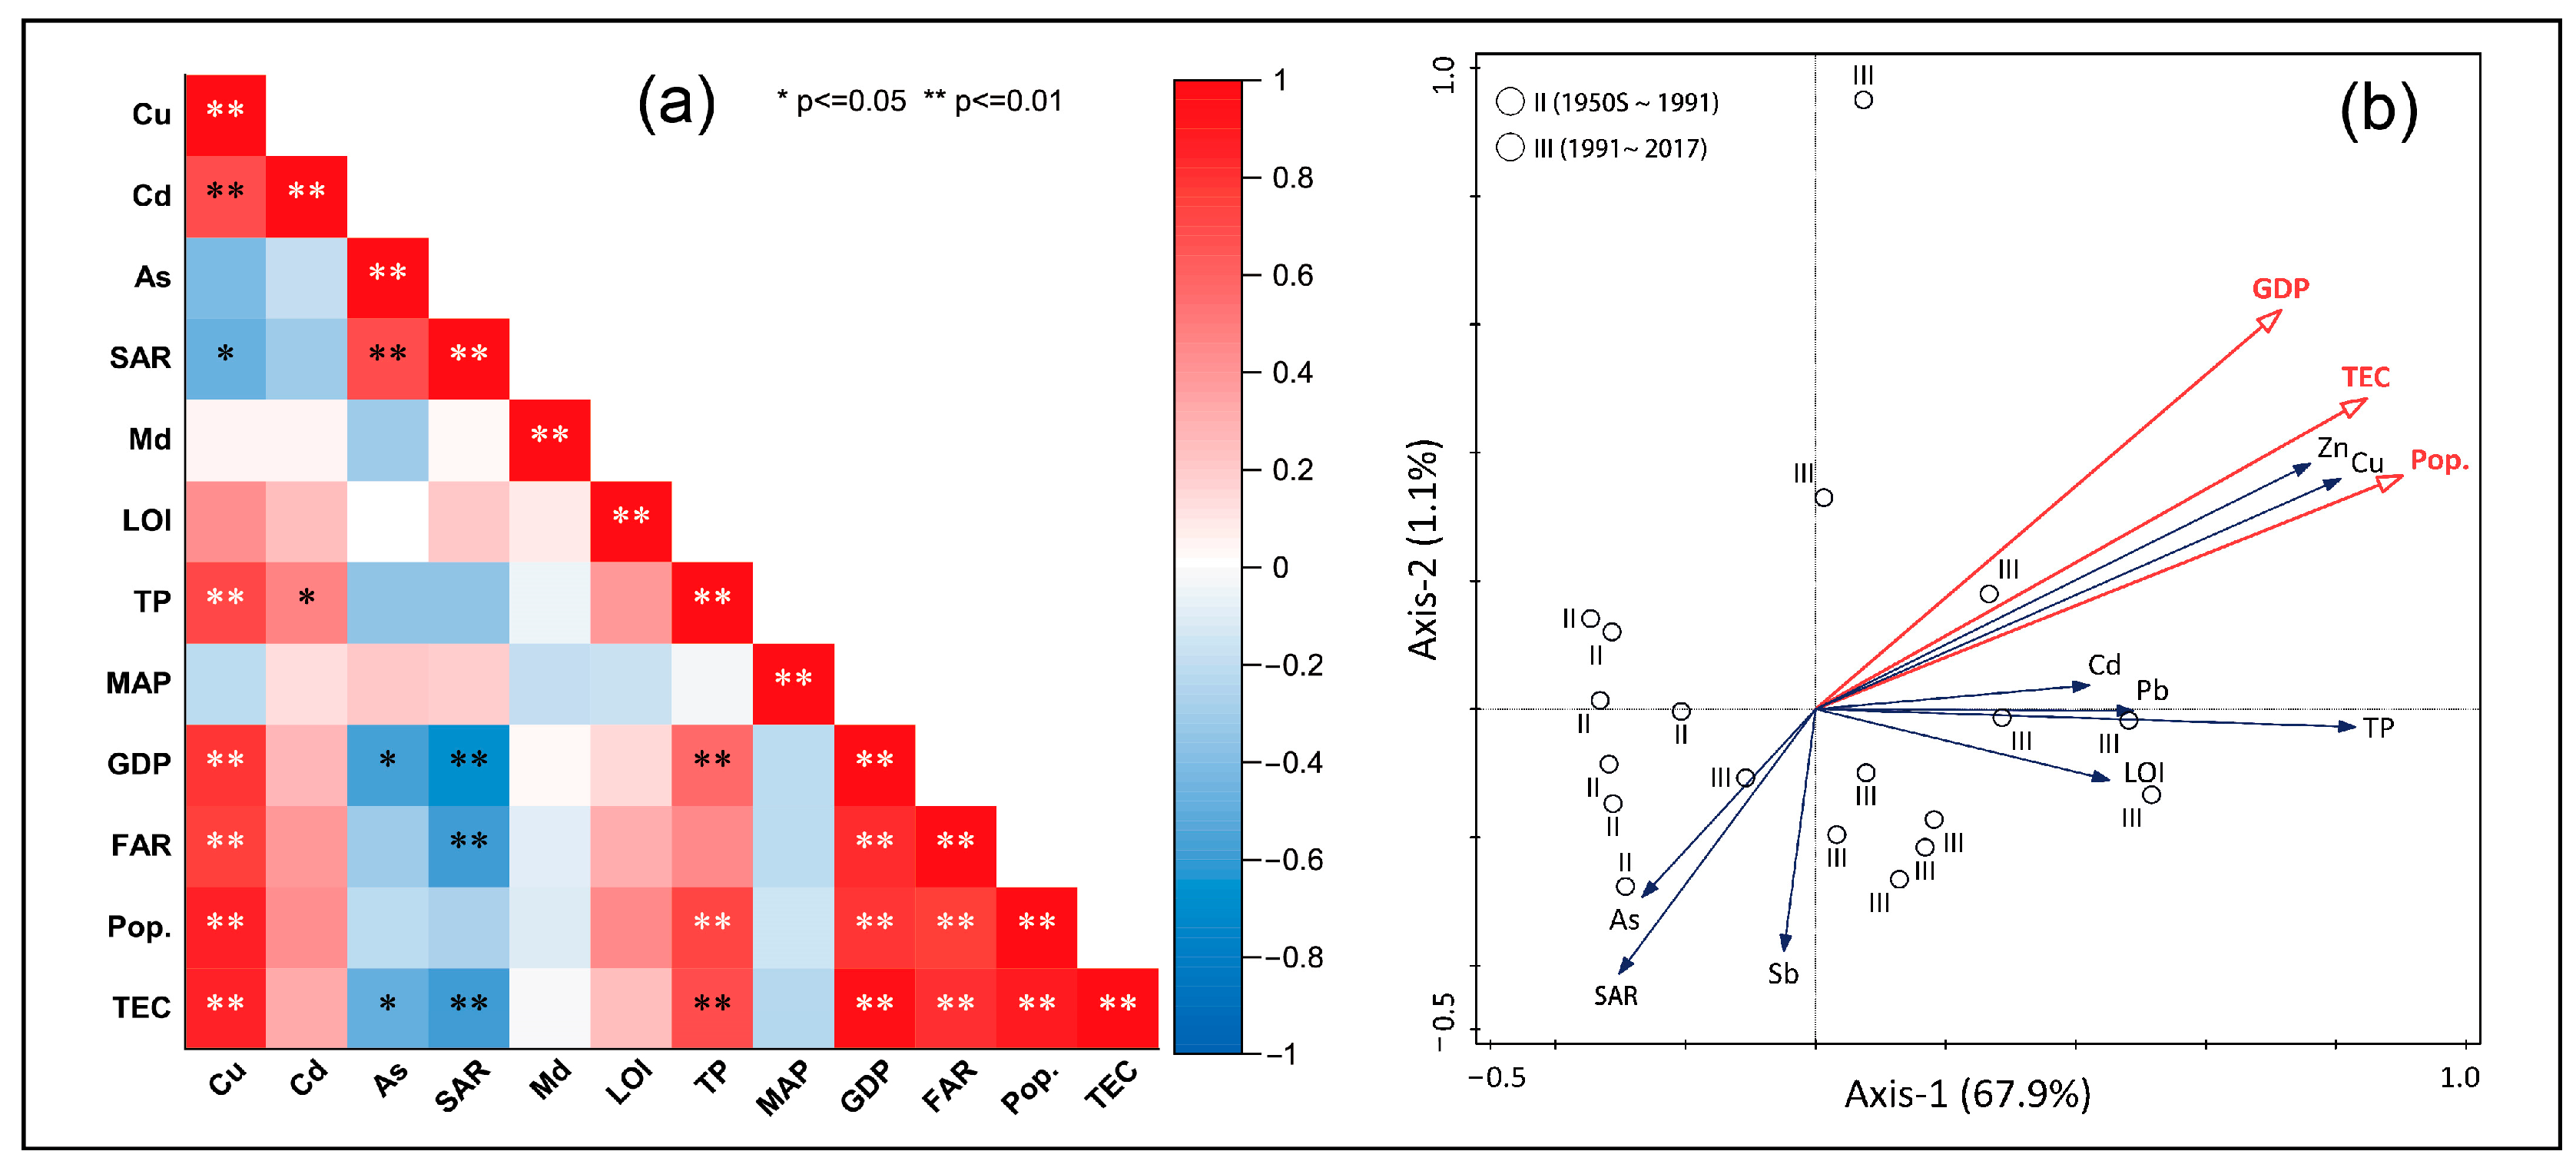
3.2. Possible Sources of Heavy Metals

PCA analysis of heavy metals in the PQ2 core revealed that the cumulative variance contribution of the first three principal components reached 92.13% (Figure 4a). The first principal component, PC1, contributed to 58.3% of the total variation, indicating that the factor variables of Mn, V, Ni, Cr, Co, and Ba had very high positive loadings (>0.8; Figure 4b). The metals Cu, Cd, and Zn fell under the second principal component, PC2. A very high positive loading (>0.9) was shown by Cu, and significant positive correlations among Cu, Cd, and Zn were indicated by the correlation analysis (p < 0.01). The degree of enrichment of As, Pb, and Sb was reflected by the third principal component, PC3. As and Sb showed a significant positive correlation (p < 0.01), while Pb was not significantly correlated with them. Due to the companion relationship between Mn and the macro-metal Fe in PC1, and the significant positive correlation among the elements, PC1 can be recognized as a natural source, while PC2 and PC3 are more likely to be influenced by human factors.

3.3. Heavy-Metal Pollution Assessment

The mean values of the metal enrichment factor (EF) in the PQ2 core (Figure 5a) followed the ordering: Cu (1.59) > As (1.29) > Pb (1.27) > Sb (1.17) > Cd > (1.14) > Zn (1.06), indicating the profile from an overall uncontaminated to mildly contaminated state. Notably, the EF values of Cu were greater than 2 (Figure 5a) for the range above 14 cm (2003~2017), indicating moderate contamination of Cu during this time period, primarily due to human activities. This finding aligns with the sources of contaminants revealed later.
The mean values of the contamination factor (CF) for metals were in the order: Cu (1.7) > As (1.37) > Pb (1.35) > Sb (1.24) > Cd (1.21) > Zn (1.12), all falling within the moderate contamination range (Figure 5b). These results differ from those obtained using the enrichment factor (EF) method. However, both methods indicate that Cu is the primary contaminant of heavy metal in Pinqing Lagoon. The high concentration stage of Cu (CF) is consistent with the EF results, indicating higher pollution characteristics during 2003~2017. The combined degree of contamination (CD) of the six heavy metals ranged from 5.36 to 10.86, with a mean value of 7.4. Vertically, the CD showed an increasing trend from the bottom of the core to the surface (Figure 5d). From 1855 to 1991, the CD values were lower than 8, indicating a low level of contamination. From 1991 to 2017, the CD values increased rapidly, exceeding 8, and reaching a maximum value of 11.1 (2006), indicating a moderate level of heavy-metal contamination in the lagoon during this period.
In terms of the risk factor ( E r i ) , the mean values were as follows: Cd (36.3) > As (13.7) > Sb (8.7) > Cu (8.5) > Pb (6.7) > Zn (1.1). All measured metals except Cd were at a low ecological risk level (Figure 5c). Cd in stage C (1991~2017) had an average value above the threshold of 40, indicating a moderate ecological risk. The potential ecological risk index (RI) ranged from 50.0 to 98.6, with a mean value of 70.1, indicating a low ecological risk in all historical periods (Figure 5e). The vertical change in RI was more pronounced, particularly after 1930. This is mainly because 48.40% of the RI was contributed by Cd, and the vertical change in Cd was very apparent.
Overall, the heavy-metal contamination status of Pinqing Lagoon has not worsened over the past 150 years. Only Cu and Cd exhibit moderate contamination (EF and CF) and moderate ecological risk ( E r i ) , respectively, in the last three decades, whereas the other heavy metals were assessed at low levels. Despite CD and RI displaying significant vertical variations, their mean values remained at a relatively low level, indicating that Pinqing Lagoon is not at risk of severe heavy-metal pollution and ecological risk.

4. Discussion

4.1. Stage Division, History of Human Activity, and Lagoon Pollution

By combining the results of the SIRM, CD, and RI indicators, the heavy-metal contamination history of Pinqing Lagoon is divided into three stages (Figure 6a,b): the period before the 1950s (baseline period), the period from the 1950s to 1991 (early anthropogenic period), and the period from 1991 to 2017 (intense anthropogenic period).
During the period before the 1950s (baseline period), the sedimentary environment of Pinqing Lagoon was primarily influenced by natural factors such as the hydro-metrological system. The increase in sedimentary rate and decrease in median grain size were associated with the weakening of the lagoon’s hydrodynamic environment following the tidal channelization. As the hydrodynamic conditions of the lagoon weakened, new conditions emerged, such as a slight increase in the concentration of metals from natural sources, while the concentration of metals from anthropogenic sources remained stable, and the physicochemical parameters approached the environmental background values (Figure 6a). The absence of pollution in Pinqing Lagoon during this period indicates that human activities in the watershed before 1950 were limited and primarily centered around agricultural activities. It is worth noting that Cd and Pb show an earlier anthropogenic influence (Figure 2a and Figure 6a), with Cd typically originating from industrial pollution [47] and Pb pollution primarily from transportation [48]. However, given the level of human development in the watershed and the county’s documented records, it is possible that their presence is related to the historical Pb and Cd mining activities in the area [27].
During the period between the 1950s and 1991 (early anthropogenic period), Pinqing Lagoon was minimally impacted by human activities. Haifeng County predominantly focused on agricultural industry during this time. Although the lagoon’s productivity (LOI, TP) increased (Figure 6a), this did not reach the eutrophic state. Eutrophication is often caused by the rise in domestic sewage and agricultural surface pollution resulting from population growth and agricultural fertilizer use in the basin [49]. Previous studies concluded that the agricultural sources of As and Sb mainly originate from agricultural production activities including the increased use of fertilizers and pesticides in the watershed (Figure 2a and Figure 6b) [50,51,52]. These arsenic- and antimony-rich substances can be transported from the soil to the sediments [53,54]. Fish farming also can elevate the As concentration in sediment [55]. This occurs due to trace amounts of As being released into the water column through feed additives [51], and marine fish bodies can also accumulate As, which is then enriched in the sediment in various forms [56], including fish residues and excreta. Consequently, when fish farming attains a substantial density, it can result in increased As pollution (Figure 6a).
Figure 6. (a,b) Mean annual precipitation (MAP), population (Pop.), fertilizer application rate (FAR), total energy consumption (TEC), and gross domestic product (GDP) of Shanwei City [26,27,28], sedimentary proxies of core PQ2 (SAR: sedimentary rate, Md: median grain size). (c,d) Land use and land cover changes in the watershed. Data source: [57].
Water 15 03126 g006
After 1991 (period of intense human activities), Pinqing Lagoon experienced increased anthropogenic disturbances. During the early years of Shanwei City, the concentration of Cu, Cd, Pb, and Zn [58] in the sediment was dramatically high due to rapid urbanization, population growth, and the wastewater enriched with heavy metals from industrial activities (Figure 6). Subsequently, the concentration of these metals in the sediment stabilized at a high level after 2003, indicating that the transition of Shanwei City’s industrial structure would occur from a predominantly agriculture system to an industrialized colony. Concurrently, the concentration of Pb, commonly originating from the traffic pollution caused by the combustion of leaded gasoline/diesel [48], decreased in correlation with the decline in the number of fishing vessels in the lagoon, reflecting the transformation and development of the fishery industry in the region. In addition, urbanization significantly altered the sedimentary conditions in the lagoons (Figure 6a). In watersheds devoid of significant runoff injections at small scales, the increase in the impervious surface area around lagoons (Figure 6c,d) often enhances the topsoil resistance to erosion [59]. As a result, the input of protolithic detrital material is reduced, leading to a more marked decrease in the concentration of natural-source metals in sedimentary proxies (Figure 2b). The slower rates of sedimentation (Figure 6a) likely reflect the reduced input of natural-source material. In 2004, the Shanwei City discharged 4.591 million tons of industrial wastewater directly into the South China Sea, accounting for 42.3% of the total discharge [26]. Consequently, Pinqing Lagoon has been heavily impacted by anthropogenic disturbances. Despite the decrease in the degree of contamination (CD) and potential ecological risk index (RI) of sedimentary pollution since 2010, resulting from the removal of illegal aquaculture and the closure of highly polluting and energy-consuming factories in Pinqing Lagoon, these proxies remain at historically high levels. In conclusion, the three stages of heavy-metal contamination in the lagoon are closely related to the intensity of human disturbance and the type of industrial activities. However, the sediment sources and sedimentary environments in Pinqing Lagoon are complex and diverse [24]. The above sedimentary proxies only provide an overview of the historical human activities in the watershed. The temporal characteristics of the high resolution within the proxies and their underlying causes deserve further investigation.

4.2. Spatial Differences in Heavy-Metal Pollution in the Lagoon and Adjacent Water Bodies

Sample data of heavy metals in surface sediments at different times reveal a shift in the center of gravity of heavy-metal contamination over the last decade (Figure 7a–d) [18,20]. The shift has moved from J1 and J5, which are close to the inlet of the runoff from the north side of the lagoon, to P3 in the typhoon shelter (Figure 7a–d). The shift in the center of gravity of heavy-metal pollution in the lagoon is primarily associated with changes in human activities around the lagoon. The gradual closure of certain industrial electronics factories on the north side of the lagoon since 2010 has resulted in a reduced input of industrial heavy metals into the runoff, thereby decreasing pollution at the previously highly polluted sites J1 and J5. Conversely, P3 (typhoon shelter) has experienced a high concentration of heavy-metal pollution in recent years due to the conversion of the surrounding area from agricultural land to urban land (Figure 1c and Figure 6d), resulting in a large amount of industrial and urban sewage input from the Kuishan River (Figure 7a,b). This finding underscores the spatial autocorrelation between heavy-metal concentrations in water bodies from terrestrial sources and the intensity of adjacent land use and human activities [60]. On a time-scale basis, the PQ2 cores reveal a shift in the center of gravity of contamination. Using the assessment results (EF, CF, E r i , CD, RI) for nMDS analysis (stress < 0.1; Figure 7e), it was found that the samples were clearly classified into two major periods: 1855~2003 and 2006~2017. In particular, the post-2006 samples showed a high degree of differentiation, indicating that the sedimentary environments in this period were significantly different from those of previous periods. By combining the CD and RI, we found that the pollution level was stable and high from 2006 to 2011 and decreased after 2012 (Figure 6a), which coincided with the time of environmental control measures, such as the closure of highly polluting industries such as electroplating in the north of the lagoon.
In detail, site P3 (typhoon shelter) had a significantly higher heavy-metal concentration than the neighboring sites P2 and P1 (Figure 7a,b). This difference may be influenced by several factors, including anthropogenic discharge, sediment grain size effect, and biochemical processes. The hydrodynamic environment within the lagoon also plays an important role in this difference [19]. P1 and P3 are located in the tidal channel and experience frequent water exchange with the outer sea (Figure 7a,b). The flow velocity in the channel during high and low tides has been reported to reach up to 70 cm/s in historical hydrographic data [19]. Therefore, although P1 and P2 are in the same vicinity of the urban area as P3, their water exchange capacity is significantly stronger, promoting the dilution and diffusion of pollutants, such as heavy metals, into the outer sea or the lagoon through waves and tides. Previous data (sampling time: 2007~2008) have also indicated the trend in the distribution of heavy metals studied here. For instance, sampling sites Z1, Z3, and Z5 situated on the western side of the tidal channel, receiving sewage from the northern urban area as well, exhibit significantly lower heavy-metal concentrations compared to the lagoon (Figure 7c,d). Interestingly, Kaozhouyang Bay (Figure 1b), situated on the western side of Honghai Bay, and coastal lagoons (e.g., Nador Lagoon), also subject to human-induced disturbances, exhibit identical spatial distribution characteristics of heavy metals as observed in Pinqing Lagoon [10,61]. A shared feature among these sites is the lower heavy-metal content within tidal channels compared to their interiors. In regions distanced from the channel mouth and lagoons with weaker hydrodynamic exchanges with the ocean, heavy-metal concentrations are recorded as noticeably higher. This highlights the significant influence of the hydrodynamic environment in the distribution and spatial variation in the heavy-metal pollution in the lagoon.
The heavy-metal concentrations in sediments of Pinqing Lagoon are slightly higher than those in Honghai Bay (Figure 7c,d,f), suggesting the openness of the water body in Honghai Bay. The water body of Honghai Bay appears to have increased pollution trapping and self-purification ability with a tolerance of increased pollution sources. On the other hand, Pinqing Lagoon is relatively closed and has a longer renewal cycle [19], resulting in a slow dilution of pollutants. Compared with inland water bodies that have similar pollution sources, Pinqing Lagoon shows a significantly lower level of pollution and heavy-metal concentration in its sediments (Figure 7f). Chisha and Gongping reservoirs, which are located 4.2 km and 29.3 km away from Pinqing Lagoon (Figure 1b), are strongly affected by human activities [36], with the highest concentration of Zn (e.g., Chisha reservoir) reaching as high as 1022 mg/kg [36]. Situated in the same watershed, but eight times higher Zn concentration in Chisha reservoir, than in Pinqing Lagoon clearly indicates recycling capacity of pollution of Pinqing lagoon in South China.

4.3. Source Identification and Drivers of Environmental Changes in Lagoon

Heavy-metal accumulation in lacustrine and marine sediments is influenced by sediment grain size, hydrodynamic conditions, and metal inputs. Differences in rock fraction inputs and marine depositional conditions between sites may also contribute to the distribution of heavy metals in sedimentary cores, including PQ1, PQ2, and PQ3 within the lagoon [62].
The Pearson correlation results categorized the 12 factors into two types of variables (Figure 8a): (1) Cu, Cd, TP, GDP, population (Pop.), total energy consumption (TEC), and fertilizer application rate (FAR). The elements Cu, Cd, Pb, and Zn were mainly associated with wastewater discharges from urbanization and industrialization, which is consistent with previous studies [19,20,63]. The findings are also in line with earlier research. (2) Arsenic (As) and sedimentary rate showed a significant positive correlation (Figure 8a). However, there was no correlation between As and fertilizer application rate (Figure 8a), indicating that the source of As in sediments is not limited to fertilizers used in cropland production at the surface alone. Therefore, the main source of arsenic (As) in Pingqing Lagoon is related to organic arsenic in animal feed, residues, and excreta and this is further supported by historical records of extensive fish farming in the lagoon area [27,50,51]. The RDA results revealed the relationship between sedimentary proxies and anthropogenic variables (GDP, Pop., TEC) (Figure 8b). GDP, Pop. (p < 0.01), and TEC (p < 0.05) were the significant variables affecting the variation in sedimentary proxies. The first two axes of the three significant variables explained 69.05% of the variance in the data. The sample points in Combined Band II (1950s~1991) to Combined Band III (after 1991) roughly shifted from the negative to the positive direction of the explanatory variables (GDP, Pop., and TEC), reflecting that wastewater discharges due to population growth together with industrial and economic development were the driving force for the mechanism behind the heavy-metal pollution in Pinqing Lagoon.

4.4. Insights into the Management of Heavy-Metal Pollution in Coastal Lagoons

Hydrological connectivity significantly impacts both inland and coastal lake ecosystems. When there is a high connectivity between lakes and rivers or lagoons and oceans, the water exchange cycle is relatively short and intense, allowing the water body to remain in good condition for a prolonged period, thereby maintaining the balance of lake ecosystems [64]. In contrast, reduced lake area or drying-up conditions can lead to a longer water exchange cycle, resulting in significant water quality deterioration (e.g., metal pollution, eutrophication) and transformation in the ecosystem structure, posing a threat to the lake ecosystem functioning [64,65]. In a semi-open coastal lagoon such as Pinqing Lagoon, the pollution level is intermediate between that of a bay and an inland lake, slightly higher than the adjacent outer sea but significantly lower than the adjacent inland lagoon. This is probably due to the continuous action of various ocean-related factors, such as waves, tides, and storm surges in the coastal lagoon, which allow pollutants to dilute and spread rapidly [20]. Such mechanisms should be similar to inland lakes, but coastal lagoons have a much higher dilution capacity compared to inland lakes.
Nevertheless, the problem of heavy-metal pollution in coastal lagoons cannot be ignored. On the one hand, global environmental problems are becoming more prominent, and lakes are showing a higher sensitivity to anthropogenic disturbances worldwide [66,67,68]. In particular, densely populated coastal lagoons often act as “sinks” for pollutants discharged by humans in the coastal zone. Shallow lakes like coastal lagoons, where the sediment and water exchanges would occur more frequently, are susceptible to the release of heavy metals from disturbed sediments [69] and can be potential “sources” of pollutant releases. These released heavy metals can pose a threat to human health through enrichment and transportation by organisms, such as via the food chain [70,71]. On the other hand, the pollution dilution capacity of coastal lagoons depends on the degree of openness of the water body. Current studies have shown that lagoons with severe heavy-metal contamination are mostly located in areas of intense anthropogenic disturbance, with smaller tidal channels and doorway widths compared to Pinqing Lagoon (Table 2), making it difficult for pollutants to diffuse further into the open sea. However, to meet the needs of services like boat mooring and harbor construction, humans often extend and close the entrance area of the lagoon, leading to its gradual closure and increased susceptibility to pollutant siltation—counteracting efforts to improve hydrodynamic conditions. In this context, it is important to discuss how to balance regional human development and the environmental benefits to lagoons in the coastal zones. From the “source–sink” perspective of pollutants, reducing pollutant discharges in the watershed, regular dredging of the lagoon bottom, and improving the hydrodynamic environment [72] to increase pollutant transport and dilution capacity are essential to inhibit the tendency of coastal lagoons to accumulate and silt up over time, thereby prolonging their life cycle of evolution. While doing this, however, the habitat of the endemic biota must be kept intact.

5. Conclusions

This study analyzed the temporal and spatial variations in heavy-metal enrichment in three sedimentary cores of Pinqing Lagoon in South China and found significant spatial variations in heavy-metal content driven by natural factors, such as differences in natural rock debris fractions. Among heavy metals, Cu was identified as the primary contaminant, while Cd posed a potential ecological risk. However, on average, CD and RI showed a low level of pollution and ecological risk. It is now clear that intense human activities have resulted in the emergence of heavy-metal pollution in Pinqing Lagoon. Rapid population growth and industrial activities have changed the environmental quality of the lagoon over the past century. Municipal sewage and industrial wastewater discharges, as indicated by changes of GDP, Pop., and TEC, are the main drivers of heavy-metal pollution over the past 30 years. However, the level of heavy-metal pollution in Pinqing Lagoon is slightly higher than that in the outer sea and Red Bay, and significantly lower than that in the neighboring inland lakes, indicating the increased pollution mitigation capacity of the lagoon. This study reveals that improved internal hydrodynamic conditions of the coastal lagoon can promote the dilution of pollutants to the outer sea. Despite anthropogenic disturbances, Pinqing Lagoon showed an increased tolerance to heavy-metal pollution, suggesting that the use of coastal lagoons as the pollution trap could be an important management measure in South China.

Author Contributions

G.H.: investigation, data curation, methodology, writing—original draft. X.D.: conceptualization, methodology, writing—review and editing, funding acquisition, supervision. H.X.: investigation, data curation, methodology, writing—review and editing, supervision. W.X.: investigation, visualization. H.Y.: investigation, validation. Y.Z.: investigation, validation. G.K.: writing—review and editing, funding acquisition. All authors have read and agreed to the published version of the manuscript.

Funding

This research was funded by “Climbing” Program of Guangdong Province (designation: pdjh2023 b0417 and pdjh2022 a0405), the Alliance of Guangzhou International Sister-City Universities (GISU), and the Famous Overseas Scientists of Guangdong Province Project (to H.X.).

Data Availability Statement

The data that support the findings of this study are available from the corresponding author upon justified request.

Acknowledgments

We are grateful to Yuejun Liao, Yingda Huang, and Liangfang Li for their valuable assistance in the fieldwork. We would like to thank our GISU project partners Meryem Beklioglu and Erik Jeppesen for comments and proof-reading the manuscript.

Conflicts of Interest

The authors declare no conflict of interest.

References

  1. Pérez-Ruzafa, A.; Pérez-Ruzafa, I.M.; Newton, A.; Marcos, C. Chapter 15—Coastal Lagoons: Environmental Variability, Ecosystem Complexity, and Goods and Services Uniformity. In Coasts and Estuaries; Wolanski, E., Day, J.W., Elliott, M., Ramachandran, R., Eds.; Elsevier: Amsterdam, The Netherlands, 2019; pp. 253–276. [Google Scholar]
  2. Temmerman, S.; Meire, P.; Bouma, T.J.; Herman, P.M.J.; Ysebaert, T.; De Vriend, H.J. Ecosystem-based coastal defence in the face of global change. Nature 2013, 504, 79–83. [Google Scholar] [CrossRef] [PubMed]
  3. Sun, W.; Zhang, J.; Ma, Y.; Xia, D. Investigation of the evolution of China coastal lagoons from 1979 to 2010 using multi-temporal satellite data. Acta Oceanol. Sin. 2015, 37, 54–69, (In Chinese with English Abstract). [Google Scholar]
  4. Jiang, R.; Lin, C.; Zhou, K.; Liu, Y.; Chen, J.; Wang, S.; Pan, Z.; Sun, X.; Wang, W.; Lin, H. Pollution, ecological risk, and source identification of potentially toxic elements in sediments of a landscape urban lagoon, China. Mar. Pollut. Bull. 2022, 174, 113192. [Google Scholar] [CrossRef] [PubMed]
  5. Peter, P.O.; Rashid, A.; Nkinahamira, F.; Wang, H.; Sun, Q.; Gad, M.; Yu, C.-P.; Hu, A. Integrated assessment of major and trace elements in surface and core sediments from an urban lagoon, China: Potential ecological risks and influencing factors. Mar. Pollut. Bull. 2021, 170, 112651. [Google Scholar] [CrossRef] [PubMed]
  6. Ge, C.; Wang, L.; Zhang, Y.; Qu, C.; Liu, X.; Zhu, L.; Song, J.; Zheng, F.; Li, L.; Liu, W.; et al. Responses of the macrobenthic community to cage culture in one tropical lagoon in the South China Sea. Ecol. Indic. 2022, 140, 108985. [Google Scholar] [CrossRef]
  7. Shen, J. Progress and prospect of palaeolimnology research in China. J. Lake Sci. 2009, 21, 307–313, (In Chinese with English Abstract). [Google Scholar] [CrossRef]
  8. Li, C.; Wang, H.; Liao, X.; Xiao, R.; Liu, K.; Bai, J.; Li, B.; He, Q. Heavy metal pollution in coastal wetlands: A systematic review of studies globally over the past three decades. J. Hazard. Mater. 2022, 424, 127312. [Google Scholar] [CrossRef] [PubMed]
  9. Garcés-Ordóñez, O.; Saldarriaga-Vélez, J.F.; Espinosa-Díaz, L.F.; Canals, M.; Sánchez-Vidal, A.; Thiel, M. A systematic review on microplastic pollution in water, sediments, and organisms from 50 coastal lagoons across the globe. Environ. Pollut. 2022, 315, 120366. [Google Scholar] [CrossRef] [PubMed]
  10. Maanan, M.; Saddik, M.; Maanan, M.; Chaibi, M.; Assobhei, O.; Zourarah, B. Environmental and ecological risk assessment of heavy metals in sediments of Nador lagoon, Morocco. Ecol. Indic. 2015, 48, 616–626. [Google Scholar] [CrossRef]
  11. Shetaia, S.A.; Khatita, A.M.A.; Abdelhafez, N.A.; Shaker, I.M.; El Kafrawy, S.B. Human-induced sediment degradation of Burullus lagoon, Nile Delta, Egypt: Heavy metals pollution status and potential ecological risk. Mar. Pollut. Bull. 2022, 178, 113566. [Google Scholar] [CrossRef] [PubMed]
  12. Mendoza-Carranza, M.; Sepúlveda-Lozada, A.; Dias-Ferreira, C.; Geissen, V. Distribution and bioconcentration of heavy metals in a tropical aquatic food web: A case study of a tropical estuarine lagoon in SE Mexico. Environ. Pollut. 2016, 210, 155–165. [Google Scholar] [CrossRef] [PubMed]
  13. Green-Ruiz, C.; Páez-Osuna, F. Heavy metal anomalies in lagoon sediments related to intensive agriculture in Altata-Ensenada del Pabellón coastal system (SE Gulf of California). Environ. Int. 2001, 26, 265–273. [Google Scholar] [CrossRef] [PubMed]
  14. Yao, S. The water environment of the Pinqing Lagoon in Eastern Guangdong, China. In Proceedings of the 2010 International Conference on Mechanic Automation and Control Engineering, Wuhan, China, 26–28 June 2010; pp. 4798–4801. [Google Scholar]
  15. Cai, Y.; Li, F.; Liu, L.; Lu, W.; Cao, B. Residue characteristics and ecological risk assessment of organochlorine pesticides in coastal waters and sediments of Shanwei. Mar. Environ. Sci. 2022, 41, 387–394, (In Chinese with English Abstract). [Google Scholar] [CrossRef]
  16. Wang, Y.; Huang, J. A preliminary study on the occurrence pattern of red tide of marine resources. Resour. Econ. Environ. Prot. 2014, 2, 157–159, (In Chinese with English Abstract). [Google Scholar] [CrossRef]
  17. Meng, Y.; Yin, X.; Feng, J. Acid volatile sulfides and biotoxicity of heavy metals in sediments from the Pinqing Lagoon. Adv. Mar. Sci. 2012, 30, 119–124, (In Chinese with English Abstract). [Google Scholar]
  18. Li, Z. Evalution of heavy metal pollution for surface sediments near Shanwei Port. Mar. Geol. Lett. 2010, 26, 10–15, (In Chinese with English Abstract). [Google Scholar] [CrossRef]
  19. Yao, S. The Modern Sedimentary and Hydraulic Environment and Environmental Geochemistry of Heavy Metals in Pinging Lagoon, East of GuangDong Province. Ph.D. Thesis, The Graduate School of the Chinese Academy of Sciences, Beijing, China, 2010. (In Chinese with English Abstract). [Google Scholar]
  20. Xian, H.; Dong, X.; Wang, Y.; Li, Y.; Xing, J.; Jeppesen, E. Geochemical baseline establishment and pollution assessment of heavy metals in the largest coastal lagoon (Pinqing Lagoon) in China mainland. Mar. Pollut. Bull. 2022, 177, 113459. [Google Scholar] [CrossRef]
  21. Sun, Q.; Zhang, C.; Wu, L.; Ju, M.; Lei, C. Concentration distribution and pollution assessment of heavy metals in surface sediments in Honghai Bay. Ecol. Environ. Sci. 2017, 26, 843–849, (In Chinese with English Abstract). [Google Scholar] [CrossRef]
  22. Heim, S.; Schwarzbauer, J. Pollution history revealed by sedimentary records: A review. Environ. Chem. Lett. 2013, 11, 255–270. [Google Scholar] [CrossRef]
  23. Zhou, Y.; Wang, L.; Xiao, T.; Chen, Y.; Beiyuan, J.; She, J.; Zhou, Y.; Yin, M.; Liu, J.; Liu, Y.; et al. Legacy of multiple heavy metal(loid)s contamination and ecological risks in farmland soils from a historical artisanal zinc smelting area. Sci. Total Environ. 2020, 720, 137541. [Google Scholar] [CrossRef]
  24. Sun, Z.; Yao, S.; Chen, Z.; Chen, J.; Sun, L. Analysis of the sediment environmental characteristics of Pinqing Lake in Shanwei, Guangdong Province. J. Trop. Oceanogr. 2010, 29, 65–71, (In Chinese with English Abstract). [Google Scholar]
  25. Gong, P.; Liu, H.; Zhang, M.; Li, C.; Wang, J.; Huang, H.; Clinton, N.; Ji, L.; Li, W.; Bai, Y.; et al. Stable classification with limited sample: Transferring a 30-m resolution sample set collected in 2015 to mapping 10-m resolution global land cover in 2017. Sci. Bull. 2019, 64, 370–373. [Google Scholar] [CrossRef] [PubMed]
  26. SCLRCC (Shanwei City Local Record Compilation Committee). Local Records of Shanwei City; Fangzhi Publishing House: Beijing, China, 2013. (In Chinese) [Google Scholar]
  27. HCLCCC (Haifeng County Local Chorography Compilation Committee). Local Records of Haifeng County; Guangdong People’s Publishing House: Guangzhou, China, 2005. (In Chinese) [Google Scholar]
  28. Shanwei City Bureau of Statistics. Statistical Yearbook of Shanwei; Official Website of Shanwei Municipal Bureau of Statistics: Shanwei, China, 2017. [Google Scholar]
  29. Xian, H.; Dong, X.; Li, Y.; Zhan, N.; Jeppesen, E. High-resolution reconstruction of typhoon events since ~1850 CE based on multi-proxy sediment records in a coastal lagoon, South China. Sci. Total Environ. 2022, 803, 150063. [Google Scholar] [CrossRef] [PubMed]
  30. Thompson, R.P.; Simson, J.A.V.; Currie, M.G. Atriopeptin distribution in the developing rat heart. Anat. Embryol. 1986, 175, 227–233. [Google Scholar] [CrossRef] [PubMed]
  31. Mariyanto, M.; Amir, M.F.; Utama, W.; Hamdan, A.M.; Bijaksana, S.; Pratama, A.; Yunginger, R.; Sudarningsih, S. Heavy metal contents and magnetic properties of surface sediments in volcanic and tropical environment from Brantas River, Jawa Timur Province, Indonesia. Sci. Total Environ. 2019, 675, 632–641. [Google Scholar] [CrossRef]
  32. Szczepaniak-Wnuk, I.; Górka-Kostrubiec, B.; Dytłow, S.; Szwarczewski, P.; Kwapuliński, P.; Karasiński, J. Assessment of heavy metal pollution in Vistula river (Poland) sediments by using magnetic methods. Environ. Sci. Pollut. Res. 2020, 27, 24129–24144. [Google Scholar] [CrossRef] [PubMed]
  33. Horng, C.-S.; Huh, C.-A.; Chen, K.-H.; Huang, P.-R.; Hsiung, K.-H.; Lin, H.-L. Air pollution history elucidated from anthropogenic spherules and their magnetic signatures in marine sediments offshore of Southwestern Taiwan. J. Mar. Syst. 2009, 76, 468–478. [Google Scholar] [CrossRef]
  34. GB 17378.5-2007; GAQSIQ (General Administration of Ouality Supervision, Inspection and Ouarantine of the People’s Republic of China); SAPRC (Standardization Administration of the People’s Republic of China). The Specification for Marine Monitoring. China Standard Publishing House: Beijing, China, 2007; p. 104.
  35. Gu, Y. Distributions of Biogenic Elements, Heavy Metals and Potential Ecological Risk Assessment of Heavy Metal in Surface Sediments from Coastal Sea of Guandong Province. Master’s Thesis, Jinan University, Jinan, China, 2009. (In Chinese with English Abstract). [Google Scholar]
  36. Zhang, H.; Gu, J.; Hu, R.; Lin, G.; Wang, Z. Characteristics of heavy metals pollution in sediments of four reservoirs from the east coast of Guangdong Province, South China. Chin. J. Ecol. 2012, 31, 1807–1816, (In Chinese with English Abstract). [Google Scholar]
  37. Buat-Menard, P.; Chesselet, R. Variable influence of the atmospheric flux on the trace metal chemistry of oceanic suspended matter. Earth Planet. Sci. Lett. 1979, 42, 399–411. [Google Scholar] [CrossRef]
  38. Islam, M.S.; Ahmed, M.K.; Raknuzzaman, M.; Habibullah-Al-Mamun, M.; Islam, M.K. Heavy metal pollution in surface water and sediment: A preliminary assessment of an urban river in a developing country. Ecol. Indic. 2015, 48, 282–291. [Google Scholar] [CrossRef]
  39. Hans Wedepohl, K. The composition of the continental crust. Geochim. Cosmochim. Acta 1995, 59, 1217–1232. [Google Scholar] [CrossRef]
  40. Apitz, S.E.; Degetto, S.; Cantaluppi, C. The use of statistical methods to separate natural background and anthropogenic concentrations of trace elements in radio-chronologically selected surface sediments of the Venice Lagoon. Mar. Pollut. Bull. 2009, 58, 402–414. [Google Scholar] [CrossRef]
  41. Hakanson, L. An ecological risk index for aquatic pollution control.a sedimentological approach. Water Res. 1980, 14, 975–1001. [Google Scholar] [CrossRef]
  42. Jiang, S.; Bralower, T.J.; Patzkowsky, M.E.; Kump, L.R.; Schueth, J.D. Geographic controls on nannoplankton extinction across the Cretaceous/Palaeogene boundary. Nat. Geosci. 2010, 3, 280–285. [Google Scholar] [CrossRef]
  43. Kruskal, J.B. Multidimensional scaling by optimizing goodness of fit to a nonmetric hypothesis. Psychometrika 1964, 29, 1–27. [Google Scholar] [CrossRef]
  44. Lai, J. Canoco 5: A new version of an ecological multivariate data ordination program. Biodivers. Sci. 2013, 21, 765. [Google Scholar]
  45. Mikac, N.; Sondi, I.; Vdović, N.; Pikelj, K.; Ivanić, M.; Lučić, M.; Bačić, N.; Turk, M.F.; Škapin, D.S.; Krivokapić, S. Origin and history of trace elements accumulation in recent Mediterranean sediments under heavy human impact. A case study of the Boka Kotorska Bay (Southeast Adriatic Sea). Mar. Pollut. Bull. 2022, 179, 113702. [Google Scholar] [CrossRef] [PubMed]
  46. Koschinsky, A.; Hein, J.R. Uptake of elements from seawater by ferromanganese crusts: Solid-phase associations and seawater speciation. Mar. Geol. 2003, 198, 331–351. [Google Scholar] [CrossRef]
  47. Kubier, A.; Wilkin, R.T.; Pichler, T. Cadmium in soils and groundwater: A review. Appl. Geochem. 2019, 108, 104388. [Google Scholar] [CrossRef]
  48. Cetin, M.; Aljama, A.M.O.; Alrabiti, O.B.M.; Adiguzel, F.; Sevik, H.; Zeren Cetin, I. Determination and mapping of regional change of Pb and Cr pollution in Ankara city center. Water Air Soil Pollut. 2022, 233, 163. [Google Scholar] [CrossRef]
  49. Khan, M.N.; Mohammad, F. Eutrophication: Challenges and solutions. In Eutrophication: Causes, Consequences and Control: Volume 2; Springer: Dordrecht, The Netherlands, 2014; pp. 1–15. [Google Scholar]
  50. Thornton, I. Sources and pathways of arsenic in the geochemical environment: Health implications. Geol. Soc. Lond. Spec. Publ. 1996, 113, 153–161. [Google Scholar] [CrossRef]
  51. Smedley, P.L.; Kinniburgh, D.G. A review of the source, behaviour and distribution of arsenic in natural waters. Appl. Geochem. 2002, 17, 517–568. [Google Scholar] [CrossRef]
  52. Hassan, A.S. Inorganic-based pesticides: A review article. Egypt. Sci. J. Pestic. 2019, 5, 39–52. [Google Scholar]
  53. Zhang, L.; Lu, J. Redox Transformation of Arsenic and Antimony in Soils Mediated by Pantoea sp. IMH. Environ. Sci. Technol. 2017, 38, 3937–3943, (In Chinese with English Abstract). [Google Scholar] [CrossRef]
  54. Wang, X.; Lang, C.; Fang, C.; Wang, J.; Wu, X.; Zhou, L. Distribution of Species of Arsenic and Antimony in Surface Sediments of Ledong Sea Area in South China Sea. Contemp. Chem. Ind. 2015, 44, 1821–1824, (In Chinese with English Abstract). [Google Scholar] [CrossRef]
  55. Xia, W.; Qu, X.; Zhang, Y.; Wang, R.; Xin, M.; Guo, C.; Chen, Y. Effects of different fish farming methods on heavy metals in water and sediments of typical lakes in the middle reaches of the Yangtze River. In Proceedings of the 2016 Academic Annual Meeting of the Chinese Fisheries Society, Chengdu, China, 21–23 November 2016; p. 143, (In Chinese with English Abstract). [Google Scholar]
  56. Gaim, K.; Gebru, G.; Abba, S. The effect of arsenic on liver tissue of experimental animals (fishes and mice)—A review article. Int. J. Sci. Res. Publ. 2015, 5, 161–169. [Google Scholar]
  57. Zhang, X.; Liu, L.; Chen, X.; Gao, Y.; Xie, S.; Mi, J. GLC_FCS30: Global land-cover product with fine classification system at 30 m using time-series Landsat imagery. Earth Syst. Sci. Data 2021, 13, 2753–2776. [Google Scholar] [CrossRef]
  58. Cheng, S. Heavy metal pollution in China: Origin, pattern and control. Environ. Sci. Pollut. Res. 2003, 10, 192–198. [Google Scholar] [CrossRef]
  59. McVey, I.; Michalek, A.; Mahoney, T.; Husic, A. Urbanization as a limiter and catalyst of watershed-scale sediment transport: Insights from probabilistic connectivity modeling. Sci. Total Environ. 2023, 894, 165093. [Google Scholar] [CrossRef]
  60. Xiao, X.; Tong, Y.; Wang, D.; Gong, Y.; Zhou, Z.; Liu, Y.; Huang, H.; Zhang, B.; Li, H.; You, J. Spatial distribution of benthic toxicity and sediment-bound metals and arsenic in Guangzhou urban waterways: Influence of land use. J. Hazard. Mater. 2022, 439, 129634. [Google Scholar] [CrossRef]
  61. Wang, X.-N.; Gu, Y.-G.; Wang, Z.-H.; Ke, C.-L.; Mo, M.-S. Biological risk assessment of heavy metals in sediments and health risk assessment in bivalve mollusks from Kaozhouyang Bay, South China. Mar. Pollut. Bull. 2018, 133, 312–319. [Google Scholar] [CrossRef]
  62. Cho, J.; Hyun, S.; Han, J.H.; Kim, S.; Shin, D.-H. Historical trend in heavy metal pollution in core sediments from the Masan Bay, Korea. Mar. Pollut. Bull. 2015, 95, 427–432. [Google Scholar] [CrossRef] [PubMed]
  63. Duan, J.; Tan, J. Atmospheric heavy metals and Arsenic in China: Situation, sources and control policies. Atmos. Environ. 2013, 74, 93–101. [Google Scholar] [CrossRef]
  64. Li, Y.; Liao, Y.; Dong, X.; Xian, H.; Kattel, G. Hydrological disconnection from the Yangtze River triggered rapid environmental degradation in a riverine lake. Limnologica 2022, 95, 125993. [Google Scholar] [CrossRef]
  65. Dou, Y.; Yu, X.; Liu, L.; Ning, Y.; Bi, X.; Liu, J. Effects of hydrological connectivity project on heavy metals in Wuhan urban lakes on the time scale. Sci. Total Environ. 2022, 853, 158654. [Google Scholar] [CrossRef] [PubMed]
  66. Huang, S.; Zhang, K.; Lin, Q.; Liu, J.; Shen, J. Abrupt ecological shifts of lakes during the Anthropocene. Earth-Sci. Rev. 2022, 227, 103981. [Google Scholar] [CrossRef]
  67. Will, S.; Paul, J.C.; John, R.M. The Anthropocene: Are Humans Now Overwhelming the Great Forces of Nature. AMBIO A J. Hum. Environ. 2007, 36, 614–621. [Google Scholar] [CrossRef]
  68. Castañeda, O.; Contreras, F. La biodiversidad de las lagunas costeras. Ciencias 2004, 076, 46–56. [Google Scholar]
  69. Zhou, J.; Leavitt, P.R.; Zhang, Y.; Qin, B. Anthropogenic eutrophication of shallow lakes: Is it occasional? Water Res. 2022, 221, 118728. [Google Scholar] [CrossRef]
  70. Bosch, A.C.; O’Neill, B.; Sigge, G.O.; Kerwath, S.E.; Hoffman, L.C. Heavy metals in marine fish meat and consumer health: A review. J. Sci. Food Agric. 2016, 96, 32–48. [Google Scholar] [CrossRef]
  71. Gray, J.S. Biomagnification in marine systems: The perspective of an ecologist. Mar. Pollut. Bull. 2002, 45, 46–52. [Google Scholar] [CrossRef] [PubMed]
  72. Davies-Vollum, K.S.; Zhang, Z.; Agyekumhene, A. Impacts of lagoon opening and implications for coastal management: Case study from Muni-Pomadze lagoon, Ghana. J. Coast. Conserv. 2019, 23, 293–301. [Google Scholar] [CrossRef]
  73. Chen, S.; WU, Z.; Cai, Z.; Xiang, Y.; Xing, K.; Wang, R.; Lin, G.; Tong, Y. Distribution characteristics and pollution evaluation of heavy metals in the surface sediments of Li’an lagoon, Hainan province. Mar. Sci. 2018, 42, 124–133. [Google Scholar]
  74. El-Kafrawy, S.; Ahmed, H. Using Remote Sensing technology integrated with the Geographic Information System (GIS) to develop a Plan to save the Egyptian Northern lakes Case study: Lake Burullus. Aquat. Sci. Fish Resour. (ASFR) 2022, 3, 66–73. [Google Scholar] [CrossRef]
  75. Whitehead, N.; Oregioni, B.; Fukai, R. Background Levels of Trace Metals in Mediterranean Sediments. Rapp. Procès Verbaux Réunions-Comm. Int. Pour L’exploration Sci. Méditerranée 1985, 29, 233–240. [Google Scholar]
  76. He, Y.; Wen, W. Distribution and concentrations of some heavy metals in the offshore bottom sediments, Guangdong Province. Trop. Ocean. 1982, 1, 58–71, (In Chinese with English Abstract). [Google Scholar]
  77. Zhang, Y.; Du, J. Background values of pollutants in sediments of the South China Sea. Acta Ocean. 2005, 27, 161–166, (In Chinese with English Abstract). [Google Scholar]
Figure 1. Regional setting and sampling locations. (a) The location of Pinqing Lagoon in South China. (b) The position of Pinqing Lagoon in Shanwei, along with two typical reservoirs used for comparison. (c) The distributions of the sediment cores PQ1, PQ2, and PQ3 collected in this study. Previous study results such as those from the sediment cores S18 and S29, water-depth data of Pinqing Lagoon [19,24], surface sediment samples [20], land use, and land-cover conditions around the lagoon area are also displayed [25].
Water 15 03126 g001
Figure 2. (a,b) Depth profiles of metal concentration (mg/kg), (c) ratio indicators of Cu/Fe in sediment cores, and (d) SIRM magnetic parameters in the sediment cores PQ1, PQ2, and PQ3 of Pinqing Lagoon.
Water 15 03126 g002
Figure 3. (af) Heavy-metal concentrations in sediment cores for different stages. The horizontal axes are labeled with sedimentary cores names and vertical axes are labeled with the names of metal elements. Boxes represent the inter-quartile range, different box colors represent different periods, midlines indicate median values, solid squares (black, blue, and green) are the means, triangles (black, blue, and green) are the outliers, and whiskers denote the inter-quartile range IQR. Parentheses asterisks indicate significant differences (p < 0.05).
Water 15 03126 g003
Figure 4. (a) PCA results and (b) Pearson correlation analysis of heavy metals in the PQ2 core sediment of Pinqing Lagoon.
Water 15 03126 g004
Figure 5. Boxplot with data points overlap of (a) enrichment factor (EF), (b) contamination factors (CF), the distribution of degree of contamination (CD), (c) potential ecological risk factor ( E r i ), (d) degree of contamination (CD), and (e) potential ecological risk index (RI) in the sediment core PQ2 of Pinqing Lagoon. Solid squares are the means and the green dots indicate the distribution of the data.
Water 15 03126 g005
Figure 7. Distribution of Cu and Cd metal concentrations (mg/kg) in surface sediments: (a,b) sampled in 2020 [20]; (c,d) sampled in 2007–2008 [18]; (e) nMDS analysis results: sample temporal distribution plot and kernel density plot; (f) comparison of historical data of heavy-metal concentrations of Pinqing Lagoon. In the floating bar chart, the top and bottom bars represent the highest and lowest values of the data, respectively. The numbers within the box indicate the sample mean: (1) data from [18], (2) data from [21], (3) data from [18], (4) data from [20], (5) data from [19], (6) this study: PQ2, (7–8) data from [36]. The data for S18, PQ2, Chisha Reservoir, and Gongping Reservoir were obtained from sedimentary cores. The sedimentary cores from Chisha Reservoir and Gongping Reservoir have lengths of 32 cm and 36 cm, respectively.
Water 15 03126 g007
Figure 8. (a) Results of Pearson analysis of socio-economic development data and sedimentary proxies; their full names are given in Figure 6. (b) RDA statistical analysis results. Sedimentary proxies from 1950s to 1991 and from 1991 to 2017 are represented by Combined Bands II and III, respectively. The correlation is higher when the perpendicular projection point of the response variable arrow (blue line) on the explanatory variable (red line) is closer to the direction indicated by the explanatory variable arrow. If the projection point is in the opposite direction, the predicted correlation is negative.
Water 15 03126 g008
Table 1. Heavy-metal concentration range, mean (mg/kg), and coefficient of variation (C.V.) in sediment cores of Pinqing Lagoon.
ItemFeCuCdZnPbAsSbMnVNiCrCoBa
Background 132,7008.10.05882.0278.20.46
Toxic coefficient 2 53015107
PQ1
Maximum81,8943760.4 15.513.10.84109129262.381.138.1391
Minimum35,037121 0.1 5.13.40.2944610524.133.90 12.13 173
Mean63,927238.90.23 12.068.70.65793.6218.350.066.226.7333.3
C.V.0.20 0.28 0.22 0.22 0.24 0.250.210.230.220.18 0.25 0.20
PQ2
Maximum38,08328.400.11131.044.816.60.872393.323.055.29.6377
Minimum29,290 7.74 0.04 69.424.06.50.4464 70.616.1 38.0 7.2 269
Mean34,23013.770.0791.8336.4811.220.57585.384.5320.3847.128.78327.5
C.V.0.07 0.47 0.29 0.17 0.170.22 0.18 0.08 0.070.080.09 0.07 0.07
PQ3
Maximum33,4951950.36 30.294.540.79339112.922.541.212.7187
Minimum25,9471310.23 5.392.500.2520368.115.631.27.6 125
Mean27,722157.70.28 9.343.230.34252.081.1918.6434.249.42158.3
C.V.0.07 0.10 0.11 0.480.130.29 0.130.150.070.06 0.12 0.08
S18 3
Maximum 50.30.2512879.516.23
Minimum 6.6 0.04 47.219.75.82
Mean 54.950.0891.7244.5511.43
C.V. 0.48 0.38 0.17 0.26 0.25
S29 3
Maximum 29.70.1212553.09.42
Minimum 5.6 0.04 25.117.05.3
Mean 20.70.0881.8334.877.39
C.V. 0.50 0.25 0.27 0.21 0.14
Note: 1 From reference [20]; 2 From reference [41]; 3 From reference [19].
Table 2. Comparison of heavy-metal concentrations in different sediments of marine environments (mg/kg), lagoon area, and tidal channel inlet width.
SiteArea/km2Inlet Width/mCuCdPbZnAs
Pinqing Lagoon
(Guangdong, China) 1
23.1665033.30.1034.998.98.0
Li’an Lagoon
(Hainan, China) 2
97542.20.3317.276.69.26
Nador lagoon (Morocco) 3115300150.81.6135.0554.9
Burullus lagoon (Egypt) 445485382.327.61016
Mediterranean background 5 150.1~2.32550
GCS background 6 15.50.143063.313
SCSS background 7 7.430.1815.654.49.7
Note: Data sources: 1 (This study); 2 from reference [73]; 3 from reference [10]; 4 from reference [11,74]; 5 from reference [75]; 6 Guangdong coastal sediments from reference [76]; 7 South China Seashelf background from reference [77]; satellite imagery in Google Earth Pro was used to obtain the width of the tidal channel inlet.
Disclaimer/Publisher’s Note: The statements, opinions and data contained in all publications are solely those of the individual author(s) and contributor(s) and not of MDPI and/or the editor(s). MDPI and/or the editor(s) disclaim responsibility for any injury to people or property resulting from any ideas, methods, instructions or products referred to in the content.

