
Characteristics of Hydrogen–Oxygen Isotopes and Water Vapor Sources of Different Waters in the Ili Kashi River Basin

Abstract
:1. Introduction
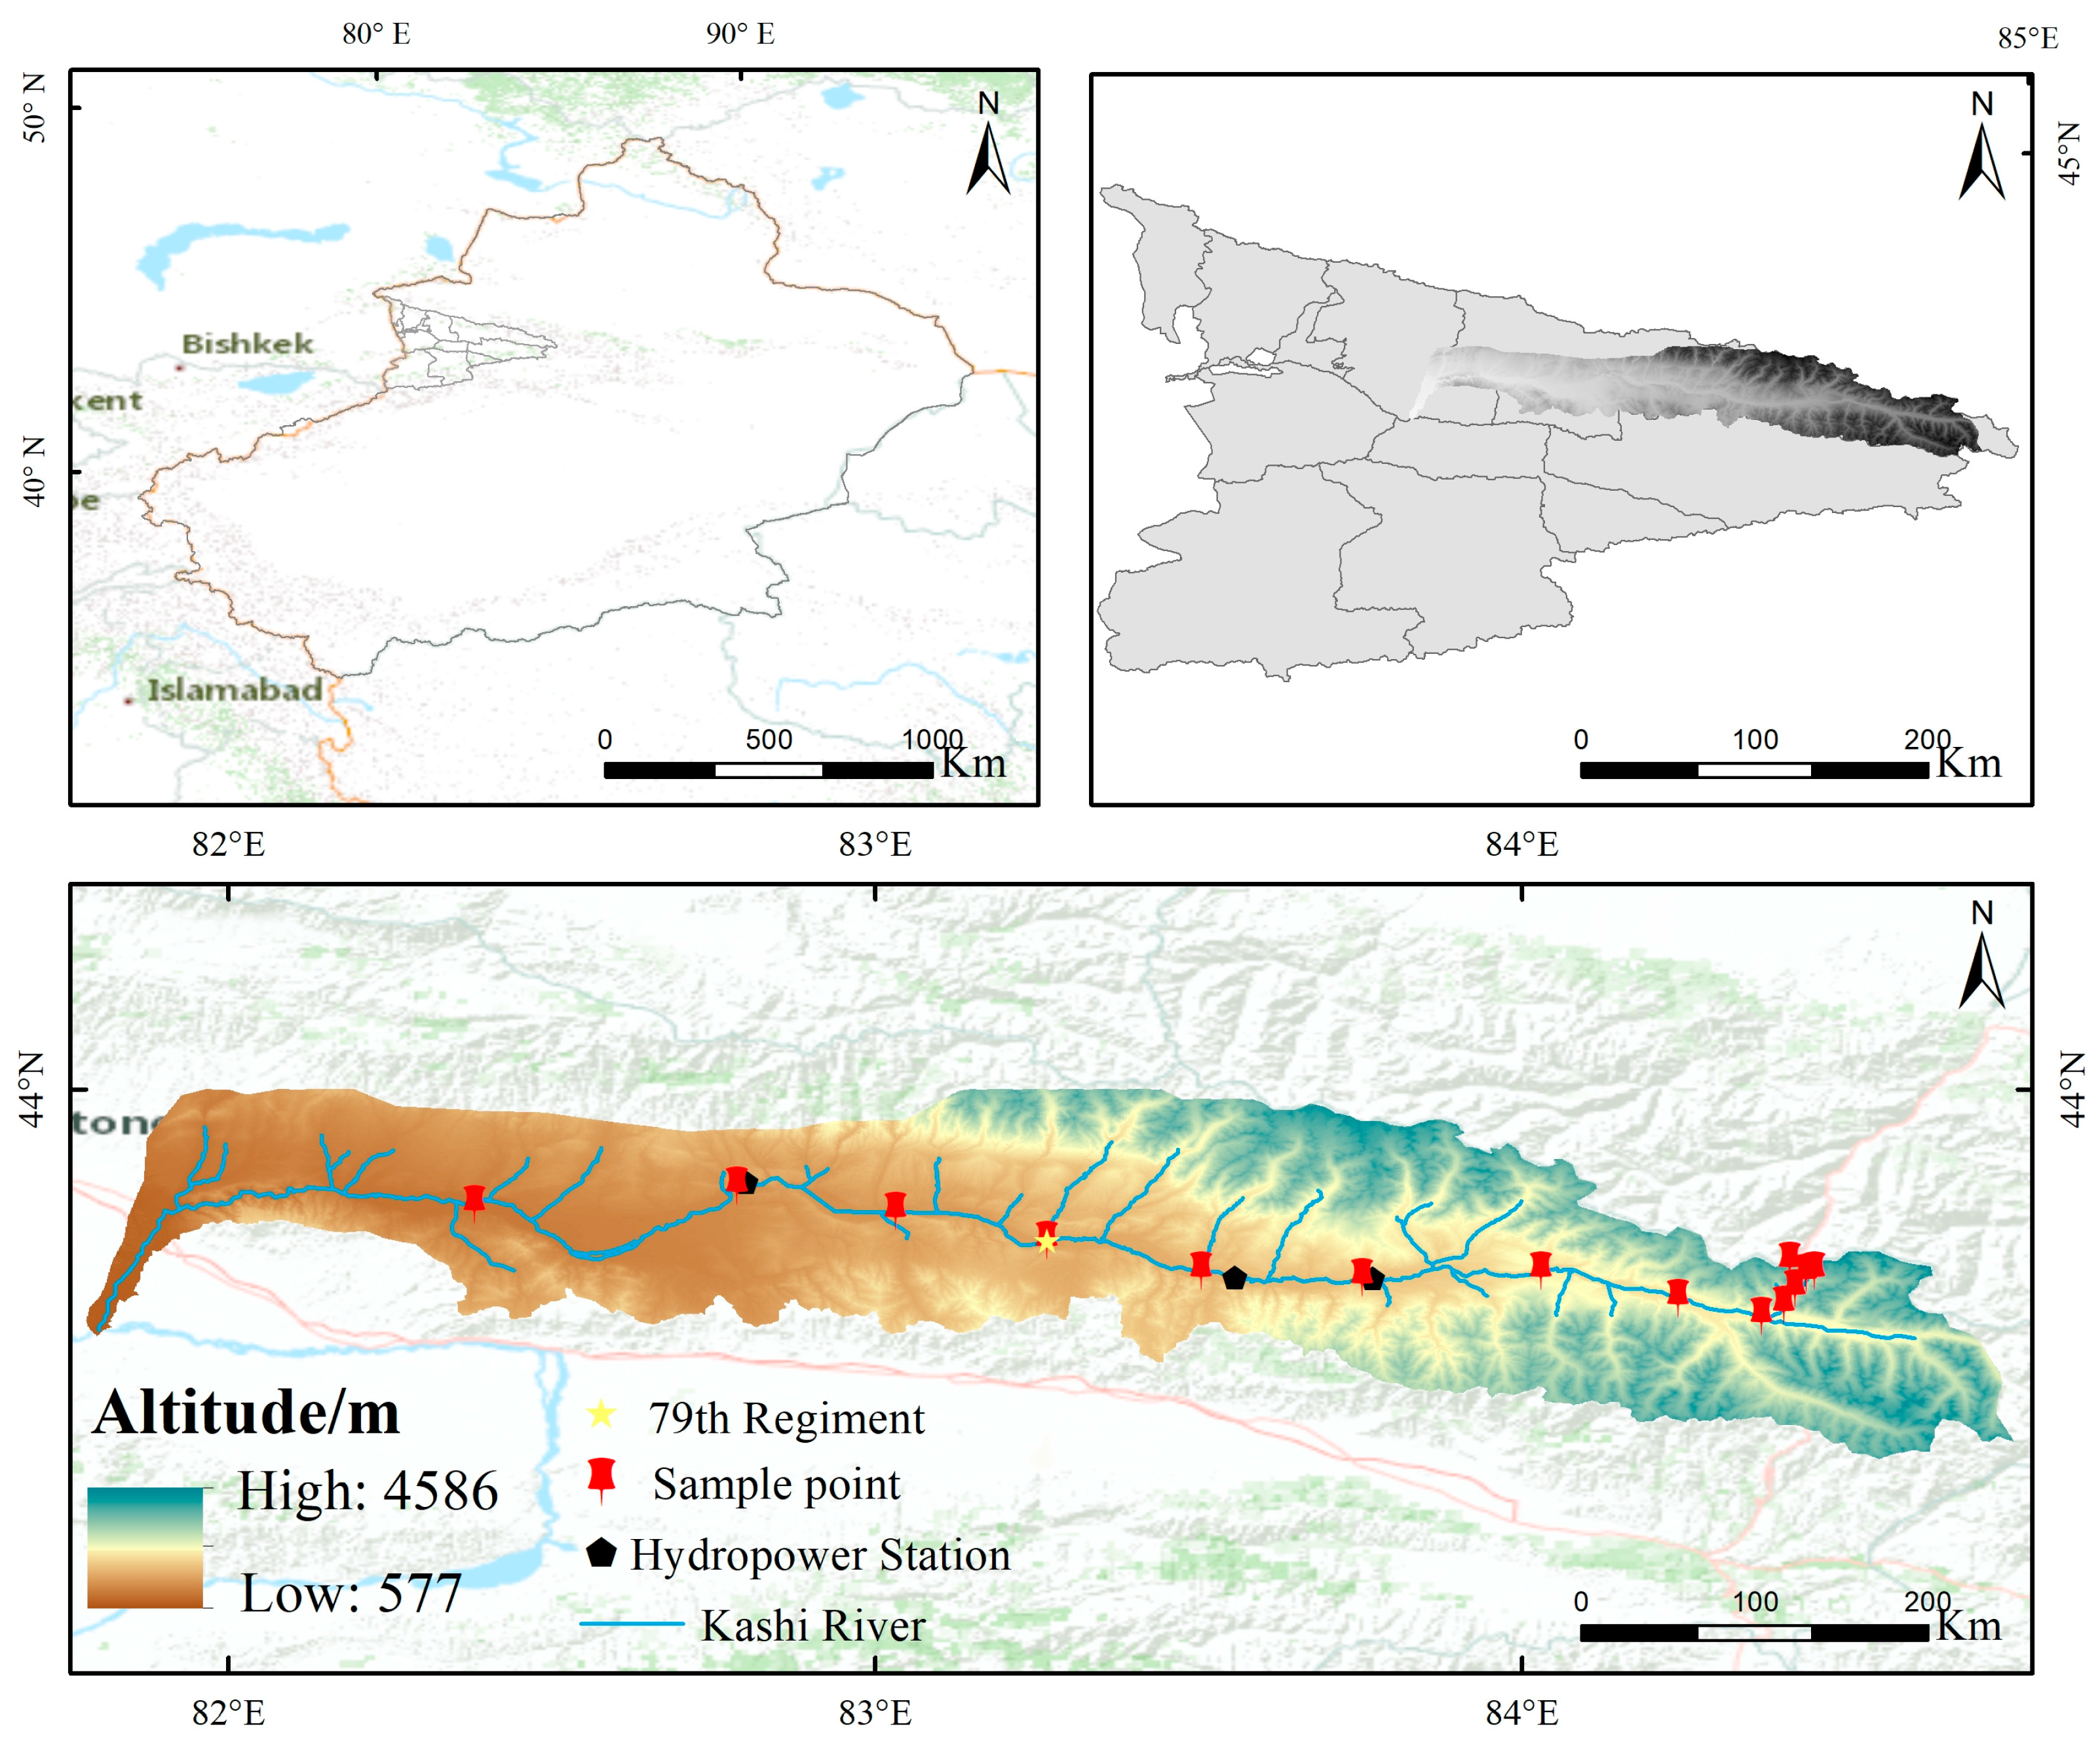
2. Study Area
3. Data Sources and Research Methods
3.1. Data Sources
3.2. Methods
3.2.1. Isotope Measurement
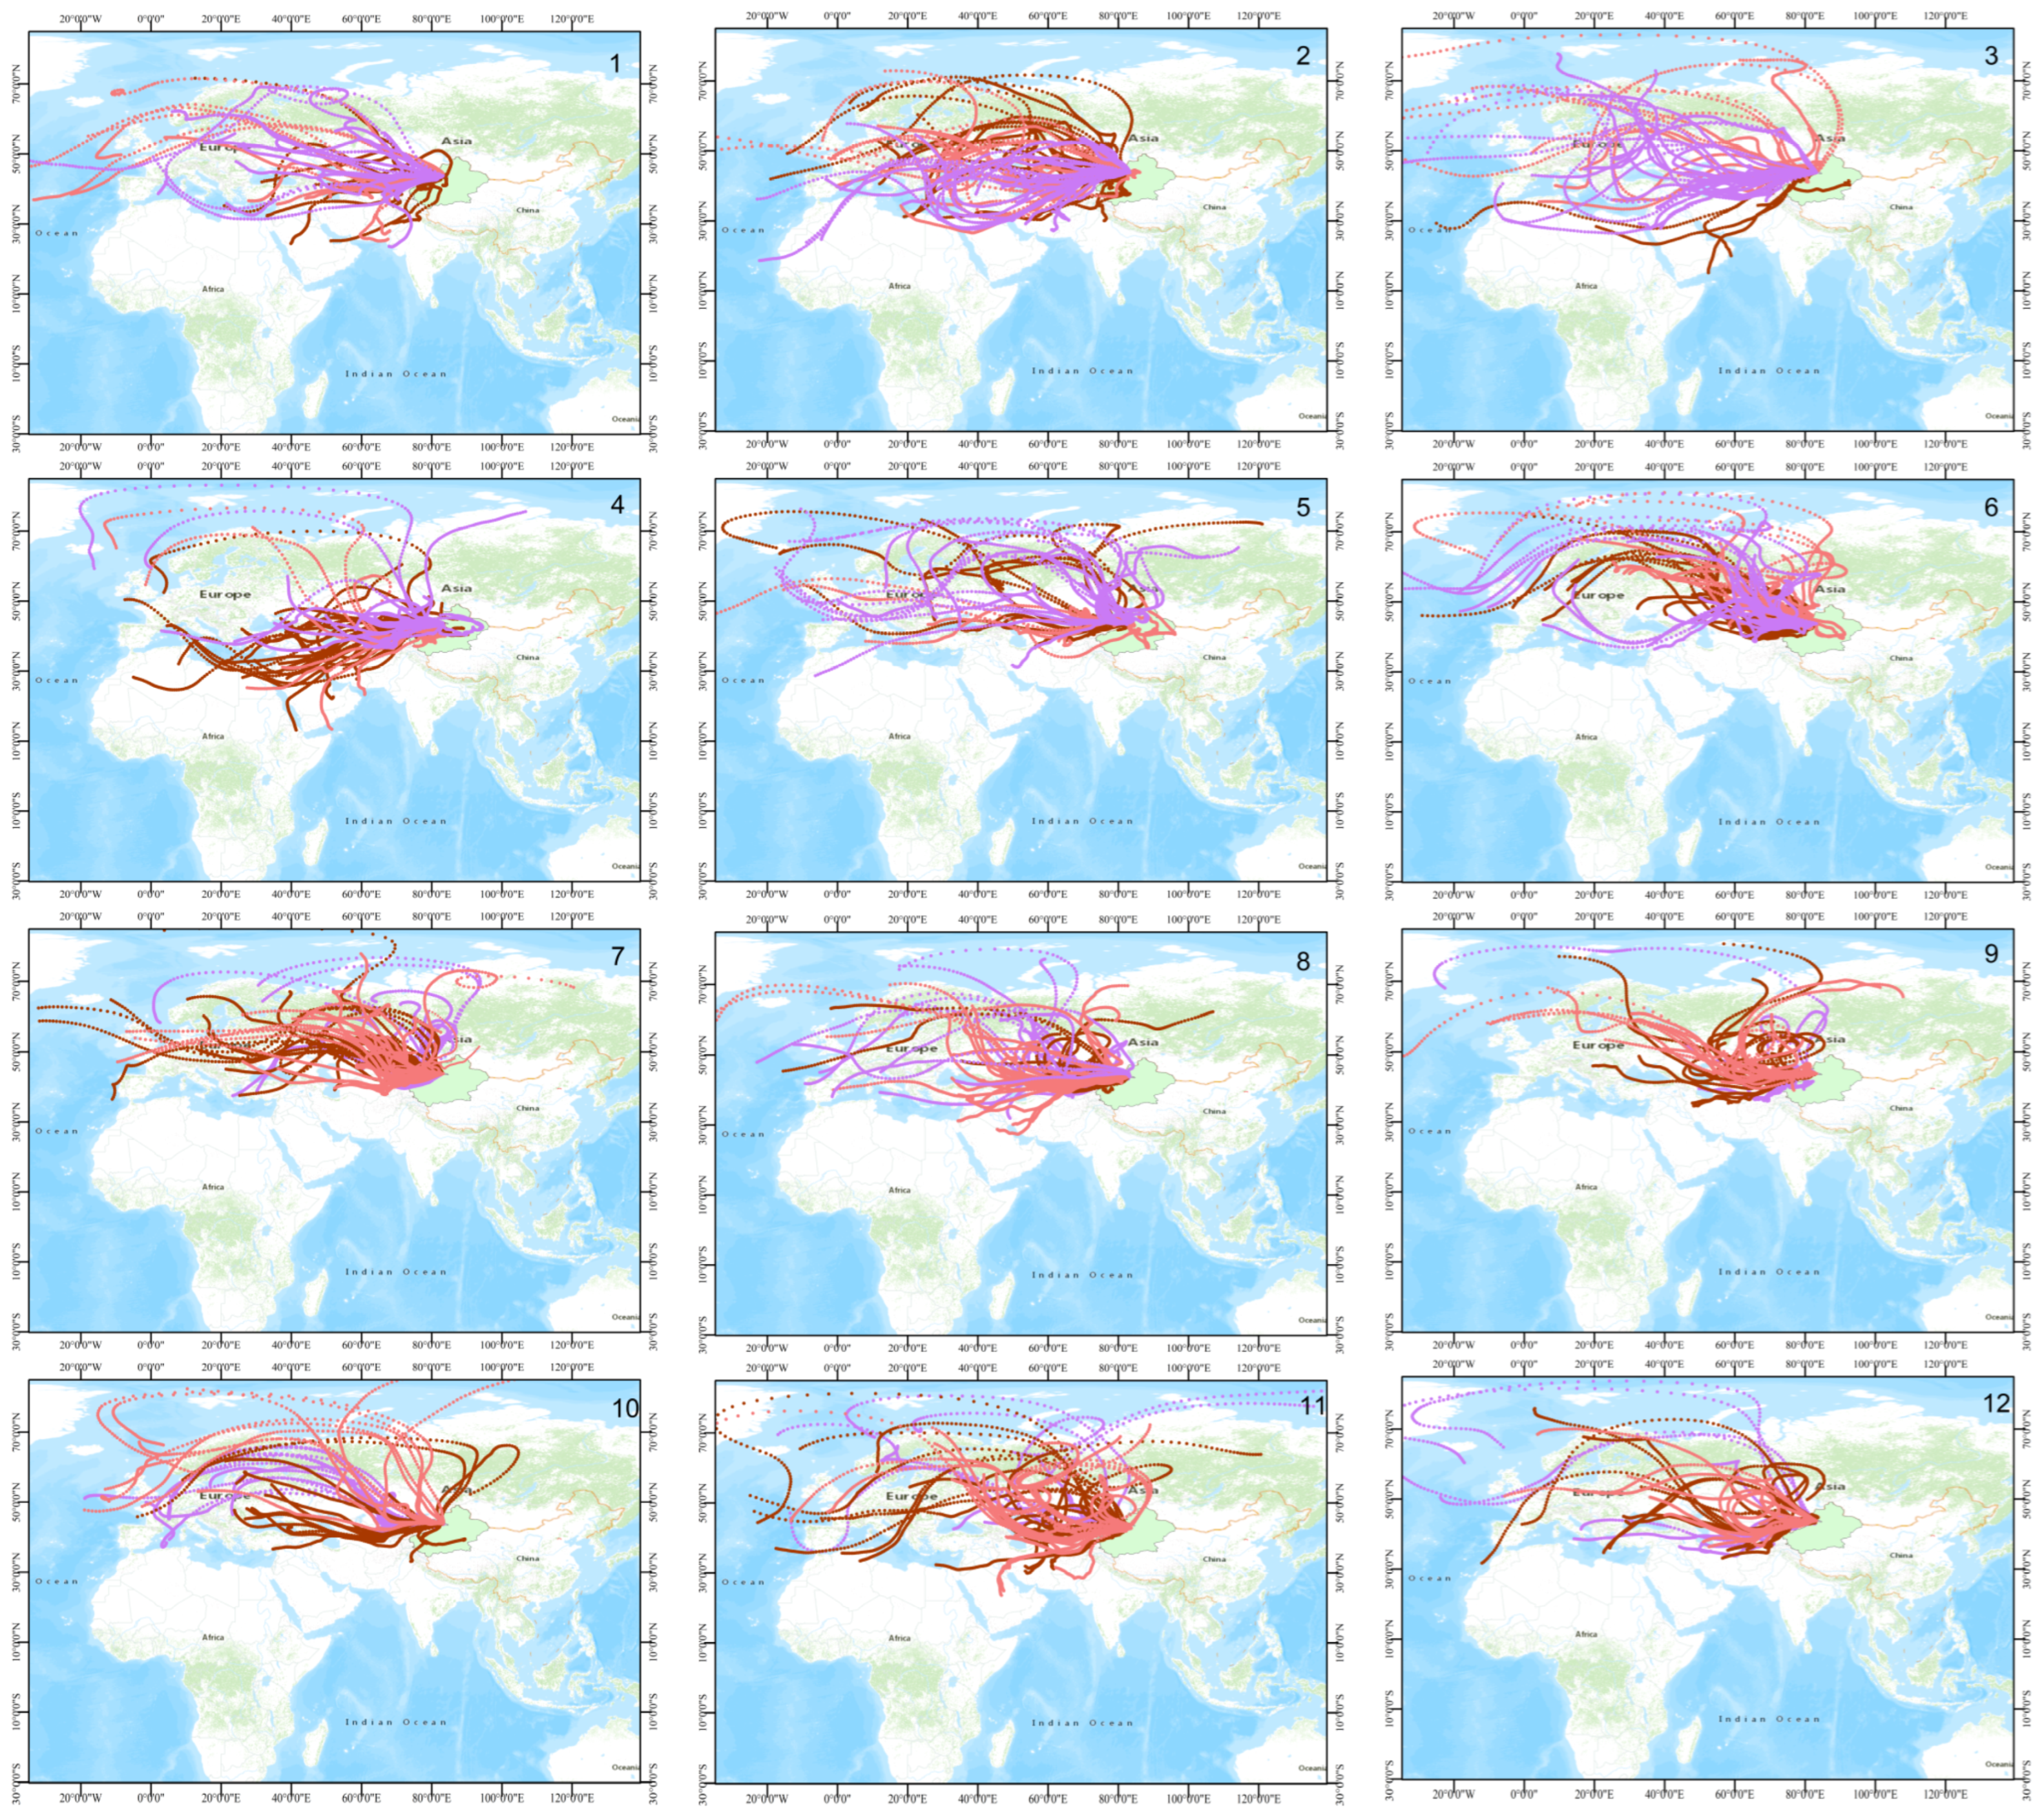
3.2.2. Simulation of Atmospheric Precipitation Water Vapor Sources
3.2.3. Water Source Composition Analysis
3.2.4. Localized Evaporation of Water Vapor Analysis
3.2.5. Calculation of Water Vapor Transport Contribution
4. Results
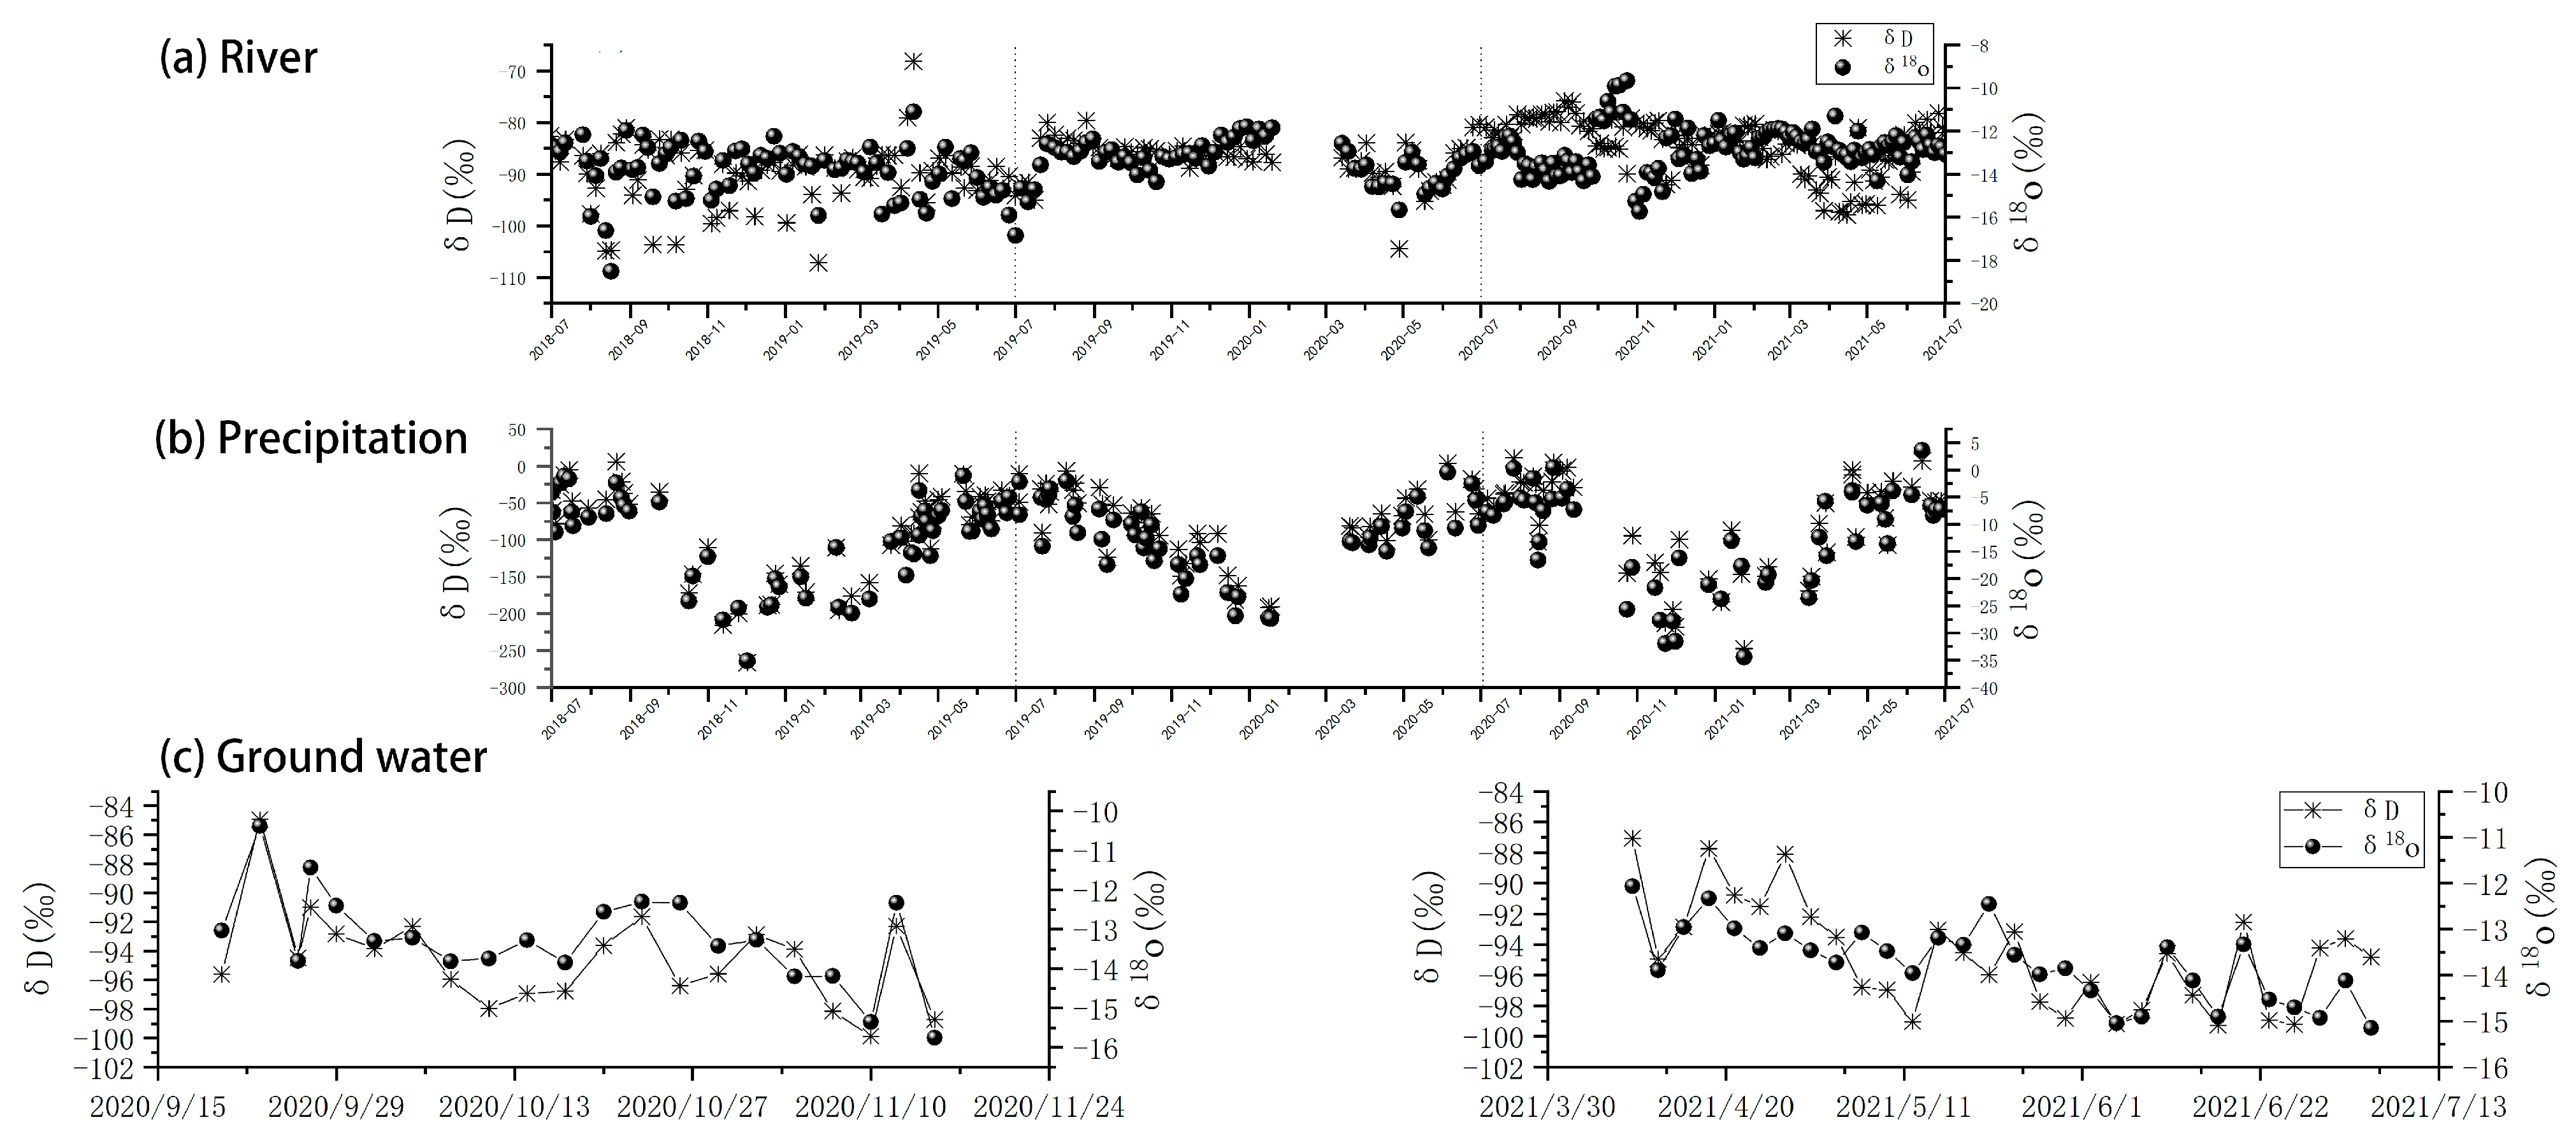
4.1. Isotopic Characteristics of Different Water Bodies
4.1.1. Elevation Effects on River Water Isotopes
4.1.2. Seasonal Effects on River Water Isotopes
4.1.3. Isotopic Characteristics of Precipitation
4.1.4. Isotopic Characteristics of Groundwater
4.1.5. Isotopic Characteristics of Granular Snow Meltwater
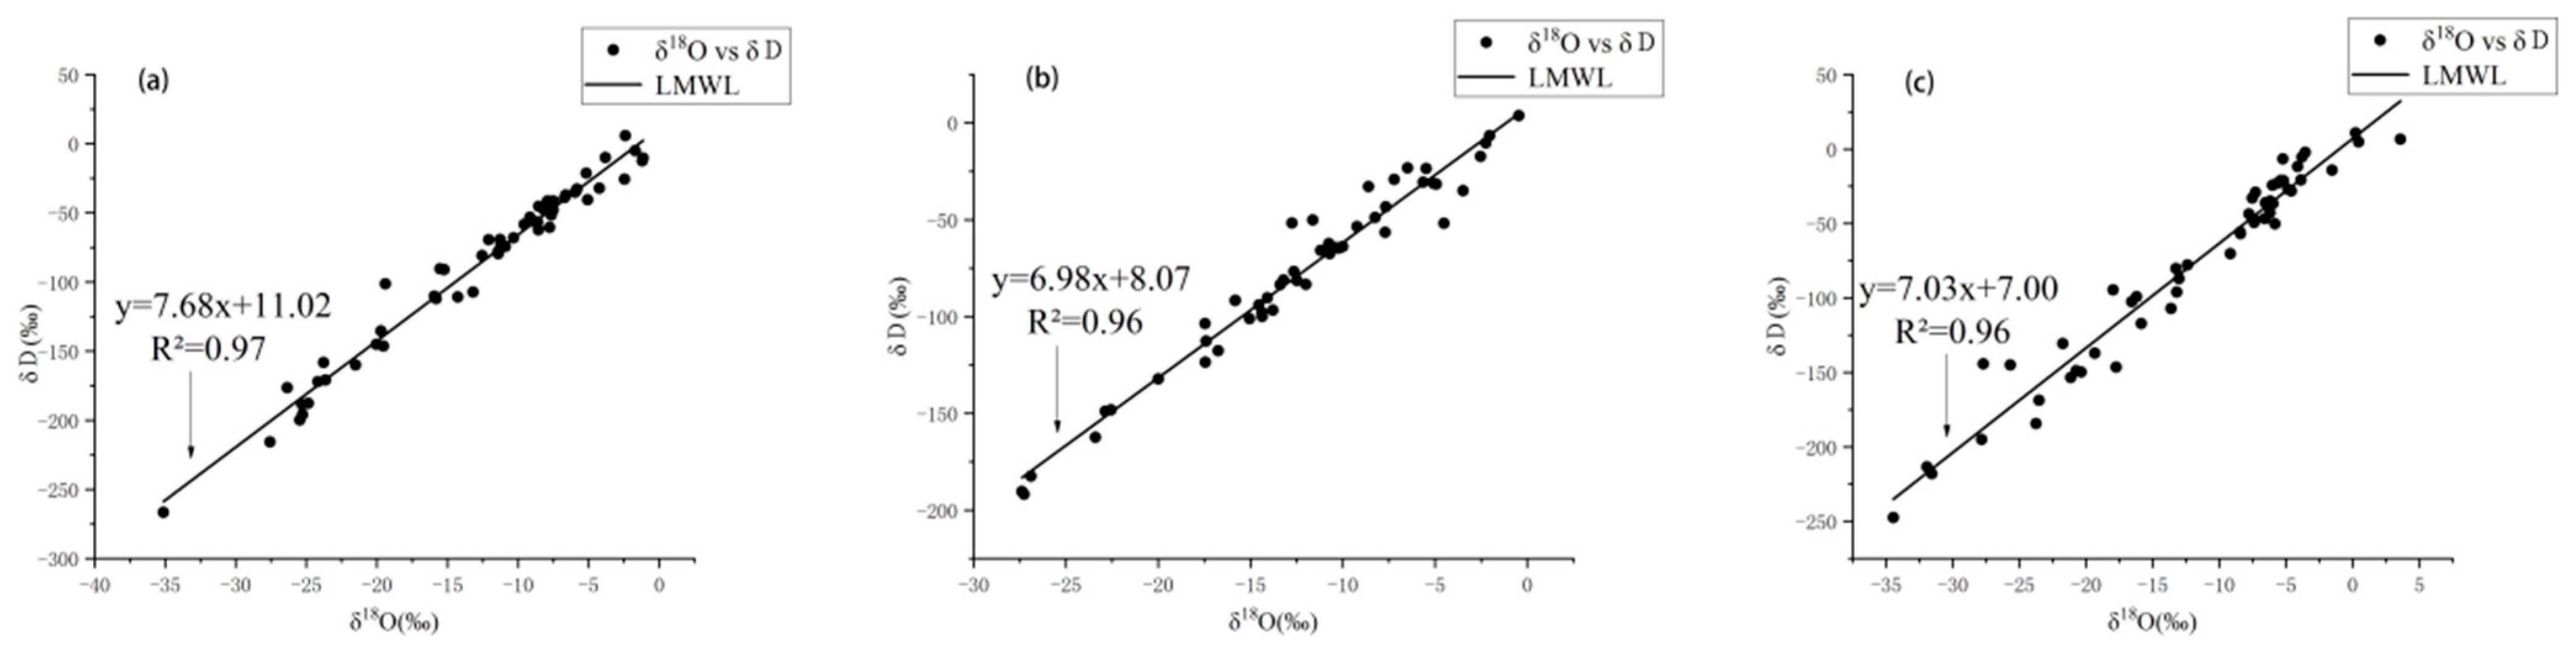
4.2. Relationship between δD and δ18O in Different Water Bodies
4.2.1. Precipitation Line Equation
4.2.2. Analysis of Different Water Bodies
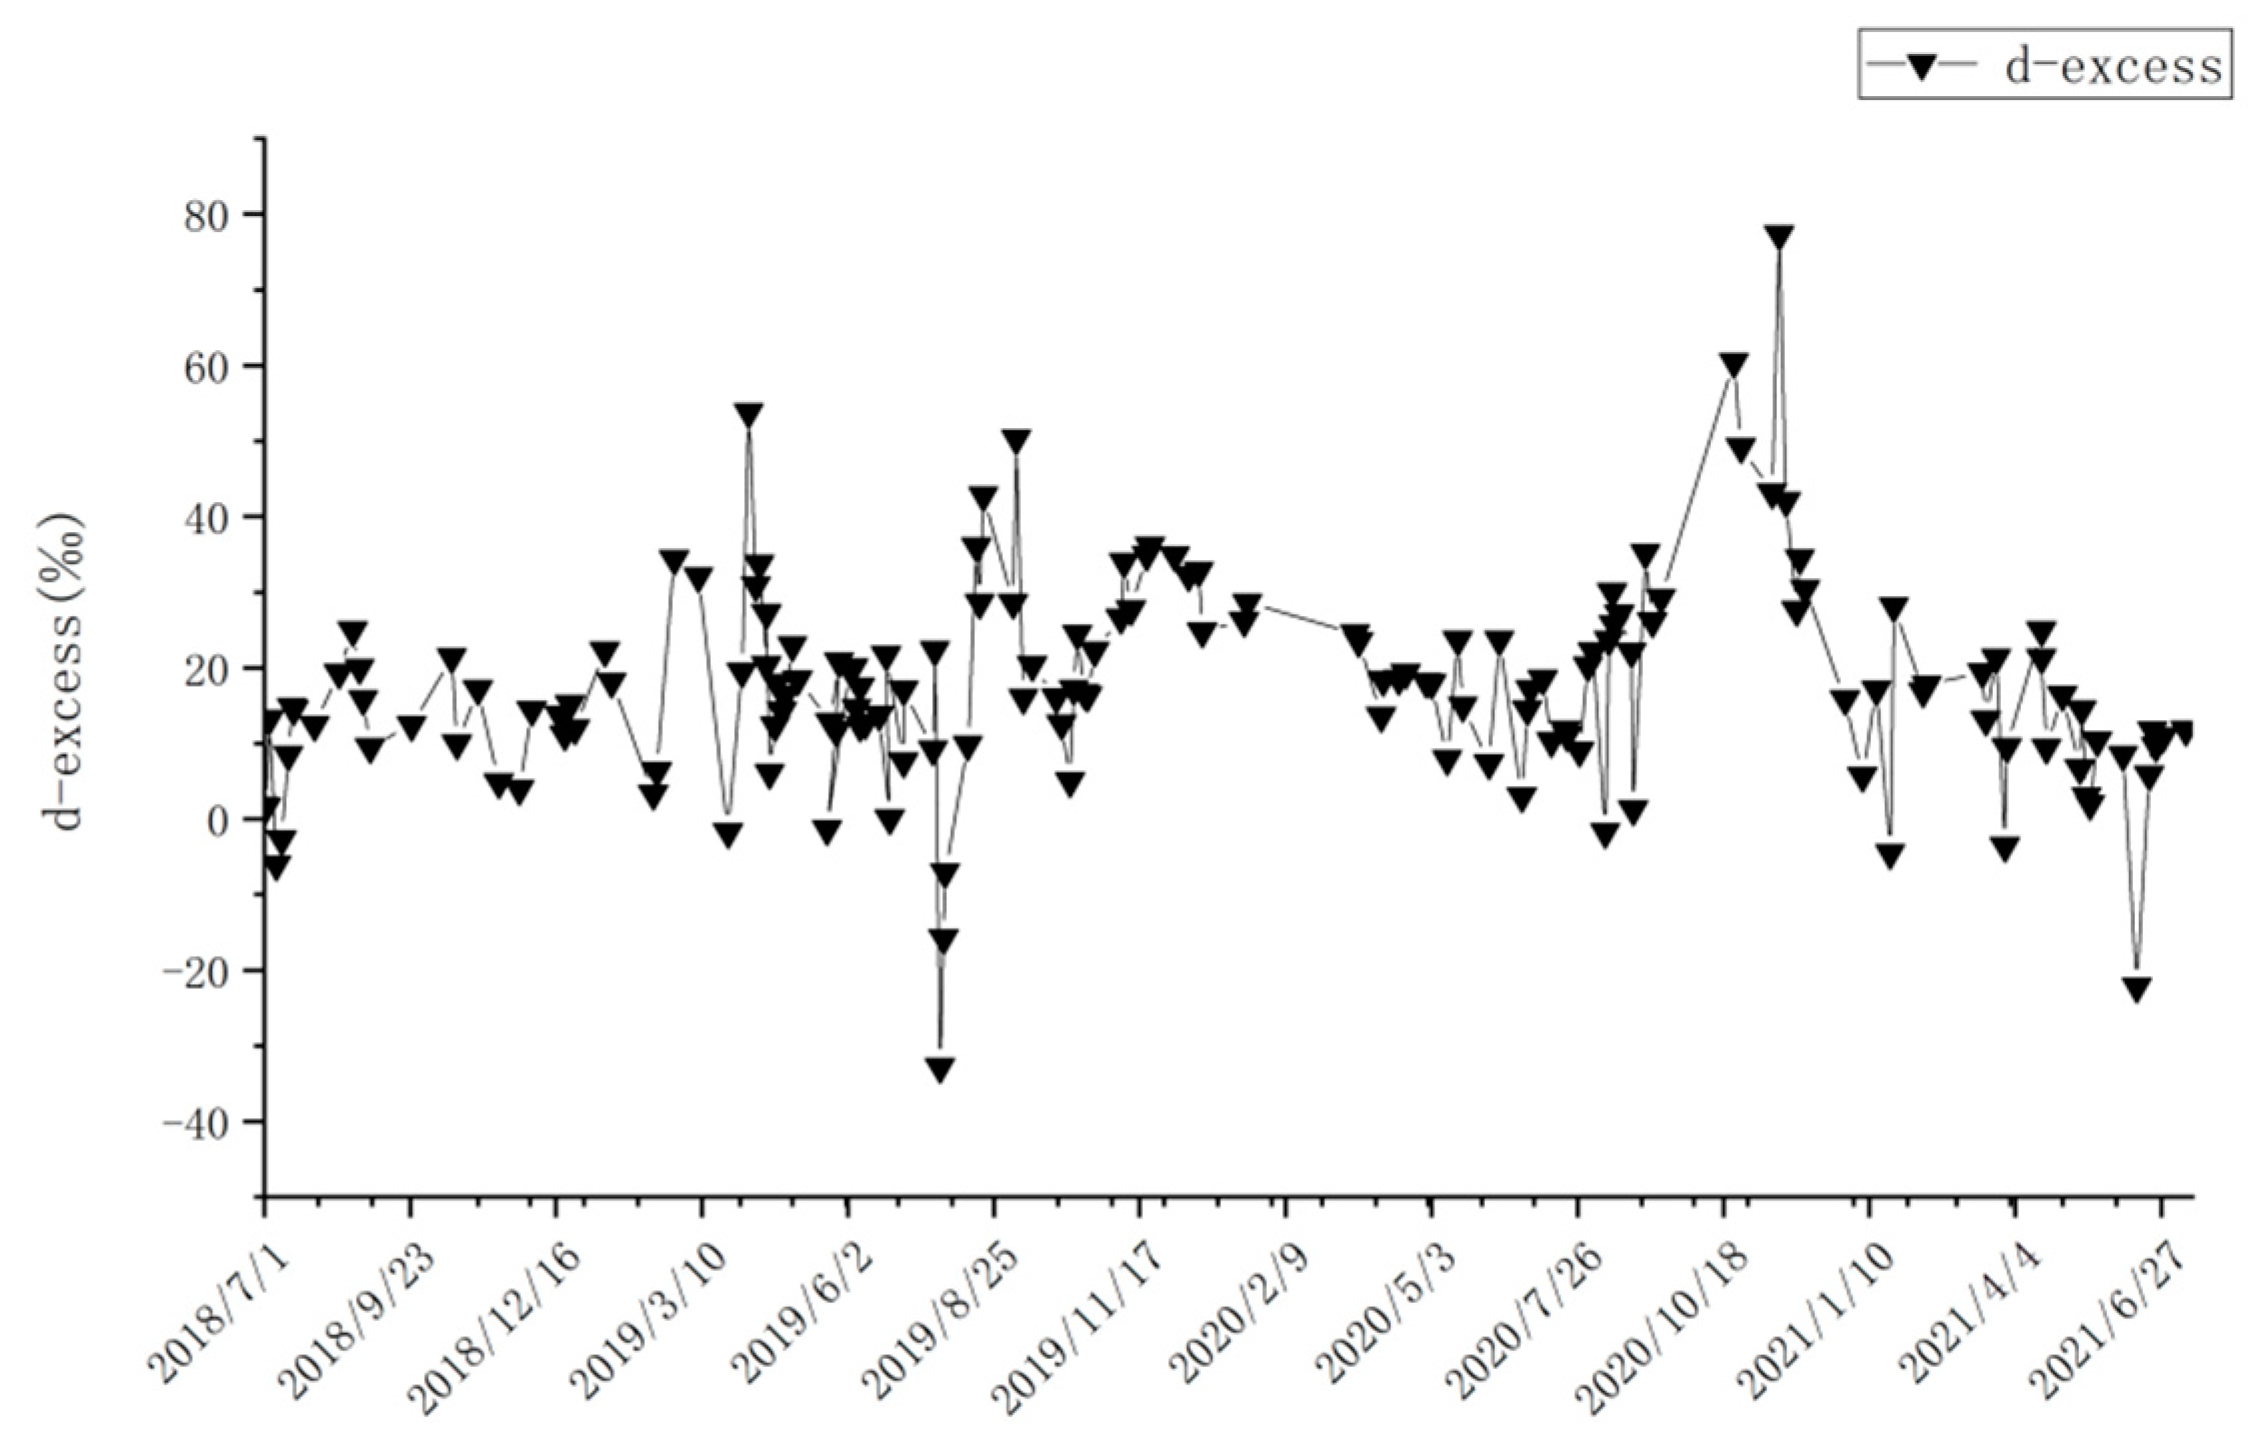
4.3. D-Excess Analysis
4.3.1. Analysis of D-Excess in River Water, Surface Granular Snow Meltwater, and Groundwater
4.3.2. Analysis of D-Excess in Precipitation
4.4. Links between Different Water Bodies
4.5. HYSPLIT-Based Water Vapor Source Analysis
5. Discussion
5.1. Isotope Change Analysis
5.2. Water Vapor Source Analysis
6. Conclusions
Author Contributions
Funding
Data Availability Statement
Conflicts of Interest
References
- Yue, H.; Yu, X.X.; Deng, W.P.; Jia, G.D.; Lou, Y.H.; Bai, Y.Q. The Variations of Hydrogen and Oxygen Compositions and Moisture Sources in the Precipitation in Western Mountain Areas of Beijing. J. Nat. Resour. 2016, 31, 1211–1221. [Google Scholar]
- Sun, C.J.; Li, W.H.; Chen, Y.N.; Li, X.G.; Yang, Y.H. Isotopic and hydrochemical composition of runoff in the Urumqi River, Tianshan Mountains, China. Environ. Earth Sci. 2015, 74, 1521–1537. [Google Scholar]
- Cappa, C.D. Isotopic fractionation of water during evaporation. J. Geophys. Res. 2003, 108, 4525. [Google Scholar]
- Ma, B.; Liang, X.; Jin, M.G.; Li, J.; Niu, H. Characteristics of fractionation of hydrogen and oxygen isotopes in evaporating water in the typical region of the North China Plain. Adv. Water Sci. 2015, 26, 639–648. [Google Scholar]
- Zhou, J.; Liu, G.; Meng, Y.; Xia, C.; Chen, K.; Chen, Y. Using stable isotopes as tracer to investigate hydrological condition and estimate water residence time in a plain region, Chengdu, China. Sci. Rep. 2021, 11, 2812. [Google Scholar]
- Unnikrishnan Warrier, C.; Praveen Babu, M. A study on the spatial variations in stable isotopic composition of precipitation in a semiarid region of Southern India. Hydrol. Processes. 2012, 26, 3791–3799. [Google Scholar]
- Dansgaard, W. Stable isotopes in precipition. Tellus 1964, 16, 436–468. [Google Scholar] [CrossRef]
- Nakamura, T.; Osaka, K.; Nishida, K.; Chapagain, S.; Kazama, F. Groundwater Recharges and Interaction between Groundwater and River Water in Kathmandu Valley, Nepal. AGU Fall Meeting Abstracts; American Geophysical Union: San Francisco, CA, USA, 2015; p. 1125. [Google Scholar]
- Song, X.F.; Liu, J.R.; Sun, X.M.; Yuan, G.F.; Liu, X.; Wang, S.Q.; Hou, S.B. Establishment of Chinese Network of Isotopes in Precipitation (CHNIP) Based on CERN. Adv. Earth. Sci. 2007, 22, 738–747. [Google Scholar]
- Li, Y.J.; Zhang, M.J.; Li, Z.Q.; Wang, S.J.; Wang, F.T. Seasonal variations of stable oxygen isotope in surface snow and vapor transportation at the headwaters of Urumqi River Tianshan Mountains. Geogr. Res. 2011, 30, 953–962. [Google Scholar]
- Li, J.P.; Li, J.F.; Du, L.L.; Zhang, Y.; Wang, S.G. General situation of heavy rain in Northwest China and analysis of a case. J. Lanzhou Univ. (Nat. Sci.) 2013, 49, 474–482. [Google Scholar]
- Du, L.L.; Yang, D.B.; Wang, S.G.; Li, J.P.; Zhang, Y.; Dong, A.X. Transportation paths of water vapor of heavy precipitation from May to October in Maqu. J. Lanzhou Univ. (Nat. Sci.) 2011, 47, 55–61. [Google Scholar]
- Wang, J.Y. Impacts of Climate Change on Runoff Process of Khash River in Western Tianshan Mountains, Xinjiang, China. J. Glaciol. Geocryol. 2011, 33, 1153–1160. [Google Scholar]
- Zhang, Y.X.; Lei, X.Y.; Jiang, Q.Q.; Ma, Z.G.; Zhang, H. Evaluation and Analysis of Forecasting Short-term Daily Reference Crop Evapotranspiration by Hargreaves-Samani Equation Based on Temperature Forecast. J. Yangtze River Sci. Res. Inst. 2018, 35, 18–22. [Google Scholar]
- Li, J.Q.; Huang, Y.N.; Shi, P.J.; Li, Z. Isotopic characteristics and vapor sources of atmospheric precipitation in the loess region of North Shaanxi, China. Chin. J. Appl. Ecol. 2022, 33, 1459–1465. [Google Scholar]
- Turner, J.V.; Bradd, J.M.; Waite, T.D. Conjunctive use of isotopic techniques to elucidate solute concentration and flow processes in dryland salinized catchments. In Proceedings of the International Hydrology and Water Resources Symposium, Challenges for Sustainable Development, Perth, WA, Australia, 2–4 October 1991. [Google Scholar]
- Hooper, R.P.; Christophersen, N.; Peter, N.E. Modelling streamwater chemistry as a mixture of soilwater end-members-An application to the Panola Mountain cat chment, Georgia, USA. J. Hydrol. 1990, 116, 321–343. [Google Scholar] [CrossRef]
- Ma, J.Y.; Li, Z.B.; Ma, B.; Li., C.D.; Xiao, J.B.; Zhang, L.T. Effects of vegetation types in small watershed on soil water cycle in gully-slope land of loess region. Acta Ecol. Sin. 2020, 40, 2698–2706. [Google Scholar]
- Starr, V.P.; Peixoto, J.P. On the global balance of water vapor and the hydrology of deserts. Tellus 1958, 10, 188–194. [Google Scholar] [CrossRef]
- Rasmusson, E.M. Atmospheric water vapor transport and the water balance of North America: Part I. characteristics of the water vapor flux field. Mon. Weather Rev. 1967, 95, 403–426. [Google Scholar]
- Eltahir, E.A.B.; BRAS, R.L. Precipitation recycling in the Amazon basin. Q. J. R. Meteorol.Soc. 1994, 120, 861–880. [Google Scholar]
- Kinzer, G.D.; Gunn, R. The evaporation, temperature and thermal relaxation-time of freely falling waterdrops. J. Meteorol. 1951, 8, 71–83. [Google Scholar]
- Wang, S.J.; Zhang, M.J.; Che, Y.J.; Zhu, X.F.; Liu, X.M. Influence of belowcloud evaporation on deuterium excess in precipitation of arid central Asia and its meteorological controls. J. Hydrometeorol. 2016, 17, 1973–1984. [Google Scholar]
- Chen, H.Z.; Ye, C.Z.; Chen, J.J.; Luo, Z.R. Analysis of water vapor transport and budget during persistent heavy rainfall over Hu nan Province in June 2017. Meteor Mon. 2019, 45, 1213–1226. [Google Scholar]
- Hao, S.; Li, F.; Li, Y.; Gu, C.; Zhang, Q.; Qiao, Y.; Jiao, L.; Zhu, N. Stable isotope evidence for identifying the recharge mechanisms of precipitation, surface water, and groundwater in the Ebinur Lake basin. Sci. Total Environ. 2019, 657, 1041–1050. [Google Scholar]
- Craig, H. Isotopic variations in meteoric water. Science 1961, 133, 1702–1703. [Google Scholar]
- Zheng, S.H.; Hou, F.L.; Ni, B.L. Hydrogen and oxygen isotopes of precipitationin China. Chin. Sci. Bull. 1983, 34, 801–806. [Google Scholar]
- Qiu, X.; Zhang, M.; Wang, S. Preliminary research on hydrogen and oxygen stable isotope characteristics of different water bodies in the Qilian Mountains, northwestern Tibetan Plateau. Environ. Earth Sci. 2016, 75, 1491. [Google Scholar]
- Aizen, V.B.; Aizen, E.M.; Joswiak, D.R. Climatic and atmospher-ic circulation pattern variability from ice-core isotope/geochemis-try records (Altai, Tien Shan and Tibet). Ann. Glaciol. 2006, 4, 49–60. [Google Scholar]
- Hou, D.T.; Qin, X.; Wu, J.K.; Du, W.T. Characteristicsof stable isotopes in precipitation and the water vapor sources in Urumchi. J. Arid. Land Resour. Environ. 2011, 25, 139–145. [Google Scholar]
- Yang, Q.; Mu, H.; Guo, J.; Bao, X.; Martín, J.D. Temperature and rainfall amount effects on hydrogen and oxygen stable isotope in precipitation. Quat. Int. 2019, 519, 25–31. [Google Scholar]
- Claus, K.; Rolf, F.R.; Fernando, R.B.; Iñaki, V. Vapour source and spatiotemporal variation of precipitation isotopes in Southwest Spain. Hydrol. Process. 2021, 35, 14445. [Google Scholar]
- Hoefs, J. Stable Isotope Geochemistry, fourth ed. Sediment. Geol. 1997, 201, 321–323. [Google Scholar]
- Sanci, R.; Panarello, H.O.; Gozalvez, M.R. Environmental isotopes as tracers of mining activities and natural processes: A case study of San Antonio de los Cobres River Basin, Puna Argentina. J. Geochem. Explor. 2020, 213, 106517. [Google Scholar]
- Deng, H.J.; Chen, Y.N.; Chen, X.W. Driving factors and changes in components of terrestrial water storage in the endorheic Tibetan Plateau. J. Hydrol. 2022, 612, 128225. [Google Scholar]
- Xu, Y.W.; Kang, S.J.; Zhang, Y.L.; Zhang, Y.J. A method for estimating the contribution of evaporative vapor from the Lake Nam Co to local atmospheric vapor based on stable isotopes of water bodies. Chin. Sci. Bull. 2011, 56, 1042–1049. [Google Scholar]
- Feng, X.C.; Yang, Y.H. Hydrochemical and stable isotopic spatiotemporal variation characteristics and their environmental significance in the Kashi River Mountain Area of Ili, Xinjiang, China. Environ. Geochem. Health 2022, 44, 799–816. [Google Scholar]
- Zeng, K.K.; Yang, Y.H.; Hu, Y.C.; Feng, X.C. Isotopic characteristics and water vapor sources of precipitation in the Kashi River Basin. Arid Zone Res. 2021, 38, 1263–1273. [Google Scholar]


| Years | Samples | δD/‰ | δ18O/‰ | ||||
|---|---|---|---|---|---|---|---|
| Max | Min | Average | Max | Min | Average | ||
| 2018 | Summer | −82.25 | −104.86 | −90.21 | −12.17 | −18.53 | −14.17 |
| Autumn | −83.26 | −103.67 | −91.16 | −12.19 | −15.27 | −13.65 | |
| Winter | −86.24 | −107.15 | −91.67 | −12.24 | −15.93 | −13.59 | |
| 2019 | Spring | −68.13 | −95.45 | −86.97 | −11.11 | −15.87 | −13.93 |
| Summer | −79.62 | −95.06 | −87.63 | −12.38 | −16.85 | −14.11 | |
| Autumn | −84.59 | −88.84 | −86.11 | −12.67 | −14.35 | −13.37 | |
| Winter | −84.25 | −87.70 | −86.15 | −11.80 | −12.98 | −12.25 | |
| 2020 | Spring | −83.91 | −104.47 | −90.52 | −12.58 | −15.67 | −14.04 |
| Summer | −77.93 | −92.11 | −81.99 | −12.22 | −14.70 | −13.43 | |
| Autumn | −75.82 | −92.03 | −82.14 | −9.66 | −15.74 | −12.86 | |
| Winter | −80.33 | −88.26 | −83.56 | −11.44 | −13.97 | −12.56 | |
| 2021 | Spring | −81.01 | −97.89 | −90.29 | −11.31 | −14.32 | −12.73 |
| Summer | −78.20 | −94.97 | −83.55 | −12.20 | −14.03 | −12.92 | |
| Year/Month | Altitude (m) | Sample Type | δD (‰) | δ18O (‰) |
|---|---|---|---|---|
| 2018/07 | 3377 | Snow | −107.14 | −15.27 |
| 2019/07 | 3341 | Snow | −182.93 | −25.31 |
| 2020/09 | 3385 | Snow | −56.87 | −9.81 |
| 2021/07 | 3375 | Snow | −134.85 | −18.63 |
| Year/Month | River Water | Year/Month | Ground Water | Year/Month | Snow | ||||
|---|---|---|---|---|---|---|---|---|---|
| Max | Min | Avg | Max | Min | Avg | ||||
| 2018/07–2018/12 | 43.49 | 10.24 | 19.07 | 2020/09–2020/12 | 27.30 | −1.88 | 11.35 | 2018/07 | 15.02 |
| 2019/01–2020/01 | 40.70 | 7.39 | 21.55 | 2019/07 | 19.55 | ||||
| 2020/01–2021/01 | 45.07 | −12.61 | 21.88 | 2021/04–2021/06 | 26.39 | 3.65 | 15.16 | 2020/09 | 21.61 |
| 2021/01–2021/06 | 25.95 | 3.83 | 14.24 | 2021/07 | 14.19 | ||||
| Year/Month | Water Type | Number of Samples | δ18O | Rate\% | |
|---|---|---|---|---|---|
| AVG | Standard Deviation | ||||
| 2020/09 - 2020/11 | Ground water | 21 | −13.24 | 1.18 | 77% |
| Precipitation | 8 | −10.10 | 9.57 | 23% | |
| River | 19 | −12.53 | 1.93 | - | |
| 2021/04 - 2021/06 | Ground water | 30 | −13.74 | 0.81 | 48% |
| Precipitation | 16 | −6.39 | 3.84 | 52% | |
| River | 30 | −12.89 | 0.49 | - | |
| Month | Year | Precipitation/mm | Recirculation Rate | Land Vapor | Atlantic Ocean | Arctic Ocean | Mediterranean Sea | Black Sea | Caspian Sea | Baltic Sea | Arabian Sea |
|---|---|---|---|---|---|---|---|---|---|---|---|
| 1 | 2019 | 6.8 | 28% | 33% | 6% | - | 11% | 6% | 11% | - | 5% |
| 2020 | 7.4 | 7% | 13% | 40% | 7% | 13% | - | 7% | 6% | 7% | |
| 2021 | 18.7 | - | 50% | 11% | 5% | 17% | 6% | - | 6% | 5% | |
| 2 | 2019 | 30.4 | 10% | 43% | 10% | 7% | 20% | 3% | 3% | 4% | - |
| 2020 | 22.3 | - | 50% | 21% | 8% | 17% | - | 4% | - | - | |
| 2021 | 39.4 | 4% | 58% | 13% | - | 12% | 13% | - | - | - | |
| 3 | 2019 | 20.7 | 23% | 44% | 11% | - | - | - | - | - | 22% |
| 2020 | 27.8 | 10% | 38% | 33% | 5% | 14% | - | - | - | - | |
| 2021 | 26.4 | - | 41% | 30% | 7% | 4% | - | 11% | 7% | - | |
| 4 | 2019 | 90.9 | 11% | 52% | 6% | - | 25% | 6% | - | - | - |
| 2020 | 17.4 | 27% | 46% | 20% | - | - | - | - | - | 7% | |
| 2021 | 17.9 | 6% | 58% | 7% | 6% | 11% | 6% | 6% | - | - | |
| 5 | 2019 | 35.3 | 11% | 38% | 17% | 17% | - | 11% | 6% | - | - |
| 2020 | 29.4 | 13% | 60% | 13% | - | 7% | - | 7% | - | - | |
| 2021 | 48.9 | 4% | 54% | 38% | - | - | 4% | - | - | - | |
| 6 | 2019 | 35.1 | 8% | 63% | 17% | 6% | 3% | - | 3% | - | - |
| 2020 | 36 | 8% | 66% | 13% | 13% | - | - | - | - | - | |
| 2021 | 72 | 5% | 46% | 25% | 13% | 8% | - | - | 3% | - | |
| 7 | 2018 | 76.7 | 11% | 67% | 12% | - | 4% | - | 4% | 2% | - |
| 2019 | 24.4 | 8% | 42% | 29% | 4% | 5% | 4% | 4% | 4% | - | |
| 2020 | 57.6 | 10% | 60% | 18% | 4% | - | - | 7% | 1% | - | |
| 8 | 2018 | 37.8 | - | 38% | 19% | 9% | 14% | 10% | 5% | 5% | - |
| 2019 | 55.6 | 5% | 55% | 28% | - | 6% | 6% | - | - | - | |
| 2020 | 50.5 | 6% | 57% | 17% | - | 3% | 7% | 10% | - | - | |
| 9 | 2018 | 29.4 | 17% | 67% | 8% | - | - | - | 8% | - | - |
| 2019 | 39.1 | 6% | 66% | 6% | 11% | - | - | 11% | - | - | |
| 2020 | 16.9 | - | 73% | 27% | - | - | - | - | - | - | |
| 10 | 2018 | 26.2 | - | 33% | 50% | - | 17% | - | - | - | - |
| 2019 | 27.7 | 15% | 48% | 10% | - | 5% | 19% | - | 3% | - | |
| 2020 | 20.7 | 17% | 58% | 25% | - | - | - | - | - | - | |
| 11 | 2018 | 16.4 | - | 33% | 17% | 42% | - | 8% | - | - | - |
| 2019 | 33.5 | 8% | 50% | 13% | 13% | 13% | - | - | 3% | - | |
| 2020 | 13.6 | 8% | 58% | 13% | 13% | - | - | 8% | - | - | |
| 12 | 2018 | 25.9 | - | 53% | 13% | 14% | 13% | - | 7% | - | - |
| 2019 | 19.8 | 19% | 42% | 19% | - | 10% | 10% | - | - | - | |
| 2020 | 11.6 | - | 58% | 25% | - | - | - | 17% | - | - | |
| amount to | 1166.2 | 8% | 52% | 18% | 5% | 8% | 3% | 3% | 2% | 1% |
Disclaimer/Publisher’s Note: The statements, opinions and data contained in all publications are solely those of the individual author(s) and contributor(s) and not of MDPI and/or the editor(s). MDPI and/or the editor(s) disclaim responsibility for any injury to people or property resulting from any ideas, methods, instructions or products referred to in the content. |
© 2023 by the authors. Licensee MDPI, Basel, Switzerland. This article is an open access article distributed under the terms and conditions of the Creative Commons Attribution (CC BY) license (https://creativecommons.org/licenses/by/4.0/).
Share and Cite
Abudouwaili, Z.; Yang, Y.; Feng, X. Characteristics of Hydrogen–Oxygen Isotopes and Water Vapor Sources of Different Waters in the Ili Kashi River Basin. Water 2023, 15, 3127. https://doi.org/10.3390/w15173127
Abudouwaili Z, Yang Y, Feng X. Characteristics of Hydrogen–Oxygen Isotopes and Water Vapor Sources of Different Waters in the Ili Kashi River Basin. Water. 2023; 15(17):3127. https://doi.org/10.3390/w15173127
Chicago/Turabian StyleAbudouwaili, Zilalai, Yuhui Yang, and Xiancheng Feng. 2023. "Characteristics of Hydrogen–Oxygen Isotopes and Water Vapor Sources of Different Waters in the Ili Kashi River Basin" Water 15, no. 17: 3127. https://doi.org/10.3390/w15173127
APA StyleAbudouwaili, Z., Yang, Y., & Feng, X. (2023). Characteristics of Hydrogen–Oxygen Isotopes and Water Vapor Sources of Different Waters in the Ili Kashi River Basin. Water, 15(17), 3127. https://doi.org/10.3390/w15173127