Article

Assessment of Spatial and Temporal Variation in Water Quality for the Godavari River

1
Department of Civil Engineering, Chandigarh University, H-05, Ludhiana-Chandigarh State, Mohali 140413, Punjab, India
2
Department of Civil Engineering, Galgotias College of Engineering and Technology, Knowledge Park I, Greater Noida 201310, Uttar Pradesh, India
3
Department of Botany & Microbiology, College of Science, King Saud University, P.O. Box 22452, Riyadh 11495, Saudi Arabia
4
Water Resources Engineering, Department of Civil Engineering, College of Engineering, King Saud University, Riyadh 11421, Saudi Arabia
5
Department of Applied Sciences, Galgotias College of Engineering & Technology, Greater Noida 201310, Uttar Pradesh, India
6
Department of Civil Engineering (Environmental Science & Engineering), Yeungnam University, Gyeongsan 38541, Republic of Korea
*
Author to whom correspondence should be addressed.
Water 2023, 15(17), 3076; https://doi.org/10.3390/w15173076
Submission received: 21 June 2023 / Revised: 1 August 2023 / Accepted: 5 August 2023 / Published: 28 August 2023

Abstract

:
With increasing population and industrialization, the water quality of freshwater sources like rivers, lakes, and ponds is becoming increasingly degraded. Most of the rivers in India are becoming polluted, including the Godavari. With the construction of dams, new industries and unsustainable agricultural practices in the Godavari basin, the water characteristics are degrading spatially and temporally. The present study emphasizes the analysis of water quality parameters like temperature, pH, Dissolved Oxygen (DO), conductivity, Biological Oxygen Demand (BOD), nitrate, and faecal coliform concentration in the Godavari basin. This was achieved by analysis of data taken from the Central Pollution Control Board, India (CPCB) for 21 stations around the Godavari basin over a span of five years from 2015 to 2019. The Pearson Correlation coefficient for the water quality parameters was assessed to study the relationship among the parameters. Variation in the water quality parameter is observed from the graphs for each station for respective years. It was found that conductivity and DO, temperature and pH and DO and faecal coliform are negatively correlated. It was also observed that DO has a negative correlation with pH, BOD and faecal coliform, indicating the utilization of dissolved oxygen at higher rates due to increasing degradation of organic matter by aerobic microorganisms in the river. One-way ANOVA was applied to find out significant temporal variations and it was observed that temperature, pH, and faecal coliform level had significantly changed the overdue course of time (F(4, 115) = 2.451, p < 0.05). The obtained results from the analysis indicate that the selected water quality parameters have varied significantly spatially, whereas temporally, according to the ANOVA coefficient, only temperature, pH and faecal coliform had shown significant differences during the selected timeframe. Hence, the present study highlighted the deteriorating water quality of the Godavari River over time.

1. Introduction

Water is an essential source for any life form on Earth to sustain life. Humans depend on freshwater sources for their livelihood [1,2]. There are many freshwater sources, but rivers are the major source of freshwater across India. The river system caters to irrigation, potable water, and electricity generation demands along with providing employment opportunities to many families [3,4]. Additionally, some rivers, such as the Ganga and Brahmaputra, are also considered sacred in India. There are many rivers spread across the Indian subcontinent. The seven major rivers are the Indus, Brahmaputra, Tapi, Narmada, Krishna, Mahanadi, and Godavari, and they make up the river system of India [5].
As civilization increased, dependency on freshwater from rivers also increased. The river water is becoming degraded by contaminants, which include untreated industrial effluents, sewage water, domestic waste, agricultural runoff with high loads of pesticides and fertilizers contributing to eutrophication due to nutrient enrichment resulting in deteriorating water quality, products of rituals and irrigation and changing climatic conditions [6,7]. With the decreasing water quality of rivers, India is facing the difficulty of meeting safe drinking water demands. More than 600 million people in India are experiencing a severe water crisis, and around three-fourths of households lack access to safe drinking water, according to a Niti Aayog report from June 2018 [8]. India is placed in the 120th position among 122 countries in the water quality index, as more than 70% of the freshwater sources available are contaminated [9].
River pollution is causing an unprecedented shift in the ecosystem [10,11]. Degrading water quality is affecting aquatic life and making human livelihoods cumbersome. Most of the rivers in India are extremely polluted, including the Ganga, Yamuna, Sabarmathi and Cooum [12,13,14]. So, the conservation of rivers is the need of the hour. To achieve this, many initiatives and programmes have been implemented by the Government and other nonprofit organisations wherein the water quality of the rivers is properly monitored by estimating various parameters and by taking countermeasures to contain and prevent river pollution [15,16].
In the present study, the water quality of the Godavari River was assessed to understand the variation in water quality parameters over distance and time, on which less research have been conducted. The study area is sacred and attracts pilgrims in large numbers; as a result of the pollutants generated by pilgrimage activities and the rapid and unplanned population growth along the river banks leading to inadequate sewage disposal, untreated industrial effluent discharge and inadequate and inefficient treatment facilities along the river banks have made the river quality unfit for safe drinking [17]. This has led to the importance of studying the water quality of the Godavari River. The main objective of this study is to present and analyse if there has been any significant variation in the water quality by analysing spatially and temporally the data for different stations in the Godavari basin. Additionally, the correlation between the water quality parameters was also calculated to understand its influence on river water quality.

2. Methodology

2.1. Study Area

The Godavari River, also known as one of the sacred rivers of India [18,19], has been selected for the present study. The Godavari basin, the second largest basin in India, covers the central and southern part of the Indian subcontinent with an area of 313,147 km2. it originates at Nashik, travels 1465 km and drains off at the Bay of Bengal [20]. Large, undulating plains are split by low, flat-topped hill ranges in the Godavari basin. Tropical climate characterizes the Godavari basin, and evaporation losses range from 1800 to 2440 mm in various regions of the basin [21]. The Godavari River watershed receives 1132 mm of rain on average annually, with the monsoon season accounting for over 84% of the total amount [21]. Figure 1 illustrates the percentage area covered by the Godavari River in various states.

2.2. Selection of Water Quality Parameters

Temperature, pH, DO, conductivity, BOD, nitrate, and faecal coliform concentration in the river stream are selected for this study due to data availability. Temperature is one of the water quality indicators that influence biological growth and aquatic life, dissolved oxygen levels, various chemical process, water density and stratification and species composition of the aquatic ecosystem [22,23]. pH is one such parameter that can help in understanding the suitability of rivers for aquatic life as it affects most of the biological and chemical processes of the rivers [8]. Conductivity is the ability of any substance to pass an electric current through it. Changes in conductivity levels can be used as an indicator of river pollution by examining if there is any discharge into the river [24].
One of the most important aspects of water quality is dissolved oxygen as it indicates the viability for aquatic life; when it is reduced, it indicates that there is excessive bacterial growth to degrade the available biodegradable material in the water which is using up all the available oxygen [5,25,26]. This can also tell us if the water is befitting for aquatic life. BOD represents the amount of oxygen consumed by microorganisms to decompose organic matter; more BOD indicates less favourable conditions for aquatic life [24,27]. Nitrate concentration in water indicates the presence of nutrients, which stimulates the rapid growth of the algae leading to eutrophication, which degrades the water quality [5]. Faecal coliform can be used as an indication of the discharge of sewage water into the river and also points toward the presence of other pathogenic materials in the river water [18].
As per the CPCB guidelines, the maximum permissible limit for pH value is 6.5 to 8.5, dissolved oxygen should be greater than 4 mg/L, nitrate concentration must be within 10 mg/L, Bio-chemical oxygen demand must be below 3 mg/L for safe usage, conductivity should be within 1500 µmhos/cm and the faecal coliform concentration should be less than 2500 MPN/100 mL, which will indicate whether the river water is contaminated by any sewage water [28].

2.3. Data Collection

To study the water quality of the Godavari River, the data were extracted from the openly available portal of the Central Pollution Control Board, India (https://cpcb.nic.in/nwmp-data 5 November 2022) under the NWMP Data column. Data for around 24 stations of Godavari Basin in Maharashtra, Telangana and Andhra Pradesh were used to study the variation in water quality. The stations selected with station codes (as per CPCB) are Dhalegaon (12); Mancherial (13); Polavaram (14); Ramku (1096); Raher (1209); Rajahmury U/S (1218); Latur water intake near pump house, Dhamegaon (2157); U/S of Paithan at Paithan intake pumps house at Jayakwadi (2158); D/S of Paithan at Pathegaon Bridge (2159); U/S of Aurangabad Reservoir, Kaigaon Tokka near Kaigaon Bridge (2160); Saikheda (2182); D/S of Ramanuguam (2356); Basara, Adilabad (2360); Mancherial, near railway bridge B/C of Rallavagu (2361); Ramaguam D/S, near FCI intake well, Karimnagar (2362); Godavarikhani near bathing ghat, Karimnagar (2363); Ramaguam U/S, Karimnagar (2364); Kamalpur U/S, M/S Rayons limited, Intake well, Warangal (2365); Kamalpur D/S at M/S AP Rayons Limited discharge point, Warangal (2366); Bhadrachalam U/S Bathing Ghat, Khammam (2367); Bhadrachalam D/S Bathing Ghat, Khammam (2368); Burgampahad, Khammam (2369); Rajamury U/S of Nalla channel (2370); and Rajamury D/S of Nalla channel (2371).
Data used in the study are for 5 years i.e., from 2015 to 2019, due to data availability. The yearly maximum concentration or value of temperature, pH, dissolved oxygen, conductivity, BOD, nitrate and faecal coliform was obtained for the selected stations for the respective years to analyse the change in the concentration with the flow of the river and also to study the whether there has been any change in the selected water quality parameters during the selected time frame.

2.4. Data Analysis

ANOVA (one way) and the Pearson correlation coefficient (r) were computed using self-coded software on Microsoft Excel 2019 to analyse the collected data and to determine whether there is any significant variation in the concentration of the selected parameters along the flow from western ghats to the Bay of Bengal, and also to study the change in their values within a span of five years from 2015 to 2019.
The Pearson correlation coefficient was used to study the relationship among temperature, pH, dissolved oxygen, conductivity, BOD, nitrate and faecal coliform in all the selected 24 stations for the selected timeframe of 5 years.
In order to demonstrate the difference between two or more means or components through significance tests, analysis of variance, or ANOVA, is a powerful statistical tool. One-way ANOVA was used to analyse the temporal variation in the selected parameters over 5 years i.e., from 2015 to 2019 in all 24 selected stations.

3. Results

3.1. Line Graph Showing the Variation of Water Quality Parameters

DO, temperature, pH, Nitrate, conductivity, BOD and faecal coliform values for the selected 24 stations for five years from 2015 to 2019 are represented in the form of line charts to observe the changing trend of the parameters spatially along the flow of the Godavari River for each year. The line graphs will also help in analysing the change in the parameters temporally.
From Figure 2, it can be observed that the temperature varies from 25 °C to 41 °C and is highest at U/S of Paithan at the Paithan intake pumps house at Jayakwadi (2158), D/S of Paithan at Pathegaon Bridge (2159) and U/S of Aurangabad Reservoir, Kaigaon Tokka near Kaigaon Bridge (2160) stations during 2015. During 2016, the temperature ranges from 25 °C to 35 °C along different stations. During 2017, it can be observed that the temperature ranges from 27 °C to 34 °C which indicates that there was no significant variation in the temperature with respect to distance during this year. A similar observation was made for the year 2018 whereas, during 2019, the temperature varied significantly with distance and ranged from 26 °C to 38 °C. This variation in temperature, along the selected stations, can be attributed to the differences in ambient temperature or release of effluents with temperatures more than the river’s temperature. It can also be noted that the temperature range has significantly changed over the selected five-year timeframe.
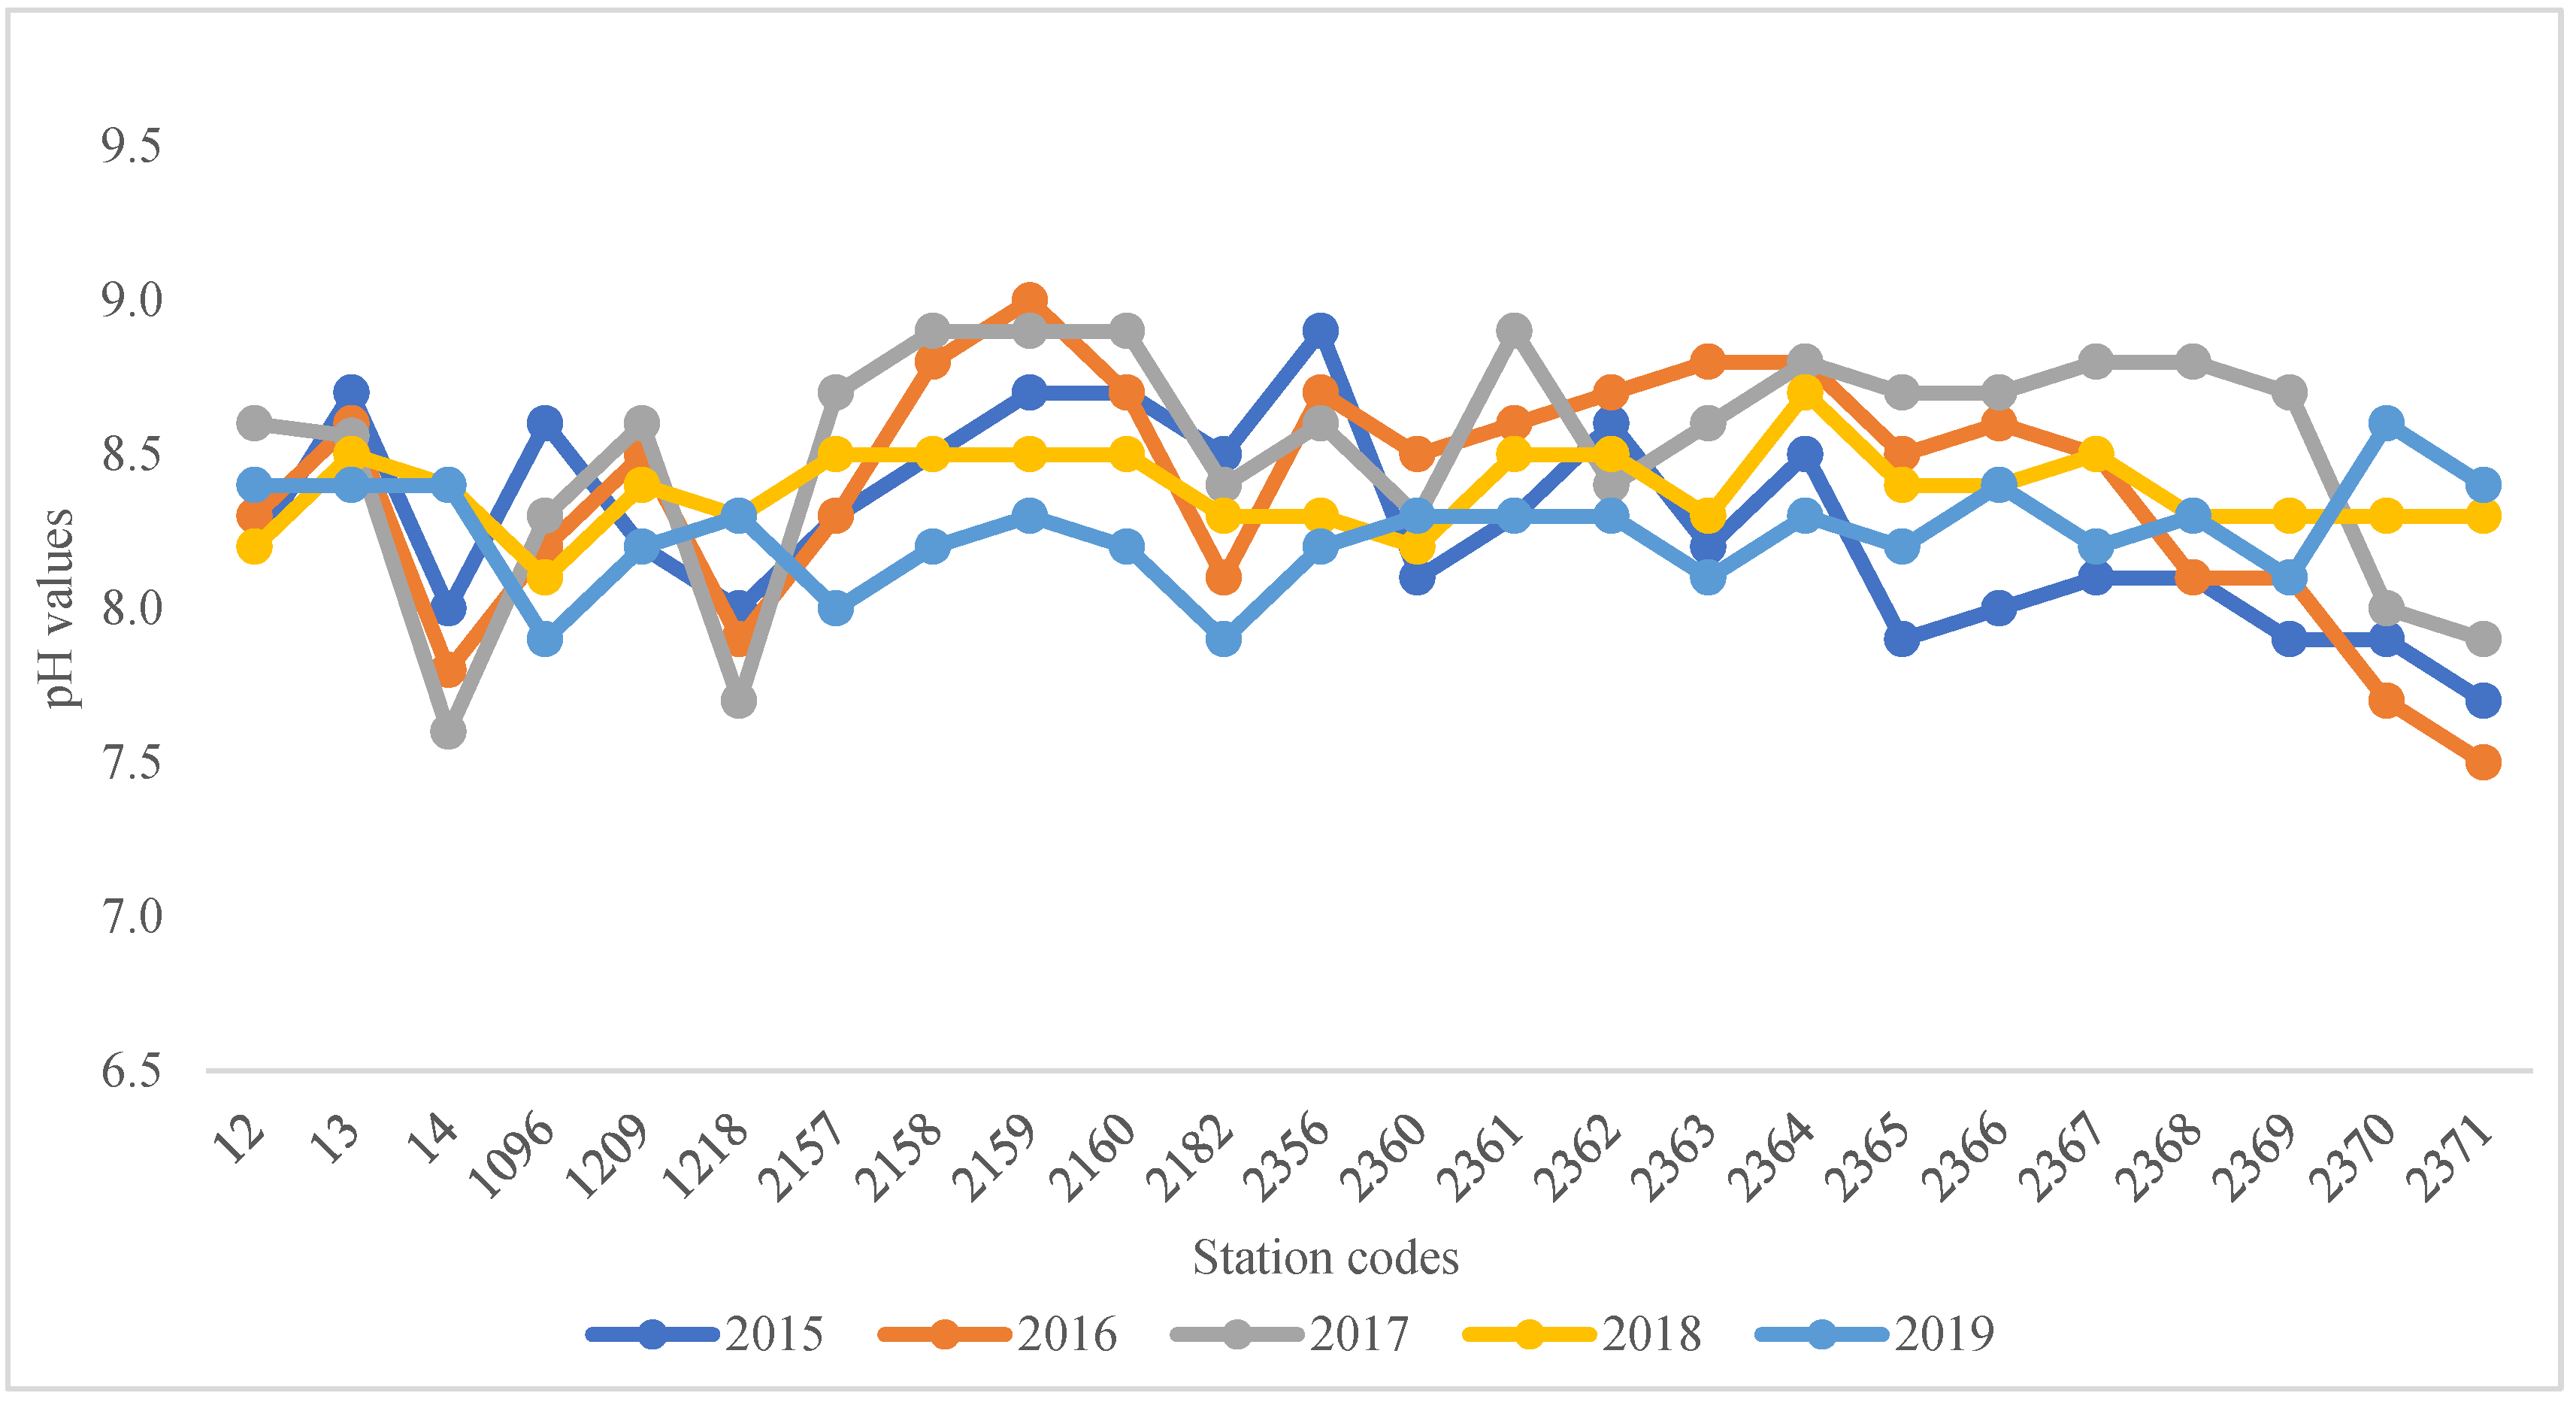
The selected stations showed a pH range between 7.5 to 9, which falls under alkaline nature (Figure 3) and some stations had a pH greater than the permissible limit, i.e., 6.5 to 8.5. The D/S of Ramanuguam (2356), D/S of Paithan at Pathegaon Bridge (2159) and Ramaguam U/S, Karimnagar (2364) show the highest pH value among the stations selected during 2015, 2016 and 2018, respectively. In the year 2017, the pH was the highest in four stations, namely, U/S of Paithan at the Paithan intake pumps house at Jayakwadi (2158), D/S of Paithan at Pathegaon Bridge (2159), Mancherial, near the railway bridge B/C of Rallavagu (2361) and U/S of Aurangabad Reservoir, Kaigaon Tokka near Kaigaon Bridge (2160) stations. Higher alkalinity can be due to the release of untreated effluents from industries and agricultural runoff into the river.
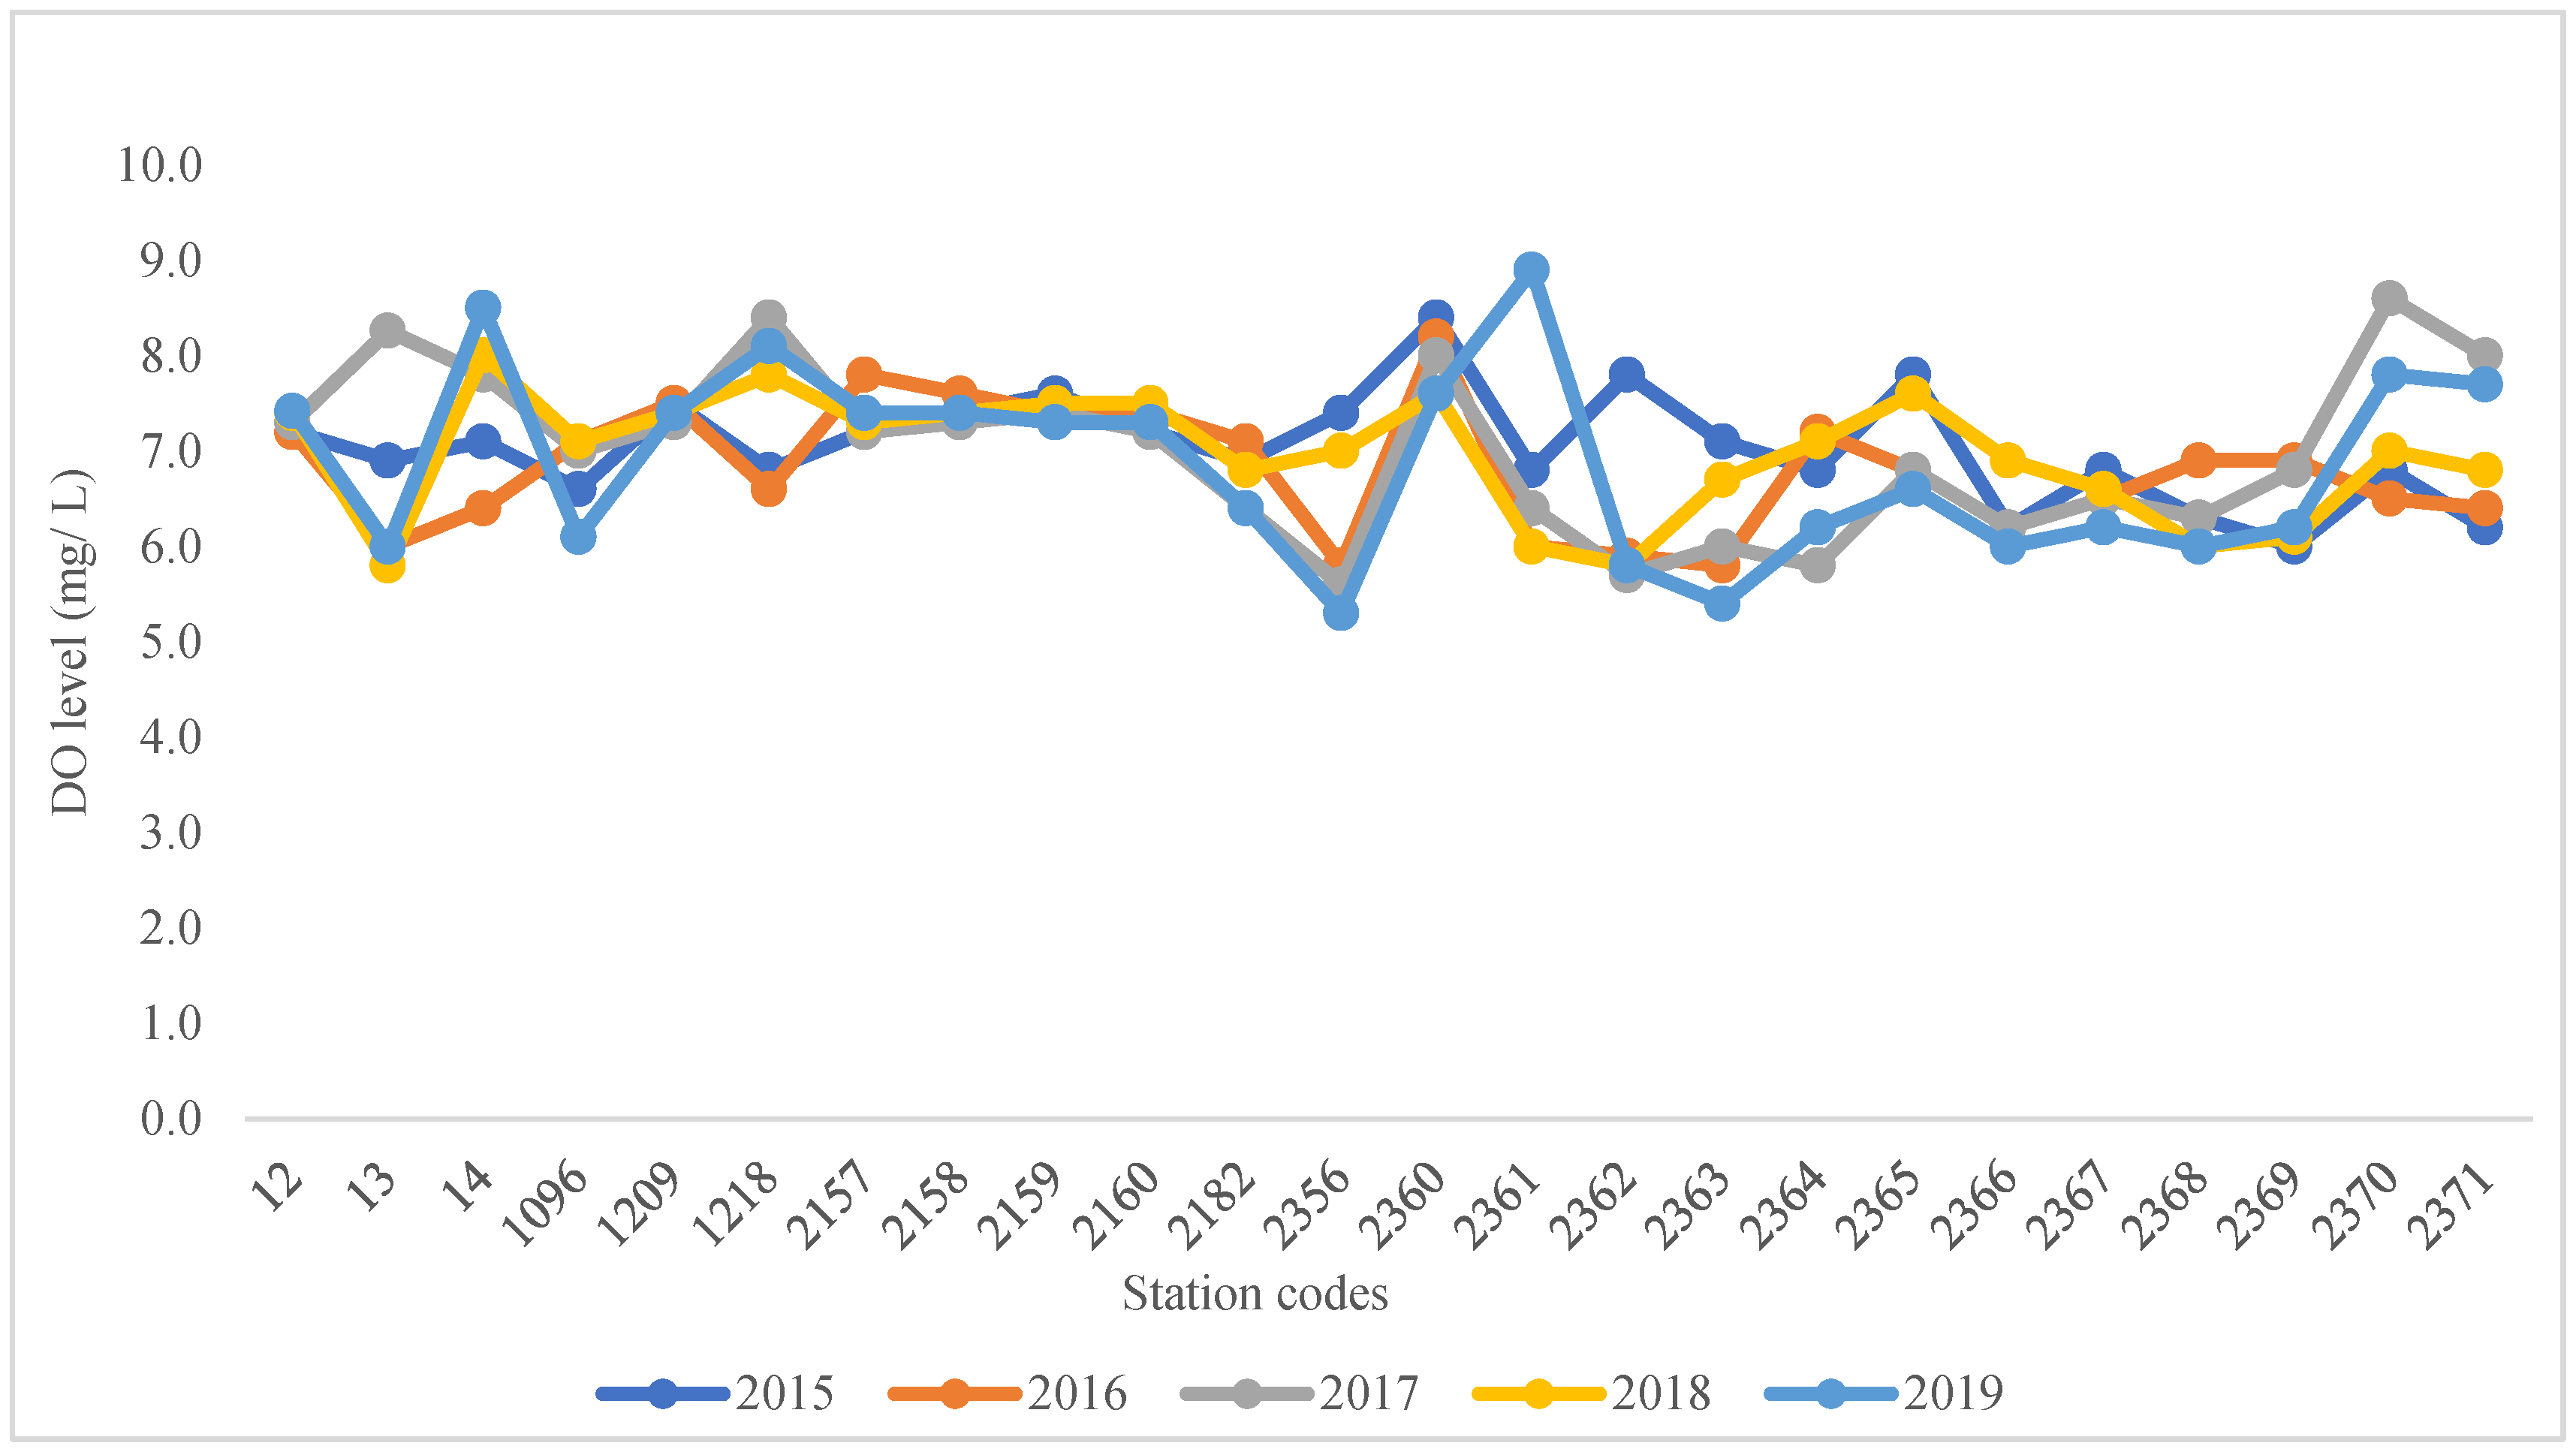
From Figure 4, it can be observed that the DO level in all the stations is greater than 4 mg/L, which fulfils the DO requirements during the chosen timeframe.
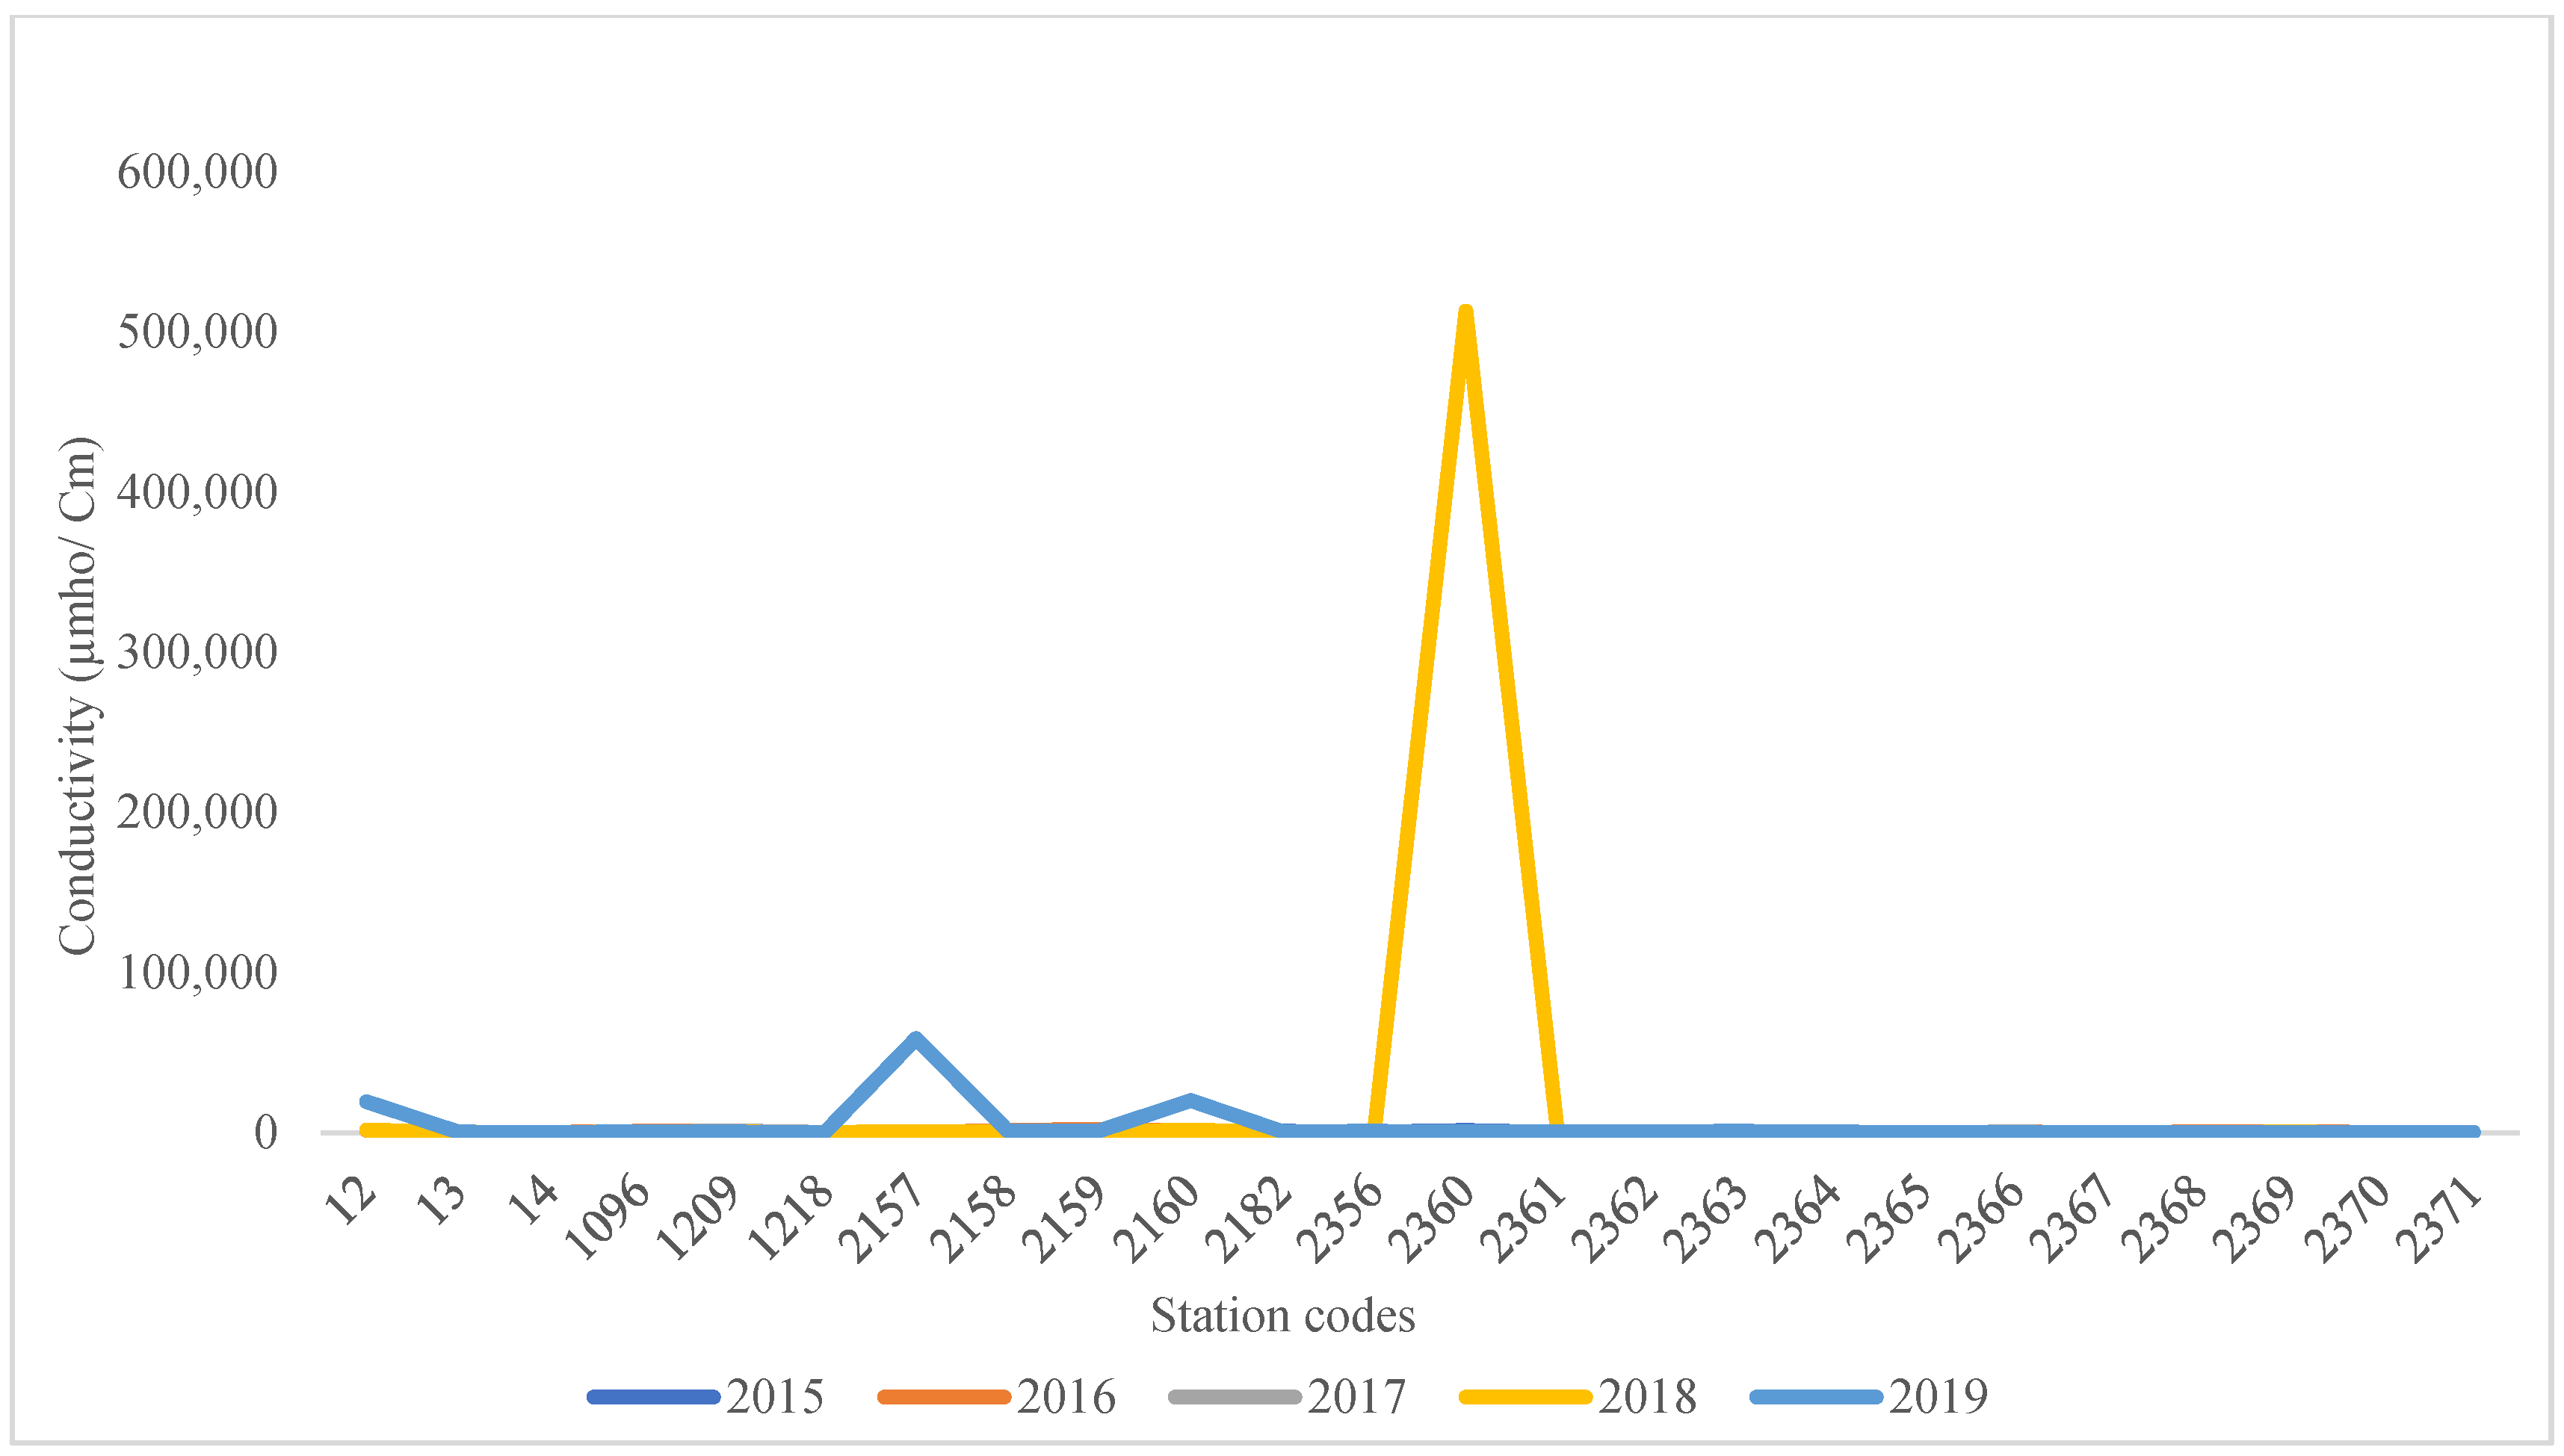
According to the CPCB guidelines, the permissible limit of conductivity for river water is 1500 µmhos/cm and it can be observed from Figure 5 that the conductivity levels were alarmingly high during 2018 and 2019, making it unfit for safe usage. High conductivity means the presence of more salts and inorganic chemicals, which may be released into the river water due to the washout of fertilizer-rich water from agricultural runoff during 2018 in Basara, Adilabad station (2360).
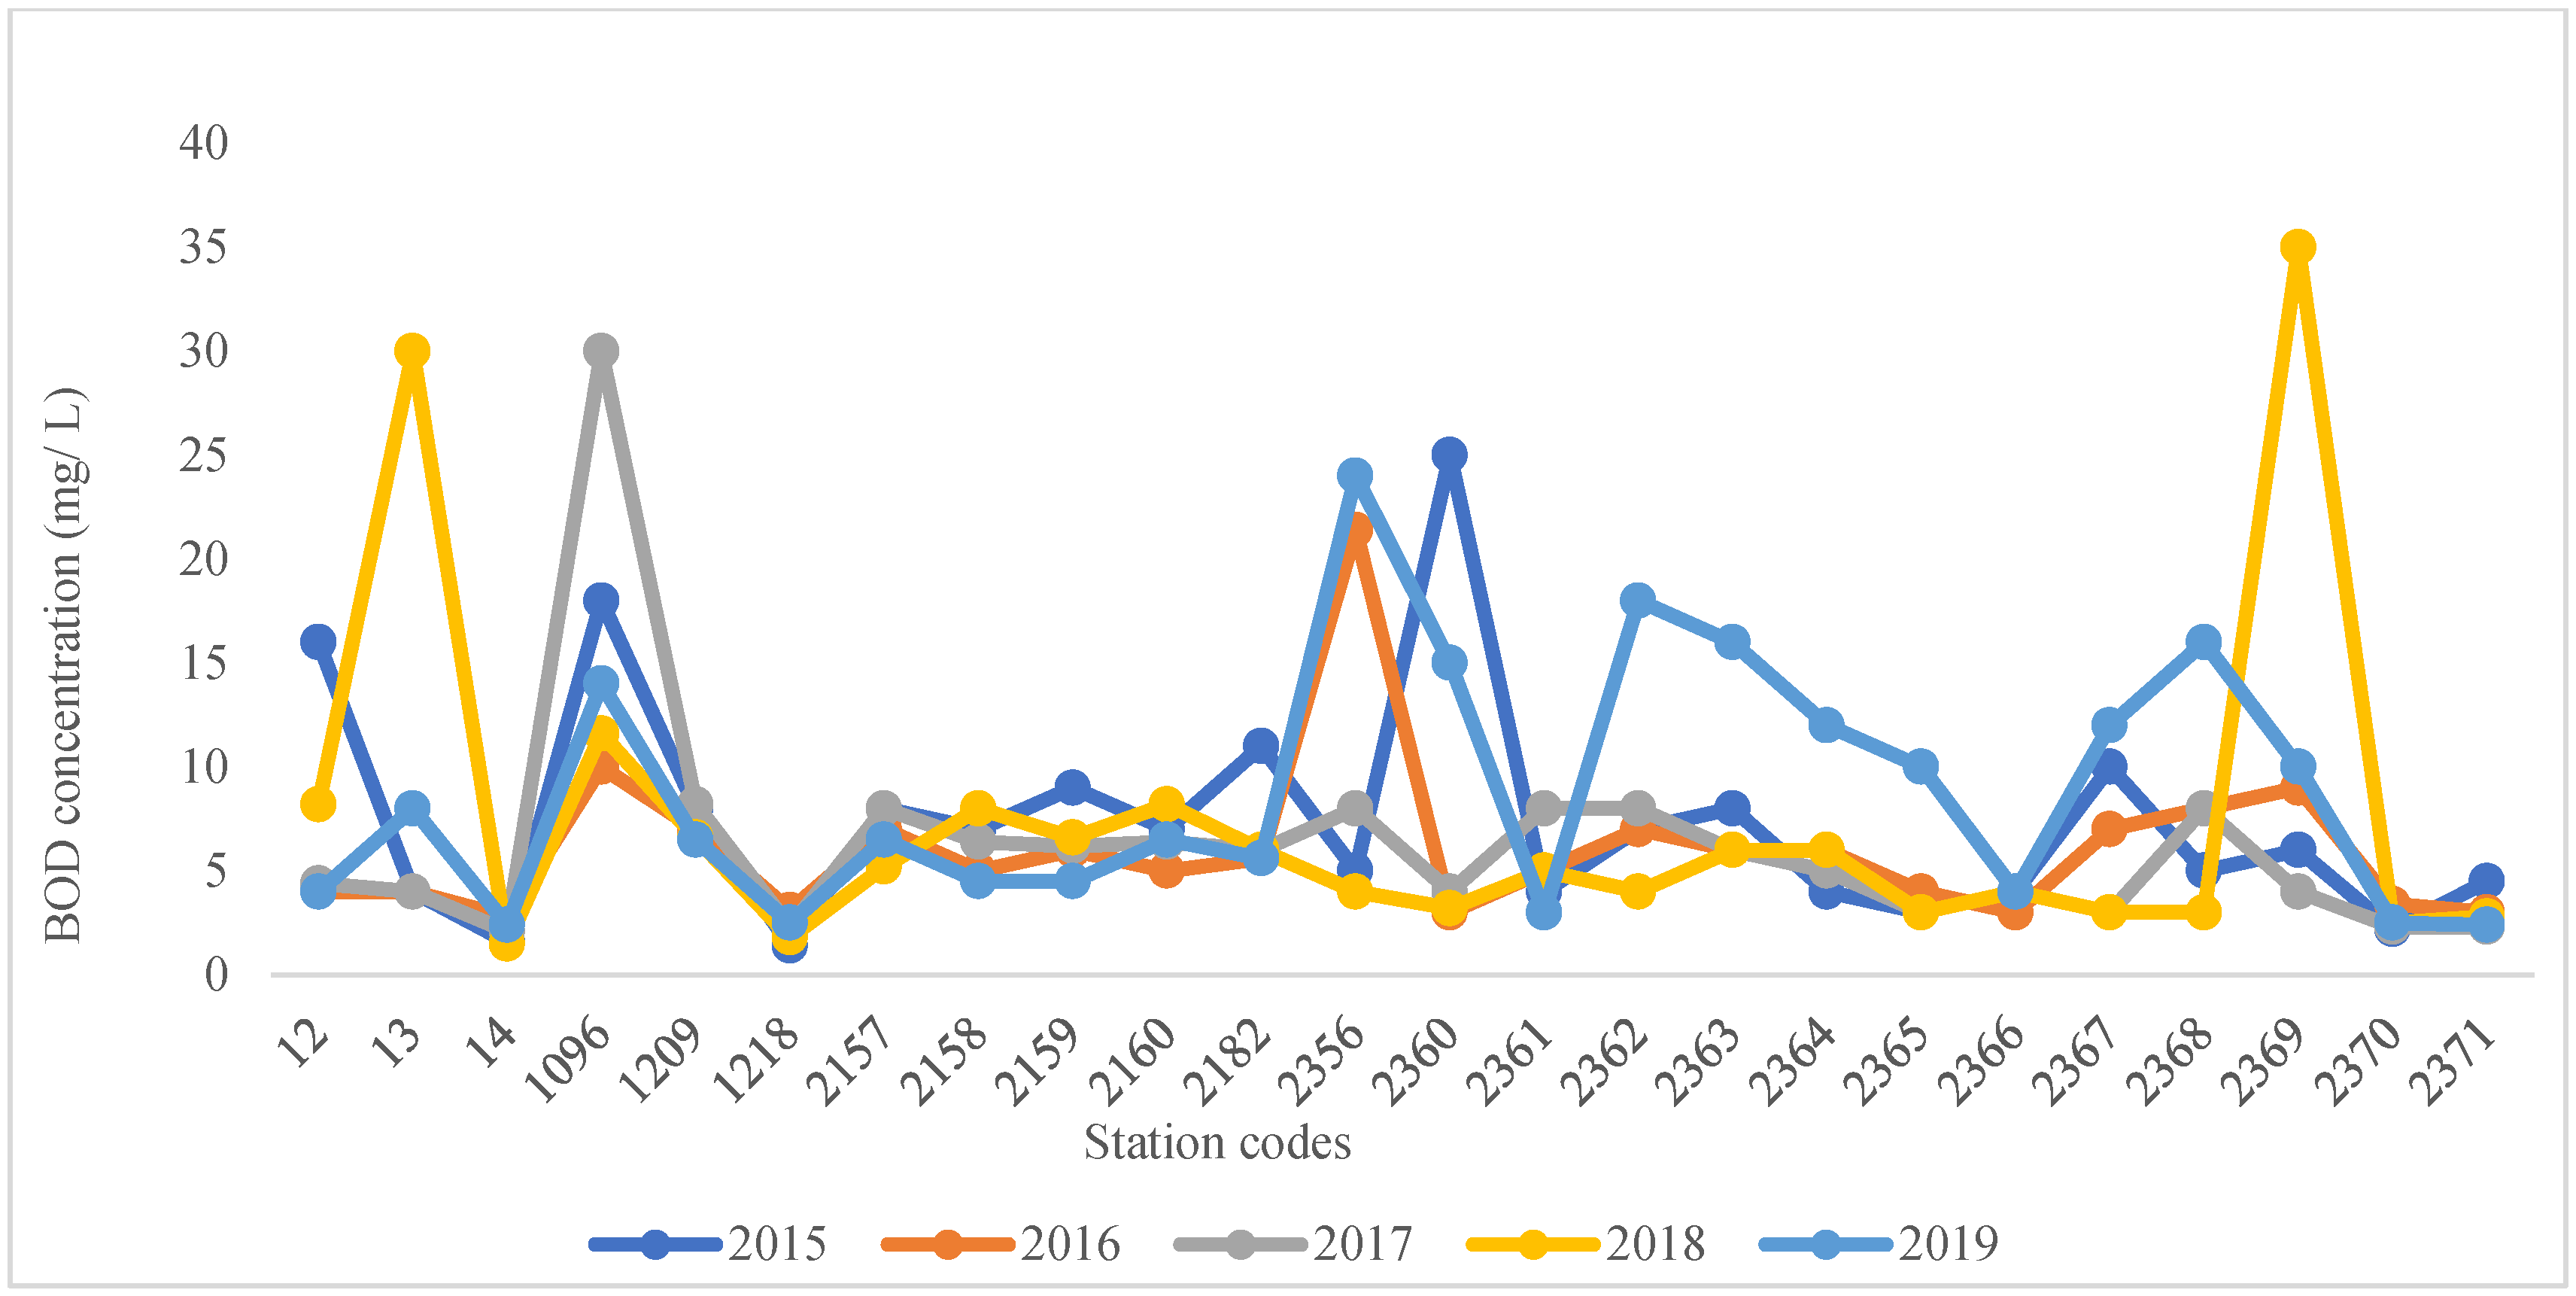
BOD levels in almost all the selected stations were greater than the acceptable limit given in the CPCB guidelines, i.e., of 3 mg/L (Figure 6) and are the highest at Kaigaon Tokka near Kaigaon Bridge (2160) station, D/S of Ramanuguam (2356), Burgampahad, Khammam (2369) and D/S of Ramanuguam (2356) during 2015, 2016, 2018 and 2019, respectively, which shows that the river water in these stations has a relatively higher amount of degradable organic matter as a pollutant.
From Figure 7, it can be observed that the nitrate levels during 2015 and 2017 were within the acceptable limit as per CPCB guidelinest’ however, in the year 2016, Burgampahad, Khammam (2369) and Bhadrachalam U/S Bathing Ghat, Khammam (2367) had shown more concentration because of the release of industrial effluents from rice and brick industries rich in nutrient content. Similarly, during 2018 and 2019, Basara, Adilabad (2360) station indicated there had been a high agricultural runoff with more fertilizers.
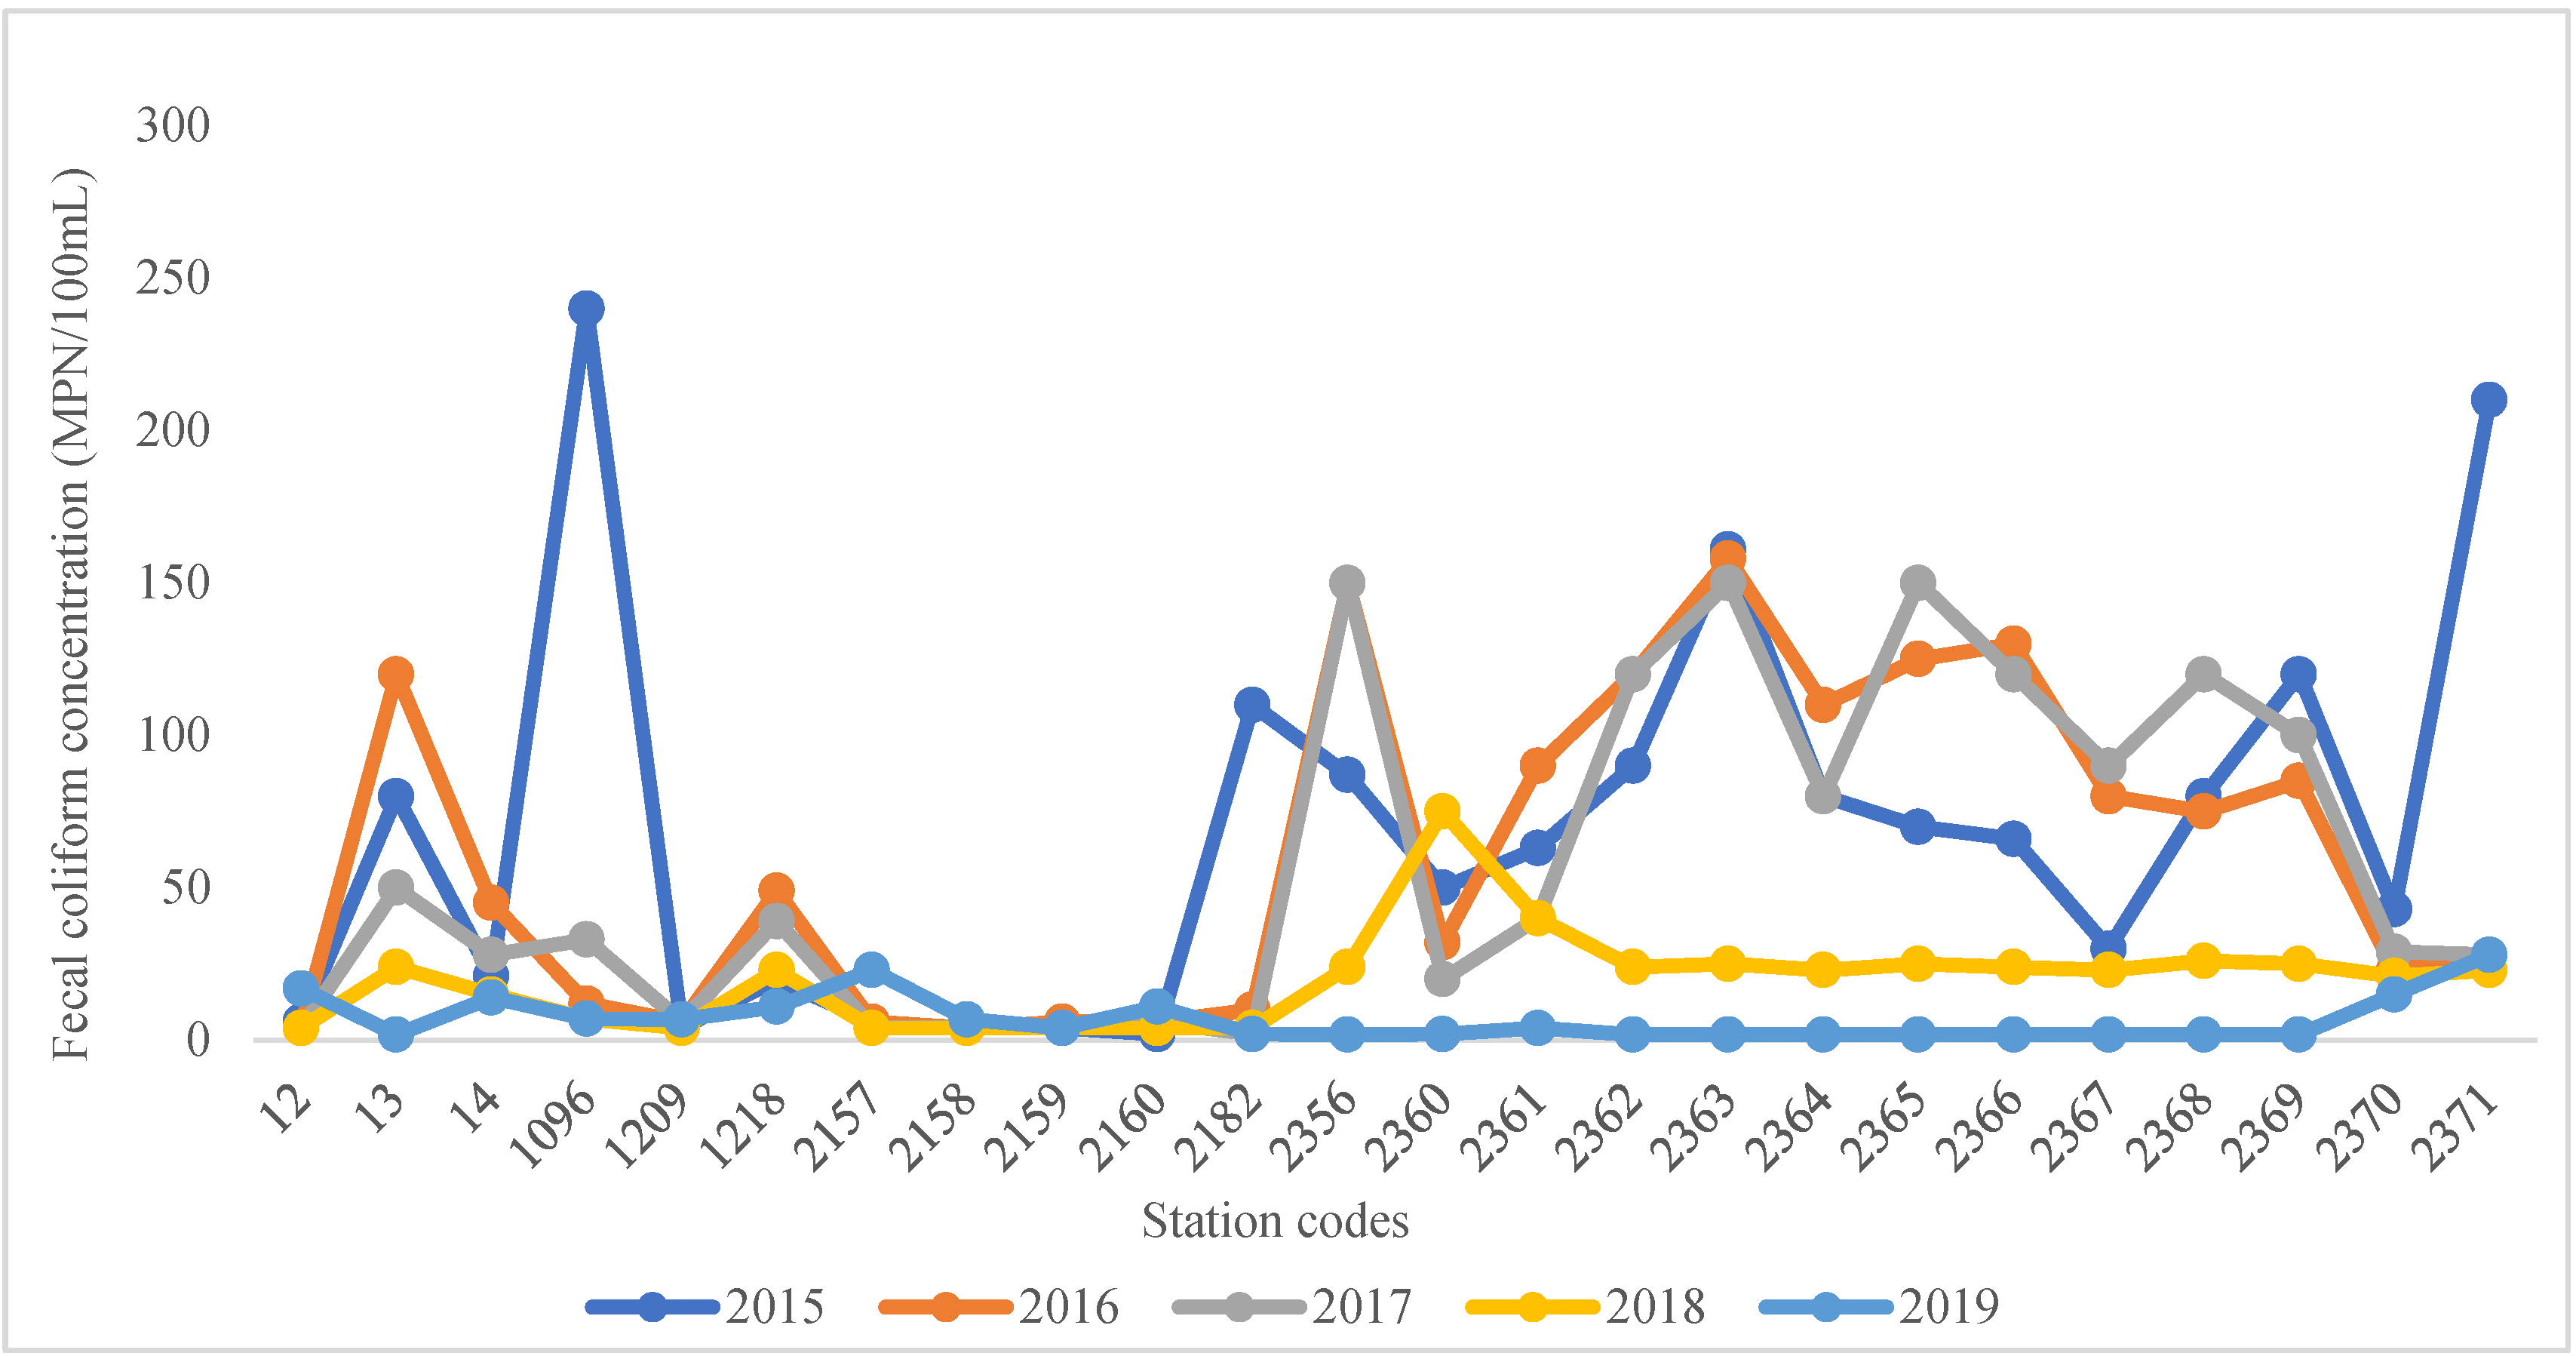
Faecal coliform in all stations from 2015 to 2019 fell within acceptable limits for safe usage of the river water as per NWMP guidelines (Figure 8). Some stations had shown higher faecal coliform concentrations which can be linked to the possibility of discharge of untreated sewage into the river water.

3.2. Correlation among Water Quality Parameters

To analyse and understand the correlation and association among the observed water quality parameters, the Pearson correlation coefficient was calculated between temperature, pH, DO, conductivity BOD, nitrate and faecal coliform concentration from 2015 to 2019 for the selected stations along Godavari River. The Pearson correlation coefficient between water quality parameters for five years is tabulated in Table 1.
It can be noted that during the year 2015, conductivity has a positive correlation with BOD and a negative correlation with DO. The BOD shows a significantly positive correlation with nitrate value. An inverse correlation is observed between temperature and pH and also between DO and faecal coliform for the year 2016. For the year 2017, it can be highlighted that dissolved oxygen shares a negative correlation with pH and faecal coliform. It has also been observed that pH and faecal coliform establish a direct correlation for the same year. Conductivity establishes a positive correlation between nitrate and faecal coliform concentration during 2018 and faecal coliform and nitrate concentration also share a significant positive relation during that year. In 2019, faecal coliform shares an influential correlation with BOD and conductivity, whereas a negative correlation can be established between DO and faecal coliform concentration and DO and BOD levels.

3.3. Analysis of Temporal Variation in the Godavari River Using One-Way ANOVA

One-way ANOVA was used to understand and find out whether there has been any significant variation in the concentration of the water quality parameters in the selected stations along the Godavari basin within five years’ timeframe i.e., from 2015 to 2019. It has been found that only temperature, pH and faecal coliform concentration had shown significant variation within the assumed time period (F(4, 115) = 2.451, p < 0.05) in all the assumed stations (Table 2).

4. Discussion

The water quality parameters for the Godavari River were analysed by using ANOVA and correlation to study its spatial and temporal variations. Line graphs were plotted to study the variation of water quality parameters spatially and it was observed that the values were significantly different in all the stations along the Godavari Basin. The temperature ranged from 25 °C to 41 °C and pH during all five years, indicating that the water was alkaline in nature. Some stations showed higher conductivity values, which may be attributed to the presence of more salts and inorganic chemicals in the river water in that station, which might have been released into the river by kiln waste from the brick industry and/or due to agricultural runoff.
Varying faecal coliform values spatially indicated that domestic wastewater is directly released into the Godavari River in some of the stations. During 2018 and 2019, the nitrate concentration in some stations was higher than permissible limit due to the release of untreated industrial effluents from rice and brick manufacturing industries and fertilizer-rich agricultural runoff. The BOD concentration in all the stations during the selected time duration was more than the acceptable limit due to the presence of an excess quantity of biodegradable contaminants from domestic discharge in the river water.
The Pearson correlation coefficient indicated that during 2015, conductivity was positively correlated with BOD, negatively correlated with DO and BOD and nitrate levels shared a significant relationship. With the increase in conductivity, salinity increases, which decreases the DO in the river and aids in the increment of the BOD level. An inverse correlation was observed during 2016 between temperature and pH, which means that with a temperature increase, the pH will decrease because with an increase in temperature a dissociation of water molecules occurs, resulting in the formation of more hydrogen ions leading to a decrease in pH value [29,30]. DO and faecal coliform also showed a negative correlation, which can be attributed to increased consumption in DO for degradation of faecal coliform by microorganisms [31,32].
For the year 2017, it can be highlighted that dissolved oxygen shares a negative correlation with pH and faecal coliform. With an elevated pH, the aquatic species will die leading to growth of decomposers which will use DO for degradation of the dead aquatic life, which will result in a decrease in the DO level. It has also been observed that pH and faecal coliform establish a positive correlation for the same year as faecal coliform can survive in alkaline water and cannot thrive in an acidic medium [33].
Conductivity established a positive correlation with nitrate and faecal coliform concentration during 2018 and faecal coliform and nitrate concentration also shared a significant positive relation during that year. In 2019, faecal coliform shared an influential correlation with BOD and conductivity, whereas a negative correlation was observed between DO and faecal coliform concentration and between the DO and BOD levels, as more BOD indicates increased use of oxygen for degradation of organic matter present in the Godavari River [34].
ANOVA coefficients revealed that only temperature, pH and fecal coliform concentration had significantly changed during the selected five-year timeframe (F(4, 115) = 2.451, p < 0.05). The F value helps us in determining whether there is any significant variance among the groups. An F value greater than Fcritical at p < 0.05 indicates that the parameter temperature, pH and fecal coliform concentration had varied significantly in the assumed timeframe.
The water quality of the study area was found appreciable as per the study conducted by Gupta et al., 2015, which successively deteriorated as time passed.
At station Basara (2360), it was asserted that the BOD, conductivity and nitrate levels were exceptionally high during five years due to a discharge from rice and brick manufacturing industries, agricultural runoff and discharge of untreated domestic wastewater indicating that the river is becoming more polluted every day [35]. The temperature over the Godavari basin varies significantly with time and distance which was also confirmed by the study carried out by [17,21].
The selected water quality parameters in the present study indicate that in Rajahmundry station (1218), the water quality is good and within the safe limits of usage. This conclusion was also derived by [18], wherein using water quality indices, his study showed that the water quality of the Godavari River at Rajahmundry and Dowlaiswaram is excellent to good quality and will continue to be in the future if the present situation persists.
Higher conductivity in the river water was detected from the analysis of the data, which can be linked to a study conducted by [36] and inferred that there is a prominent nickel and copper concentration in the Godavari River, which is above the acceptable limit in the Godavari River and its tributaries, which is unfit for domestic usage.
The urban, agricultural and industrial stations selected in this study have shown noticeably greater concentrations compared to other stations, with regards to water quality. Similar observation was made by [9] in his study, which used the Pearson correlation matrix and water quality index to analyse the water quality and concluded that the water quality deteriorates as it reaches the urban and industrial areas.

5. Conclusions

Spatial and temporal variation of water quality results of the Godavari River were analysed using the Pearson correlation coefficient and ANOVA. Around 21 stations were selected in the Godavari basin to examine the water quality parameters, namely pH, temperature, DO, conductivity, BOD, nitrate and faecal coliform concentrations for five years from 2015 to 2019. Line graphs, plotted for different parameters for all the 21 stations, show significant variation with distance along the flow of the Godavari River in the basin. The Pearson correlation coefficient was applied to check the correlation of water quality parameters, and a negative correlation was found between conductivity and DO, temperature and pH and DO and faecal coliform. It was also observed that DO shares a negative correlation with pH, BOD and faecal coliform. Temporal variation was analyzed using ANOVA for five years and it was noticed that only temperature, pH and faecal coliform concentration had significantly changed during these five years (F(4, 115) = 2.451, p < 0.05). Additionally, it can be noted that at urban and industrialized stations like Basara, Paithan and Khamam, the water quality is a bit worse when compared with other chosen stations, which can be attributed to the release of untreated industrial effluent along with agricultural and domestic discharge into the Godavari River. From this study, it can be concluded that there is a significant deterioration happening with time in river water quality. This will continue if the present industrial establishment and domestic sewage discharge without proper treatment, as there is a limit on the self-purification capacity of the river. Although in the present study variation in water quality has been studied for a span of five years, the results may be more significant if the study can be expanded to decadal change. Furthermore, this study can be narrowed down to focus on the influence of effluent from a single source in the river and deriving a prediction modelling which can help in policy-making to reduce river pollution.

Author Contributions

S.N.: drafting—data collection and preparation of the manuscript, writing—review and editing; A.P.: drafting—preparation of the manuscript, revision, and correction; R.D.: composing—reviewing and modifying; M.H.: composing—reviewing and modifying; M.A.K.: composing—reviewing and modifying, K.P.: composing—reviewing and modifying, S.A.: reviewing and modifying, R.G.: composing—reviewing and modifying, O.Q.: reviewing and modifying. All authors have read and agreed to the published version of the manuscript.

Funding

The authors would like to acknowledge the support provided by Researchers Supporting Project Number RSP2023R358, King Saud University, Riyadh, Saudi Arabia.

Data Availability Statement

No new data were created or analyzed in this study. Data sharing is not applicable to this article.

Conflicts of Interest

The authors declare no conflict of interest.

References

  1. Chaplin, M.F. Water: Its importance to life. Biochem. Mol. Biol. Educ. 2001, 29, 54–59. [Google Scholar] [CrossRef]
  2. Westall, F. The importance of water for life. Space Sci. Rev. 2018, 214, 50. [Google Scholar] [CrossRef]
  3. Bhardwaj, V.; Singh, D.S.; Singh, A.K. Water quality of the Chhoti Gandak River using principal component analysis, Ganga Plain, India. J. Earth Syst. Sci. 2010, 119, 117–127. [Google Scholar] [CrossRef]
  4. Bhat, B.; Parveen, S.; Hassan, T. Seasonal assessment of physicochemical parameters and evaluation of water quality of river Yamuna, India. Adv. Environ. Technol. 2018, 4, 41–49. [Google Scholar] [CrossRef]
  5. Omer, N.H. Water Quality—Science, Assessments and Policy. 2019. Available online: https://www.intechopen.com/books/7718 (accessed on 1 August 2023).
  6. Srivastava, P.K.; Mukherjee, S.; Gupta, M.; Singh, S.K. Characterizing Monsoonal Variation on Water Quality Index of River Mahi in India using Geographical Information System. Water Qual. Expo. Health 2011, 2, 193–203. [Google Scholar] [CrossRef]
  7. Venugopal, T.; Giridharan, L.; Jayaprakash, M.; Velmurugan, P.M. A Comprehensive Geochemical Evaluation of the Water Quality of River Adyar, India. Bull. Environ. Contam. Toxicol. 2009, 82, 211–217. [Google Scholar] [CrossRef]
  8. Khound, N.J.; Bhattacharyya, K.G. Assessment of water quality in and around Jia-Bharali river basin, North Brahmaputra Plain, India, using multivariate statistical technique. Appl. Water Sci. 2018, 8, 221. [Google Scholar] [CrossRef]
  9. Kharake, A.C.; Raut, V.S. An assessment of water quality index of Godavari river water in Nashik city, Maharashtra. Appl. Water Sci. 2021, 11, 101. [Google Scholar] [CrossRef]
  10. Bowes, M.J.; Read, D.S.; Joshi, H.; Sinha, R.; Ansari, A.; Hazra, M.; Simon, M.; Vishwakarma, R.; Armstrong, L.K.; Nicholls, D.J.E.; et al. Nutrient and microbial water quality of the upper Ganga River, India: Identification of pollution sources. Environ. Monit. Assess. 2020, 192, 533. [Google Scholar] [CrossRef]
  11. Lokhande, S.; Tare, V. Spatio-temporal trends in the flow and water quality: Response of river Yamuna to urbanization. Environ. Monit. Assess. 2021, 193, 117. [Google Scholar] [CrossRef]
  12. Kazmi, A.A.; Hansen, I.S. Numerical models in water quality management: A case study for the Yamuna river (India). Water Sci. Technol. 1997, 36, 193–200. [Google Scholar] [CrossRef]
  13. Khan, M.Y.A.; Gani, K.M.; Chakrapani, G.J. Assessment of surface water quality and its spatial variation. A case study of Ramganga River, Ganga Basin, India. Arab. J. Geosci. 2016, 9, 28. [Google Scholar] [CrossRef]
  14. Sharma, M.; Kansal, A.; Jain, S.; Sharma, P. Application of Multivariate Statistical Techniques in Determining the Spatial Temporal Water Quality Variation of Ganga and Yamuna Rivers Present in Uttarakhand State, India. Water Qual. Expo. Health 2015, 7, 567–581. [Google Scholar] [CrossRef]
  15. Singh, K.P.; Malik, A.; Mohan, D.; Sinha, S. Multivariate statistical techniques for the evaluation of spatial and temporal variations in water quality of Gomti River (India)—A case study. Water Res. 2004, 38, 3980–3992. [Google Scholar] [CrossRef]
  16. Solaraj, G.; Dhanakumar, S.; Murthy, K.R.; Mohanraj, R. Water quality in select regions of Cauvery Delta River basin, southern India, with emphasis on monsoonal variation. Environ. Monit. Assess. 2010, 166, 435–444. [Google Scholar] [CrossRef]
  17. Chavan, A.D.; Sharma, M.P.; Bhargava, R. Water Quality Assessment of the Godavari River. Hydro Nepal: J. Water Energy Environ. 2009, 5, 31–34. [Google Scholar] [CrossRef]
  18. Akkaraboyina, M.K.; Raju, P.S. A Comparative study of water quality indices of River Godavari. Int. J. Eng. Res. Dev. 2012, 2, 29–34. [Google Scholar]
  19. Amrith, S. Unruly Waters: How Mountain Rivers and Monsoons Have Shaped South Asia’s History; Penguin: London, UK, 2018. [Google Scholar]
  20. Biksham, G.; Subramanian, V. Sediment transport of the Godavari River basin and its controlling factors. J. Hydrol. 1988, 101, 275–290. [Google Scholar] [CrossRef]
  21. Jhajharia, D.; Dinpashoh, Y.; Kahya, E.; Choudhary, R.R.; Singh, V.P. Trends in temperature over Godavari River basin in Southern Peninsular India. Int. J. Clim. 2014, 34, 1369–1384. [Google Scholar] [CrossRef]
  22. Steffen, W.; Jäger, J.; Carson, D.J.; Bradshaw, C. Challenges of a Changing Earth: Proceedings of the Global Change Open Science Conference, Amsterdam, The Netherlands, 10–13 July 2001; Springer: Berlin/Heidelberg, Germany, 2002. [Google Scholar]
  23. Noori, R.; Bateni, S.M.; Saari, M.; Almazroui, M.; Haghighi, A.T. Strong Warming Rates in the Surface and Bottom Layers of a Boreal Lake: Results From Approximately Six Decades of Measurements (1964–2020). Earth Space Sci. 2022, 9, e2021EA001973. [Google Scholar] [CrossRef]
  24. Epa, U. United States environmental protection agency. Qual. Assur. Guid. Doc. -Model Qual. Assur. Proj. Plan PM Ambient Air 2001, 2, 12. [Google Scholar]
  25. Mandal, P.; Upadhyay, R.; Hasan, A. Seasonal and spatial variation of Yamuna River water quality in Delhi, India. Environ. Monit. Assess. 2010, 170, 661–670. [Google Scholar] [CrossRef] [PubMed]
  26. Matta, G.; Kumar, A.; Nayak, A.; Kumar, P.; Kumar, A.; Tiwari, A.K. Determination of water quality of Ganga River System in Himalayan region, referencing indexing techniques. Arab. J. Geosci. 2020, 13, 1027. [Google Scholar] [CrossRef]
  27. Noori, R.; Karbassi, A.; Ashrafi, K.; Ardestani, M.; Mehrdadi, N. Development and application of reduced-order neural network model based on proper orthogonal decomposition for BOD5 monitoring: Active and online prediction. Environ. Prog. Sustain. Energy 2013, 32, 120–127. [Google Scholar] [CrossRef]
  28. Sharma, P.; Meher, P.K.; Kumar, A.; Gautam, Y.P.; Mishra, K.P. Changes in water quality index of Ganges river at different locations in Allahabad. Sustain. Water Qual. Ecol. 2014, 3, 67–76. [Google Scholar] [CrossRef]
  29. Dung, D.Q.; Pham, D.A. Influence of water temperature and salinity on pH during dry season in lower Dong Nai River system, Vietnam. GeoScience Eng. 2015, 61, 29. [Google Scholar] [CrossRef]
  30. Li, H.; Liu, L.; Li, M.; Zhang, X. Effects of pH, Temperature, Dissolved Oxygen, and Flow Rate on Phosphorus Release Processes at the Sediment and Water Interface in Storm Sewer. J. Anal. Methods Chem. 2013, 2013, 104316. [Google Scholar] [CrossRef]
  31. Haritash, A.K.; Gaur, S.; Garg, S. Assessment of water quality and suitability analysis of River Ganga in Rishikesh, India. Appl. Water Sci. 2016, 6, 383–392. [Google Scholar] [CrossRef]
  32. Pote, S.E.; Singal, S.K.; Srivastava, D.K. Assessment of surface water quality of Godavari River at Aurangabad. Asian J. Water Environ. Pollut. 2012, 9, 117–122. [Google Scholar]
  33. Seo, M.; Lee, H.; Kim, Y. Relationship between Coliform Bacteria and Water Quality Factors at Weir Stations in the Nakdong River, South Korea. Water 2019, 11, 1171. [Google Scholar] [CrossRef]
  34. Fan, C.; Wang, W.-S. Influence of Biological Oxygen Demand Degradation Patterns on Water-Quality Modeling for Rivers Running through Urban Areas. Ann. N. Y. Acad. Sci. 2008, 1140, 78–85. [Google Scholar] [CrossRef]
  35. Patil, S.; Ghorade, I. Assessment of physicochemical characteristics of Godavari river water at Trimbakeshwar and Kopargaon, Maharashtra (India). Environment 2013, 3, 149–152. [Google Scholar] [CrossRef]
  36. Hussain, J.; Husain, I.; Arif, M.; Gupta, N. Studies on heavy metal contamination in Godavari river basin. Appl. Water Sci. 2017, 7, 4539–4548. [Google Scholar] [CrossRef]
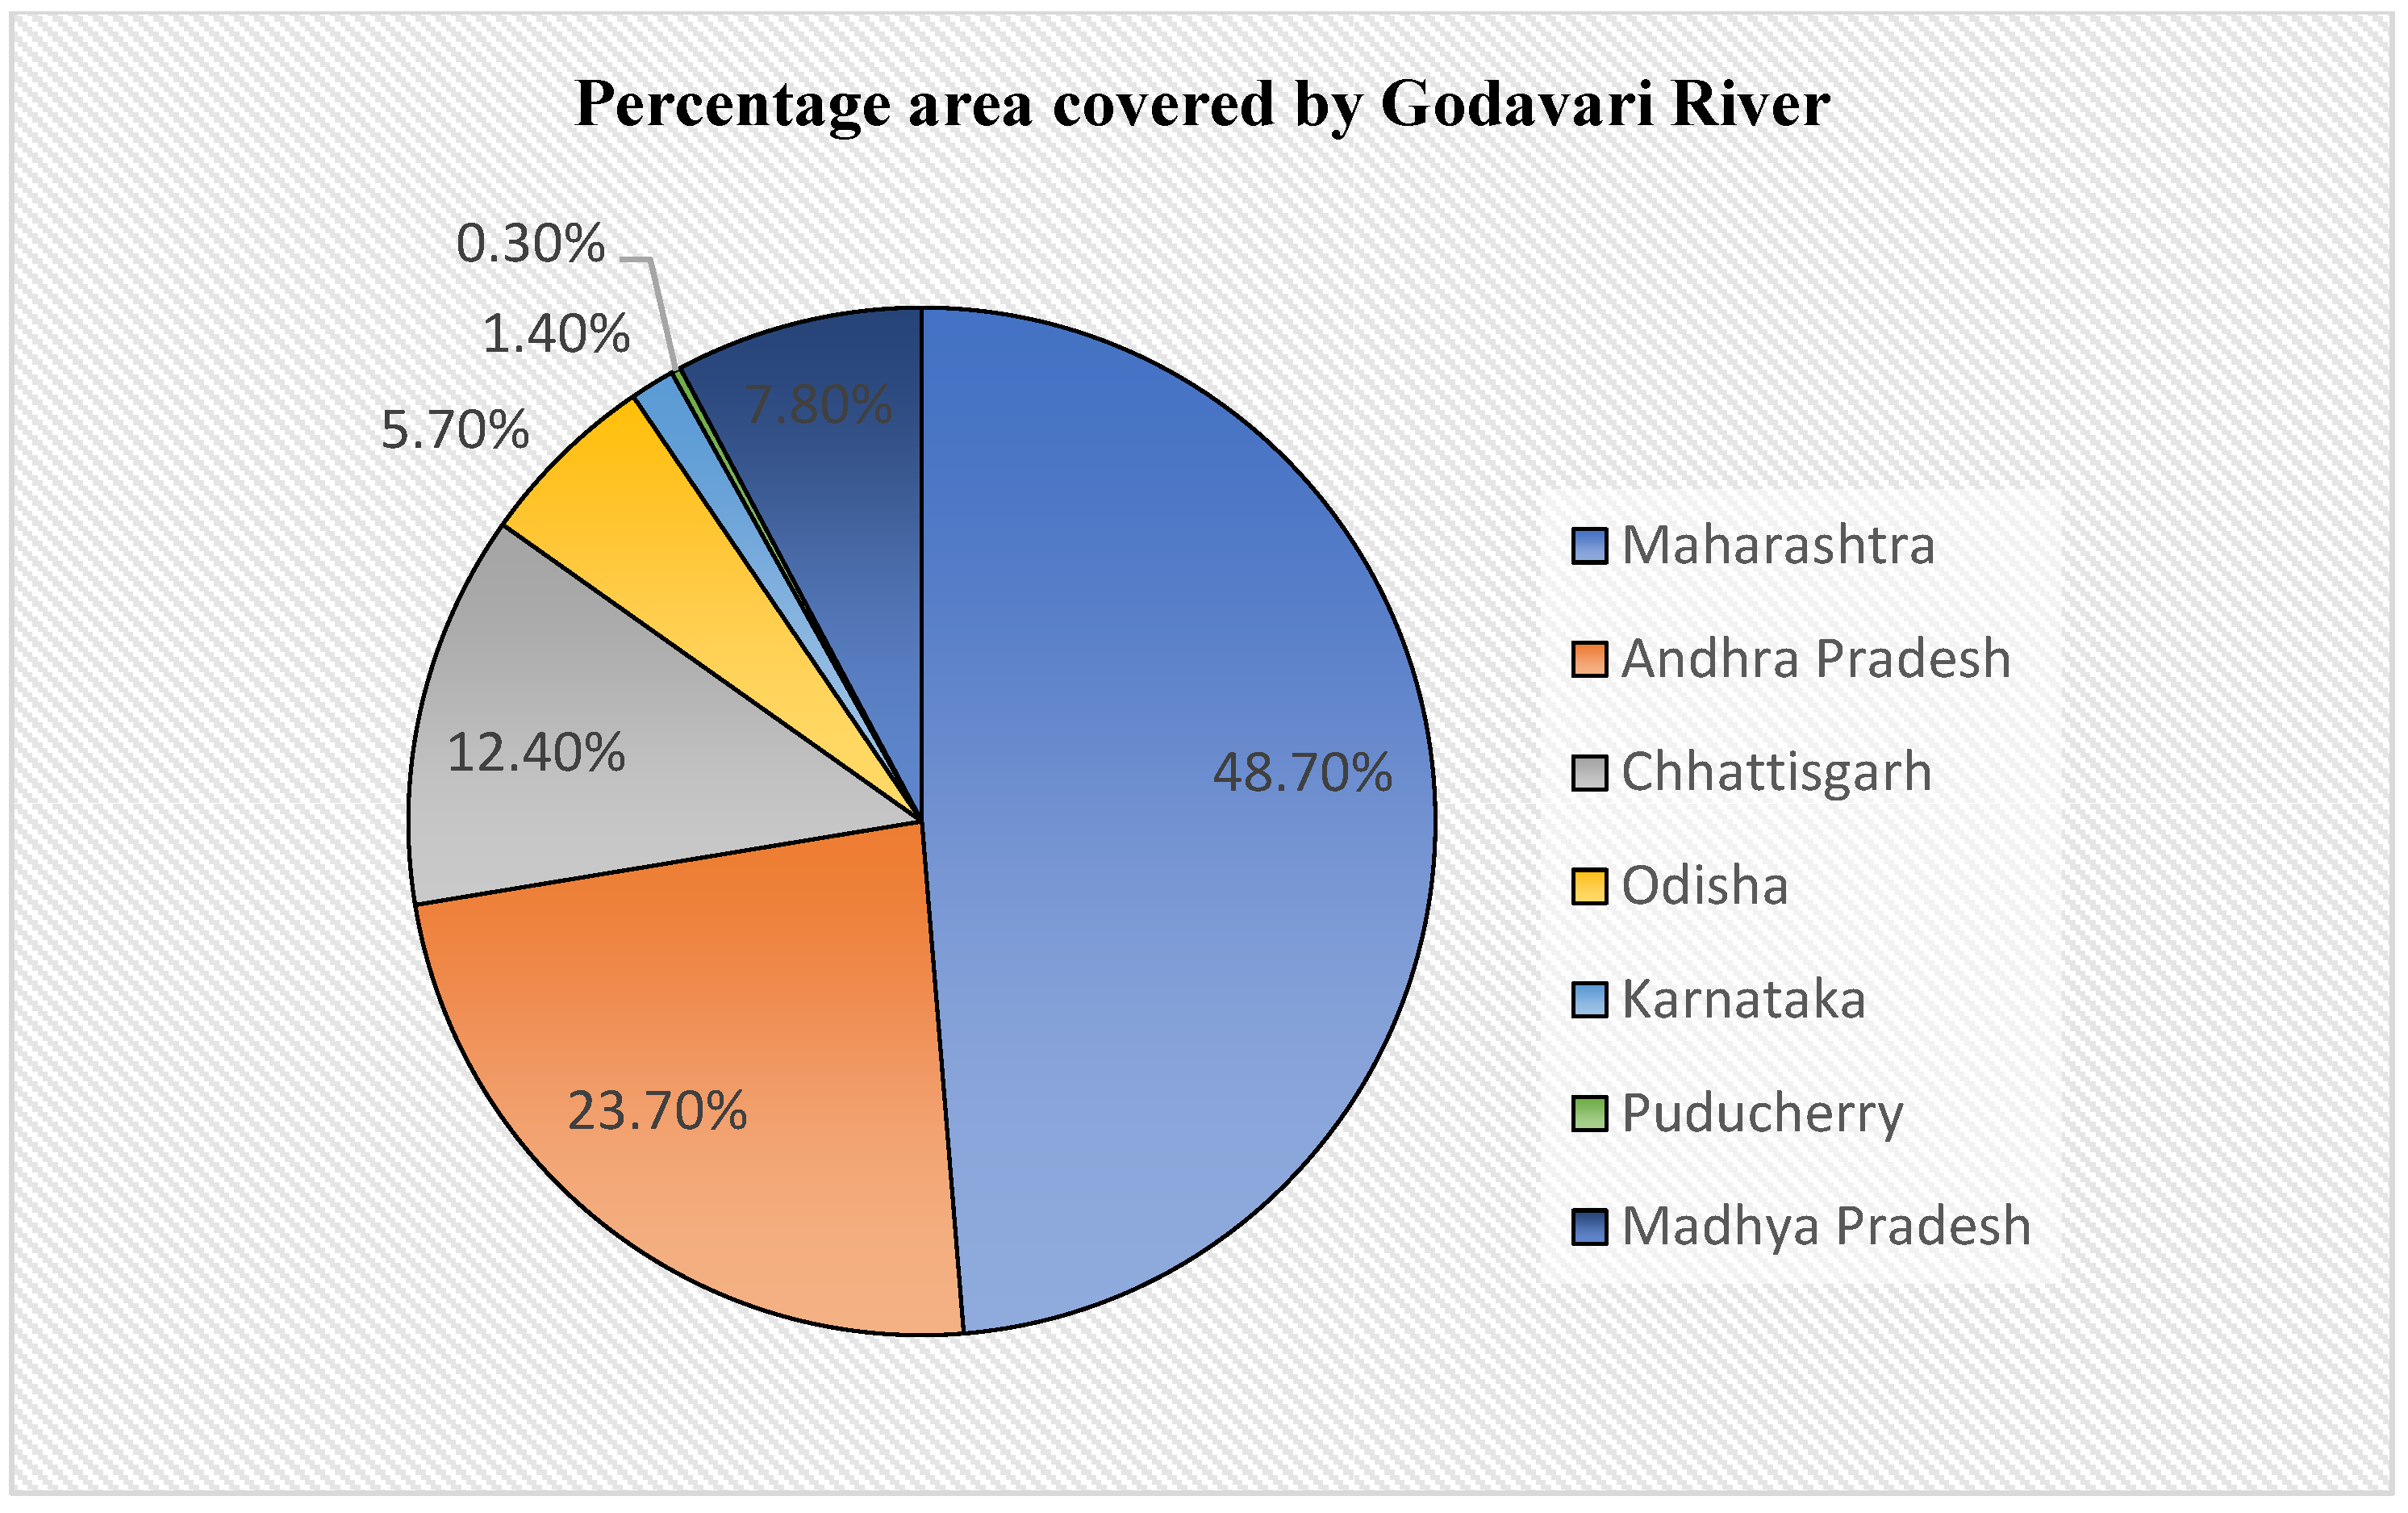
Figure 1. Percentage area covered by Godavari River in various states of Central and Southern India [8].
Water 15 03076 g001
Figure 2. Variation of temperature along the selected stations in Godavari Basin during the selected five years timeframe.
Water 15 03076 g002
Figure 3. Variation of pH along the selected stations in Godavari Basin during the selected five years timeframe.
Water 15 03076 g003
Figure 4. Variation of dissolved oxygen levels along the selected stations in Godavari Basin during the selected five years timeframe.
Water 15 03076 g004
Figure 5. Variation of conductivity levels along the selected stations in Godavari Basin during the selected five-year timeframe.
Water 15 03076 g005
Figure 6. Variation of BOD levels along the selected stations in Godavari Basin during the selected five-year timeframe.
Water 15 03076 g006
Figure 7. Variation of nitrate concentration along the selected stations in Godavari Basin during the selected five-year timeframe.
Water 15 03076 g007
Figure 8. Variation of Faecal coliform along the selected stations in Godavari Basin during the selected five-year timeframe.
Water 15 03076 g008
Table 1. Pearson Correlation coefficient (r) among the water quality parameters for all the selected stations for five years.
YearParametersTemperatureDOpHConductivityBODNitrateFaecal Coliform
2015Temperature1
DO0.1231
pH0.1610.3351
Conductivity0.002−0.556 *0.2731
BOD−0.2130.4020.1680.794 *1
Nitrate0.3410.0680.1980.3420.536 *1
Faecal Coliform−0.424−0.420−0.073−0.1920.1230.3801
2016Temperature1
DO−0.2981
pH−0.556 *0.0581
Conductivity−0.4650.4160.4731
BOD0.092−0.1980.2480.0651
Nitrate0.082−0.201−0.032−0.2660.1911
Faecal Coliform0−0.731 *0.333−0.4180.2940.3501
2017Temperature1
DO−0.0751
pH−0.108−0.549 *1
Conductivity0.173−0.1700.1141
BOD0.176−0.2210.1180.1451
Nitrate−0.106−0.3800.082−0.046−0.1631
Faecal Coliform0.094−0.638 *0.186−0.117−0.0730.664 *1
2018Temperature1
DO0.2231
pH−0.333−0.1231
Conductivity−0.0750.211−0.2911
BOD0.130−0.442−0.006−0.1071
Nitrate−0.2700.188−0.4120.845 *−0.2081
Faecal Coliform−0.460−0.210−0.1550.751 *−0.0600.713 *1
2019Temperature1
DO0.0781
pH0.0010.3461
Conductivity0.4030.162−0.2671
BOD−0.170−0.748 *−0.318−0.1431
Nitrate0.110−0.112−0.226−0.0110.4371
Faecal Coliform0.466−0.563 *0.2030.536*0.540 *−0.0981
Note: * Significant at p ≤ 0.01.
Table 2. ANOVA table for water quality parameters with respect to assumed timeframes.
Water Quality ParameterSource of VariationSSdfMSF
Temperature (°C)Between Groups263.733465.933256.804544 *
Within Groups1114.3031159.689591
Total1378.036119
pHBetween Groups1.0938240.2734553.08538 *
Within Groups10.192371150.088629
Total11.28619119
Dissolved Oxygen (mg/L)Between Groups0.91491340.2287280.393193
Within Groups66.897831150.58172
Total67.81275119
Conductivity (µmho/Cm)Between Groups8.27 × 100942.07 × 1090.931765
Within Groups2.55 × 10111152.22 × 109
Total2.63 × 1011119
BOD (mg/L)Between Groups112.7438428.185960.794579
Within Groups4079.37211535.4728
Total4192.116119
Nitrate (mg/L)Between Groups88.37806422.094522.3165
Within Groups1096.8571159.537886
Total1185.235119
Faecal Coliform (MPN/100 mL)Between Groups72,772.34418193.098.977362 *
Within Groups233,053.41152026.551
Total305,825.8119
Note: * Significant at p ≤ 0.05.
Disclaimer/Publisher’s Note: The statements, opinions and data contained in all publications are solely those of the individual author(s) and contributor(s) and not of MDPI and/or the editor(s). MDPI and/or the editor(s) disclaim responsibility for any injury to people or property resulting from any ideas, methods, instructions or products referred to in the content.