1. Introduction
In recent years, climate change in the European region has been characterized by an increase in the frequency of extreme events such as catastrophic floods and droughts in atmosphere, soil, and water systems, which has affected significant amounts of the population in Europe. The frequency of very severe floods increased during the 1985–2016 period, but with high interannual variability [
1,
2]. Floods increased in northwestern and central parts of Europe due to increased autumn and winter rains but decreased in northeastern Europe due to decreased snow cover and rapid snowmelt. Regular floods practically disappeared in southern Europe due to reduced precipitation and increased evapotranspiration [
3,
4].
In eastern Europe, the flood frequency has been decreasing since the 1970s [
3,
5,
6]. Westwards, in Poland, a significant decrease in winter flow has been observed in many rivers accompanied by a delayed increase in the spring thaw in the 1950s and 1960s [
7]. The maximum historical discharges were recorded in the Ukrainian plain river basins from about 1947 to the river transformation period in the 1980s, after which the maximal streamflow decreased [
8]. The most frequent flooding in Belarus was observed in the 1950s and 1960s [
9]. In recent decades, in some rivers in central eastern Europe, spring floods did not occur at all.
Climate change has also affected the timing of floods [
10,
11]. These changes include later winter floods in the North Sea Basin and parts of the Mediterranean coast due to later winter storms, and earlier winter floods in western Europe due to earlier soil moisture maxima. In northeastern Europe, spring floods (if any) occur earlier because of the earlier snowmelt.
Forecasts [
12] anticipate more catastrophic floods in most regions of Europe, with the largest increases in central and central-eastern Europe. However, at the same time, small floods are expected to decrease in northern Europe due to reduced snow accumulation. Flooding of small rivers in northern Europe could increase due to increased precipitation, even though snowmelt-related floods in large rivers are likely to decrease [
13]. For numerous river basins in the north and south of western Europe, extreme floods are projected to increase, though with a decrease in the overall flood frequency [
14]. Similar decreasing trends have been detected for some regions of southern Europe due to decreasing precipitation [
15].
The hydrological forecast for the European part of Russia [
16] shows, for the northern territories, an increase in precipitation and temperatures, which will cause small changes in the annual runoff but may (and this is already happening) cause a significant restructuring of the annual runoff distribution. For the flat territories of the southern part of eastern Europe, an increase in temperatures and a decrease in precipitation are expected.
Together with the flood risk growth for most of Europe, an increase in meteorological drought frequency has been detected. This increase has been observed since 1950 in southern Europe and most of central Europe while, in many parts of northern Europe, the drought frequency decreased [
17]. Statistically significant increases in the SPI (Standardized Precipitation Index) and SPEI (Standardized Precipitation and Evaporation Index) during the cold season, reflecting precipitation increases, were found in Estonia, Latvia, Lithuania, northern Belarus, and northern Poland. The summer season is characterized by an SPEI increase in the north, while its clear decrease, reflecting a drying trend, is typical for Czechia, Slovakia, Hungary, Romania, Moldova, and southern Poland [
18]. By the middle of the 21st century (2041–2070 relative to 1981–2010), meteorological droughts are expected to occur more frequently over most of Europe, and especially in southern Europe. A decreased number of droughts is projected only for a few parts of northern Europe [
19].
For 1950–2015, runoff trends were negative in southern Europe and over much of central Europe, but minimal flows increased in northern Europe [
20,
21]. Increasingly severe hydrological droughts are predicted for most European regions, except for central-east and northeast Europe [
22]. In the rivers of the central part of the East European Plain (the Volga, Oka, and Don), long phases (10–15 years or more) of increased/decreased annual and seasonal runoff have occurred, as well as differences in the frequencies of extremely low flow conditions from the late 19th century to 2020 [
6].
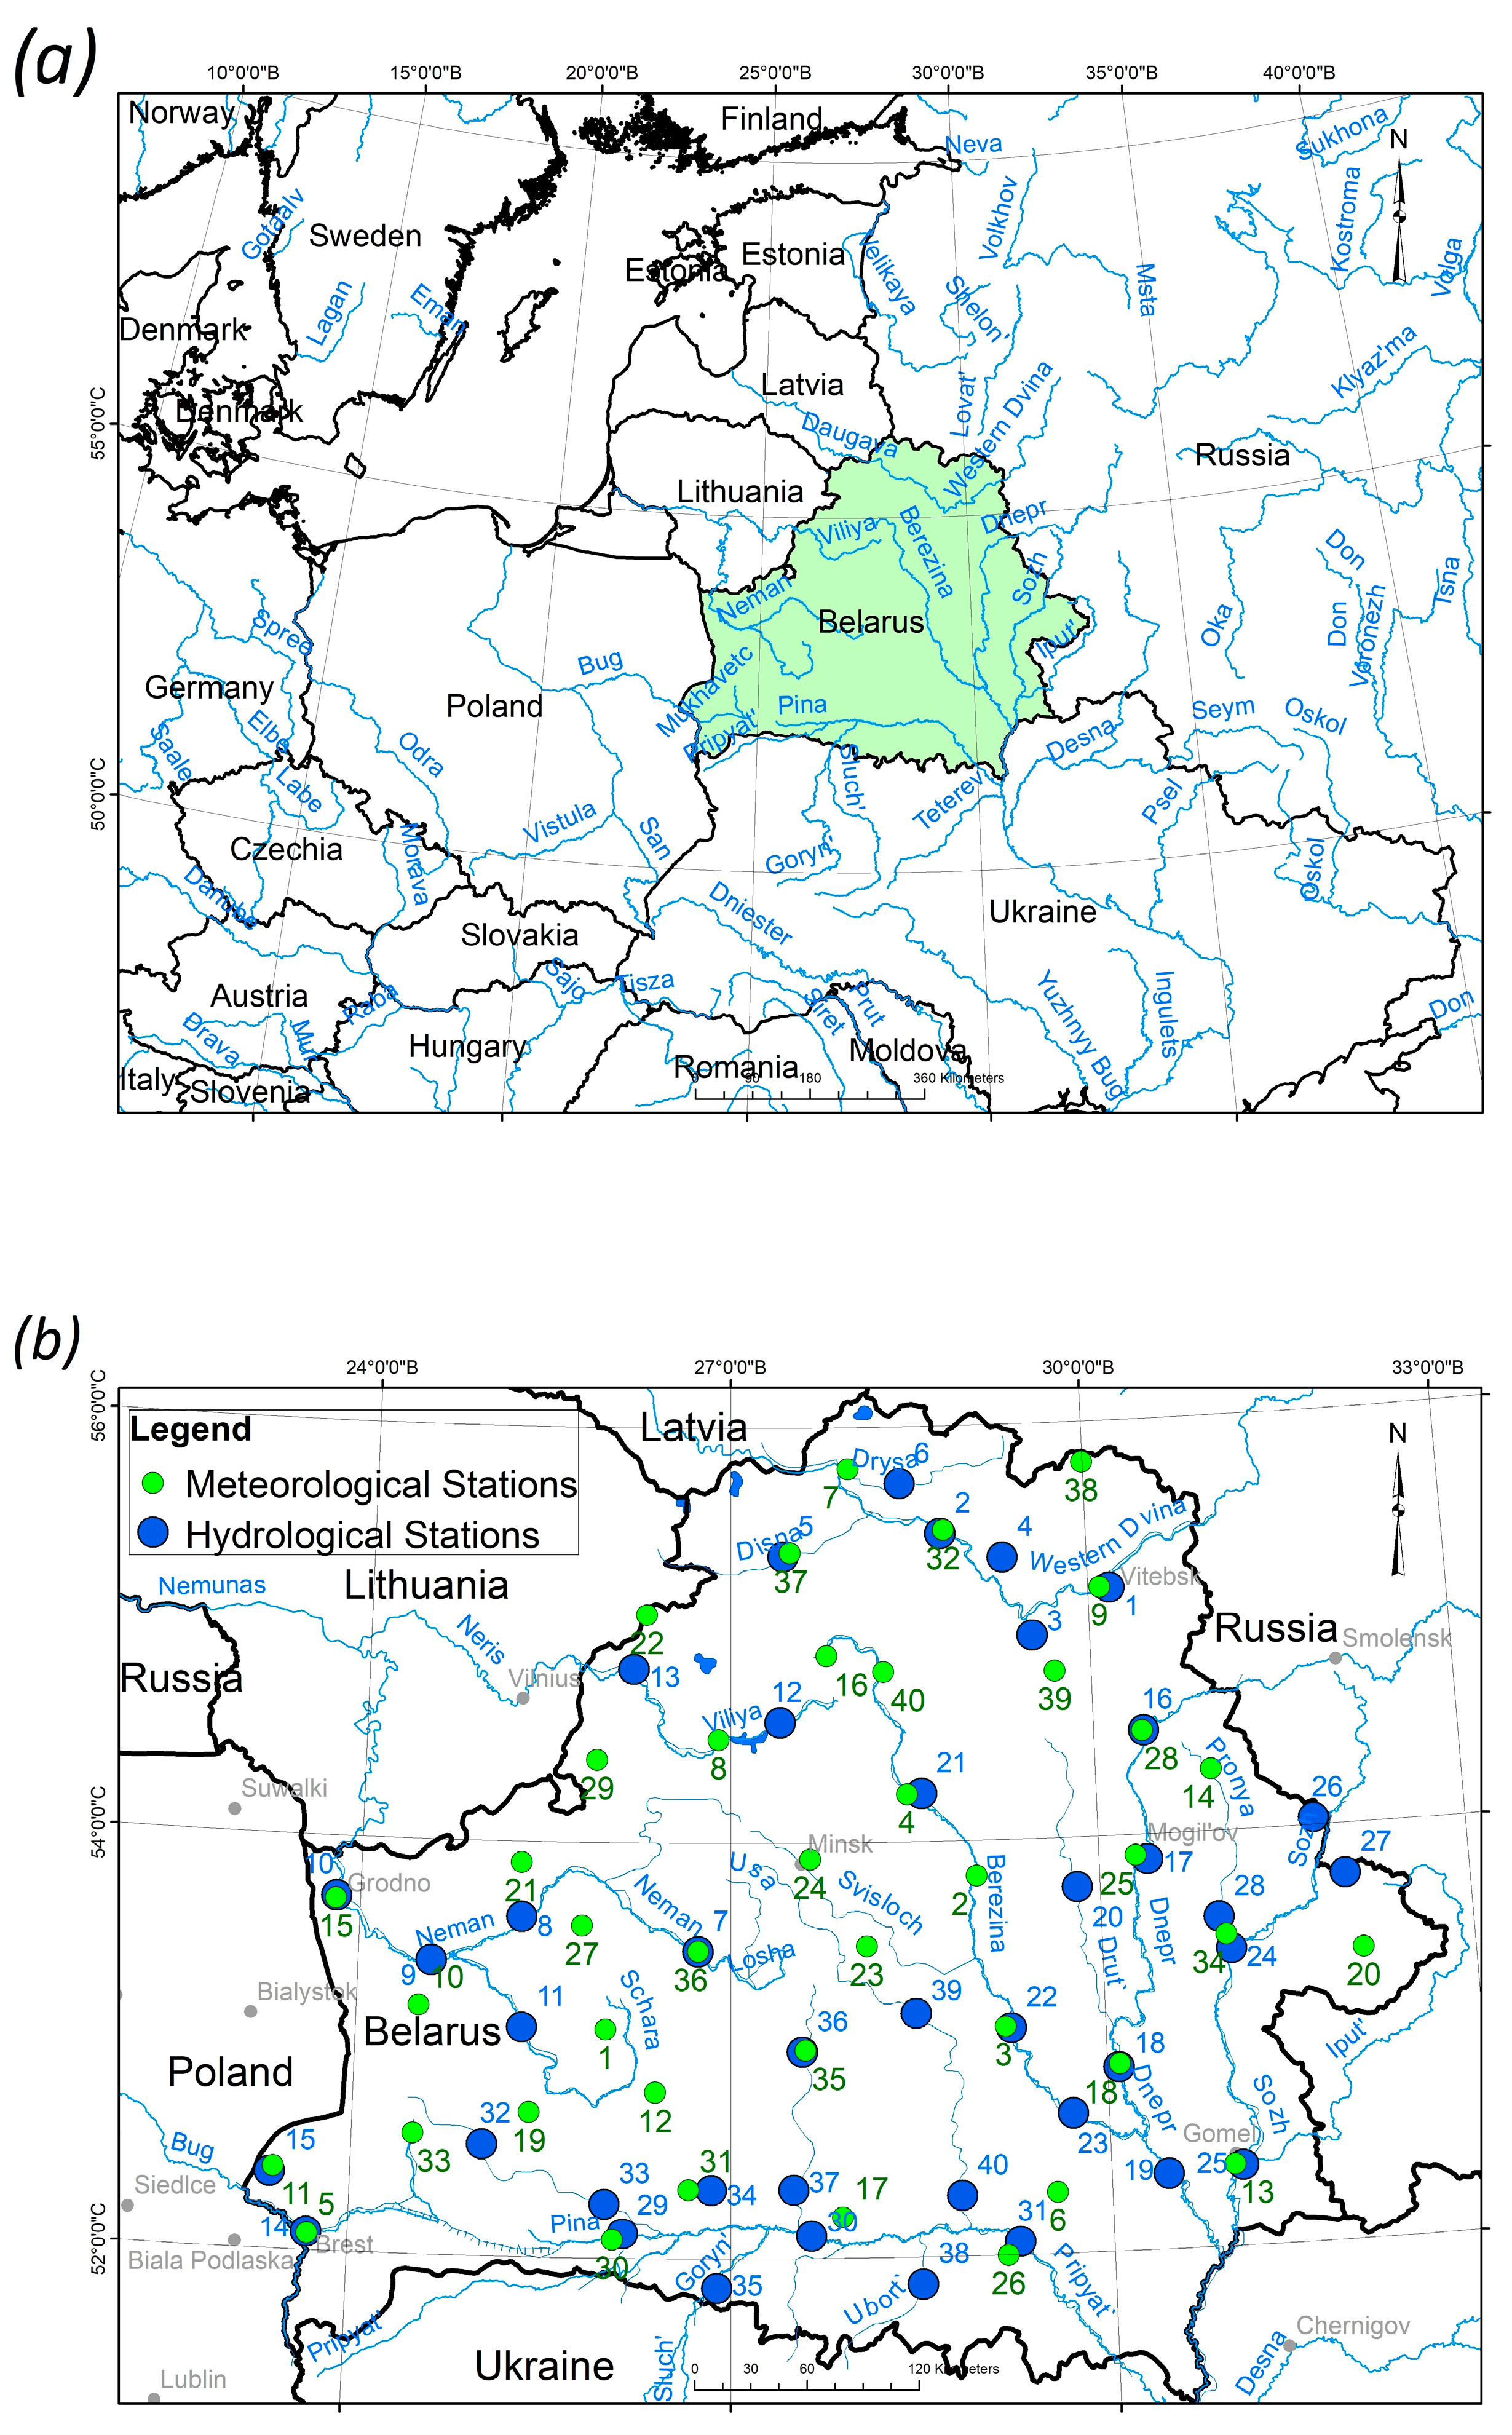
The greatest changes in hydrologic extremes have been reported in studies focusing on western Europe. It seems that current changes are less noticeable in eastern Europe, which looks more resilient to climate transformations. However, despite insignificant annual and seasonal trends in hydroclimatic characteristics, there are remarkable changes in extremes detected here over the last few decades. Eastern Europe is generally (indeed often) defined as a microregion that includes the European part of Russia, Belarus, Poland, Slovakia, Hungary, Romania, and Ukraine. Belarus is centered in this macroregion between northwest Russia and north Ukraine (see
Figure 1a) and represents well its climatic and environmental changes. Belarus is on the western edge of the Great East European Plain. Some rivers, such as the Western Dvina (Daugava) and the Dnepr (Dnieper, Dnipro) start in the Russian highlands and pass through Belarus en route to the Baltic (47%) and Black (53%) Seas.
There are four main rivers in Belarus. The Western Dvina River enters from Russia in the east and flows out to Latvia. The Neman (Nemunas) River originates in the center of Belarus and flows out to Lithuania. These river basins belong to the Baltic Sea Basin. The annual outflow to the neighboring countries is, on average, 13.9 km3 to Latvia via the Western Dvina River and 9 km3 to Lithuania via the Neman. The Dnepr River comes to northeast Belarus from Russia, crosses the country southward, and exits to Ukraine. The Dnepr’s largest tributary is the Pripyat’ River. This river is considered a separate river basin. The Pripyat’ rises in the southwest of Belarus and passes to the southeast where it also exits to Ukraine. The Dnepr and Pripyat’ Rivers belong to the Black Sea Basin. On average, their annual outflow from Belarus to Ukraine is 31.9 km3.
There are some natural and anthropogenic factors which should be considered in the study. The territory of Belarus is a terrain with flat relief; heights vary from 80 to 340 m. The forest density is about 40%.
There are 20 thousand rivers and 153 reservoirs with a total surface area of 822 km². Eighty-six of them, with a water surface area above 100 hectares, have a total area of about 800 km2. In the study, we used data from river stations which are not influenced by hydropower stations.
Eleven thousand lakes are spread across Belarus. Their total area is about 1.6 thousand km², their total volume of water is about 7 km³. Most of the lakes are in the north and northwest of the country. The lake density in Belarus is about 3–8% of its territory.
Despite numerous lakes and reservoirs, the river flow changes are not influenced by lake and reservoirs and retention does not significantly affect the flow transformation of the large rivers [
23].
In addition, the anthropogenic effect on rivers includes amelioration, which was most actively conducted in the 1960s. Large river catchment areas are less sensitive to anthropogenic impacts. Drainage most noticeably affects the water resources of small watersheds with an area less than 3000 km
2 [
23,
24]. We avoided river stations with possible transformed regimes under amelioration and concentrated on climate change’s impact on the rivers.
Climate change in eastern Europe was detected in the early 1970s. This has strengthened since the 1990s [
25,
26,
27,
28]. Since 1990, the air temperature in Belarus has increased by 1.3 °C above the climatic norm of the 1961–1990 period [
29]. In addition, drought events became more frequent [
30].
Water resources in eastern Europe depend strongly on precipitation. The annual water resources of Belarus for the period from 1945 to 2020 are about 56 km3 and exhibit alternating periods above and below the average. The greatest water resource volume over the last 30 years was in 1998, equal to 88.88 km3 (the second largest maximum since 1900). This was 154% of the long-term average value or norm. The minimum water resource volume was observed in 2015 (51% of the norm). Despite small changes in annual precipitation, a significant decrease in water resources has been reported only in the last decade (up to 40% in some years).
The main objective of our study is to identify regional trends in hydrologic extremes such as floods caused by snowmelt or heavy rains and droughts, considering a period with extremely low streamflow. This reflects a change in the eastern part of Europe, focusing on Belarus with interest in similar changes in neighboring countries. This study is divided into three parts. First, we conduct a detailed analysis of recent hydrological changes observed in Belarus. We concentrate on the Belarussian territory due to a diminished availability of detailed hydrological in situ data over the physically contiguous but politically divided region. Thereafter, we analyzed atmospheric circulation patterns over the Atlantic–European area as main drivers of hydroclimatic fluctuations in the study domain. Finally, we analyzed the impact of the ongoing changes in these drivers on the river flow regime and hydrological extremes over the center of eastern Europe.
2. Data and Methods
Our analysis involves several types of data. For floods and droughts analyses, we obtained meteorological data from 40 stations located within Belarus (
Figure 1b, the station names are listed in
Appendix A). We used monthly precipitation data to detect meteorological droughts during a period of 75 years (1945–2020). This is the time frame for the continuous data of meteorological measurements made in the study region after gaps during World War II.
Hydrologic extremes were identified based on river discharges from the 40 hydrological stations marked in
Figure 1b. We collected monthly river discharges (m
3/s), the maximal spring flood discharges, the minimal winter discharges, and the minimal summer–autumn discharges. The data passed quality control at the national weather service. We consider four types of runoff extremes:
Spring floods connected with snowmelt;
Floods caused by heavy rain observed both in winter and summer;
Winter low-flow runoff from river freeze up to snowmelt onset;
Summer–autumn low-flow period from the end of spring flood to the first ice appearance on rivers in autumn–winter.
We computed two drought indices: the Standardized Precipitation Index and the Standardized Streamflow Index (SSFI) [
31]. The first index is based only on precipitation data, while the second one is based on river discharges. To calculate the SPIs, a gamma distribution function was constructed and the cumulative probability of observed precipitation was determined, which was then converted using the inverse Gaussian function to the probability of a normally distributed random variable Z with zero mean and a variance equal to one, which is the SPI value [
32]. The Standardized Streamflow Index (SSFI) was developed from monthly streamflow rates and normalization methods like the SPI. SSFI values characterize periods of high and low flow associated with droughts and floods.
SPI/SSFIs were calculated for the three summer months (e.g., SSFI-3 for June–August) for each year during 1945–2020. Positive and negative values indicate above average and below average rainfall/runoff, respectively. The SPI/SSFIs were divided into gradations that characterize the territory’s aridity:
| −0.5 to −1.0 | Mild drought; |
| −1.1 to −1.5 | Moderate drought; |
| −1.6 to −1.99 | Severe drought; |
| −2.0 or less | Extreme drought [33]. |
Drought frequency (according to SPI/SSFI) was computed for two periods—1945–1990 and 1991–2020—and was defined as the percentage of months in the study period with negative SPI/SSFIs.
For an aridity analysis, we studied atmospheric circulation patterns over the Atlantic–European area, considering the anticyclones passing eastern Europe. The pressure highs were identified with an automatic tracking procedure by [
34] for the ERA5 reanalysis data [
33] for the 1979–2019 period. For this study, we sampled anticyclones that affected the hydrometeorological conditions of eastern Europe (defined as within 1500 km of Minsk).
A trend analysis was carried out using linear least squares regression [
35] and the Mann–Kendall test [
36,
37]. We used the total change by trend as the main characteristic of change, calculated by multiplying the fitted slope by the timespan in this study (viz. 75 years). Changes are considered where the estimated slope differs significantly from zero and tested for statistical significance at the
p < 0.05 level. The main results are presented on maps in the form of net changes. The homogeneity Pettitt test was applied to detect change-point (year) in the series for case studies [
38].
3. Results
3.1. Climatology and Nationwide Changes in the Main Meteorological Characteristics over Belarus
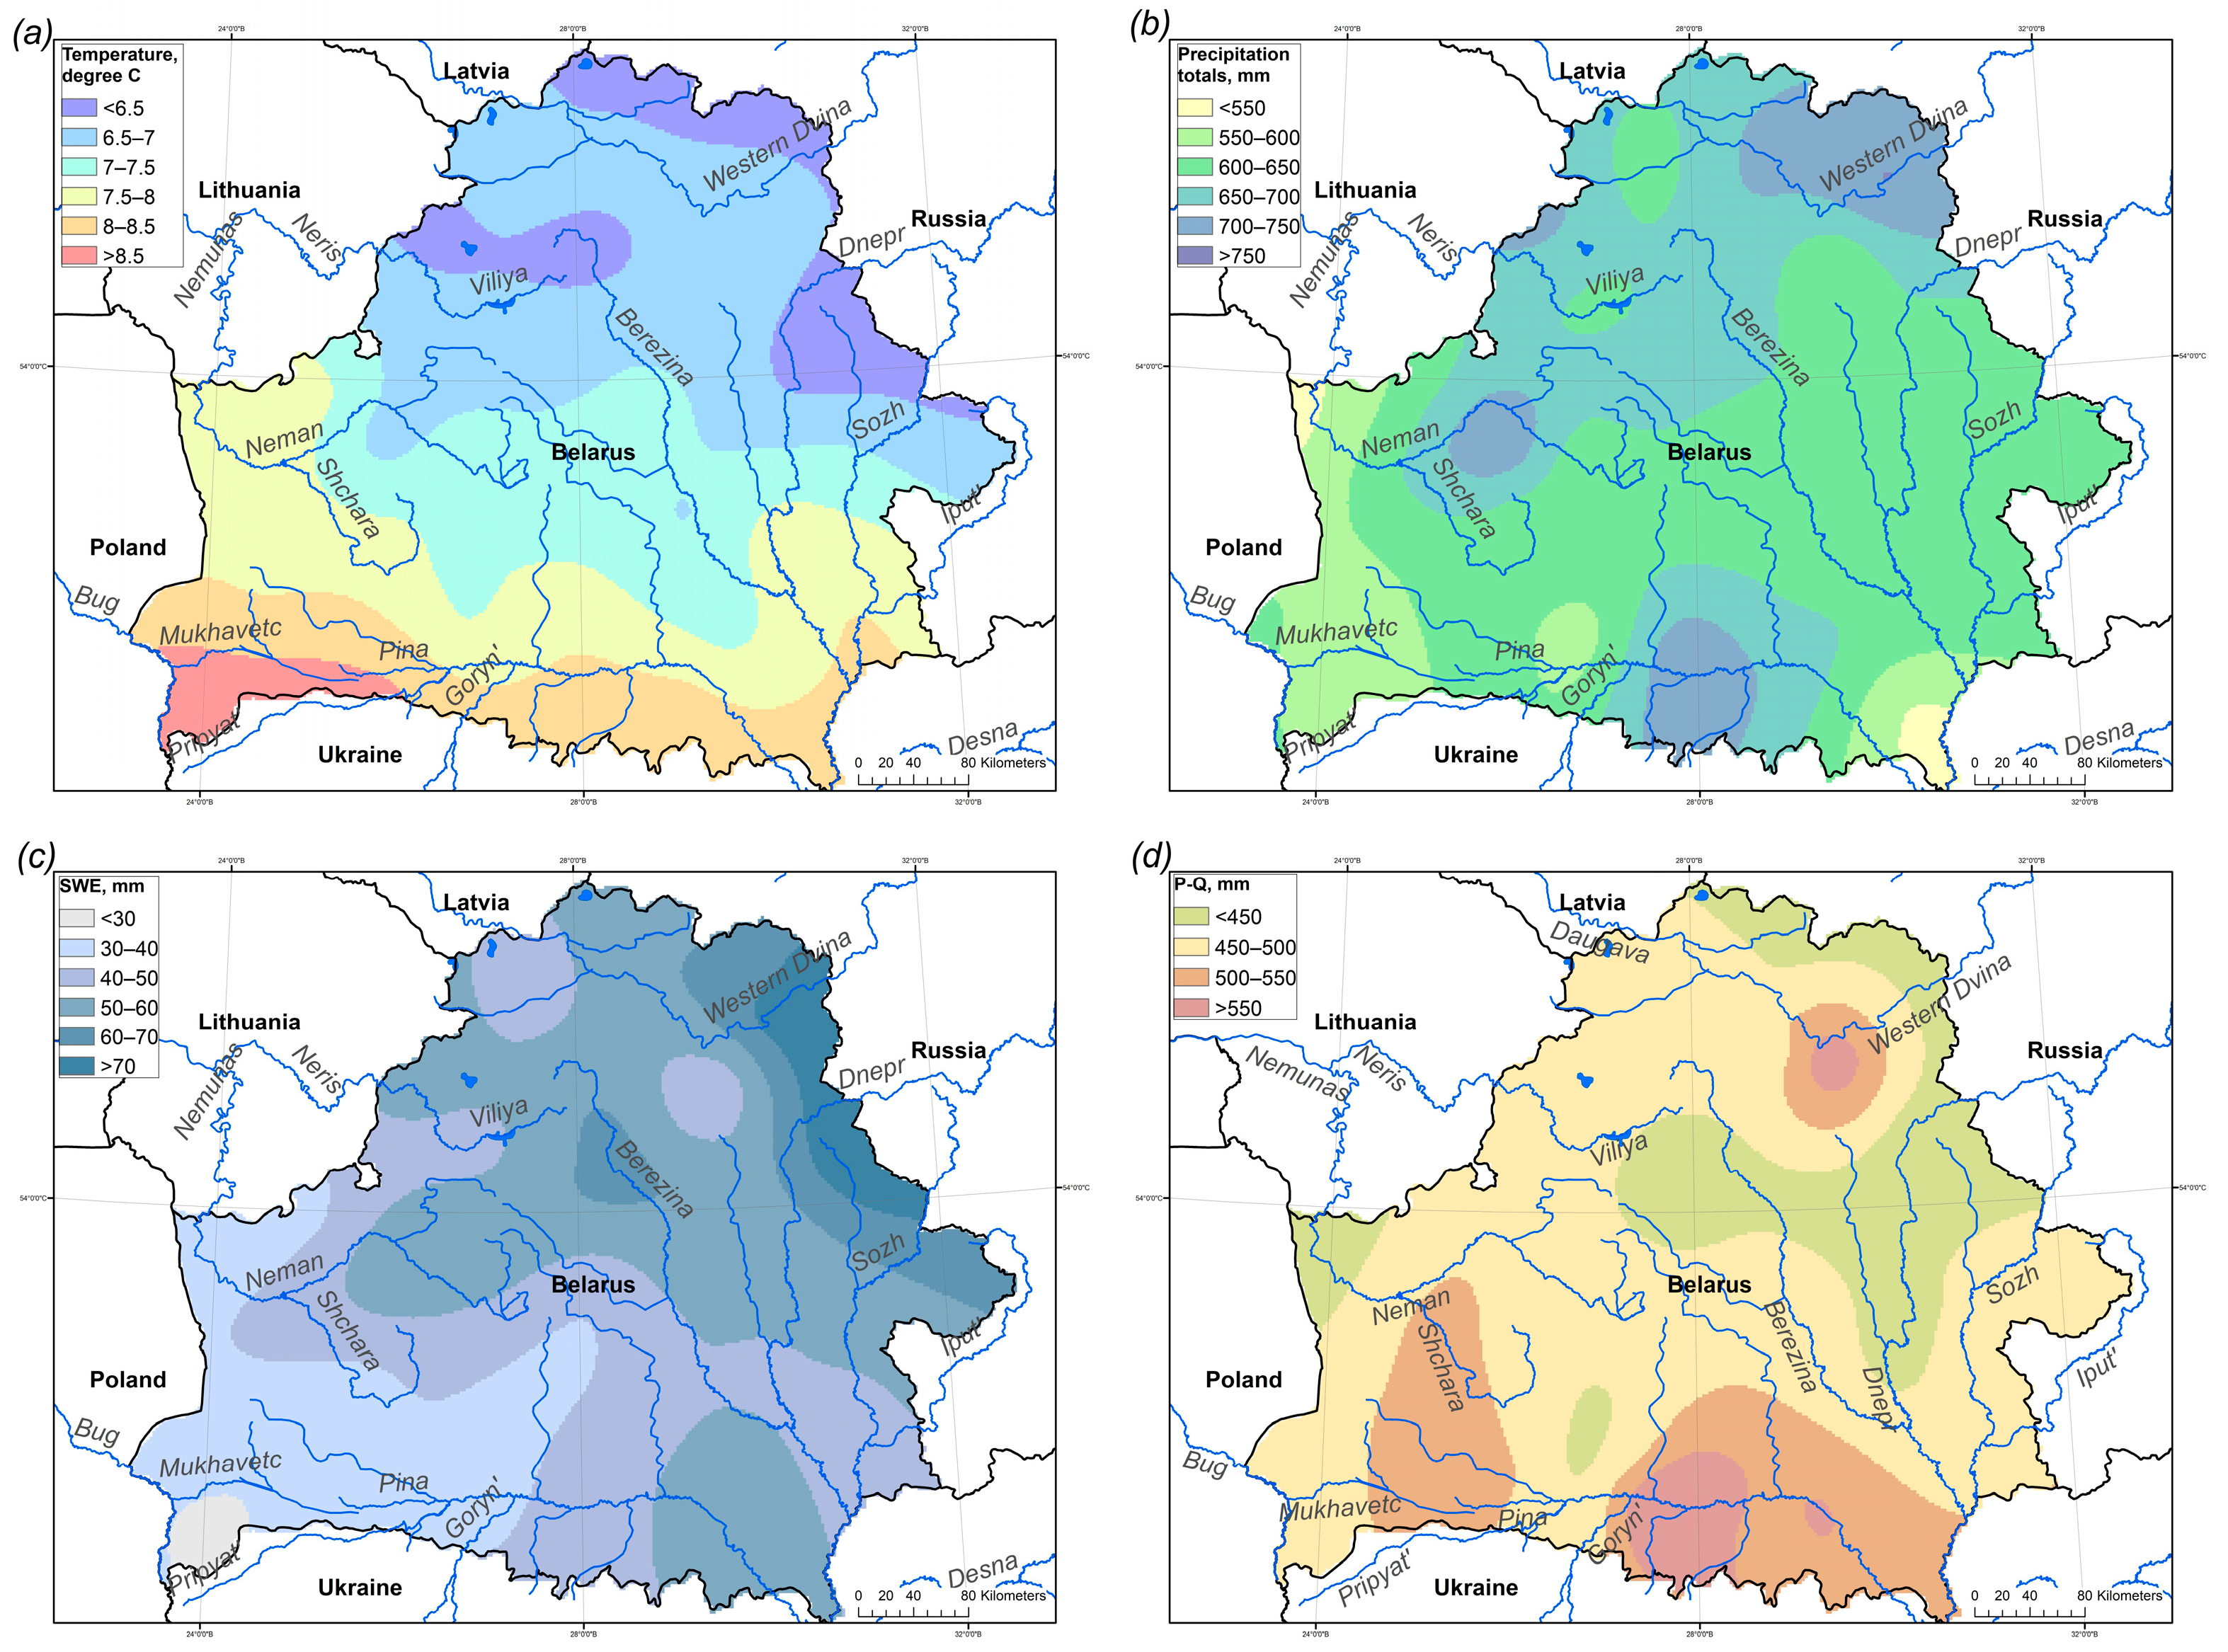
Belarus has a flat terrain with a maximum elevation of 340 m above the sea level and an elevation range of only 260 m. This feature explains the smooth geographical patterns of surface air temperature, precipitation, and snow water equivalent (
Figure 2). The climate of Belarus is moderate continental, with relatively cold winters and warm summers, and two short intermediate seasons. The degree of continentality increases from northwest to southeast, while moving away from the Baltic Sea towards the center of the East European Plain. In this sub-section, we provide a brief overview of the major meteorological characteristics during three hydrological seasons:
Winter, when most of country rivers are covered by ice;
Spring, when seasonal snowmelt causes peak streamflow;
Summer–autumn period (in Belarussian language, “mezhan`”, i.e., the low-flow period between spring peak flow and winter, when rivers covered by ice are mainly isolated from precipitation).
In the panels of
Figure 2, we show maps of mean annual surface air temperature, precipitation, snow water equivalent (SWE), and difference between precipitation and river runoff (which, in the absence of instrumental observations, is serving as an approximation for annual evapotranspiration).
Figure 3 presents nationwide averaged time series of the first two of these variables for fixed calendar seasons, December–January, March–May, June–November, and annual values. The calendar seasons approximate the three hydrological seasons mentioned above.
During the 20th century, the annual temperature over Belarus fluctuated around the temperature climatological norms for the 1881–1990 period. Significant changes in the national temperatures were observed after 1989. Particularly, the current warming is not only unprecedented in duration but also the higher temperatures that have occurred during the past thirty years (1989–2020) have exceeded the average climatic norms (1961–1990) by 1.3 °C. The three warmest years in Belarus since 1880 occurred in 2015 (Tannual = 8.5 °C), 2019 (Tannual = 8.8 °C), and 2020 (Tannual = 9.1 °C).
The rising temperature at the end of the 20th century did not lead to a higher annual amount of precipitation in Belarus. Instead, the increased irregularity of precipitation and rise in air temperature caused twice as many periods of drought in Belarus as before (cf.,
Section 3.5). Only winter nationwide precipitation has statistically significantly increased during the past 75 years. Most of this increase was localized in the northern half of the country.
3.2. Winter Low-Flow Season
Climate changes in Belarus and neighboring countries are associated with a significant increase in air temperature, especially in the winter season (>2 °C throughout the country). This affected the onset of autumn ice events, which shifted to 8–13 days later (usually, river ice appears here in late November or early December) and the freeze-up shifted by 5–8 days (usually toward the second third of December). The end of the ice phenomena (usually in the last third of March through the first third of April) shifted to 13–21 days earlier. The maximum ice thickness on the rivers decreased by 9–25 cm against average values from 25 to 45 cm.
Over the past 30 years, the low-flow season onset (which depends on ice appearance on rivers) has shifted later; for the north of Belarus in the Western Dvina River Basin, the onset was postponed by 4–11 days, for the western part of Belarus in the Neman River Basin by 6–10 days, and in the Western Bug River Basin by 11–12 days. In the east and south, in the Dnepr and Pripyat’ River Basins, the shift was 6–13 days. As a result, the duration of the winter low-flow season of all basins has decreased by an average of 14 to 26 days and ranges now from 89–99 days in the southern rivers to 113–123 days in the north.
Over most of Belarus, the monthly river discharges increased significantly in January–March [
24,
39]. The same changes occurred in most of the Baltic Sea Basin rivers [
40,
41,
42]. An increase in the winter runoff rates is caused by elevated air temperatures, an increase in thaw frequency, and an earlier onset of the spring floods and the snowmelt flow peaks.
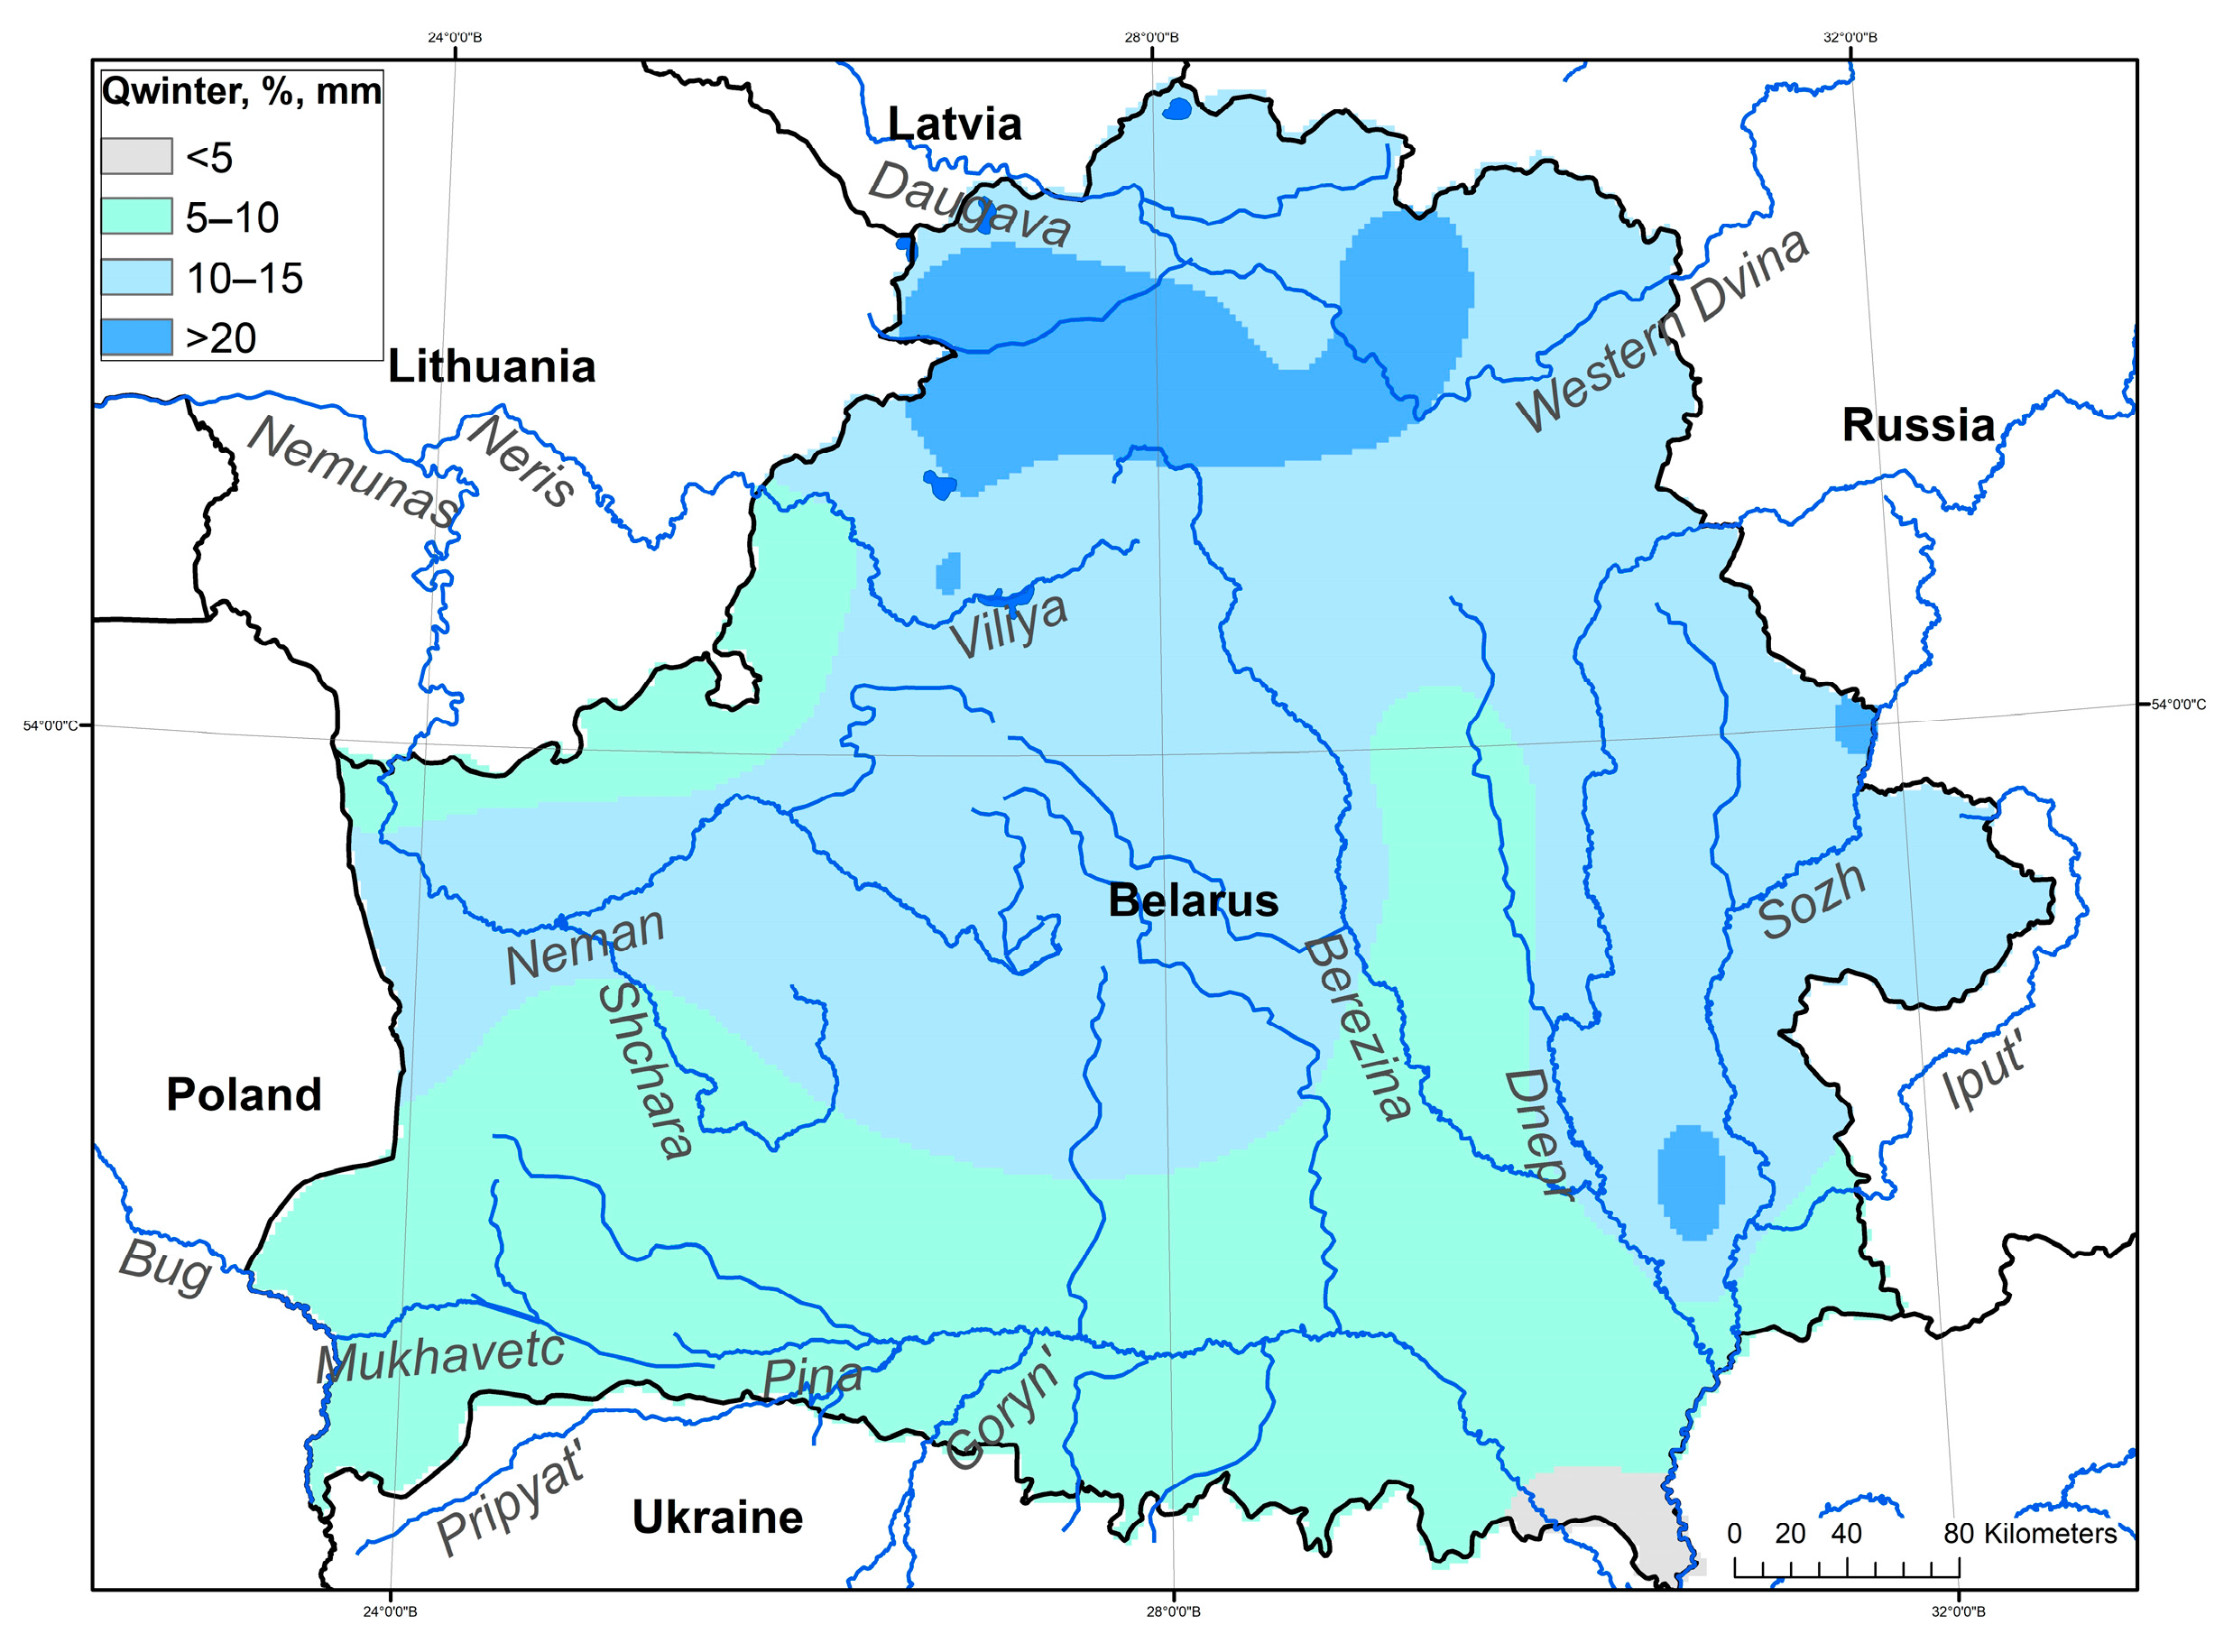
Figure 4 shows the distribution of the runoff rate change over the past 75 years, which is characterized by an increase of 13–18% in the north of the country (in the Western Dvina River Basin) and in the east (the upper Sozh River Basin). The smallest increase was detected in the southern part of the country—the Pripyat’ River Basin—within 7–9%. This is explained by the autumn runoff rise due to late autumn rain floods. In this River Basin, the high-water period lasts from autumn to winter because of flat relief and bogged basin areas.
3.3. Winter Floods
An early study of winter floods [
43] indicated an increase in flood discharges over the 1988–2010 period compared to 1966–1987 in most rivers of Belarus: from 10–20% in the Pripyat’ River Basin to 20–40% in the Western Dvina River Basin. A 20–40% decrease in winter flood magnitude was noted in the Western Bug (Narew tributary) River Basin.
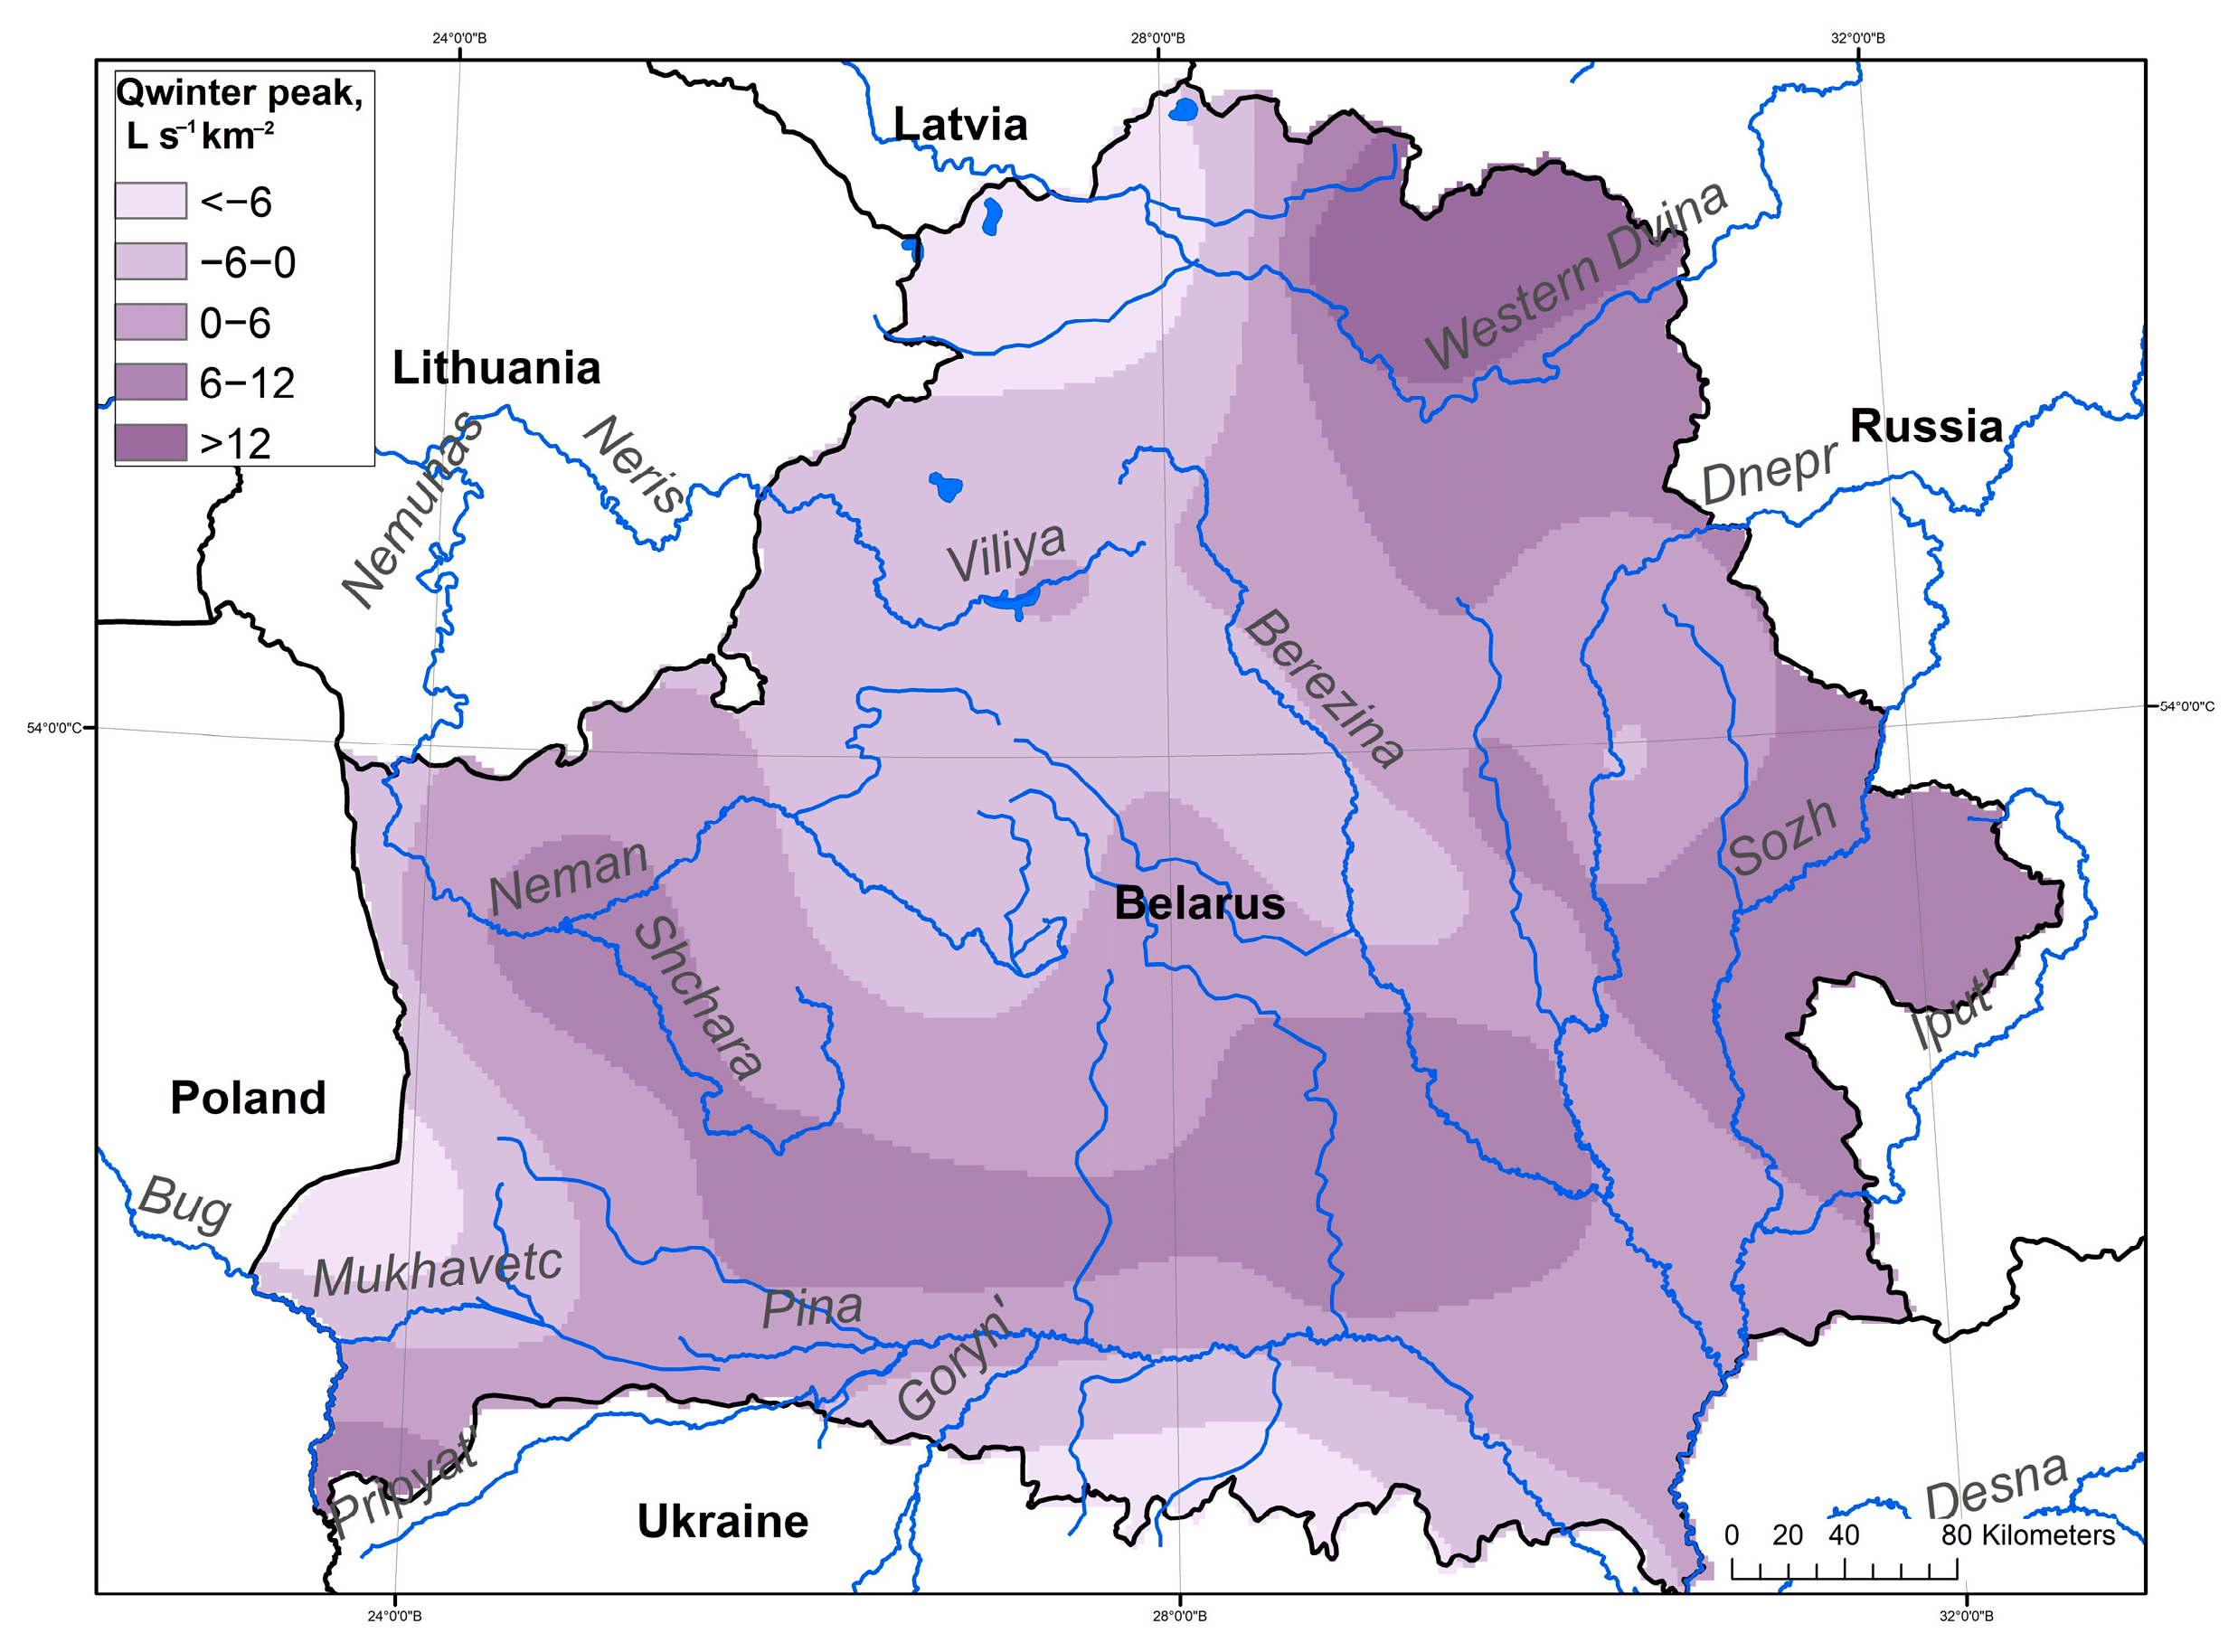
Our calculations consider recent years and show a continuing increase in winter floods mainly in the eastern half of the country, as presented in
Figure 4 for the upper Western Dvina, the Dnepr, and the left-bank of the Pripyat’ River Basin. In these basins, winter maximal discharge increased by 1 to 6 L s
−1 km
−2, or by 5 to 20%, in the central part of the country and up to 30–40% in the southeast.
A decrease in winter flood height is observed in the west and south of the country by 1–10 L s−1 km−2. In the Neman, the Viliya (or Neris, the Neman tributary), and the Western Bug River Basins and the lower Western Dvina River Basin, the decrease in flood peaks reaches 15–30%, while, on the right-bank of the Pripyat’ River Basin, this decrease exceeded 40%. These changes are associated with higher air temperatures in the south and west of the country and, as a result, low snow accumulation in watersheds. For example, in these River Basins, the snow water equivalent (SWE) varied within 50–70 mm in the 1945–1990 period. Thereafter, in the past 30 years, the prevailing SWE values sat at 40–50 mm and the winter snow height decreased by 10–15 cm.
Winter flooding was noted in some years only in the Pripyat’ River Basin and its tributaries. Outstanding (occurring once per 55–100 years) winter floods were noted in 1974–1975, 1980–1981, and 1998–1999; large floods (recurrence 10–50 years) were noted in 1947–1948, 1974–1975, 1981–1982, 1988–1989, 1990–1991, 1992–1993, 1993–1994, 1997–1998, 1998–1999, 1999–2000, 2002–2003, 2008–2009, 2009–2010, 2010–2011, and 2012–2013 [
24]. The largest number of winter floods occurred in 1990–2020. However, since 2000, we found a continued growth runoff rate during the winter low-flow season without sharp floods.
3.4. Spring Floods
The streamflow changes in the study region occurred under natural and anthropogenic drivers. The anthropogenic impact (amelioration, mostly in the 1960s) influenced small river catchments, while the large-river regime is more stable and depends mainly on natural drivers, primarily climate fluctuations [
23].
Studies of how the river regime responds to climate change within northwest Russia [
44,
45] and Belarus [
9,
23,
24,
46] show no significant long-term trends in annual streamflow. Meanwhile, the intra-annual distribution of runoff has changed significantly over the last few decades.
Summarized hydrological hazards on Belarussian rivers, documented from 1880 to 2000 [
47], show the largest number of inundations caused by spring floods in 1951, 1953, 1956, 1958, 1962–1968, 1970, 1979, 1994, 1996, and 1999 (plus, subsequently in 2004 and 2010). The spatial distribution of spring flood peaks in the past 75 years is shown in
Figure 5. High floods were often observed in the 1950–1970 period, while the other decades mostly featured lower spring floods. For comparison, high flow on the rivers of Ukraine was observed in 1931–1933, 1958, 1970, 1980, and 1998. The greatest flow rates of spring floods on lowland rivers of this country were recorded in 1932, 1970, and 1979 [
48]. The frequency of spring floods in the Desna River Basin, in the north of Ukraine, decreased [
49]. The same tendencies were detected in Poland [
7].
Over the past 30 years, the maximum flood discharges decreased by 20% in the Western Dvina River Basin and by 50–60% in the Neman, Dnepr, and Pripyat’ River Basins. The flood onset dates shifted 11–22 days earlier over the last 30 years. Since 1970, and especially after 1990, a maximum streamflow reduction was observed over the entire territory of Belarus, with the largest changes for the northwest, in the Western Dvina River Basin. Here, the decreases range from 15 to 18 L s
−1 km
−2. The lowest changes in spring freshet decrease were in the south and central part of the country, mainly in the Pripyat’ River Basin, where the changes were between 4 and 18 L s
−1 km
−2 [
9]. However, the largest decrease in maximal discharges occurred in the Viliya River Basin, up to 50–80% in the 1989–2009 period, when compared to the 1951–1987 period [
23]. This was explained by anthropogenic action; part of the streamflow was redirected to the Svisloch (a Dnepr tributary) River Basin. The smallest changes, less than 10%, were observed in the upper stream of the Prypyat’ River Basin caused by intensive amelioration in this area. When we compared the 1961–1985 period with the next 25 years, despite a general flood occurrence decrease, the spring streamflow was found to have grown by 15–40% in southeast Belarus [
46]. The significant negative trends of the spring flood peak in the upper and middle stream of the Western Dvina River vary within 69–89 m
3 s
−1 per decade, with the largest trend values in the middle stream and the smallest values in the upper stream of the basin in Russia [
39].
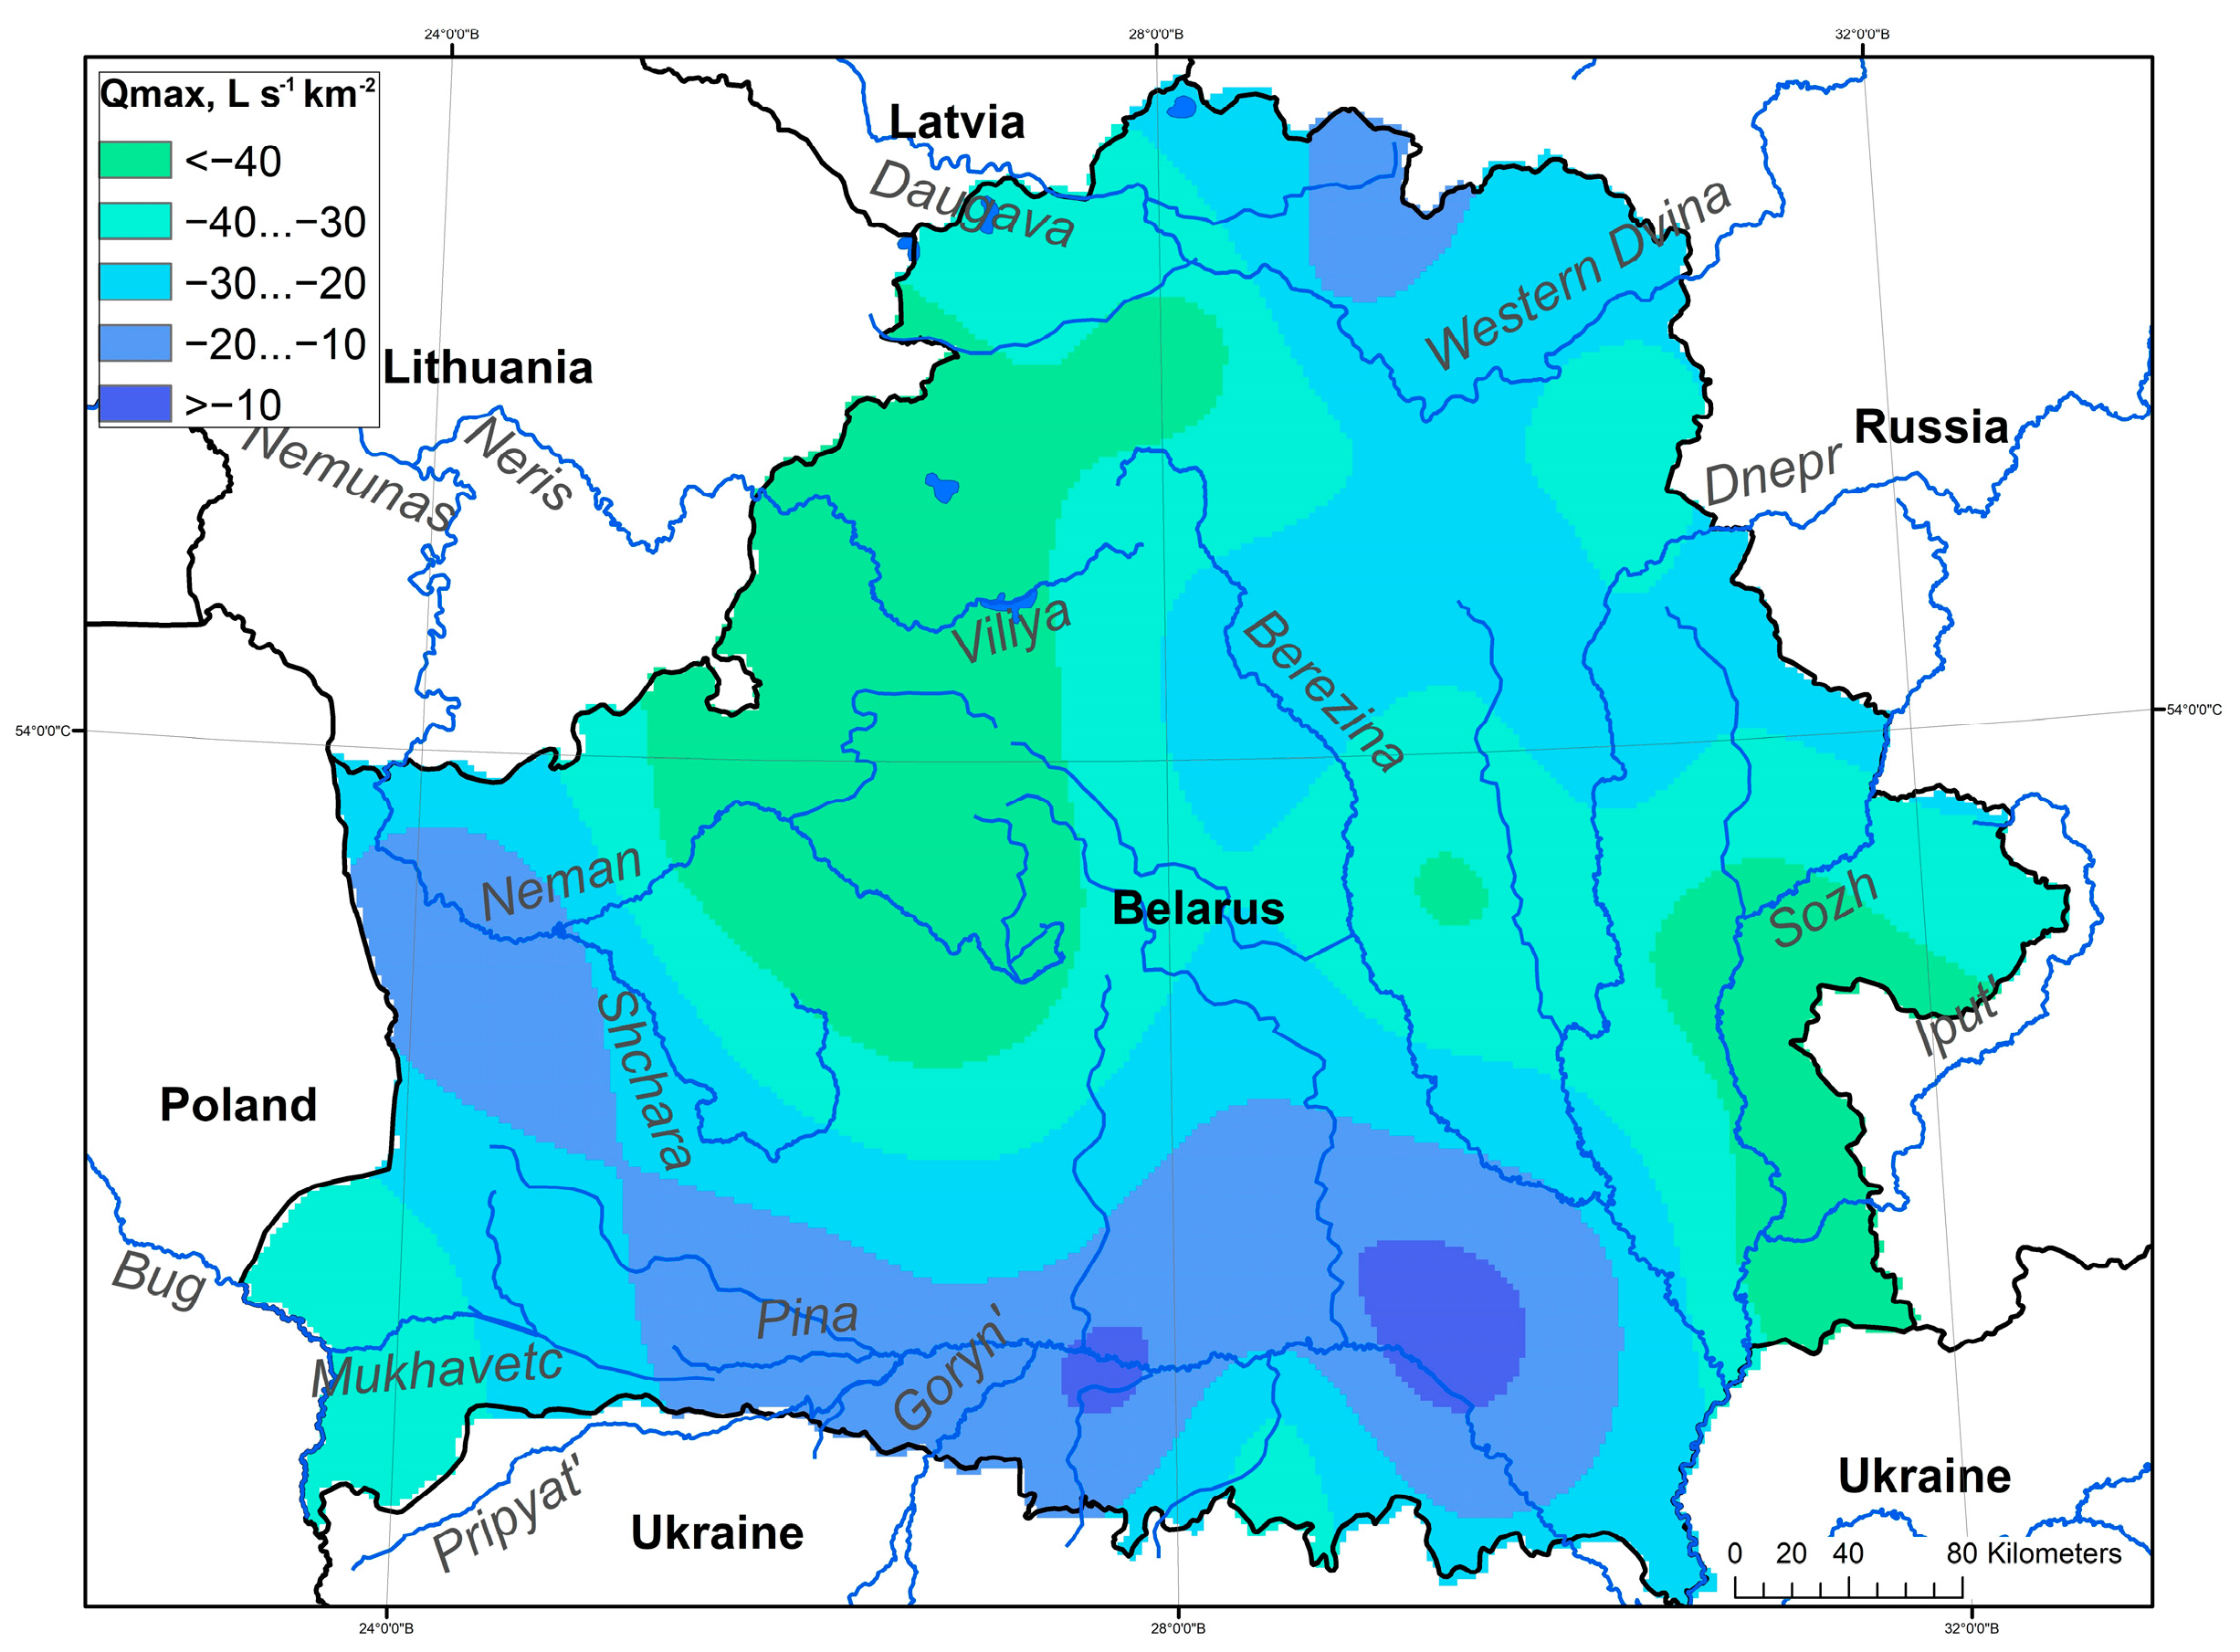
Our study showed the continued decrease in maximal discharges in all river basins in the past 50 years (see
Figure 6). The largest changes were detected in small river catchments due to their higher sensitivity to climatic anomalies such as extreme precipitation or droughts. In small river basins, the trends of specific maximal discharge vary from 5–6 L s
−1 km
−2 to 1–3 L s
−1 km
−2.
However, despite the steady trend towards a decrease in the spring maximum streamflow and a decrease in the flooding frequency, there were several floods in the southern part of the country, in the Pripyat’ River Basin. This basin is characterized by the smallest decrease in the spring runoff rate during the last 30–50 years, and the specifics of the hydrological extremes in this basin are explained by a flat relief and large wetland areas. In recent decades, outstanding floods in the Pripyat’ River Basin were recorded in 1979 and 1999. Small floods were also noted in 2005, 2006, 2010, 2013, 2018, and 2019. Furthermore, inundations are noted almost every year.
3.5. Summer–Autumn Low-Flow Season
The streamflow in the warm half of the year in Belarus depends strongly upon precipitation and less upon temperature. The climate changes in the summer–autumn season are related to regular long-term rainfall deficit, reflected in decreased summer rain duration by 15–20% at all regional meteorological stations. In addition, the number of days with low relative humidity (daily RH < 30%), increased by 1–4 days per decade. At the same time, there was an increase in summer daily precipitation maxima by 20–30% at most regional meteorological stations [
30]. Despite regular precipitation deficit and increasing precipitation intensity, the annual amount of precipitation does not change significantly over the last 30 years.
Over the last 30 years, the onset of the summer low-flow season shifted 7–22 days earlier in the Western Dvina River Basin, 6–13 days earlier in the Neman River Basin, 3–11 days earlier in the Dnepr River Basin, and 4–22 days earlier in the Pripyat’ River Basin. The earliest dates of the summer–autumn low-flow season were established at the end of March (in 1989, 1995, 1997, and 2008). In 2008 in the Western Bug River Basin, early onset of the summer–autumn low-flow season was documented in mid-February. The duration of the summer–autumn low-flow season increased by an average of 12–29 days. In 2007 and 2012, the latest offset dates of summer low-flow season in Belarus were marked at the end of December–mid-January. The mean summer low-flow duration in the central part of Poland does not vary much and averages 95–100 days, though its maximum duration is much higher (up to 171 days) [
50].
Flooding incidence caused by heavy rains in the warm season increased in the Western Dvina and Dnepr River Basins. In the Pripyat’ River Basin, there were no significant changes in flood occurrences, in either the main river or its tributaries. Flood occurrence decreased in the Neman River Basin because of significant rainfall deficits in recent decades.
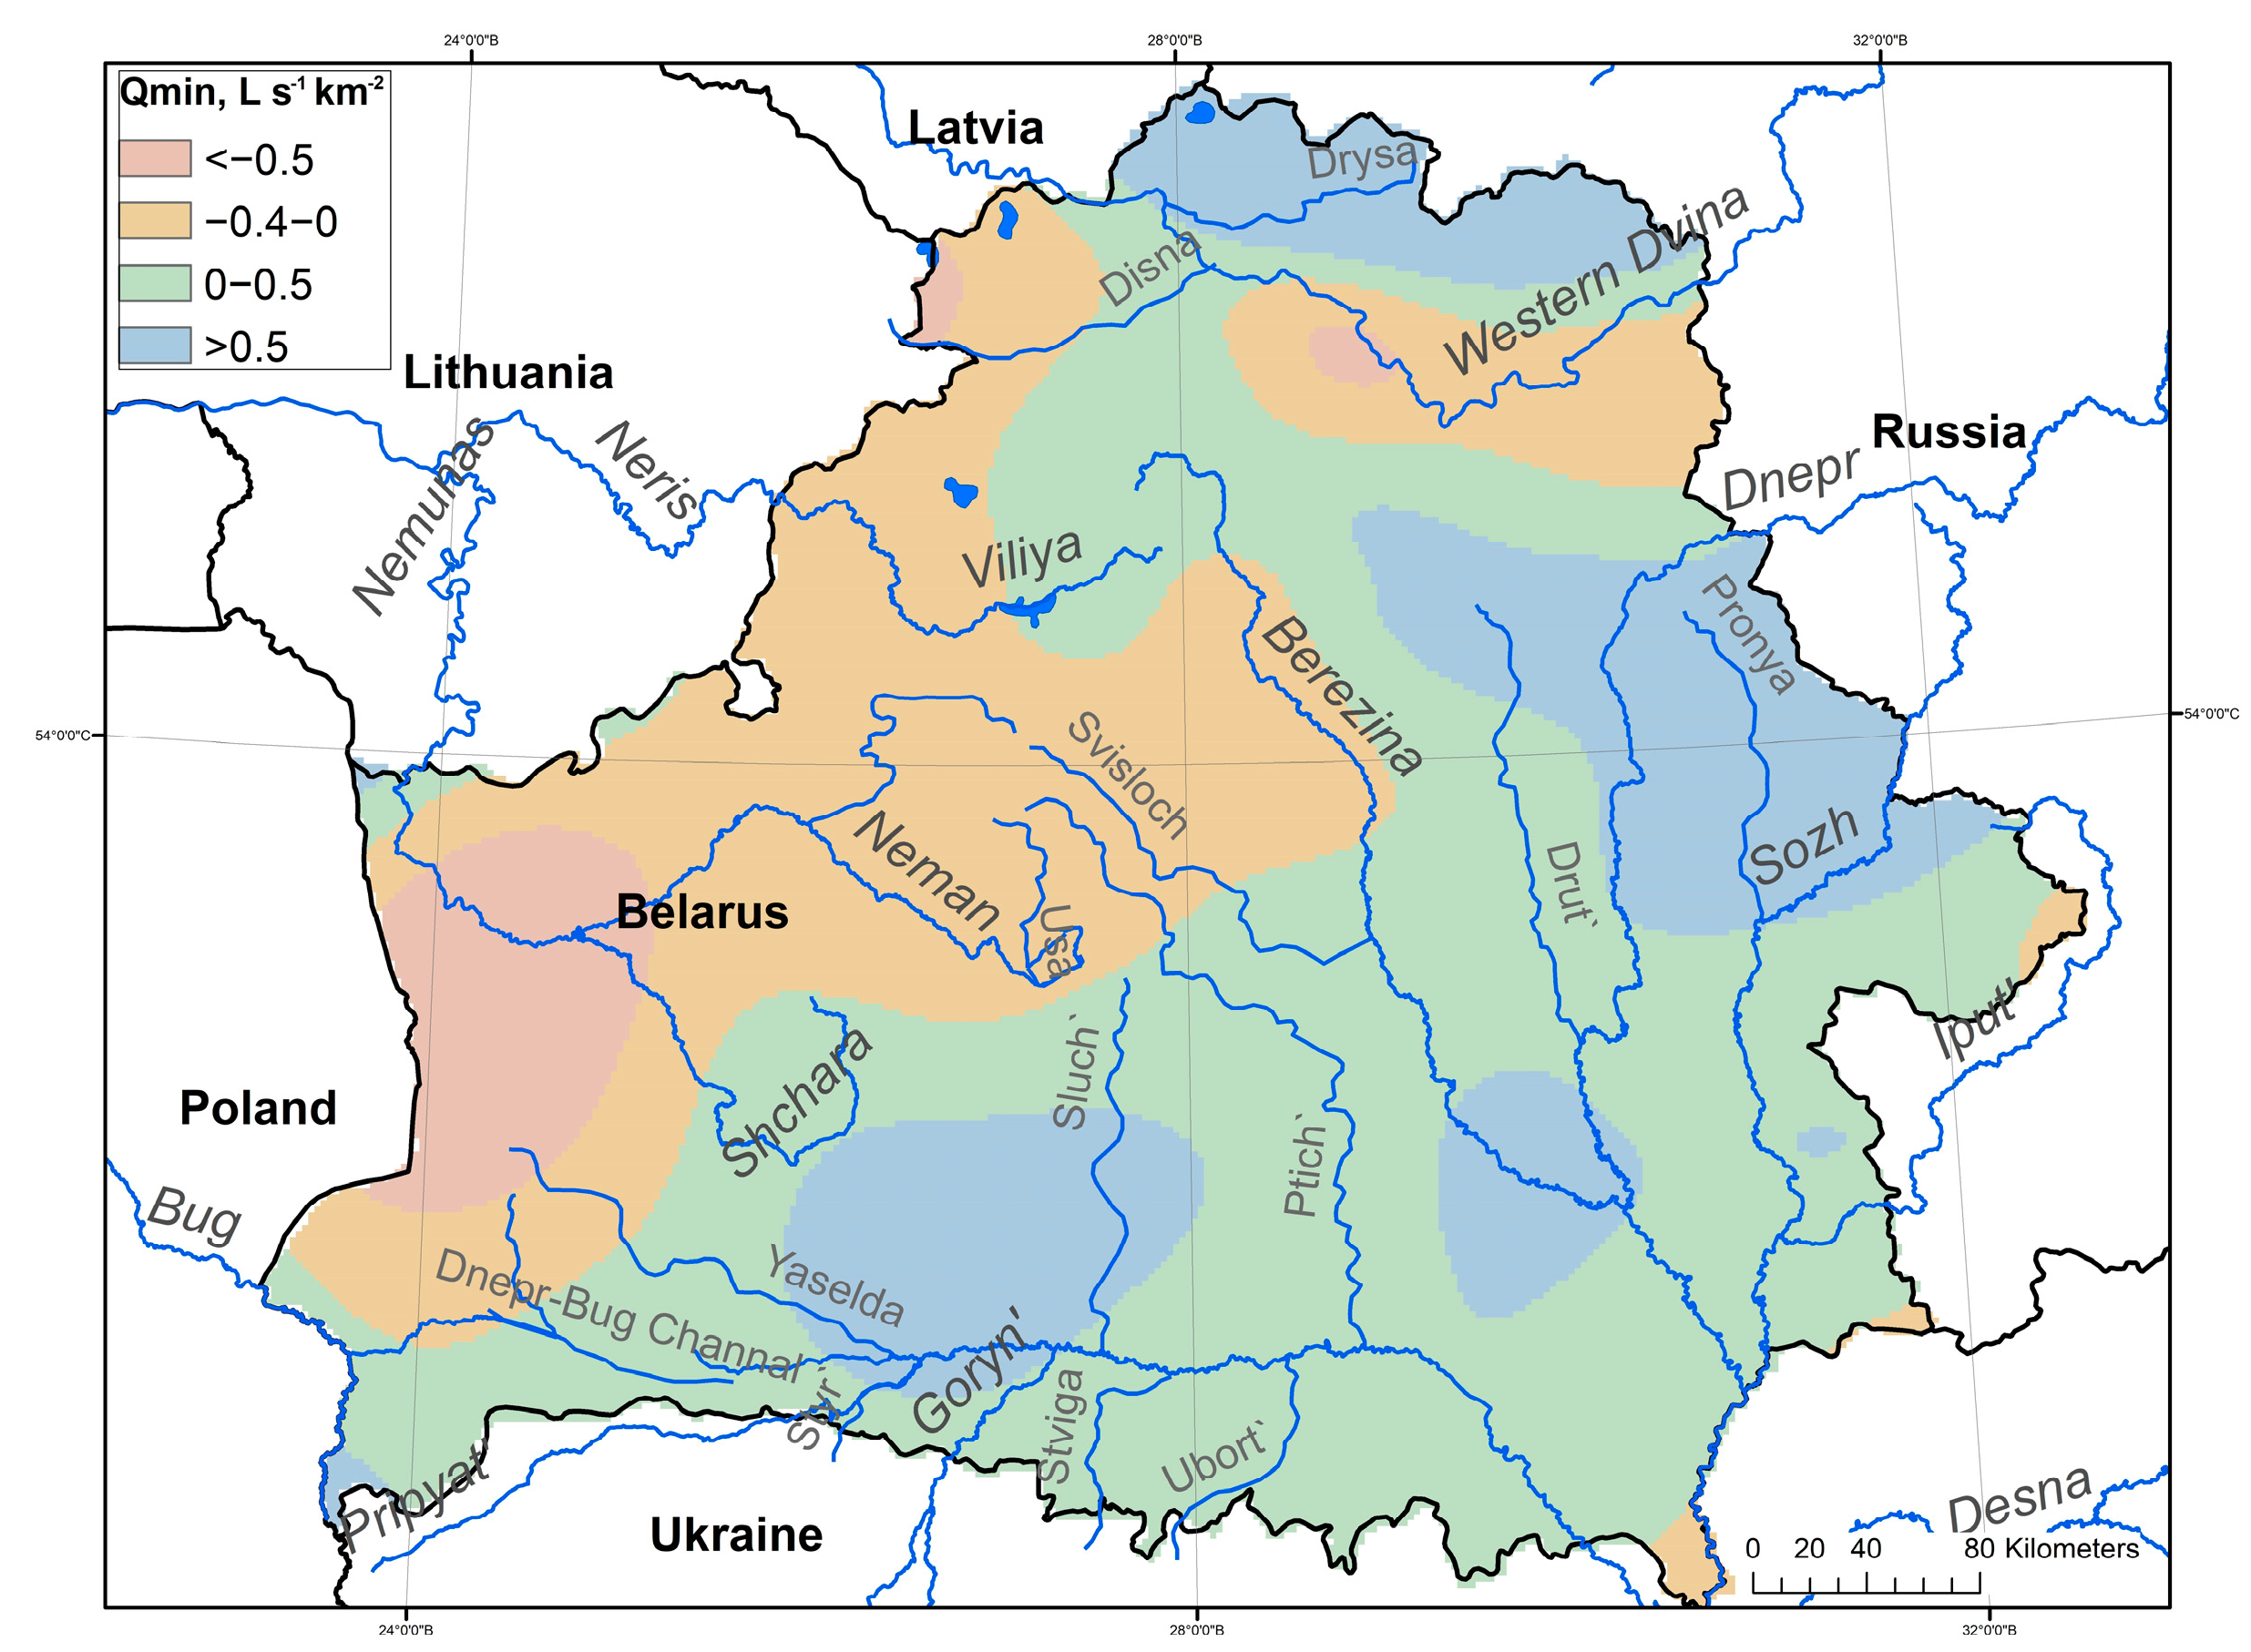
A frequent long-term precipitation deficit has led to a decrease in minimal streamflow in the summer–autumn low-flow season in the western half of the country (
Figure 7). Before the 1970–1990 period, the water levels of the summer–autumn low water were higher than the levels of the winter low water. However, in the last 30–50 years, the levels of the winter low-flow season exceeded those of the summer–autumn season. There is a nationwide tendency for a reduction in the levels of the summer–autumn low-flow season by an average of 32 cm. Extremely low river levels (below navigation marks) of the rivers in the country were noted in 1995, 1996, 2002–2005, 2007, and 2010–2018, or in 17 out of the 30 years over 1990–2020. These extremely low levels lasted from 3 to 205 days on average.
For the past 30 years, the spatial distribution of the standardized three-month precipitation indices (SPI-3) and standardized three-month streamflow indices (SSFI-3) for June–August indicates increased dryness and a low streamflow period during the warm period in most of the country. The greatest decrease in SPI-3 is typical for the western half of the country, which is characterized by the least annual and summer precipitation totals during the study period. The Neman, Western Bug, and the upper Pripyat’ River Basins (i.e., west and southwest of the country) were the most arid areas in the past 30 years with 20–30% precipitation deficits compared to the preceding decades. Here, we found that the hydrologic drought frequency increased by 15–20%. In the central part of the country, in the Dnepr River Basin, the hydrological drought frequency increased by 5–10%. In most of the Dnepr River Basin and on the Pripyat’ river itself, small changes are associated with higher precipitation totals, and, for the Pripyat’ River Basin, with slower fluctuations in the river flow due to flat relief and wetlands. The opposite trends in SPI-3/SSFI-3 for June–August (i.e., an increase) were detected in the east of the country, in the upper Dnepr and the Sozh Rivers. These increases correspond to a decrease here in the hydrological drought frequency by 3–5%.
The earliest research [
51] showed that, in the 1961–2010 period, there were no indications of increased droughts in the Neman River Basin. Decreasing trends of dryness in most parts of this basin correspond with a rise in extreme precipitation events. Our study confirms a decrease in the number of mild and moderate hydrologic droughts (with SSFI-3 < −0.5 and −1.0) in the surrounding basin areas. However, we found a two-fold increase in the severe and extreme hydrologic droughts (SSFI-3 < −1.5 and −2.0) in the past 30 years over Belarus. For example, for the Dnepr River near Mogilev, no severe droughts were observed before 1990, while thereafter, in the 1990–2020 period, three severe droughts were documented. An increase in severe droughts from three to six was noted on the Pripyat’ River near Mozyr. On the Neman River near Grodno, seven severe droughts were noted in recent decades.
3.6. Case Study: Hydrological Extremes at Three Stations across Belarus
In this sub-section, we show a detailed analysis of hydrological extremes for three river stations, which represent the three largest catchments within the territory of Belarus: the Western Dvina River near Vitebsk (north), the Neman River near Grodno (west), and the Dnepr River near Rechitsa (southeast). For surface air temperature, precipitation, and annual, minimal, and maximum discharges, we divided the 1945–2020 period of observations into two major periods, where the tendencies of these variables changed substantially.
Table 1 and
Table 2 show that for the surface air temperature, the major break points were around 1988–1989 and at all three sites, the mean temperature increased from 1.2 °C in the west (Grodno) to 1.7–1.8 °C in the northern and eastern parts of Belarus. For annual precipitation, the major break points occurred earlier, in the first half of the 1980s. Again, there was a difference in precipitation change between the western and eastern parts of the country; in Grodno, annual precipitation began to decrease, while at the two other sites, the opposite tendency took place. There were no significant changes in annual discharges at all three rivers. However, in the past three decades, there were observed statistically significant changes in extreme streamflow. The minimal winter discharge became higher at all three rivers in the 30 years, while the maximum discharge (usually in spring) decreased. For Western Dvina, the decrease in maximum streamflow was observed earlier after 1971. We speculate that this early break point onset could be related to a multiannual drainage experiment in the upstream part of this river in Russia [
52,
53]. The minimal summer runoff increased for the Dnepr River, while for the two other rivers, its changes were insignificant.
In
Figure 8, we present the probabilities of discharge exceedance (PE) for two periods (1945–1990 and 1990–2020). The calculated discharges of 5 and 95% PE prove the findings of river regime transformation. The winter discharges of 95% PE in Western Dvina (Vitebsk) did not change significantly due its location in the north of the country and relatively more severe winter weather. In the Neman and Dnepr Rivers, the winter discharge of 95% PE increased by 1.5–2-fold. The winter discharges of 5% PE increased for the three studied rivers by 30%. In spring, the discharges of 5% PE decreased at all three rivers from 20% at Western Dvina River to 50% at the Neman and Dnepr Rivers. In the summer–autumn low-flow season, a significant decrease of 95% PE discharges (by more than 10%) was detected in the west of the country in the Neman River basin due the significant precipitation deficit there in the last 30 years.
3.7. Main Drivers of Extremes Change
The main driver of current hydrologic changes is atmospheric circulation over the Euro–Atlantic area. We analyzed atmospheric patterns over Europe which cause changes in winter and summer separately.
The main indicator of regional climate change in winter over Europe is the North Atlantic Oscillation (NAO) [
54], which determines the intensity of westerlies depending on the pressure gradient between the Azores High and the Icelandic Low. For Belarus, there is a statistically significant relationship between NAO and air temperature from December to March, which is estimated by correlation coefficients to be in the range of 0.45–0.55 [
55].
In 1960–1990, the prevailing positive NAO phase correlates with winter temperature and precipitation increases in Europe [
56]. Since the mid-1990s, the intensity of meridional circulation associated with the Scandinavian Pattern of the North Atlantic circulation (SCAND) has been increasing [
57]. Positive trends in winter air temperature above 0.5–0.7 °C and precipitation totals by 3–5 mm per decade were noted for Belarus [
30]. Winter air temperatures were increasing faster in the positive NAO period, and, since 2000, the summer air temperatures have also been increasing more markedly. Precipitation patterns exhibit a trend towards a rainfall intensity increase of 20–25% per 30 years, associated mostly with the atmospheric convection changes [
58].
Cold season NAO
DJFM and river runoff in Belarus show a significant connection [
9]. In winter, with positive North Atlantic Oscillation indices, long waves in the atmosphere are characterized by a small amplitude. The cyclones moving along long waves run almost directly eastward. They block the inflow of cold air masses into Europe and bring precipitation along their route. As shown in [
3], floods in medium and large watersheds are associated with significant precipitation totals that fall from cyclones. In winter, the powerful North Atlantic cyclones, formed near the eastern coasts of North America, bring heavy precipitation to Europe [
59].
Since the 1970s, there has been an increase in the frequency of cyclones in northern Europe [
9,
60,
61], especially North Atlantic cyclones in the winter season, which has led to a precipitation increase in Northern Europe and decrease in Central Europe. Additionally, increased winter air temperatures and precipitation totals over Belarus correspond to the shortening of the “air mass travel” distance between the North Atlantic cyclone centers and the city of Minsk [
62]. The influence of cyclone warm sectors increased, which led to a reduction in solid precipitation and an increase in liquid precipitation. As a result, mild and wet weather and winter runoff rose over recent decades.
With negative NAO indices, the long wave amplitudes increase and the meridional atmospheric circulation prevails. This atmospheric pattern is characterized by both the southern cyclones, which can also bring heavy precipitation to Europe, and, from the other side, inflows of cold Arctic air with an anticyclone.
The increasing climate aridity over eastern Europe in the warm season is controlled by atmospheric blocking in the Atlantic–European sector. An anticyclonic weather pattern disturbs westerly air flow in the middle latitudes, leading to a precipitation deficit around the blocking anticyclone and positive rainfall anomalies in adjacent areas [
63].
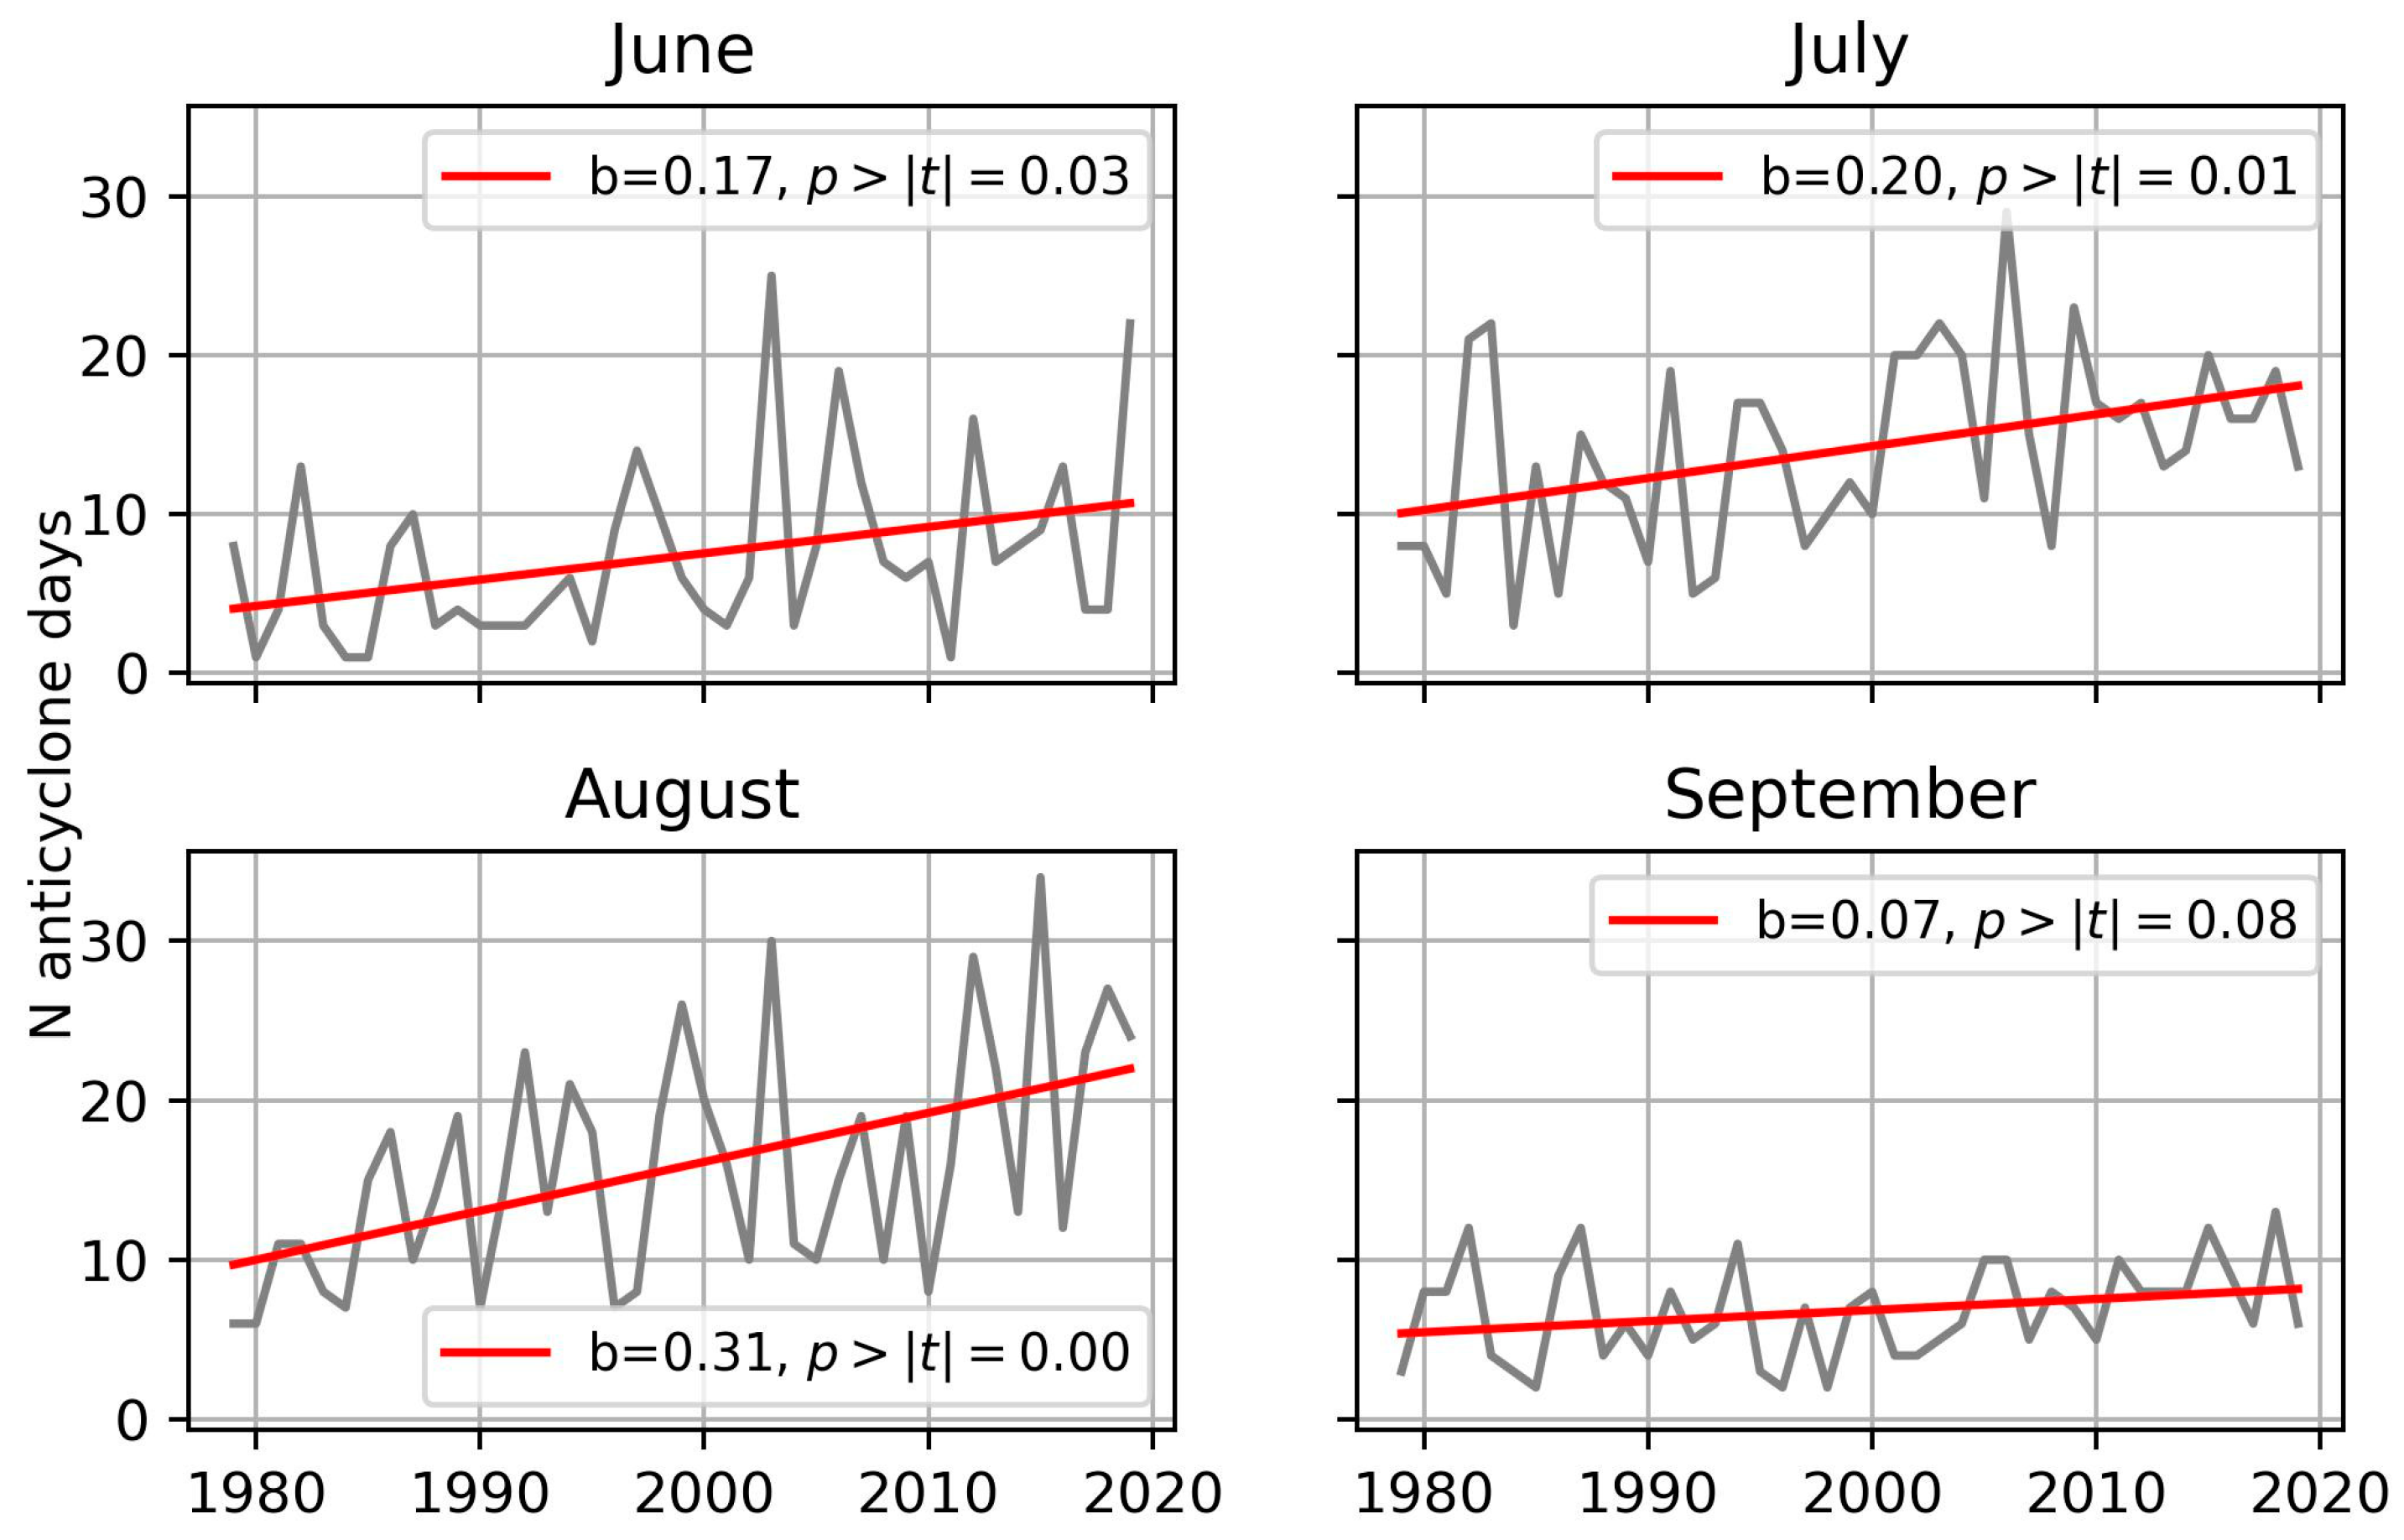
Figure 9 shows the dynamics of the number of days with anticyclone weather over eastern Europe (within 1500 km of Minsk). In the last ~40 years, there has been an increase in the anticyclone days in each of the warm months (IV–IX). However, for April and May, the changes do not exceed 1 day/month and are statistically insignificant. In the summer months, the anticyclone days have increased more remarkably, by 3–4 days/month in June and July (with an average of 4–13 days in June and 7–18 days in July), and by 7–8 days/month in August (on average, 8–20 days). These changes are statistically significant at the 0.05 level. In September, anticyclone days grew by 2 days/month.
An increase in the frequency of anticyclones and blocking processes in the atmosphere correlates with a decrease in the frequency of cyclones, which determine the weather conditions over eastern Europe in the summer season [
64]. In the last ~40 years, there was a decrease in the number of days with North Atlantic and Mediterranean cyclones in summer by 20–30%. This might be explained by a weakening of the zonal wind and an increase in the jet stream amplitude, influencing the increase in frequency of blocking [
65]. However, [
66] showed that the mechanisms behind such blockings in the atmosphere remain uncertain, since many dynamic processes are involved and significant internal variability masks any signals in observations.
3.8. Recent Changes in Neighboring Countries
In this sub-section, we compare the hydrological changes in Belarus with changes in neighboring countries. We use, for these comparisons, the findings of our colleagues from these countries over the past decade. Each research team used, for their analyses, the national data available for different periods of time. In particular, the last year of data that were available for their studies varies from 2010 to 2020. The geographic focus of our studies was Belarus, located, as mentioned earlier, in the center of eastern Europe, bordering Russia in the north and east, Ukraine in the south, Poland in the west, and Latvia and Lithuania in the northwest. Hydroclimatic changes in Belarus correspond well with changes in these neighboring countries. This means that:
The results in global perspective [
68] show that more than 60% of 433 major global river basins during 1985–2014 experienced significant decreasing trends in annual runoff at rates ranging from −0.3 to 0.15% per year for eastern Europe. In general, regional studies prove that there are no significant changes in annual streamflow or that the trends were weak in the last 30–40 years in Belarus and neighboring countries. Overall, the annual runoff and the total water resources of the Great East European Plain (European Russia) show a tendency towards a gradual increase by 0–10% per 10 years in 1950–2019 due to a general increase in humidity. However, in most of the catchments analyzed, such changes are statistically insignificant. In the upper reaches of the Don, the difference falls within the range of ±10% with no statistical significance, but further to the southeast, this decreasing tendency becomes stronger, reaching 25% in the outlet of the Don Basin. However, the rivers in the northwest of the Great East European Plain show a pronounced increase in annual runoff of 20–50% [
5].
The annual streamflow is decreasing in northern Ukraine [
69] because recent years in the country were dry [
48]. In Poland [
70], decreasing trends of −0.04 to 0.01 m
3/s per year dominate in the north of the country. These trends are very weak in the central part but, in 1981–2016, the annual runoff increased by 0.025–0.04 m
3 s
−1 y
−1 in the southern part of the nation close to The Carpathian Mountains. In contrast, for the 1956–2016 period, no trends were found at approximately half of the gauging stations scattered across Poland. Another study in Poland [
64] showed that annual outflows in the 1988–2020 period exhibited a decreasing trend by 15–20% for most rivers, but, before the warming in 1951–1988, there were mostly increasing flow trends. In the Baltic States, increasing trends of annual streamflow were detected in [
41]. However, a tendency towards a decrease in annual discharge in the southern Baltic catchments was also recognized in [
71] and [
72]. The Atlantic Multidecadal Variability and NAO together modulate precipitation over these watersheds and hence the river discharge into the Baltic Sea, which increased from 1970 and then, in the last 30 years, began to decrease [
73].
The most robust and significant streamflow changes in eastern Europe are established for winter and spring seasons. Positive dynamics of annual maximum discharge (
Qmax) dominate in the European part of Russia (Leningrad oblast and Southern Karelia) [
5], with discharges in excess of the maximal values with 10% exceedance probability recorded 2–3 times over recent decades [
74]. In western Russia, a decrease in
Qmax, mostly by 10–20%, has been observed in the 1950–2019 period, and for some catchments, the decrease was 20–50% [
5].
Further south, the rate of
Qmax decrease strengthens. In the upper reaches of the Oka River, it averages 20–50%; throughout the Don River Basin it was above 50%. According to [
74], for the basins of the Lower Volga, Don, and Dnepr, as well as in for the basins of most rivers in the southern part of the Oka basin,
Qmax decreased by 40–60% in 1979–1983, with a statistically significant decrease in its variance.
In the plain parts of Ukraine’s river basins, the maximum streamflow is characterized by a gradual increase from 1947 to 1980 [
8]. Thereafter, a constant decrease in maxima was observed at almost half of the catchments. This phenomenon can be attributed to increasing winter air temperatures, frequent thaws, and, consequently, the decrease in the water equivalent of snow cover, which plays a major role in nourishing the rivers of the national river basins and forms the greater part of the annual runoff during the spring flood period. On the other hand, these factors have led to increasing discharge during the winter low-water period [
69]. Study [
49] demonstrates the same tendencies in the Desna River catchment, located in the north of Ukraine close to the Belarussian border.
The winter runoff increased in Poland’s mountain catchments by 10% and in northeast Poland by as much as 30%. The 10 to 25% decrease in the share of spring runoff was clearly marked in catchments with the most severe climatic conditions in northeast Poland [
64]. In turn, in the 1970s and 1980s in Polish rivers, the winter low-water stages disappeared. This was associated with a remarkable increase in the winter flow [
7]. These changes indicate the noticeable impact of changes in the NAO intensity on the transformation of the characteristics of the flow regime of Polish rivers mainly in winter, spring, and summer.
A significant increase in winter river discharge and a tendency for decreasing spring floods have been reported for the east Baltic States (excluding Russia and Belarus) by Reihan et al. [
40]. Trends in the annual maximum discharges for the major rivers of the Baltic States (Daugava, Lielupe, Venta, Gauja, and Salaca) indicate a statistically significant decrease. Since the last BACC publication in 2015, there have been only a few studies devoted to past hydrological regime changes. For example, Arheimer [
75] studied the change in Sweden’s hydrological regime over the last 100 years and concluded that the observed anomalies in annual maximum daily flow were normally distributed within 30% of the mean values of the reference period. There were no obvious trends in the magnitude of high flows in the observed time series. Earlier spring snowmelt floods throughout northern and eastern Europe due to warmer temperature were established in [
10].
The summer average low flow and the minimum monthly summer discharges over the catchments in European Russia increased significantly in the 1978–2010 period when compared to the 1946–1977 period [
67]. The minimum monthly flow in the northern Russian rivers in the summer season varies from 15–25% in the lower reaches up to 30–50% in the middle reaches of the Northern Dvina and Pechora Rivers. The increase in minimum flow is less significant (15%), up to its decline in the middle reaches of the Don. However, in the upper reaches of the Don and its local tributaries, the increase in the minimum monthly water discharges grows by 50–70%.
As a result of long-term cyclic streamflow fluctuations, intra-annual streamflow redistribution occurred in Ukrainian rivers. For rivers on the plain, the dry phase versus the wet phase is characterized by lower discharges during spring floods and by higher discharges during summer–autumn low waters [
76]. According to the influence of climatic factors on the river runoff in Ukraine in recent decades, the summer and autumn periods with low rainfall and temperature increases caused decreased water storage during these seasons. Streamflow during the summer–autumn low-flow season in 2015, 2016, and 2020 was very low in Ukraine [
48].
Throughout Poland, summer runoff reduced by a maximum of 15–20%, and in autumn by 10–15% in 1988–2020 [
64]. The water balance of Greater Poland (i.e., the central western part of the country) is becoming negative, mainly because of a rapid increase in agricultural evaporation [
28]. As a result, in 1989–2020, there was a significant increase in the number of days with a low flow (
Q below the tenth percentile) detected in about two-thirds of Poland’s overall area. Polish scientists connect this increase in low flow days with changes in the NAO phase, the macro-circulation conditions, and artificial changes in the spatial distribution of areas drained by some Polish rivers [
50].
Studies in Lithuania do not reveal clear trends in rising dryness and extreme droughts before 2000 [
51,
77], but recent dry, warm summers are causing major changes in river runoff. For the three consecutive summers of 2018–2020, hydrological droughts were declared for the entire country [
78]. Since the 1980s, an increased aridity in the Nemunas River Basin has been observed between April and August due to a strong positive trend in evapotranspiration and a strong negative trend in precipitation [
79]. In the Baltic States in summer months, strong negative trends were found (decreasing streamflow and a shift towards drier conditions) [
17,
20,
80].
4. Conclusions
This study presents an overall picture (indeed, a mosaic) of current hydrological changes in eastern Europe in recent decades and helps to understand climate change impacts on the regional level as well as to interpret hydrological projections better. The study provides more detailed estimates for Belarus. It was possible to compare these estimates with the neighboring administrative areas of central eastern Europe because the main river catchments cross political boundaries and many rivers flow through several countries. A short overview of our findings is presented in
Table 3.
In general, we found that the main differences in hydrological changes are related to the annual discharges. Studies of precipitation changes over Europe during the past 75 years show that the eastern region, centered over Belarus, is characterized by small changes in annual precipitation and insignificant aridity trends in comparison to central and southern Europe. However, a frequency analysis of meteorological and hydrological droughts based on standardized precipitation and streamflow indices (SPI and SSFI) showed statistically significant increasing dryness trends over most of eastern Europe since the 2000s. Following [
28,
57], we speculate that the latest changes since the mid-1990s could be connected with the negative phase of the NAO, intensification of the meridional component of the atmospheric circulation (i.e., SCAND), and blocking processes that strengthened in the atmosphere over the European–Atlantic region.
These trends correspond to an onset of noticeable regional climate change with further warming intensifying after the 1990s. This change increased the frequency of thaws and winter floods in the cold season, caused an increase in the occurrence of extremely high rainfall values, and prolonged no-rain intervals during the warm season. The largest increases in aridity (a statistically significant decrease in the SSFI indices) were observed over most of Belarus in the past 30–40 years. During the 1990–2020 period, there was a two-fold increase in the frequency of dry periods in all river basins along the Black, Caspian, and Baltic Sea watersheds of central eastern Europe.
Over the several past decades, the winter–spring season has presented region-wide winter streamflow rises and spring maximal runoff decreases. These changes were caused by warm, wet winters associated mainly with positive NAO phases, resulting in frequent thaws and a decline in snow water storage in the river catchments before snowmelt.
In summer, we observed more spatial diversity in runoff tendencies. There was a similarity in the tendencies of summer flow increases in northwest Russia and Ukraine. However, some recent years were very dry in Ukraine, as well as in Belarus, Poland, and Lithuania. Meanwhile, in northeast Belarus, summer flood occurrence increased.
The main driver of current hydrologic changes is atmospheric circulation over the Euro–Atlantic area. In the cold season of the 1960–1990 period, a prevailing positive NAO phase correlated with temperature and precipitation increases in Europe, causing winter floods, which, for the Belarussian rivers, exceeded the snowmelt floods several times. Since 2000, we found high runoff rates here during the winter low-flow season without sharp floods and a continued decrease in maximal discharges.
In the warm period, there was a statistically significant increase in the number of days with anticyclonic weather over eastern Europe. This increased the dry period duration and the number of days with a relative humidity below 30%. However, at the same time, summer daily rainfall maxima grew by 20–25%.


