Review

Are Indicator Microorganisms Predictive of Pathogens in Water?

1
Department of Public Health and Pediatrics, University of Torino, Via Santena 5 bis, 10126 Torino, Italy
2
Department of Life Sciences and Systems Biology, University of Torino, Via Accademia Albertina 13, 10123 Torino, Italy
*
Author to whom correspondence should be addressed.
Water 2023, 15(16), 2964; https://doi.org/10.3390/w15162964
Submission received: 18 July 2023 / Revised: 10 August 2023 / Accepted: 15 August 2023 / Published: 17 August 2023
(This article belongs to the Section Water Quality and Contamination)

Abstract

:
The microbiological quality assessment of drinking water (DW) and drinking water sources (DWSs) is based on the detection of indicator microorganisms (IMs). However, the relationship between IMs and pathogens has been questioned, as pathogens have been detected even in the absence of IMs, and vice versa. Therefore, the aim of this review was to evaluate the reliability of IMs by analysing the correlation between the presence of IMs and pathogens in water. This review focused on studies that reported statistical analyses of the relationship between traditional and alternative IMs and enteric pathogens in DWSs (groundwater, surface water, and rainwater) and in DW. Additionally, the main DW guidelines and regulations, along with a focus on the application of Quantitative Microbial Risk Assessment (QMRA), were also reported. The overall analysis of publications revealed a controversial correlation, characterised by high spatiotemporal variability, indicating the impossibility of identifying a reliable IM for any specific pathogen or water type. The association was also influenced by numerous factors, such as intrinsic characteristics of microorganisms, seasonal variations, sample number, water sample volume, and the detection method used. In conclusion, the detection of IMs should be considered complementary to, rather than a substitute for, the detection of pathogens.

1. Introduction

Water safety and quality are essential for human development, well-being, and ecosystem health. Ensuring access to safe water is one of the most effective measures to promote health and reduce poverty. This is particularly crucial considering the diverse range of water uses, including aquaculture, agriculture, animal husbandry, food industries, and household activities, in addition to the fundamental roles of water in drinking, cooking, and personal hygiene [1]. These common anthropogenic activities, combined with extreme climatic events, have an impact on water pollution. In this context, monitoring water quality is essential to protect animals, the environment, and humans from a One Health perspective [2,3]. Specifically, the availability of clean and safe drinking water (DW) is essential for life and should be a human right. However, many people still lack access to improved drinking water sources (DWSs) and die from DW-related diseases. In 2020, billions of people did not have access to safely managed DW services (2 billion people), sanitation (3.6 billion people), and basic hygiene facilities (2.3 billion people). Among them, 367 million used unimproved sources, 122 million drank untreated surface water (SW), 494 million practised open defecation, and 670 million lacked handwashing facilities [4]. The World Health Organization (WHO) estimates that contaminated DW results in 485,000 diarrheal deaths per year [5]. Diarrhoea is currently the second leading cause of death among children under age 5, with most cases in low-income countries being due to just two pathogens: rotavirus and pathogenic Escherichia coli [6]. Waterborne diarrheal diseases occur less frequently in industrialised countries, thanks to water disinfection processes, hygienic-sanitary control activities, and quality standards established by regulations. Nonetheless, in 2021, seven European Union (EU) Member States reported 12 waterborne outbreaks associated with the consumption of tap water, including well water and potable water [7]. The outbreaks, for which the causative agent was identified, were caused by norovirus, Shiga-toxin-producing E. coli (STEC), and Campylobacter [7]. According to the Centers for Disease Control and Prevention (CDC), through the National Outbreak Reporting System (NORS), there were 54 waterborne disease outbreaks in 2021, with 15 of them associated with DW, accounting for 41% of reported cases (214/518), nearly 53% of reported hospitalisations (56/105), and 70% of deaths (7/10) [8]. While the majority of outbreaks (67%) were caused by Legionella, others were caused by Campylobacter, Pseudomonas, and norovirus [8]. Therefore, waterborne diseases caused by enteric pathogens remain a current issue worldwide.
The primary DWSs are groundwater (GW) and SW, such as rivers, lakes, and streams. However, considering the effects of climate change and the continuously increasing global demand for DW, the necessity for alternative DWSs has arisen over the past several years. Rainwater (RW) harvesting, among these alternatives, represents one of the simplest and most cost-effective options to implement [9]. Depending on the quality of these water supplies, the necessary water treatment methods to ensure a microbiologically safe end product may vary. Therefore, it is crucial for public health protection to test the microbiological characteristics of raw water and verify the absence of contamination in treated water distributed to the population [10]. Due to the challenges in directly monitoring pathogens in water, the microbiological quality assessment of DWSs and DW relies on the detection of indicator microorganisms (IMs), which are employed as quality standards in DW regulations [11]. In fact, Public Health Services in industrialised countries began adopting IMs for DW quality assessment, particularly the coliform group as an indicator of faecal contamination, as early as 1914. Over time, many countries have incorporated coliforms and other bacterial groups as official standards not only for DW but also for recreational bathing waters, wastewater discharges, and various food products [12]. The presence of IMs should indicate the potential contamination of DW by pathogens, while their absence should signify the likely absence of pathogens and a condition of safe DW. However, the detection of IMs in water has occurred even in the absence of pathogenic microorganisms, implying that the presence of IMs does not unequivocally indicate a significant health risk for the exposed population. This situation can be critical for DW treatment plant managers, who might be compelled to halt DW supply, causing difficulties for the affected community. Conversely, the detection of pathogens also occurred in the absence of IMs, posing the risk of supplying the population with actually contaminated DW. Consequently, the relationship between IMs and pathogens has been questioned for several years [13]. To safeguard human health from waterborne infections, understanding the correlation between IMs and pathogens is essential, as is evaluating the usefulness of IMs as quality standards in guidelines and regulations. From this perspective, this review analyses the correlation between IMs and waterborne pathogens in the primary DWSs (GW, SW, and RW), as well as in DW, with the purpose of investigating the validity of using IMs in water quality assessment. This paper focuses on the most commonly employed traditional and alternative IMs, providing descriptions of their characteristics, potential, and limitations. It also focuses on pathogens for which ingestion of contaminated water represents a transmission route. Furthermore, to emphasise the most essential IMs requiring monitoring to ensure the distribution of safe DW to the user population, some guidelines and standards for DW quality (WHO, Canadian and Australian guidelines, US Environmental Protection Agency (EPA) regulations and EU Directive 2020/2184) are reported. Finally, a focus on the application of the Quantitative Microbial Risk Assessment (QMRA), which can be useful in developing strategies to mitigate microbiological risk in DW, is presented.

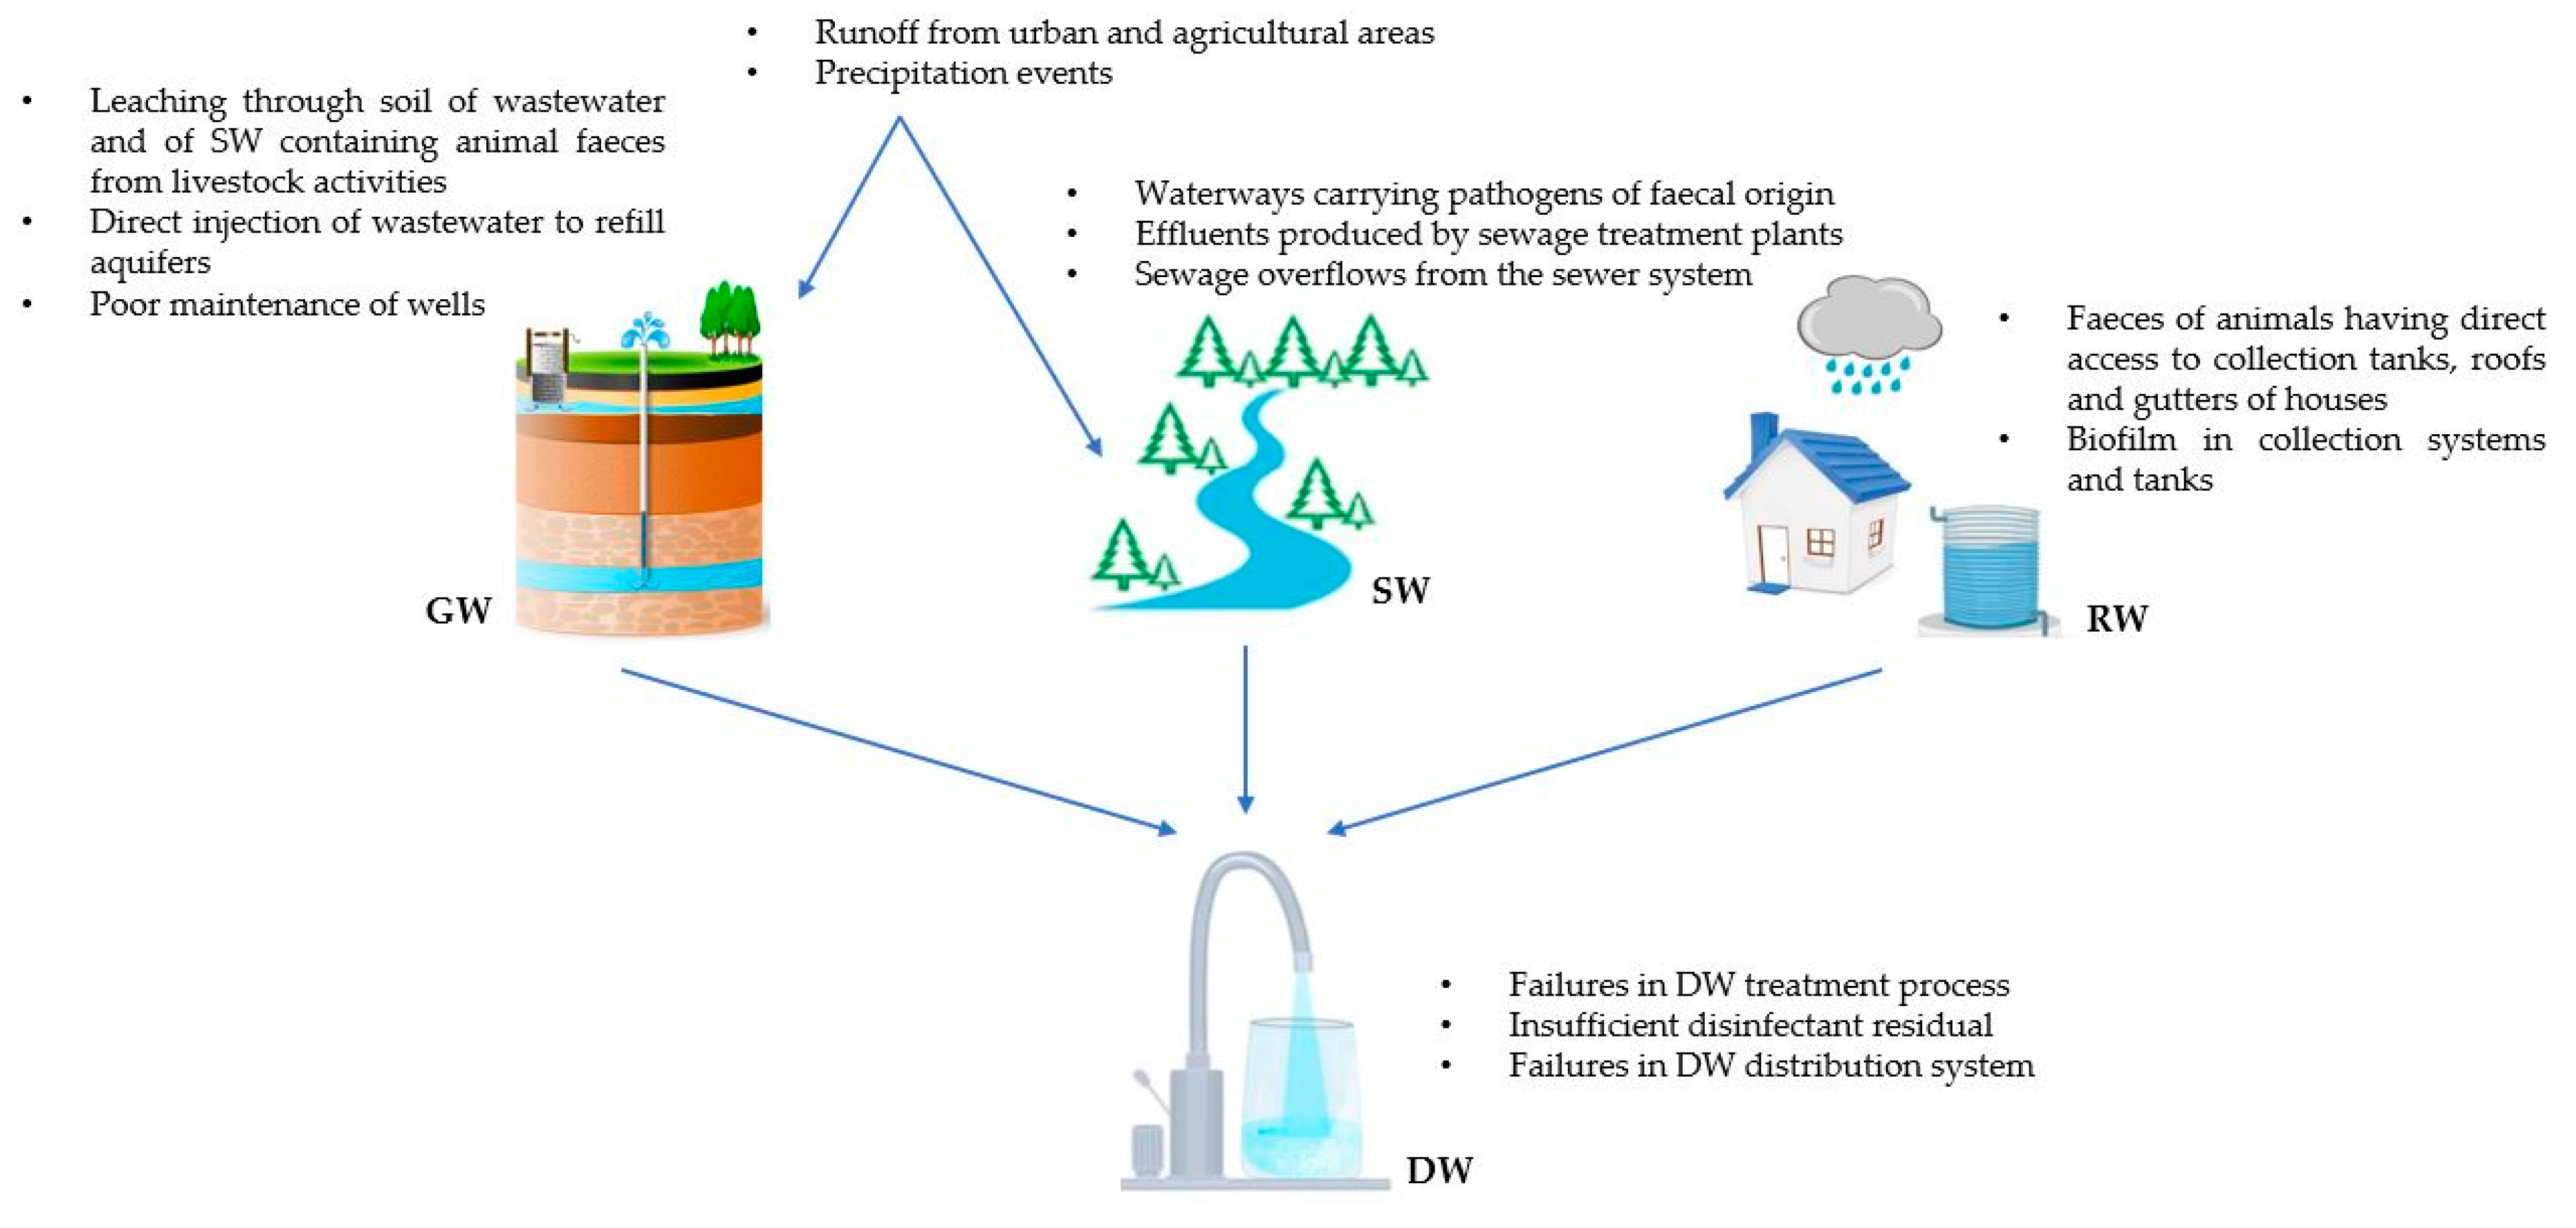
2. Origin of the Microbiological Contamination of DWSs and DW

The quality and microbiological characteristics of DW depend on several factors, including contamination of DWSs, the effectiveness of DW treatment, and the operation of distribution systems (Figure 1).
The contamination level of raw water directly influences the efficiency of DW treatment, subsequently impacting the quality of the produced DW. GW constitutes approximately 95% of world’s accessible freshwater [14] and contributes to half of the water withdrawn globally for domestic use [15]. It is frequently employed as a potable water source with minimal or no treatment due to its lower susceptibility to microbiological contamination compared to SW. However, GW can be faecally contaminated through various pathways, including leaching of wastewater and SW containing animal faeces from livestock activities, runoff from urban and agricultural areas, direct injection of inadequately treated wastewater to recharge aquifers, and poor maintenance of wells. Moreover, GW pathogen contamination may increase during precipitation events [14,16]. A multitude of enteric-origin microorganisms responsible for gastrointestinal diseases can be present in GW, such as Campylobacter, Entamoeba hystolitica, Salmonella, Giardia intestinalis, and human enteric viruses. Their stability and persistence in aquifers have been established in the literature [17].
SW constitutes another significant global source of DW. Pathogens can be introduced through various pathways, including other water bodies that may carry pathogens of faecal (human and animal) origin, effluents produced by sewage treatment plants (e.g., discharges from plants located upstream), surface runoff from urban and agricultural areas, and sewage overflows from the sewer system. Furthermore, extreme weather events that mobilise debris and sediment from riverbed (e.g., flooding or heavy rainfall) can pose a risk to public health [18]. Epilithic biofilms (i.e., microphytobenthic communities associated with stream substrates) and river sediments serve as reservoirs for microbial agents, including pathogens such as protozoans Cryptosporidium and Giardia, Shigella, and enteric viruses, including enteroviruses, adenoviruses, rotaviruses, and noroviruses [19]. Storm events can also lead to increased pathogen levels in lakes and reservoirs due to the influx of contaminated water from tributary rivers [20].
For several years, RW harvesting has become a widely adopted practice in both developed and developing countries, serving as a resource for drinking purposes. Generally, the population tends to perceive it as a source of safe DW, even without undergoing any treatment [21]. However, this assumption is not always accurate, as RW can carry multiple pathogens, including Aeromonas, Campylobacter (jejuni and coli), Mycobacterium, Salmonella, Shigella, Vibrio, Cryptosporidium, and Giardia. These microorganisms might originate from the faeces of animals (birds, insects, mammals, and reptiles) that have direct access to collection tanks or the roofs and gutters of houses. During precipitation events, stools from wildlife can be washed into the collection tanks [22]. Another potential source of contamination is the formation of biofilm within collection systems and tanks, particularly if they are not regularly and adequately cleaned and disinfected [23]. Biofilm is a complex matrix of microorganisms, polysaccharides, and proteins, providing pathogens with nourishment and protection against the effects of disinfectants. This environment enables them to multiply, consequently compromising water quality [24].
Since these DWSs can be contaminated, they must be properly treated to ensure that the DW supplied to the population does not pose a public health hazard. The most frequent failure in DW production concerns the disinfection process (e.g., malfunctions in the chlorination step or UV treatment) and the maintenance of a sufficient disinfectant residual in the water delivered to consumers [25]. The major purpose of the residual disinfectant presence is to prevent the regrowth of pathogens and the biofilm formation, thus preserving DW quality throughout the distribution network up to the farthest point of delivery to users. Therefore, the absence or insufficient concentration of disinfectant residual can result in the supply of contaminated water. The DW distribution system can also be susceptible to various failures, often due to inadequate pressure in pipelines, leakages, and ageing of infrastructure [26,27]. A negative pressure in the network can cause the backflow and the consequent contamination of water through leaks and cross-connections, while leakages in pipes can lead to faecal contamination because of sewage intrusion. Finally, corrosion and ageing of pipelines create favourable conditions for the growth of microorganisms; in fact, corroded pipes exhibit cavities on the surface that represent ideal sites for biofilm formation [24].

3. Role of the IMs for the Evaluation of DW Safety

To ensure that DW does not pose microbiological hazards to human health, it is essential to monitor its microbiological condition and verify the absence of pathogens. However, direct detection of all pathogens potentially present in DWSs and in DW is unfeasible for several reasons. The confirmed absence of a specific pathogen does not guarantee the absence of other pathogens or opportunistic microorganisms [11]. Additionally, there are not standardised detection techniques for all pathogens and the culture-dependent methods available for the direct detection of these microorganisms (i.e., multiple-tube fermentation technique, membrane filtration technique, standard bacterial cell culture methods, virus cultivation on cell cultures) are expensive and present certain disadvantages (e.g., labour-intensive procedures, extended lead times, and limited efficiency) [28]. Moreover, some of these methods exhibit low sensitivity, so they are unable to detect pathogens that, especially in cleaner water such as GW or DW, may be present sporadically and at low concentrations (e.g., human enteric viruses) [11]. Furthermore, culture-based methods are not able to detect the viable but non-cultivable (VBNC) state, which certain non-spore-forming bacteria may enter under stressful environmental conditions (e.g., E. coli, Vibrio cholerae, Helicobacter, Campylobacter) [28]. Similarly, these methods cannot identify viruses that are not cell-adapted and thus do not replicate on cell lines [29]. As a result, culture-based methods might underestimate the number of pathogens in a water sample, even risking declaring false negatives [30,31]. Subsequently, to address these challenges, molecular methods such as polymerase chain reaction (PCR), multiplex PCR (mPCR), real-time or quantitative PCR (qPCR), reverse transcription qPCR (RT-qPCR), and droplet digital PCR (ddPCR) were developed and rapidly became widespread, as they are faster, more efficient, and more sensitive [30,31]. However, such methods can also detect the genetic material from dead or damaged microorganisms, complicating the interpretation of results in terms of viability and infectivity of the microorganisms and, thus, of the real risk to human health [13]. Due to this limitation, molecular techniques are not recognised as analysis methods in DW regulations. More recently, additional culture-independent methods have emerged (e.g., DNA microarrays, microbial source tracking MST, and next-generation sequencing NGS). Nevertheless, these methods are expensive and require highly specialised personnel, currently limiting their use primarily to research purposes [28,30].
Considering all these issues, the assessment of the microbiological safety of water is carried out using IMs. The ideal IM should meet the following characteristics: (i) present in water whenever pathogenic microorganisms are present, (ii) occur at concentrations reflecting the degree of water pollution, (iii) survive in water similarly to pathogens, (iv) not pathogenic, (v) applicable to any types of water, (vi) exhibit stable characteristics over time, (vii) not proliferate in water, and (vii) detectable through simple, rapid, and cost-effective methods [32]. Such an IM is not known to date, but over time, various complementary indicators providing different information have been proposed (Table 1). Indicators of faecal contamination are the most frequently mentioned in the literature. They are microorganisms typically abundant in the intestine of humans and other warm-blooded animals (e.g., E. coli, intestinal enterococci) and they are easily detectable in water. The detection of these IMs is considered predictive of the presence of pathogens transmitted through the faecal–oral route. Process indicators are sought in DW since they can demonstrate the effectiveness of water disinfection process (e.g., heterotrophic plate counts and total coliforms for chlorine disinfection). Lastly, index and model organisms are groups or species of microorganisms that indicate the presence and behaviour of pathogens, respectively (e.g., E. coli is considered an index organism for Salmonella, while F-RNA coliphages are considered model organisms for human enteric viruses) [13].

3.1. Total Coliforms

Coliforms belong to the Enterobacteriaceae family. They are Gram-negative, lactose-fermenting, non-spore-forming, oxidase-negative bacteria capable of aerobic and facultative anaerobic growth. These bacteria are present in the gastrointestinal tract of humans and animals, but they can also be isolated from environments without faecal contamination (e.g., water from food industries and biofilms within the distribution network). In addition, they survive in the environment by becoming part of the normal bacterial flora in freshwater of temperate and tropical environments. Hence, total coliforms are not specific indicators of faecal pollution, but they function as operational indicators that can provide information on the general conditions of the DW distribution system. They are mainly used as indicators of the efficiency of DW treatments, and their presence is related to the deterioration of DW quality, due for instance to the phenomenon of microbial regrowth [33].

3.2. Thermotolerant Coliforms

The thermotolerant coliforms, also known as faecal coliforms, differ from total coliforms in their ability to grow at high temperatures; indeed, they produce acid and gas from lactose at 44.5 ± 0.2 °C. The group of thermotolerant coliforms is represented by microorganisms that inhabit the gastrointestinal tract of animals, thus serving as indicators of faecal contamination by warm-blooded animals. They exhibit a survival pattern similar to that of pathogenic bacteria. E. coli is the most prevalent thermotolerant coliform found in faeces, and its presence is seldom detected in the absence of faecal pollution. Other faecal coliforms, such as Klebsiella, Citrobacter, and Enterobacter, can grow in the environment and may be present even in the absence of faecal contamination. Consequently, thermotolerant coliforms are considered more specific indicators of faecal contamination than total coliforms, but less than E. coli [11].

3.3. Escherichia coli

E. coli is a rod-shaped, Gram-negative, lactose-fermenting bacterium belonging to the Enterobacteriaceae family. This microorganism is a member of the thermotolerant coliforms group and can produce indole from tryptophan and β-glucuronidase. E. coli is the most prevalent commensal in the intestinal tract of warm-blooded animals, where it lives naturally, and, through excretion of faecal material, it can reach the environment. Its detection in water is easy, thanks to the availability of rapid, easy-to-use, sensitive, and specific methods of analysis. Since E. coli is predominantly present in faeces, it is a microorganism widely and historically used as indicator of faecal contamination and of the possible presence of bacterial enteric pathogens. The indication provided by the presence of this microorganism is of recent faecal contamination, which may result from pollution of DWSs with human or animal excreta, DW treatment ineffectiveness, or DW distribution system failures [34].

3.4. Intestinal Enterococci

Enterococci are Gram-positive, facultative anaerobic, chain-arranged, oxidase- and catalase-positive bacteria. They were included within the Streptococcus genus until 1984, when they were classified as members of the Enterococcus genus, which includes more than 50 species, such as E. faecalis and E. faecium. Intestinal enterococci grow at the optimum temperature of 35 °C and live as commensals in the gastrointestinal tract of humans and other warm-blooded animals. Enterococci, along with E. coli, represent the most used indicators of faecal contamination because of their abundant presence in faeces; they are generally more abundant in faecal matter of animal rather than human origin. Enterococci have developed strategies of resistance to adverse environmental conditions; in fact, they are able to grow in environments with NaCl concentrations of 6.5%, at temperatures ranging from 10 to 45 °C, and at pH values of 9.6 [35]. They also exhibit increased resistance to dehydrating conditions and to chlorination, and they can survive for long amounts of time in the outdoor environment. These characteristics of resistance can be attributed to the thicker cellular wall typical of Gram-positive bacteria and their ability to form layers of biofilm in the DW distribution network, contributing to its deterioration and acting as a reservoir for other microorganisms. These characteristics make enterococci potential indicators of less recent contamination than E. coli and other coliforms, as well as of DW disinfection treatment efficiency. Although intestinal enterococci are commensal bacteria of humans and animals, some species can act as opportunistic pathogens, causing nosocomial infections because of their potential virulence factors and antibiotic resistance genes [33].

3.5. Heterotrophic Plate Count (HPC)

HPC, also known as total plate counts or colony counts, refer to the enumeration of heterotrophic microorganisms capable of growing on non-selective solid culture media without inhibitory or selective agents, and under defined cultivation conditions. HPC communities encompass a wide range of ubiquitous heterotrophic bacteria that naturally exist in various environmental matrices, as they use organic nutrients for growth. The effectiveness of DW treatments and the integrity of DW distribution systems are evaluated by the count of colonies grown at 22 °C, which represent the presence of microorganisms that are naturally found in the environment and, therefore, that are not related to faecal pollution. On the other hand, colonies grown at 37 °C indicate the presence of microorganisms originating from humans or animals [36]. Since the number of heterotrophs should be reduced by DW treatments, elevated colony counts or substantial increases in their numbers indicate DW quality deterioration due to treatment deficiencies, loss of disinfection residual, biofilm formation along the distribution network, or stagnant water conditions [37].

3.6. Clostridium perfringens and Its Spores

Microorganisms belonging to the Clostridium genus are spore-forming, anaerobic, and sulphite-reducing bacteria. Considering their ability to produce spores as forms of survival in adverse environmental conditions, clostridia possess high stability in water and high resistance to environmental stresses and to disinfection processes. C. perfringens is the representative species of this genus; it is part of the intestinal microbiota of humans and other warm-blooded animals and its origin is entirely faecal. C. perfringens and its spores are widely distributed in sewage and do not multiply in water environments. For these reasons, C. perfringens spores are used as indicators of remote or past faecal pollution and as surrogates for pathogens resistant to water treatment processes. Therefore, the presence of C. perfringens spores in DW could indicate contamination by protozoan cysts/oocysts, highlighting deficiencies in treatment and disinfection processes or possible recontamination of the distribution network [38].

3.7. Bacteroides spp.

Microorganisms belonging to the Bacteroides genus are Gram-negative, non-spore-forming anaerobes. They exclusively inhabit the intestinal tract of warm-blooded animals, where they account for a 1000-fold greater portion than coliforms and show lower survival rates in aquatic environments than coliforms. The use of these microorganisms as indicators of faecal pollution has shown limitations due to the difficulty of cultivation with traditional bacteriological methods. However, the advances in molecular methods allow for overcoming these problems, resulting in rapid detection and identification of these bacteria [39]. In addition, certain species of the Bacteroides genus are highly host-specific, which means they are found in a particular host organism and not in another. PCR methods have been developed to detect the genetic marker sequences specific for both Bacteroides and the host species (e.g., human- and bovine-specific Bacteroides 16S rRNA genetic markers), making it possible to distinguish and identify the source of faecal pollution in water (e.g., human or bovine) [40].

3.8. Coliphages

Bacteriophages or phages are viruses that exclusively use bacteria as hosts for their replication. Coliphages are bacteriophages that infect E. coli and closely related coliform bacteria, so they are found in the faeces of humans and other warm-blooded animals. Coliphages share numerous characteristics with human viruses, particularly in terms of composition, morphology, structure, and replication mechanism. As a result, they have been proposed as useful models or surrogates for evaluating the behaviour and resistance to treatment and disinfection processes of enteric viruses in aquatic environments [41,42]. Coliphages used in water quality assessment are divided into two main groups: somatic coliphages and F-specific coliphages. Somatic coliphages belong to the Myoviridae, Siphoviridae, Podoviridae, and Microviridae families and exhibit a wide spectrum of morphologies. They infect E. coli by attaching to receptors permanently located on the cell wall. They generally replicate within the gastrointestinal tract of warm-blooded animals but can also replicate in some aquatic environments. Because of their mode of replication and host specificity, somatic coliphages are excreted by most humans and animals and they are found in aquatic environments at higher concentrations than F-specific coliphages. F-specific coliphages, also called sex coliphages or male-specific coliphages, initiate infection by attaching to sex pili (F pili) produced by E. coli cells containing the F plasmid responsible for bacterial conjugation. Since F pili are produced only during the logarithmic growth phase at temperatures exceeding 30 °C, F-specific coliphages are unlikely to replicate in environments other than the gut of warm-blooded animals. F-RNA coliphages are a subgroup of F-specific coliphages containing a single-stranded RNA genome and belong to the Leviviridae family, comprising the two genera Levivirus and Allolevirus. F-RNA coliphages are excreted by a variable and generally lower percentage of humans and animals than somatic coliphages [43].
The presence of coliphages in DW indicates faecal pollution and the potential presence of enteric viruses. It can also highlight deficiencies in water treatment, as coliphages exhibit resistance to disinfection processes such as chlorination and UV radiation [10].

3.9. Methanobrevibacter smithii

Microorganisms belonging to the Methanobrevibacter genus are members of the Methanobacteriales order and belong to the Archaea domain. Some species of the Methanobrevibacter genus live in the digestive tract of animals, especially ruminants (e.g., M. acididurans and M. wolinii in sheep, M. gottschalkii and M. thaueri in horses and pigs, and M. ruminantium in ruminants in general), where they enhance the digestion of cellulose thanks to their metabolism of methanogenesis. The most prevalent and abundant species in the human intestinal microbiota, detected in more than 50% of the adult population, is M. smithii, which colonizes the cecum to rectum tract and employs H2 or formate to reduce CO2. Currently, M. smithii has only been detected in human faeces and not in the faeces of other animals. Owing to its host specificity and high abundance in the human gut, M. smithii may be a useful human-specific marker of faecal pollution in aquatic environments [44,45].

3.10. Pepper Mild Mottle Virus

Pepper mild mottle virus (PMMoV) is a plant-pathogenic (Capsicum spp.) positive-sense, single-stranded RNA virus that belongs to the family Virgoviridae and the genus Tobamovirus. PMMoV virions enter the human system through food, particularly via the consumption of peppers and processed products such as curry and hot sauce. Subsequently, these virions are excreted with faeces into the environment. Virions are extremely stable, withstanding standard food processing methods and various environmental conditions, and retaining their infectivity for plants after passage through the human gut, within which they do not replicate [34]. PMMoV has been identified as the most abundant virus excreted in the faeces of a wide percentage of healthy adults (105–1010 copies/g of faeces) and has been detected at high concentrations in raw sewage throughout the world. In addition to wastewater, PMMoV has also been identified in DWSs and irrigation water and appears to be more persistent in aquatic environments than other viruses [46]. Despite being widespread in human faeces, PMMoV has rarely been detected in animal faecal samples (e.g., those from chickens, seagulls, geese, and cows) and at 3–4 log lower concentrations than in human faeces. For all these characteristics, PMMoV has recently been proposed as a potential viral indicator of human faecal pollution in aquatic environments and to evaluate the efficiency of DW treatment processes. However, further studies are needed to assess whether different food preferences and ecological distribution of host plants may influence the presence and abundance of PMMoV in different geographical regions [47].

4. Analysis of the Relationship between IMs and Pathogens in DWSs and in DW

The search for articles evaluating the relationship between IMs and pathogenic microorganisms was limited to the most common DWSs (i.e., GW, SW, and RW) and to the most widely used traditional and alternative IMs (i.e., total and thermotolerant coliforms, E. coli, enterococci, HPC, C. perfringens and its spores, Bacteroides spp., coliphages, M. smithii, and PMMoV). Only articles that met the following criteria were chosen: (i) publication year from 2000 onwards, (ii) water analysed used as DW or to produce DW, (iii) statistical analysis of the correlation between IMs and pathogens, and (iv) analysis of the IMs correlation with pathogens for which contaminated water ingestion represents a transmission route.
To categorize studies by the type of water analysed, untreated raw water intended for DW production or directly consumed as DW was considered as a DWS and classified as GW, SW, or RW depending on its origin. Water that had undergone any form of treatment was classified as DW.

4.1. Groundwater

Table 2 shows the studies that evaluated the correlation between IMs and pathogens in GW.
E. coli and total coliforms were the most frequently tested indicators (6/6 and 5/6 studies, respectively), followed by HPC and F-RNA coliphages (2/6), enterococci, human Bacteroides, and PMMoV (1/6). However, it should be noted that in one of the six studies E. coli was not considered for correlation with pathogens, as it was detected in only 3 out of 964 samples [48]. Moreover, in other studies, authors did not provide information on possible correlations for some of the analysed indicators (HPC in De Giglio et al. [50]; total coliforms and F-RNA coliphages in Haramoto et al. [52]). Although evaluated in a single study, the only IMs that significantly correlated with all the pathogens they were related to were enterococci [50] and human Bacteroides [48]. However, it is important to emphasise that for human Bacteroides the correlation with pathogens was statistically significant when considering the total number of samples, but not when considering individual wells [48]. The only indicator that consistently showed no correlation with pathogens was PMMoV, but again the association was assessed in only one study [48]. Among the remaining indicators (i.e., E. coli, total coliforms, HPC, and F-RNA coliphages), correlation was significant with some pathogens but not with others. Certain specific indicator–pathogen pairs were evaluated in multiple studies. Of these, only total coliforms and Salmonella always displayed a significant correlation [48,50]. Surprisingly, this association concerns a pathogen typically of faecal origin and a non-specific indicator of faecal contamination. In contrast, the relationship between E. coli and Helicobacter, both of faecal origin, yielded contradictory results, with E. coli showing a significant correlation with H. pylori for Baker and Hegarty [53] but not with Helicobacter for Richards et al. [49]. Helicobacter can survive in water environments by entering a VBNC state, which also confers high resistance to traditional chlorine disinfection of water [54]. These characteristics could therefore explain the lack of correlation with total coliforms and E. coli, which are more susceptible to the effects of disinfectants. The correlation between total coliforms and rotavirus was also controversial [48,51]. This result can be expected, as these are microorganisms with profoundly different characteristics and dissimilar origins (total coliforms can be of faecal or environmental origin, whereas rotaviruses are totally of faecal origin).
One aspect that plays an important role in assessing the correlation between IMs and pathogens is the number of samples on which the association is assessed. The studies considered for GW presented a high heterogeneity in sample size (ranging from n = 9 to n = 1656) (Table 2), which may have influenced the statistical analysis of the correlation. In particular, two studies analysed a relatively small number of samples (n = 9 [52] and n = 22 [53]).

4.2. Surface Water

Studies that assessed the correlation between IMs and pathogens in SW are shown in Table 3.
E. coli was the most frequently tested indicator (9/15 studies), followed by C. perfringens spores and somatic and male-specific coliphages (7/15), total and faecal coliforms (5/15), Bacteroides (4/15), M. smithii, and PMMoV (1/15). No indicator correlated with all the pathogens it was related to. In fact, all IMs showed statistically significant associations with some pathogens but not with others. Several indicator–pathogen pairs were evaluated in more than one study.
As expected, total coliforms, faecal coliforms, and E. coli showed uncertain results regarding their association with protozoa Giardia and Cryptosporidium [58,61,63,66,67,68,69], as these are microorganisms that differ greatly on a physiological and phylogenetic level. Moreover, temporal and site-specific variations in protozoa concentrations may not coincide with those of faecal indicators, as they result from different sources and loadings of the microorganisms in SW. In fact, although they are all of faecal origin, not all animals carry or are infected by protozoa, while faecal coliforms—and, in particular, E. coli—are common commensals of the gastrointestinal tract of warm-blooded animals, where they are present in high concentrations. Consequently, it can be assumed that the spread of cysts/oocysts is concurrent with that of faecal coliforms, but not the reverse [66]. This underscores the importance of establishing appropriate sampling frequencies and methods to account for the short-term spatial fluctuations in protozoan presence, ensuring the detection of potential contamination in the DWS [61]. Differences in the fate and transport of these microorganisms in SW should also be considered; unlike faecal coliforms and E. coli, cysts and oocysts do not tend to aggregate in suspension, remaining as single cells and thus presenting a lower sedimentation rate. Moreover, at 15 °C they can persist in the aquatic environment for months, whereas faecal coliforms, such as E. coli, have a much higher decay rate [66]. Finally, the ability to form cysts and oocysts gives protozoa high resistance to environmental stresses and to all DW treatment processes, including disinfection. This resistance is not characteristic of coliform indicators, which can be eliminated in a higher percentage and more rapidly by disinfection processes. These considerations may also explain the lack of correlation observed with enterococci and Bacteroides, which was never statistically associated with Giardia and Cryptosporidium [58,63,67]. A very critical result, however, was the contradictory correlation between protozoa and C. perfringens spores. Given its ability to produce spores resistant to adverse environmental conditions and disinfection processes, as well as its kinetics resembling those of the two parasites, C. perfringens is commonly employed as a surrogate for Giardia and Cryptosporidium. The correlation was statistically significant in three studies for Cryptosporidium [55,63,69] and in as many for Giardia [55,68,69]. However, it should be noted that in one of the studies [55] the association between indicator and pathogen concentrations was significant with ANOVA regression analysis but not with Spearman’s rank correlation. Furthermore, in another study, the correlation was statistically significant when considering the total number of samples, but not when considering the individual sampling site [68]. Finally, Edge and colleagues [63] found a statistically significant correlation for only one of the three sampling sites. In contrast, C. perfringens did not correlate with Cryptosporidium in one study [67] and with Giardia in two studies [63,67]. This result could be due to the difference between the volumes of water analysed, as highlighted by Edge and colleagues [63]. In fact, standard methods for detecting C. perfringens, as well as other bacterial IMs, are based on filtering 100 mL of sample, whereas analysis for protozoa requires much larger volumes of water (10–1000 L).
The association between Bacteroides and thermotolerant Campylobacter, evaluated in two studies, was never found to be statistically significant. In one study [56], C. jejuni did not correlate with either the universal/total Bacteroidales marker (BacUni) or the human- and avian-associated markers (HF183 and FGD, respectively). The lack of association with human-associated Bacteroides might be attributed to the presence of poultry farms around the sampling sites, which serve as the primary source of the pathogen. The different persistence in aquatic environments could instead account for the lack of correlation with total and avian-associated Bacteroides; Campylobacter can survive for more than four months in water, entering a VBNC state and finding protection within protozoa. In contrast, Bacteroides have lower survival rates than coliforms. These same considerations may explain the absence of correlation found in the other study [63], in which Campylobacter did not correlate with the HF183 human Bacteroidales marker. In this case, however, it should be noted that Campylobacter was only detected in 3 out of 94 samples by culture method. Given Campylobacter’s ability to enter a VBNC state, this result may represent an underestimation of the actual occurrence and may have influenced the correlation with Bacteroidales detected by molecular methods, as reported by the authors themselves.
E. coli and enterococci were always significantly correlated with Salmonella spp. [55,59,64]. This is an expected result, as both the IMs and the pathogen are typically of faecal origin. Moreover, they were all detected by culture-based methods, which may have favoured the presence of the association. However, it should be noted that, in one of the studies [55], the association between indicator and pathogen concentrations was significant with ANOVA regression analysis, but not with Spearman’s rank correlation. As reported by the authors, this discordance could be due to the limited number of samples (n = 22) and sampling sites (n = 5).
Due to the differences between bacteria and viruses, the presence of bacterial and viral pathogens is usually assessed by looking for their corresponding IMs. Despite this, the correlation between bacterial pathogens and viral indicators, as well as between viral pathogens and bacterial indicators, was also evaluated in many of the studies considered, with occasionally unexpected results. The relationship between Salmonella spp. and coliphages (both somatic and male-specific) was investigated in two studies [59,64]. In one study, a statistically significant correlation was found with both types of coliphages, probably due to the use of culture methods for both pathogen and indicator detection and to the high positivity rate of the samples (86%, 97%, and 94% for Salmonella spp., somatic coliphages, and F-coliphages, respectively) [59]. In the other study, however, Salmonella spp. correlated significantly with somatic coliphages, but not with F-coliphages [64]. According to the authors, the lack of association with male-specific coliphages could be due to the low concentrations detected for these indicators compared to those of somatic coliphages and Salmonella spp. Indeed, not only the positive detection rate, but also the concentrations of the microorganisms in the samples may influence the correlation. Total coliforms, E. coli, enterococci, C. perfringens, and Bacteroides have been related to human enteric viruses in more than one study. As expected, for total coliforms, E. coli, and Bacteroides no clear correlation was found. In one study [58], all three IMs demonstrated significant associations with total human enteric viruses detected by molecular methods (Aichi virus 1, enteroviruses, human cosaviruses, human adenoviruses, noroviruses GI and GII, group A rotaviruses, and saliviruses). However, this correlation was not evident with cultivable enteric viruses considered as a whole in another study [63]. The detection method used could partially explain the difference in the results obtained for Bacteroides (detected by molecular method in both studies), but not for E. coli (detected by both culture and molecular method in the first study and only by culture method in the second study) and for total coliforms (detected only by culture method in both studies). However, it should be noted that, in the first study [58], the correlation result may have been influenced by the small number of samples analysed (n = 18) (Table 3). Furthermore, in contrast to the findings of Edge and colleagues [63], total coliforms (measured by culture method) showed a statistically significant correlation with cultivable human enteric viruses in a third study [69], further underlining the uncertainty in using these IMs as reliable tools for monitoring the presence of human enteric viruses in the DWS. On the contrary, enterococci [58,63] and C. perfringens [63,69] surprisingly displayed statistically significant correlations with enteric viruses. This result could be explained by the concordance of the detection method used for IMs and pathogens (molecular in Tandukar et al. [58]; cultural in Edge et al. [63] and Payment et al. [69]). Furthermore, the greater resistance in aquatic environments of clostridia, due to spore formation, and of enterococci, due to the thicker cellular wall of Gram-positives, compared to the other bacterial IMs, might have contributed to the correlation. However, it is important to mention that, as pointed out earlier, Tandukar and colleagues [58] analysed a small number of samples (n = 18), while Edge and colleagues [63] found a statistically significant correlation for only two out of three sampling sites.
Although coliphages have been proposed as surrogates for enteric viruses, their correlation with viral pathogens in the studies reviewed has yielded conflicting or inconclusive results. Somatic coliphages have never shown any association with astroviruses [59,60,62], reoviruses [65], noroviruses GI and GII, and rotaviruses [59,60,62,65]. They were significantly associated with enteroviruses in only one study [65] and with adenoviruses in one out of three studies [55]. Notably, in the latter study, the correlation was statistically significant with ANOVA regression analysis but not with Spearman’s rank correlation. Male-specific coliphages were correlated with enteroviruses but not with reoviruses; however, these associations were evaluated in only one study [65]. With all the other enteric viruses (i.e., adenoviruses, astroviruses, GI and GII noroviruses, and rotaviruses), F-specific coliphages showed conflicting results, with presence of correlation in some studies and absence of correlation in as many studies [55,59,60,62,65]. All the authors of these studies agree in attributing the cause of this ambiguity of correlation to the use of different detection methodologies for the two targets (culture-based for indicator viruses and molecular-based for pathogenic viruses), which obviously have a different detection efficiency and sensitivity. Therefore, the authors report that employing molecular detection for coliphages could provide more accurate results concerning the presence of human enteric viruses in SW. Furthermore, molecular methods may allow the specific identification of human coliphages, distinguishing the origin of faecal pollution; in fact, the GII and GIII serological groups of F-specific coliphages are human-specific, whereas the GI and GIV serological groups are animal-specific. This differentiation may also provide a better association with human enteric viruses, as found by Vergara and colleagues [60].

4.3. Rainwater

Table 4 shows the studies that evaluated the correlation between IMs and pathogens in RW.
Enterococci and E. coli were the most frequently tested indicators (6/6 and 5/6 studies, respectively), followed by total coliforms (2/6), faecal coliforms, HPC, and C. perfringens (1/6). No indicator was significantly correlated with all the pathogens with which it was related to, while C. perfringens was the only indicator that never showed any correlation with pathogens [74]. The other IMs displayed statistically significant associations with some pathogens but not with others. All indicator–pathogen pairs evaluated in multiple studies showed an ambiguous or absent correlation. E. coli was never found to be associated with Aeromonas hydrophila [73,74] and Mycobacterium avium [71,72], whereas it was correlated with Mycobacterium intracellulare in one study [72]. Enterococci were never found to be associated with the presence of M. intracellulare [71,72] and Salmonella spp. [74,75]. They were correlated with M. avium in one of two studies [72] and with Aeromonas spp. in one study [75] but not with A. hydrophila in two studies [73,74]. These results are unexpected and raise concerns, as they bring into question the reliability of faecal contamination indicators in predicting the presence of enteric pathogens and assessing microbiological water quality. Several factors may have influenced the assessment of the association, including the predominant use of culture-based methods for indicator detection and molecular methods for pathogen detection. In the only study in which culture methods were also used to detect pathogenic microorganisms, a low prevalence was obtained for Salmonella spp. and Cryptosporidium spp. (1% and 2%, respectively). This is likely due to the lower sensitivity of these methods and their inability to detect VBNC forms, leading to an underestimation of both the presence and concentrations of pathogens. In fact, in this study, IMs only correlated with Aeromonas spp., which exhibited the highest prevalence (20%) [75]. The analysis of different volumes of water samples, associated with different detection sensitivities and recovery efficiencies, may have also influenced the indicator–pathogen correlation, as reported by Ahmed and colleagues [74]. Indeed, much larger volumes of water are usually analysed for pathogens than those analysed for IMs, due to the spatiotemporal variability of pathogen contamination and their generally lower concentrations. Finally, it cannot be overlooked that Aeromonas and Mycobacterium avium complex (MAC), to which M. avium and M. intracellulare belong, are ubiquitous in DW distribution systems and RW harvesting systems, as they are associated with the biofilm of pipes and tanks, within which they proliferate and find protection from adverse conditions, such as low temperatures and high chlorine levels. Consequently, they are highly resistant to water disinfection treatments, unlike E. coli and enterococci, for which chlorination is ineffective only in the event of a malfunction.

4.4. Drinking Water

When the DW treatment process works properly, pathogenic microorganisms should be absent and IMs, if present, should be detected at low frequencies and concentrations. In such a situation of no or low contamination, it is difficult to perform a statistical evaluation of the correlation between IMs and pathogens [32]. This may explain the paucity of studies concerning the correlation between IMs and pathogenic microorganisms in DW. Indeed, only one study was found in literature that statistically evaluated the association between IMs and pathogens transmitted through the ingestion of contaminated water. Vesga and colleagues [57] detected total coliforms, E. coli, and spores of sulphite-reducing clostridia by culture methods and H. pylori by the molecular method in 155 chlorine-disinfected DW samples from the city of Bogotá, Colombia. Statistical analysis (Spearman correlation and Tau-b Kendall correlation) did not find a correlation between the concentrations of IMs and the presence/absence of H. pylori DNA. As already reported for other studies, the lack of association may be due to the different detection methods (cultural vs. molecular) used for the IMs and the pathogen. Furthermore, as previously highlighted, the ability of H. pylori to survive in water environments by entering a VBNC state resistant to chlorination could be a further factor that may influence the correlation, particularly with total coliforms and E. coli.

5. Discussion

Based on the literature research carried out, total coliforms and E. coli were the only IMs researched in all types of water (i.e., DWSs and DW), to which enterococci can be added only for DWSs. No indicator–pathogen pairs were evaluated in all water types. The pairs that exhibited an ever-present correlation or an ever-absent correlation in at least two water types are shown in Table 5.
It is important to acknowledge that the correlation for the majority of these pairs was assessed in only two articles, highlighting the need for additional research to confirm these associations. Furthermore, it would be desirable to validate these correlations also in the other types of water. Except from DW, for which only one study meeting the criteria of this review was found in the literature, the correlation of certain indicator–pathogen pairs was assessed in all DWSs (Table 6).
All of these pairs showed conflicting results between different DWSs, indicating that it does not seem possible to identify any indicator among those evaluated that is valid and reliable for all water types considered in this work. Furthermore, as shown in the previous paragraphs, the correlation between certain IMs and certain pathogens was highly variable even in the same type of water and geographical region. Indeed, water bodies located in close proximity may still have sufficiently different quality characteristics to yield different results regarding the association between a given indicator and a given pathogen [55,61,63,66,68]. This does not allow generalising the use of an indicator not only between different types of water, but also within the same one.
A second aspect that came out of the studies considered in this review is the impossibility of identifying an indicator that correlates reliably with all pathogens, as the correlation depends on the indicator and the pathogen considered. Indeed, in many studies, a given indicator did not correlate with all detected pathogens, but only with one or a few. For instance, HPC was correlated with Mycobacterium but not with Helicobacter in GW [49], or male-specific coliphages were associated to noroviruses GI and GII but not to adenoviruses and rotaviruses in SW [62], or E. coli was correlated with M. intracellulare but not with M. avium in RW [72]. Additionally, the association in some cases was even contradictory, as it was sometimes present and sometimes absent between the same indicator and the same pathogen, leading to conflicting opinions on the reliability of the specific indicator. For instance, total coliforms were correlated with Cryptosporidium in two studies [48,69] but not in other three studies [58,63,75], or enterococci were associated to Salmonella spp. in four studies [50,55,59,64] but not in another two studies [74,75]. An uncertain correlation between pathogens with faecal–oral transmission and IMs that are not exclusively of faecal origin may be expected, considering the different origin of the microorganisms. In contrast, a contradictory correlation between IMs and pathogens both of faecal origin, which should exhibit similar characteristics and behaviour, is more problematic and concerning. In this regard, it should be noted that this ambiguity was also evident for C. perfringens (and its spores) and coliphages (somatic and male-specific), proposed and used as surrogates for protozoa and enteric viruses, respectively. C. perfringens showed inconsistent correlation with both Cryptosporidium and Giardia in SW and RW [55,63,67,68,69,74] and coliphages exhibited a controversial or absent association with adenoviruses, astroviruses, noroviruses GI and GII, reoviruses, and rotaviruses in GW and SW [51,52,55,59,60,62,65].
Another crucial aspect to emphasize is that, in some studies, pathogens were detected in samples with either no or low concentrations of all or some of the tested IMs [64,69,74]. This reveals the impossibility of identifying a minimum concentration or threshold value that reliably represents the presence or absence of pathogens. It also underscores that testing for a sole indicator does not seem to be sufficient to provide correct information on water contamination and the presence of pathogenic microorganisms.
The analysis of the studies included in this review revealed numerous factors that may influence the correlation between IMs and pathogenic microorganisms:
  • The intrinsic characteristics of microorganisms, which, although similar, are not identical and therefore may present physiological differences, different decay rates, and different survival and multiplication capacities in the water environment [40];
  • Seasonal variations, which affect the sources of water contamination and thus the presence and concentration of both IMs and pathogenic microorganisms (e.g., extreme weather events, urban discharges in tourist cities) [71];
  • The high temporal and spatial fluctuation characterising pathogenic microorganisms, in contrast to IMs, in water environments, due to biotic and environmental factors, intrinsic characteristics of the pathogen, and its circulation in the population. This transient nature of pathogen occurrence in water means that correlation with IMs may exist at one point in time and not at another, even at the same geographic site [32]. In such a situation, the frequency of sampling becomes paramount to capture the moment of contamination [61];
  • The fact that, especially in waters that are usually not heavily contaminated such as GW or DW, pathogens may not actually be present or may be present below the detection limit of the analytical method (e.g., human enteric viruses), which makes it difficult to assess the relationship with IMs [32];
  • The number of samples on which the association is evaluated, as numerically large samples allow for smaller errors and thus greater reliability of the results of applied statistics. Several studies considered in this review have evaluated a small number of samples (n ≤ 22) [52,53,55,58,67]. The correlations found in these studies clearly have a different weight than those assessed on larger datasets (e.g., n = 1656 [50]; n = 964 [48]; n = 415 [69]), so it would be necessary to expand the sample size to validate the indicator–pathogen correlation;
  • The volume of water sampled, as microorganisms in water environments are not uniformly distributed. This means that taking a few large-volume samples or many small-volume samples may lead to different results. Typically, the detection of pathogens requires large volumes of water (10–1000 L), because of their transient presence and generally lower concentrations than those of IMs. In contrast, the detection of IMs is normally carried out on 100–250 mL [66,74];
  • The use of different detection methods (culture or molecular), characterised by different efficiency, sensitivity, and specificity, for the detection of IMs and pathogens may compromise correlation evaluation. Typically, indicator detection, especially of traditional indicators but not only, is based on the use of simple, rapid, and cost-effective culture techniques. Conversely, for most pathogens, the available culture techniques are expensive, difficult, time-consuming, and have low efficiency. For these reasons, pathogenic microorganisms are usually identified by molecular methods (PCR, qPCR, RT-qPCR). In several studies described in this work, a better ability of IMs to point out pathogen presence/absence was found when both targets were searched using the same detection method (i.e., molecular method) [59,60,62,65].
Finally, it may be interesting to describe the approach used in some studies to determine whether IMs are predictive of pathogen presence/absence. This methodology consists of using logistic regression to derive performance metrics (i.e., sensitivity, specificity, positive and negative predictive value) of IMs. This analysis evaluates a different aspect of the association between IMs and pathogens than the statistical tests commonly used to relate concentrations or the presence/absence of IMs and pathogens (e.g., Spearman rank correlation). Stokdyk and colleagues [48] applied this approach for both total samples and individual GW wells. At the sample level, all IMs showed high negative predictive value and specificity but low positive predictive value and sensitivity, demonstrating a good ability to predict the absence of pathogens rather than their presence. These associations were significant for all IMs (i.e., total coliforms, Bacteroides) except PMMoV (Table 2). Although ideally both characteristics (sensitivity and specificity) are important for an indicator, for public health protection purposes, it would be preferable to minimize false negatives (high sensitivity) so as not to provide or use potentially contaminated water. At the well level, no association was found to be statistically significant. Ferguson and colleagues [51] assessed the predictive ability of IMs by considering as reliable only those that could correctly identify all GW wells containing one or more pathogens (100% sensitivity) and more than 50% of wells without pathogens (≥50% specificity). The outcomes of this analysis showed that all IMs (total coliforms, culturable and molecular E. coli, and F+ RNA coliphages) were effective in predicting the presence of pathogenic E. coli. For Shigella, all IMs except culturable E. coli were reliable. Only molecular E. coli and F+ RNA coliphages were predictive of the combined presence of pathogenic E. coli and Shigella. No indicator was effective in predicting the presence of Vibrio or rotavirus. Once again, coliphages, which have been proposed and used as viral indicators of faecal contamination and as model organisms of human enteric viruses, did not correlate with rotaviruses (results of Spearman rank correlation shown in Table 2) and could not even predict their presence. Bailey and colleagues [55] classified the results of binary logistic regression into true positives (both indicator and pathogen are present), true negatives (both indicator and pathogen are absent), false positives (indicator present and pathogen absent) and false negatives (indicator absent and pathogen present). Each pathogen (Salmonella spp., Cryptosporidium, Giardia, and adenovirus) was associated only with its respective indicator (total coliforms, E. coli, and enterococci as bacterial indicators; C. perfringens as protozoan surrogate; coliphages as viral indicators) (Table 3). The results of the analysis showed a high rate of true positives for the bacterial IMs–Salmonella spp. and C. perfringens–protozoa associations (50–80%), which, however, were not matched by a high rate of true negatives. In addition, both associations showed a non-negligible false negative rate, which is an undesirable result as it provides a false indication of SW safety. Regarding viruses, the coliphage–adenovirus association presented similar rates of true positives (20–35%) and true negatives (10–35%) and relatively high rates of false positives (20–40%). Since the purpose of IMs is to underline the possible presence of pathogens so that more targeted analysis and more stringent treatment can be carried out, a high rate of false positives is not necessarily a problematic result. Lastly, Payment and colleagues [69] highlighted with logistics regression analysis that the probability of detecting one of the pathogens (human enteric viruses, Cryptosporidium, and Giardia) was very high at high levels of IMs (total and faecal coliforms, and C. perfringens) (Table 3). However, pathogens were frequently detected in SW samples with low indicator levels, making it impossible to identify a level of IMs at which the probability of finding a pathogen was zero.

6. DW Guidelines and Quality Standards

6.1. WHO Guidelines

For numerous years, the microbiological safety of DW was exclusively verified through the application of retrospective monitoring of the distributed water. However, it has become evident that the most effective means of protecting public health in relation to DW consumption is the adoption of a comprehensive system based on risk analysis applied throughout the entire DW supply chain. The WHO, in its Guidelines for Drinking-Water Quality [10], proposes a preventive approach based on risk assessment and risk management from catchment to consumer, known as the Water Safety Plan (WSP). This holistic and integrated strategy can be applied to all types of water supply systems and should be declined depending on the environmental, social, economic, and cultural conditions at the national or local level. The main objective of the WSP is to ensure consumer health protection by preventing or reducing contamination of DWSs, eliminating or minimising possible hazards through treatment processes, and preventing recontamination during distribution and consumption. The WSP approach must be developed by a multidisciplinary team and can be schematically summarised with three key components: water system analysis, performance monitoring, and process management and review.
During the water system analysis phase, all potential hazards and hazardous events related to each step of the water supply chain (including catchment or raw water, treatment, distribution network, and point of supply to consumer) are identified. Subsequently, the related risks are defined and classified based on their level of significance. At this point, the efficiency of existing preventive control measures must be validated and any additional improvements introduced.
The monitoring step aims to assess the performance of both individual control measures (operational monitoring) and the entire DW supply chain (verification monitoring). Operational monitoring involves routine checks conducted at specific time intervals of various parameters (e.g., turbidity, algal growth, or the integrity of extraction infrastructure for DWSs; disinfectant concentration and contact time, pH, or membrane integrity for water treatment; residual chlorine concentration or heterotrophic bacteria growth for distribution network). Verification monitoring consists of a final check of the entire DW production system and the safety of DW supplied to consumers. Regarding microbial quality verification, the WHO suggests the monitoring of E. coli or thermotolerant coliform bacteria as IMs of faecal pollution for treated water in the distribution system, treated water entering the distribution system, and all water directly intended for consumption. These microorganisms must not be detectable in 100 mL of sample (Table 7).
Finally, the last step of the WSP process is the development of standard operating procedures, emergency response plans, and support programmes (e.g., operator training and consumer education). This phase also involves the periodic updating of the WSP approach to integrate new risks and implement necessary improvements highlighted by incidents or near misses [10].

6.2. US EPA Regulations

The actions required to safeguard the quality of DW in the United States are established in the Safe Drinking Water Act (SDWA). Originally, the SDWA focused primarily on the treatment process as the major means of ensuring a safe water supply for consumers. However, the importance of adopting a multiple-barriers approach has been recognised over the years. These barriers include protecting the DWSs, implementing treatment methods appropriate to raw water characteristics, maintaining an intact and functioning distribution system, providing operator training, allocating funds for water system improvement, and offering public information. In this way, DW quality can be maintained and assured from source to tap, while effectively managing available resources (funds, time, and personnel). The SDWA authorizes the US EPA to set national health-based standards to protect DW quality. These standards are established for both naturally occurring and human-made contaminants that, due to their frequency and levels of occurrence, pose a threat to public health [76]. With the National Primary Drinking Water Regulations, the EPA provides three types of standards [77]:
  • Maximum Contaminant Level Goal (MCLG) is the level of a contaminant in DW below which there is no known or expected health risk (also including risk for most sensitive people, such as infants, children, pregnant women, the elderly, and immunocompromised individuals). This goal allows for a margin of safety and is non-enforceable;
  • Maximum Contaminant Level (MCL) is the highest level of a contaminant that is allowed in DW. MCLs are set as close as possible to MCLGs using the best available treatment technology and considering costs. These are enforceable standards;
  • Treatment Technique (TT) is a required process intended to reduce the level of a contaminant in DW.
Regarding microbial water quality, the EPA considers five parameters: Cryptosporidium, Giardia lamblia, HPC, Legionella, total coliforms (including faecal coliforms and E. coli), and enteric viruses (Table 7) [77].
In addition, EPA is also responsible for compiling the Contaminant Candidate List (CCL), which is a list of contaminants potentially hazardous to public health whose presence is known or expected in public water systems. Contaminants listed on the CCL may therefore require future regulation. The CCL is updated every five years and on 19 July 2021, EPA published the Draft Fifth Contaminant Candidate List (CCL 5), which, in addition to chemical contaminants and disinfection by-products, includes 12 microbes (adenoviruses, caliciviruses, C. jejuni, E. coli O157, enteroviruses, H. pylori, Legionella pneumophila, M. abscessus, M. avium, Naegleria fowleri, Pseudomonas aeruginosa, Shigella sonnei) [78].

6.3. Canadian Guidelines

In Canada, the management of the DW supply follows a multi-barrier approach from source to tap, aligning with EPA recommendations. The Guidelines for Canadian Drinking Water Quality [79] are a key component of this approach, as they establish the basic parameters needed to ensure a safe and clean water supply to consumers. Regarding microbial water quality, these guidelines set out maximum acceptable concentrations for IMs and treatment targets for pathogens. These set values are particularly stringent (Table 7), as they aim to protect the most vulnerable members of the population, for whom the health effects of microbial contamination of water can be quite severe.

6.4. Australian Guidelines

According to the WHO guidelines, the Australian Drinking Water Guidelines [80] propose a preventive approach that includes all stages of water production, from catchment to consumer, as the most effective means of ensuring DW quality and public health protection. This approach is incorporated into the Framework for Management of Drinking Water Quality, which encompasses four main steps: commitment to DW quality management, system analysis and management (including assessment of the DW supply system, preventive measures for DW quality management, operational procedures and process control, verification of DW quality, management of incidents and emergencies), supporting requirements (including employee awareness and training, community involvement and awareness, research and development, documentation, and reporting), and review (including evaluation and audit, review, and continuous co-improvement). The verification of DW quality consists of monitoring essential health-related characteristics, including microbial parameters (Table 7).

6.5. Directive (EU) 2020/2184

The implementation of the WSP principles outlined by WHO is the goal pursued by Directive (EU) 2020/2184 on the quality of water intended for human consumption [81]. In this directive, the term ‘water intended for human consumption’ means all water, either in its original state or after treatment, intended for drinking, cooking, food preparation, or other domestic purposes, regardless of its origin and mode of supply, including spring waters. As already introduced in Directive (EU) 2015/1787 [82], a generalised risk-based approach to water safety allows allocation of time and resources towards relevant risks and cost-effective source measures, avoiding analysis and effort on irrelevant issues. Such an approach must cover the entire supply chain and involve risk assessment and management of catchment areas, supply system, and domestic distribution systems. The purpose of risk assessment in catchment areas is to reduce the level of treatment required for DW production. Through the identification of hazards and hazardous events, it is possible to implement the necessary prevention and mitigation measures and thus prevent the deterioration of water quality. Based on the results of this assessment, the EU directive also provides the option for water suppliers to reduce or even eliminate monitoring of parameters that do not pose a significant risk. The assessment of the supply system includes extraction, treatment, storage, and distribution of water up to the point of delivery and aims to adjust monitoring to the main risks actually present. Finally, the assessment of risks associated with domestic distribution systems must pay special attention to priority premises (e.g., hospitals, nursing homes, schools, etc.). As with the review of the WSP process, these assessments should undergo periodic revisions to address any new threats to water safety. The EU directive establishes minimum requirements for assessing the quality of water intended for human consumption, which member states can supplement with other parameters to be monitored based on the results of risk assessments (Table 7) [81].

7. A Focus on Quantitative Microbial Risk Assessment (QMRA)

DW quality control strategies are increasingly moving towards a preventive approach based on risk assessment and risk management of the entire DW supply and production chain. For this reason, the application of QMRA has increased in recent years. QMRA is a tool used for assessing microbial water safety that consists of four steps: hazard identification, exposure assessment, dose–response relationship analysis, and risk characterisation. QMRA is a process of estimating the risk (probability of an adverse effect such as infection, disease, or death) due to exposure to pathogenic microorganisms. It is calculated from the environmental concentration of microorganisms and results in the assessment of the risk of adverse effect associated with exposure to certain concentrations of pathogens [83]. Using this tool, it is possible to set acceptable limits for microbial risk in DW, expressed as an annual risk of disease or as the number of years lost due to disease (Disability Adjusted Life Year, DALY). For example, the US EPA, the United Kingdom, and the Netherlands adopt a limit of 10−4 (1 in 10,000) illnesses/year, while WHO has established a limit of 10−6 DALYs per person per year [84]. The main advantage of QMRA lies in its objective, see-through, and evidence-based approach, which can provide a detailed quantification of risk. QMRA is based on the consideration and comprehension of all components of the water system, from source to consumer. This holistic approach provides valuable information on the effects of each component on the risk of disease outbreaks due to exposure to waterborne pathogens. Furthermore, in addition to the standard condition in which the water treatment process is functioning properly (“baseline condition”), any scenarios characterised by the failure of each step in the treatment process (“failure scenarios”) are also examined in the QMRA to determine their impact on ultimate risk [84,85]. The results of this assessment can provide a scientific basis for selecting management priorities and risk control strategies. At the same time, however, being based on laborious and complex statistics, this type of assessment requires high technical skills and in-depth knowledge about the concentrations of pathogenic microorganisms in the water matrix of interest and the characteristics and abatement capacity of the water treatment process. Indeed, the main limitation of QMRA is the scarcity of available data on the presence and quantity of pathogens in water (especially DW), as well as on the transport and removal of these microorganisms along the treatment process. This limitation can be overcome by referring to pathogen concentrations reported in literature for water types and treatment plants that are as similar as possible to those of interest, or by using faecal contamination indicator datasets, which typically are larger than pathogen datasets and in many situations are the only microbiological data available for characterising local water quality. Clearly, this introduces a source of uncertainty to the QMRA process, which in turn results in greater uncertainty in the quantitative risk outcome. In fact, in the former case, the uncertainty is due to the extrapolation of data from literature about systems that, although similar, will never be identical to the one under consideration. In the latter case, the uncertainty arises from relying on the existing relationship between IMs and pathogens, which, as highlighted by this review, is rather variable and is not always confirmed. In addition, when having to work with assumptions due to lack of data, there is a tendency to adopt conservative estimates or consider the worst-case scenario to apply a precautionary approach, which may lead to an overestimation of the final risk [86]. There are several examples in the literature of using indicator data for deriving concentrations for reference pathogens in DWSs or DW. Howard and colleagues [87] selected thermotolerant coliforms (including E. coli), sulphite-reducing clostridia, and somatic coliforms as surrogates for pathogenic E. coli, Cryptosporidium parvum, and rotavirus, respectively. Concentrations of IMs were used to derive those of pathogens in raw water entering two DW treatment plants and in treated water, assuming that 95% of thermotolerant coliforms were E. coli and 8% of E. coli were pathogenic. For C. parvum and rotaviruses, concentrations were assumed to be identical to those of their respective surrogates to represent the worst-case scenario. Machdar and colleagues [88] also used the same assumption to derive the concentrations of pathogenic E. coli in DW from those of E. coli and extrapolated the concentrations of other pathogens (Campylobacter, rotavirus, and Cryptosporidium) based on published ratios between pathogens and E. coli. Numerous other studies report similar approaches, but authors always emphasize the presence of uncertainty in the use of assumptions regarding the indicator–pathogen relationship and the need to improve pathogen detection methods so that direct measurements of the presence and quantity of these microorganisms in water matrices can be obtained [89,90,91,92].
Another limitation of QMRA involves the analysis of the dose–response relationship, which correlates exposure to pathogenic microorganisms with possible human health effects. This relationship relies on the infectivity of a pathogen, which depends on its ability to penetrate the defensive barriers of the host, multiply within it, and cause infection. The variability in infectivity can therefore be due both to the variability existing between different pathogens characterised by different virulence and to the variability existing between hosts in terms of immune response (susceptible population categories, such as children, elderly, and immunocompromised subjects, or the presence of short- or long-term immunity after an infection). These considerations reveal the complexity of developing a dose–response relationship for microbiological agents, which is the reason why such relationships are available in literature for a limited number of pathogens: C. jejuni, E. coli O157:H7, enteroviruses (echovirus-12 and coxsackievirus B4), adenovirus, rotavirus, norovirus, Giardia, and Cryptosporidium. In many studies, these dose–response models have been fitted to experimental data and applied in QMRA, but caution is needed to ensure that the selected model is appropriate for ongoing risk assessment [86].
QMRA can also be conducted in a reverse manner (reverse QMRA), i.e., starting from a defined acceptable risk value and arriving at critical concentrations for the pathogenic microorganisms of interest. This approach can be used to establish useful cut-offs in planning and policy making for water quality regulation [83]. For reverse QMRA, the same considerations as above apply; the main limitations remain the difficulty of obtaining quantitative data on pathogens in water and related to the microbial reduction achieved by treatment and the development of dose–response relationships. In fact, once the acceptable concentrations of microorganisms have been established by quantitative assessment, compliance with this critical threshold must be verified. This requires knowledge of pathogen concentrations in water or reference to published data or estimates derived from faecal contamination indicator datasets. There are not many examples in literature of studies applying reverse QMRA, especially to DW. Ryan and colleagues [93] performed both direct and reverse QMRA to 1) determine the risk associated with H. pylori concentrations in SW intended for human consumption and 2) to establish an acceptable concentration for treated water released into the distribution system. Because quantitative data on pathogen presence in SW and its reduction by the treatment process were not available, the authors derived the most probable number (MPN) from studies reporting qualitative data. They assumed a 5-log removal rate from prechlorination-coagulation-sedimentation treatment based on available data for total coliforms. However, this assumption emerged as the main source of uncertainty in the QMRA, because of the poor correlation between traditional indicators of faecal contamination and H. pylori. The direct QMRA showed that the annual infection risk of 10−4 was never exceeded for SW, whereas the reverse QMRA provided a cut-off value of <1 microorganism/L to meet the risk target. In another study [94], reverse QMRA was applied to GW as a DWS to verify that the treatment implemented for virus removal was sufficient to meet acceptable risk levels of 10−4 infections/person/year and 10−6 DALYs/person/year. Concentrations of reference pathogens in DWSs were needed to assess the required level of abatement: the authors chose noroviruses because of the availability of dose–response relationship information and, in the absence of standard culture methods, used molecular methods for sample analysis. Of 392 samples, 91.8% were “not detected”, highlighting the difficulty of applying a quantitative assessment on such a dataset and the problems concerning the detection of viruses in water. Due to the lack of consensus in the scientific community on the dose–response model for noroviruses, seven different models were used, resulting in abatements ranging from 4 to 9 logs and underlining the importance of the choice of model, which can greatly impact the final result.

8. Conclusions

Monitoring the microbiological characteristics of DWSs and DW is essential to safeguard public health. DW may be contaminated with pathogenic microorganisms (e.g., pathogenic E. coli, Salmonella spp., Cryptosporidium, Giardia, rotavirus, etc.) due to failures in water treatment or distribution systems (e.g., sewage intrusion, pipelines ageing, biofilm formation). Moreover, raw water quality can also affect the effectiveness of DW treatment. Since it is not feasible to test water for all potentially present pathogens, IMs are employed. The presence or absence of IMs should reflect that of pathogenic microorganisms. However, the reliability of IMs and their relationship to pathogens have been questioned following the detection of pathogenic microorganisms even in the absence of IMs. In this review, we analysed studies that statistically evaluated the correlation between traditional and alternative IMs and enteric pathogens in DWSs (GW, SW, and RW) and in DW. The findings revealed a rather undefined and controversial picture of the association between IMs and pathogens. In addition, correlation, when present, was characterised by high spatiotemporal variability, which makes it impossible to identify a valid and reliable IM for any pathogen and any water type. Consequently, IMs, rather than predicting the presence/absence of specific pathogenic microorganisms, are useful for a generic assessment of the microbiological quality of DWSs and DW. In particular, the simultaneous search for different types of IMs can provide various information on the possible presence of faecal contamination, the effectiveness of the water treatment process, and the general condition of the distribution system. Abnormal or elevated values of indicator concentrations highlight a potential risk scenario, prompting further targeted investigations. Indeed, only direct measurement of the presence and quantity of individual pathogens makes it possible to estimate the real risk to human health from exposure to contaminated water. Therefore, improvement of available detection techniques is essential to obtain more information on the prevalence of pathogens in water. Such data could also enhance in the application of the QMRA, ultimately leading to a more robust establishment of acceptable risk levels for DW.
In conclusion, evaluating the correlation between IMs and pathogens could offer valuable insights to policymakers as they revise parameters for regulations concerning the safeguarding of water intended for human consumption. This refinement aims to ensure that these parameters are increasingly appropriate for safeguarding the health of even the most vulnerable members of the population. Based on the findings of this review, the detection of IMs should be intended as complementary to, rather than a substitute for, the detection of pathogens, as the detection of the two targets has different meanings. This is evidenced by DW guidelines and directives (WHO, EPA, Canada, Australia, EU); ensuring the quality of DW supplied to consumers is a crucial aspect of the preventive approach based on risk assessment, applied throughout the entire water supply chain (from source to tap). This verification process necessitates monitoring both IMs (E. coli, thermotolerant coliforms, HPC, enterococci, C. perfringens including spores, and coliphages) and pathogens (Cryptosporidium, Giardia, Legionella, and enteric viruses, which are already regulated, along with several other pathogens under evaluation in the EPA’s CCL 5). This combined monitoring strategy ensures a comprehensive understanding of water quality and safety, contributing to effective public health protection.

Author Contributions

Conceptualisation, L.R., C.P., E.F., S.B. and E.C.; methodology, C.P., E.F., S.B. and E.C.; validation, L.R. and S.B.; investigation, L.R.; resources, E.C.; data curation, L.R.; writing—original draft preparation, L.R.; writing—review and editing, L.R., C.P., E.F., S.B. and E.C.; visualisation, L.R. and C.P.; supervision, E.C. All authors have read and agreed to the published version of the manuscript.

Funding

This research received no external funding.

Data Availability Statement

Data is contained within the article.

Conflicts of Interest

The authors declare no conflict of interest.

References

  1. World Health Organization. Drinking-Water. Available online: https://www.who.int/news-room/fact-sheets/detail/drinking-water (accessed on 9 August 2023).
  2. FAO; UNEP; WHO; WOAH. One Health Joint Plan of Action (2022–2026). Working Together for the Health of Humans, Animals, Plants and the Environment; FAO: Rome, Italy, 2022. [Google Scholar] [CrossRef]
  3. Zainurin, S.N.; Wan Ismail, W.Z.; Mahamud, S.N.I.; Ismail, I.; Jamaludin, J.; Ariffin, K.N.Z.; Wan Ahmad Kamil, W.M. Advancements in monitoring water quality based on various sensing methods: A systematic review. Int. J. Environ. Res. Public Health 2022, 19, 14080. [Google Scholar] [CrossRef] [PubMed]
  4. United Nations. The United Nations World Water Development Report 2023: Partnerships and Cooperation for Water; UNESCO: Paris, France, 2023. [Google Scholar]
  5. WASH. Compendium of WHO and Other UN Guidance on Health and Environment; World Health Organization: Geneva, Switzerland, 2021; (WHO/HEP/ECH/EHD/21.02). [Google Scholar]
  6. WHO. Water, Sanitation, Hygiene and Health: A Primer for Health Professionals; World Health Organization: Geneva, Switzerland, 2019; (WHO/CED/PHE/WSH/19.149). [Google Scholar]
  7. European Food Safety Authority; European Centre for Disease Prevention and Control. The European Union One Health 2021 Zoonoses Report. EFSA J. 2022, 20, 7666. [Google Scholar] [CrossRef]
  8. Centers for Disease Control and Prevention—CDC. National Outbreak Reporting System (NORS). Available online: https://wwwn.cdc.gov/norsdashboard/ (accessed on 9 August 2023).
  9. UNESCO. UN-Water, 2020: United Nations World Water Development Report 2020: Water and Climate Change; UNESCO: Paris, France, 2020. [Google Scholar]
  10. WHO. Guidelines for Drinking-Water Quality: Fourth Edition Incorporating the First and Second Addenda; World Health Organization: Geneva, Switzerland, 2022. [Google Scholar]
  11. Figueras, M.J.; Borrego, J.J. New perspectives in monitoring drinking water microbial quality. Int. J. Environ. Res. Public Health 2010, 7, 4179–4202. [Google Scholar] [CrossRef] [PubMed]
  12. Gerba, C.P. Chapter 23—Indicator Microorganisms. In Environmental Microbiology, 3rd ed.; Pepper, I.L., Gerba, C.P., Gentry, T.J., Eds.; Academic Press: Cambridge, MA, USA, 2015; pp. 551–564. [Google Scholar]
  13. Saxena, G.; Bharagava, R.N.; Kaithwas, G.; Raj, A. Microbial indicators, pathogens and methods for their monitoring in water environment. J. Water Health 2015, 13, 319–339. [Google Scholar] [CrossRef] [PubMed]
  14. Fout, G.S.; Borchardt, M.A.; Kieke, B.A., Jr.; Karim, M.R. Human virus and microbial indicator occurrence in public-supply groundwater systems: Meta-analysis of 12 international studies. Hydrogeol. J. 2017, 25, 903–919. [Google Scholar] [CrossRef]
  15. United Nations. The United Nations World Water Development Report 2022: Groundwater: Making the Invisible Visible; UNESCO: Paris, France, 2022. [Google Scholar]
  16. Kumar, A.; Ranjan, A.; Gulati, K.; Thakur, S.; Jindal, T. Assessment of chemical and microbial contamination in groundwater through leaching of sewage waste in Delhi, India. Environ. Earth Sci. 2016, 75, 275. [Google Scholar] [CrossRef]
  17. Kumar, A.; Nirpen, L.; Ranjan, A.; Gulati, K.; Thakur, S.; Jindal, T. Microbial groundwater contamination and effective monitoring system. Asian J. Environ. Sci. 2014, 9, 37–48. [Google Scholar]
  18. World Health Organization—WHO. Protecting Surface Water for Health. Identifying, Assessing and Managing Drinking-Water Quality Risks in Surface-Water Catchments; World Health Organization: Geneva, Switzerland, 2016; ISBN 978 92 4 151612 9. [Google Scholar]
  19. Mackowiak, M.; Leifels, M.; Hamza, I.A.; Jurzik, L.; Wingender, J. Distribution of Escherichia coli, coliphages and enteric viruses in water, epilithic biofilms and sediments of an urban river in Germany. Sci. Total Environ. 2018, 626, 650–659. [Google Scholar] [CrossRef]
  20. Pandey, P.K.; Kass, P.H.; Soupir, M.L.; Biswas, S.; Singh, V.P. Contamination of water resources by pathogenic bacteria. AMB Express 2014, 4, 51. [Google Scholar] [CrossRef]
  21. Dean, J.; Hunter, P.R. Risk of gastrointestinal illness associated with the consumption of rainwater: A systematic review. Environ. Sci. Technol. 2012, 46, 2501–2507. [Google Scholar] [CrossRef]
  22. Hamilton, K.; Reyneke, B.; Waso, M.; Clements, T.; Ndlovu, T.; Khan, W.; DiGiovanni, K.; Rakestraw, E.; Montalto, F.; Haas, C.N.; et al. A global review of the microbiological quality and potential health risks associated with roof-harvested rainwater tanks. npj Clean Water 2019, 2, 7. [Google Scholar] [CrossRef]
  23. Ahmed, W.; Gardner, T.; Toze, S. Microbiological quality of roof-harvested rainwater and health risks: A review. J. Environ. Qual. 2011, 40, 13–21. [Google Scholar] [CrossRef]
  24. Hemdan, B.A.; El-Taweel, G.E.; Goswami, P.; Pant, D.; Sevda, S. The role of biofilm in the development and dissemination of ubiquitous pathogens in drinking water distribution systems: An overview of surveillance, outbreaks, and prevention. World J. Microbiol. Biotechnol. 2021, 37, 36. [Google Scholar] [CrossRef] [PubMed]
  25. Moreira, N.A.; Bondelind, M. Safe drinking water and waterborne outbreaks. J. Water Health. 2017, 15, 83–96. [Google Scholar] [CrossRef] [PubMed]
  26. Chowdhury, S. Heterotrophic bacteria in drinking water distribution system: A review. Environ. Monit. Assess. 2012, 184, 6087–6137. [Google Scholar] [CrossRef]
  27. Lee, E.J.; Schwab, K.J. Deficiencies in drinking water distribution systems in developing countries. J. Water Health. 2005, 3, 109–127. [Google Scholar] [CrossRef]
  28. Deshmukh, R.A.; Joshi, K.; Bhand, S.; Roy, U. Recent developments in detection and enumeration of waterborne bacteria: A retrospective minireview. Microbiologyopen 2016, 5, 901–922. [Google Scholar] [CrossRef] [PubMed]
  29. Haramoto, E.; Kitajima, M.; Hata, A.; Torrey, J.R.; Masago, Y.; Sano, D.; Katayama, H. A review on recent progress in the detection methods and prevalence of human enteric viruses in water. Water Res. 2018, 135, 168–186. [Google Scholar] [CrossRef]
  30. Motlagh, A.M.; Yang, Z. Detection and occurrence of indicator organisms and pathogens. Water Environ. Res. 2019, 91, 1402–1408. [Google Scholar] [CrossRef]
  31. Ramírez-Castillo, F.Y.; Loera-Muro, A.; Jacques, M.; Garneau, P.; Avelar-González, F.J.; Harel, J.; Guerrero-Barrera, A.L. Waterborne pathogens: Detection methods and challenges. Pathogens 2015, 4, 307–334. [Google Scholar] [CrossRef]
  32. Payment, P.; Locas, A. Pathogens in water: Value and limits of correlation with microbial indicators. Ground Water 2011, 49, 4–11. [Google Scholar] [CrossRef] [PubMed]
  33. Waideman, M.A.; Teixeira, V.P.; Uemura, E.H.; Stamford, T.M.; Leal, D.A.G.; Stangarlin-Fiori, L.; Ferreira, S.M.R.; Taconeli, C.A.; Beux, M.R. Enterococci used as complementary indicator of fecal contamination to assess water quality from public schools in the city of Curitiba, Paraná, Brazil. Braz. J. Food Technol. 2020, 23, e2019155. [Google Scholar] [CrossRef]
  34. Lin, J.; Ganesh, A. Water quality indicators: Bacteria, coliphages, enteric viruses. Int. J. Environ. Health Res. 2013, 23, 484–506. [Google Scholar] [CrossRef] [PubMed]
  35. Ben Braïek, O.; Smaoui, S. Enterococci: Between emerging pathogens and potential probiotics. Biomed Res. Int. 2019, 2019, 5938210. [Google Scholar] [CrossRef]
  36. Gensberger, E.T.; Gössl, E.M.; Antonielli, L.; Sessitsch, A.; Kostić, T. Effect of different heterotrophic plate count methods on the estimation of the composition of the culturable microbial community. PeerJ 2015, 3, e862. [Google Scholar] [CrossRef] [PubMed]
  37. Allen, M.J.; Edberg, S.C.; Reasoner, D.J. Heterotrophic plate count bacteria--what is their significance in drinking water? Int. J. Food Microbiol. 2004, 92, 265–274. [Google Scholar] [CrossRef]
  38. Stelma, G.N., Jr. Use of bacterial spores in monitoring water quality and treatment. J. Water Health 2018, 16, 491–500. [Google Scholar] [CrossRef] [PubMed]
  39. Ahmed, W.; Goonetilleke, A.; Gardner, T. Alternative indicators for detection and quantification of faecal pollution. Water J. Aust. Water Assoc. 2008, 35, 59–65. [Google Scholar]
  40. Harwood, V.J.; Staley, C.; Badgley, B.D.; Borges, K.; Korajkic, A. Microbial source tracking markers for detection of fecal contamination in environmental waters: Relationships between pathogens and human health outcomes. FEMS Microbiol. Rev. 2014, 38, 1–40. [Google Scholar] [CrossRef]
  41. Fitzmorris-Brisolara, K.; Maal-Bared, R.; Worley-Morse, T.; Danley-Thomson, A.; Sobsey, M. Monitoring coliphages to reduce waterborne infectious disease transmission in the One Water framework. Int. J. Hyg. Environ. Health 2022, 240, 113921. [Google Scholar] [CrossRef]
  42. Bonadonna, L.; Briancesco, R.; Suffredini, E.; Coccia, A.; Della Libera, S.; Carducci, A.; Verani, M.; Federigi, I.; Iaconelli, M.; Bonanno Ferraro, G.; et al. Enteric viruses, somatic coliphages and Vibrio species in marine bathing and non-bathing waters in Italy. Mar. Pollut. Bull. 2019, 149, 110570. [Google Scholar] [CrossRef] [PubMed]
  43. Jofre, J.; Lucena, F.; Blanch, A.R.; Muniesa, M. Coliphages as model organisms in the characterization and management of water resources. Water 2016, 8, 199. [Google Scholar] [CrossRef]
  44. Gaci, N.; Borrel, G.; Tottey, W.; O’Toole, P.W.; Brugère, J.F. Archaea and the human gut: New beginning of an old story. World J. Gastroenterol. 2014, 20, 16062–16078. [Google Scholar] [CrossRef] [PubMed]
  45. Ufnar, J.A.; Wang, S.Y.; Christiansen, J.M.; Yampara-Iquise, H.; Carson, C.A.; Ellender, R.D. Detection of the nifH gene of Methanobrevibacter smithii: A potential tool to identify sewage pollution in recreational waters. J. Appl. Microbiol. 2006, 101, 44–52. [Google Scholar] [CrossRef] [PubMed]
  46. Maniah, K.; Nour, I.; Hanif, A.; Yassin, M.T.; Alkathiri, A.; Alharbi, Y.; Alotaibi, R.; Al-Anazi, A.E.; Eifan, S. Application of the Human Viral Surrogate Pepper Mild Mottle Virus for Wastewater Fecal Pollution Management. Water 2022, 14, 4033. [Google Scholar] [CrossRef]
  47. Bonanno Ferraro, G.; Suffredini, E.; Mancini, P.; Veneri, C.; Iaconelli, M.; Bonadonna, L.; Montagna, M.T.; De Giglio, O.; La Rosa, G. Pepper mild mottle virus as indicator of pollution: Assessment of prevalence and concentration in different water environments in Italy. Food. Environ. Virol. 2021, 13, 117–125. [Google Scholar] [CrossRef]
  48. Stokdyk, J.P.; Firnstahl, A.D.; Walsh, J.F.; Spencer, S.K.; de Lambert, J.R.; Anderson, A.C.; Rezania, L.W.; Kieke, B.A., Jr.; Borchardt, M.A. Viral, bacterial, and protozoan pathogens and fecal markers in wells supplying groundwater to public water systems in Minnesota. USA. Water Res. 2020, 178, 115814. [Google Scholar] [CrossRef]
  49. Richards, C.L.; Broadaway, S.C.; Eggers, M.J.; Doyle, J.; Pyle, B.H.; Camper, A.K.; Ford, T.E. Detection of pathogenic and non-pathogenic bacteria in drinking water and associated biofilms on the Crow Reservation, Montana, USA. Microb. Ecol. 2018, 76, 52–63. [Google Scholar] [CrossRef]
  50. De Giglio, O.; Barbuti, G.; Trerotoli, P.; Brigida, S.; Calabrese, A.; Di Vittorio, G.; Lovero, G.; Caggiano, G.; Uricchio, V.F.; Montagna, M.T. Microbiological and hydrogeological assessment of groundwater in southern Italy. Environ. Monit. Assess. 2016, 188, 638. [Google Scholar] [CrossRef]
  51. Ferguson, A.S.; Layton, A.C.; Mailloux, B.J.; Culligan, P.J.; Williams, D.E.; Smartt, A.E.; Sayler, G.S.; Feighery, J.; McKay, L.D.; Knappett, P.S.; et al. Comparison of fecal indicators with pathogenic bacteria and rotavirus in groundwater. Sci. Total Environ. 2012, 431, 314–322. [Google Scholar] [CrossRef]
  52. Haramoto, E.; Yamada, K.; Nishida, K. Prevalence of protozoa, viruses, coliphages and indicator bacteria in groundwater and river water in the Kathmandu Valley, Nepal. Trans. R. Soc. Trop. Med. Hyg. 2011, 105, 711–716. [Google Scholar] [CrossRef]
  53. Baker, K.H.; Hegarty, J.P. Presence of Helicobacter pylori in drinking water is associated with clinical infection. Scand. J. Infect. Dis. 2001, 33, 744–746. [Google Scholar] [CrossRef] [PubMed]
  54. Ashbolt, N.J. Microbial contamination of drinking water and human health from community water systems. Curr. Environ. Health Rep. 2015, 2, 95–106. [Google Scholar] [CrossRef]
  55. Bailey, E.S.; Hopkins, M.; Casanova, L.; Sobsey, M.D. Evaluating fecal indicator and pathogen relationships in sewage impacted surface waters to blend with reclaimed water for potable reuse in North Carolina. Pathogens 2021, 10, 1603. [Google Scholar] [CrossRef] [PubMed]
  56. Vadde, K.K.; McCarthy, A.J.; Rong, R.; Sekar, R. Quantification of microbial source tracking and pathogenic bacterial markers in water and sediments of Tiaoxi River (Taihu Watershed). Front. Microbiol. 2019, 10, 699. [Google Scholar] [CrossRef]
  57. Vesga, F.J.; Moreno, Y.; Ferrús, M.A.; Ledesma-Gaitan, L.M.; Campos, C.; Trespalacios, A.A. Correlation among fecal indicator bacteria and physicochemical parameters with the presence of Helicobacter pylori DNA in raw and drinking water from Bogotá, Colombia. Helicobacter 2019, 24, e12582. [Google Scholar] [CrossRef]
  58. Tandukar, S.; Sherchand, J.B.; Bhandari, D.; Sherchan, S.P.; Malla, B.; Ghaju Shrestha, R.; Haramoto, E. Presence of human enteric viruses, protozoa, and indicators of pathogens in the Bagmati River, Nepal. Pathogens 2018, 7, 38. [Google Scholar] [CrossRef]
  59. Liang, L.; Goh, S.G.; Vergara, G.G.; Fang, H.M.; Rezaeinejad, S.; Chang, S.Y.; Bayen, S.; Lee, W.A.; Sobsey, M.D.; Rose, J.B.; et al. Alternative fecal indicators and their empirical relationships with enteric viruses, Salmonella enterica, and Pseudomonas aeruginosa in surface waters of a tropical urban catchment. Appl. Environ. Microbiol. 2015, 81, 850–860. [Google Scholar] [CrossRef]
  60. Vergara, G.G.; Goh, S.G.; Rezaeinejad, S.; Chang, S.Y.; Sobsey, M.D.; Gin, K.Y. Evaluation of FRNA coliphages as indicators of human enteric viruses in a tropical urban freshwater catchment. Water Res. 2015, 79, 39–47. [Google Scholar] [CrossRef]
  61. Burnet, J.B.; Penny, C.; Ogorzaly, L.; Cauchie, H.M. Spatial and temporal distribution of Cryptosporidium and Giardia in a drinking water resource: Implications for monitoring and risk assessment. Sci. Total. Environ. 2014, 472, 1023–1035. [Google Scholar] [CrossRef]
  62. Rezaeinejad, S.; Vergara, G.G.; Woo, C.H.; Lim, T.T.; Sobsey, M.D.; Gin, K.Y. Surveillance of enteric viruses and coliphages in a tropical urban catchment. Water Res. 2014, 58, 122–131. [Google Scholar] [CrossRef]
  63. Edge, T.A.; Khan, I.U.; Bouchard, R.; Guo, J.; Hill, S.; Locas, A.; Moore, L.; Neumann, N.; Nowak, E.; Payment, P.; et al. Occurrence of waterborne pathogens and Escherichia coli at offshore drinking water intakes in Lake Ontario. Appl. Environ. Microbiol. 2013, 79, 5799–5813. [Google Scholar] [CrossRef] [PubMed]
  64. Krometis, L.A.; Characklis, G.W.; Drummey, P.N.; Sobsey, M.D. Comparison of the presence and partitioning behavior of indicator organisms and Salmonella spp. in an urban watershed. J. Water Health. 2010, 8, 44–59. [Google Scholar] [CrossRef] [PubMed]
  65. Lodder, W.J.; van den Berg, H.H.; Rutjes, S.A.; de Roda Husman, A.M. Presence of enteric viruses in source waters for drinking water production in The Netherlands. Appl. Environ. Microbiol. 2010, 76, 5965–5971. [Google Scholar] [CrossRef] [PubMed]
  66. Nieminski, E.; Durrant, G.C.; Hoyt, M.B.; Owens, M.E.; Peterson, L.; Peterson, S.; Tanner, W.D.; Rosen, J.; Clancy, J.L. Is E. Coli an appropriate surrogate for Cryptosporidium occurrence in water? J. Am. Water Works Assoc. 2010, 102, 65–78. [Google Scholar] [CrossRef]
  67. Cizek, A.R.; Characklis, G.W.; Krometis, L.A.; Hayes, J.A.; Simmons, O.D., III; Di Lonardo, S.; Alderisio, K.A.; Sobsey, M.D. Comparing the partitioning behavior of Giardia and Cryptosporidium with that of indicator organisms in stormwater runoff. Water Res. 2008, 42, 4421–4438. [Google Scholar] [CrossRef]
  68. Hachich, E.M.; Sato, M.I.; Galvani, A.T.; Menegon, J.R.; Mucci, J.L. Giardia and Cryptosporidium in source waters of São Paulo State, Brazil. Water Sci. Technol. 2004, 50, 239–245. [Google Scholar] [CrossRef]
  69. Payment, P.; Berte, A.; Prévost, M.; Ménard, B.; Barbeau, B. Occurrence of pathogenic microorganisms in the Saint Lawrence River (Canada) and comparison of health risks for populations using it as their source of drinking water. Can. J. Microbiol. 2000, 46, 565–576. [Google Scholar] [CrossRef]
  70. Ahmed, W.; Zhang, Q.; Ishii, S.; Hamilton, K.; Haas, C. Microfluidic quantification of multiple enteric and opportunistic bacterial pathogens in roof-harvested rainwater tank samples. Environ. Monit. Assess. 2018, 190, 105. [Google Scholar] [CrossRef]
  71. Hamilton, K.A.; Ahmed, W.; Palmer, A.; Smith, K.; Toze, S.; Haas, C.N. Seasonal assessment of opportunistic premise plumbing pathogens in roof-harvested rainwater tanks. Environ. Sci. Technol. 2017, 51, 1742–1753. [Google Scholar] [CrossRef]
  72. Hamilton, K.A.; Ahmed, W.; Palmer, A.; Sidhu, J.P.S.; Hodgers, L.; Toze, S.; Haas, C.N. Public health implications of Acanthamoeba and multiple potential opportunistic pathogens in roof-harvested rainwater tanks. Environ. Res. 2016, 150, 320–327. [Google Scholar] [CrossRef]
  73. Ahmed, W.; Brandes, H.; Gyawali, P.; Sidhu, J.P.; Toze, S. Opportunistic pathogens in roof-captured rainwater samples, determined using quantitative PCR. Water Res. 2014, 53, 361–369. [Google Scholar] [CrossRef]
  74. Ahmed, W.; Goonetilleke, A.; Gardner, T. Implications of faecal indicator bacteria for the microbiological assessment of roof-harvested rainwater quality in southeast Queensland, Australia. Can. J. Microbiol. 2010, 56, 471–479. [Google Scholar] [CrossRef]
  75. Simmons, G.; Hope, V.; Lewis, G.; Whitmore, J.; Gao, W. Contamination of potable roof-collected rainwater in Auckland, New Zealand. Water Res. 2001, 35, 1518–1524. [Google Scholar] [CrossRef] [PubMed]
  76. United States Environmental Protection Agency—US EPA. Understanding the Safe Drinking Water Act. EPA 816-F-04-030 June 2004. Available online: https://www.epa.gov/sdwa/overview-safe-drinking-water-act (accessed on 9 August 2023).
  77. United States Environmental Protection Agency—US EPA. National Primary Drinking Water Regulations. Available online: https://www.epa.gov/ground-water-and-drinking-water/national-primary-drinking-water-regulations (accessed on 9 August 2023).
  78. United States Environmental Protection Agency—US EPA. CCL 5 Microbial Contaminants. Available online: https://www.epa.gov/ccl/ccl-5-microbial-contaminants (accessed on 9 August 2023).
  79. Health Canada. Guidelines for Canadian Drinking Water Quality—Summary Tables; Water and Air Quality Bureau, Healthy Environments and Consumer Safety Branch, Health Canada: Ottawa, ON, Canada, 2022. [Google Scholar]
  80. NHMRC, NRMMC. Australian Drinking Water Guidelines Paper 6 National Water Quality Management Strategy; National Health and Medical Research Council, National Resource Management Ministerial Council, Commonwealth of Australia: Canberra, Australia, 2011. [Google Scholar]
  81. Directive (EU) 2020/2184 of the European Parliament and of the Council of 16 December 2020 on the Quality of Water Intended for Human Consumption. Available online: http://data.europa.eu/eli/dir/2020/2184/oj (accessed on 9 August 2023).
  82. Commission Directive (EU) 2015/1787 of 6 October 2015 amending Annexes II and III to Council Directive 98/83/EC on the Quality of Water Intended for Human Consumption. Available online: https://eur-lex.europa.eu/legal-content/EN/TXT/PDF/?uri=CELEX:01998L0083-20151027&from=EN (accessed on 9 August 2023).
  83. Rasheduzzaman, M.; Singh, R.; Haas, C.N.; Tolofari, D.; Yassaghi, H.; Hamilton, K.A.; Yang, Z.; Gurian, P.L. Reverse QMRA as a decision support tool: Setting acceptable concentration limits for Pseudomonas aeruginosa and Naegleria fowleri. Water 2019, 11, 1850. [Google Scholar] [CrossRef]
  84. Hamouda, M.A.; Jin, X.; Xu, H.; Chen, F. Quantitative microbial risk assessment and its applications in small water systems: A review. Sci. Total Environ. 2018, 645, 993–1002. [Google Scholar] [CrossRef] [PubMed]
  85. Amoueyan, E.; Ahmad, S.; Eisenberg, J.N.S.; Gerrity, D. Equivalency of indirect and direct potable reuse paradigms based on a quantitative microbial risk assessment framework. Microb. Risk Anal. 2019, 12, 60–75. [Google Scholar] [CrossRef]
  86. World Health Organization—WHO. Quantitative Microbial Risk Assessment: Application for Water Safety Management; World Health Organization: Geneva, Switzerland, 2016; ISBN 978 92 4 156537 0. [Google Scholar]
  87. Howard, G.; Pedley, S.; Tibatemwa, S. Quantitative microbial risk assessment to estimate health risks attributable to water supply: Can the technique be applied in developing countries with limited data? J. Water Health 2006, 4, 49–65. [Google Scholar] [CrossRef] [PubMed]
  88. Machdar, E.; van der Steen, N.P.; Raschid-Sally, L.; Lens, P.N. Application of Quantitative Microbial Risk Assessment to analyze the public health risk from poor drinking water quality in a low income area in Accra, Ghana. Sci. Total Environ. 2013, 449, 134–142. [Google Scholar] [CrossRef]
  89. Petterson, S.R.; Stenström, T.A.; Ottoson, J. A theoretical approach to using faecal indicator data to model norovirus concentration in surface water for QMRA: Glomma River, Norway. Water Res. 2016, 91, 31–37. [Google Scholar] [CrossRef]
  90. Petterson, S.R.; Mitchell, V.G.; Davies, C.M.; O’Connor, J.; Kaucner, C.; Roser, D.; Ashbolt, N. Evaluation of three full-scale stormwater treatment systems with respect to water yield, pathogen removal efficacy and human health risk from faecal pathogens. Sci. Total Environ. 2016, 543, 691–702. [Google Scholar] [CrossRef] [PubMed]
  91. Petterson, S.; Grøndahl-Rosado, R.; Nilsen, V.; Myrmel, M.; Robertson, L.J. Variability in the recovery of a virus concentration procedure in water: Implications for QMRA. Water Res. 2015, 87, 79–86. [Google Scholar] [CrossRef] [PubMed]
  92. van Lieverloo, J.H.; Blokker, E.J.; Medema, G. Quantitative microbial risk assessment of distributed drinking water using faecal indicator incidence and concentrations. J. Water Health 2007, 5, 131–149. [Google Scholar] [CrossRef] [PubMed]
  93. Ryan, M.; Hamilton, K.; Hamilton, M.; Haas, C.N. Evaluating the potential for a Helicobacter pylori drinking water guideline. Risk Anal. 2014, 34, 1651–1662. [Google Scholar] [CrossRef] [PubMed]
  94. Emelko, M.B.; Schmidt, P.J.; Borchardt, M.A. Confirming the need for virus disinfection in municipal subsurface drinking water supplies. Water Res. 2019, 157, 356–364. [Google Scholar] [CrossRef] [PubMed]
Figure 1. Sources of microbiological contamination of groundwater (GW), surface water (SW), rainwater (RW), and drinking water (DW).
Water 15 02964 g001
Table 1. Most widely used traditional and alternative indicator microorganisms (IMs), their main significance, and their use as surrogates for specific pathogens. The hyphen indicates the absence of utilisation as substitutes for specific pathogens.
IMSignificanceSurrogate for Pathogens
Total coliformsProcess indicators-
Thermotolerant coliformsIndicators of faecal contamination by humans and warm-blooded animals-
Escherichia coliIndicator of faecal contamination by humans and warm-blooded animalsSurrogate for bacterial enteric pathogens: pathogenic E. coli, Salmonella, Shigella
Intestinal enterococciIndicators of faecal contamination by humans and warm-blooded animals-
Heterotrophic plate count (HPC)Process and water quality indicator-
Clostridium perfringens and its sporesIndicator of remote faecal contamination by humans and warm-blooded animalsSurrogate for protozoan pathogens: Cryptosporidium, Giardia
Bacteroides spp.Indicators of faecal contamination by humans and warm-blooded animals, they can be used to identify the source of faecal pollution-
ColiphagesIndicators of faecal contamination by humans and warm-blooded animalsSurrogate for enteric viruses
Methanobrevibacter smithiiIndicator of human faecal contamination-
Pepper mild mottle virus (PMMoV)Indicator of human faecal contaminationPossible surrogate for enteric viruses
Table 2. Studies that evaluated the correlation between indicator microorganisms (IMs) and pathogens in GW. Studies are presented in descending chronological order, from the most recent to the oldest. PMMoV = pepper mild mottle virus; HPC = heterotrophic plate count.
Reference and Publication YearCountryGW TypeNumber of SamplesIMs and Detection MethodPathogens and Detection MethodCorrelation
[48], 2020Minnesota, USADisinfected and undisinfected GW from public water supply wells 1964Culture method: total coliforms, E. coli
Molecular method: PMMoV, human Bacteroides HF183, Bacteroidales-like HumM2
Molecular method: C. jejuni, enteropathogenic E. coli, Shiga-toxin-1- and 2-producing bacteria, Salmonella, adenovirus, human enterovirus, human polyomavirus, norovirus GI and GII, rotavirus group A, hepatitis A virus, Giardia, CryptosporidiumE. coli (detected in only 3 samples) not considered for correlation. Hepatitis A virus, norovirus GI, enteropathogenic E. coli, and Shiga-toxin-1-producing bacteria never detected.
Positive significant: for all IMs except PMMoV on total samples (logistic regression, p < 0.01).
Not significant: for any IMs at each well (p > 0.05).
[49], 2018Montana, USAGW used as DW57 2Culture method: total coliforms, E. coli, HPCCulture method: Mycobacterium, Helicobacter
Molecular method: Mycobacterium, Helicobacter
Positive significant: between HPC and Mycobacterium (logistic regression, p = 0.05).
[50], 2016Apulia region, ItalyGW from wells for emergency use1656Culture method: E. coli, total coliforms, enterococci, HPC 22 °C and 37 °CCulture method: Salmonella spp.Positive significant: between Salmonella spp. and E. coli, total coliforms and enterococci (Spearman correlation coefficient, p < 0.0001).
No indication on correlation for HPC.
[51], 2012BangladeshGW from shallow tube wells as a primary source of DW50Culture method: total coliforms, E. coli, F+ RNA coliphages
Molecular method: E. coli
Molecular method: Shigella, Vibrio, pathogenic E. coli, rotavirusPositive significant: between pathogenic E. coli and culturable E. coli, total coliforms and F+ RNA coliphages; between molecular E. coli and Shigella (Spearman rank correlations, p < 0.05).
[52], 2011Katmandu Valley, NepalGW from shallow wells for daily water supply9Culture method: E. coli, total coliforms
Molecular method: F-RNA coliphages
Immunofluorescent microscopy: Cryptosporidium, Giardia
Molecular method: human adenoviruses, noroviruses GI and GII
Positive significant: 3 samples negative for E. coli and target pathogens; 5/6 E. coli-positive samples also positive for at least one of target pathogens (chi-square test, p < 0.05).
No indication on correlation of pathogens with total coliforms and F-RNA coliphages.
[53], 2001Pennsylvania, USAPrivate untreated well water consumed as DW22Culture method: E. coliCulture method: H. pyloriPositive significant: between E. coli and H. pylori (Fisher’s exact test, p = 0.0011).
Notes: 1 The authors do not report the number of public water supply wells that disinfect water, so it was not possible to separate them from the rest of the samples. 2 16 out of 57 samples were from treated SW, but could not be separated as statistical analysis was applied to the total number of samples.
Table 3. Studies that evaluated the correlation between IMs and pathogens in SW. Studies are presented in descending chronological order, from the most recent to the oldest.
Reference and Publication YearCountrySW TypeNumber of SamplesIndicators and
Detection Method
Pathogens and Detection MethodCorrelation
[55], 2021North Carolina, USARiver water and sewage-impacted reservoirs, both sources for DW treatment plants22Culture method: total coliforms, E. coli, Enterococcus spp., C. perfringens, somatic and F+ coliphagesImmunofluorescent microscopy: Cryptosporidium, Giardia
Culture method: Salmonella spp.
Molecular method: adenovirus, norovirus
Positive significant:
  • ANOVA regression analysis: between Salmonella spp. and total coliforms, E. coli and Enterococcus spp. (p ≤ 0.01); between adenovirus and somatic and F+ coliphages (p < 0.0001); between protozoa and C. perfringens (p < 0.0001).
  • Spearman’s rank correlation on total samples: between Salmonella spp. and total coliforms (p = 0.02).
Negative significant: between adenovirus and F+ coliphages on total samples (Spearman’s rank correlation, p = 0.05).
Not significant: for any IMs by treatment plant (n = 5) (Spearman’s rank correlation, p > 0.05).
Norovirus never detected.
[56], 2019ChinaTiaoxi River, an important source of water supply45Culture method: faecal coliforms
Molecular method: Bacteroidales (total, human-, swine-, and avian-associated)
Molecular method: C. jejuni, pathogenic Leptospira spp., Shigella spp., Shiga-toxin-producing E. coli (STEC), E. coli O157:H7Positive significant: between STEC and total and human Bacteroidales (Spearman’s coefficient correlation, p < 0.05).
[57], 2019Bogotá, ColombiaCatchment of raw superficial waters155Culture method: total coliforms, E. coli, spores of sulphite-reducing clostridiaMolecular method: H. pyloriNot significant: for any IMs (Spearman correlation coefficient and Tau-b Kendall correlation coefficient, p > 0.05).
[58], 2018NepalBagmati River water used untreated for domestic use18Culture method: total coliforms, E. coli
Molecular method: E. coli, Enterococcus spp., human Bacteroidales HF183, PMMoV
Immunofluorescent microscopy: Cryptosporidium, Giardia
Molecular method: Aichi virus 1, enteroviruses, human cosaviruses, human adenoviruses, noroviruses GI and GII, group A rotaviruses, saliviruses
Positive significant: between all IMs and total human enteric viruses (bivariate correlation with Pearson coefficients, p < 0.05)
[59], 2015SingaporeTributaries and reservoir used for DW148Culture method: E. coli, enterococci, somatic and F-coliphages
Molecular method: E. coli, enterococci, Bacteroides thetaiotaomicron, M. smithii
Culture method: Salmonella spp.
Molecular method: rotavirus, astrovirus, norovirus GI and GII, adenovirus
Positive significant: between Salmonella spp. and E. coli, enterococci, somatic and F-coliphages, and B. thetaiotaomicron (Spearman’s rank correlation, p < 0.05); between adenovirus and norovirus GII and molecular E. coli (p < 0.05) and molecular enterococci (p < 0.01); between norovirus GII and M. smithii (p < 0.05) and B. thetaiotaomicron (p < 0.01); between norovirus GI and M. smithii (p < 0.01).
[60], 2015SingaporeMarina Reservoir, an important source of DW75Culture method: somatic and F-coliphages
Molecular method: F-coliphages
Molecular method: adenovirus, norovirus GI and GII, astrovirus, rotavirusPositive significant: between cultural F-coliphages and norovirus GII and rotavirus; between molecular human-specific GII coliphages and all human enteric viruses (Kendall Tau-b correlation, p < 0.05).
[61], 2014LuxembourgRaw SW (sub-catchments, river, reservoir, and inlet of a DW treatment plant)121Culture method: E. coliImmunofluorescent microscopy: Cryptosporidium, GiardiaPositive significant: between E. coli and Giardia in the river and both protozoa in the reservoir and at the inlet of the DW treatment plant (nonparametric Spearman rank correlation test, p < 0.05).
[62], 2014SingaporeReservoir for water supply65Culture method: somatic and male-specific coliphagesMolecular method: adenovirus, norovirus GI and GII, astrovirus, rotavirusPositive significant: between male-specific coliphages and norovirus GI and GII (Kendall’s Tau-b correlation, p < 0.05).
[63], 2013CanadaRaw lake water entering three DW treatment plants (DWTP1, DWTP2, DWTP3)298Culture method: total coliforms, E. coli, enterococci, clostridia
Molecular method: human Bacteroidales HF183
Culture method: thermophilic Campylobacter, cultivable enteric viruses
Immunofluorescent microscopy: Cryptosporidium, Giardia
Molecular method: Cryptosporidium, Giardia
Positive significant: between enterococci and enteric viruses in DWTP1 and DWTP3 influents (Spearman rank correlation test, p < 0.05); between clostridia and enteric viruses in DWTP1 (p < 0.05); between clostridia and Cryptosporidium in DWTP2 influent (p < 0.05).
[64], 2010North Carolina, USACreek and pond tributaries of Jordan Lake, a DWS83Culture method: faecal coliforms, E. coli, enterococci, C. perfringens spores, somatic and male-specific coliphagesCulture method: Salmonella spp.Positive significant: between Salmonella spp. and faecal coliforms, E. coli, enterococci, C. perfringens spores, and somatic coliphages (Spearman rank correlation, p < 0.05).
[65], 2010NetherlandsSource water for DW production (intake area or upstream of a source water intake area)75Culture method: somatic and F-specific coliphagesCulture method: enteroviruses, reoviruses
Molecular method: noroviruses, rotaviruses
Positive significant: between the two coliphages and enteroviruses (p < 0.0005).
[66], 2010Utah, USARaw SW of seven DW treatment plants (reservoir and stream)228Culture method: E. coliImmunofluorescent microscopy: CryptosporidiumNegative significant: between E. coli and Cryptosporidium in winter for reservoir samples (nonparametric Spearman correlations).
[67], 2008New York, USATributaries of the Kensico Reservoir, a primary source of DW for the city of New York16Culture method: faecal coliforms, E. coli, enterococci, C. perfringens spores, somatic and F+ coliphagesImmunofluorescent microscopy: Cryptosporidium, GiardiaNot significant: for any IMs (nonparametric Spearman rank statistical test, p > 0.5).
[68], 2004São Paulo, BrazilSW used to supply DW278Culture method: faecal coliforms, C. perfringensImmunofluorescent microscopy: Giardia, CryptosporidiumPositive significant: between IMs and Giardia for total samples (Spearman rank correlation coefficient, p < 0.0001) and for only 3/10 watersheds (p < 0.05).
Cryptosporidium not considered for correlation (low number of positive samples).
[69], 2000CanadaRaw river water415Culture method: total coliforms, faecal coliforms, C. perfringensCulture method: cultivable human enteric viruses
Immunofluorescent microscopy: Cryptosporidium, Giardia
Positive significant: between all IMs and all pathogens (Spearman correlation analysis, p < 0.001; logistic regression analysis, p ≤ 0.001).
Table 4. Studies that evaluated the correlation between IMs and pathogens in RW. Studies are presented in descending chronological order, from the most recent to the oldest.
Reference and Publication YearCountryRW TypeNumber of SamplesIndicators and
Detection Method
Pathogens and Detection MethodCorrelation
[70], 2018AustraliaRoof-harvested RW for potable and non-potable use144Culture method: E. coli, Enterococcus spp.
Molecular method: E. coli, Enterococcus spp.
Molecular method: enteropathogenic E. coli, Shiga-toxin-producing E. coli, Shigella spp., Salmonella spp., C. jejuni, C. lari, C. perfringens, Listeria monocytogenes, V. cholera, V. parahaemolyticusOnly Shigella spp. was detected.
Negative significant: between IMs and Shigella spp. (odds ratio, p < 0.05).
[71], 2017AustraliaRoof-harvested RW for potable and non-potable use144Culture method: E. coli, Enterococcus spp.Molecular method: M. avium, M. intracellulareNot significant: for any IMs (nonparametric Kendall’s Tau correlation, p > 0.05).
[72], 2016AustraliaRoof-harvested RW for potable and non-potable use134Culture method: total coliforms, E. coli, Enterococcus spp.Molecular method: M. avium, M. intracellularePositive significant: between M. intracellulare and E. coli and total coliforms (nonparametric Kendall’s Tau correlation, p < 0.05).
Negative significant: between Enterococcus spp. and M. avium (p < 0.05).
[73], 2014AustraliaRoof-captured RW for potable and non-potable use72Culture method: E. coli, Enterococcus spp.Molecular method: A. hydrophilaNot significant: for any IMs (binary logistic regression analysis, p > 0.05).
[74], 2010AustraliaRoof-harvested RW for drinking and non-potable use100Culture method: E. coli, enterococci, spore-forming C. perfringensMolecular method: A. hydrophila, C. coli, C. jejuni, Salmonella, E. coli O157, Giardia lamblia, Cryptosporidium parvumNot significant: for any IMs (binary logistic regression, p > 0.05).
E. coli O157 and C. parvum never detected.
[75], 2001Auckland, New ZealandDomestic roof-collected RW consumed as DW125Culture method: HPC, total coliforms, faecal coliforms, enterococciCulture method: Salmonella spp., Campylobacter spp., Aeromonas spp.
Immunofluorescent microscopy: Cryptosporidium, Giardia
Positive significant: between Aeromonas spp. and all IMs (p < 0.05).
Campylobacter spp. and Giardia never detected.
Table 5. Indicator–pathogen pairs that exhibited an ever-present or ever-absent correlation in at least two water types.
Ever-Present Correlation
IMPathogen
E. coliAdenovirus
Norovirus
Shigella spp.
BacteroidesNorovirus
Salmonella spp.
Shiga-toxin-2-producing bacteria (including E. coli)
Ever-Absent Correlation
IMPathogen
E. coliCampylobacter (coli and jejuni)
Rotavirus
EnterococciCampylobacter (coli and jejuni)
Cryptosporidium
Giardia
C. perfringens and its sporesCampylobacter (coli and jejuni)
Helicobacter
PMMoVCryptosporidium
Giardia
Table 6. Indicator–pathogen pairs assessed in all DWSs.
IMPathogen
Total coliformsCryptosporidium
Salmonella spp.
E. coliGiardia
Salmonella spp.
EnterococciSalmonella spp.
Table 7. Guideline values and quality standards for DW.
WHO GuidelinesUS EPA RegulationsCanadian GuidelinesAustralian GuidelinesDirective (EU) 2020/2184
Guideline valuesMCLG 2MCL 2TT 2Maximum acceptable concentrationTreatment targetNon-mandatory standardsParametric values
Total coliforms Zero5.0% 3-0/100 mL 7- 0/100 mL 8
Thermotolerant (faecal) coliforms0/100 mLZero- 4- 0/100 mL
E. coli0/100 mL 1Zero- 4-0/100 mL-0/100 mL0/100 mL 8
Intestinal enterococci 0/100 mL 8
HPC N/A<500 colonies per millilitre (HPC 22 °C) No abnormal change
C. perfringens including spores 0/100 mL 9
Coliphages 0/100 mL(Somatic coliphages) 50 PFU/100 mL (for raw water) 10
Cryptosporidium Zero-99% removal 5-Minimum 3 log removal and/or inactivation of cysts and oocysts
Giardia lamblia Zero-99.9% removal or inactivation-Minimum 3 log removal and/or inactivation of cysts and oocysts
Legionella Zero-- 6 <1000 CFU/L 11
Enteric viruses Zero-99.9% removal or inactivation-Minimum 4 log reduction (removal and/or inactivation)
Notes: 1 Immediate investigative action must be taken if E. coli are detected. 2 See text for definitions. 3 No more than 5.0% samples total coliforms positive in a month. For water systems that collect fewer than 40 routine samples per month, no more than 1 sample can be total coliforms positive per month. Every sample that has total coliforms must be analysed for either faecal coliforms or E. coli. If two consecutive total-coliforms-positive samples and one is also positive for E. coli or faecal coliforms, system has an acute MCL violation. 4 A routine sample that is faecal coliforms positive or E. coli positive triggers repeat samples. If any repeat sample is total coliforms positive, the system has an acute MCL violation. A routine sample that is total coliforms positive and faecal coliforms negative or E. coli negative trigger repeat samples. If any repeat sample is faecal coliforms positive or E. coli positive, the system has an acute MCL violation. 5 99% removal for systems that filter. Unfiltered systems are required to include Cryptosporidium in their existing watershed control provisions. 6 No limit, but EPA believes that, if Giardia and viruses are removed/inactivated, Legionella will also be controlled. 7 In water leaving a treatment plant and in non-disinfected GW leaving the well. 8 For water put into bottles or containers, the unit is number/250 mL. 9 This parameter shall be measured if the risk assessment indicates that it is appropriate to do so. 10 This parameter shall be measured if the risk assessment indicates that it is appropriate to do so. If it is found in raw water at concentrations > 50 PFU/100 mL, it should be analysed after steps of the treatment train in order to determine log removal by the barriers in place and to assess whether the risk of a breakthrough of pathogenic viruses is sufficiently under control. 11 This parametric value is set for the purposes of Articles 10 and 14 of the Directive (EU) 2020/2184. Actions provided for in those Articles could be considered even when the value is below the parametric value, e.g., in cases of infections and outbreaks. In such cases, the source of infection should be confirmed and the species of Legionella should be identified.
Disclaimer/Publisher’s Note: The statements, opinions and data contained in all publications are solely those of the individual author(s) and contributor(s) and not of MDPI and/or the editor(s). MDPI and/or the editor(s) disclaim responsibility for any injury to people or property resulting from any ideas, methods, instructions or products referred to in the content.

