Article

Surface Water–Groundwater Transformation Patterns in the Jianghan Plain after the Impoundment of the Three Gorges Project and the Opening of the Yangtze-to-Hanjiang Water Transfer Project

1
State Key Laboratory of Water Resources Engineering and Management, Wuhan University, Wuhan 430000, China
2
Hubei Water Resources Research Institute, Wuhan 430000, China
*
Author to whom correspondence should be addressed.
Water 2023, 15(16), 2952; https://doi.org/10.3390/w15162952
Submission received: 14 July 2023 / Revised: 8 August 2023 / Accepted: 11 August 2023 / Published: 16 August 2023

Abstract

:
Understanding the law of surface water–groundwater conversion in the face of high-intensity human activities is still a challenge. In this study, we employed statistical and system dynamics methods to investigate the surface water–groundwater conversion law in the Jianghan Plain following the impoundment of the Three Gorges Project (TGP) and the Yangtze-to-Hanjiang Water Transfer Project (YHWTP). The groundwater level’s long data set was used for the first time to study the water level change and water exchange in the research region after the impoundment of the TGP and the delivery of water from the YHWTP. The findings suggest a significant decrease in the interannual trend of the surface water level and groundwater level in the research region. It was observed that a 1m rise in the surface water level can lead to a 0.11–0.38 m rise in the groundwater level. The water level fluctuation coefficients of the surface water level and groundwater level are influenced by the impoundment of the TGP and the water delivery from the YHWTP, causing them to increase and decrease, respectively. In general, the surface water recharges the groundwater in the studied region. The water exchanges between the surface water and groundwater in the Yangtze River’s main stream, the middle region of the Hanjiang Plain, and the lower reaches of the Hanjiang River are, on average, 10−2 m3/(d·m), 10−5 m3/(d·m), and 10−3 m3/(d·m) orders of magnitude, respectively. The water exchange in the Yangtze River’s main stream was reduced after TGP impoundment, and it was enhanced following YHWTP water delivery.

1. Introduction

Groundwater is a significant freshwater resource and a crucial factor in the water cycle worldwide; it plays a vital role in agricultural irrigation, ecological water usage, and urban development [1,2]. China’s large-scale exploitation of groundwater resources has had a positive impact on agricultural food security and social stability; however, this has also led to land subsidence, seawater intrusion, and ecological deterioration [3,4]. Southern China faces flood control and drainage issues due to the high volume of water [5]; to address these problems, the Chinese government implemented groundwater management laws [6] and has undertaken large-scale projects like the South-to-North Water Transfer Project [7]. Implementing these measures will effectively address the aforementioned issues, leading to improvements in the water resources allocation system, the sustainability of water resources, and the promotion of economic and social green ecological development [8]. The interplay between the large and small water networks in southern China and their impact on surface water and groundwater in the water diversion area presents a new challenge. Understanding the conversion relationship between these networks is crucial to address this issue.
The conversion of surface and ground waters is a complex and dynamic process, which is influenced by various factors such as the hydrological cycle [9], hydro chemical evolution [10], and pollutant migration. The Three Gorges Project (TGP) is a significant national infrastructure project situated in Sandoping, Yichang City, Hubei Province, China [11], and the Danjiangkou Reservoir of the Hanjiang River (also known as Han River) is a water source for the South–North Water Diversion Central Project [8,12], which is part of a large national water network project. The Yangtze-to-Hanjiang Water Transfer Project (YHWTP) is a regional minor water network project [13]. The Jianghan Plain, formed by the alluvial deposits of the Yangtze River’s main stream and the Hanjiang River Basin, is celebrated for a land of fish and rice; it also serves as a crucial source of China’s commodity grain [14]. Scholars have focused on nitrogen, phosphorus, and arsenic in the water chemistry characteristics of the Jianghan Plain [15,16,17,18,19], groundwater hydrodynamic issues [20,21], the relationship characteristics of the rainfall, water sand, flow, and runoff of rivers and lakes in the Jianghan Plain region under climate change [22,23,24,25,26,27]. And there are studies related to the Jianghan Plain cascade reservoirs and watershed reservoir complex [28,29,30,31]. The YHWTP is mainly concerned with ecological flow compensation [32,33]. There has been little study into the relationship between the surface water and groundwater levels in the Jianghan Plain [34,35], as well as the degree of water exchange between the two following the building of the TGP and YHWTP dams.
This research offers the first analysis of the water level change and water exchange of the surface and ground waters in the Jianghan Plain under high-intensity human activity, utilizing the TGP impoundment and YHWTP as case studies. This study utilized daily water level data from hydrological stations in the main stream of the Yangtze River and the lower reaches of the Hanjiang River, collected by the Changjiang Water Resources Commission of the Ministry of Water Resources from 1991 to 2019. In addition, the monitored groundwater well water levels from the Jianghan Plain were also included in the analysis. These water levels were monitored by the Hubei Water Resources Research Institute during the same period. The raw data from both the surface and ground water sources are seasonally adjusted using the Seasonal Trend Decomposition using LOESS (STL) [36] in order to examine the influence of the TGP impoundment and the YHWTP water supply on the water level changes in the Jianghan Plain. The cross-correlation function is used to determine the groundwater level fluctuation caused by rising surface water levels after the seasonal components are removed. This gives a quantitative depiction of the groundwater level variations [37]. The water exchange between the surface water and groundwater in the Jianghan Plain following the TGP impoundment and the YHWTP water delivery was described by the average water quantity exchange per unit width of surface water and groundwater. The research findings can serve as a theoretical foundation for advocating for Yangtze River conservation and water resource management along the ‘Three Red Lines’. Furthermore, these insights may be used to help the construction of both large and local water networks in the region.

2. Materials and Methods

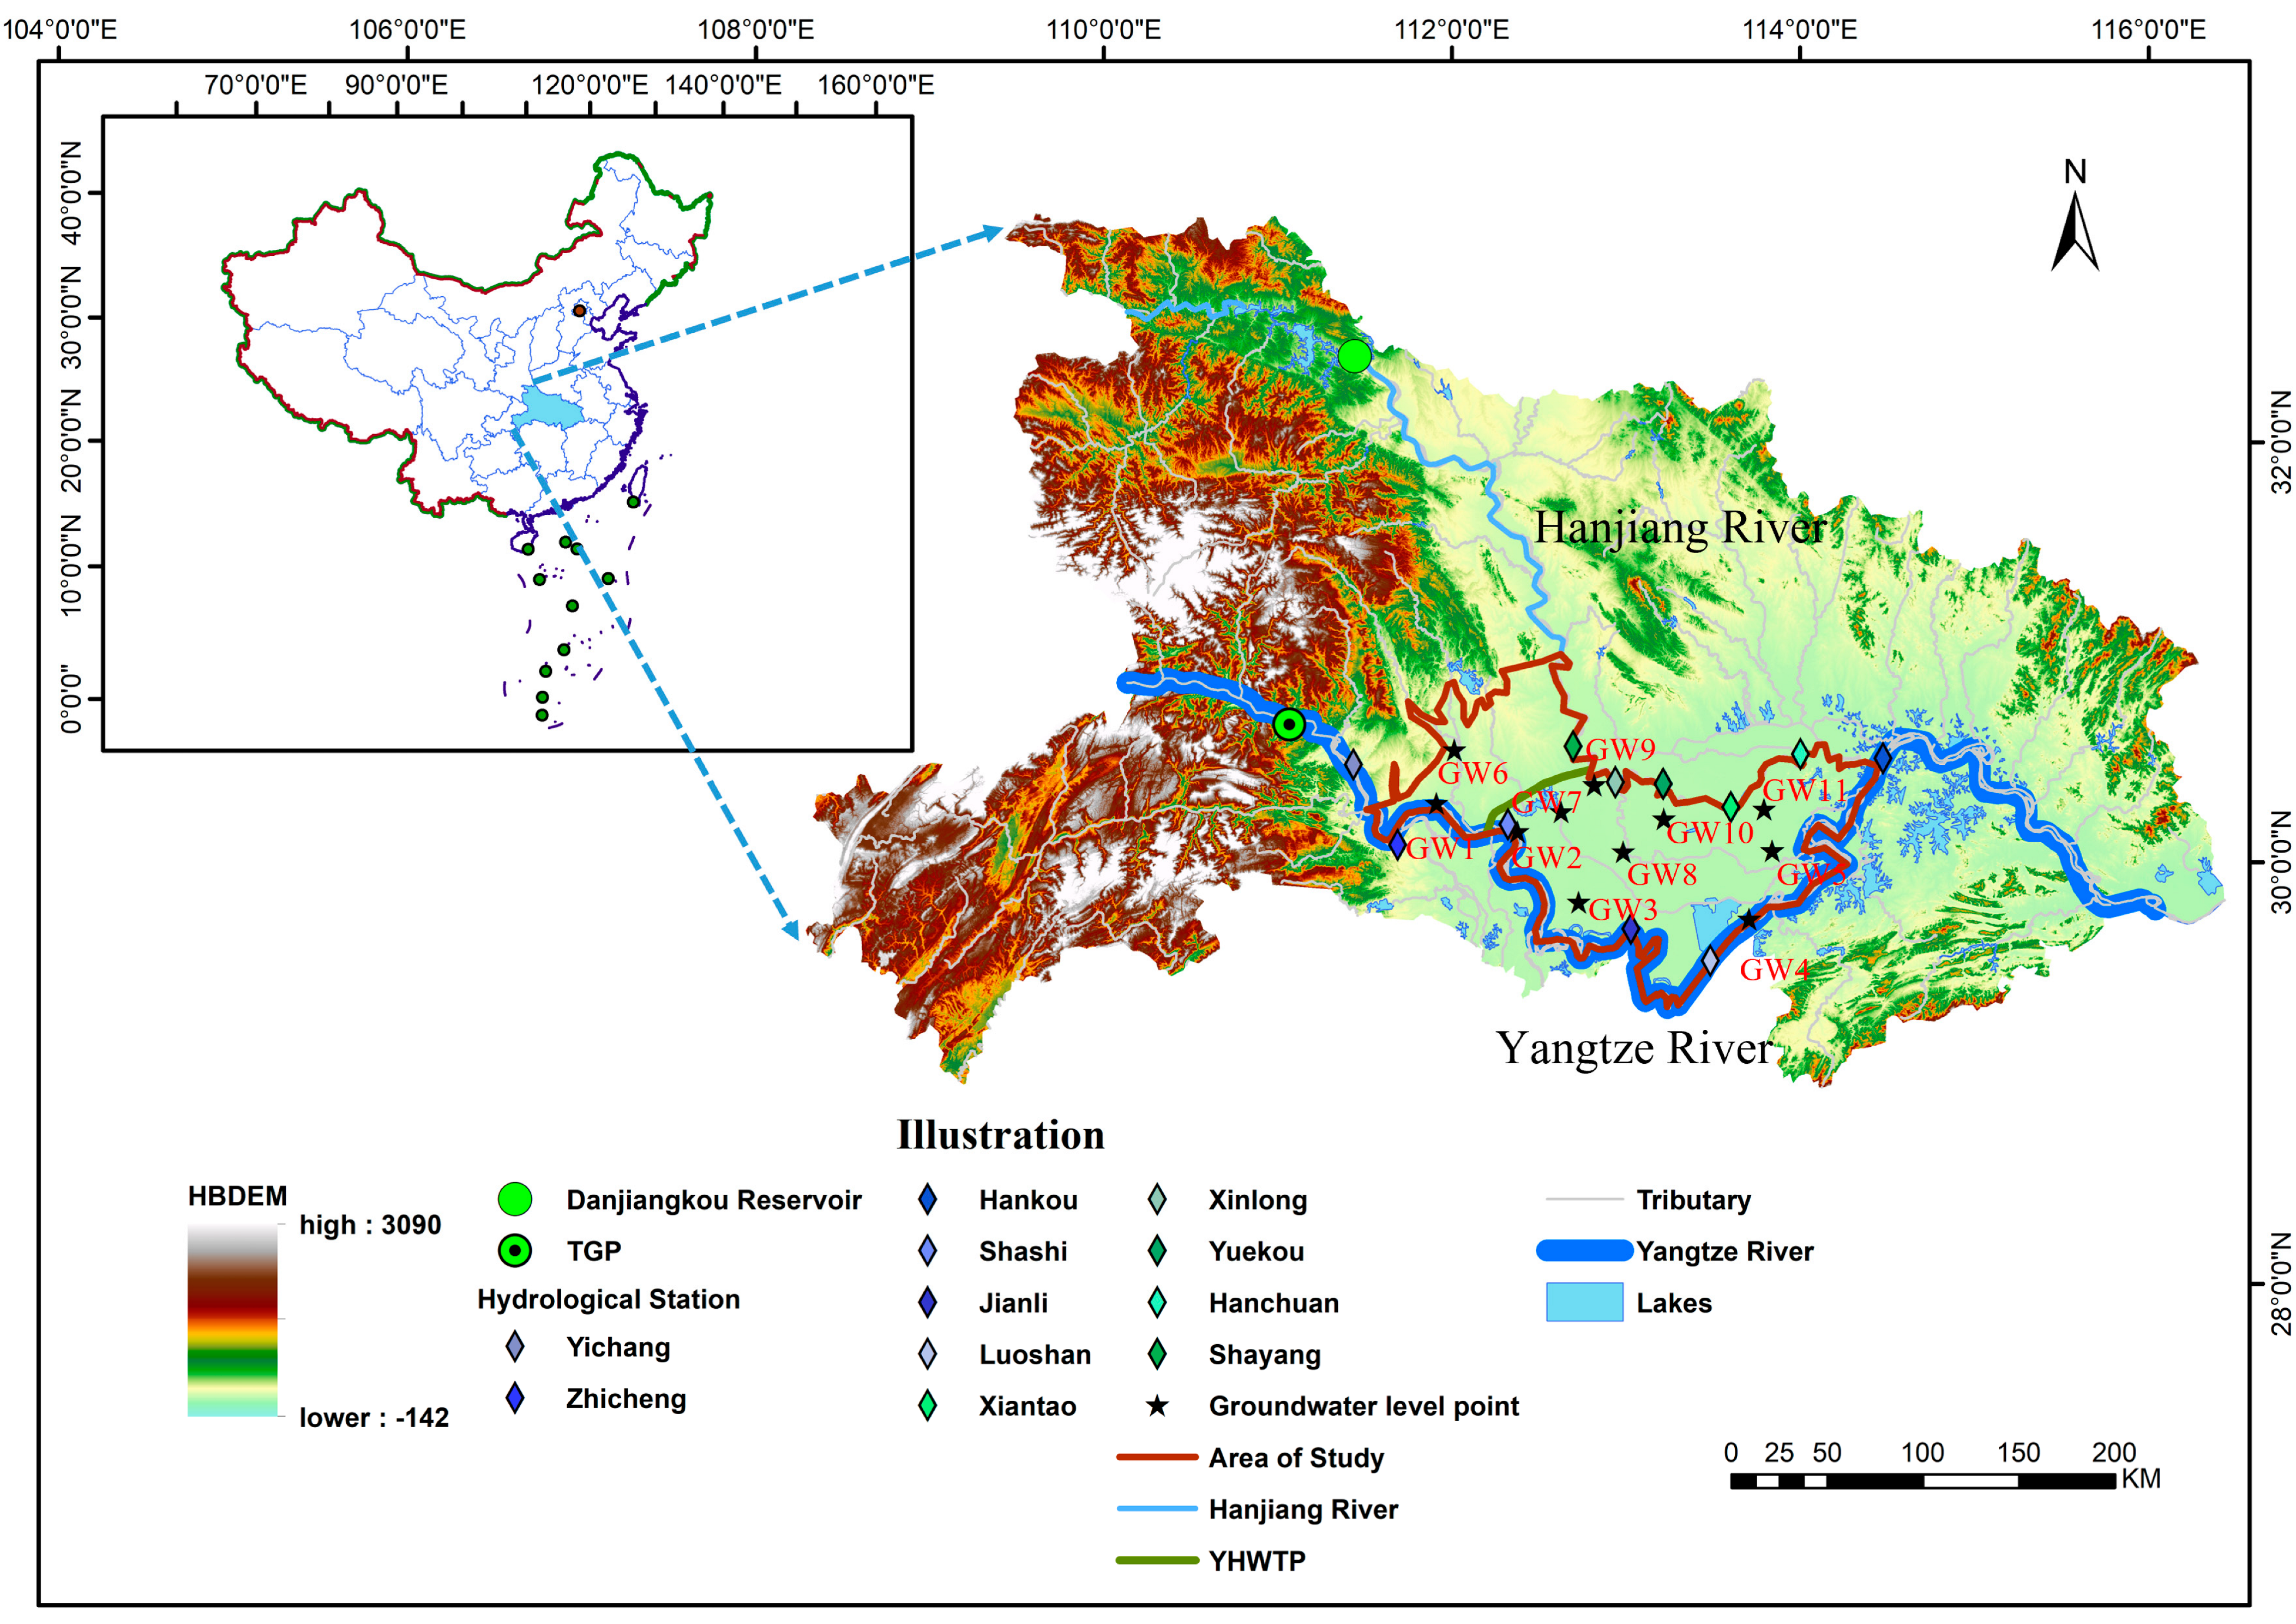
2.1. Study Area Overview

The Jianghan Plain is situated within the latitudinal range of 29°26′ to 31°37′ N and the longitudinal range of 111°14′ to 114°36′ E. Figure 1 shows the geographic position of the research area, along with the main hydraulic projects, hydrological stations, and groundwater level points. The northwest is characterized by low hills, while the east and west have an alluvial plain formed by the Yangtze and Han River basins. The topography of the area is circular disc shaped, with the center of the plain rising gradually in all directions. The plain’s geography has a 1–2° slope from northwest to southeast. It gradually descends from low hills and mountains in the northwest (20–290 m above sea level) to low-lying plains in the central hinterland (20–30 m above sea level). Low hills are often found in front of the mountains, and their surfaces are typically covered by 5–8 m of brownish red and yellowish-brown clay. The central plain area consists of the first and second terraces, which were formed by alluvium from the Yangtze River, Han River, and their tributaries. The surface lithology changes gradually from the front edge of the terraces to the back edge, with a transition from coarse to fine. The area also transitions from sandy to muddy, with a sequence of sand, sandy loam, and clay. In the Jianghan Plain, there is a predominant distribution of high-pitched plains, lakes, and marshes that run parallel to each other. This results in a topographic feature that can be described as ‘big flat but small uneven’.
The Jianghan Plain experiences a humid subtropical monsoon climate characterized by four distinct seasons, ample rainfall, and similar high temperature and rain periods. The average temperature over several years is approximately 17 °C, with slightly higher temperatures observed in the southeast region compared to the northwest region. The regional average monthly maximum and minimum temperature distribution occurs every year in July–August and December–January. From 1991 to 2019, the average rainfall in the studied region varied greatly, ranging from 563.8 to 2004.8 mm. The rainfall distribution showed a spatially increasing trend from north to south, with a relatively consistent east–west orientation. The multi-year average evaporation is primarily concentrated in the summer months, with the highest levels of evaporation observed in July. On an annual basis, the average evaporation amount is approximately 1379 mm.
Due to the abundance of lakes, rivers, and tributaries (for example, the Dongjing River, the Tongshun River, the Four Lakes Main Canal, and so on) in the Jianghan Plain, the surface water and groundwater are closely intertwined. The Yangtze and Han rivers flow through the area, making surface water and groundwater control a crucial element in the region. The TGP Reservoir [38] and the Danjiangkou Reservoir [12] are essential projects for controlling the water flow of the Yangtze and Han rivers, respectively. Additionally, the YHWTP [33] serves as a water transfer project, enabling the Yangtze water to cross the Jianghan Plain and reach the Han River. The YHWTP aims to alleviate the negative effects of the Central Line Water Transfer Project [8] on the lower sections of the Han River. The YHWTP also seeks to improve and manage the river’s ecological environment, agricultural irrigation, urban water use, and navigation.

2.2. Data Source and Time Period Division

For the period of 1991–2019, we conducted a data analysis using surface hydrological stations located in Yichang, Zhicheng, Shashi, Jianli, Luoshan, Hankou, Shayang, Yuekou, Xiantao, and Hanchuan. To gather the necessary information, we collected day-by-day water level data from the Yangtze River Commission (http://www.cjw.gov.cn/ (accessed on 14 June 2022)). From 1991 to 2019, the daily and monthly average water levels of all hydrological stations in the research region were acquired. Rainfall data ranging from 1991 to 2019 were collected using the China Meteorological Science Data Sharing Service (https://data.cma.cn/ (accessed on 14 June 2022)). Groundwater monitoring data for 11 underground water monitoring wells were obtained from the Hubei Water Resources Research Institute. The wells were chosen from different locations, including five wells (GW1–GW5) near the Yangtze River’s main stream, three wells (GW6–GW8) in the middle of the study area, and three wells (GW9–GW11) near the Han River’s downstream. The monthly average water level is used in all surface water–groundwater data due to the difference in monitoring frequency. Groundwater levels are monitored six times per month, while surface hydrological stations monitor the surface water levels multiple times per day.
The years between 1991 and 2019 were divided into three distinct time periods: January 1991 to June 2003, July 2003 to September 2014, and October 2014 to December 2019. The month of June 2003 marked the point at which the TGP storage began, while September 2014 marked the opening of the YHWTP. This article involves more data; only the surface water data exceeded 70,000, so the data collation, data batch processing, water level, and water quantity calculation are all based on RStudio-2022.12.0, and Origin 2023 and ArcMap 10.8 are used for mapping.

2.3. Research Methodology

The goal of this study is to look at how the TGP impoundment and water supply from the YHWTP affect the water level change and water exchange between the surface and ground waters in the Jianghan Plain. This study first focuses on the changes in the surface water–groundwater levels, specifically analyzing the yearly and monthly trends. To address this issue, the STL technique is employed. The STL trend component examines annual changes in the surface water and groundwater levels, whereas the seasonal component examines monthly changes in the surface water and groundwater levels. This study also explores the coefficient of water level change, specifically the coefficient of groundwater rise that occurs due to a 1-m increase in surface water. However, it is important to employ appropriate methods to determine the correlation between surface water and groundwater before proceeding. The coefficients of water level variation for surface water and groundwater are computed by applying the cross-correlation function to the water level data after seasonal adjustment. The water exchange capacity of groundwater and surface water may be calculated by calculating the average water quantity exchange per unit width exchange capacity via the water level. This paper presents the logic behind the method described. The specific formula is outlined as follows.

2.3.1. The Seasonal Trend Decomposition Using LOESS (STL)

A hydrological time series is composed of both seasonal and random components. The seasonal component exhibits relatively constant fluctuations, while the random component is characterized by irregular fluctuations in water level series caused by unpredictable sources such as human activities. These fluctuations are often difficult to explain from a mechanism standpoint. The proposed approach utilizes a recursive procedure, with the inner loop utilizing the LOESS method of local weighted regression. The outer loop nests the robustness process, enabling the separation of time series trend components, seasonal components, and remainder components to be achieved. The na.spline R package is specifically designed for interpolating missing data values in time series decomposition. This package is particularly useful when dealing with continuous data. The STL is calculated as follows [36]:
M t = T t + S t + R t
In the formula, t is the time. At time t , the observed value M t is composed of three components: trend term T t , seasonal term S t , and remainder term R t .
Using a surface hydrological station as an example, it demonstrates how the STL approach is used to analyze the year’s interannual and monthly trends. To begin, the STL calculating program is created in R software. The T t , S t , and R t of the three time periods are calculated using the code written in R software after splitting the original water level data set from 1991 to 2019 by three time periods. The yearly and monthly trend changes of the hydrological station from 1991 to 2019 were determined by combining the trend and seasonal components from three different time periods.

2.3.2. The Series of Average Groundwater Levels in the Studied Area

This study analyzes the interannual trend and monthly changes in groundwater levels within the study region using the average groundwater level sequence in the study area. The following formula [39] was calculated using the Tyson polygon weighting method:
L i = Q 1 l 1 , i + Q 2 l 2 , i + + Q 11 l 11 , i
In the formula, L i signifies the regional average pressured water level for the i month 1 i 348 ; Q m , 1 m 11 denotes the area weight of the hydrological station in the Tyson polygon; and l n , i indicates the monitored water level at the i month’s n monitoring point.

2.3.3. Partial Correlation Analysis

The TGP impoundment and the YHWTP affect the water levels of the Yangtze and Hanjiang rivers, but the process of water level conversion is not well understood and cannot be accurately described using a linear programming approach. The link between the surface water and groundwater is determined before computing the coefficient of water level change. This study employs partial correlations to examine the connections between the TGP and YHWTP on surface water–groundwater following water passage. To investigate the correlation between the surface water level and groundwater level, a partial correlation analysis was performed on the groundwater level and river water level while controlling for rainfall factors. The equations are as follows [40]:
γ s u , p = γ s u γ s p × γ u p 1 γ s p 2 1 γ u p 2
In the formula, after controlling for the variable of rainfall p , the partial correlation coefficient γ s u , p between the river level variable s and the groundwater level variable u can be determined. The correlation coefficients of the river level variable s with the groundwater level variable u , the river level variable s with the rainfall variable p , and the groundwater level variable u with the rainfall variable p are represented by γ s u , γ s p , and γ u p , respectively. The bias correlation coefficient can be classified into four categories based on its strength of correlation: it is weakly correlated when | γ | < 0.3, it has a low correlation when 0.3 ≤ | γ | < 0.5, it has a moderate correlation when 0.5 ≤ | γ | < 0.8, and it has a high correlation when 0.8 ≤ | γ | < 1.

2.3.4. Cross-Correlation Function

The groundwater level point corresponds to the water level of the nearest water level station. The groundwater level corresponds to the average water level of the two hydrological stations if the groundwater level point is located between the two hydrological stations. After determining the original water level data for the surface water and groundwater, the R software’s seasadj function is utilized to remove the seasonal component and to reduce the interference caused by seasonal term components. The seasonally adjusted data set is divided into three time periods, spanning from 1991 to 2019. The cross-correlation function was calculated using R software. Kriging interpolation can be employed to obtain the cross-correlation coefficients of the surface water and groundwater in the Jianghan Plain across these three time periods. The cross-correlation function was calculated [41].
γ x y ( k ) = C o v ( x t , x t + k ) σ x σ y
In the formula, γ x y ( k ) is the cross-correlation function coefficients of the time series x and y ; k is the number of time lag periods; the value taken by x at time t is denoted by x t ; C o v ( x t , x t + k ) represents the covariance between x t and x t + k ; and the product of x x and y standard deviations is denoted by σ x σ y .

2.3.5. The Average Water Quantity Exchange Per Unit Width of Surface Water and Groundwater

To characterize the surface water and groundwater water exchange, the average water exchange per unit width of surface water and groundwater in the study area can be calculated. This can be performed by analyzing a long series of water level observation data from the Yangtze River main stream hydrological stations and groundwater level monitoring wells. An equation obtained from [42] can be used to calculate the average water exchange per unit width as follows:
q = K × h × Δ H L
In the formula, q is the average water quantity exchange per unit width of surface water and groundwater, measured in m3/(d·m); K is the combined permeability coefficient of the streambed sediments and aquifer, m/d; h denotes the average thickness of the buried aquifer in meters; Δ H is the difference in the water level between the surface water and groundwater, m; and L is the distance between the river and the groundwater monitoring well, m. The calculation of the permeability coefficient K of the mixed layer in the research region is associated with several uncertainties. The findings and analysis reveal the variability of the amounts of q .

3. Results and Analysis

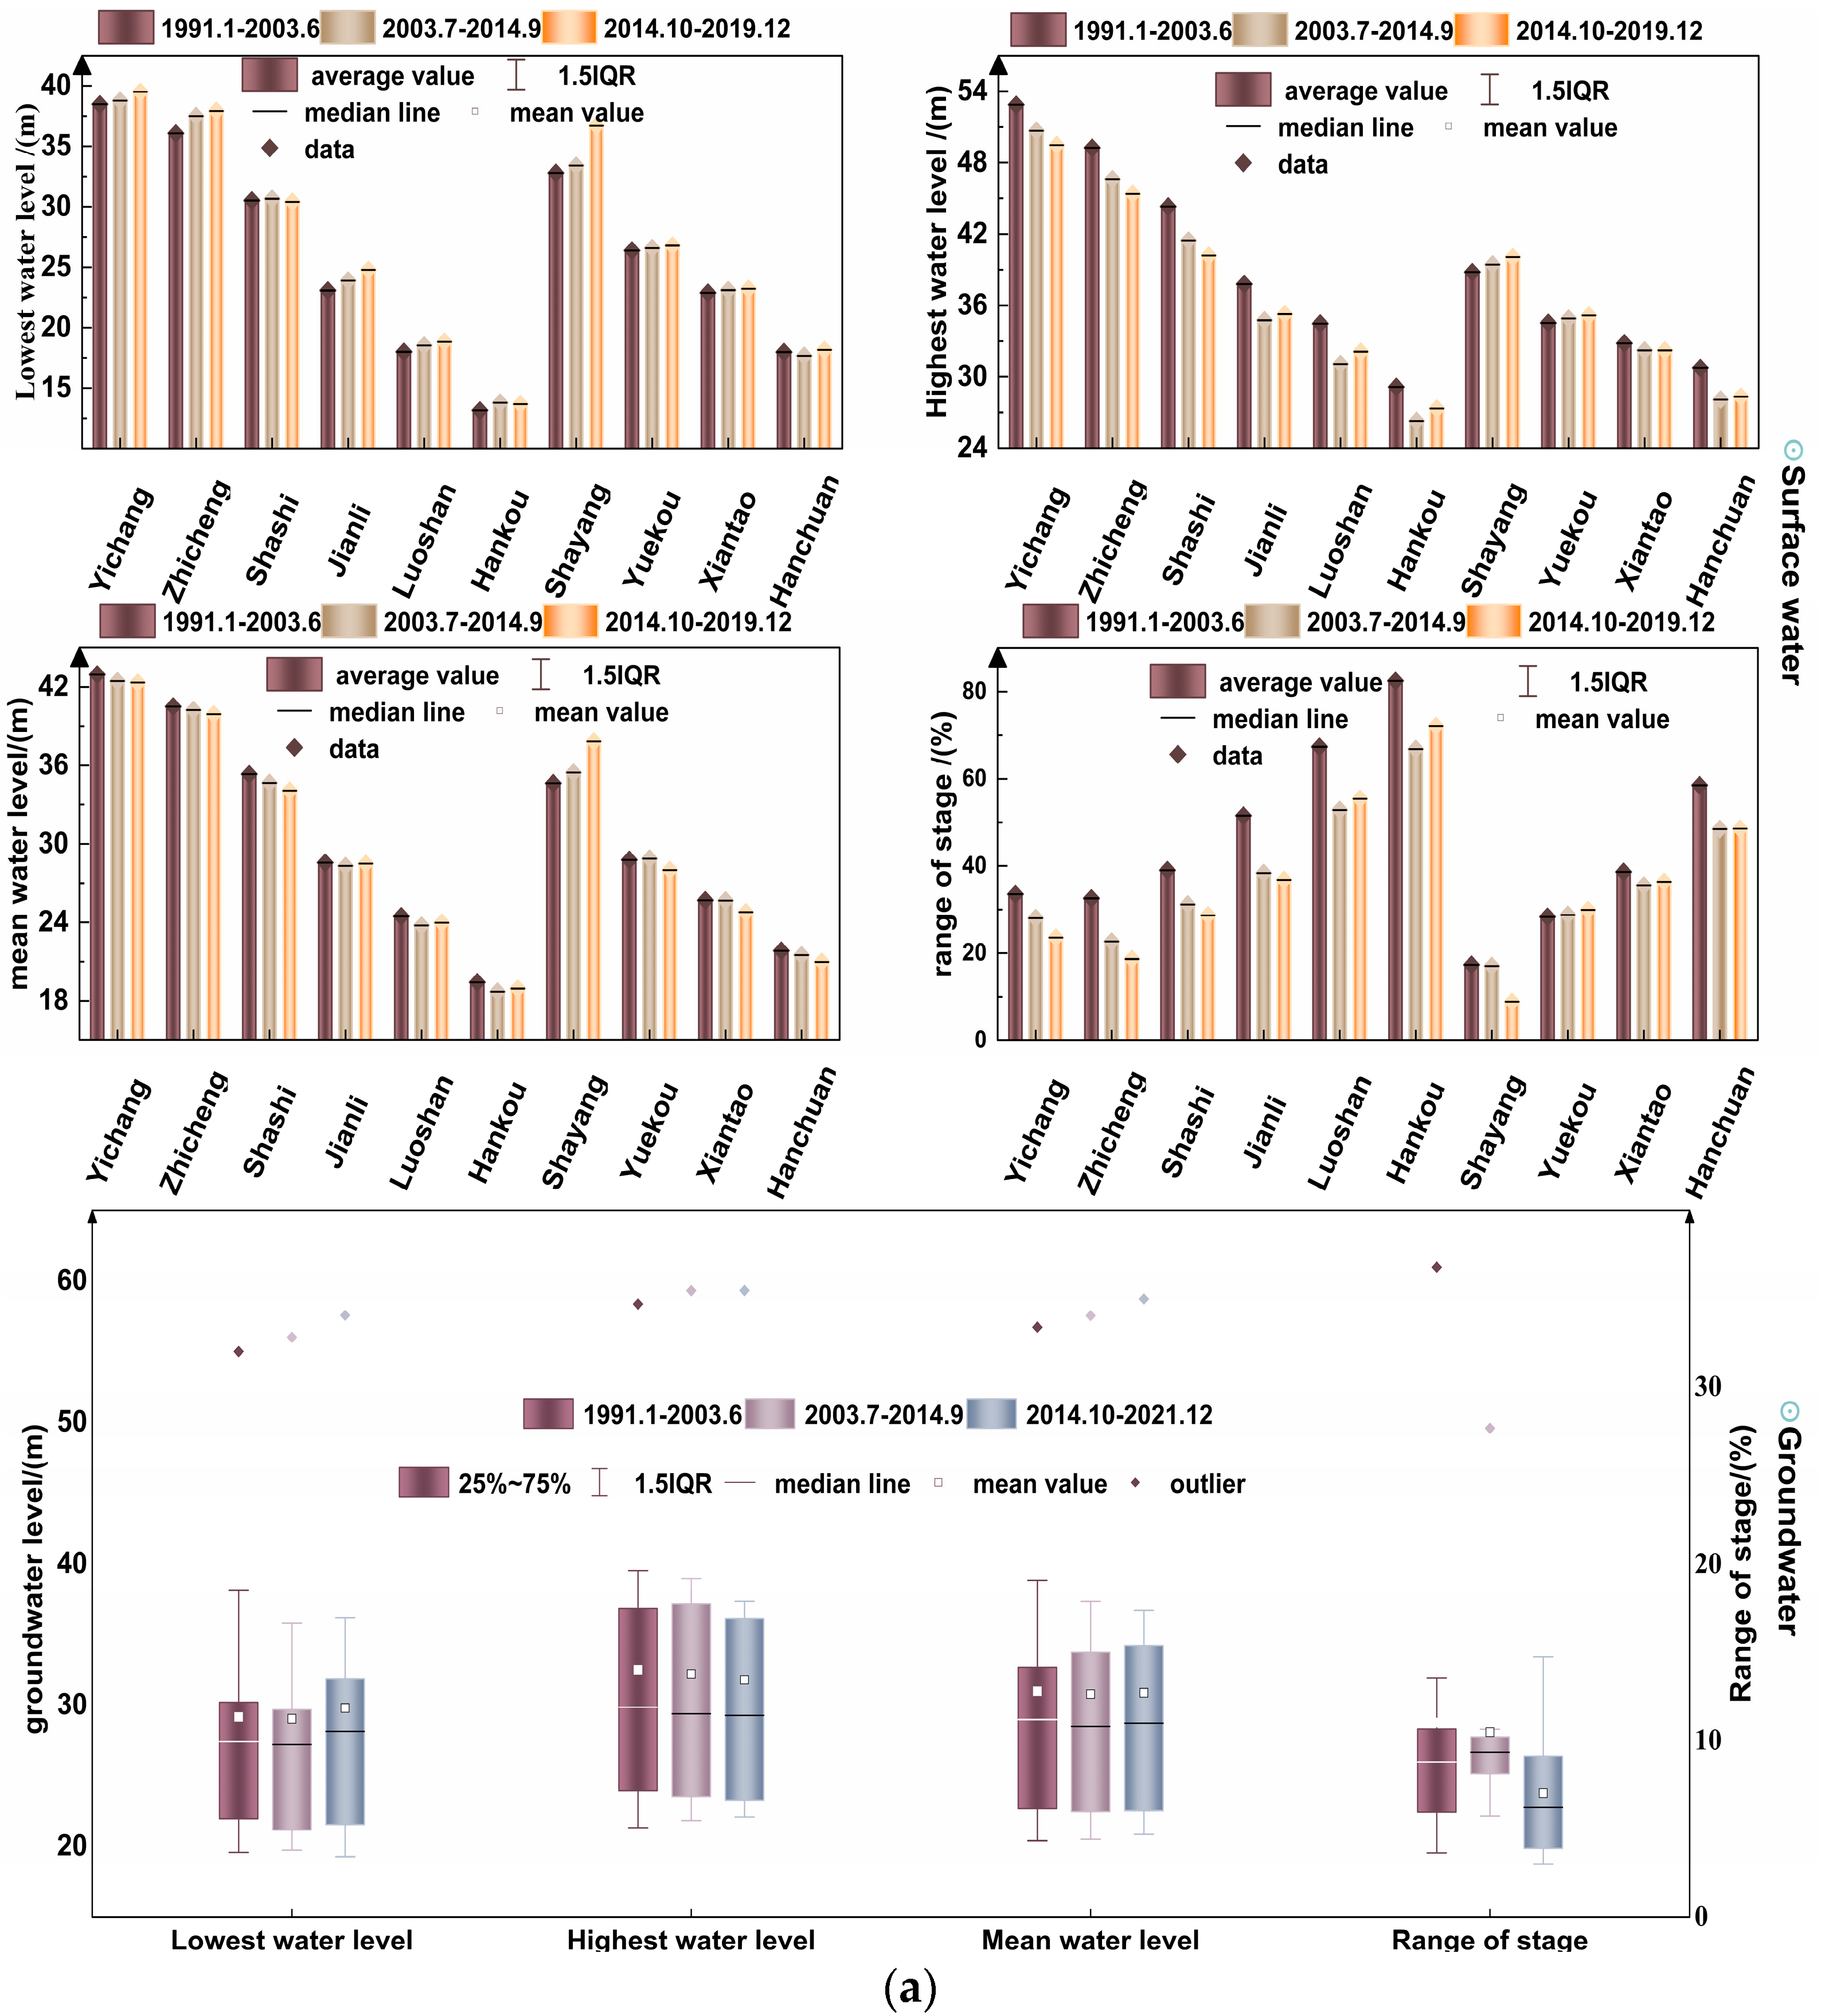
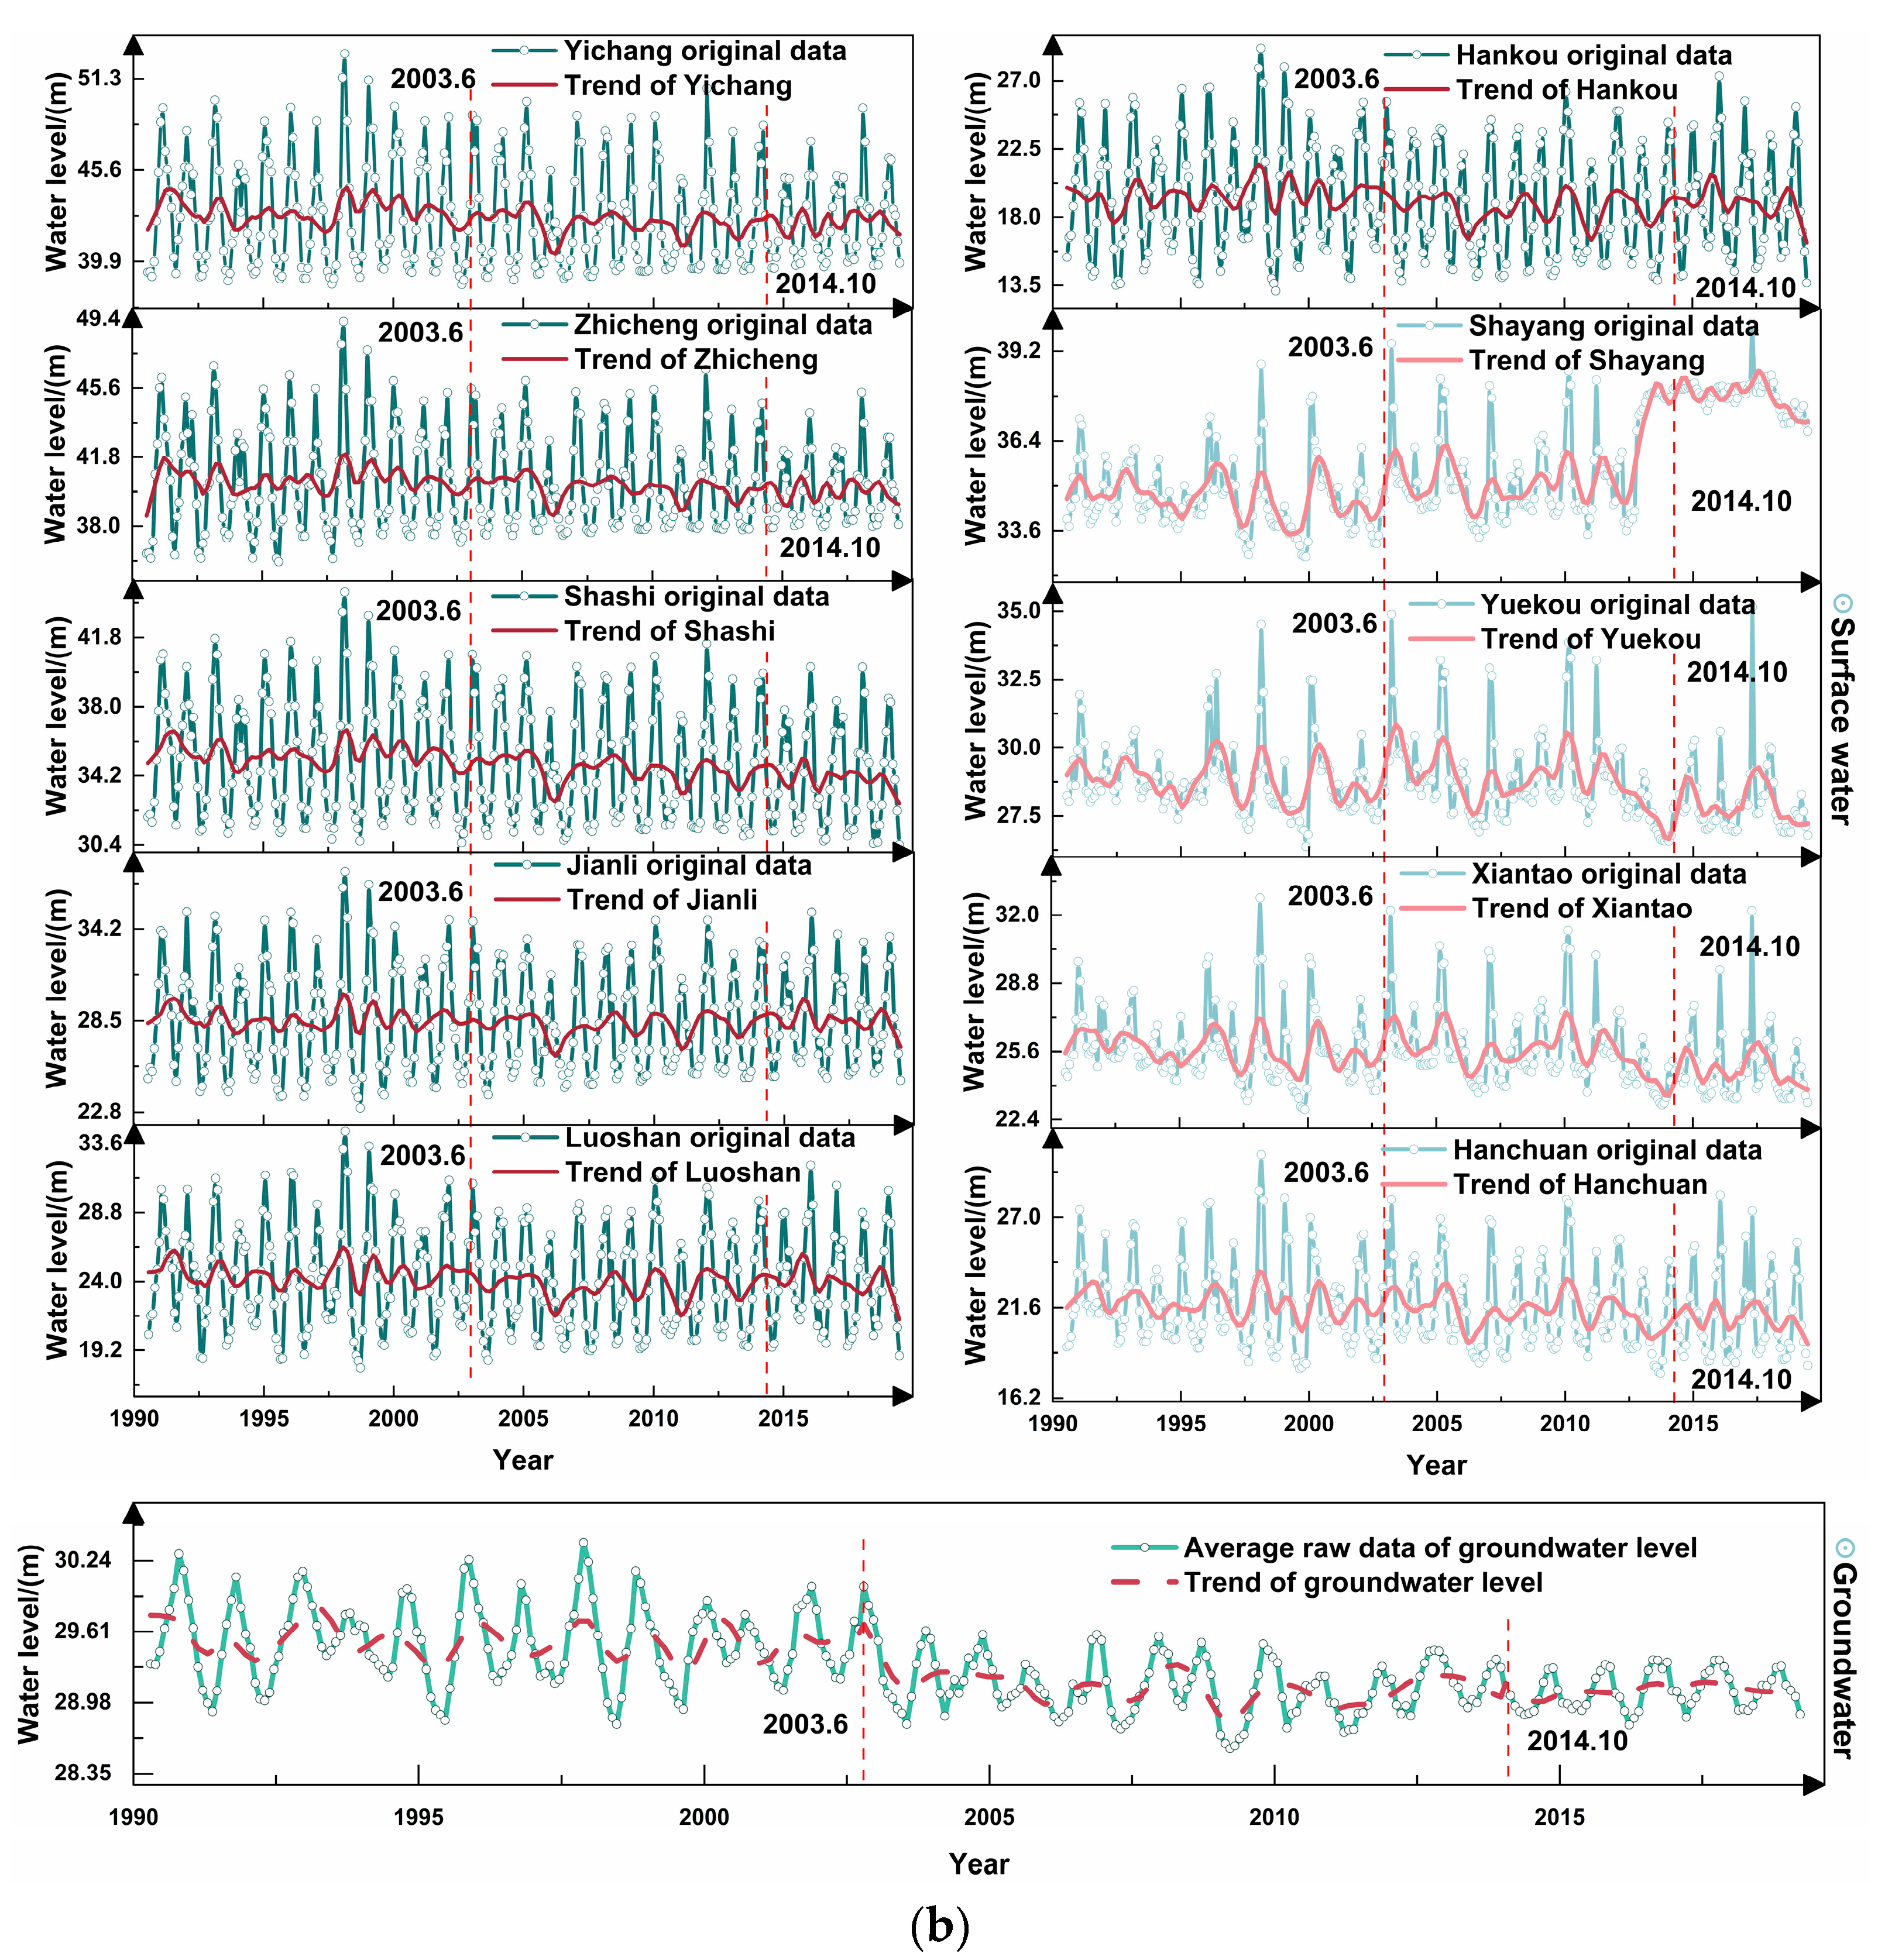
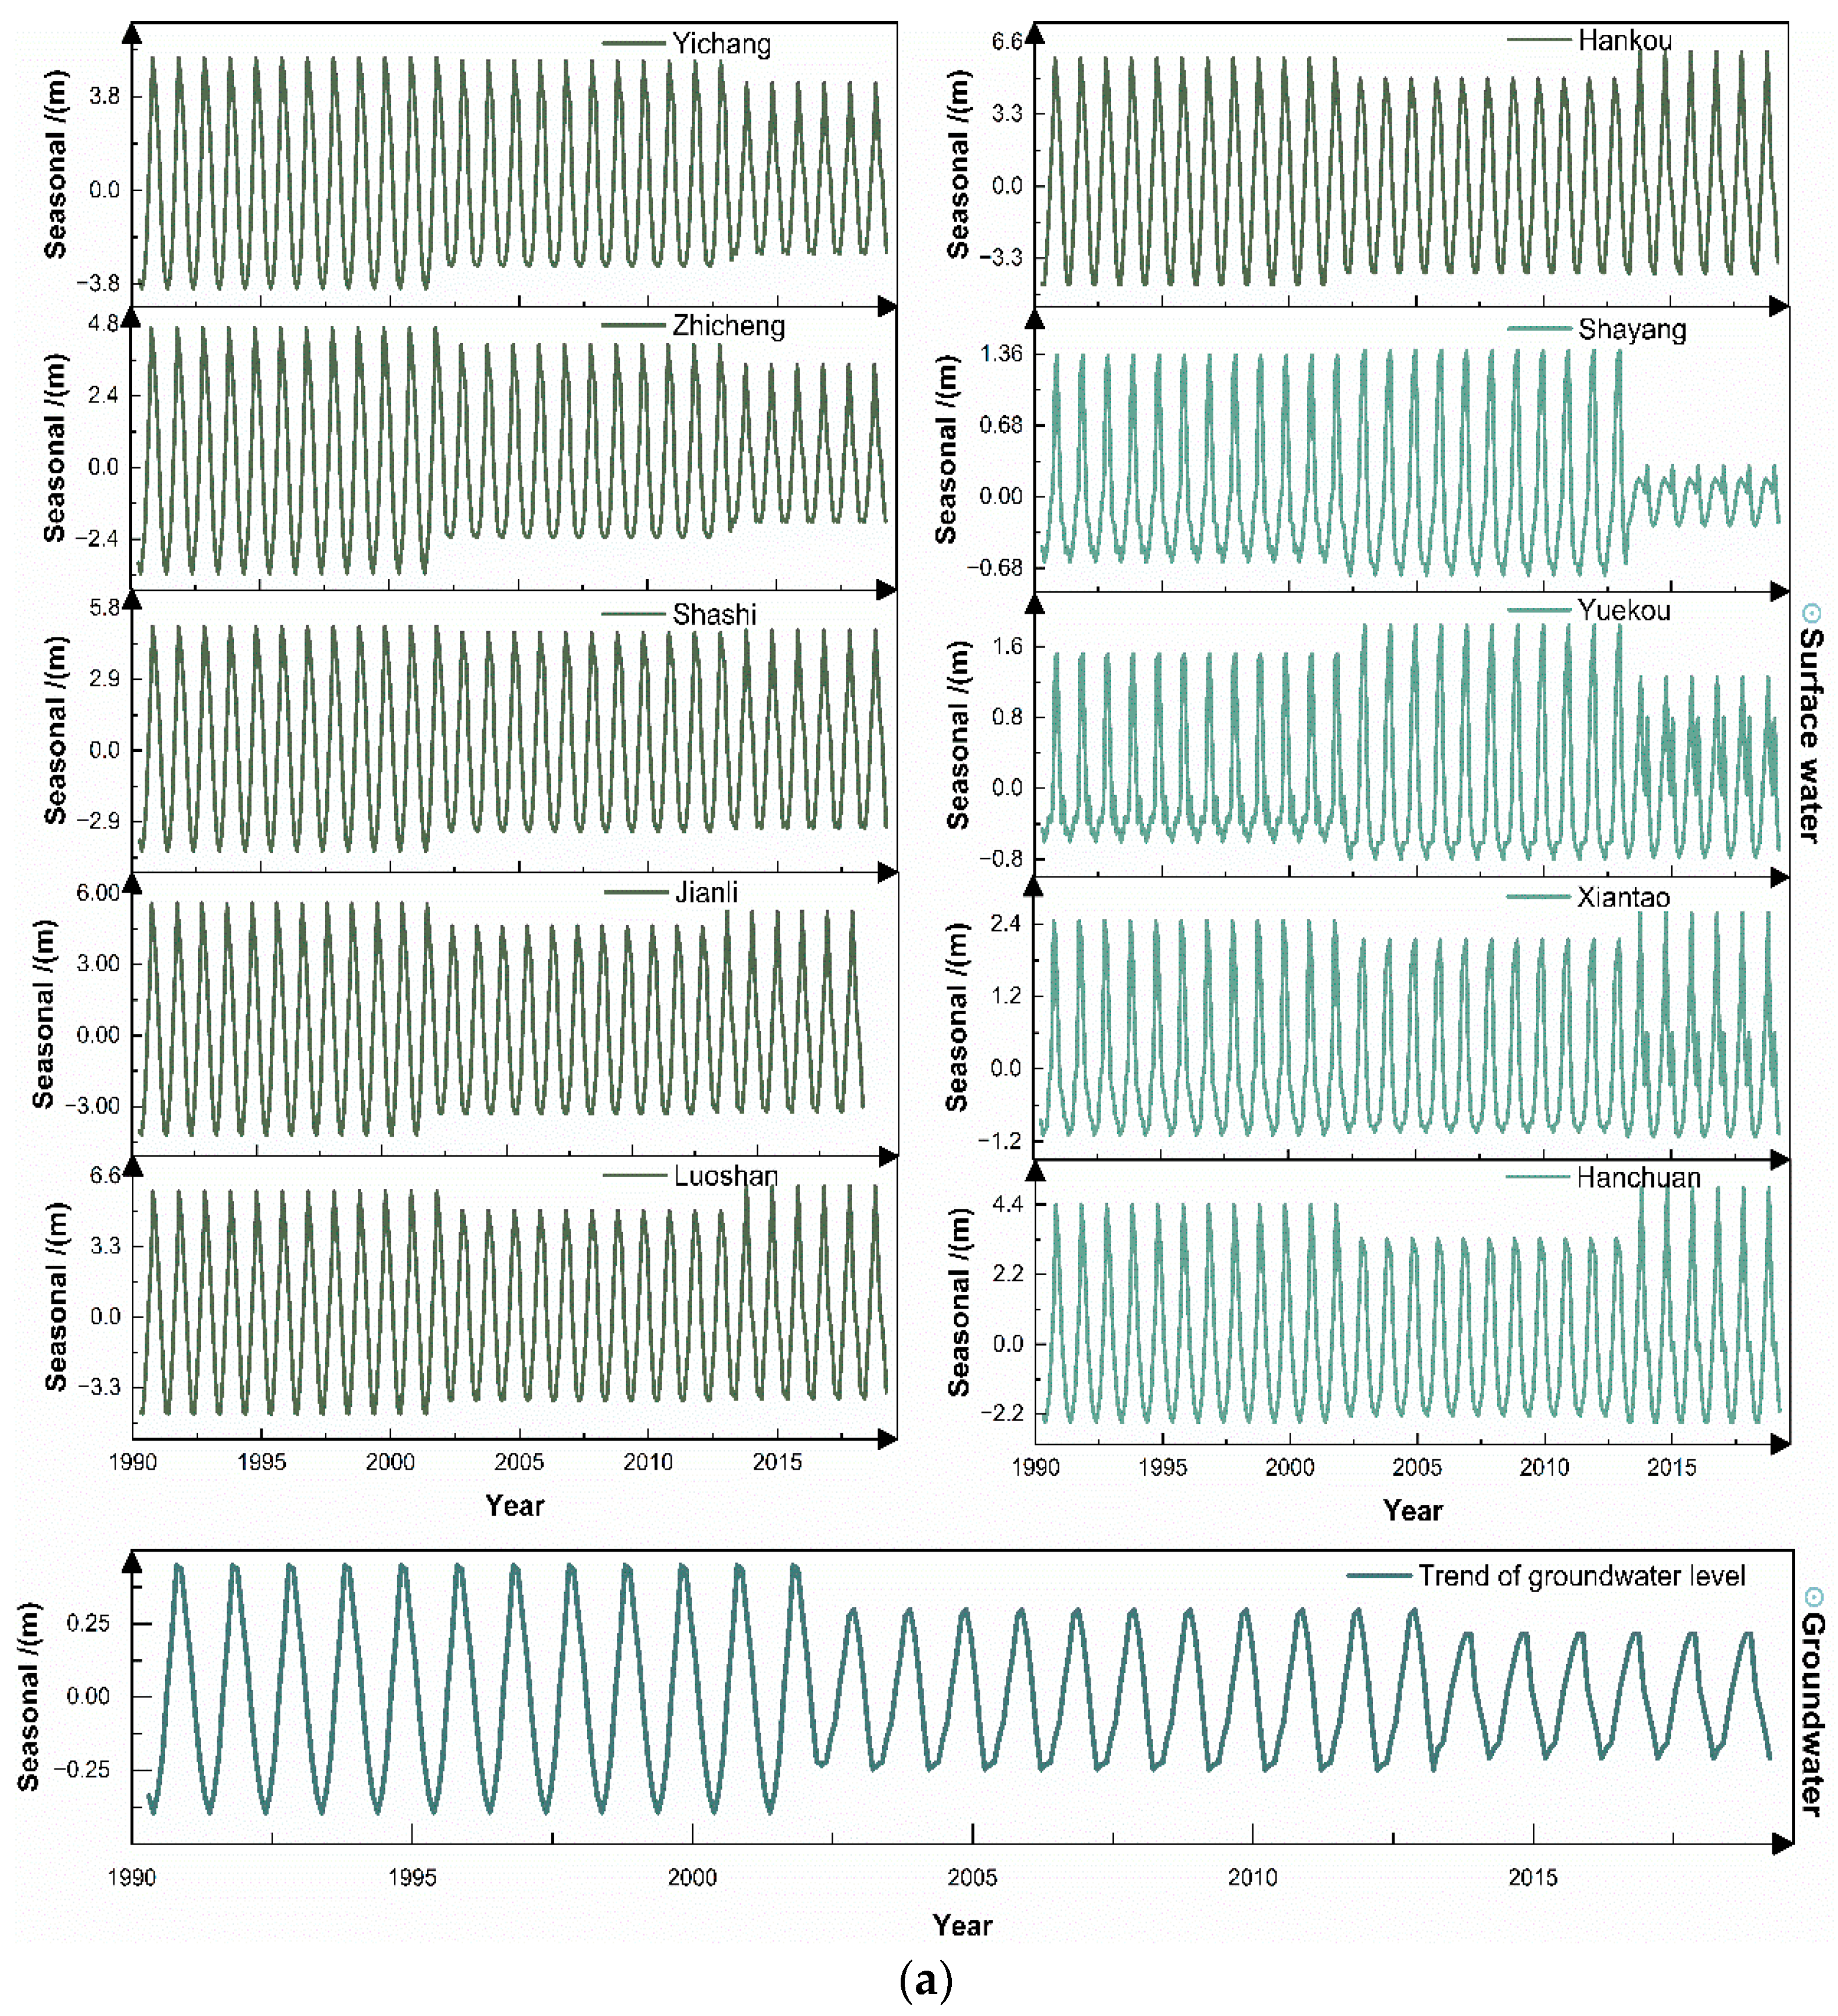
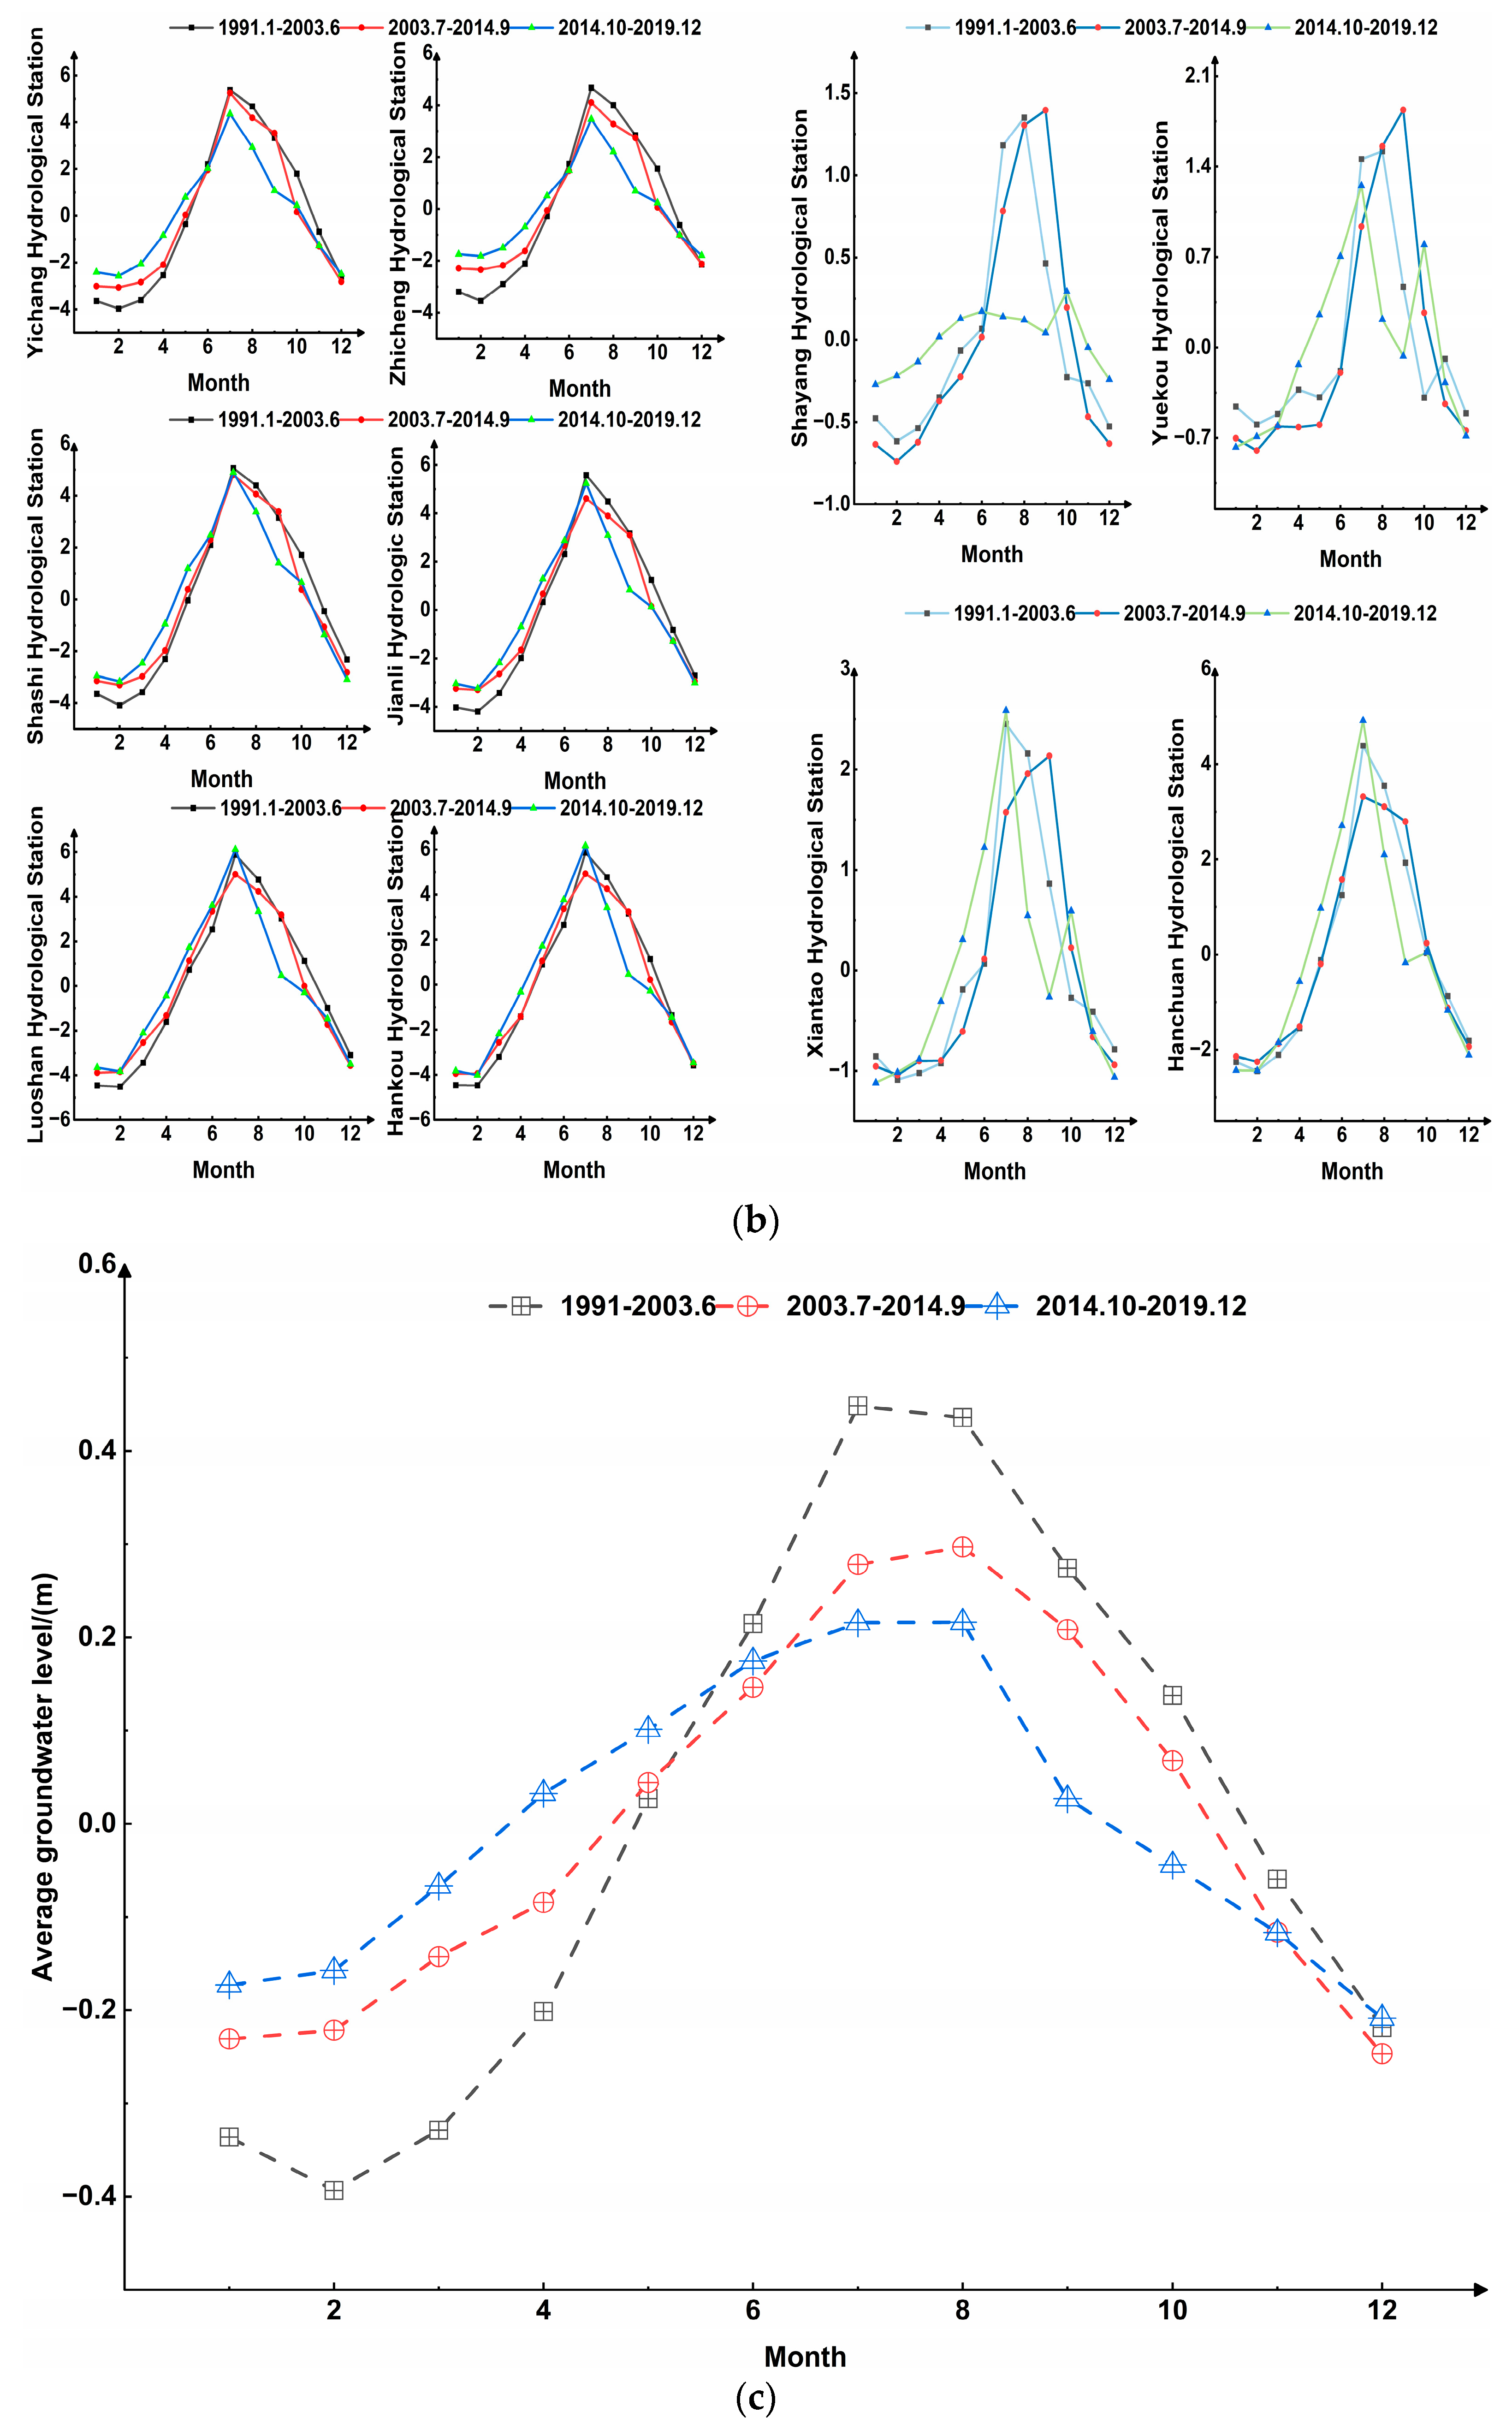
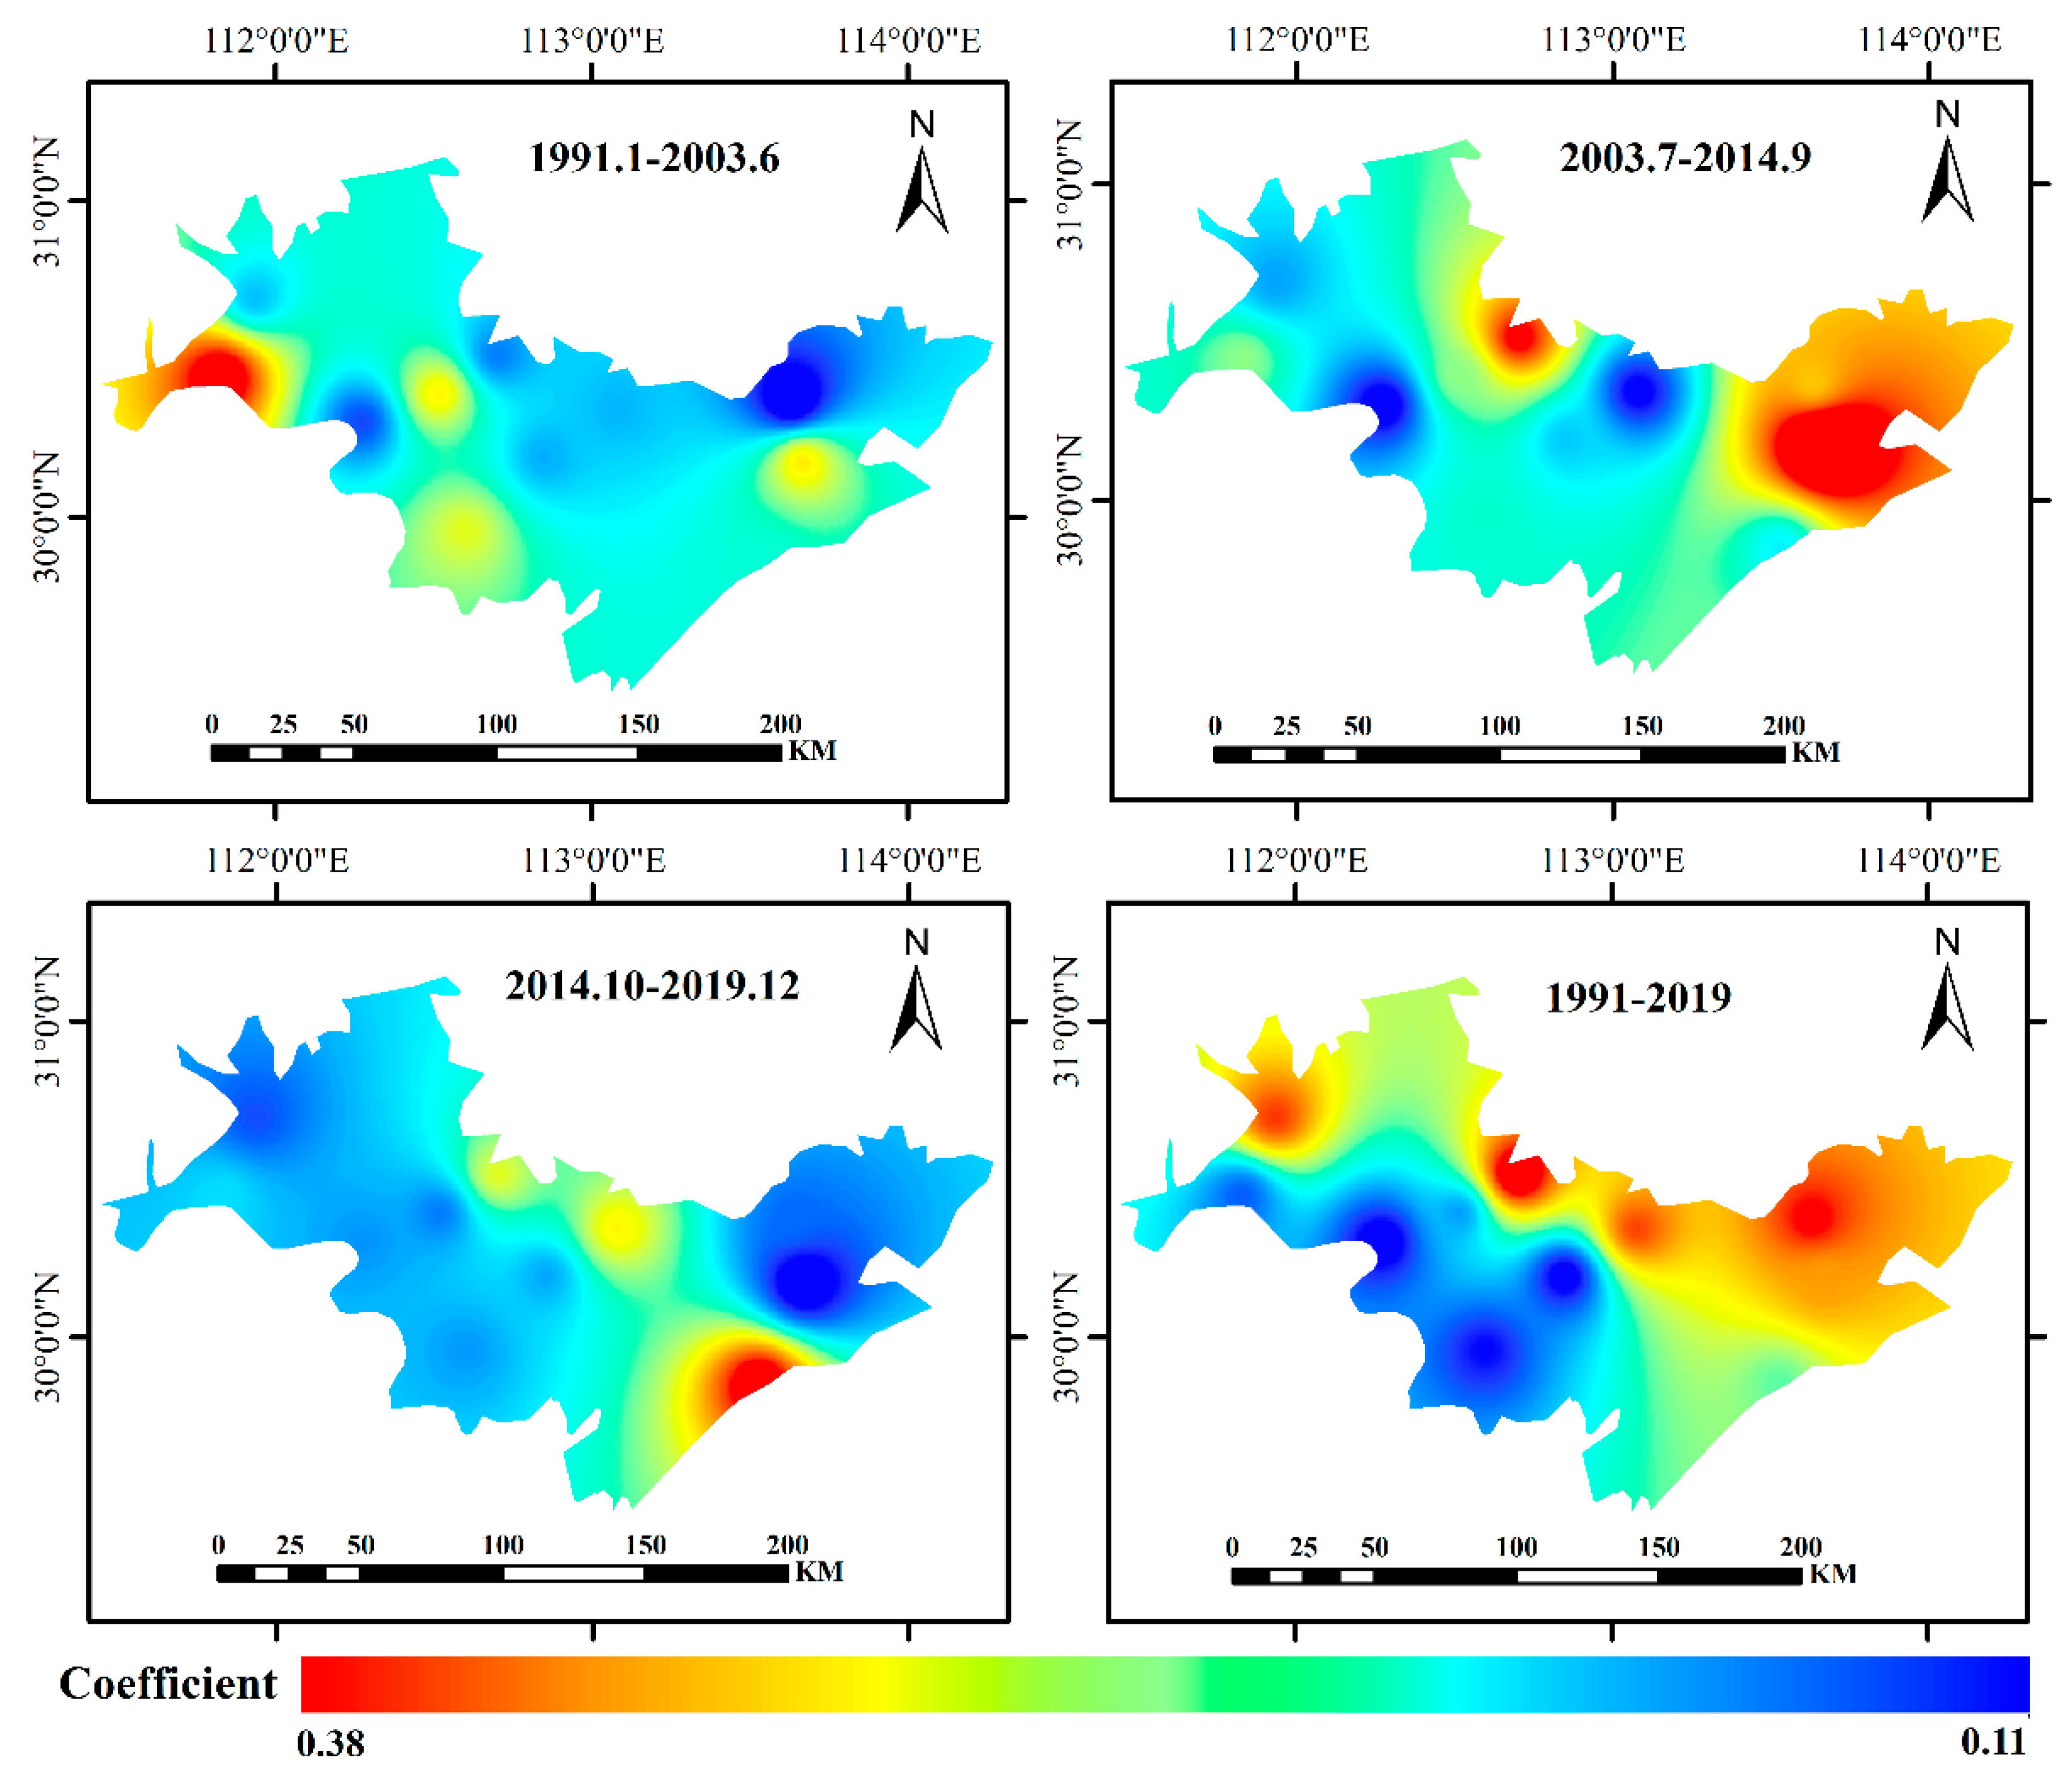
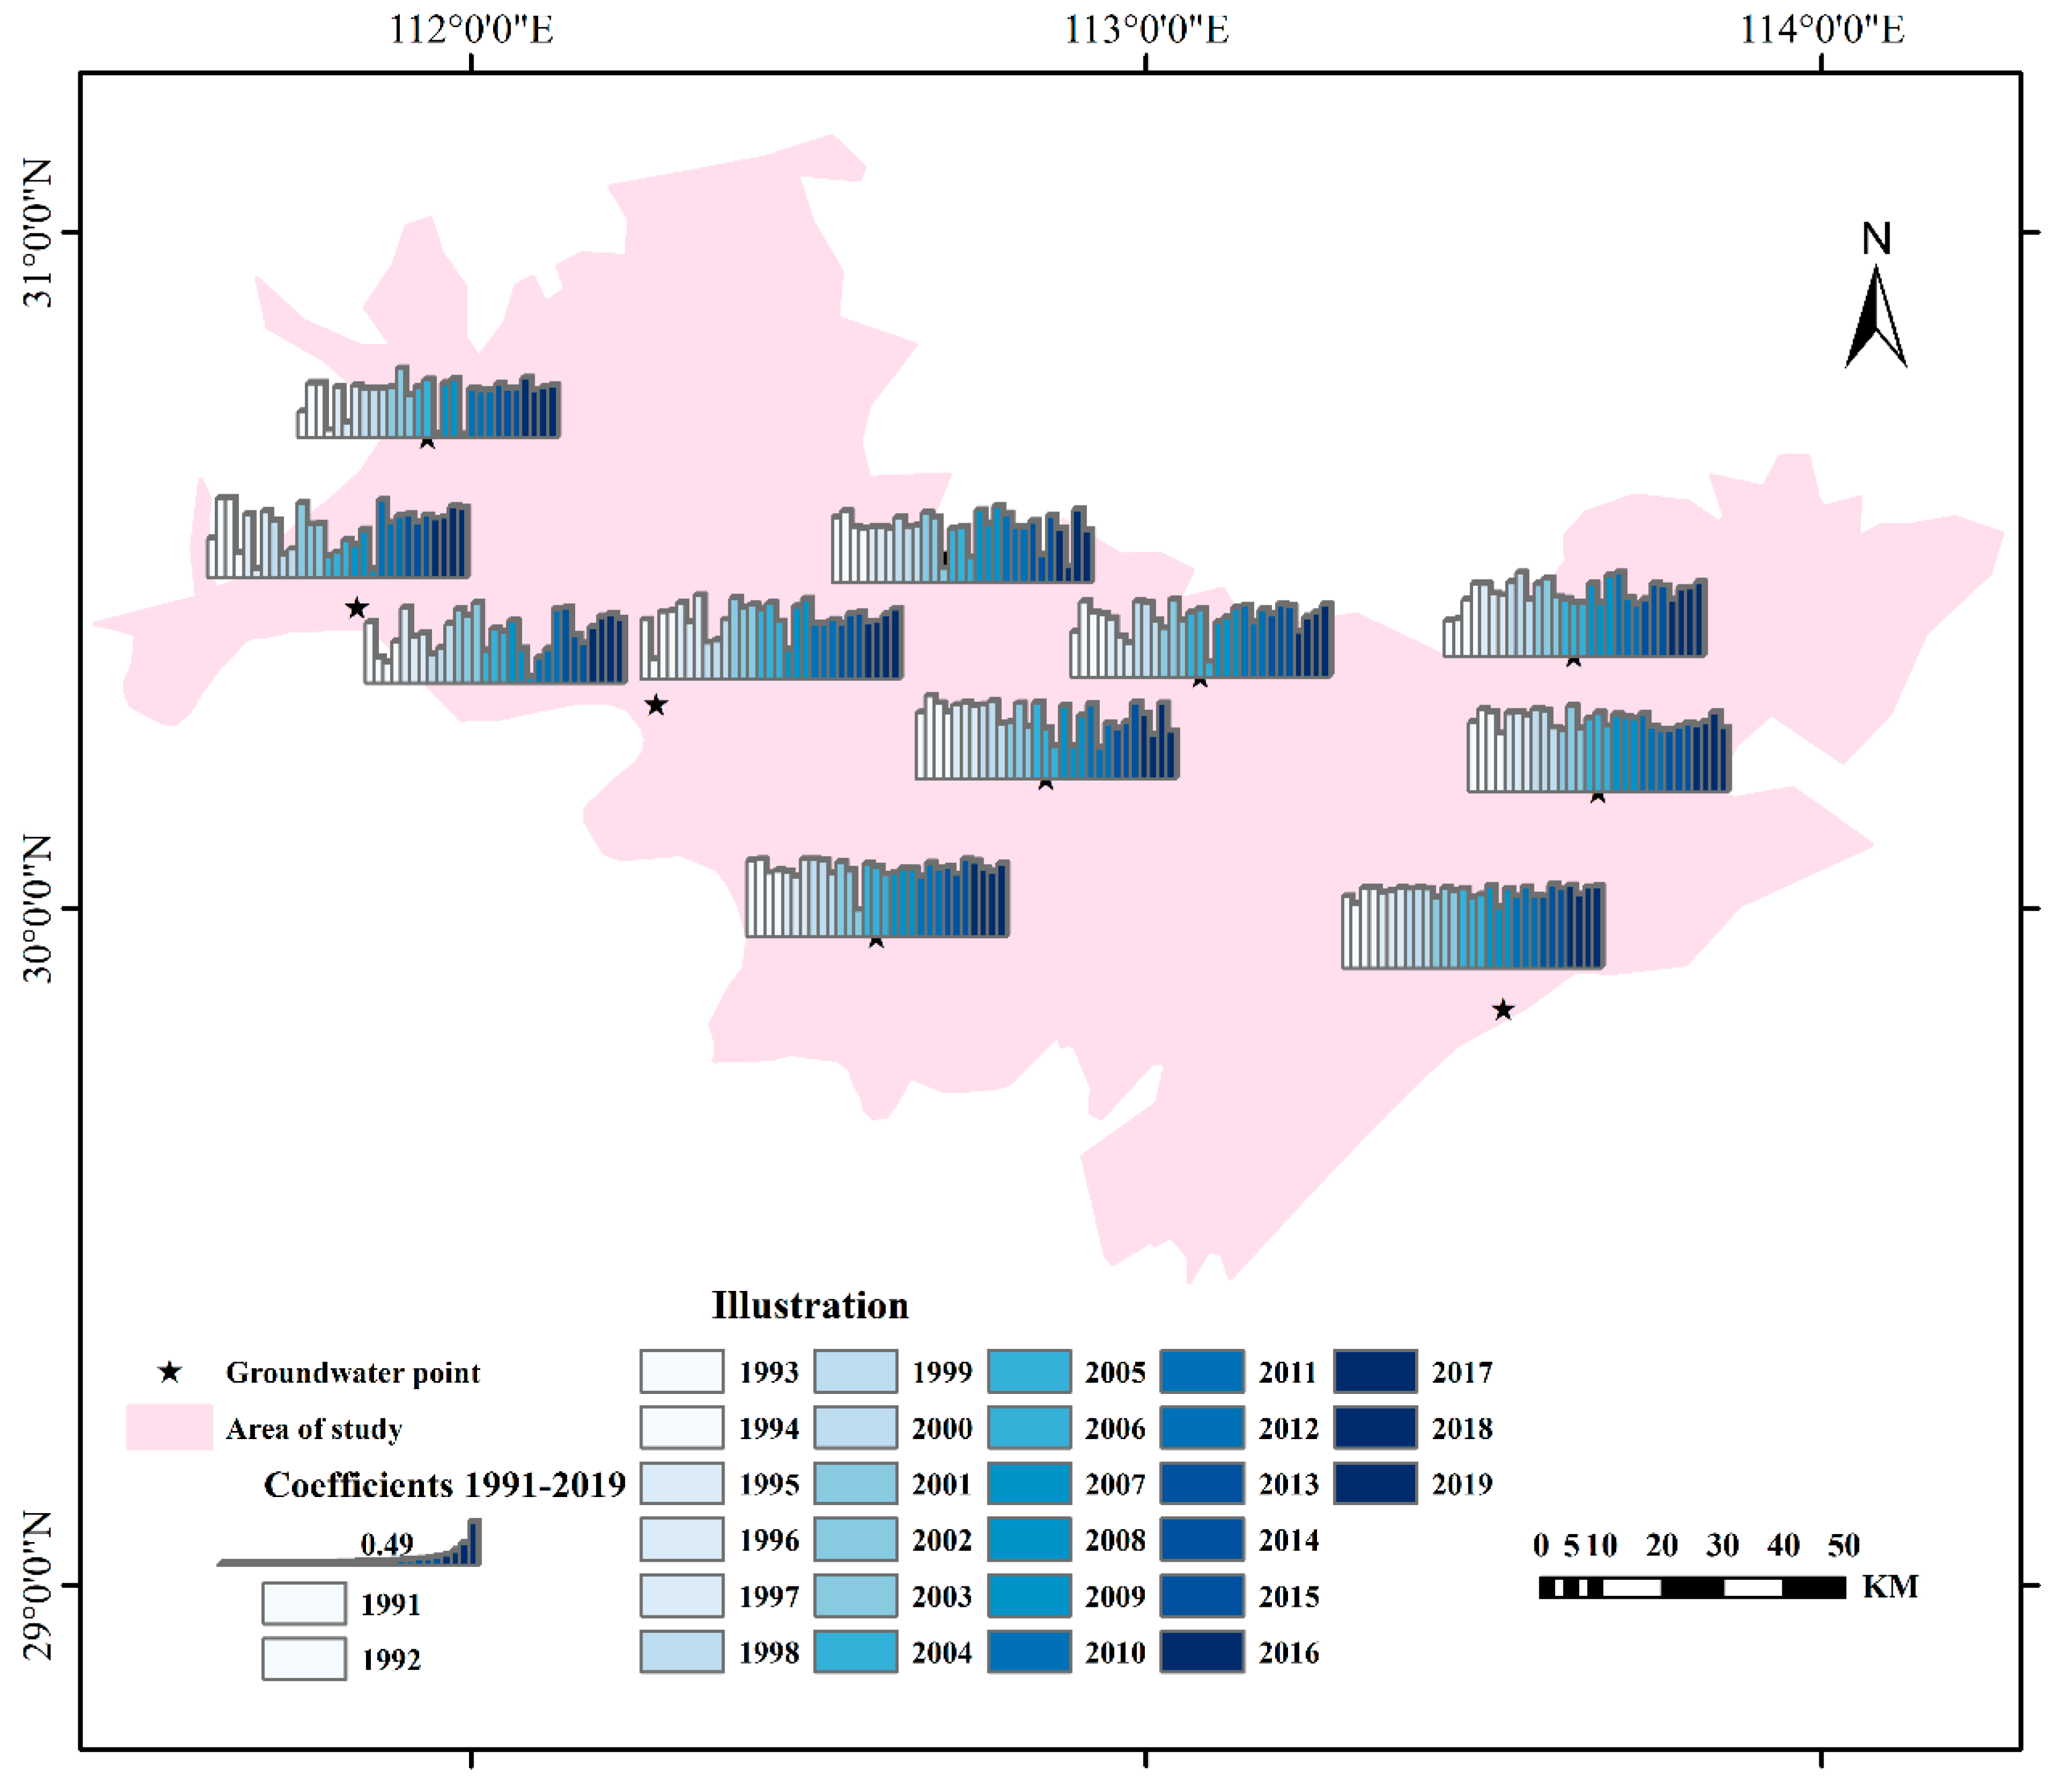
3.1. Temporal and Spatial Variation in Surface and Ground Waters

Both the surface water level and the groundwater level fell significantly. The original data set and the trend item both show an identical increase and fall. The trend term appears smoother when the STL approach decomposes the original water level data. The STL trend component is used to offer a more intelligible depiction of the interannual local change in the water level. Figure 2 depicts the trend variation of the surface water level and the average groundwater level in the study region from 1991 to 2019. The interannual variability of the surface water level trend is mostly consistent, exhibiting a ’same rise and fall’ model. The Yangtze River’s water level is mostly influenced by the TGP storage level. The Three Gorges Reservoir curtailed discharge to ensure the storage level, particularly in 2006 and 2011, and the Yangtze River’s water level dropped significantly. The construction of the Three Gorges Reservoir had a significant impact on the water levels of the Yangtze River. The multi-year minimum water level increased by 0.03–3.13 m, while the maximum and average water levels decreased by 2.18–3.39 m and 0.25–0.72 m, respectively. The water level of the lower Han River is influenced by the combination of the Danjiangkou Reservoir storage and the YHWTP. In 2014, when the YHWTP was opened to water, there was a significant decrease in the water level of the lower Han River. From October 2014 to December 2019, following the implementation of the YHWTP, there were increases in the average water level, maximum water level, and relative amplitude of water level in the lower sections of the Hanjiang River by 0.11–0.48 m, 0.25–0.62 m, and 0.07–1.12%, respectively. The opening of the YHWTP resulted in a decrease of 1.2 m in the maximum water level at the Yichang-Shashi station on the Yangtze River’s main stream. Conversely, the maximum water level at the Jianli-Hankou station increased by 0.51–1.04 m.
From June 2003 to September 2014, following the impoundment of the TGP, there were decreases in the multi-year lowest water level, multi-year maximum water level, average water level, and relative variance of water level by 0.13 m, 0.31 m, 0.20 m, and 0.53%, respectively. From October 2014 to December 2019, after the opening of the YHWTP, there were increases of 0.76 m and 0.09 m in the multi-year lowest and average water levels, respectively. However, there were decreases of 0.40 m and 3.46% in the multi-year maximum and relative variance of water levels.
Figure 3 depicts variations in the seasonal composition of surface water and groundwater from 1991 to 2019. The impoundment of the TGP (2003.6–2014.9) and the YHWTP (2014.10–2019.12) had substantial effects on both the surface water and groundwater. The TGP impoundment, in particular, served to lessen seasonal changes in the Yangtze River’s water level. After the YHWTP was completed, the seasonal component of the water level in the higher reaches of the Yangtze River intake decreased, while the seasonal component of the water level in the lower reaches increased. The impoundment of the TGP resulted in a rise in the Yangtze water’s main stream water level from January to April. It also resulted in a reduction in the seasonal component of the water level from August to December. It can be seen that the water level in the Han River basin typically rises from January to June after the opening of the YHWTP to water. In July, the water level in Shayang station stabilizes, while the water levels in the other hydrological stations remain at their highest. From August to September, the water level drops at a faster rate, and from October to December, the water level changes alternately.
The seasonal component fluctuations were significantly reduced from 0.84 m in 1991 to 0.69 m in 2003 and further reduced to 0.52 m in 2014 due to the impoundment of the TGP and the through-water of the YHWTP. The TGP impoundment and the YHWTP diversion both resulted in a fall in the seasonal term component of the average groundwater level. After implementing the TGP water storage, the groundwater levels in the study area increased by an average of 11.9 cm between January and May, followed by a decrease of 8.5 cm between June and December. The study found that after the opening of the YHWTP to water, the groundwater level in the area experienced an average increase of 3.8 cm between January and June and a decrease of 8.7 cm between July and November compared to the levels before the Three Gorges Project impoundment.

3.2. The Relationship between Surface Water Level and Groundwater Water Level Changes

The cross-correlation function formula was used to calculate the variations in the groundwater level caused by the increase or decrease in the surface water level in the Jianghan Plain following the impoundment of the TGP and the delivery of water from the YHWTP. Figure 4 depicts the relevant results. The impoundment of the TGP and YHWTP in the Jianghan Plain drastically changed the reciprocal connection between the surface water level and the groundwater level. A 1-meter rise in the surface water level was reported to result in a similar rise of 0.11–0.38 m in the groundwater level. The TGP impoundment had a major impact on the association between the surface water and groundwater levels in the studied region. The surface water and groundwater correlation coefficients varied from 0.15 to 0.29. The YHWTP minimized the number of water level interrelationships between the surface water and groundwater in the study region, which was beneficial in minimizing the effects of the South-to-North Water Diversion Central Project’s water transfer. Excessive agricultural and urban water withdrawals caused low groundwater level and surface water level correlation statistical data in the research region after the YHWTP was activated.
The R software was used to write the bias correlation calculation code, and the bias correlation coefficient of the surface water–groundwater was computed by inputting the rainfall, surface water, and groundwater data, and the results are shown in Figure 5. During the research period, there was a substantial or strong correlation between the groundwater and surface water levels’ bias correlation coefficients for 115 years, which accounts for 36% of the studied period. The data indicate a strong correlation between the groundwater and surface water levels, suggesting a high capacity for water exchange and hydraulic connection between the two. Regarding the bias correlation between the surface water and groundwater, the number of strongly correlated and highly correlated years for the three time nodes was 58, 37, and 20 years, respectively, accounting for 41%, 31%, and 36% of the three time nodes. The correlation between the surface water and groundwater decreases after the TGP impoundment but increases once the YHWTP is opened to water. This leads to an improvement in the hydraulic link between the groundwater and surface water levels.

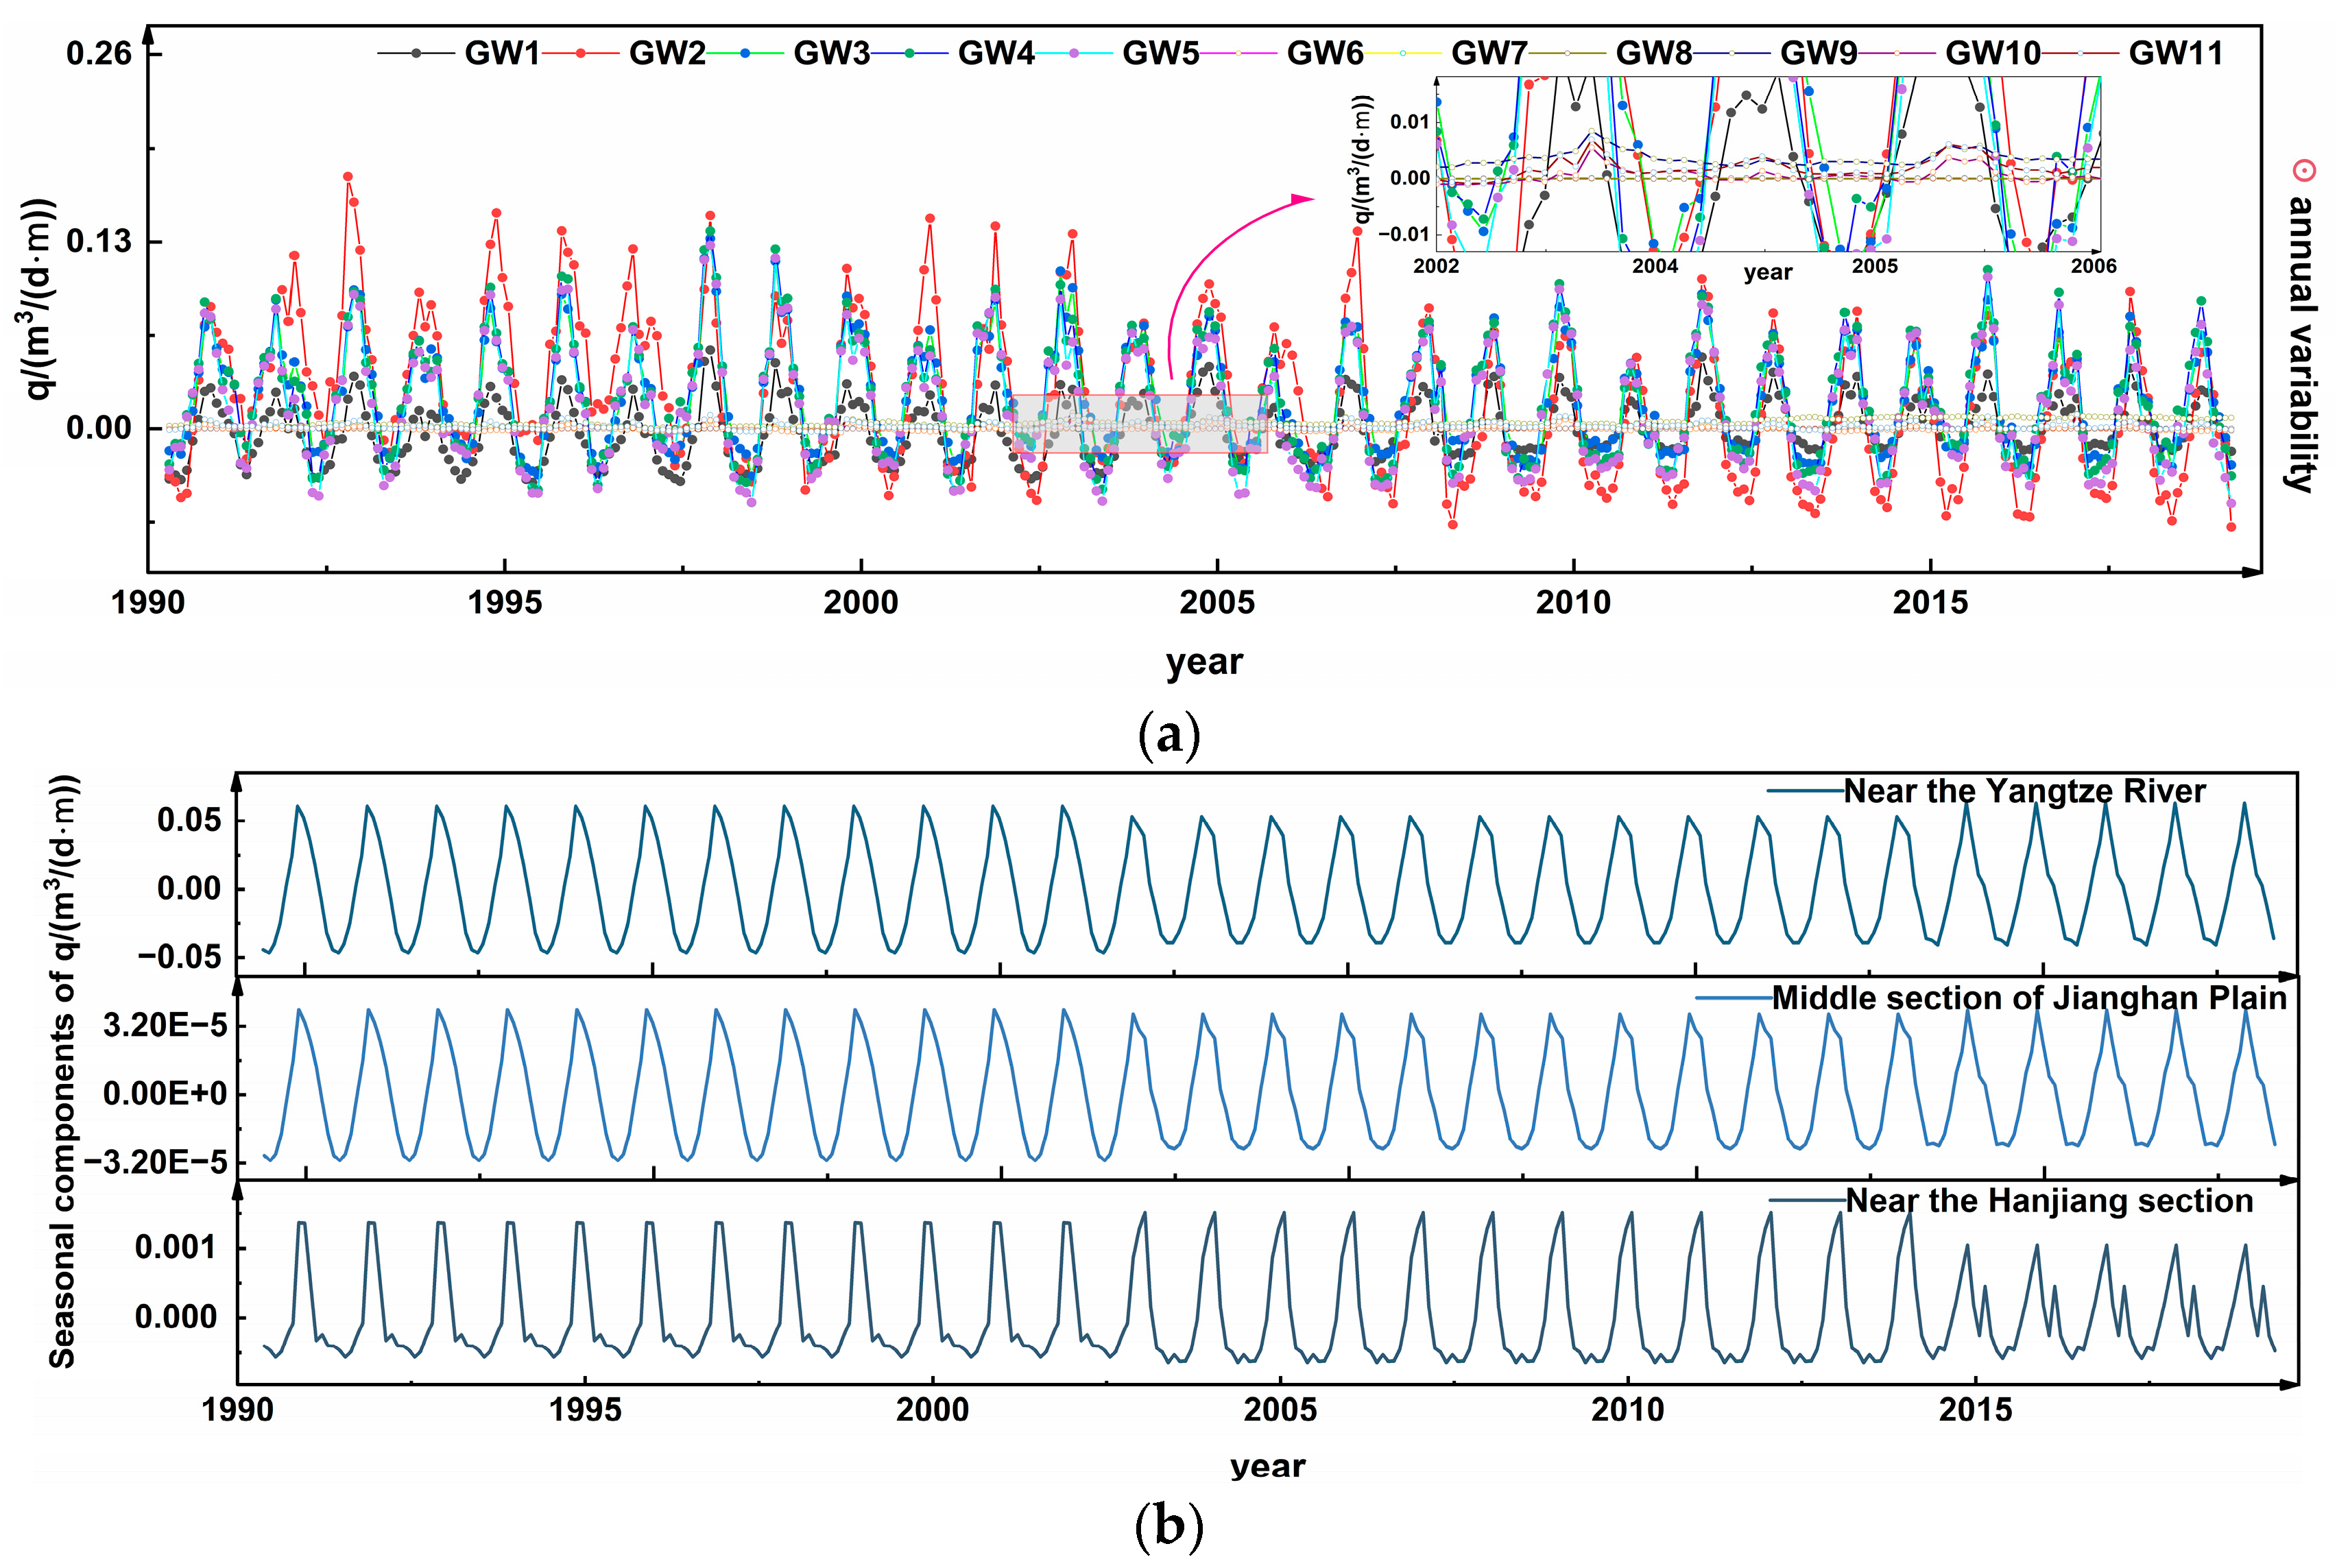
3.3. Volume Changes in Water Transferred between Surface Water and Groundwater

Figure 6 depicts the quantity of water exchanged between the surface water and groundwater in the research region from 1991 to 2019. When the surface water in the study area recharges the groundwater, a positive value is assigned to q , and vice versa. Based on the q calculations, the average of the main stream section of the Yangtze River is approximately 10−2 m3/(d·m). The interannual trend of q varies steadily, and the recharge–discharge relationship indicates that groundwater recharge to the surface water occurs during dry periods, while surface water recharge to the groundwater happens during abundant periods. The interannual variation of q in the central section of the Jianghan Plain is relatively small, averaging at 10−5 m3/(d·m). This can be attributed to the distance between its monitoring wells and the Yangtze River’s main stream water level stations, resulting in a small hydraulic gradient. As a result, the calculated results are small, and the overall relationship between the groundwater recharge and the surface water is presented. In the vicinity of the Han River, the recharge rate is approximately 10−3 m3/(d·m), and the typical recharge relationship is from the surface water to the groundwater. However, during the dry period from 1998 to 2000, the recharge relationship was from the groundwater to the surface water due to a significant flood event in 1998 (GW9–GW11 wells).
The q value of the surface water–groundwater in the Yangtze River’s main stream was computed using hydrological stations (Yichang, Zhicheng, Shashi, Jianli, Luoshan, and Hankou) and GW1-GW5. The q value of the surface water–groundwater in the Jianghan Plain’s middle portion takes into account the Yangtze River’s hydrological stations (Yichang, Zhicheng, Shashi, Jianli, Luoshan, and Hankou) and GW6-GW8. The Hanjiang River Hydrological Station (Shayang, Yuekou, Xiantao, and Hanchuan) and GW9-GW11 evaluate the surface water–groundwater q value of the Hanjiang River’s main stream. The results of using the STL technique to compute the intra-annual seasonal term variation process of q for the Yangtze River’s main stream section, the Han River’s main stream section, and the center portion of the Jianghan Plain in the research region are depicted in Figure 6. According to our research, the TGP impoundment caused a decrease in the q of the Yangtze River’s main stream portion and the Jianghan Plain’s center section by 1.40 × 10⁻² m3/(d·m) and 7.61 × 10⁻⁶ m3/(d·m), respectively. However, it improved the q of the Han River basin by 3.87 × 10⁻⁴ m3/(d·m). The opening of the YHWTP reduced the q of the Han River basin by 6.82 × 10⁻⁴ m3/(d·m), but increased the q of the Yangtze River main stream section by 7.74 × 10⁻³ m3/(d·m) and the Jianghan Plain section by 4.89 × 10⁻⁷ m3/(d·m). This is mainly because the optimal scheduling scheme changes the relationship between water level and flow after the TGP storage and YHWTP opening. Additionally, the opening of water along the YHWTP channel improves the surface flow and connects it to the surrounding surface water.

4. Discussion

This study explored the changes in the surface water–groundwater level changes and water exchange in the study area when the underlying surface conditions in the research region change, specifically focusing on the TGP and the YHWTP. The trend term of the STL method might help to explain the interannual trend changes observed in the different scenarios mentioned earlier. On the other hand, the seasonal term can be used to explain the monthly trend changes. The groundwater level’s long data set was used for the first time to study the water level change and water exchange. The findings suggest a significant decrease in the interannual trend of the surface water level and groundwater level in the research region. The water level fluctuation coefficients of the surface water level and groundwater level are influenced by the TGP and YHWTP impoundment, causing them to increase and decrease. The surface water recharges the groundwater in the studied region, with the water exchange between the surface water and groundwater in the Yangtze River’s main stream, the middle region of the Hanjiang Plain, and the lower reaches of the Hanjiang River being, on average, 10−2 m3/(d·m), 10−5 m3/(d·m), and 10−3 m3/(d·m) orders of magnitude. Additionally, we will identify the similarities and differences in the research conducted by other scholars in this field. In a study conducted by Yanhua Duan et al. [43], 13 monitoring wells were installed near the first case of arsenic poisoning in drinking water found in Shahu Town, Xiantao City, the Jianghan Plain. The study was conducted from May 2012 to December 2013, and data on nearby rainfall and river level were collected. The study found that the temporal fluctuation patterns of the underground pressurized water level and the river level were the same, starting and ending at the same time. The fluctuation pattern of the groundwater levels in monitoring wells at depths of 25 m and 50 m is significantly influenced by rainfall. The groundwater monitoring wells in the studied region exhibit spatial and temporal fluctuation patterns that are compatible with the findings of this paper. This is mostly due to the rivers’ abundance of surface water, which is due to the presence of ponds, weirs, agricultural irrigation canals, and wetlands. Additionally, there are strong interactions between the surface water and groundwater. In their study, Wang et al. [26] utilized the Mann–Kendall trend test to analyze the rainfall and water level data from the Hankou hydrological station in Wuhan from 1990 to 2020. Their findings revealed a slight decrease in rainfall and a decreasing trend in the monthly average, maximum, and minimum water levels of the Hankou hydrological station. These results are consistent with the findings of this paper. The groundwater level at Jingzhou is the lowest during the summer and the highest during the winter, and places near the middle and lower reaches of the Yangtze River. This is due to the presence of textile and pesticide factories near the monitoring well. During summer, the groundwater is used for cooling, which results in the formation of a Jing cotton-sha cotton landing funnel [44].
The Three Gorges Dam has continually drawn interest from domestic, international, and global viewpoints. Scholars have been conducting continual investigations on the water level downstream of the dam. In their study, Deng Shanshan et al. [22] analyzed the data from three monitoring wells along the Yangtze River’s middle reaches, focusing on the surface water and groundwater. They found a correlation between the scheduling scheme of the Three Gorges Reservoir and changes in the surface water and groundwater levels in the river. Specifically, the release of water from the reservoir in May resulted in an increase in the riverbed level, and the storage of water for power generation and navigation in September or October caused a fall in the riverbed level. This is consistent with the study in this paper, as this study shows that the level of the Yangtze River’s main stream in the study area rose from January to September due to the Three Gorges Reservoir being used for downstream recharge for power generation and flood control. The reservoir storage stage occurs from mid-September to the end of October, during which the Three Gorges Reservoir is stored at 175.0 m, and the water level of the Yangtze River drops. Hu Yong et al. [24] conducted a study on the mechanism of controlling downstream water level change after the operation of Three Gorges Dam. They analyzed the water level flow data from 1991 to 2015 and found that the overall trend of the low water level flow after the Three Gorges impoundment was decreasing, while the high water level flow changed less. However, these findings contradict the investigation presented in this paper. The study’s lack of statistical flow information, limited only to the water level data, resulted in inconsistent analysis findings. To maintain consistency in the surface water–groundwater scale, the analysis was computed using the monthly average values of the data. After conducting an STL trend analysis on the water level at the hydrological stations, it was discovered that the water level showed a consistent falling trend. This finding is in line with the results presented in Section 2.1 and illustrated in Figure 2.
Simultaneously, other researchers have used groundwater models to investigate the interplay between surface water and groundwater. MODFLOW was used by Yao Du et al. [45] to create a groundwater–surface water model for the Tongshun River in the Jianghan Plain. According to the hydrogeological calculations, the vertical hydrological flux was around 0.01 m per day both near and far from the river. This finding is consistent with the findings of the research. This is due to the fact that the lower parts of the Tongshun River are located in the Jianghan Plain, where there is a significant interaction between the groundwater and surface water. Jiang Xue et al. [46] used a three-dimensional regional numerical model of the Jianghan Plain to undertake a quantitative examination of the effect of the surface water–groundwater interaction. The study revealed that the interaction between the Yangtze River and groundwater was characterized by a strong mode and intensity, while the exchange effect between the YHWTP and groundwater was found to be weak. This is consistent with the study’s findings. The size of the surface water and groundwater exchange in the Yangtze River’s main stream is greater, whereas the magnitude of the surface water and groundwater exchange near the YHWTP is less.

5. Conclusions

The storage level of the Three Gorges Dam has a significant impact on the Yangtze River. The impoundment of the dam raises the minimum water level of the Yangtze River’s main stream by 0.03–3.13 m over many years and reduces seasonal fluctuations. In addition, the YHWTP increases the average and maximum water levels in the lower portions of the Hanjiang River by 0.11–0.48 m and 0.25–0.62 m, respectively. Moreover, the seasonal variation from August to December is reduced. After the impoundment of the TGP and the water delivery from the YHWTP, the average groundwater level decreases by 0.20 m and then increases by 0.09 m, while the seasonal fluctuation is reduced by 0.15 m and 0.17 m, respectively.
The surface and ground waters are interconnected, with the TGP decreasing its percentage and the YHWTP increasing its proportion. The cross-correlation coefficient of the water level after the impoundment of the TGP is found to be between 0.15 and 0.29. This indicates an improvement in the water level variation coefficient in the study area. Conversely, the YHWTP leads to a decrease in the water level variation coefficient after water inflow.
The surface water and groundwater exchange in the Yangtze River’s main stream portion is robust, with a q of approximately 10−2 m3/(d·m). However, in the YHWTP, this exchange is more modest, with a q of around 10−5 m3/(d·m). The impoundment of the TGP resulted in a decrease in the q in the main stream of the Yangtze River and in the center of the Jianghan Plain. On the other hand, once the YHWTP is connected to the water, the q in the Hanjiang River part decreases, while it increases in the mainstream section of the Yangtze River and in the middle section of the Jianghan Plain.
The findings of this study provide scientific data to support the water conversion relationship and water resource allocation in regional water transfer projects involving surface water and groundwater. The application of the STL technique should be further explored to investigate its efficacy in predicting data, such as the coupling of the STL and ARIMA models.

Author Contributions

Conceptualization, D.S. and J.F.; methodology, J.F.; software, L.L.; validation, W.D., J.F. and W.G.; formal analysis, W.D.; investigation, D.M.; resources, L.L.; data curation, D.M.; writing—original draft preparation, J.F.; writing—review and editing, J.F.; visualization, W.G.; supervision, D.S.; project administration, D.S.; funding acquisition, D.S. All authors have read and agreed to the published version of the manuscript.

Funding

This research was funded by the National Natural Science Foundation of China, grant number U21A20156.

Data Availability Statement

The original contributions presented in this study are included in the article. Further inquiries can be directed to the corresponding authors.

Acknowledgments

We express our gratitude to the National Natural Science Foundation of China for their significant support. Additionally, we extend our appreciation to the Hubei Water Resources Research Institute for their hard work in collecting the data. Lastly, we would like to acknowledge the invaluable assistance provided by our team members Wenhui Li, He Wang, Xuanyu Wang, and Ziying Hu.

Conflicts of Interest

The authors declare no conflict of interest.

References

  1. Jasechko, S.; Perrone, D. Global groundwater wells at risk of running dry. Science 2021, 372, 418–421. [Google Scholar] [CrossRef]
  2. Scanlon, B.R.; Fakhreddine, S.; Rateb, A.; de Graaf, I.; Famiglietti, J.; Gleeson, T.; Grafton, R.Q.; Jobbagy, E.; Kolusu, S.R.; Konikow, L.F.; et al. Global water resources and the role of groundwater in a resilient water future. Nat. Rev. Earth Environ. 2023, 4, 87–101. [Google Scholar] [CrossRef]
  3. Duan, G.; Gong, H.; Chen, B.; Li, X.; Pan, X.; Shi, M.; Zhang, H. Spatiotemporal heterogeneity of land subsidence in Beijing. Sci. Rep. 2022, 12, 15120. [Google Scholar] [CrossRef]
  4. Zheng, C.; Guo, Z. Plans to protect China’s depleted groundwater. Science 2022, 375, 827. [Google Scholar] [CrossRef]
  5. Zhou, Y.; Liu, Y.; Wu, W. Strengthen China’s flood control. Nature 2016, 536, 396. [Google Scholar] [CrossRef]
  6. Groundwater Management Regulations. Available online: https://www.gov.cn/zhengce/content/2021-11/09/content_5649924.htm (accessed on 14 June 2023).
  7. Guidance and Implementation Plan for the Implementation of Major National Water Network Projects. Available online: https://www.gov.cn/xinwen/2021-12/31/content_5665855.htm (accessed on 14 June 2023).
  8. Long, D.; Yang, W.; Scanlon, B.R.; Zhao, J.; Liu, D.; Burek, P.; Pan, Y.; You, L.; Wada, Y. South-to-North Water Diversion stabilizing Beijing’s groundwater levels. Nat. Commun. 2020, 11, 3665. [Google Scholar] [CrossRef]
  9. Belkhiri, L.; Mouni, L. Geochemical Characterization of Surface Water and Groundwater in Soummam Basin, Algeria. Nat. Resour. Res. 2014, 23, 393–407. [Google Scholar] [CrossRef]
  10. Belkhiri, L.; Mouni, L. Geochemical modeling of groundwater in the El Eulma area, Algeria. Desalination Water Treat. 2013, 51, 1468–1476. [Google Scholar] [CrossRef]
  11. Cai, X.; Feng, L.; Hou, X.; Chen, X. Remote Sensing of the Water Storage Dynamics of Large Lakes and Reservoirs in the Yangtze River Basin from 2000 to 2014. Sci. Rep. 2016, 6, 36405. [Google Scholar] [CrossRef] [PubMed]
  12. Liu, H.; Yin, J.; Feng, L. The Dynamic Changes in the Storage of the Danjiangkou Reservoir and the Influence of the South-North Water Transfer Project. Sci. Rep. 2018, 8, 8710. [Google Scholar] [CrossRef] [PubMed]
  13. The Yangtze-to-Hanjiang Water Transfer Project_Baidu Encyclopedia. Available online: https://baike.baidu.com/item/%E5%BC%95%E6%B1%9F%E6%B5%8E%E6%B1%89%E5%B7%A5%E7%A8%8B (accessed on 14 June 2023).
  14. Yang, X.; Zhou, X.; Shang, G.; Zhang, A. An evaluation on farmland ecological service in Jianghan Plain, China—From farmers’ heterogeneous preference perspective. Ecol. Indic. 2022, 136, 108665. [Google Scholar] [CrossRef]
  15. Huang, S.; Chen, L.; Li, J.; Xu, J.; Xie, W.; Zhang, C. The effects of colloidal Fe and Mn on P distribution in groundwater system of Jianghan Plain, China. Sci. Total Environ. 2023, 854, 158739. [Google Scholar] [CrossRef] [PubMed]
  16. Liu, J.; Gu, W.; Liu, Y.; Zhang, C.; Li, W.; Shao, D. Dynamic characteristics of net anthropogenic phosphorus input and legacy phosphorus reserves under high human activity—A case study in the Jianghan Plain. Sci. Total Environ. 2022, 836, 155287. [Google Scholar] [CrossRef] [PubMed]
  17. Sun, Y.; Lan, J.; Chen, X.; Ye, H.; Du, D.; Li, J.; Hou, H. High arsenic levels in sediments, Jianghan Plain, central China: Vertical distribution and characteristics of arsenic species, dissolved organic matter, and microbial community. J. Geochem. Explor. 2021, 228, 106822. [Google Scholar] [CrossRef]
  18. Yang, Y.; Deng, Y.; Xie, X.; Gan, Y.; Li, J. Iron isotope evidence for arsenic mobilization in shallow multi-level alluvial aquifers of Jianghan Plain, central China. Ecotoxicol. Environ. Saf. 2020, 206, 111120. [Google Scholar] [CrossRef]
  19. Zhang, J.; Li, Y.; Liu, C.; Li, F.; Zhu, L.; Qiu, Z.; Xiao, M.; Yang, Z.; Cai, Y. Concentration Levels, Biological Enrichment Capacities and Potential Health Risk Assessment of Trace Elements in Eichhornia crassipes from Honghu Lake, China. Sci. Rep. 2019, 9, 2431. [Google Scholar] [CrossRef] [PubMed]
  20. Liu, T.; Hu, C.; Wang, Q.; Li, J.; Huang, K.; Chen, Z.; Shi, T. Conversion relationship of rainfall-soil moisture-groundwater in Quaternary thick cohesive soil in Jianghan Plain, Hubei Province, China. China Geol. 2020, 3, 462–472. [Google Scholar] [CrossRef]
  21. Zhang, J.; Liang, X.; Jin, M.; Li, J.; Shen, S.; Wang, L.; Ma, T. Evolution of the groundwater flow system driven by the sedimentary environment since the Last Glacial Maximum in the central Yangtze River Basin. J. Hydrol. (Amst.) 2022, 610, 127997. [Google Scholar] [CrossRef]
  22. Deng, S.S.; Xia, J.Q.; Zhou, M.R.; Zhou, Y.Y.; Liu, X.; Li, Z.W. Riparian Groundwater Level Variation and Its Impacts on Bank Erosion in the Middle Yangtze River. Water Resour. Res. 2022, 58, e2022WR032354. [Google Scholar] [CrossRef]
  23. Hu, S.; Xia, J.; Wu, X.; Wang, Y.; Xia, F. Water Environment Variation in the Three Gorges Tributary and Its Influencing Factors on Different Scales. Water 2018, 10, 1831. [Google Scholar] [CrossRef]
  24. Hu, Y.; Li, D.F.; Deng, J.Y.; Yue, Y.; Zhou, J.X.; Chai, Y.F.; Li, Y.T. Mechanisms Controlling Water-Level Variations in the Middle Yangtze River Following the Operation of the Three Gorges Dam. Water Resour. Res. 2022, 58, e2022WR032338. [Google Scholar] [CrossRef]
  25. Longzhang, F.; Dongguo, S. Application of Long Short-Term Memory (LSTM) on the Prediction of Rainfall-Runoff in Karst Area. Front. Phys. 2022, 9, 790687. [Google Scholar] [CrossRef]
  26. Wang, X.J.; Xia, J.Q.; Zhou, M.R.; Deng, S.S.; Li, Q.J. Assessment of the joint impact of rainfall and river water level on urban flooding in Wuhan City, China. J. Hydrol. (Amst.) 2022, 613, 128419. [Google Scholar] [CrossRef]
  27. Yu, Z.; Gu, H.; Wang, J.; Xia, J.; Lu, B. Effect of projected climate change on the hydrological regime of the Yangtze River Basin, China. Stoch. Environ. Res. Risk Assess. 2018, 32, 1–16. [Google Scholar] [CrossRef]
  28. Gu, W.Q.; Shao, D.G.; Tan, X.Z.; Shu, C.; Wu, Z. Simulation and Optimization of Multi-Reservoir Operation in Inter-Basin Water Transfer System. Water Resour. Manag. 2017, 31, 3401–3412. [Google Scholar] [CrossRef]
  29. Shaokun, H.; Shenglian, G.; Pan, L.; Kebing, C.; Feng, X.; Jianting, Z. Joint and optimal impoundment oepration of Jinsha River’s cascade reservoirs and Three Gorges Reservoir. J. Hydroelectr. Eng. 2019, 38, 27–36. [Google Scholar] [CrossRef]
  30. Shen, Y.; Liu, D.; Jiang, L.; Nielsen, K.; Yin, J.; Liu, J.; Bauer-Gottwein, P. High-resolution water level and storage variation datasets for 338 reservoirs in China during 2010–2021. Earth Syst. Sci. Data 2022, 14, 5671–5694. [Google Scholar] [CrossRef]
  31. Shenglian, G.; Feng, X.; Jun, W.; Yixuan, Z.; Jing, T.; Jiabo, Y. Preliminary exploration of design flood and control water level of Three Gorges Reservoir in operation period. J. Hydraul. Eng. Asce. 2019, 50, 1311–1317. [Google Scholar] [CrossRef]
  32. Ping, X.; Ming, D.; Jun, X. Water bloom occurrence probability calculation model in Hanjiang River under different water transfer schemes of the middle route of South to North Water Transfer Project. J. Hydraul. Eng. Asce. 2005, 36, 727–732. [Google Scholar] [CrossRef]
  33. Zhang, Z. Research and Implementation of Water Dispatching System Based on Web Service. Master’s Thesis, Huazhong University of Science and Technology, Wuhan, China, 2018. [Google Scholar]
  34. Gan, Y.Q.; Wang, Y.X.; Duan, Y.H.; Deng, Y.M.; Guo, X.X. Dynamic changes of groundwater arsenic concentration in the monitoring field site, Jianghan Plain. Earth Sci. Front. 2014, 214, 37–49. [Google Scholar] [CrossRef]
  35. Du, Y. Surface Water-Groundwater Interaction and Its Effect on Ammonium Transport and Fate in Jianghan Plain, Central China. Ph.D. Thesis, China University of Geosciences, Wuhan, China, 2017. [Google Scholar]
  36. Trull, O.; Garcia-Diaz, J.C.; Peiro-Signes, A. Multiple seasonal STL decomposition with discrete-interval moving seasonalities. Appl. Math. Comput. 2022, 433, 127398. [Google Scholar] [CrossRef]
  37. Amrhein, V.; Trafinnow, D.; Greenland, S. Inferential Statistics as Descriptive Statistics: There Is No Replication Crisis if We Don’t Expect Replication. Am. Stat. 2019, 73, 262–270. [Google Scholar] [CrossRef]
  38. Overview of Three Gorges Project. Available online: https://www.ctg.com.cn/sxjt/sxgc4/gcgk7/index.html (accessed on 14 June 2023).
  39. Gong, G.; Wei, Z.; Zhang, F.; Li, Y.; An, Y.; Yang, Q.; Wu, J.; Wang, L.; Yu, P. Analysis of the spatial distribution and influencing factors of China national forest villages. Environ. Monit. Assess. 2022, 194, 428. [Google Scholar] [CrossRef]
  40. Xu, J.H. Mathematical Method in Modern Geography, 2nd ed.; Higher Education Press: Beijing, China, 2002; pp. 37–41. [Google Scholar]
  41. Taghadomi, H.J.; Wang, X.X.; Erten-Unal, M.; Vazifedan, T. Assessment of rainfall-runoff time series data using transfer function modelling with exogenous variable. Int. J. Hydrol. Sci. Technol. 2022, 14, 47–62. [Google Scholar] [CrossRef]
  42. Shu, L.C.; Tao, Y.Z. Groundwater Hydrology; China Water & Power Press: Beijing, China, 2009; pp. 112–116. [Google Scholar]
  43. Duan, Y.; Gan, Y.; Wang, Y.; Deng, Y.; Guo, X.; Dong, C. Temporal variation of groundwater level and arsenic concentration at Jianghan Plain, central China. J. Geochem. Explor. 2015, 149, 106–119. [Google Scholar] [CrossRef]
  44. Qingjun, D.; Zhonghua, T.; Qi, W.; Jiankui, L. Characteristics of groundwater and its influencing factors in Jingzhou City. Resour. Environ. Yangtze Basin 2014, 23, 1215–1221. [Google Scholar] [CrossRef]
  45. Du, Y.; Ma, T.; Deng, Y.; Shen, S.; Lu, Z. Characterizing groundwater/surface-water interactions in the interior of Jianghan Plain, central China. Hydrogeol. J. 2018, 26, 1047–1059. [Google Scholar] [CrossRef]
  46. Jiang, X.; Ma, R.; Ma, T.; Sun, Z. Modeling the effects of water diversion projects on surface water and groundwater interactions in the central Yangtze River basin. Sci. Total Environ. 2022, 830, 154606. [Google Scholar] [CrossRef]
Figure 1. The geographic position of the research area, along with the main hydraulic projects, hydrological stations, and groundwater level points.
Water 15 02952 g001
Figure 2. The trend variation of surface water level and groundwater level in the study region from 1991 to 2019. (a) In three time periods, the interannual variations of surface water–groundwater characteristic values are shown. Note: The average value of the time period 1991.1–2003.6 is explained in the interannual eigenvalue change diagram of surface water and groundwater, and the other two time periods, and so on. The highest water level minus the lowest water level divided by the mean water level is the relative amplitude of the water level. (b) Interannual variation of surface water and groundwater trends. The groundwater level is the average groundwater level across all observed wells.
Water 15 02952 g002aWater 15 02952 g002b
Figure 3. Seasonal variation characteristics of surface water and groundwater during the year. (a) The overall seasonal variation of surface water–groundwater from 1991 to 2019, where groundwater is the average groundwater level in the study area. (b) Seasonal changes of surface water level in three time periods and (c) seasonal variation of average groundwater level in three time periods.
Water 15 02952 g003aWater 15 02952 g003b
Figure 4. The coefficients of variation of surface water and groundwater levels in the study region throughout time.
Water 15 02952 g004
Figure 5. Surface water level and groundwater level bias correlation coefficients in the research region from 1991 to 2019. Note that each strip height represents the value of the bias correlation coefficient.
Water 15 02952 g005
Figure 6. Volume of surface water and groundwater inter-exchange in the research region from 1991 to 2019. (a) The interannual variation trend of q. (b) The seasonal variation trend of q.
Water 15 02952 g006
Disclaimer/Publisher’s Note: The statements, opinions and data contained in all publications are solely those of the individual author(s) and contributor(s) and not of MDPI and/or the editor(s). MDPI and/or the editor(s) disclaim responsibility for any injury to people or property resulting from any ideas, methods, instructions or products referred to in the content.

