1. Introduction
Landslides are one of the most common natural disasters in the world and threaten the safety of humans and property [
1,
2]. Landslides may be triggered by various of factors, such as extreme rainfall, which can accelerate or reactivate a landslide deformation of failure [
3,
4,
5]. The frequency and intensity of landslides have increased dramatically with the increase in heavy or extreme precipitation caused by global climate change [
6]. Extreme climate has been discussed as a driving factor for current and future landslides [
7,
8]. The emergence of new—or renewal of older—landslides occurs when precipitation exceeds the threshold values, usually over a short time (1–3 days) [
9].
In China, many large-scale landslides were triggered by heavy rainfall, such as the Yigong landslide [
10], rockslide debris in the Wenchuan earthquake area [
11], and Yanguang and Shaziba landslide in Hubei [
12,
13]. However, shallow landslides (generally lower than 2 m) are the primary and common phenomena worldwide. Rainfall often triggers shallow landslides due to the shear resistance decrease of the slip zone after infiltration. The early deformation of shallow landslides is often inconspicuous, and failures are sudden, appearing in large groups. The disasters are catastrophic and significant for humans and infrastructures [
14,
15]. Therefore, shallow landslide stability evaluation and prediction are crucial for disaster reduction.
For regional shallow landslide prediction, Baum et al. [
16] proposed a TRIGRS model for quantitatively evaluating the regional topographic stability based on DEM coupling the transient pore pressure change model caused by rainfall infiltration and the infinite slope stability model. By considering the transient effects of rainfall, the effectiveness of stability analysis can be improved. Kim et al. [
17] and Park et al. [
18] found that the parameters should be determined according to the characteristics of the study area by using the TRIGRS model to ensure the results. García-Ruiz et al. [
19] and Viet et al. [
20] used the TRIGRS model to predict the spatial distribution and optimized the model by improving data parameters such as soil and hydrology. Although the TRIGRS model could predict shallow landslides, the results are unverifiable or verified by field investigation.
In this paper, we analyzed the stability of slopes in the Shazhenxi mountainous area according to the geological conditions and geotechnical characteristics, and an optimized parameter database of the study area is established based on the TRIGRS model of transient rainfall infiltration and infinite slope theory. The Factor of Safety of regional slopes was simulated, and the prediction results were confirmed with landslide on-site real-time monitoring. It has particular relevance for regional shallow landslides induced by rainfall.
2. Materials and Methods
2.1. Study Area and Materials
Landslides are the dominant geohazards in mountainous areas of western Hubei Provence, China. As a part of the mountainous area, Zigui County suffered a severe landslide disaster due to the geological lithology and heavy precipitation. To study the slope stability, an area of the Shazhenxi region was chosen as the case affected by the heavy rainfall.
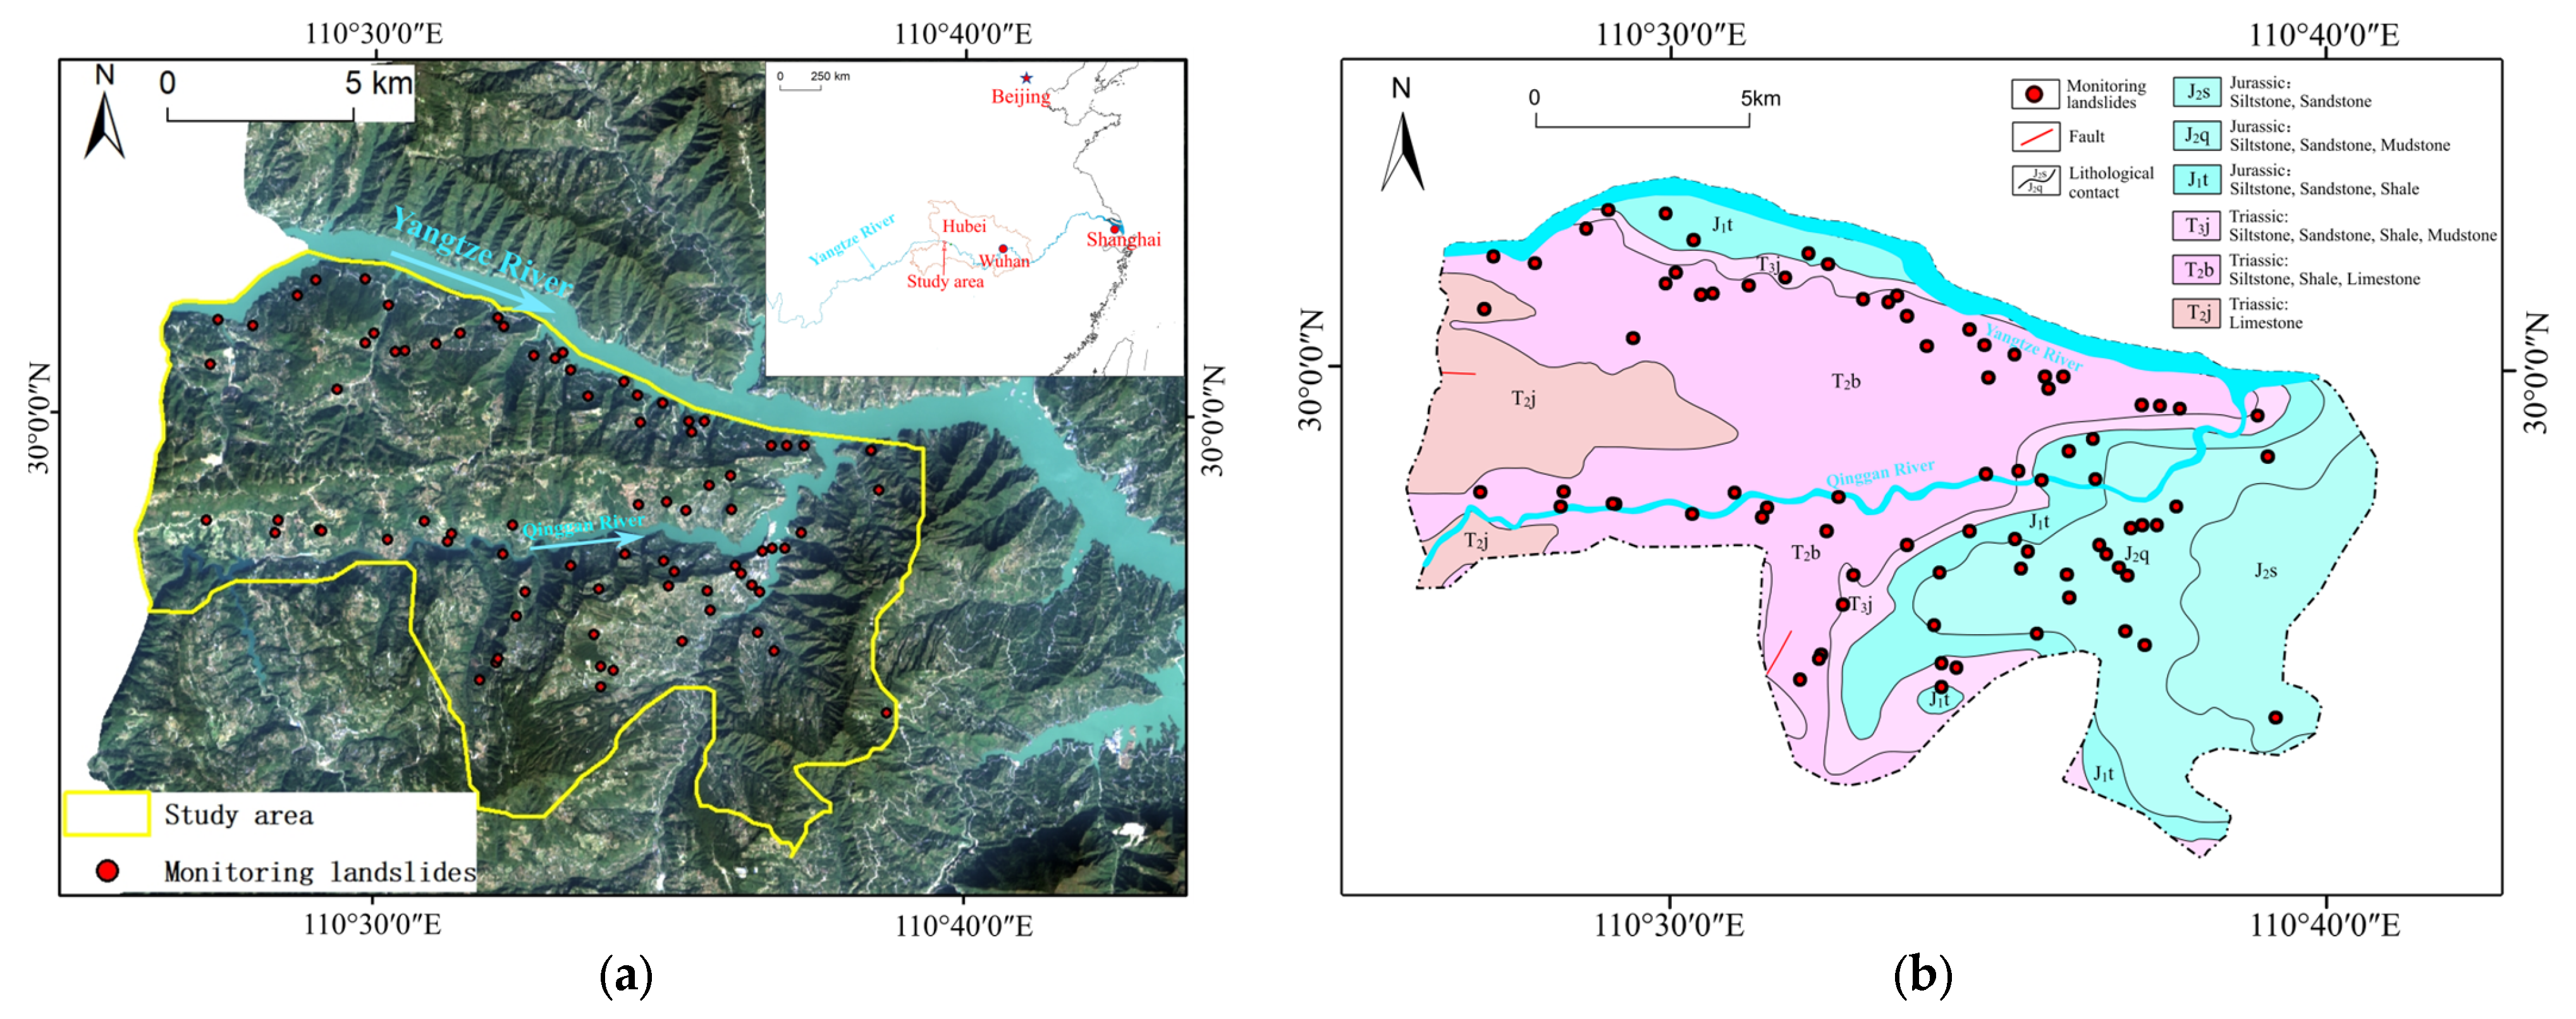
The Shazhenxi region in Zigui County is located in the mountainous area of western Hubei Provence, China. The mountainous area (31°2′22″–30°53′33″ N, 110°25′57″–110°39′18″ E) is on the south bank of the Yangtze River (
Figure 1a), with an area of 122.8 km
2.
The topography is low with middle-relief mountains, and the average altitude is in the 300–400 m range with a slope angle of 15–45°. Most of the steep slopes with angles greater than 30° are mainly distributed on the banks of the Yangtze and the Qinggan Rivers. The outcropped strata in the survey area mainly consist of Middle–Lower Jurassic and Upper–Lower Triassic Systems, and the lithology of the Jurassic is siltstone, sandstone, and mudstone and siltstone, mudstone and limestone of the Triassic system, which is shown in
Figure 1b.
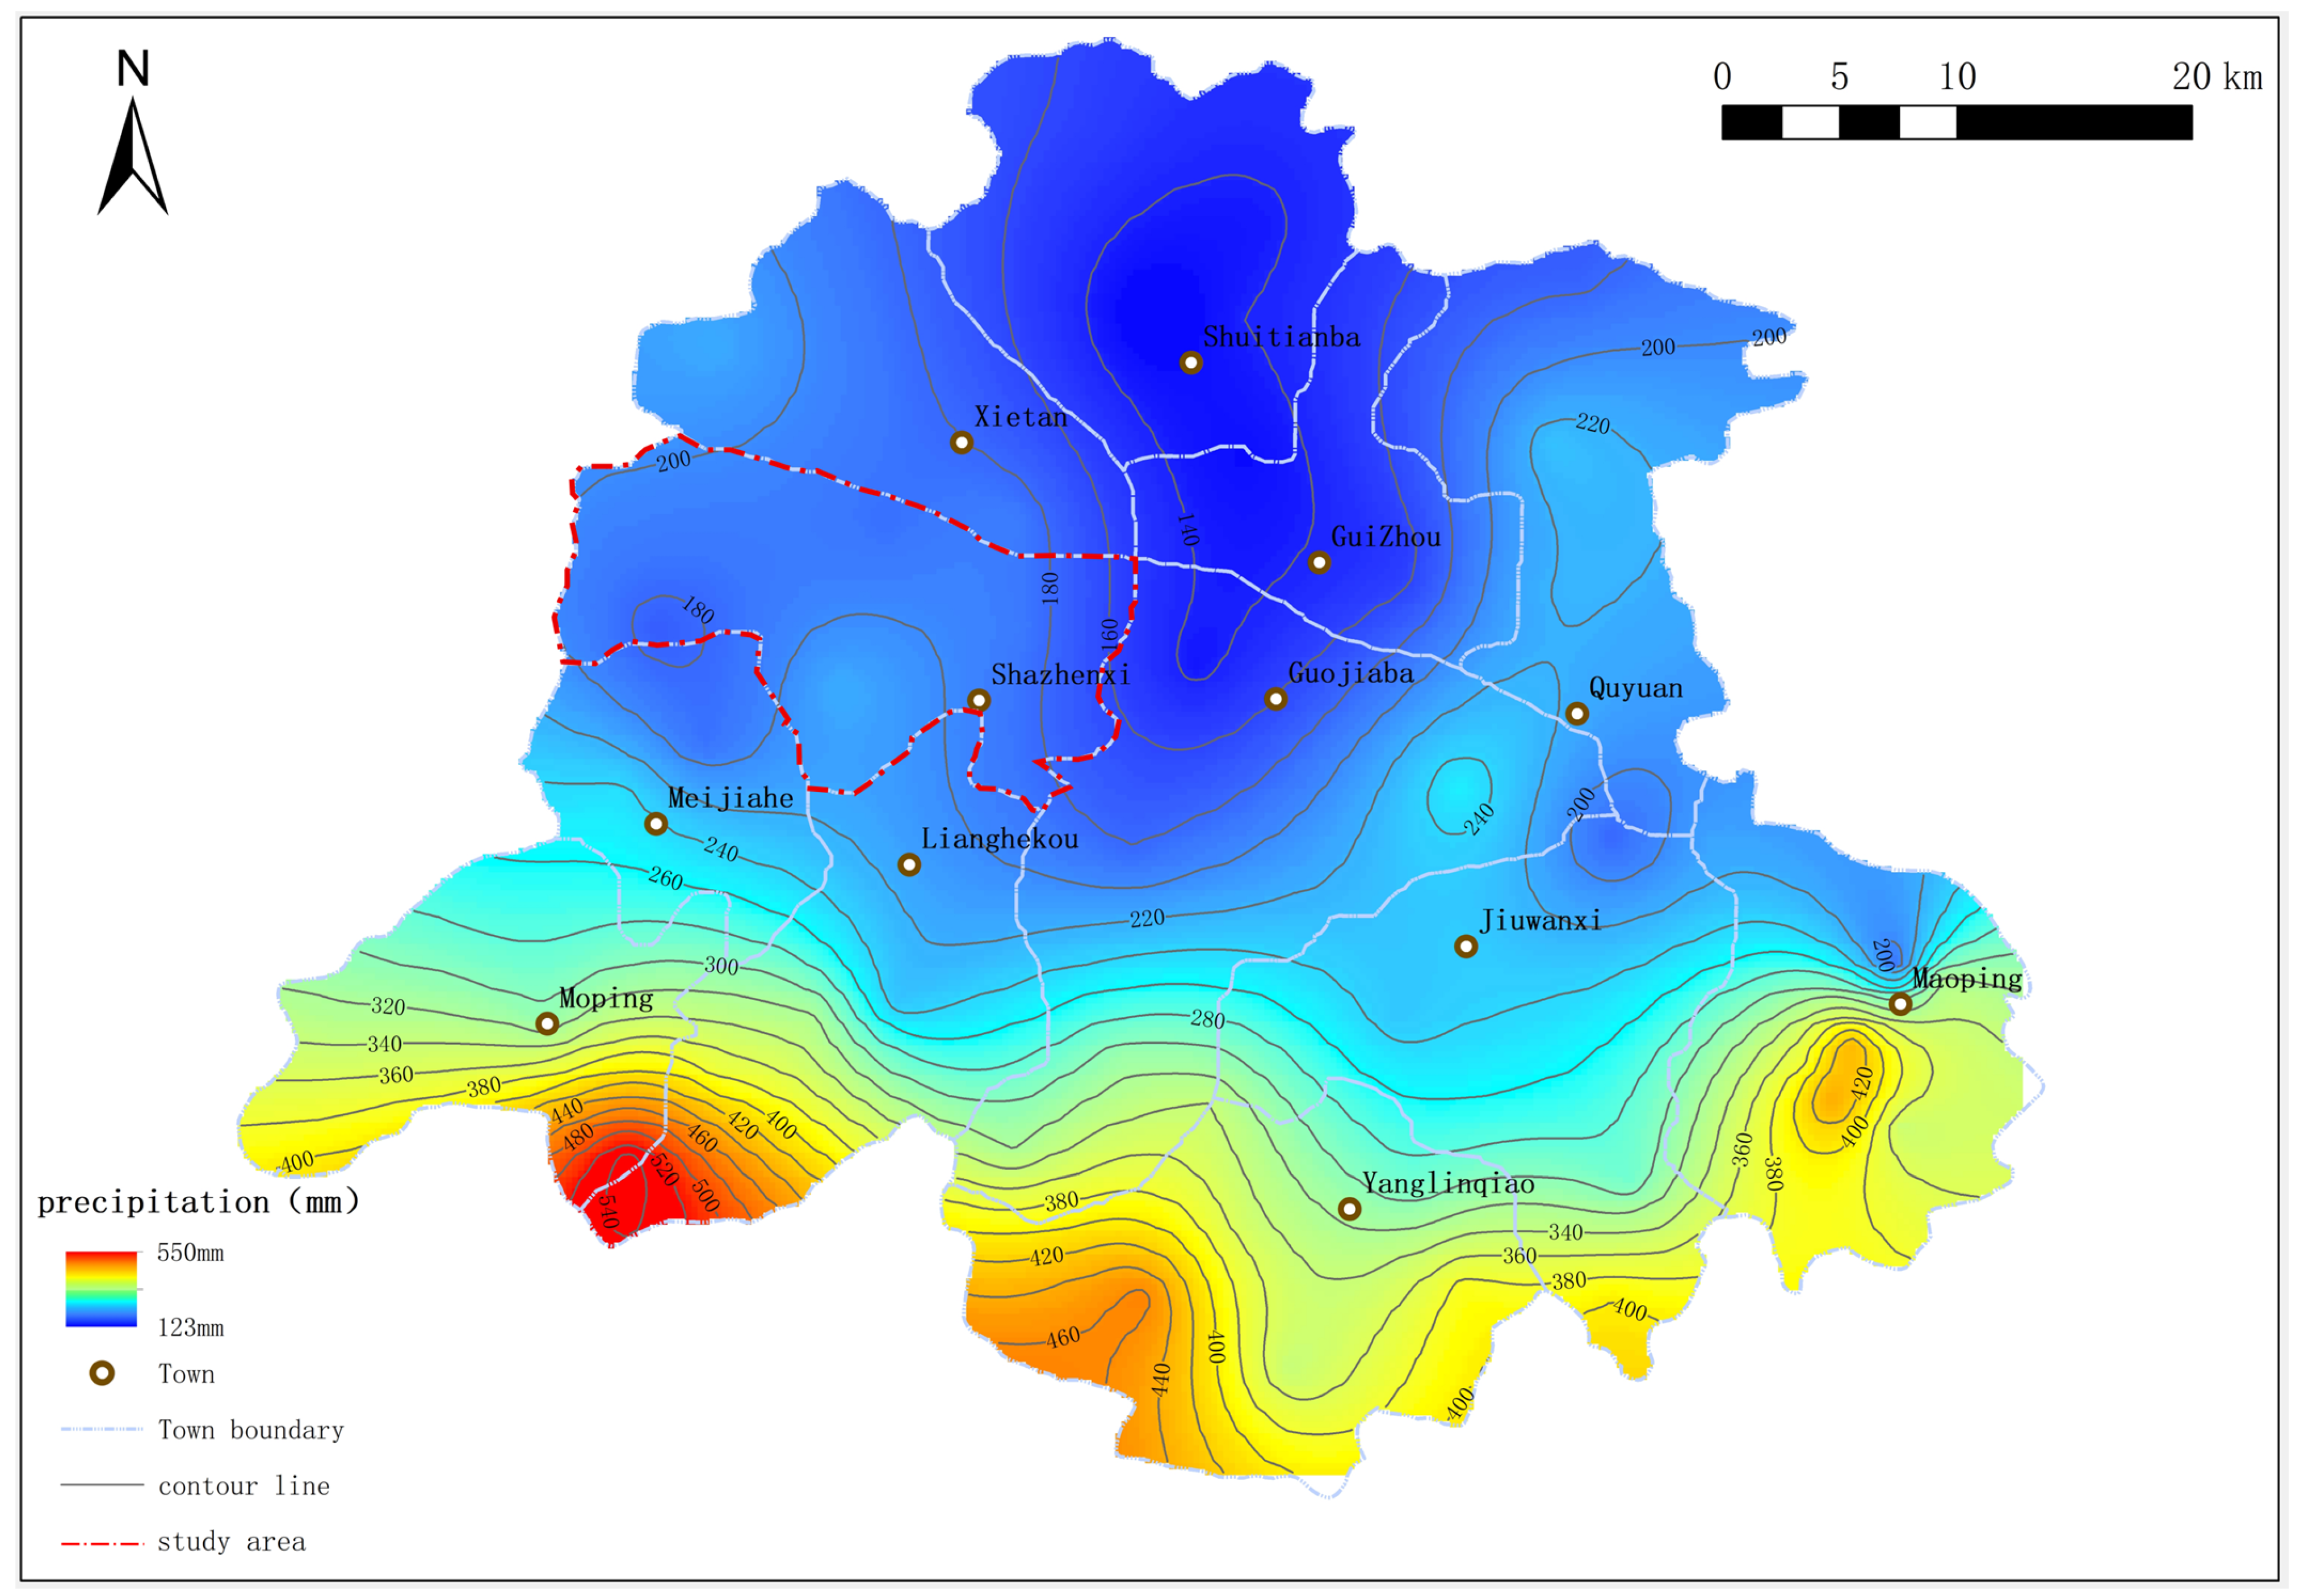
The study area of the Shazhenxi in Zigui County is the area of primary heavy rainfall in Hubei Province. The Zigui County has an average annual precipitation of about 1100 mm. The heaviest rainfall commonly occurs in July and August.
Figure 2 shows the contour map of precipitation in Zigui County in July 2021. The precipitation was 120–550 mm in the whole county area, and the Shazhenxi region was 160–210 mm.
This area is a high-susceptibility zone of landslides in the western mountainous area of Hubei Province, with some deep-seated landslides, such as the Qianjiangping landslide [
21], Shuping landslide [
22], Shanshucao landslide [
23]. Although deep-seated landslides severely affected residents’ lives and infrastructures, numerous shallow landslides triggered by rainfall are more grievous (
Figure 3), especially in the rainy season (June–September). Therefore, the numerous shallow landslide stability is the key point of the investigation.
2.2. Methods
A transient rainfall infiltration and grid-based regional slope-stability model, TRIGRS, was employed to investigate the shallow landslide stability under various rainfall intensities in the Shazhenxi region. The TRIGRS model is one of the most widely used for the potential occurrences of shallow landslides by incorporating the transient pressure response to rainfall and downward infiltration processes [
24]. The TRIGRS program uses an infinite-slope model to compute a Factor of Safety (F
S) calculation for each grid cell. The infiltration models in the TRIGRS are based on Iverson’s linearized component of Richards equation [
24].
In the failure analysis, the instability of an infinite slope is characterized by the ratio of resisting basal Coulomb friction to gravitationally induced downslope basal driving stress [
25]. The ratio is the Factor of Safety (F
S), calculated at depth
Z by the following.
where
is the safety factor,
is unit weight of soil,
is unit weight of groundwater,
is cohesion,
is the friction angle of soil,
is the groundwater pressure head and depends on
Z (vertical depth) and
t (time), and
is the slope angle.
2.3. Data
Several data sets were used as the input parameters to implement the TRIGRS model.
- (1)
Digital Elevation Model (DEM): the primary data for the TRIGRS model. In this study, a DEM at 30 m resolution was prepared and preprocessed in a GIS platform, including elevation, slope angle, and spatial location.
- (2)
Flow direction: the key factor for hydrological information and also the primary data of the TRIGRS model. Flow direction was calculated by the method proposed by Fairfield et al. [
26], which was accurate and straightforward.
- (3)
Soil mechanical parameters: obtained after the statistical analysis based on the soil datasets from previous landslide surveys [
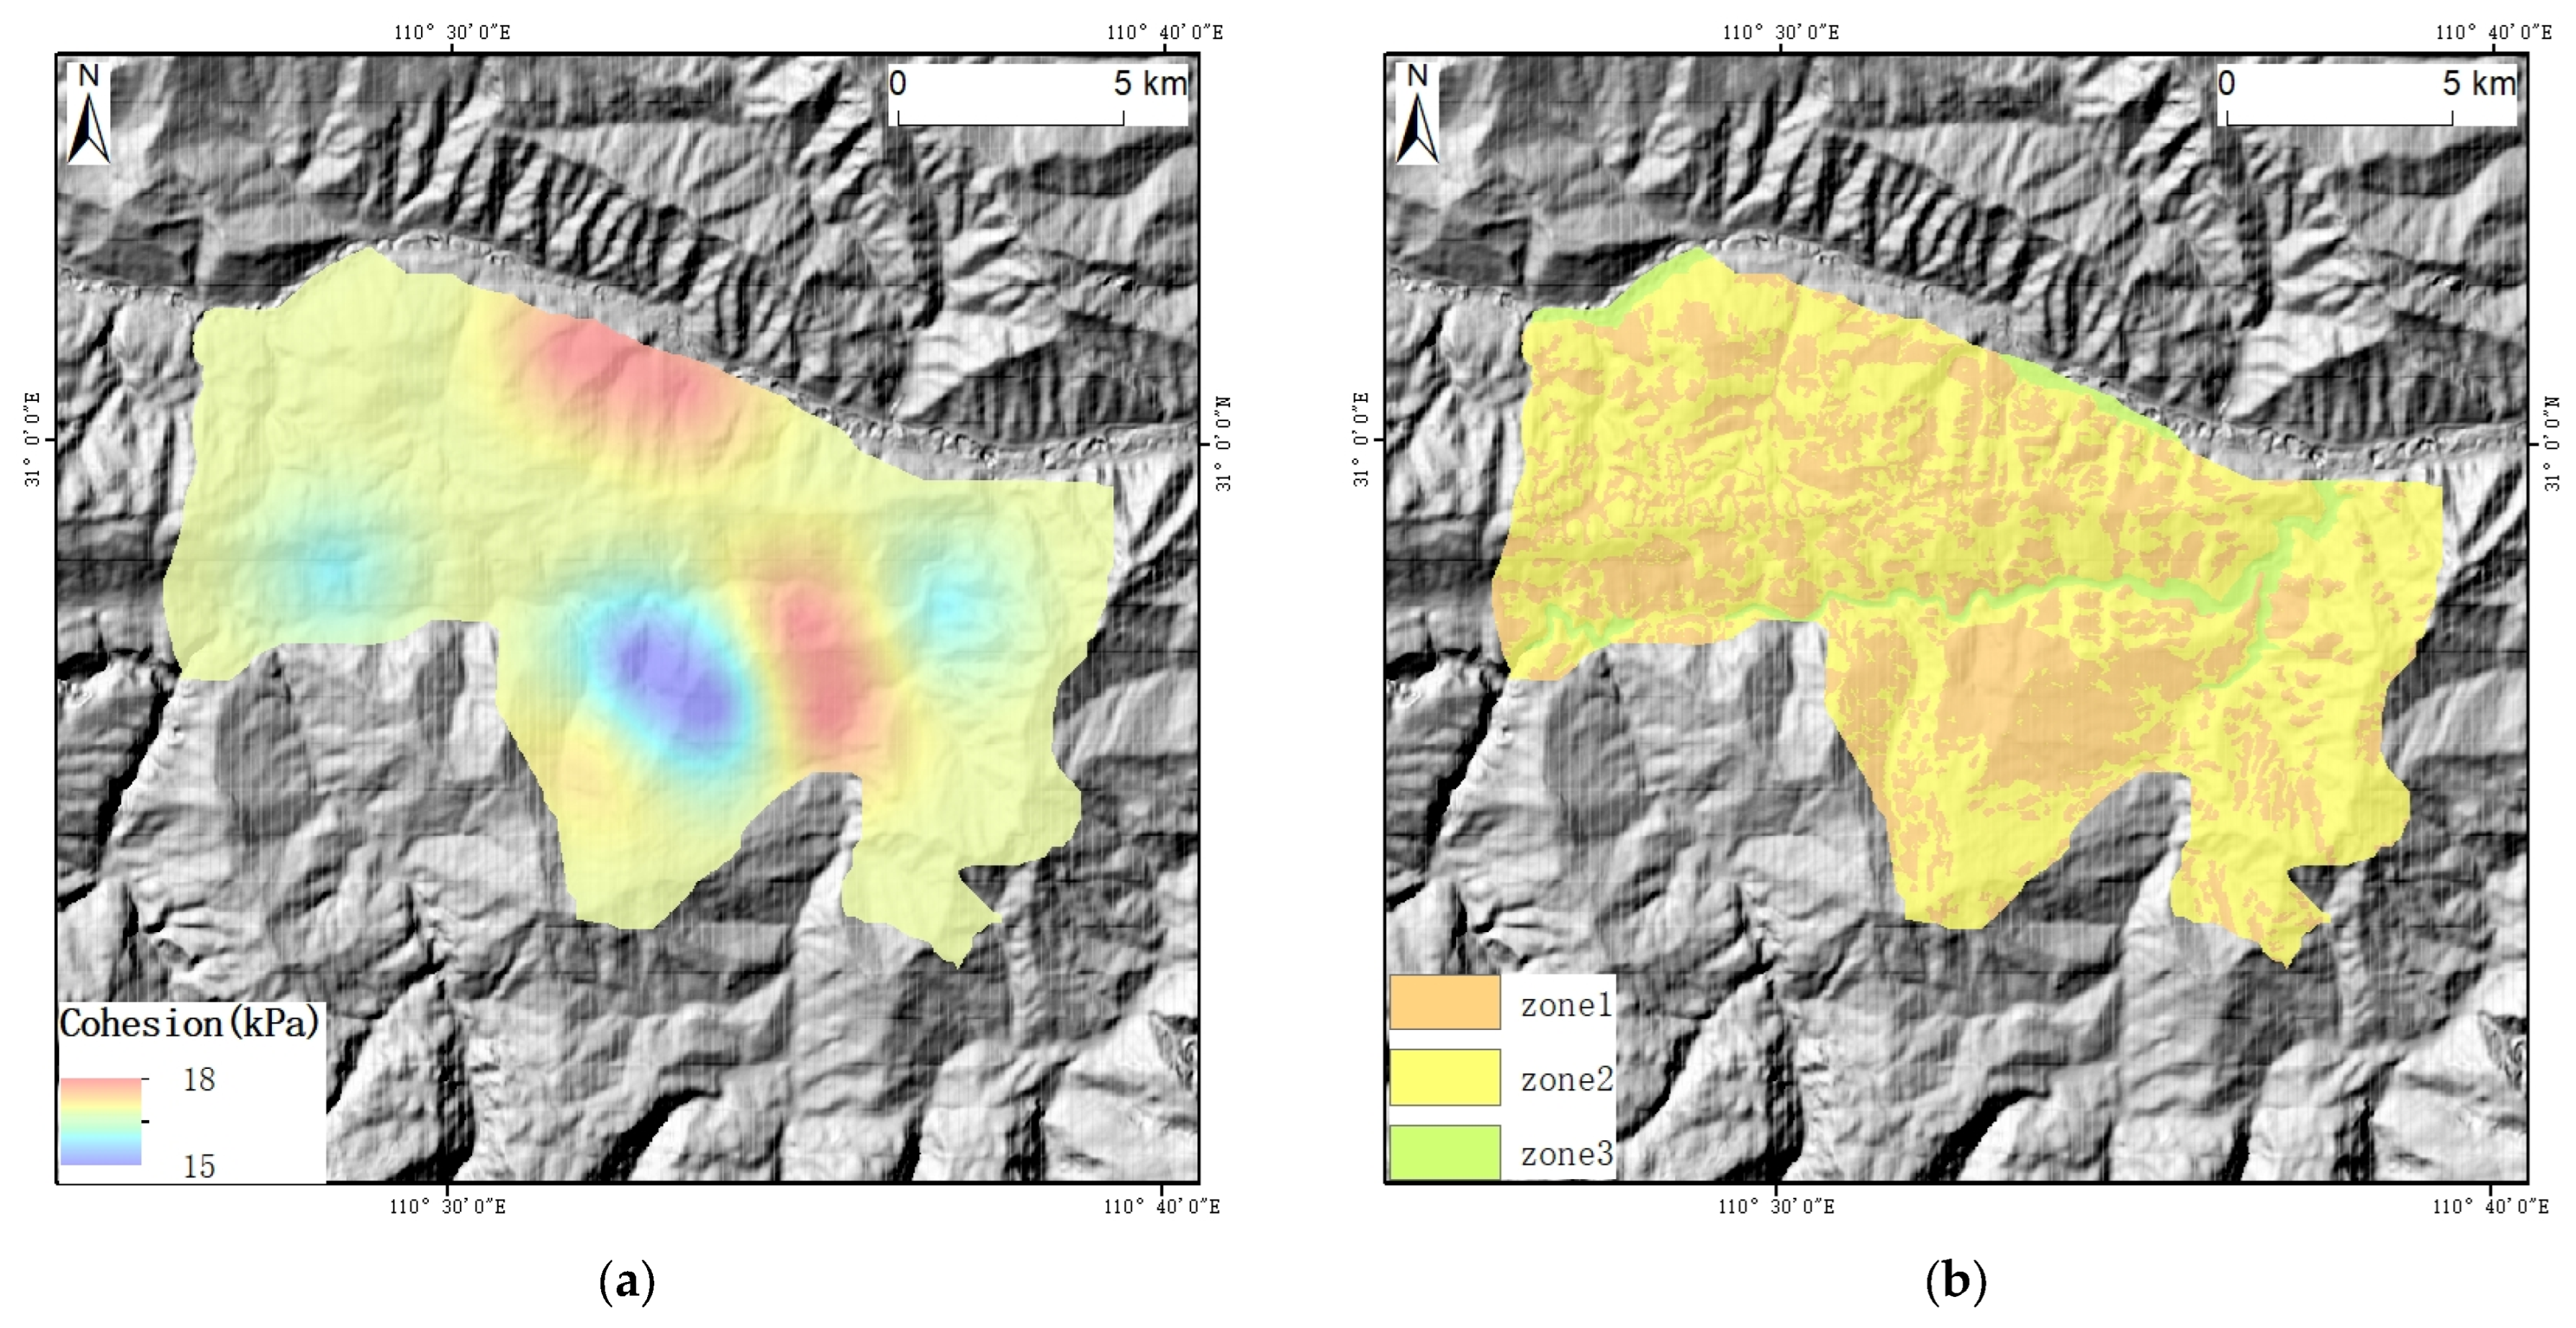
27]. The soil data spatial distribution was obtained by employing the interpolation method, and the cohesion distribution of natural soil is shown in
Figure 4a. According to the soil types and parameters and surface coverage (cultivated, wood, or grassland), the study area was divided into three regions: Zone 1, 2, and 3 (
Figure 4b).
The soil mechanical parameters of the three zones are shown in
Table 1, which lists only the required parameters for the calculation of the TRIGRS model. The hydraulic parameters mainly include the hydraulic diffusion coefficient (
D0), saturated permeability coefficient (
KS), and unit weight of water (
.
The hydraulic diffusion coefficient,
D0, is mainly determined by the empirical formula of unsaturated soil mechanical parameters. It is proposed as follows:
- (4)
Soil thickness: one of the essential parameters for the TRIGRS model. The soil thickness varies due to the complex terrain in the mountainous area of western Hubei. If the thickness is a constant value determined by the gentle terrain area, it will inevitably lead to deviations in the prediction. Therefore, an appropriate method should be proposed to predict the soil thickness. Various equations have been proposed to estimate the thickness [
18,
28,
29]. Tran et al. [
30] compared several thickness distribution models and concluded that the soil thickness is linear with the slope angle by a statistical equation. According to the linear law [
30], we proposed an equation to determine the soil thickness after field investigation and data collection of explored boreholes, which was as follows:
where
h is the soil thickness (m) and
α is the slope angle (°). As the infiltration depth of rainfall is generally less than 3 m according to the slope monitoring data [
30], the thickness,
h, is less than 3 m. We simulated the spatial distribution of soil thickness in the study area.
- (5)
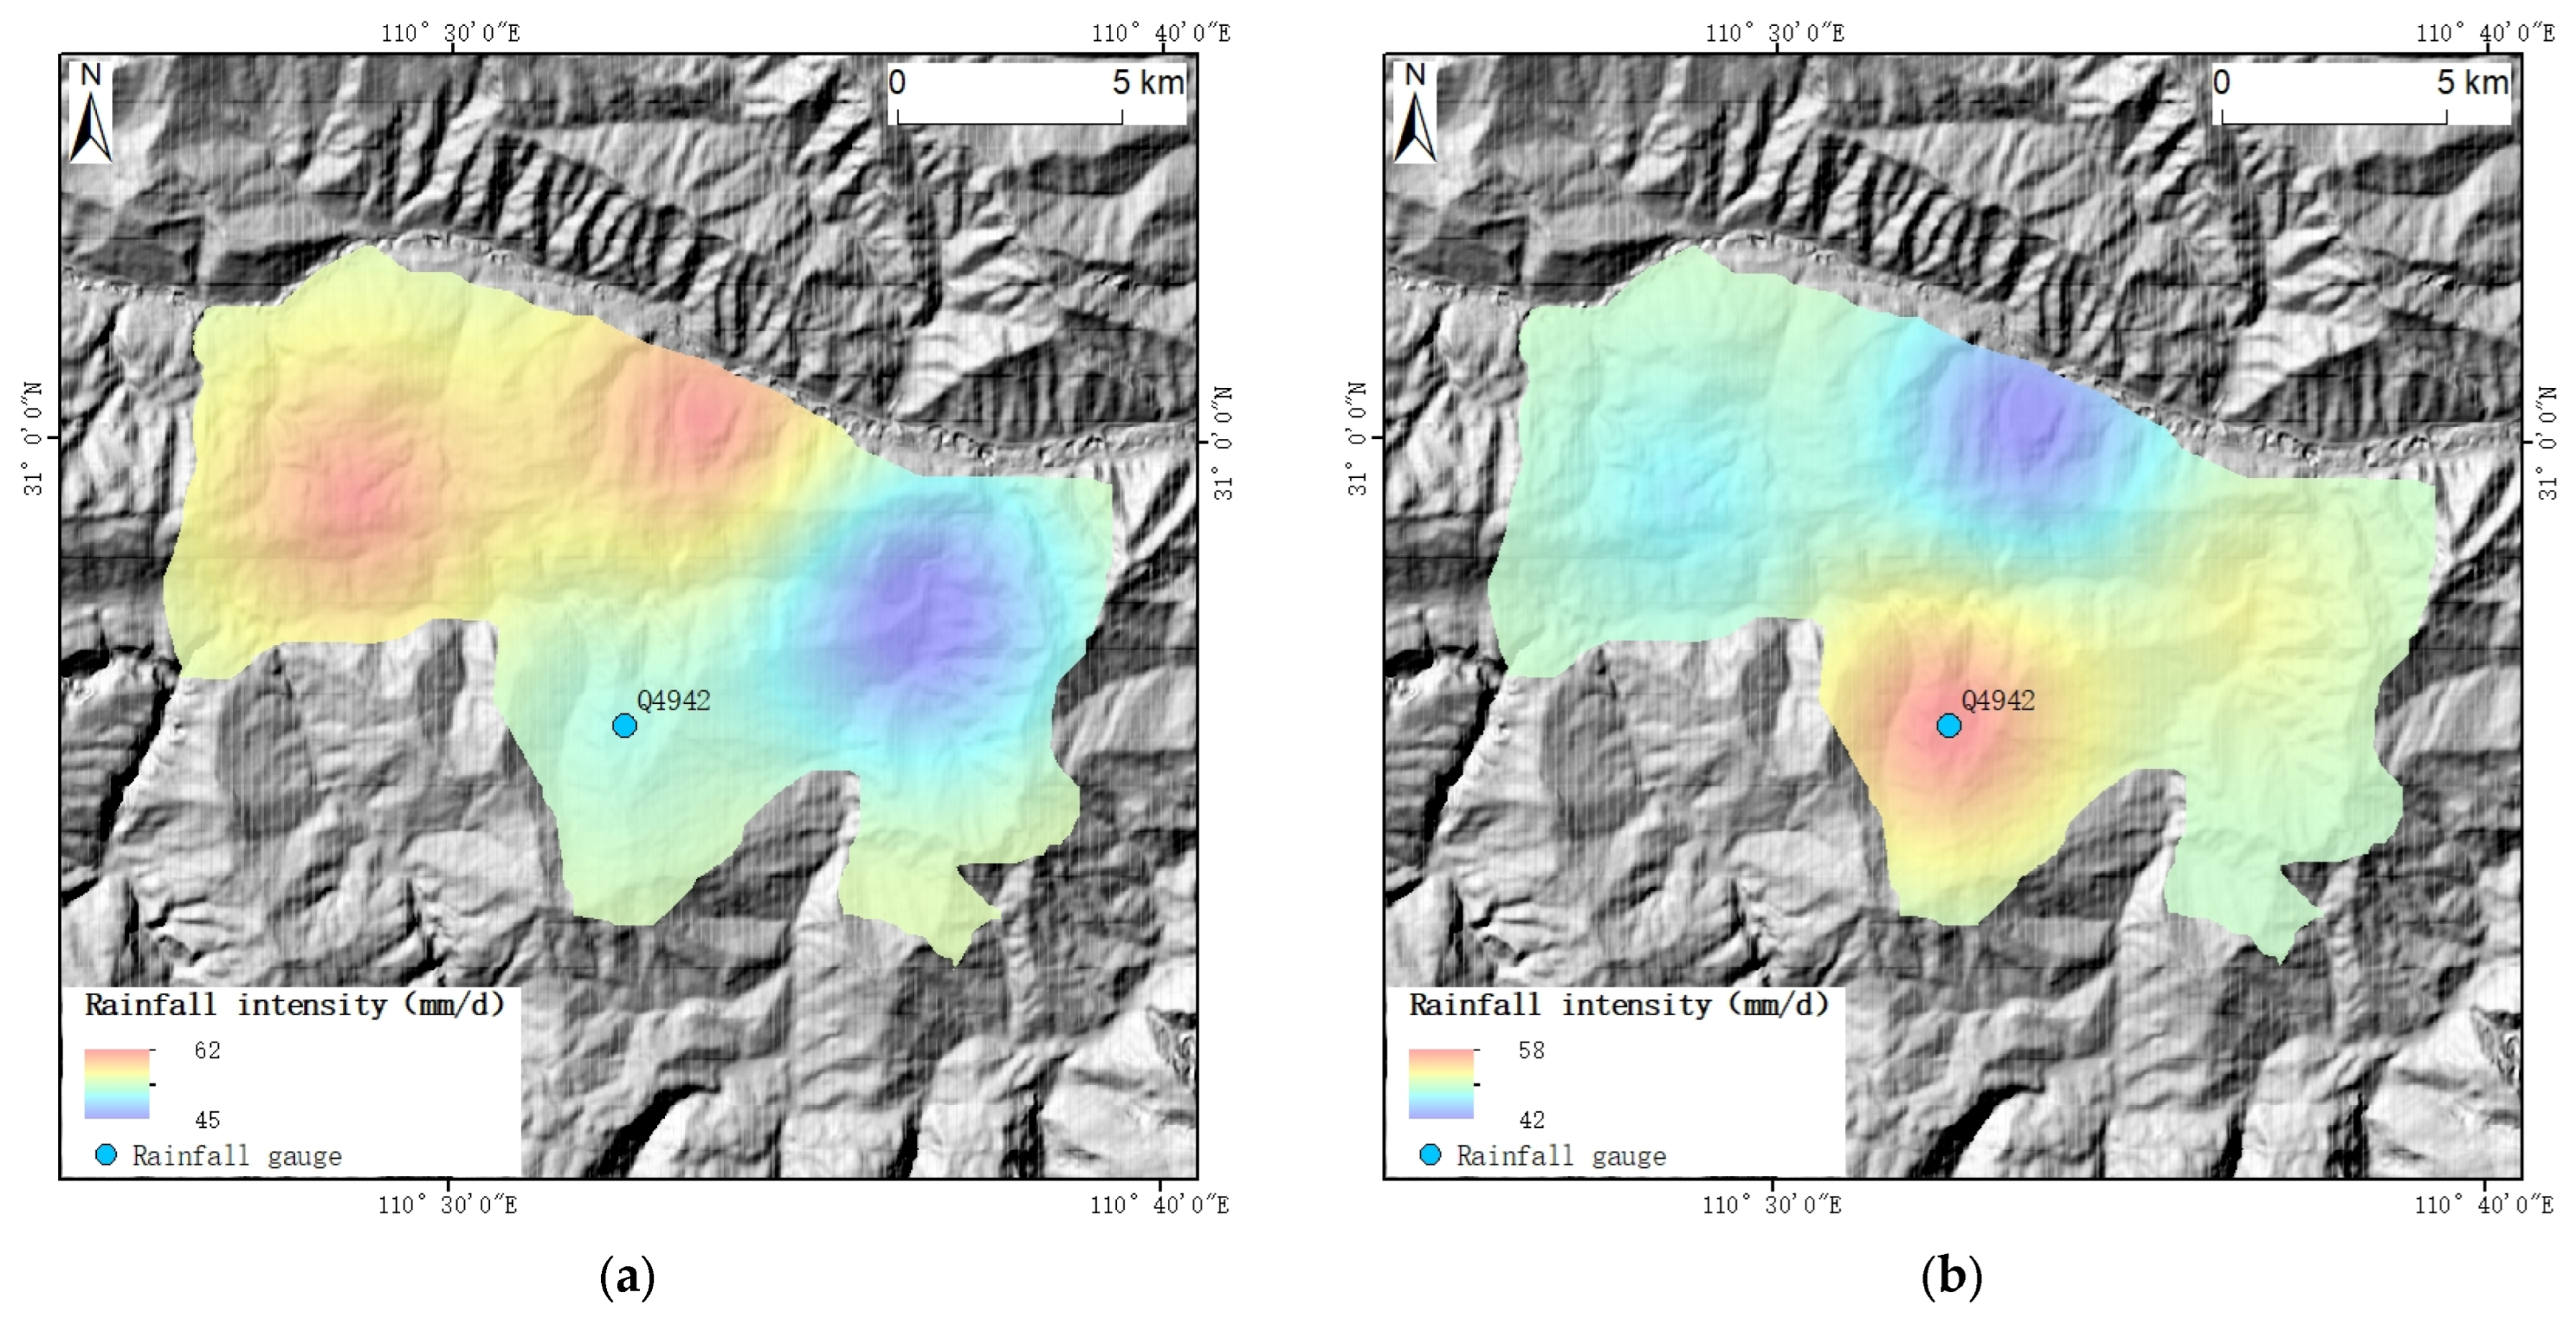
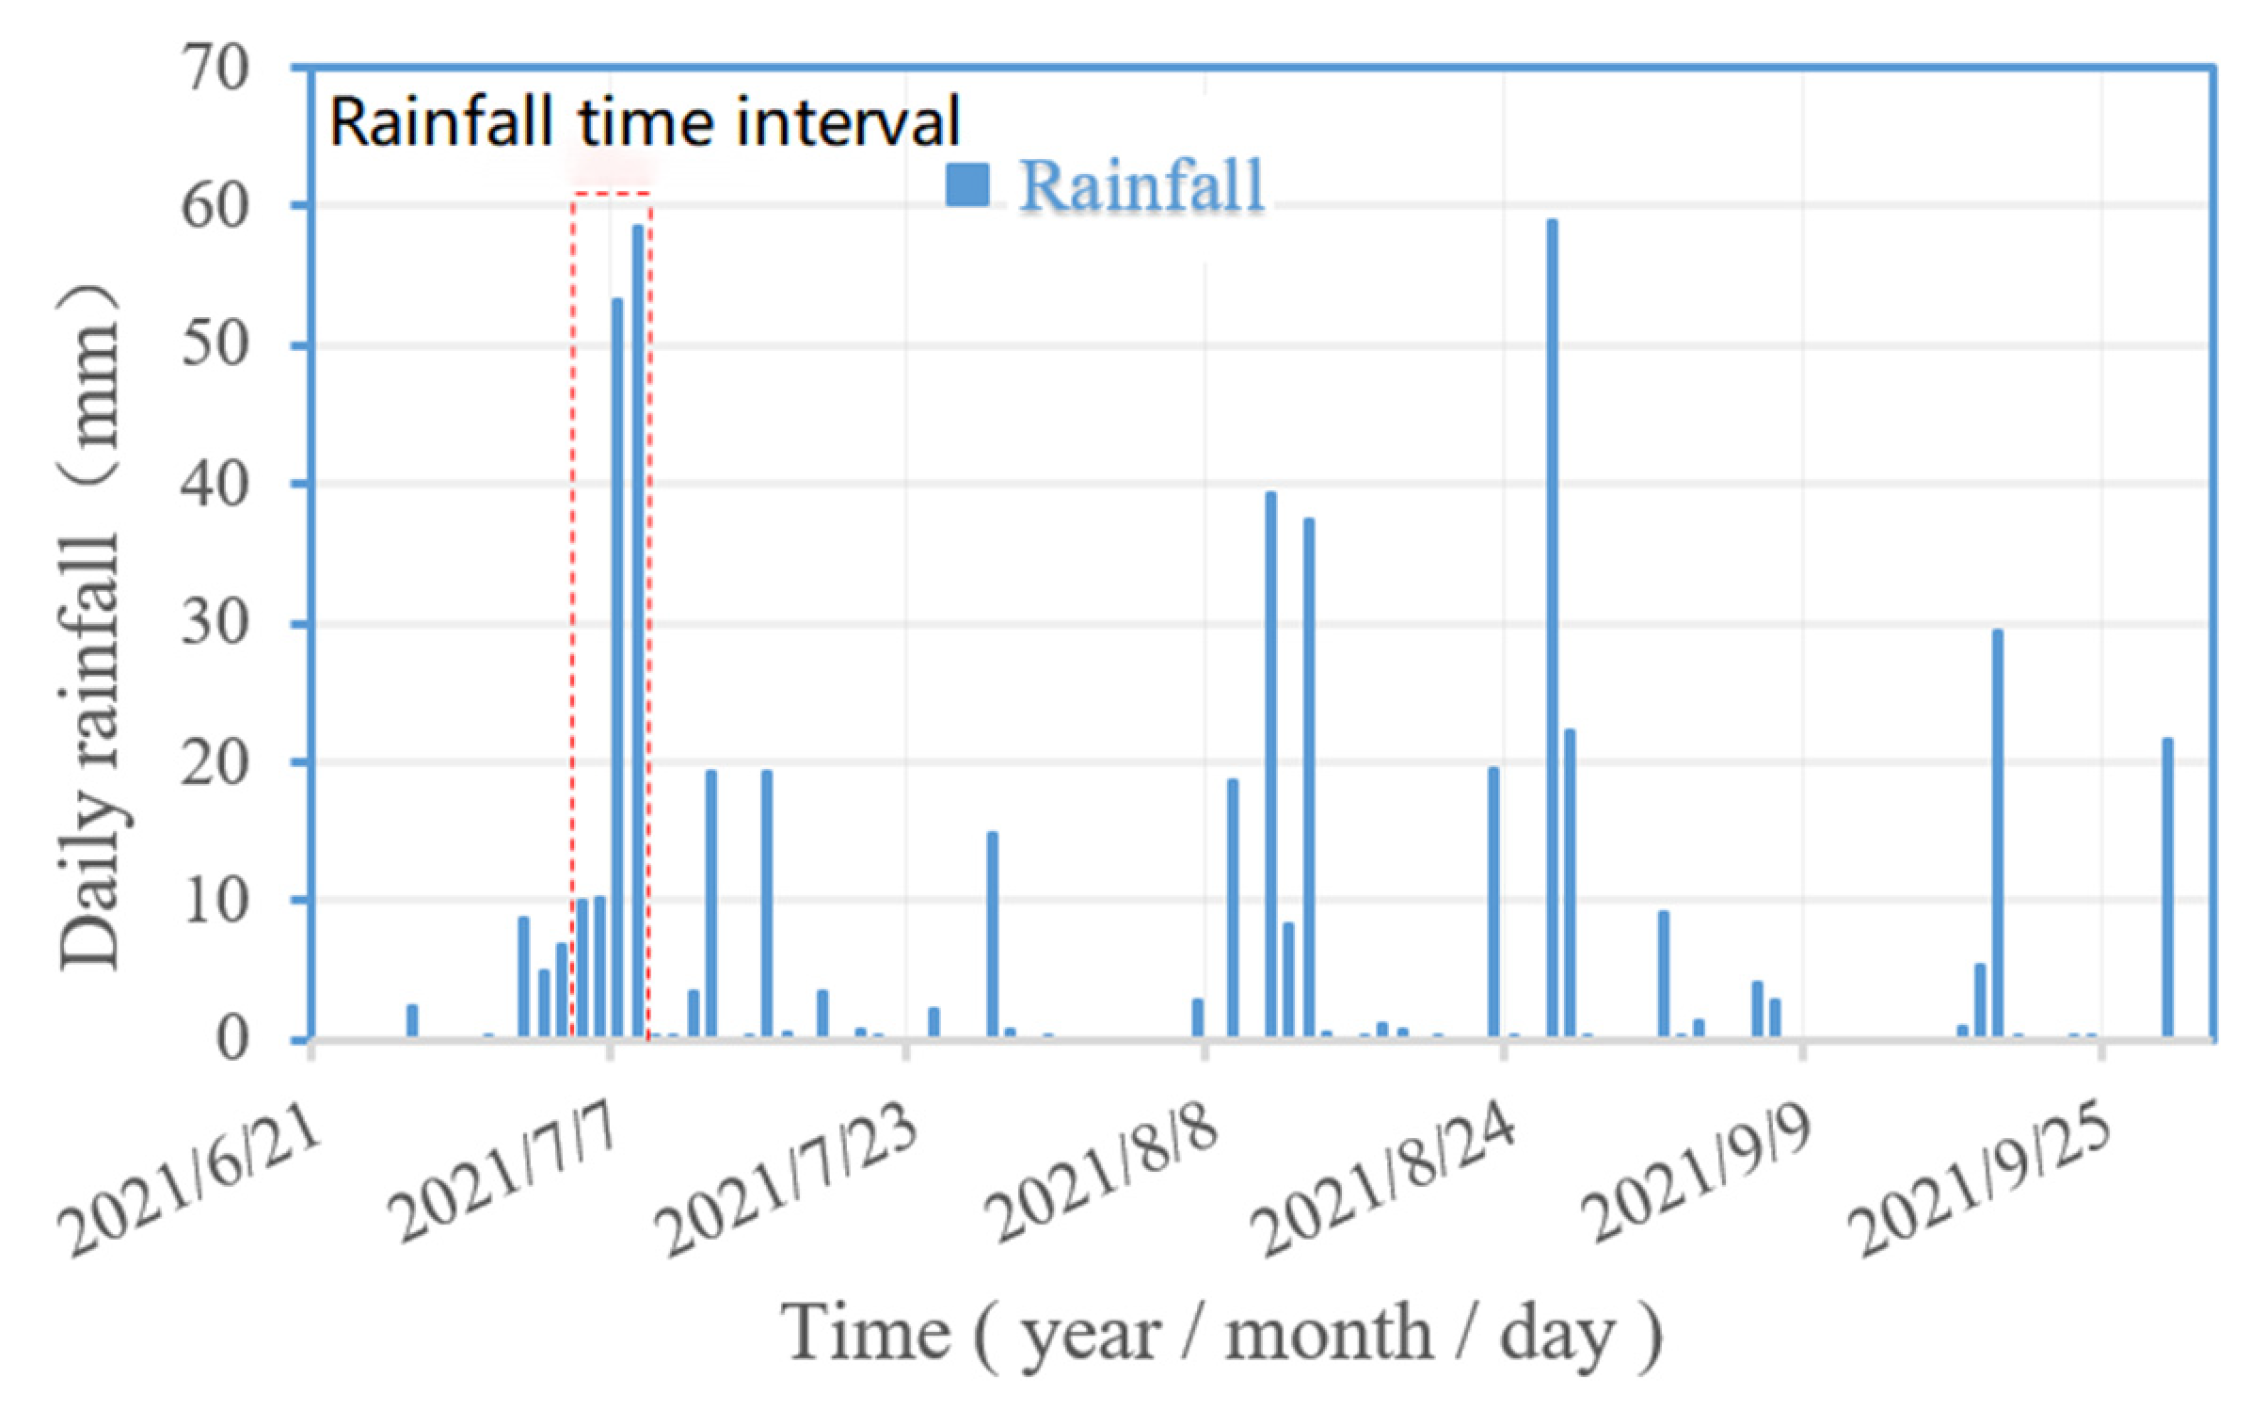
Rainfall data: collected as the precipitation from rain gauges in Shazhenxi Town, Zigui County. Then, a spatial distribution map of rainfall intensity by the Kriging geo-statistics method was drawn and shown in
Figure 5. One rain gauge, numbered Q4942, was selected to analyze the recording data (
Figure 6) in detail because it was near the Tudiling monitoring landslide. Heavy rainfall occurred at the beginning of July 2021, especially from 5–8 July. The maximum daily precipitation was nearly 60 mm, a heavy one for this area, with an average monthly precipitation of about 125 mm. The rainfall intensity and duration from 5–8 July were calculated, and the maximum intensity was 10–14 mm/h on 8 July 2021 (
Table 2).
The extreme rainfall conditions were examined in the area considering the increasing extreme weather in western Hubei in recent years. The conditions were the rainfall intensity of 60 mm/d with the duration of 1 d, 3 d, and 6 d (
Table 2).
3. Results
All the input data, such as soil and water mechanical parameters, slope elevation, and soil thickness for the TRIGRS model, were generated using the GIS spatial analysis. The slope stability was predicted by the factor of safety (FS) calculated for different rainfall conditions by employing the TRIGRS model.
3.1. Stability Prediction and Verification under Actual Precipitation Conditions
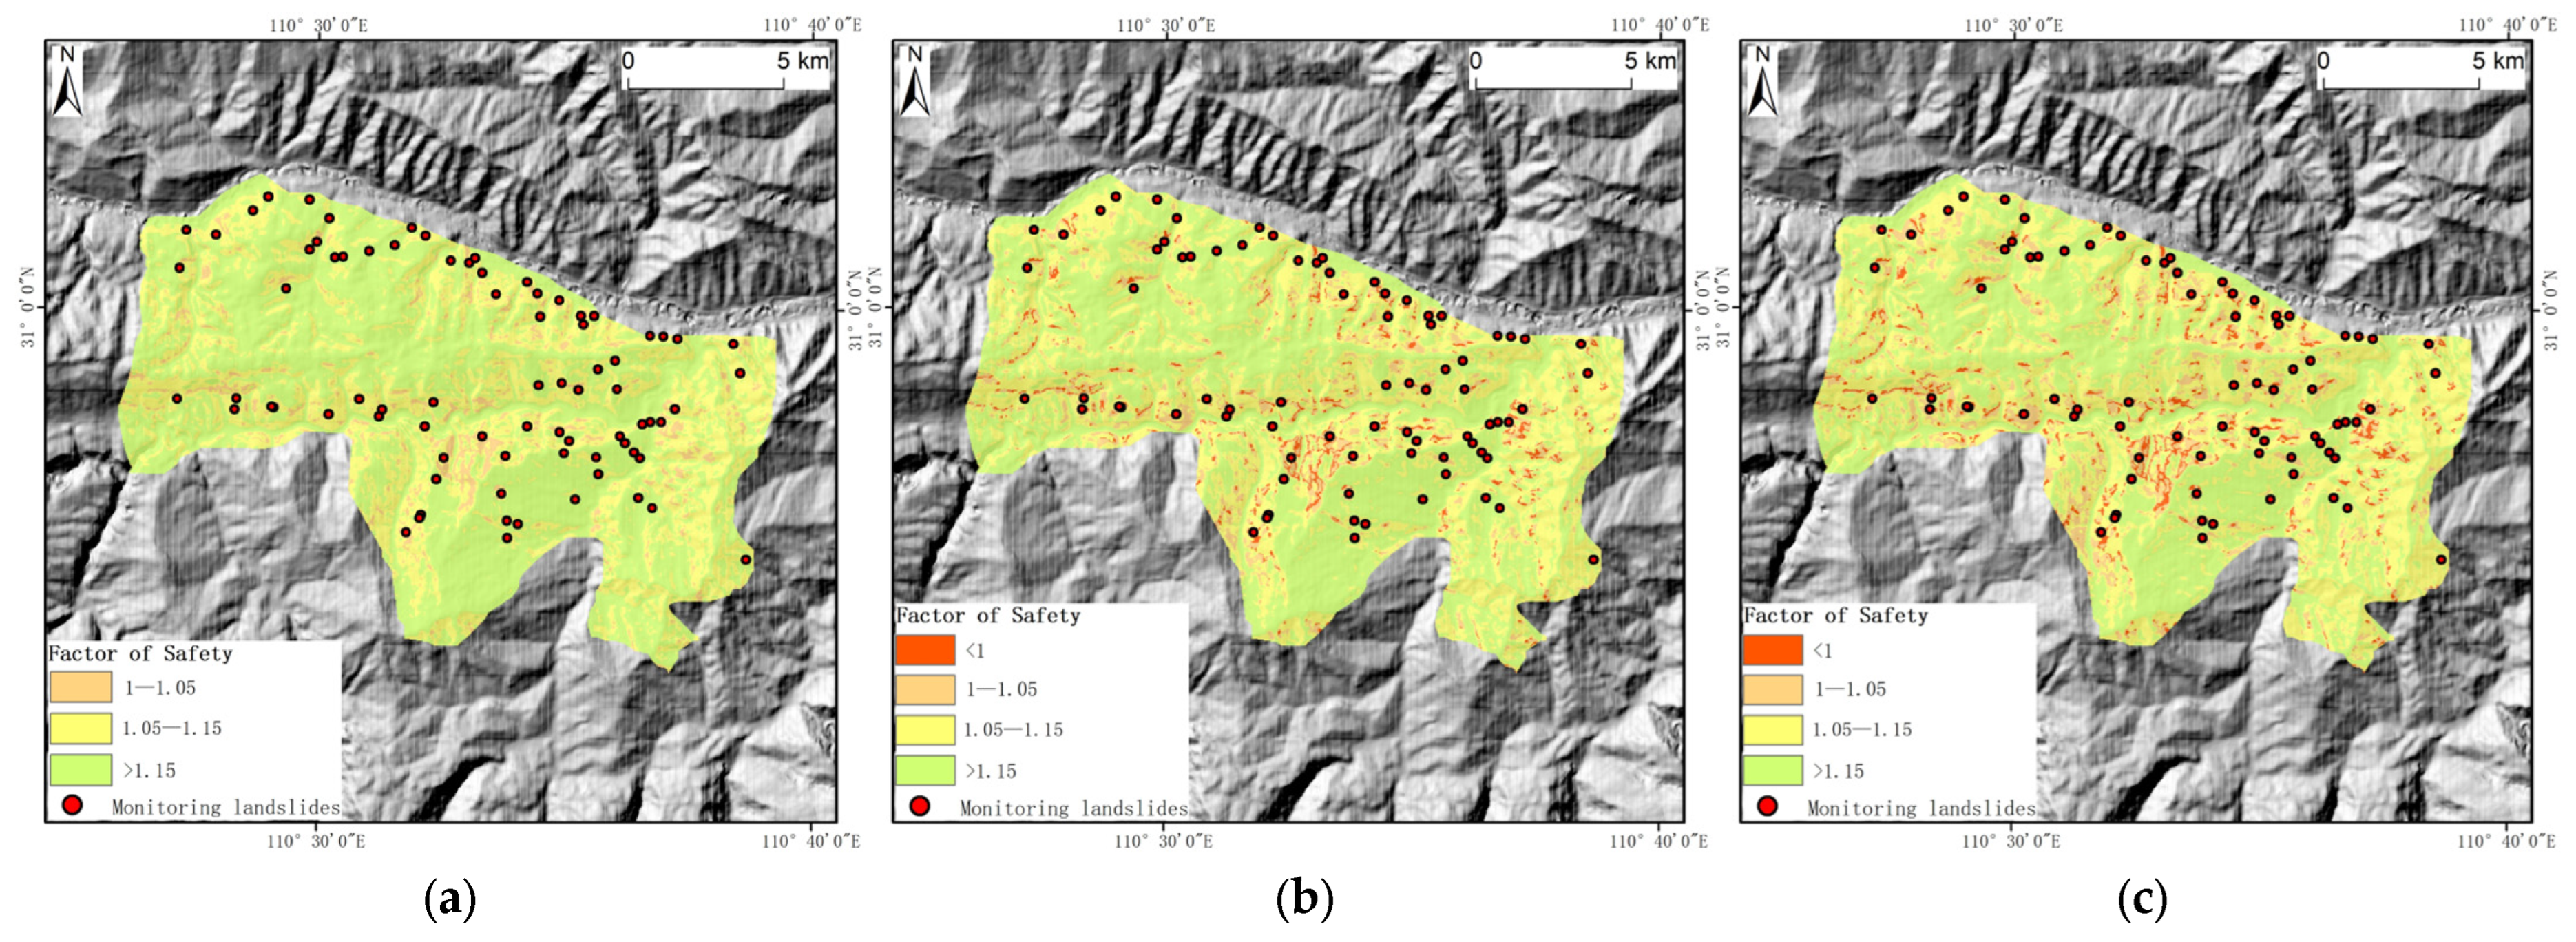
In order to evaluate the influence of rainfall on the stability of regional landslides, the heavy rainfall of actual conditions from 5–8 July 2021 was input into the TRIGRS model. The results were compared and verified by landslide deformation monitoring data. On 7 July, with the rainfall increased to 45–62 mm, the F
S of the areas of both sides of the Yangtze and Qinggan Rivers ranged from 1.05–1.15 to 1.00–1.05 (
Figure 7b). The percentage of the area with F
S in 1.00–1.05 was 6.24%, which was the first appear area (
Table 3). After the rainfall on 8 July, some less stable areas were unstable with F
S < 1.00 (
Figure 7c), and the percentage of unstable areas was 0.73% of the study area (
Table 3).
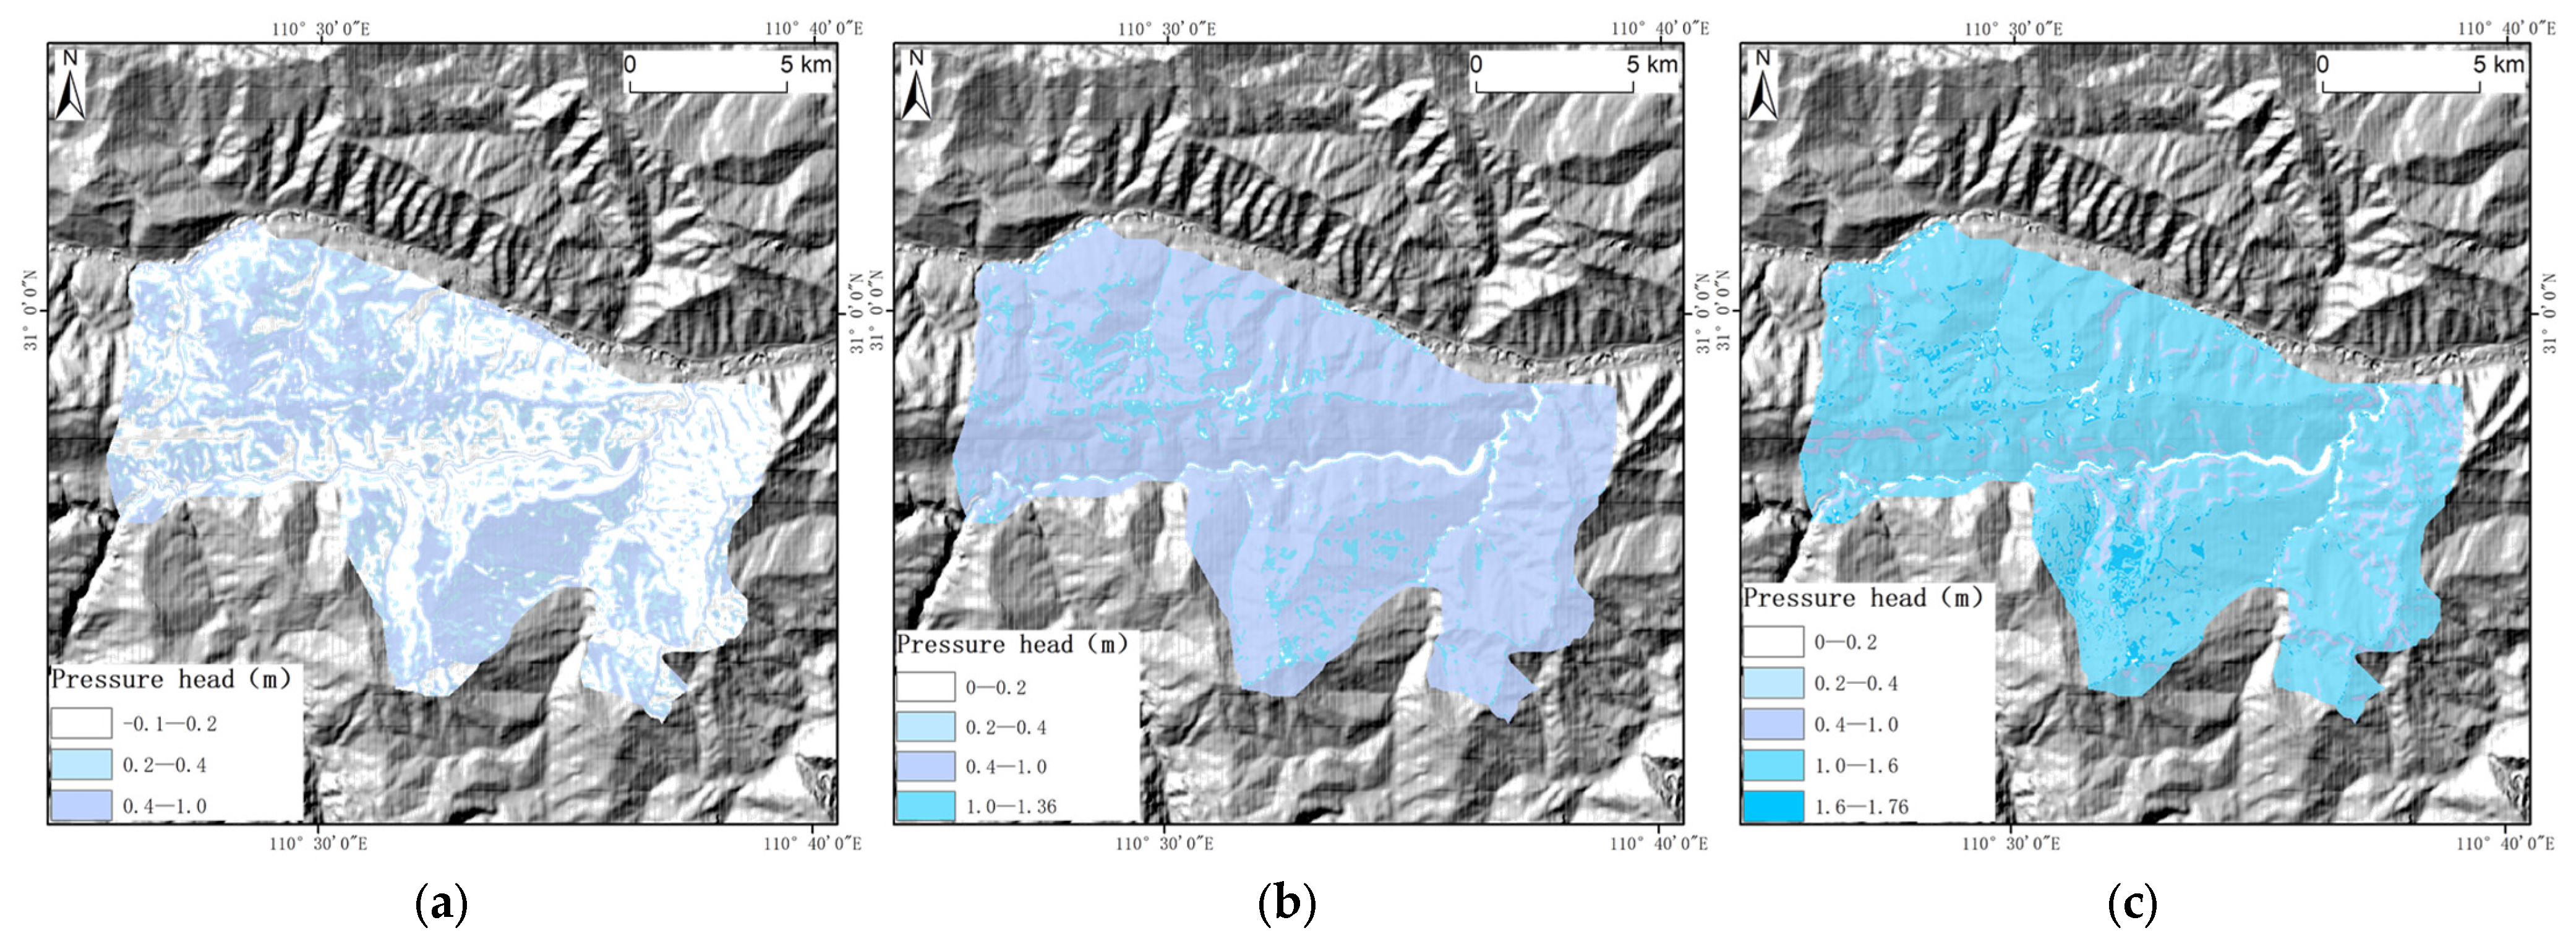
With the rainfall increasing and infiltrating, the pressure heads (
Pw) of the soil were higher (
Figure 8). On 5 July, most of the area had a lower pressure head, and 51.30% of the slope area had a pressure head
Pw < 0.2 m (
Table 3). However, most of the area had higher pressure heads, which was 86.72% of the areas with the
Pw in the range of 0.4 m to 1.0 m on 7 July and 83.68% of the areas with the
Pw in the range of 1.0 m to 1.6 m on 8 July, respectively.
In the less stable areas in
Figure 7c, there are some dormant landslides, which have been monitored using GNSS. One monitored landslide is Tudiling Landslide (marked in
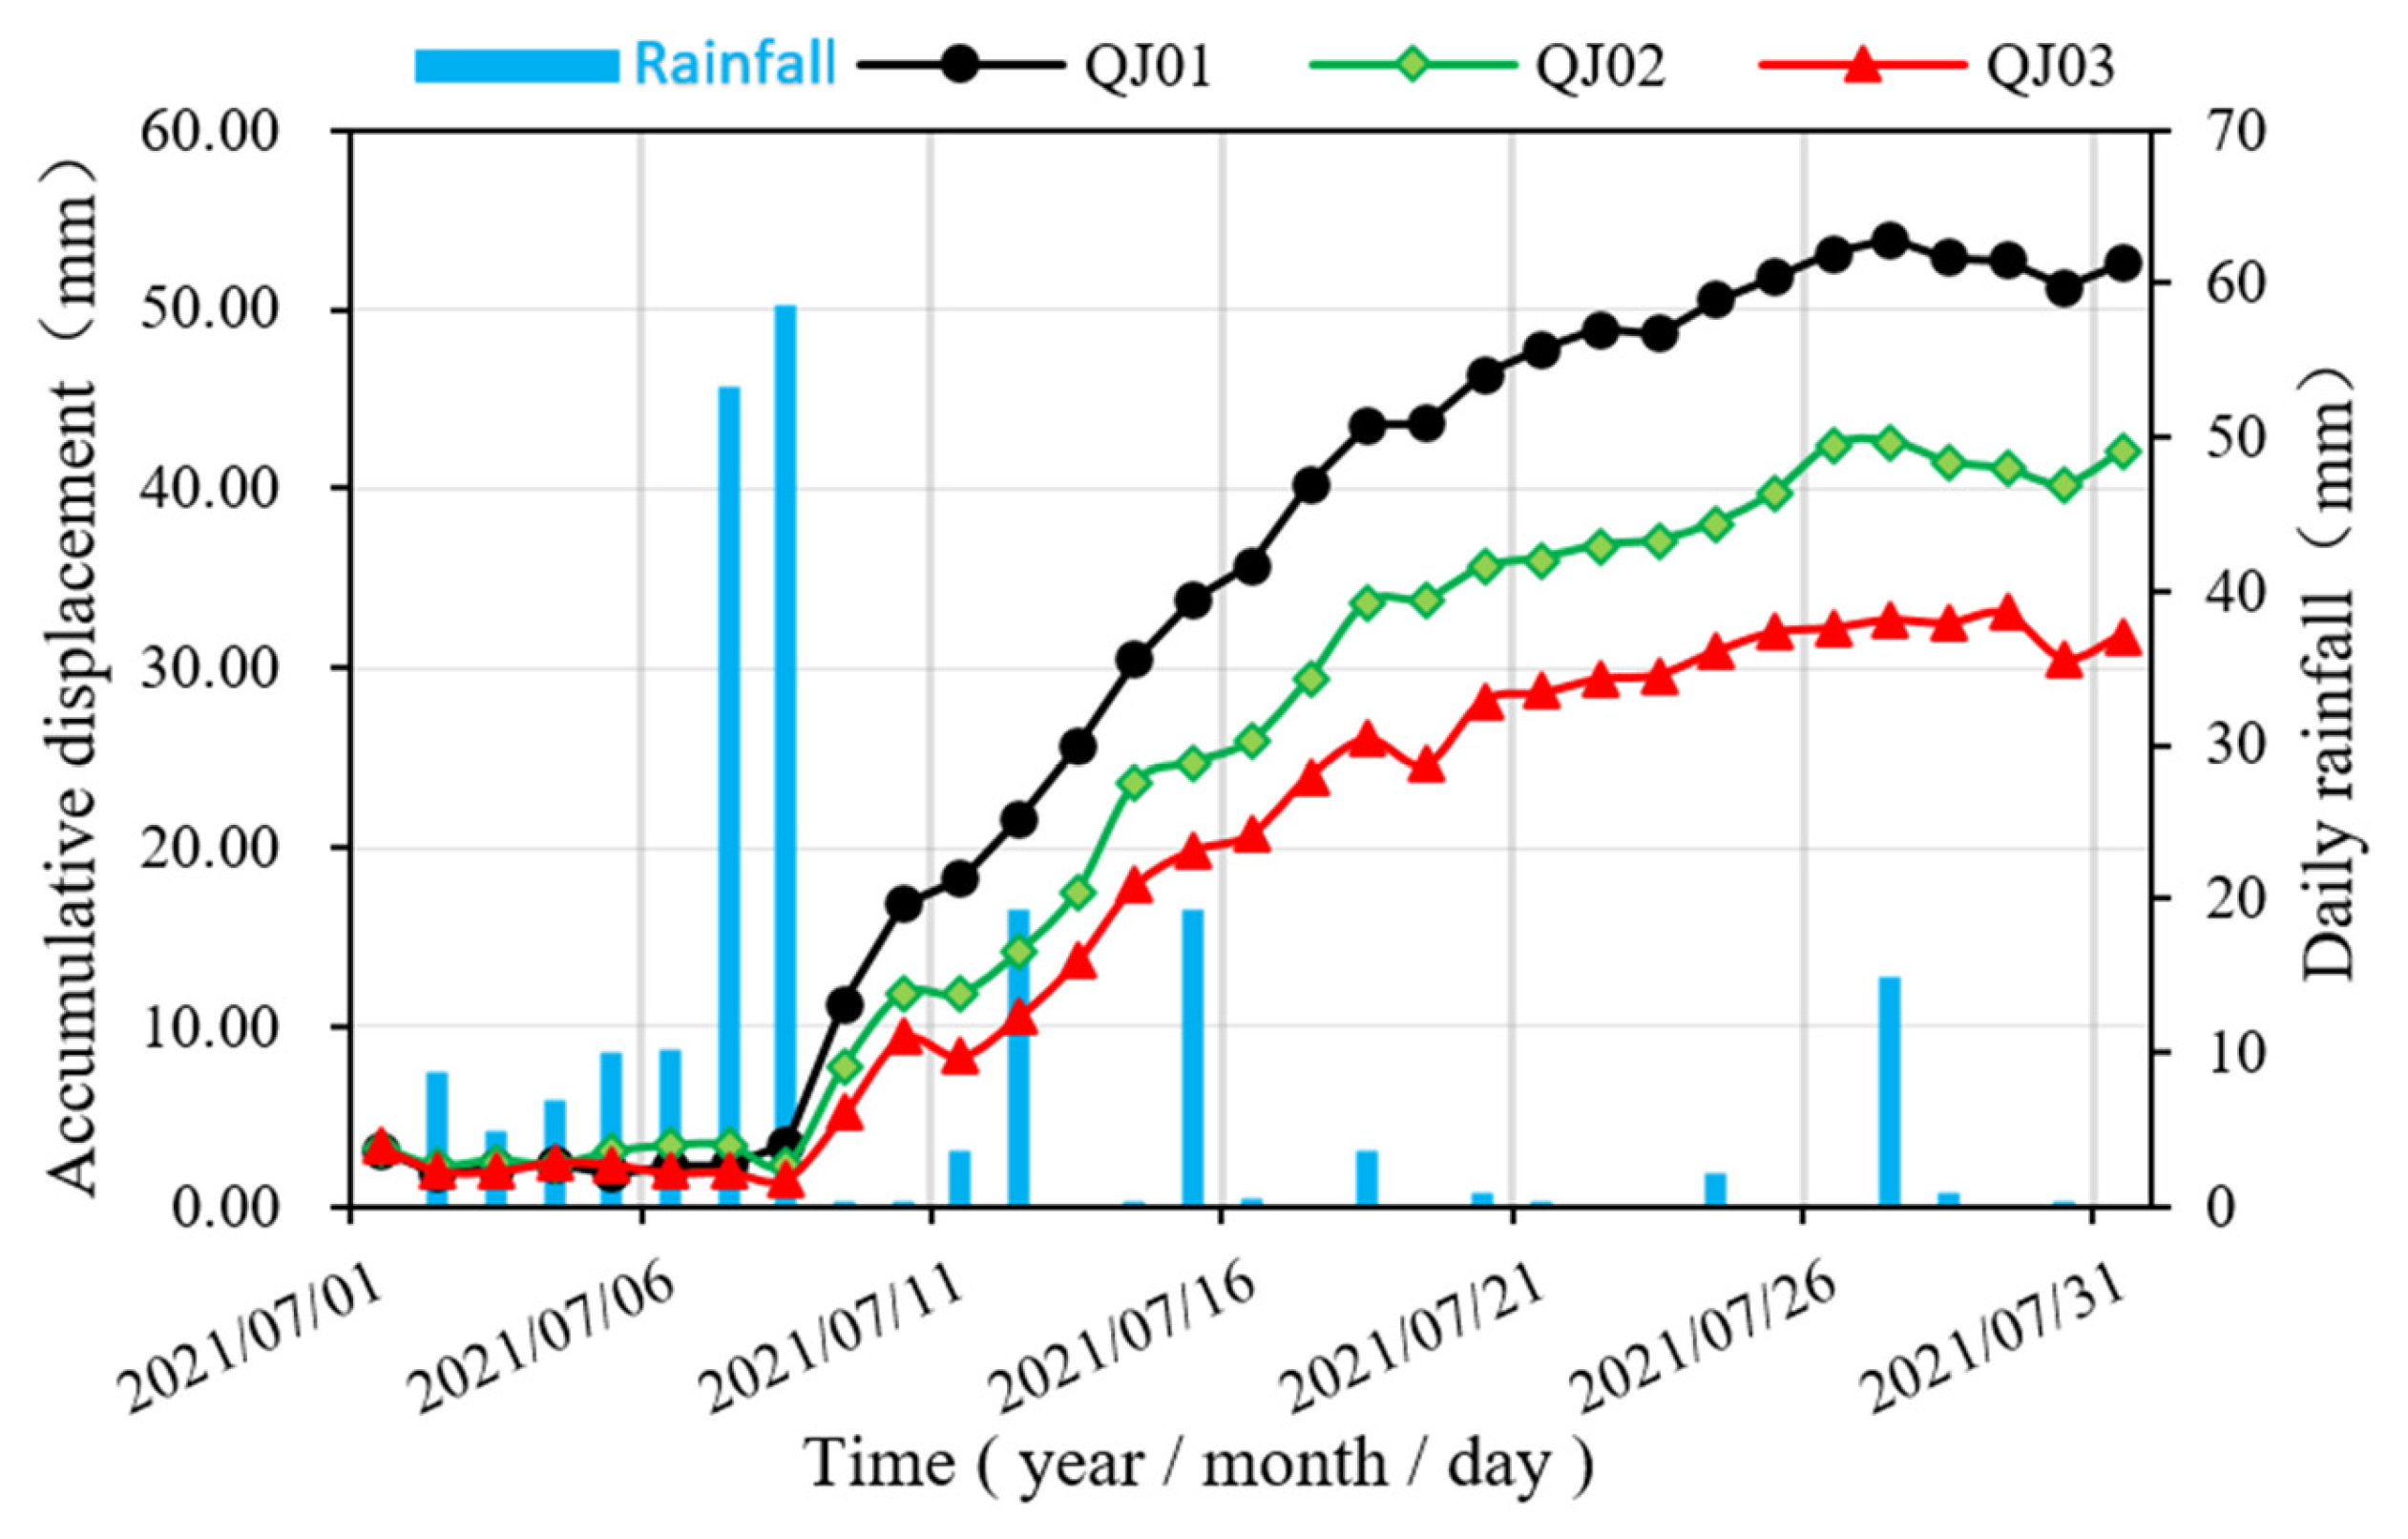
Figure 7c). The Tudiling Landslide was used to be chosen as a demonstrated case to decorate the reliability of the research. The Tudiling landslide is positioned in the center of the study area. It is a medium-sized landslide composed of clay and gravel soil in the sliding body. Three GNSS points (QJ01, QJ02, and QJ03) in the landslide surface were employed to monitor the deformation. After the 6–8 July rainfall, the monitoring displacement increased with time (
Figure 9). It means that the Tudingling Landslide is affected by heavy rainfall, and the stability of the Landslide is reduced. We estimated that the F
S was about 1.00–1.05 from the deformation velocity. That matches the calculated results of the TRIGRS model.
3.2. Stability Prediction under Extreme Rainfall
The landslide stability that may be caused by extreme rainfall was investigated and predicted. The extreme rainfall condition was designed so that the rainfall intensity was 60 mm/d for 6 days. The landslide stability was calculated by a TRIGRS model after 1 d, 3 d, and 6 d of rainfall infiltration.
The prediction results are shown in
Figure 10 and
Table 4. After the influence of extreme rainfall with an intensity of 60 mm/d, the stability of the slopes gradually decreased. The F
S of most slopes was more than 1.05 in the study area (
Figure 10a), and the percentage was 95.48% in
Table 4. About 36.82% of the area had an F
S in the range of 1.05 to 1.15, and 58.66% had the F
S > 1.15. With the rainfall continuing, the area with the F
S < 1.05 increased.
Figure 10b shows the stability of the slopes after three days of extreme rainfall. The area with F
S < 1.05 increased to 10.00% (
Table 4), which accounted for 7.83% and 2.17%, with the F
S in the range of 1.00 to 1.05 and F
S < 1.00, respectively. At the end of the extreme rainfall condition (six days of continuous rainfall with the intensity of 60 mm/d), about 14.63% of the areas had an F
S less than 1.05 (
Figure 10c and
Table 4). The percentages increased to 11.45% and 3.18% of the F
S in the interval of 1.00 to 1.05 and less than 1.00, respectively. It suggested that the less stable and unstable areas would be mainly distributed on the steep slopes on both sides of the Yangtze River and the Qinggan River.
4. Discussion
The results regarding the case study in the Shazhenxi mountainous region demonstrated that the TRIGRS model can predict shallow landslide stability with some statistical data. Although, some results may be incorrect by employing statistical data of the Digital Elevation Model (DEM), flow direction, soil mechanical parameters, and thickness. Not all regions with FS < 1.00 would be a failure under extreme rainfall.
The prediction has value for the government and residents in disaster reduction. The rainfall, especially the extreme rainfall, affected the shallow landslide stability. The role played by the rainfall in triggering shallow landslides in the study area requires further investigation. Rainfall data used in the TRIGRS analyses were gathered from a rain gauge stations. The gauge stations are not enough for the study area of 122.8 km2 for mountainous areas with different elevations. A more comprehensive monitoring system, including rain gauges, GNSSS surface deformation monitoring points, water table level, and piezometers, is being installed to record the rainfall potentially influencing shallow landslides and disaster reduction. That will be used to verify the results in the future.
The shallow landslide stability was predicted by the TRIGRS model under actual and extreme rainfall in the Shazhenxi area. However, deep-seated landslides or rockslides should not be neglected by the residents. The precipitation significantly influences slope mass movement, and the reservoir water is also a dominant factor for the bank slopes of the Yangtze River and Qinggan River.
5. Conclusions
A mountainous area in China was used to demarcate areas prone to rainfall-induced shallow landslides using the TRIGRS model. After field investigation and inputting the engineering geological and geotechnical characteristic data, the slope stability was simulated and predicted.
The stability of regional shallow landslides was evaluated by the TRIGRS model with the heavy rainfall of actual condition from 5–8 July 2021. After the rainfall on 8 July, some less stable areas tended to be unstable areas with FS < 1.00, and the percentage of unstable areas was 0.73%. On-site landslide monitoring data were used to verify the results, which was compelling evidence for the TRIGRS model.
The slope stability decreased gradually in the predicted condition, where the rainfall intensity was 60 mm/d and lasted 6 days. The percentage of the slope area with the FS < 1.0 increased from 0.00% (1 d) to 3.18% (6 d).
Author Contributions
Conceptualization, K.S. and L.H.; methodology, K.S. and L.H.; software, L.H.; validation, H.L. and B.M.; formal analysis, L.H. and D.R.; investigation, K.S., L.H. and D.R.; data curation, L.H. and H.L.; writing—original draft preparation, L.H. and D.R.; writing—review and editing, K.S.; supervision, B.M.; project administration, B.M.; funding acquisition, K.S. All authors have read and agreed to the published version of the manuscript.
Funding
This research was funded by the Open Fund of Hebei Key Laboratory of Geological Resources and Environment Monitoring and Protection, grant number JCYKT202004 and the National Natural Science Foundation of China, grant number 42077239 and 41702378.
Data Availability Statement
The Digital Elevation Model (DEM) data is the public data from the Google Earth. Other data presented in this study are available on request from the corresponding author.
Conflicts of Interest
The authors declare that they have no known competing financial interest or personal relationships that could have appeared to influence the work reported in this paper.
References
- Petley, D. Global patterns of loss of life from landslides. Geology 2012, 40, 927–930. [Google Scholar] [CrossRef]
- Froude, M.J.; Petley, D.N. Global fatal landslide occurrence from 2004 to 2016. Nat. Hazards Earth Syst. Sci. 2018, 18, 2161–2181. [Google Scholar] [CrossRef] [Green Version]
- Caine, N. The rainfall intensity-duration control of shallow landslides and debris flows. Geogr. Ann. Ser. A Phys. Geogr. 1980, 62, 23–27. [Google Scholar]
- Hong, Y.; Hiura, H.; Shino, K.; Sassa, K.; Suemine, A.; Fukuoka, H.; Wang, G.H. The influence of intense rainfall on the activity of large-scale crystalline schist landslides in Shikoku Island, Japan. Landslides 2005, 2, 97–105. [Google Scholar] [CrossRef]
- Huang, Q.X.; Wang, J.L.; Xue, X. Interpreting the influence of rainfall and reservoir infilling on a landslide. Landslides 2016, 13, 1139–1149. [Google Scholar] [CrossRef]
- Jomelli, V.; Pech, V.P.; Chochillon, C.; Brunstein, D. Geomorphic Variations of Debris Flows and Recent Climatic Change in the French Alps. Clim. Chang. 2004, 64, 77–102. [Google Scholar] [CrossRef]
- Crozier, M.J. Deciphering the effect of climate change on landslide activity: A review. Geomorphology 2010, 124, 260–267. [Google Scholar] [CrossRef]
- Kirschbaum, D.; Adler, R.; Adler, D.; Peters-Lidard, G.; Huffman, G. Global distribution of extreme precipitation and high-impact landslides in 2010 relative to previous years. J. Hydrometeor. 2012, 13, 1536–1551. [Google Scholar] [CrossRef] [Green Version]
- Skrzypczak, I.; Kokoszka, W.; Zientek, D.; Tang, Y.; Kogut, J. Landslide Hazard Assessment Map as an Element Supporting Spatial Planning: The Flysch Carpathians Region Study. Remote Sens. 2021, 13, 317. [Google Scholar] [CrossRef]
- Delaney, K.B.; Evans, S.G. The 2000 Yigong landslide (Tibetan Plateau), rockslide-dammed lake and outburst flood: Review, remote sensing analysis, and process modelling. Geomorphology 2015, 246, 377–393. [Google Scholar]
- Yin, Y.; Cheng, Y.; Liang, J.; Wang, W. Heavy-rainfall-induced catastrophic rockslide-debris flow at Sanxicun, Dujiangyan, after the Wenchuan Ms 8.0 earthquake. Landslides 2016, 13, 9–23. [Google Scholar] [CrossRef]
- Zhu, D.; Song, K.; Mu, J.; Huang, H.; Du, H.; Ziazhuang, F.; Sun, C. Effect of climate change induced extreme precipitation on landslide activity in the Three Gorges Reservoir, China. Bull. Eng. Geo. Environ. 2021, 80, 781–794. [Google Scholar] [CrossRef]
- Song, K.; Wang, F.; Zuo, Q.; Huang, B.; Mao, W.; Zheng, H. Successful disaster management of the July 2020 Shaziba landslide triggered by heavy rainfall in Mazhe Village, Enshi City, Hubei Province, China. Landslides 2021, 18, 3503–3507. [Google Scholar] [CrossRef]
- von Ruette, J.; Lehmann, P.; Or, D. Linking rainfall-induced landslides with predictions of debris flow runout distances. Landslides 2016, 13, 1097–1107. [Google Scholar] [CrossRef]
- Deng, J.; Ma, C.; Zhang, Y. Shallow landslide characteristics and its response to vegetation by example of July 2013, extreme rainstorm, Central Loess Plateau, China. Bull. Eng. Geo. Environ. 2022, 81, 100. [Google Scholar] [CrossRef]
- Baum, R.L.; Savage, W.Z.; Godt, J.W. TRIGRS: A Fortran Porgram for Transient Rainfall Infiltration and Grid-Based Regional Slope Stability Analysis; Open-File Report 02-0424; U.S. Geological Survey: Reston, VA, USA, 2002.
- Kim, D.; Im, S.; Lee, S.H.; Hong, Y.; Cha, K. Predicting the rainfall-triggered landslides in a forested mountain region using TRIGRS model. J. Mt. Sci. 2010, 7, 83–91. [Google Scholar]
- Park, D.W.; Nikhil, N.V.; Lee, S.R. Landslide and debris flow susceptibility zonation using TRIGRS for the 2011 Seoul landslide event. Nat. Hazards Earth Syst. Sci. 2013, 13, 2833–2849. [Google Scholar] [CrossRef] [Green Version]
- García-Ruiz, J.M.; Beguería, S.; Arnáez, J.; Sanjuán, Y.; Lana-Renault, N.; Gómez-Villar, A.; Álvarez-Martínez, J.; Coba-Pérez, P. Deforestation induces shallow landsliding in the montane and subalpine belts of the Urbión Mountains, Iberian Range, Northern Spain. Geomorphology 2017, 296, 31–44. [Google Scholar] [CrossRef] [Green Version]
- Viet, T.T.; Lee, G.; Thu, T.M.; An, H.U. Effect of digital elevation model resolution on shallow landslide modeling using TRIGRS. Nat. Hazards Rev. 2017, 18, 04016011. [Google Scholar] [CrossRef]
- Wang, F.; Zhang, Y.; Huo, Z.; Matsumoto, T.; Huang, B. The 14 July 2003 Qianjiangping landslide, Three Gorges Reservoir, China. Landslides 2004, 1, 157–162. [Google Scholar]
- Song, K.; Wang, F.; Yi, Q.; Lu, S. Landslide deformation behavior influenced by water level fluctuations of the Three Gorges Reservoir (China). Eng. Geol. 2018, 247, 58–68. [Google Scholar]
- Huang, B.; Zheng, W.; Yu, Z.; Liu, G. A successful case of emergency landslide response—The Sept. 2, 2014, Shanshucao landslide, Three Gorges Reservoir, China. Geoenviron. Disasters 2015, 2, 18. [Google Scholar] [CrossRef] [Green Version]
- Baum, R.L.; Savage, W.Z.; Godt, J.W. TRIGRS—A Fortran Program for Transient Rainfall Infiltration and Grid-Based Regional Slope-Stability Analysis, Version 2.0; Open File Report 2008-1159; U.S. Geological survey: Reston, VA, USA, 2008.
- Baum, R.L.; Godt, J.W.; Savage, W.Z. Estimating the timing and location of shallow rainfall-induced landslides using a model for transient, unsaturated infiltration. J. Geophys. Res. 2010, 115, F03013. [Google Scholar]
- Liu, J. Estimation of Shear Strength of Slip Zone Soils in Middle Jurassic Red Beds in Wanzhou Reservoir Area. Master’s Thesis, China University of Geosciences, Wuhan, China, 2018. [Google Scholar]
- Fairfield, J.; Leymarie, P. Drainage Networks from Grid Digital Elevation Models. Water Resour. Res. 1991, 27, 709–717. [Google Scholar]
- Salciarini, D.; Godt, J.W.; Savage, W.Z.; Conversini, P.; Baum, R.L.; Michael, J.A. Modeling regional initiation of rainfall-induced shallow landslides in the eastern Umbria Region of central Italy. Landslides 2006, 3, 181–194. [Google Scholar]
- Raia, S.; Alvioli, M.; Rossi, M.; Baum, R.L.; Godt, J.W.; Guzzetti, F. Improving predictive power of physically based rainfall-induced shallow landslide models: A probabilistic approach. Geosci. Model Dev. 2014, 7, 495–514. [Google Scholar]
- Tran, T.V.; Alvioli, M.; Lee, G.; An, H.U. Three-dimensional, time-dependent modeling of rainfall-induced landslides over a digital landscape: A case study. Landslides 2018, 15, 1071–1084. [Google Scholar]
| Disclaimer/Publisher’s Note: The statements, opinions and data contained in all publications are solely those of the individual author(s) and contributor(s) and not of MDPI and/or the editor(s). MDPI and/or the editor(s) disclaim responsibility for any injury to people or property resulting from any ideas, methods, instructions or products referred to in the content. |
© 2023 by the authors. Licensee MDPI, Basel, Switzerland. This article is an open access article distributed under the terms and conditions of the Creative Commons Attribution (CC BY) license (https://creativecommons.org/licenses/by/4.0/).
