
Rain Pattern Deeply Reshaped Total Phosphorus Load Pattern in Watershed: A Case Study from Northern China

Abstract
1. Introduction
2. Materials and Methods
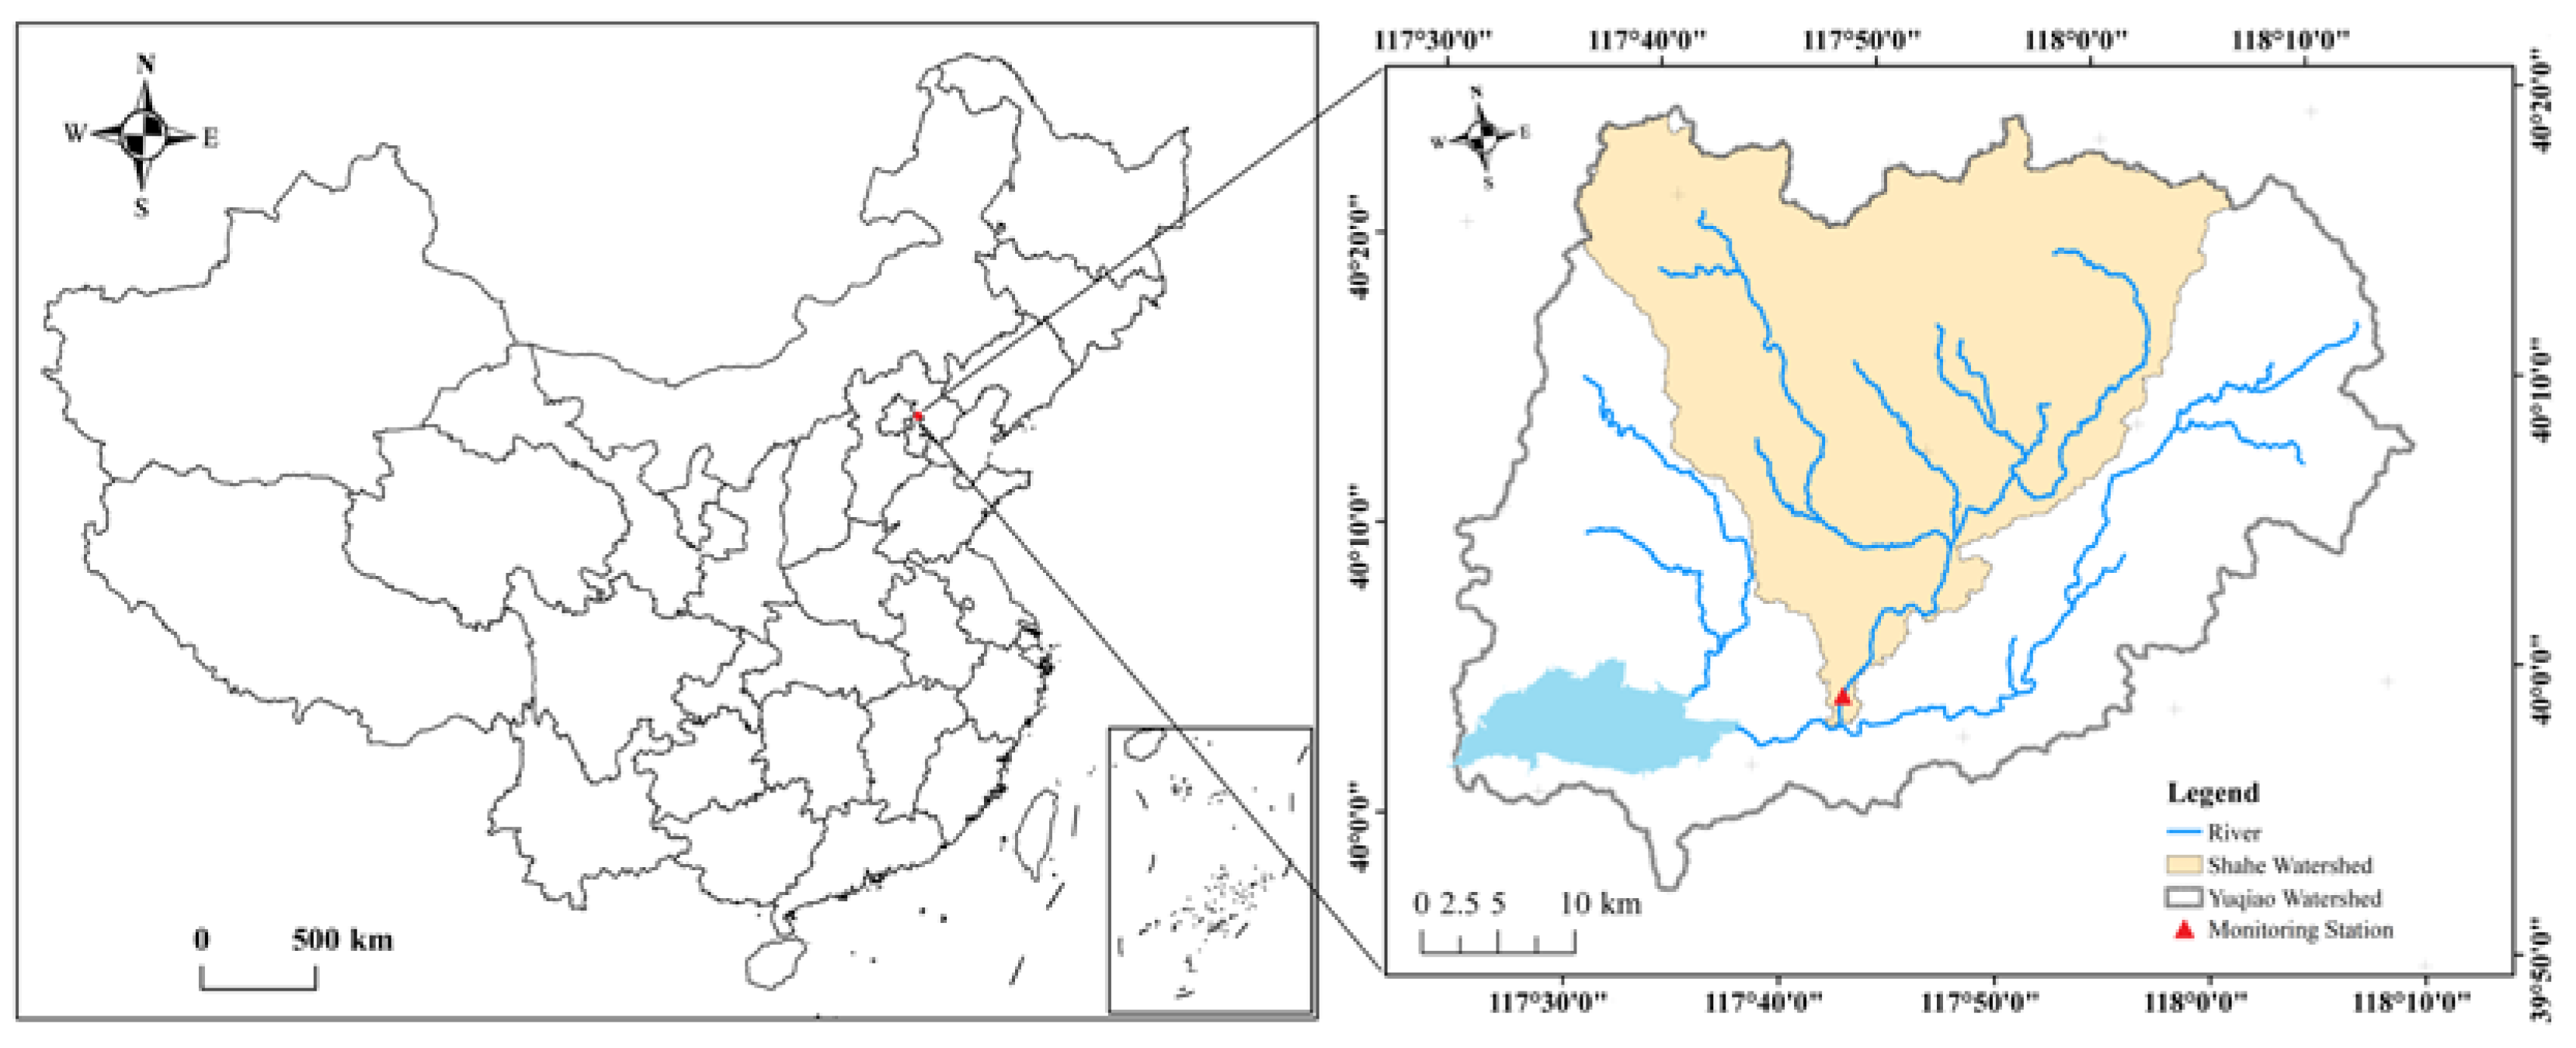
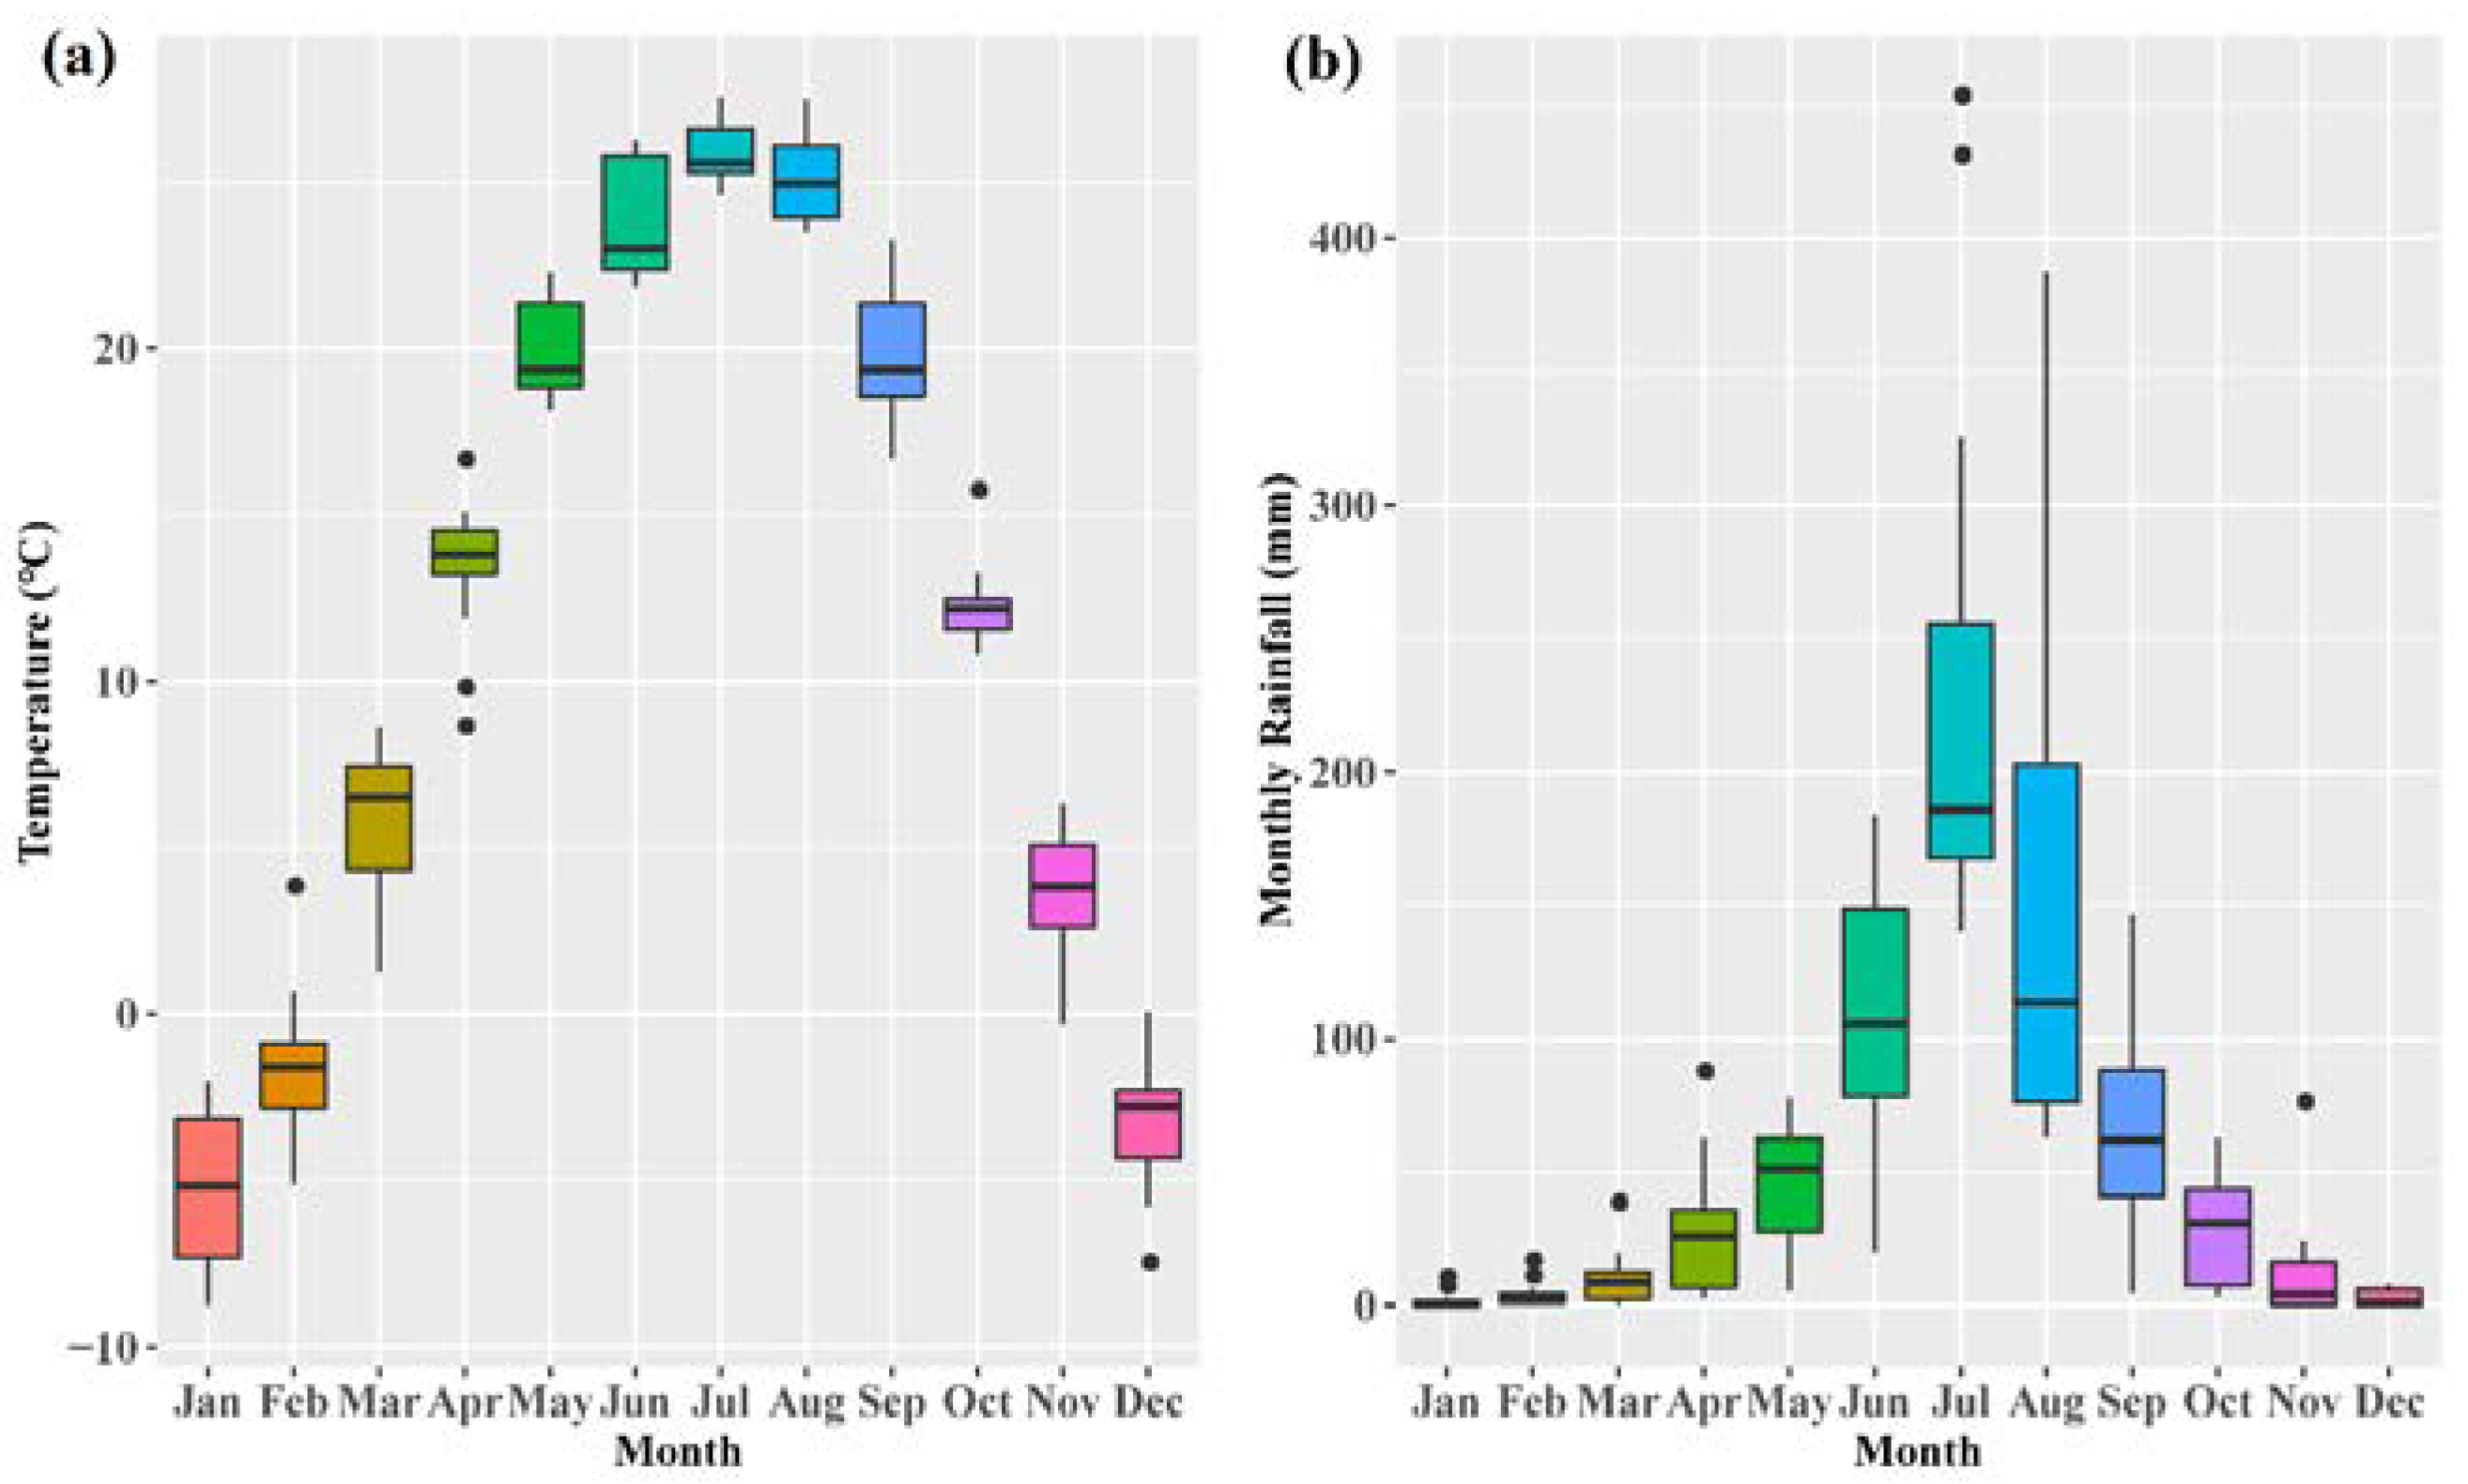
2.1. Study Area
2.2. Data Source
2.3. Bayesian Latent Variable Regression (BLVR)
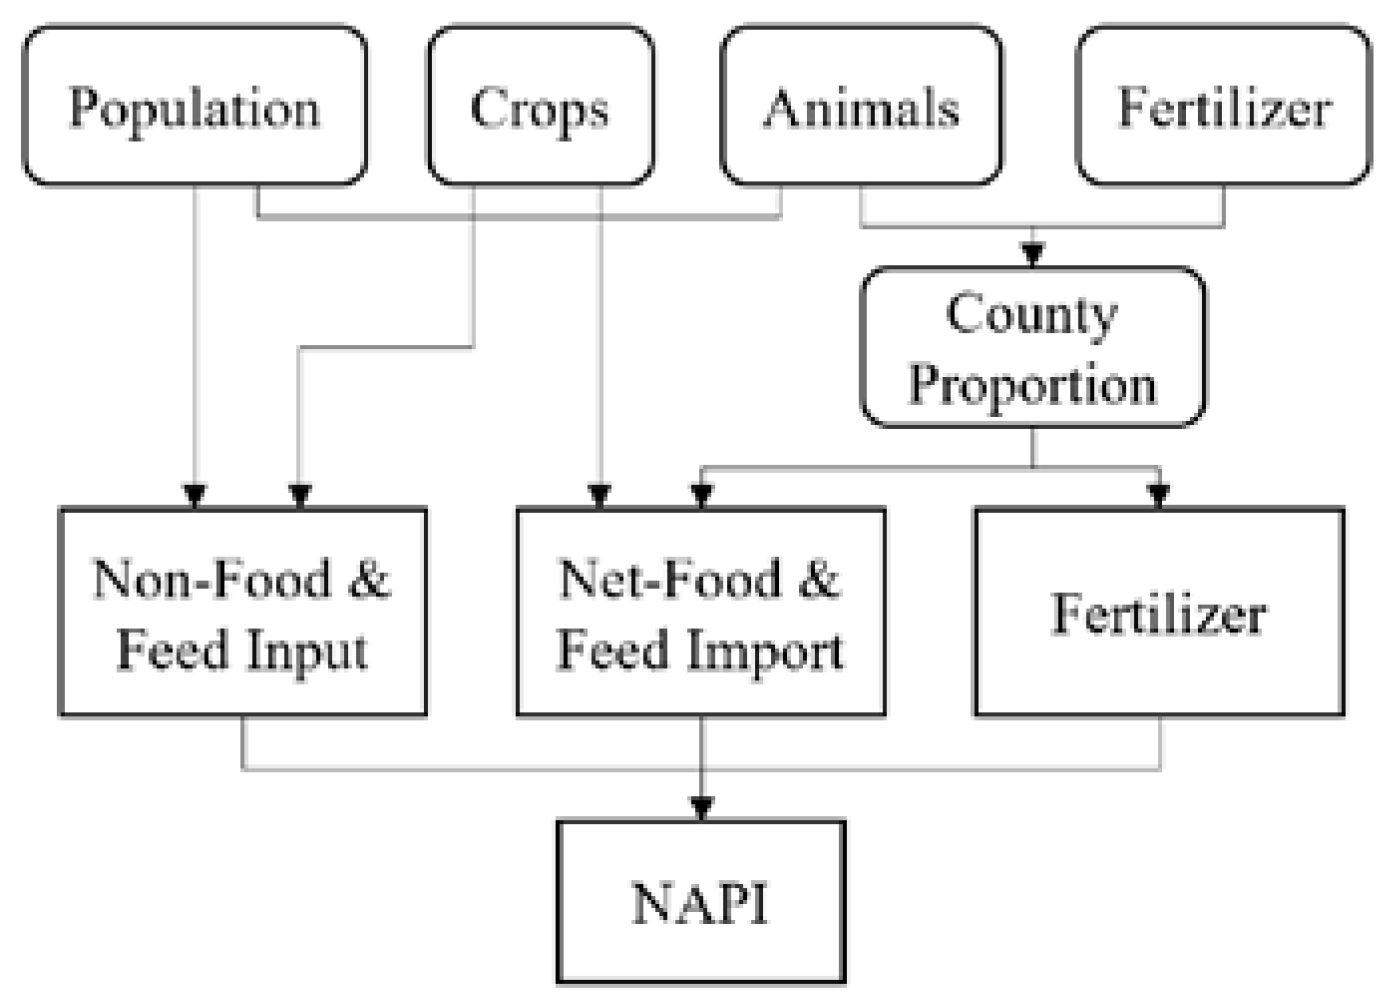
2.4. ReNuMa (Regional Nutrient Management)
3. Results
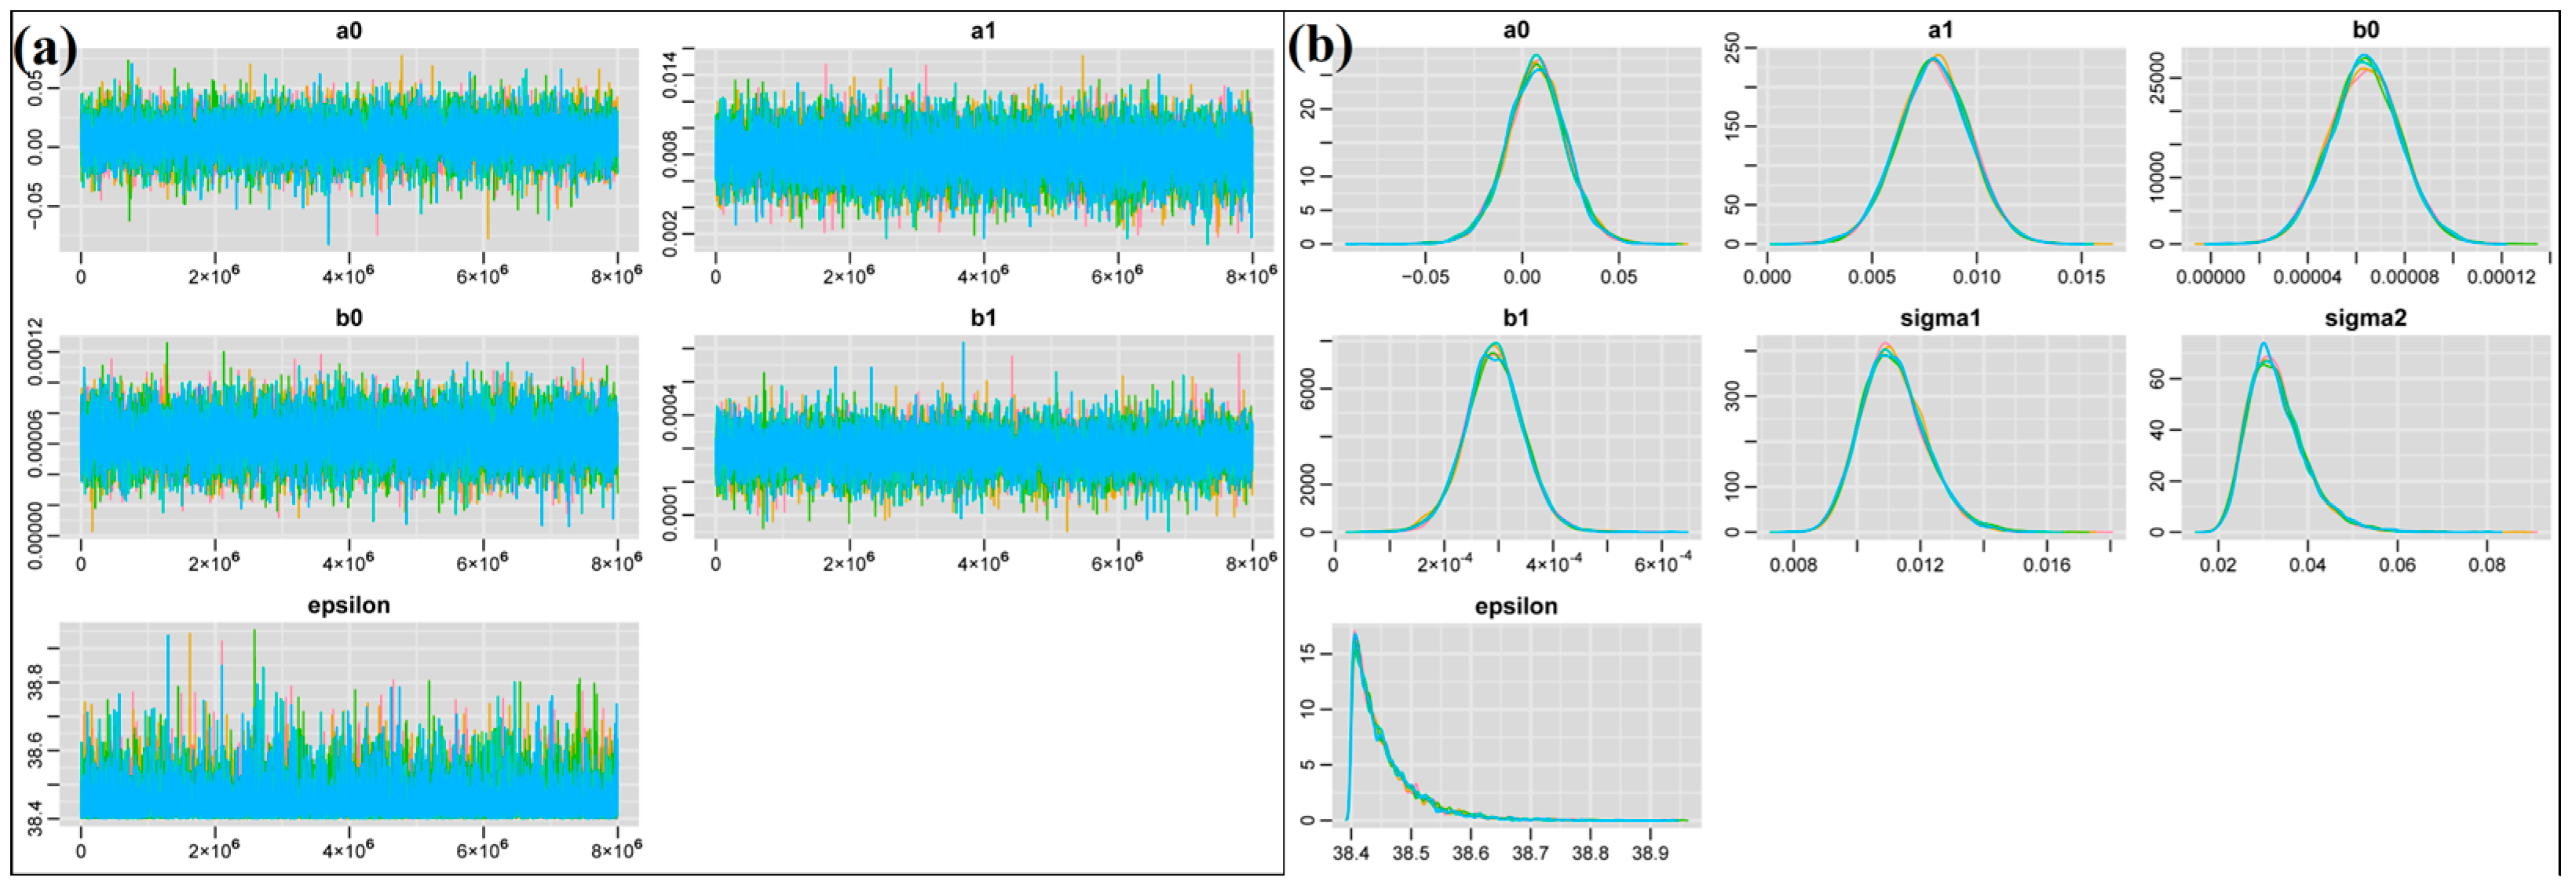
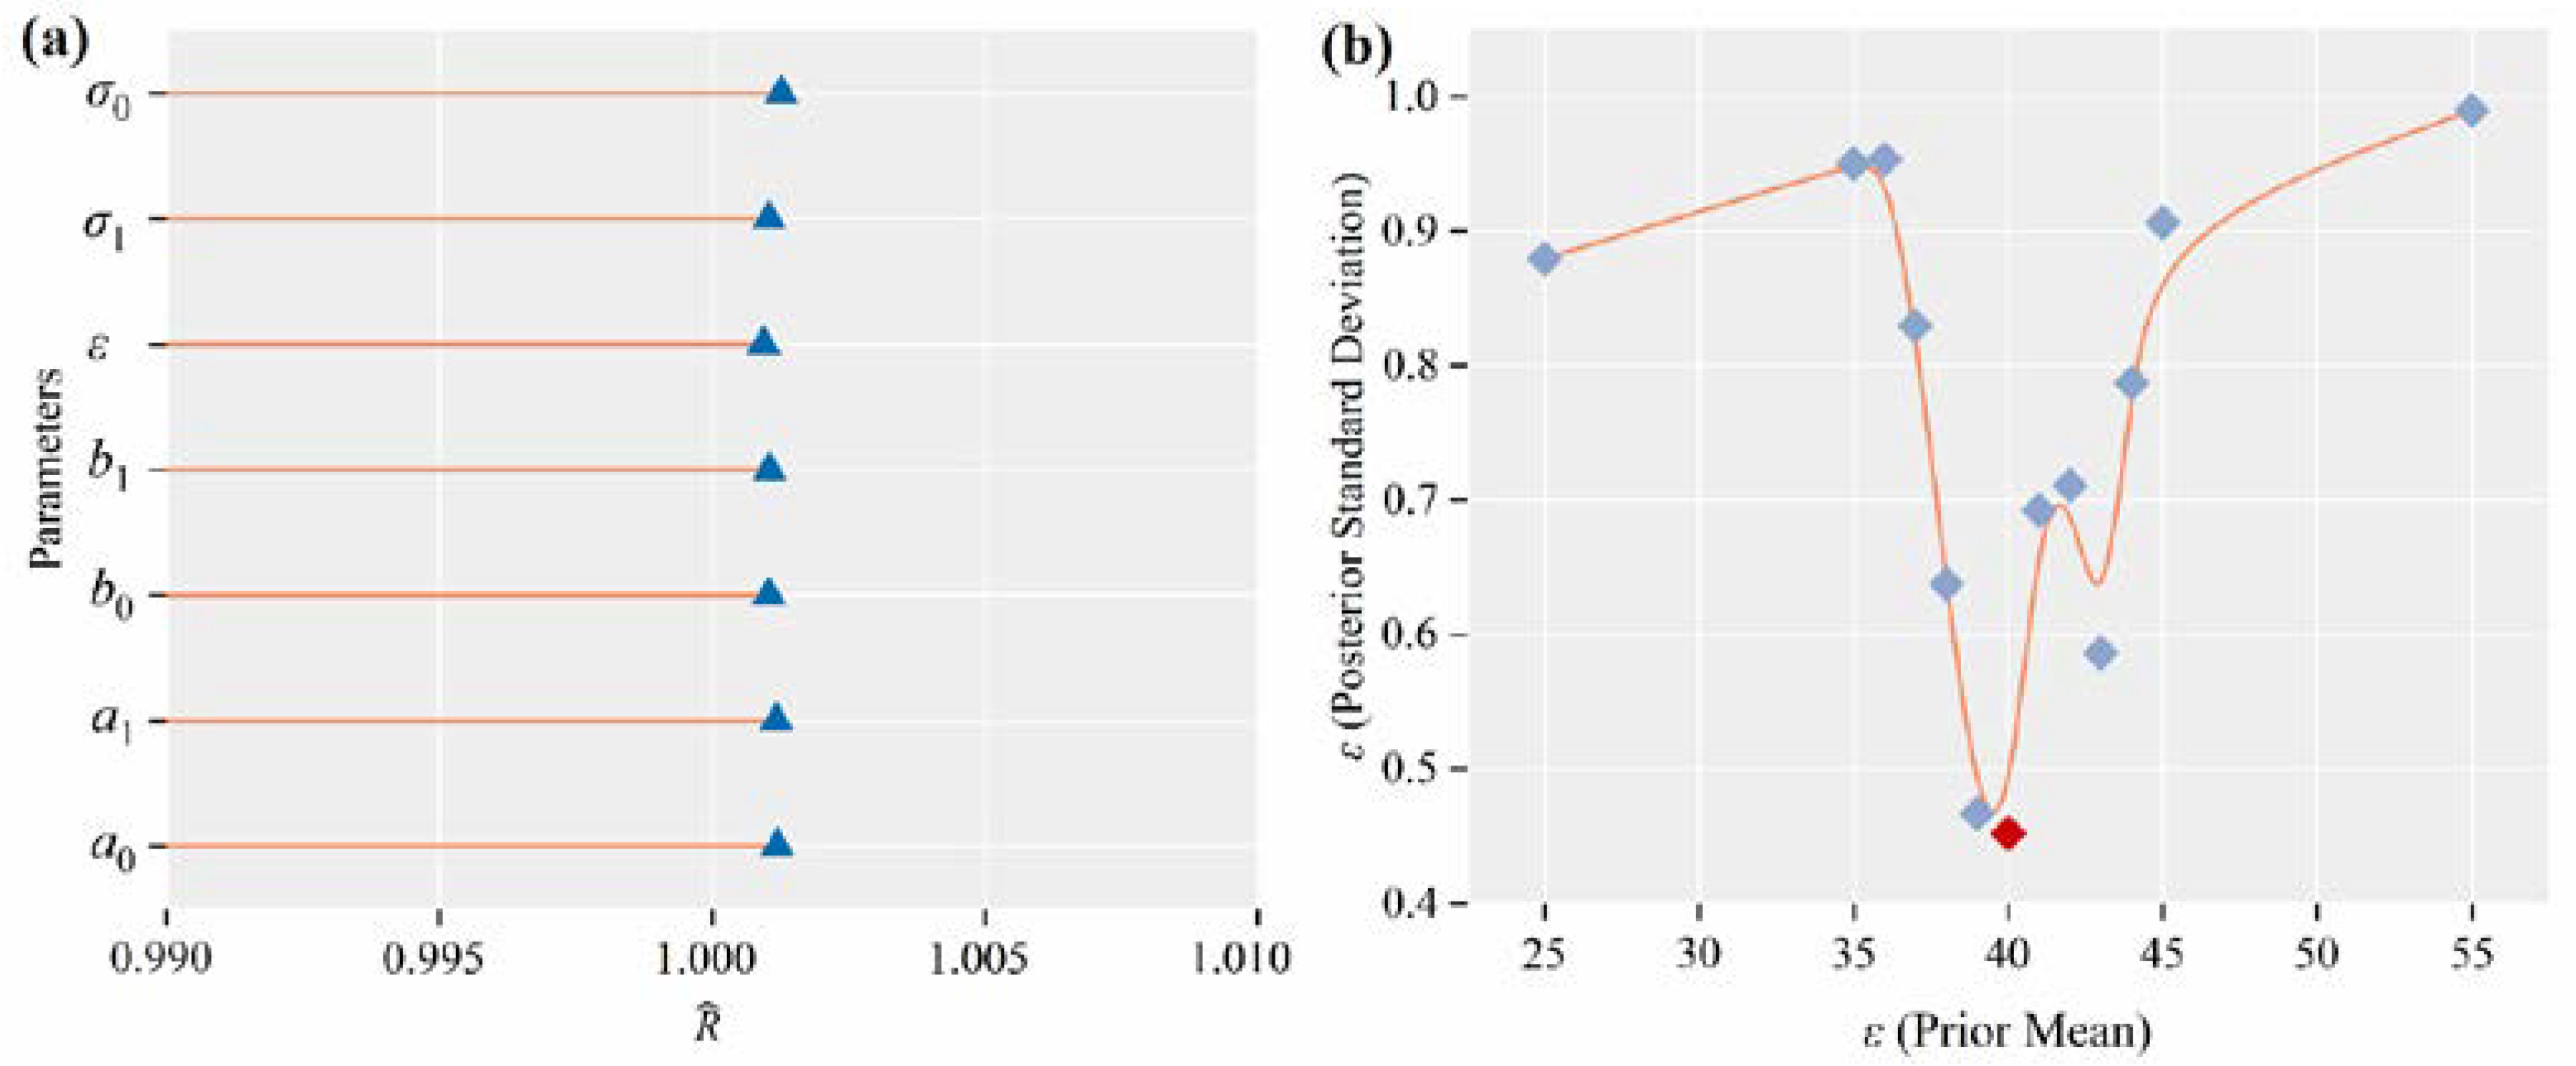
3.1. BLVR Modeling Results
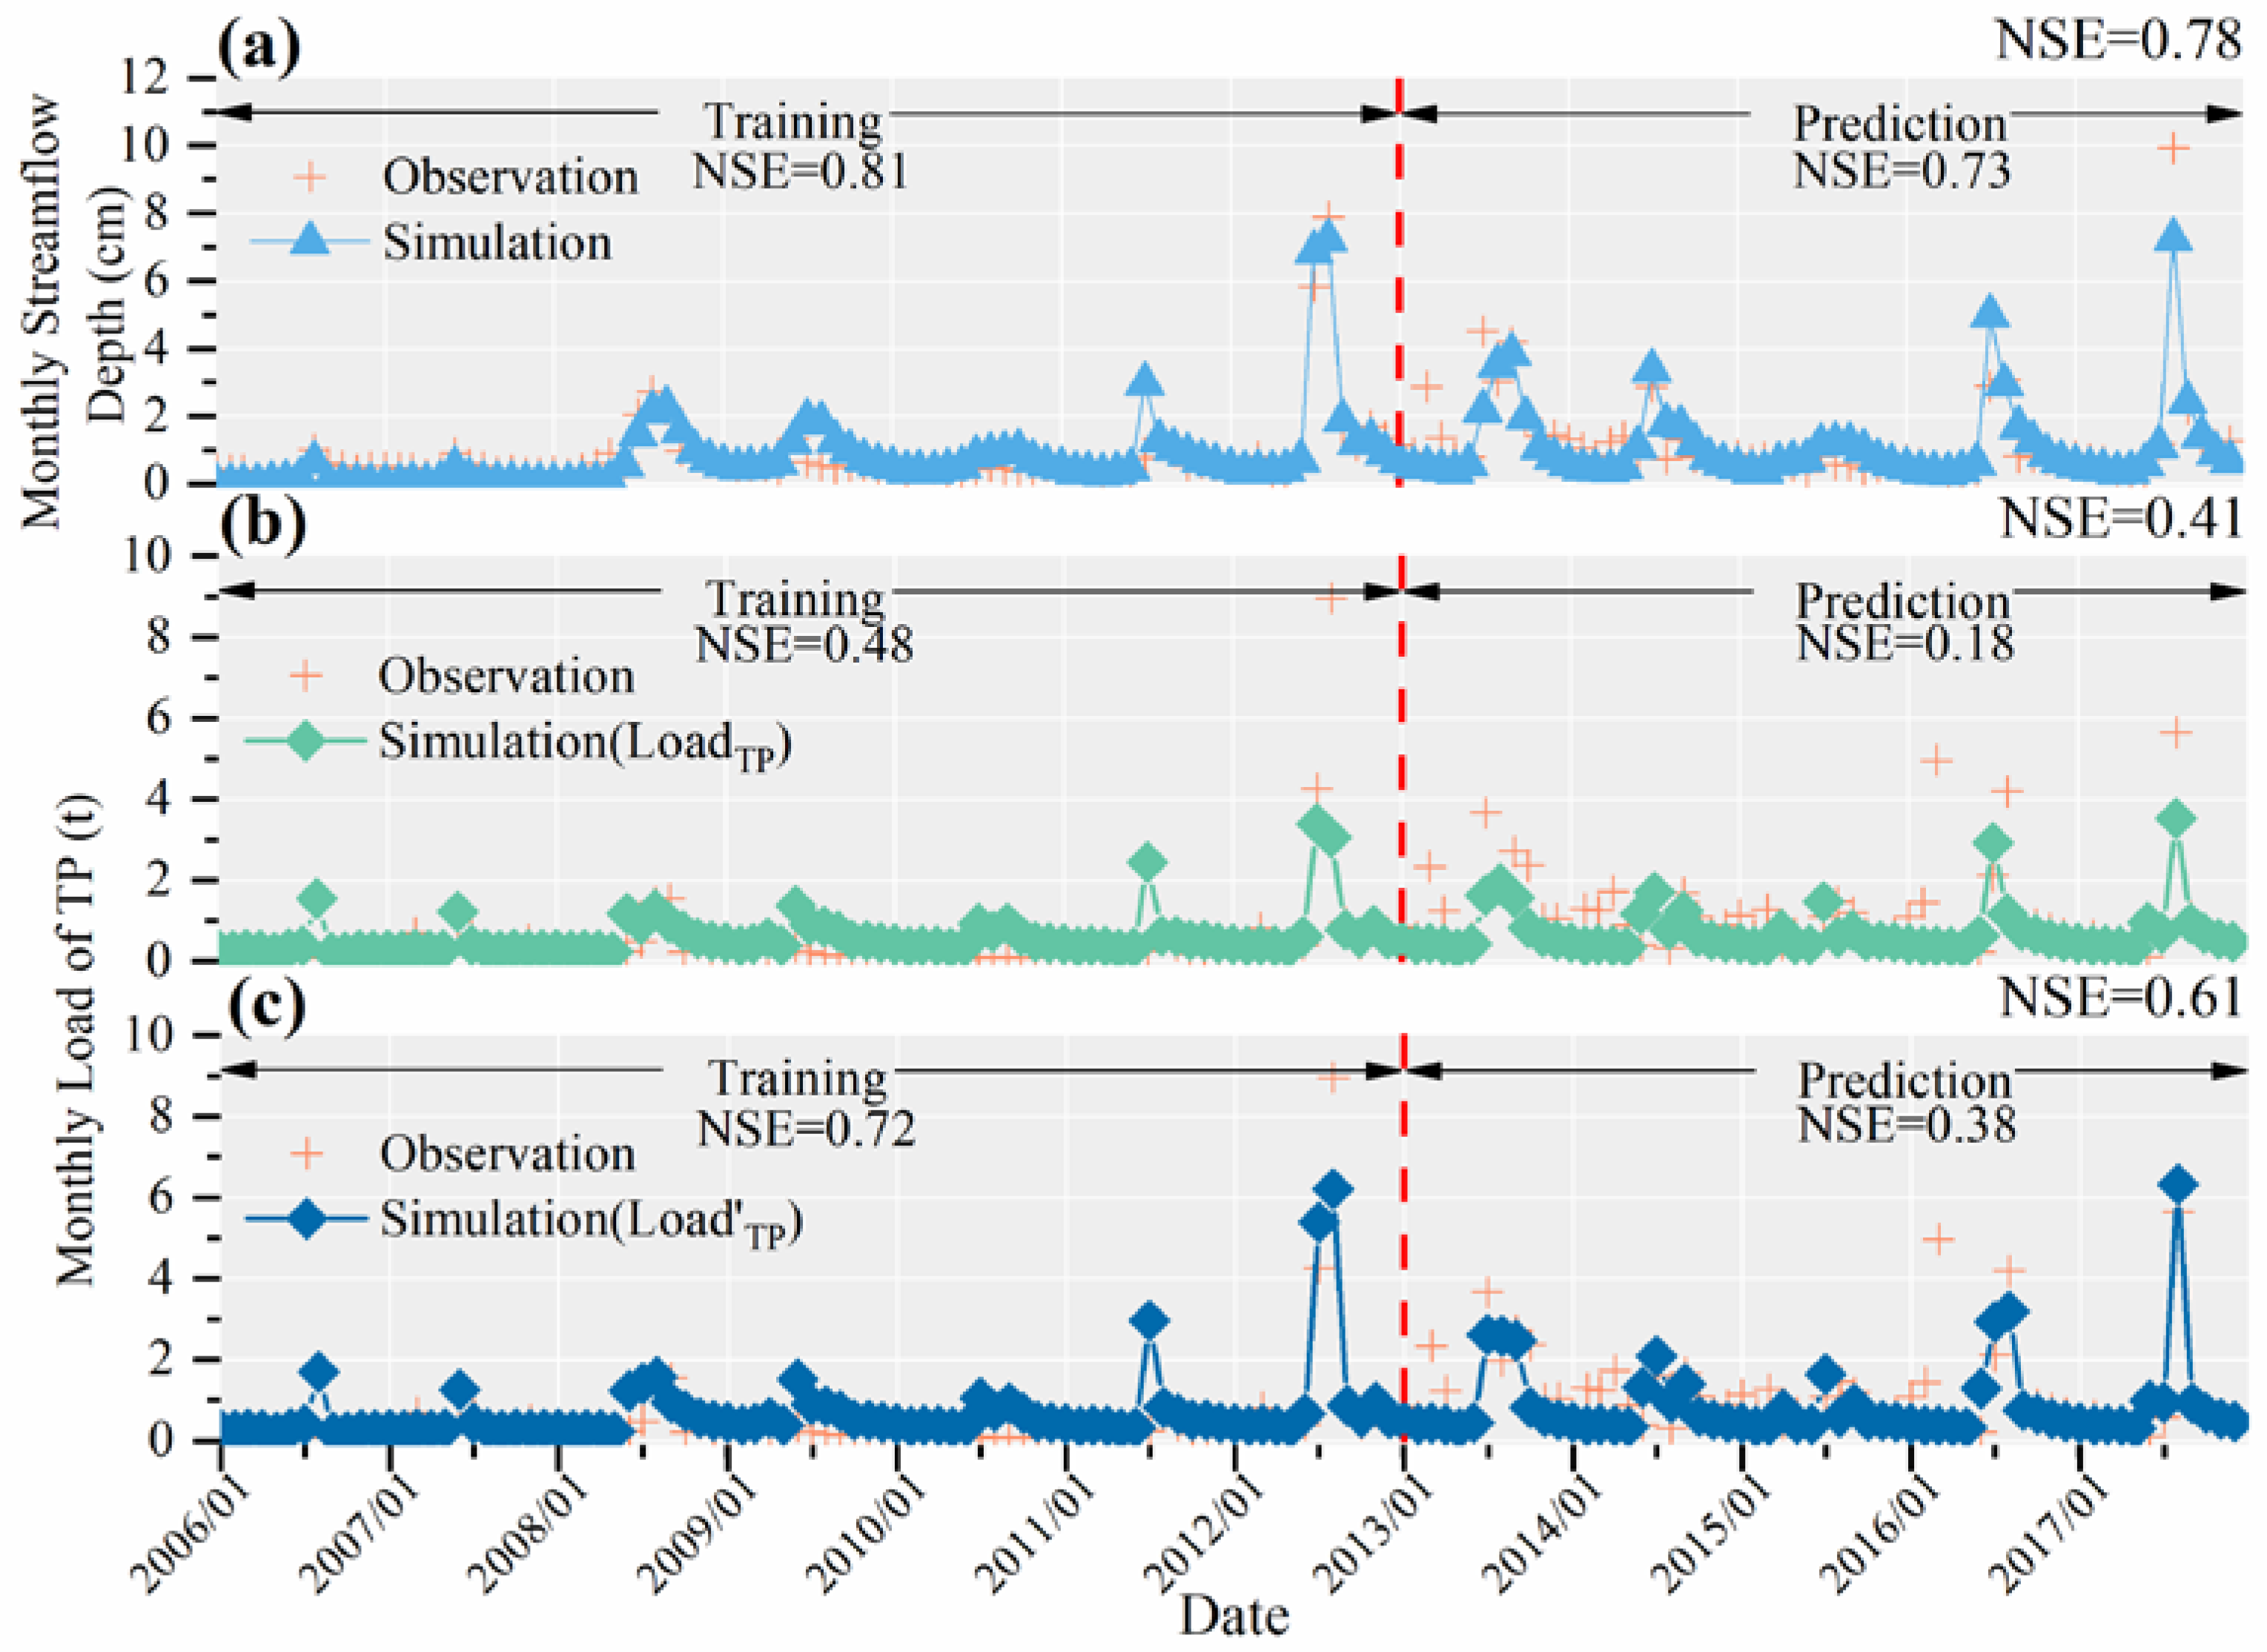
3.2. Hydrological and Nutrient Modeling
4. Discussion
5. Conclusions
- (1)
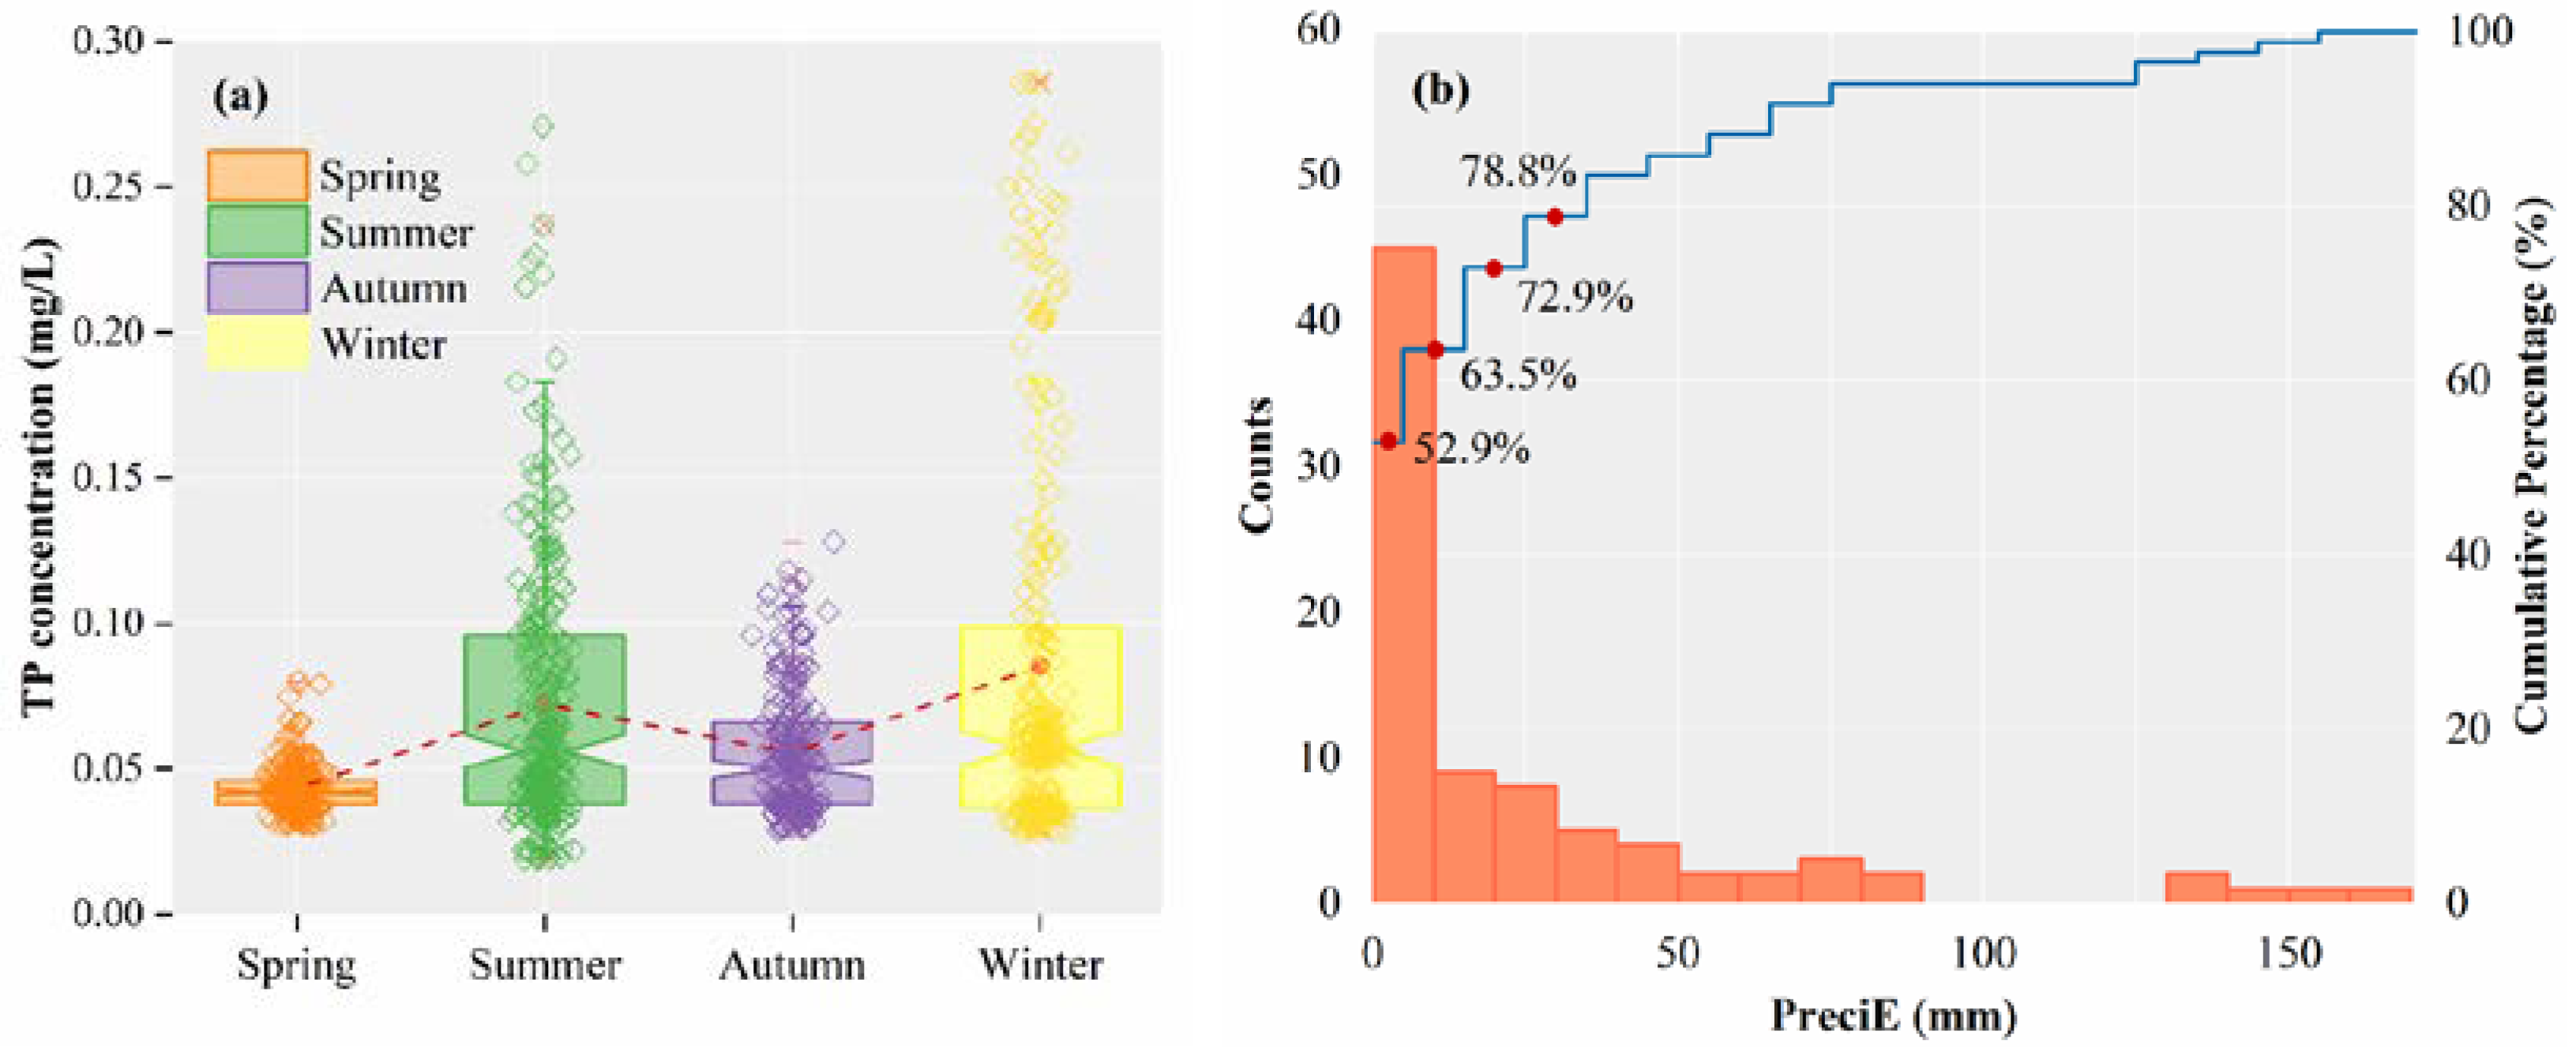
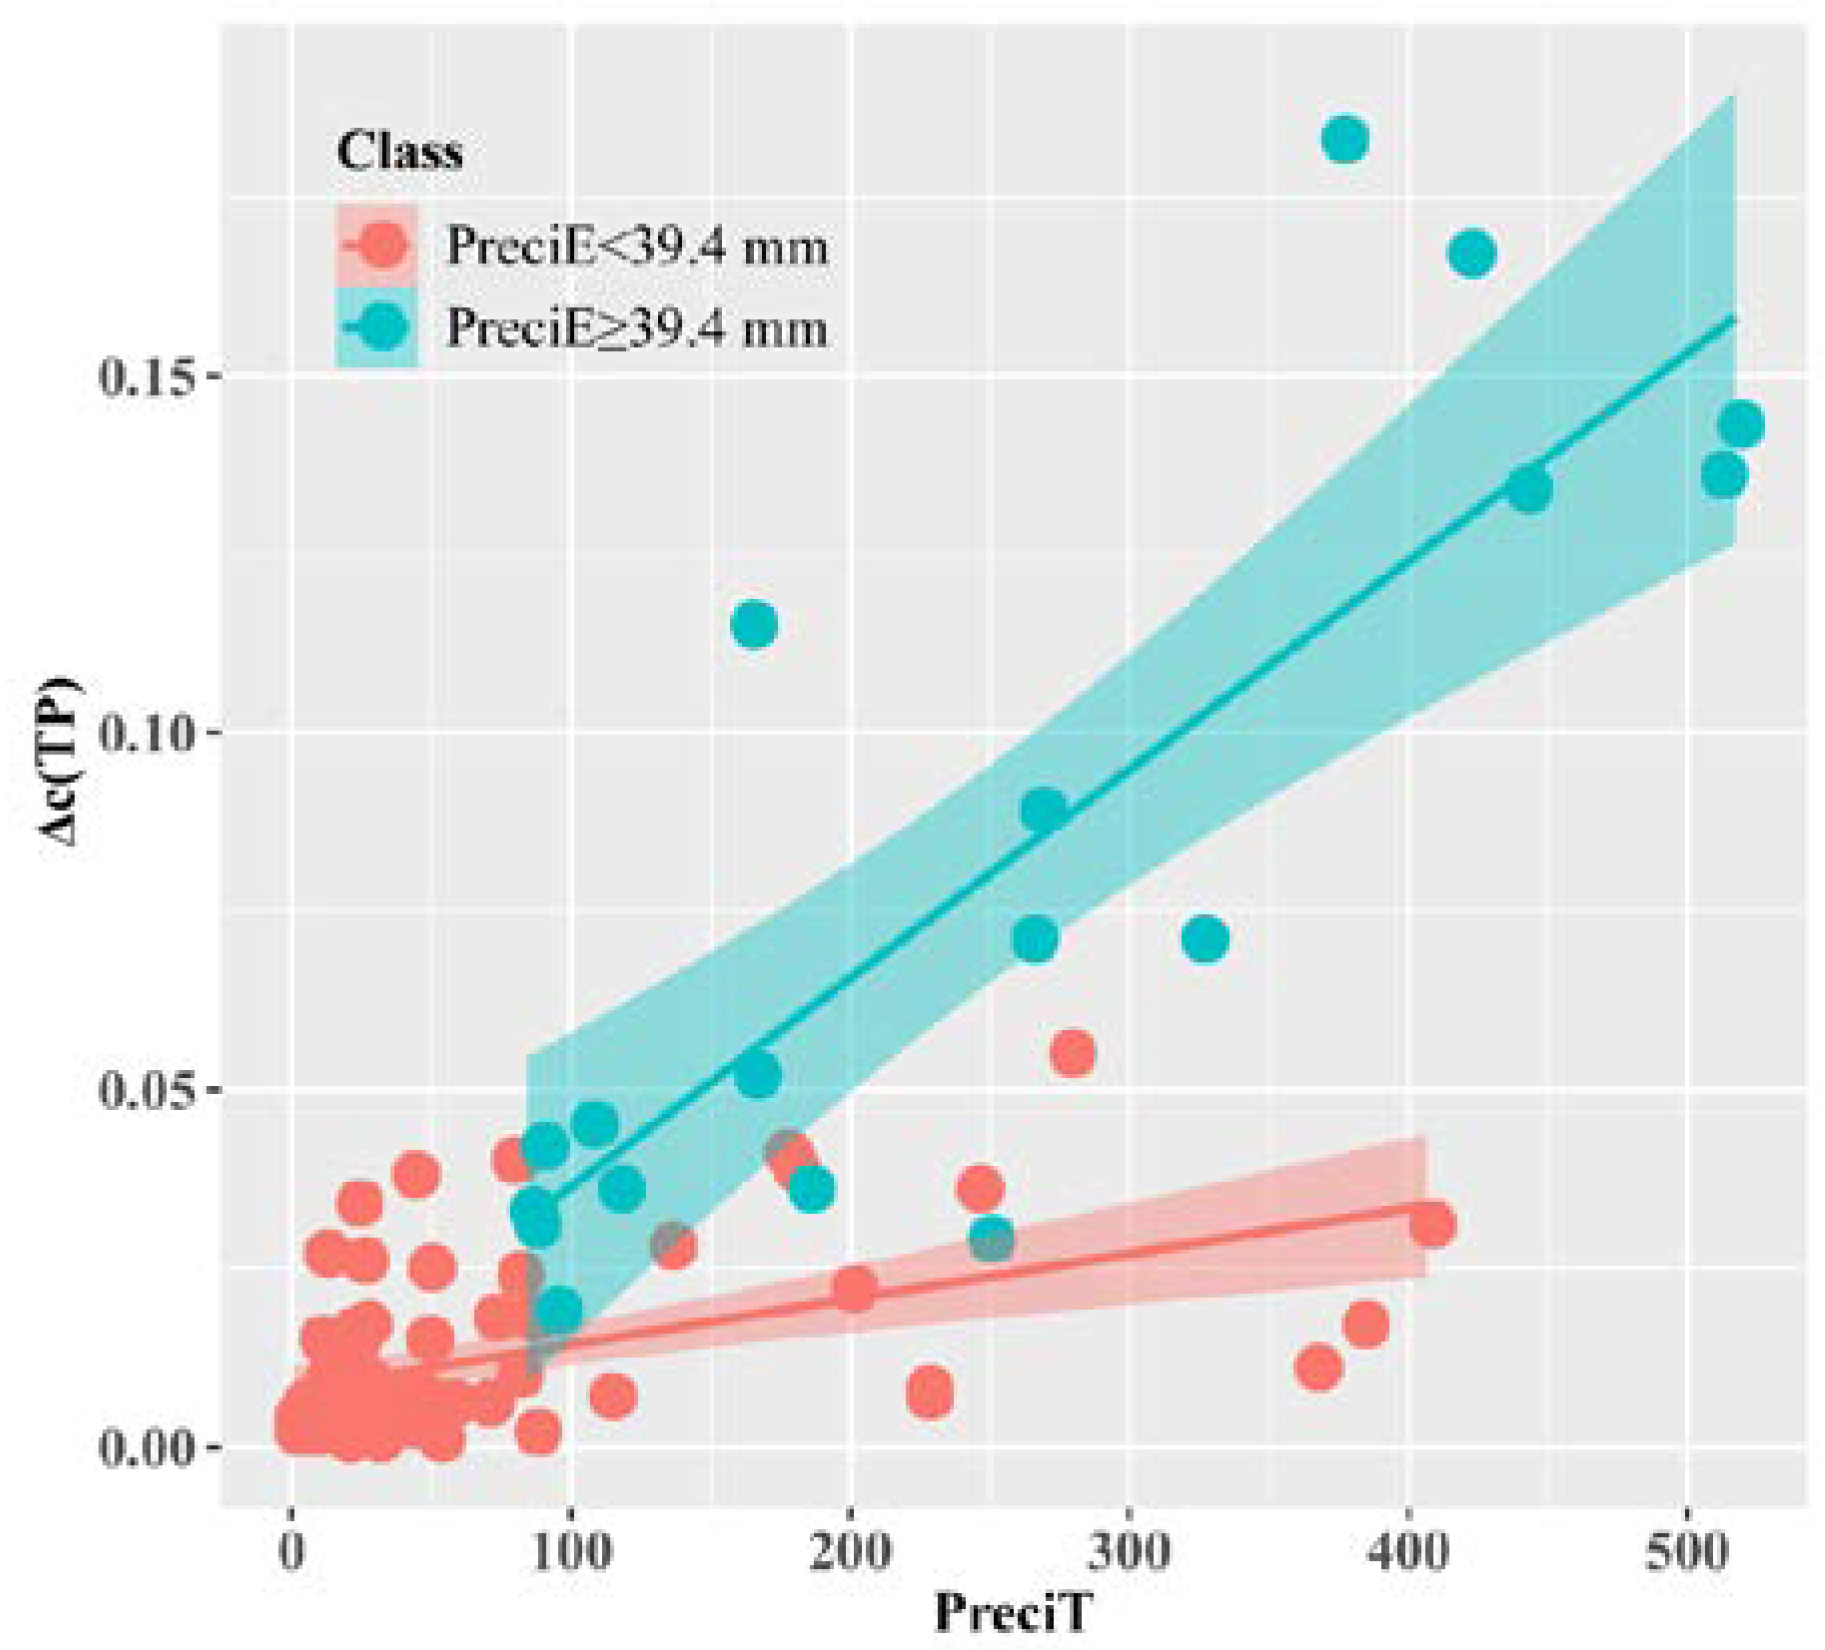
- The effect of precipitation on river TP concentrations is not consistent. The breaking point of PreciE (ε) is 39.4 ± 0.45 mm. This nonlinear relationship is inferred to be caused by the transformation of the primary streamflow production pattern;
- (2)
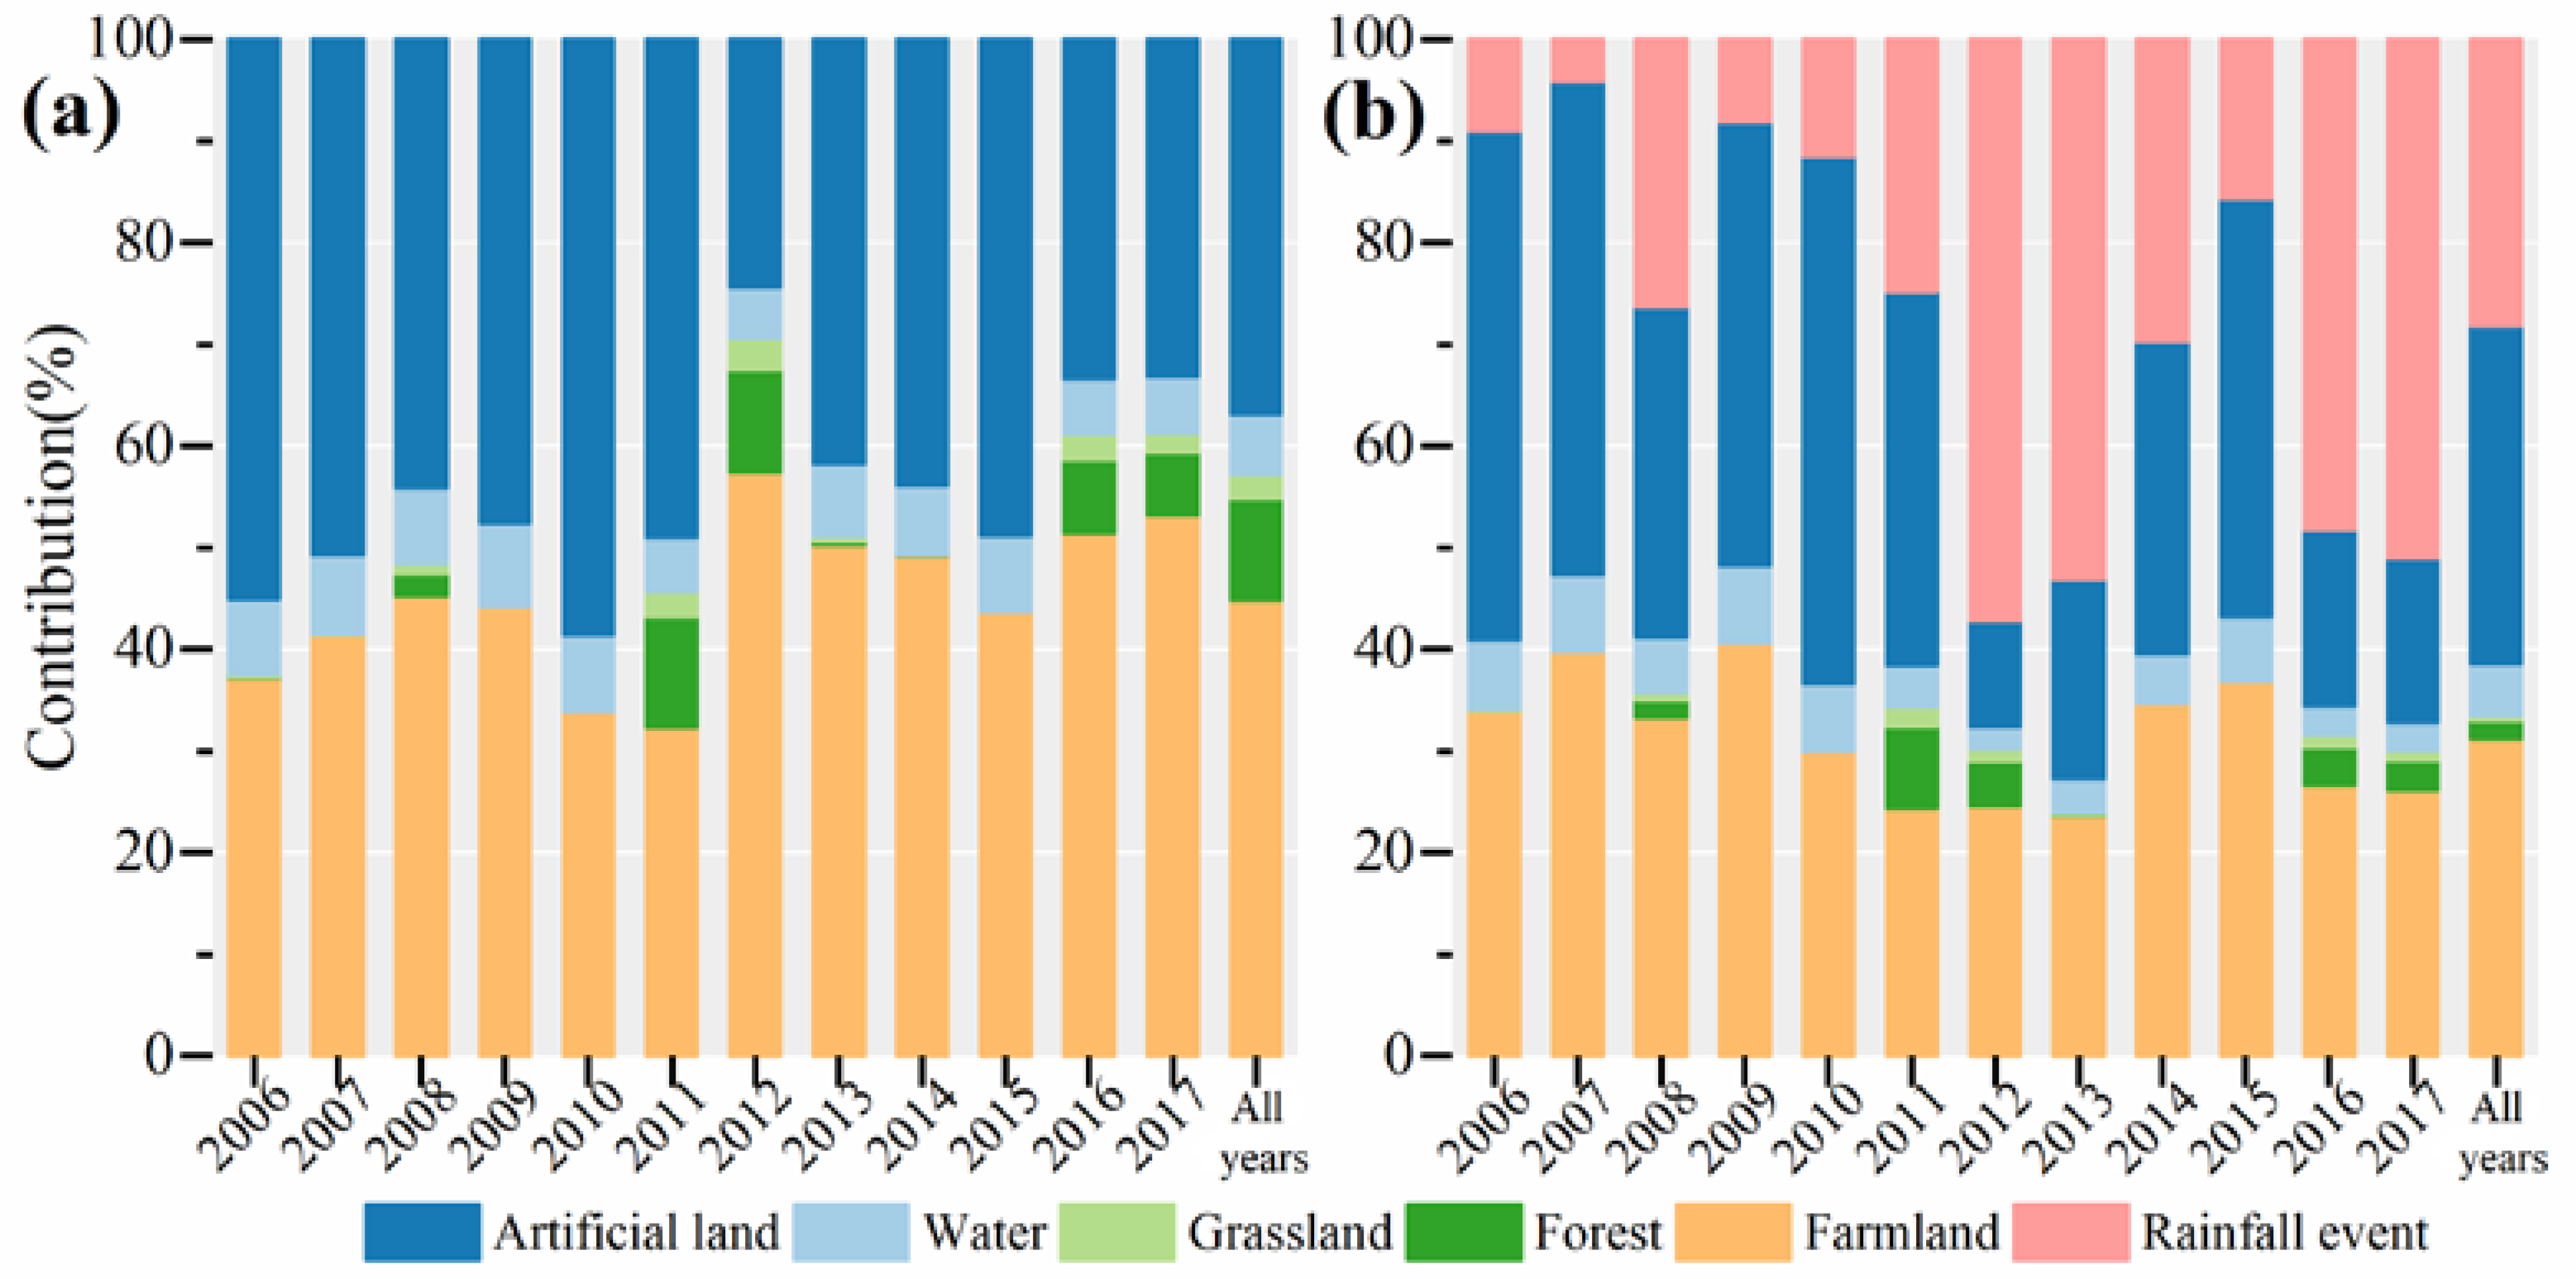
- In the Shahe basin, rainfall events were among the most significant sources of TP load during 2006–2017, accounting for 28.2% of the total. And the non-artificial land is the fundamental source of the excess TP load caused by rainfall events;
- (3)
- Due to the change of main factors, the trend of total phosphorus concentration in different time scales was inconsistent;
- (4)
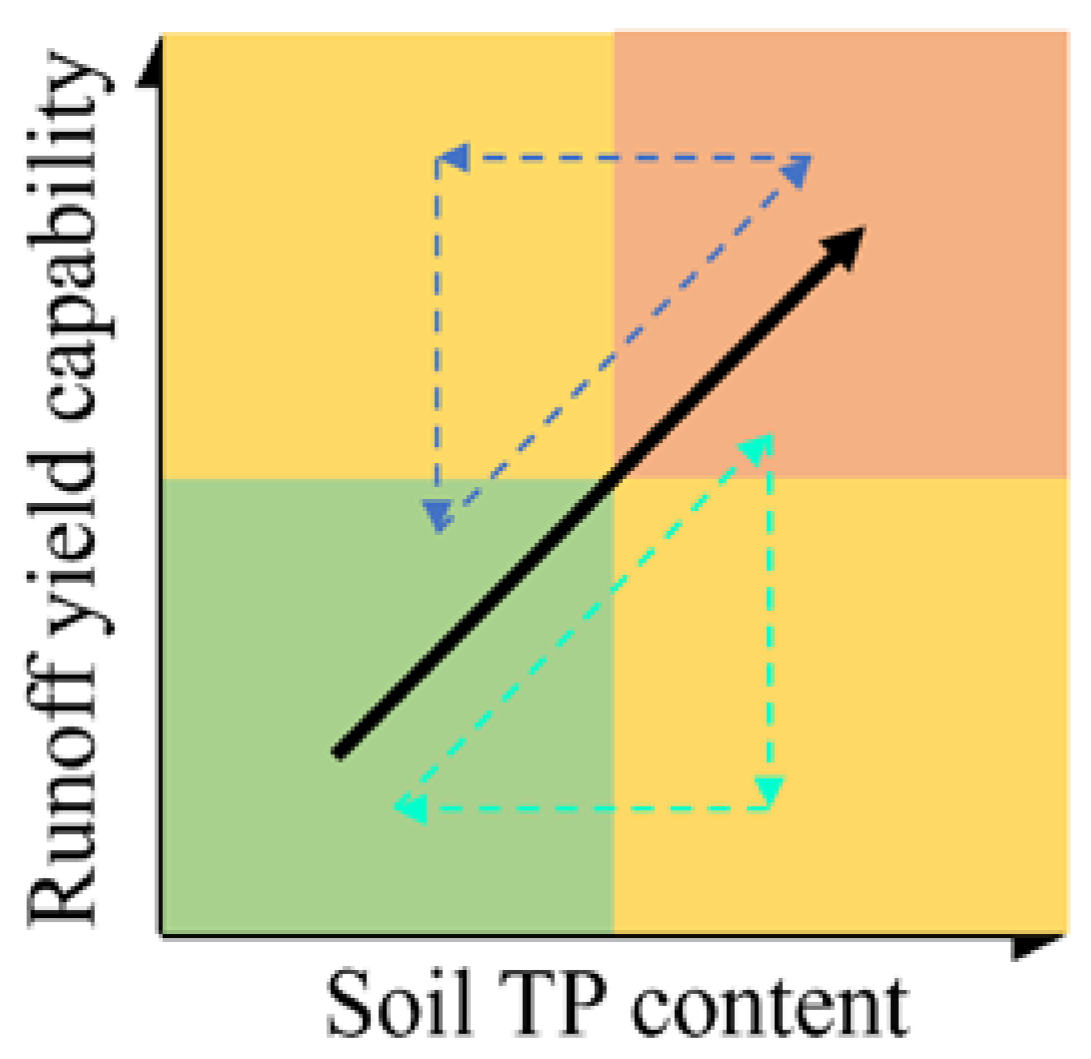
- Environmental managers can use calibrated CN values and soil TP content to classify the non-artificial land in the watershed.
Author Contributions
Funding
Data Availability Statement
Acknowledgments
Conflicts of Interest
References
- Peñuelas, J.; Poulter, B.; Sardans, J.; Ciais, P.; Van Der Velde, M.; Bopp, L.; Boucher, O.; Godderis, Y.; Hinsinger, P.; Llusia, J.; et al. Human-induced nitrogen–phosphorus imbalances alter natural and managed ecosystems across the globe. Nat. Commun. 2013, 4, 2934. [Google Scholar] [CrossRef] [PubMed]
- Hou, E.; Luo, Y.; Kuang, Y.; Chen, C.; Lu, X.; Jiang, L.; Luo, X.; Wen, D. Global meta-analysis shows pervasive phosphorus limitation of aboveground plant production in natural terrestrial ecosystems. Nat. Commun. 2020, 11, 637. [Google Scholar] [CrossRef] [PubMed]
- Li, Y.; Niu, S.; Yu, G. Aggravated phosphorus limitation on biomass production under increasing nitrogen loading: A meta-analysis. Global Chang. Biol. 2016, 22, 934–943. [Google Scholar] [CrossRef] [PubMed]
- Zemunik, G.; Turner, B.; Lambers, H.; Laliberté, E. Diversity of plant nutrient-acquisition strategies increases during long-term ecosystem development. Nat. Plants 2015, 1, 15050. [Google Scholar] [CrossRef]
- Yuan, Z.; Chen, H. Decoupling of nitrogen and phosphorus in terrestrial plants associated with global changes. Nat. Clim. Chang. 2015, 5, 465–469. [Google Scholar] [CrossRef]
- Alexander, R.B.; Smith, R.; Schwarz, G. Effect of stream channel size on the delivery of nitrogen to the Gulf of Mexico. Nature 2000, 403, 758–761. [Google Scholar] [CrossRef]
- Baker, T.J.; Miller, S.N. Using the Soil and Water Assessment Tool (SWAT) to assess land use impact on water resources in an East African watershed. J. Hydrol. 2013, 486, 100–111. [Google Scholar] [CrossRef]
- Hou, X.; Xu, Z.; Tang, C.; Zhang, S. Spatial distributions of nitrogen and phosphorus losses in a basin and responses to best management practices—Jialing River Basin case study. Agric. Water Manag. 2021, 255, 107048. [Google Scholar] [CrossRef]
- Swaney, D.P.; Sherman, D.; Howarth, R.W. Modeling water, sediment and organic carbon discharges in the Hudson-Mohawk basin: Coupling to terrestrial sources. Estuaries 1996, 19, 833–847. [Google Scholar] [CrossRef]
- Zhang, B.; Cui, B.; Zhang, S.; Wu, Q.-Y.; Yao, L. Source apportionment of nitrogen and phosphorus from non-point source pollution in Nansi Lake Basin, China. Environ. Sci. Pollut. Res. 2018, 25, 19101–19113. [Google Scholar] [CrossRef] [PubMed]
- Ma, Z.; Luo, M.; Wang, Q.; Li, C.; Guo, L.; Wu, S.; Kazery, J.; Yan, Y.; Zhai, L.; Liu, H.; et al. Long-Term Agronomic Practices in Reducing Nitrogen and Phosphorus Loss from Intensive Croplands. ACS Earth Space Chem. 2022, 6, 1627–1639. [Google Scholar] [CrossRef]
- Maccoux, M.J.; Dove, A.; Backus, S.M.; Dolan, D.M. Total and soluble reactive phosphorus loadings to Lake Erie: A detailed accounting by year, basin, country, and tributary. J. Great Lakes Res. 2016, 42, 1151–1165. [Google Scholar] [CrossRef]
- Alexander, R.B.; Elliott, A.H.; Shankar, U.; McBride, G.B. Estimating the sources and transport of nutrients in the Waikato River Basin, New Zealand. Water Resour. Res. 2002, 38, 4-1–4-23. [Google Scholar] [CrossRef]
- Yuan, Z.; Wu, H.; He, X.; Liu, X. A bottom-up model for quantifying anthropogenic phosphorus cycles in watersheds. J. Clean Prod. 2014, 84, 502–508. [Google Scholar] [CrossRef]
- Xu, Z.; Ji, Z.; Liang, B.; Song, D.; Lin, Y.; Lin, J. Estimate of nutrient sources and transport into Bohai Bay in China from a lower plain urban watershed using a SPARROW model. Environ. Sci. Pollut. Res. 2021, 28, 25733–25747. [Google Scholar] [CrossRef]
- Edwards, A.C.; Withers, P.J.A. Transport and delivery of suspended solids, nitrogen and phosphorus from various sources to freshwaters in the UK. J. Hydrol. 2008, 350, 144–153. [Google Scholar] [CrossRef]
- Bai, H.; Chen, Y.; Wang, Y.; Song, Z.; Tong, H.; Wei, Y.; Yu, Q.; Xu, Z.; Yang, S. Contribution rates analysis for sources apportionment to special river sections in Yangtze River Basin. J. Hydrol. 2021, 600, 126519. [Google Scholar] [CrossRef]
- Williams, M.R.; King, K.W. Changing rainfall patterns over the Western Lake Erie Basin (1975–2017): Effects on tributary discharge and phosphorus load. Water Resour. Res. 2020, 56, e2019WR025985. [Google Scholar] [CrossRef]
- Wang, L.; Liang, T.; Zhang, Q. Laboratory experiments of phosphorus loss with surface runoff during simulated rainfall. Environ. Earth Sci. 2013, 70, 2839–2846. [Google Scholar] [CrossRef]
- Ding, H.; Li, Z.; Ren, Q.; Chen, H.; Song, M.; Wang, Y. Single-variable method for predicting trends in chlorophyll a concentration based on the similarity of time series. Ecol. Indic. 2022, 140, 109027. [Google Scholar] [CrossRef]
- Ge, Z. Mixture Bayesian Regularization of PCR Model and Soft Sensing Application. IEEE Trans. Ind. Electron. 2015, 62, 4336–4343. [Google Scholar] [CrossRef]
- Song, X.Y.; Pan, D.; Liu, P.F.; Cai, J.H. Bayesian analysis of transformation latent variable models with multivariate censored data. Stat. Methods Med. Res. 2016, 25, 2337–2358. [Google Scholar] [CrossRef]
- Feng, X.N.; Wu, H.T.; Song, X.Y. Bayesian adaptive lasso for ordinal regression with latent variables. Sociol. Methods Res. 2017, 46, 926–953. [Google Scholar] [CrossRef]
- Vitense, K.; Hanson, M.A.; Herwig, B.R.; Zimmer, K.D.; Fieberg, J. Uncovering state-dependent relationships in shallow lakes using Bayesian latent variable regression. Ecol. Appl. 2018, 28, 309–322. [Google Scholar] [CrossRef]
- Russell, M.J.; Weller, D.E.; Jordan, T.E.; Sigwart, K.J.; Sullivan, K.J. Net anthropogenic phosphorus inputs: Spatial and temporal variability in the Chesapeake Bay region. Biogeochemistry 2008, 88, 285–304. [Google Scholar]
- Han, H.; Bosch, N.; Allan, J.D. Spatial and temporal variation in phosphorus budgets for 24 watersheds in the Lake Erie and Lake Michigan basins. Biogeochemistry 2011, 102, 45–58. [Google Scholar] [CrossRef]
- Hong, B.; Swaney, D. Regional Nutrient Management (ReNuMa) Model, Version 1.0. User’s Manual, February. 2007. Available online: http://www.eeb.cornell.edu/biogeo/nanc/usda/renuma.htm (accessed on 14 September 2022).
- Amy, G.; Pitt, R.; Singh, R.; Bradford, W.L.; LaGraffi, M.B. Water Quality Management Planning for Urban Runoff; EPAA4OI9-75-004; U.S. Environmental Protection Agency: Washington, DC, USA, 1974. [Google Scholar]
- Zhang, C.; Yan, Q.; Kuczyńska-Kippen, N.; Gao, X. An Ensemble Kalman Filter approach to assess the effects of hydrological variability, water diversion, and meteorological forcing on the total phosphorus concentration in a shallow reservoir. Sci. Total Environ. 2020, 724, 138215. [Google Scholar] [CrossRef]
- Wu, L.; Li, P. Studies on rainfall process, flow-making and nitrogen and phosphorus losses. Acta Sci. Circumstantiae 1996, 1, 111–116. [Google Scholar]
- Yin, J.; Chen, H.; Wang, Y.; Guo, L.; Li, G.; Wang, P. Ammonium Nitrogen Streamflow Transport Modelling and Spatial Analysis in Two Chinese Basins. Water 2022, 14, 209. [Google Scholar] [CrossRef]
- Carpenter, S.R.; Booth, E.G.; Kucharik, C.J. Extreme precipitation and phosphorus loads from two agricultural watersheds. Limnol. Oceanogr. 2018, 63, 1221–1233. [Google Scholar] [CrossRef]
- Fukushima, T.; Kitamura, T.; Matsushita, B. Lake water quality observed after extreme rainfall events: Implications for water quality affected by stormy runoff. SN Appl. Sci. 2021, 3, 841. [Google Scholar] [CrossRef]
- Wang, M.; Xu, X.; Wu, Z.; Zhang, X.; Sun, P.; Wen, Y.; Wang, Z.; Lu, X.; Zhang, W.; Wang, X.; et al. Seasonal Pattern of Nutrient Limitation in a Eutrophic Lake and Quantitative Analysis of the Impacts from Internal Nutrient Cycling. Environ. Sci. Technol. 2019, 53, 13675–13686. [Google Scholar] [CrossRef]
- Zeng, H.; Wang, J.; Li, Y. Water quality change and influencing factors in Lake Hongfeng (Guizhou Province), 2009–2018. J. Lake Sci. 2020, 32, 676–687. [Google Scholar]
- Fu, S.; Ni, J.; He, B.; Li, T.-Y.; Tang, Y.; Qian, T.; Xiang, K.-C. Spatial-temporal Distribution of Nutrients in Hanfeng Lake After Official Operation. Environ. Sci. 2020, 41, 2116–2126. [Google Scholar]
- Wade, A.J.; Palmer-Felgate, E.J.; Halliday, S.J.; Skeffington, R.A.; Loewenthal, M.; Jarvie, H.P.; Bowes, M.J.; Greenway, G.M.; Haswell, S.J.; Bell, I.M.; et al. Hydrochemical processes in lowland rivers: Insights from in situ, high-resolution monitoring. Hydrol. Earth Syst. Sci. 2012, 16, 4323–4342. [Google Scholar] [CrossRef]
- Strohmenger, L.; Fovet, O.; Akkal-Corfini, N.; Dupas, R.; Durand, P.; Faucheux, M.; Gruau, G.; Hamon, Y.; Jaffrezic, A.; Minaudo, C.; et al. Multitemporal Relationships Between the Hydroclimate and Exports of Carbon, Nitrogen, and Phosphorus in a Small Agricultural Watershed. Water Resour. Res. 2020, 56, e2019WR026323. [Google Scholar] [CrossRef]
- Van Meter, K.J.; Van Cappellen, P.; Basu, N.B. Legacy nitrogen may prevent achievement of water quality goals in the Gulf of Mexico. Science 2018, 360, 427–430. [Google Scholar] [CrossRef]
- Zhang, S.; Chen, L.; Fu, B. Pollution-controlling Regionalization of Agricultural non-point Phosphorous in Yuqiao Reservoir Watershed. Sci. Geogr. Sin. 2004, 2, 232–237. [Google Scholar]


| Dataset Name | Source | Format | Resolution |
|---|---|---|---|
| dem | Geospatial Data Cloud https://www.gscloud.cn/ (accessed on 25 September 2020) | Raster | 30 m × 30 m |
| Landuse | Tianjin Eco-Environmental Monitoring Center | Raster | 280 m × 280 m |
| Population | National Earth System Science Data Center http://www.geodata.cn/ (accessed on 7 October 2018) | Raster | 1 km × 1 km |
| Precipitation | National Meteorological Center http://data.cma.cn/ (accessed on 5 May 2021) | csv | Daily |
| Streamflow | Tianjin Eco-Environmental Monitoring Center | csv | Monthly |
| TP concentration | Tianjin Eco-Environmental Monitoring Center | csv | Daily and Monthly |
| Season | All Years (2019–2021) | ||||
|---|---|---|---|---|---|
| Spring | Summer | Autumn | Winter | ||
| Mean | 0.043 | 0.072 | 0.056 | 0.085 | 0.064 |
| SD | 0.008 | 0.046 | 0.022 | 0.069 | 0.046 |
| CV | 19.2% | 63.8% | 39.6% | 80.3% | 71.4% |
| Mean | SD | ||
|---|---|---|---|
| 0.0073379 | 0.0155332 | 1.0012 | |
| 0.0079701 | 0.0017017 | 1.0012 | |
| 0.0000637 | 0.0000145 | 1.0010 | |
| 0.0002917 | 0.0000538 | 1.0011 | |
| 39.4078537 | 0.4523792 | 1.0009 | |
| 0.0111851 | 0.0010107 | 1.0010 | |
| 0.0330636 | 0.0065375 | 1.0013 |
| Date | Streamflow Depth | TP Load | ||||
|---|---|---|---|---|---|---|
| NSE | R2 | NSE | R2 | NSE | R2 | |
| Training (2006–2012) | 0.81 | 0.84 | 0.48 | 0.56 | 0.72 | 0.76 |
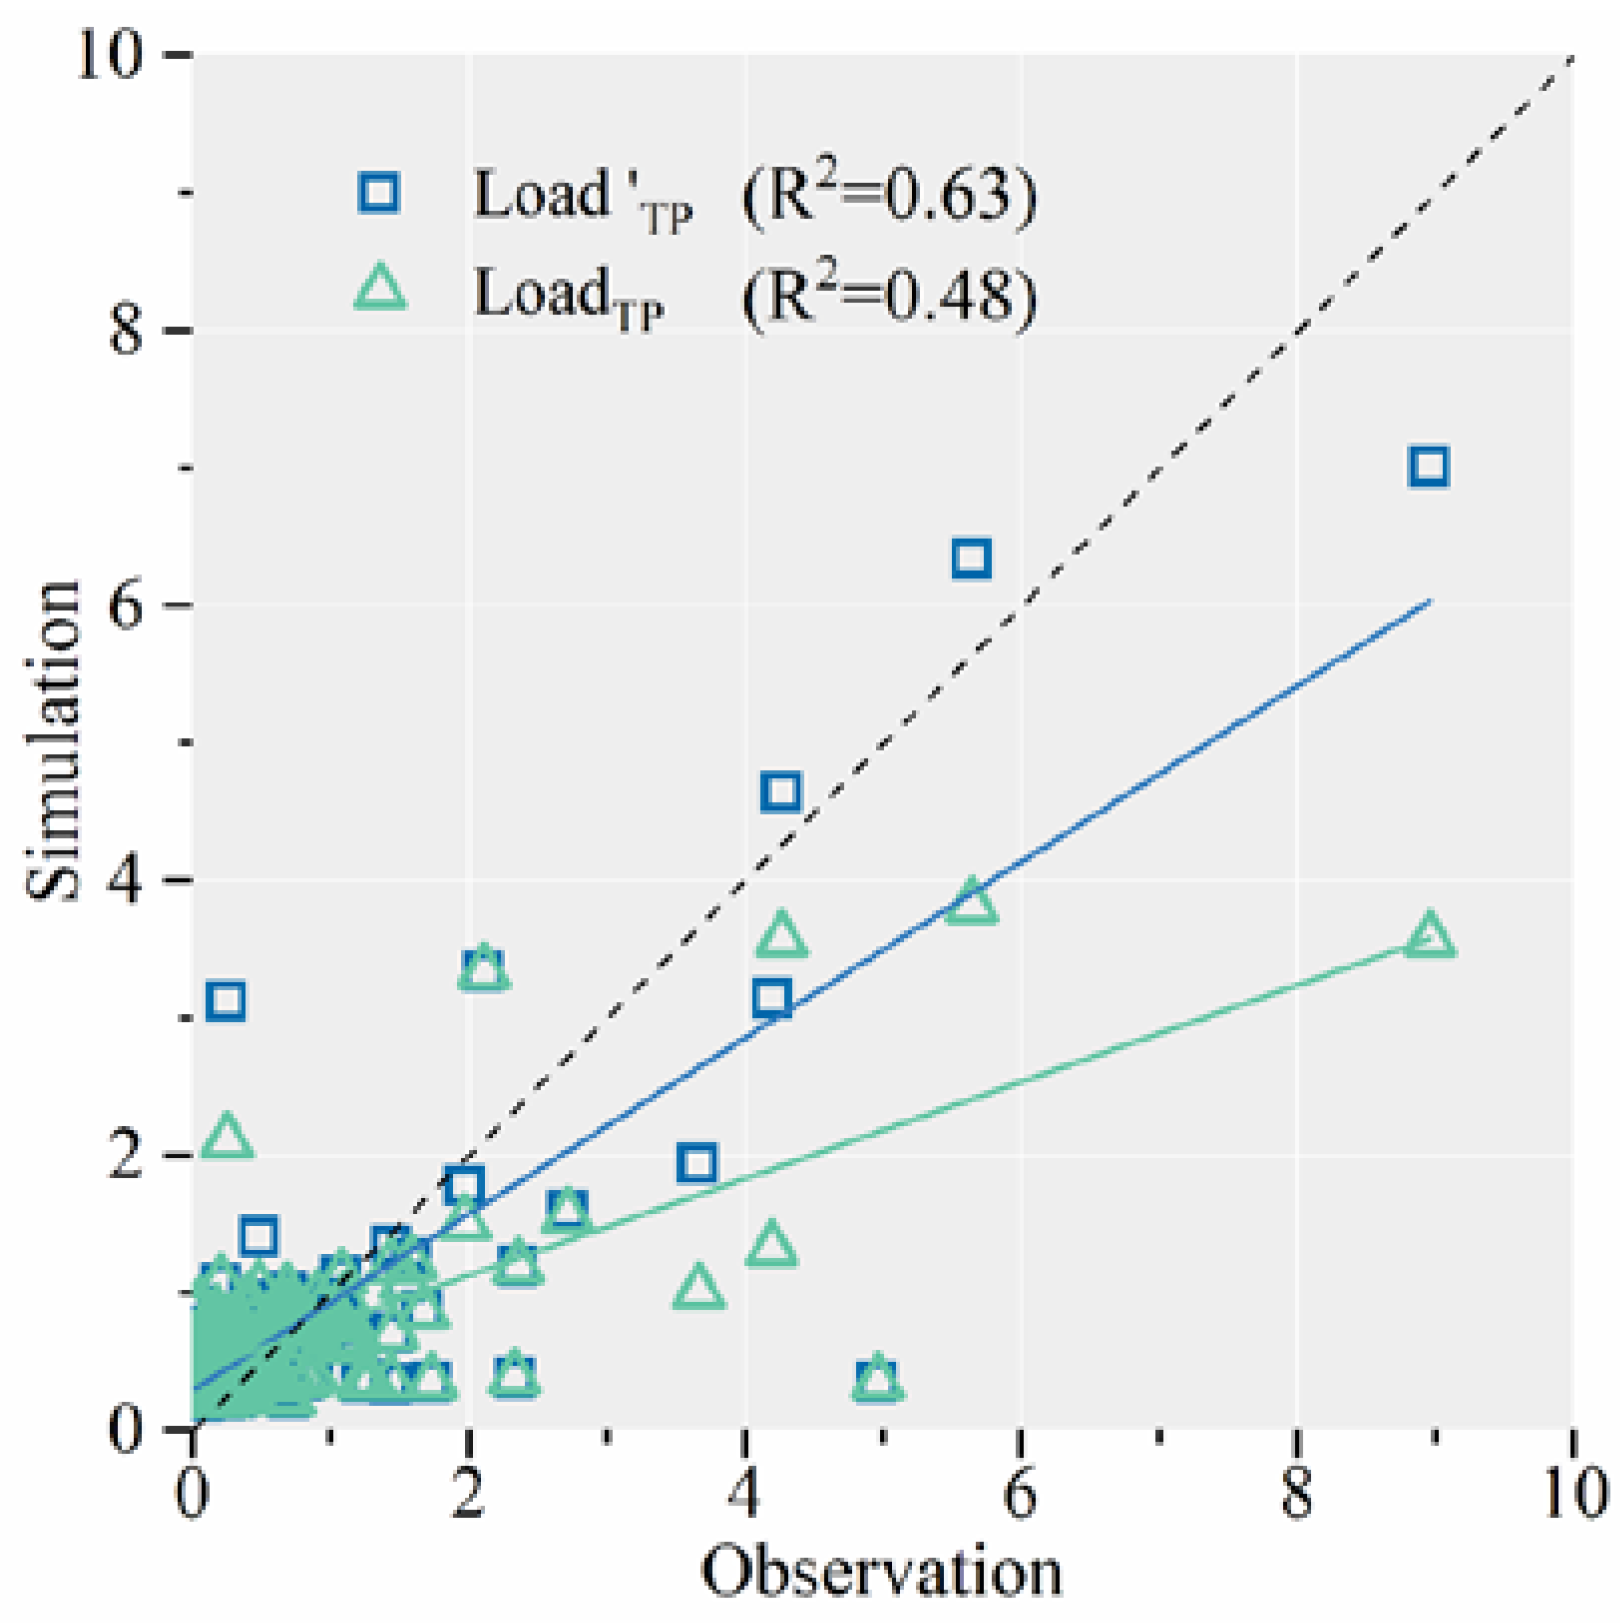
| Prediction (2013–2017) | 0.73 | 0.74 | 0.18 | 0.35 | 0.38 | 0.49 |
| All years (2006–2017) | 0.78 | 0.78 | 0.41 | 0.48 | 0.61 | 0.63 |
Disclaimer/Publisher’s Note: The statements, opinions and data contained in all publications are solely those of the individual author(s) and contributor(s) and not of MDPI and/or the editor(s). MDPI and/or the editor(s) disclaim responsibility for any injury to people or property resulting from any ideas, methods, instructions or products referred to in the content. |
© 2023 by the authors. Licensee MDPI, Basel, Switzerland. This article is an open access article distributed under the terms and conditions of the Creative Commons Attribution (CC BY) license (https://creativecommons.org/licenses/by/4.0/).
Share and Cite
Ding, H.; Ren, Q.; Wang, C.; Chen, H.; Wang, Y.; Li, Z. Rain Pattern Deeply Reshaped Total Phosphorus Load Pattern in Watershed: A Case Study from Northern China. Water 2023, 15, 2910. https://doi.org/10.3390/w15162910
Ding H, Ren Q, Wang C, Chen H, Wang Y, Li Z. Rain Pattern Deeply Reshaped Total Phosphorus Load Pattern in Watershed: A Case Study from Northern China. Water. 2023; 15(16):2910. https://doi.org/10.3390/w15162910
Chicago/Turabian StyleDing, Han, Qiuru Ren, Chengcheng Wang, Haitao Chen, Yuqiu Wang, and Zeli Li. 2023. "Rain Pattern Deeply Reshaped Total Phosphorus Load Pattern in Watershed: A Case Study from Northern China" Water 15, no. 16: 2910. https://doi.org/10.3390/w15162910
APA StyleDing, H., Ren, Q., Wang, C., Chen, H., Wang, Y., & Li, Z. (2023). Rain Pattern Deeply Reshaped Total Phosphorus Load Pattern in Watershed: A Case Study from Northern China. Water, 15(16), 2910. https://doi.org/10.3390/w15162910