Article

Multivariate Statistical Analysis and Geospatial Mapping for Assessing Groundwater Quality in West El Minia District, Egypt

1
Geology Department, Faculty of Science, Minia University, Minia 61519, Egypt
2
Egyptian Petroleum Sector, Petrotrade Co., 1 Anwar Al Moftty St.-Abbas El Akkad St.-Nasr City, Cairo 39828, Egypt
3
Laboratory of Geoenvironmental Science and Environmental Quality Assurance, Department of Civil Engineering, School of Engineering, University of West Attica, 250 Thivon& P. Ralli Str., GR 12241 Athens, Greece
4
Department of Civil Engineering, University of Bristol, Bristol BS8 1TR, UK
5
Geology and Geophysics Department, College of Science, King Saud University, P.O. Box 2455, Riyadh 11451, Saudi Arabia
*
Author to whom correspondence should be addressed.
Water 2023, 15(16), 2909; https://doi.org/10.3390/w15162909
Submission received: 12 July 2023 / Revised: 9 August 2023 / Accepted: 10 August 2023 / Published: 12 August 2023

Abstract

:
The primary goal of this study is to analyze the hydrogeochemical properties and assess the groundwater quality for drinking, domestic, and irrigation purposes in West El Minia, Egypt. Major components were determined in 49 groundwater samples to evaluate water quality in the study area. Principal component analysis (PCA), hierarchical cluster analysis (HCA), geostatistics, and spatial mapping were used to identify the chemical components and processes that influence groundwater quality and highlight areas of health risks. According to the TDS values, about 22% of the groundwater samples are suitable for drinking. Due to the elevated values of hardness in the examined water, none of the water samples are suitable for use in a household. The majority of groundwater samples are acceptable for irrigation based on the sodium adsorption ratio (SAR), residual sodium carbonate (RSC), Kelley ratio (KR), magnesium hazard (MH), and permeability index, and some can be adequately treated. The study indicated that different groundwater characteristics (such as TDS, Na+, K+, HCO3, Cl, and SO42−) do not comply with WHO requirements in some regions, which may pose a threat to human health.

1. Introduction

The deterioration of water quality is a sensitive issue in many areas worldwide because it affects human health, ecosystems, plant growth, water, and food security [1,2,3,4,5]. Groundwater is an essential natural resource for water supply in dry and semi-arid areas, where it is used mainly for drinking, agriculture, and industry. The amount and quality of groundwater are influenced worldwide by over-pumping and increasing land-use activities [6,7]. As a result of urbanization, industrialization, and agricultural operations, groundwater quality has become one of the world’s most severe challenges. Groundwater quality significantly impacts the sustainable management of water resources and their suitability for drinking, agricultural, and industrial purposes [8,9]. Poor water quality can cause various health problems in humans while using poor-quality water for irrigation reduces crop output. The major and trace element contents of water used for drinking or irrigation must be closely monitored and evaluated [8,9,10]. Interactions between water, rock, sediment, and soil and the paragenesis of the aquifer parent materials through which water flows play a significant influence in groundwater chemistry and quality variation [3,8,9]. Additionally, anthropogenic activities frequently affect groundwater quality [1,3,9,11]. Water resources are under significant threat due to rapid and unplanned population increase, mismanagement, and excessive irrigation and industrial use in Egypt. Major constituents of groundwater that exceed the allowable limit directly impact human health and the environment.
One of the issues that policymakers face worldwide is the long-term usage of groundwater for drinking purposes [12]. Around the world, over two billion people lack access to safely managed water services (readily available services, uncontaminated by faeces and priority chemicals, and available when required) [13]. Because of the importance of water intake in public health, the World Health Organization (WHO) has set various quality requirements for groundwater features [14]. As a result, the physical and chemical characteristics offered by the WHO are crucial monitoring tools for establishing groundwater safety for drinking. Unsuitable drinking water and inappropriate conditions are estimated to cause 80% of all infections in most developing countries [15].
Climate change, a scarcity of surface water, and ongoing population growth have pushed agriculture to use groundwater more extensively worldwide to create potential food security resilience [16]. Around 70% of groundwater extraction in arid and semi-arid countries is used for irrigation [17]. Due to various anthropogenic and geogenic factors, groundwater quality has significantly decreased [16]. Long-term use of low-quality groundwater for irrigation could introduce harmful constituents into the soil, changing its physio-chemical composition and reducing soil fertility, significantly impacting crop yield and quality. In order to guarantee the availability of high-quality food fit for human consumption, it is crucial to observe groundwater quality and investigate its suitability for irrigation.
Water quality analysis based on hydrochemical investigation is vital for detecting the chemical features of groundwater and its acceptability for varied uses. In order to map groundwater susceptibility and address and assess water quality concerns, the spatial analysis of groundwater parameters should be evaluated to control and manage groundwater quality. Therefore, Geographic Information Systems (GIS) can be a valuable tool for monitoring, assessing, and managing groundwater quality. Geostatistical methods (e.g., kriging and inverse distance weight) are powerful methods to estimate the data at unobserved locations and map their spatial distribution [16]. GIS and geostatistics are widely used in environmental research, particularly groundwater quality studies [18,19,20,21,22].
Multivariate analysis techniques are practical statistical tools that can be used to quickly identify the factors that affect the quality of a water system and change its geochemical processes and assist in controlling those features to reduce contamination [23,24,25].
This research focuses on a newly reclaimed district in Egypt, the West of Minia. In this district, groundwater is the main water supply for irrigation and domestic use. Prior research discussed water resources’ management, sustainability, and quality in the study area [26,27,28,29,30,31,32,33,34,35,36]. However, most previous studies did not describe the geochemical processes that control groundwater quality, a detailed analysis of groundwater characteristics spatially and statistically, or a detailed study of groundwater suitability for industrial, irrigation, and drinking usage.
Therefore, the objectives of this study are: (a) to evaluate the groundwater quality of the study area; (b) to investigate the suitability of groundwater for household, irrigation, and drinking uses; and (c) to delineate sensitive and high-risk areas using the GIS interpolation techniques, multivariate statistical methods approach, and the irrigation water quality indices [26,27,28,29,30,31,32,33,34,35,36].

2. Description of the Study Area

2.1. Geographic Location

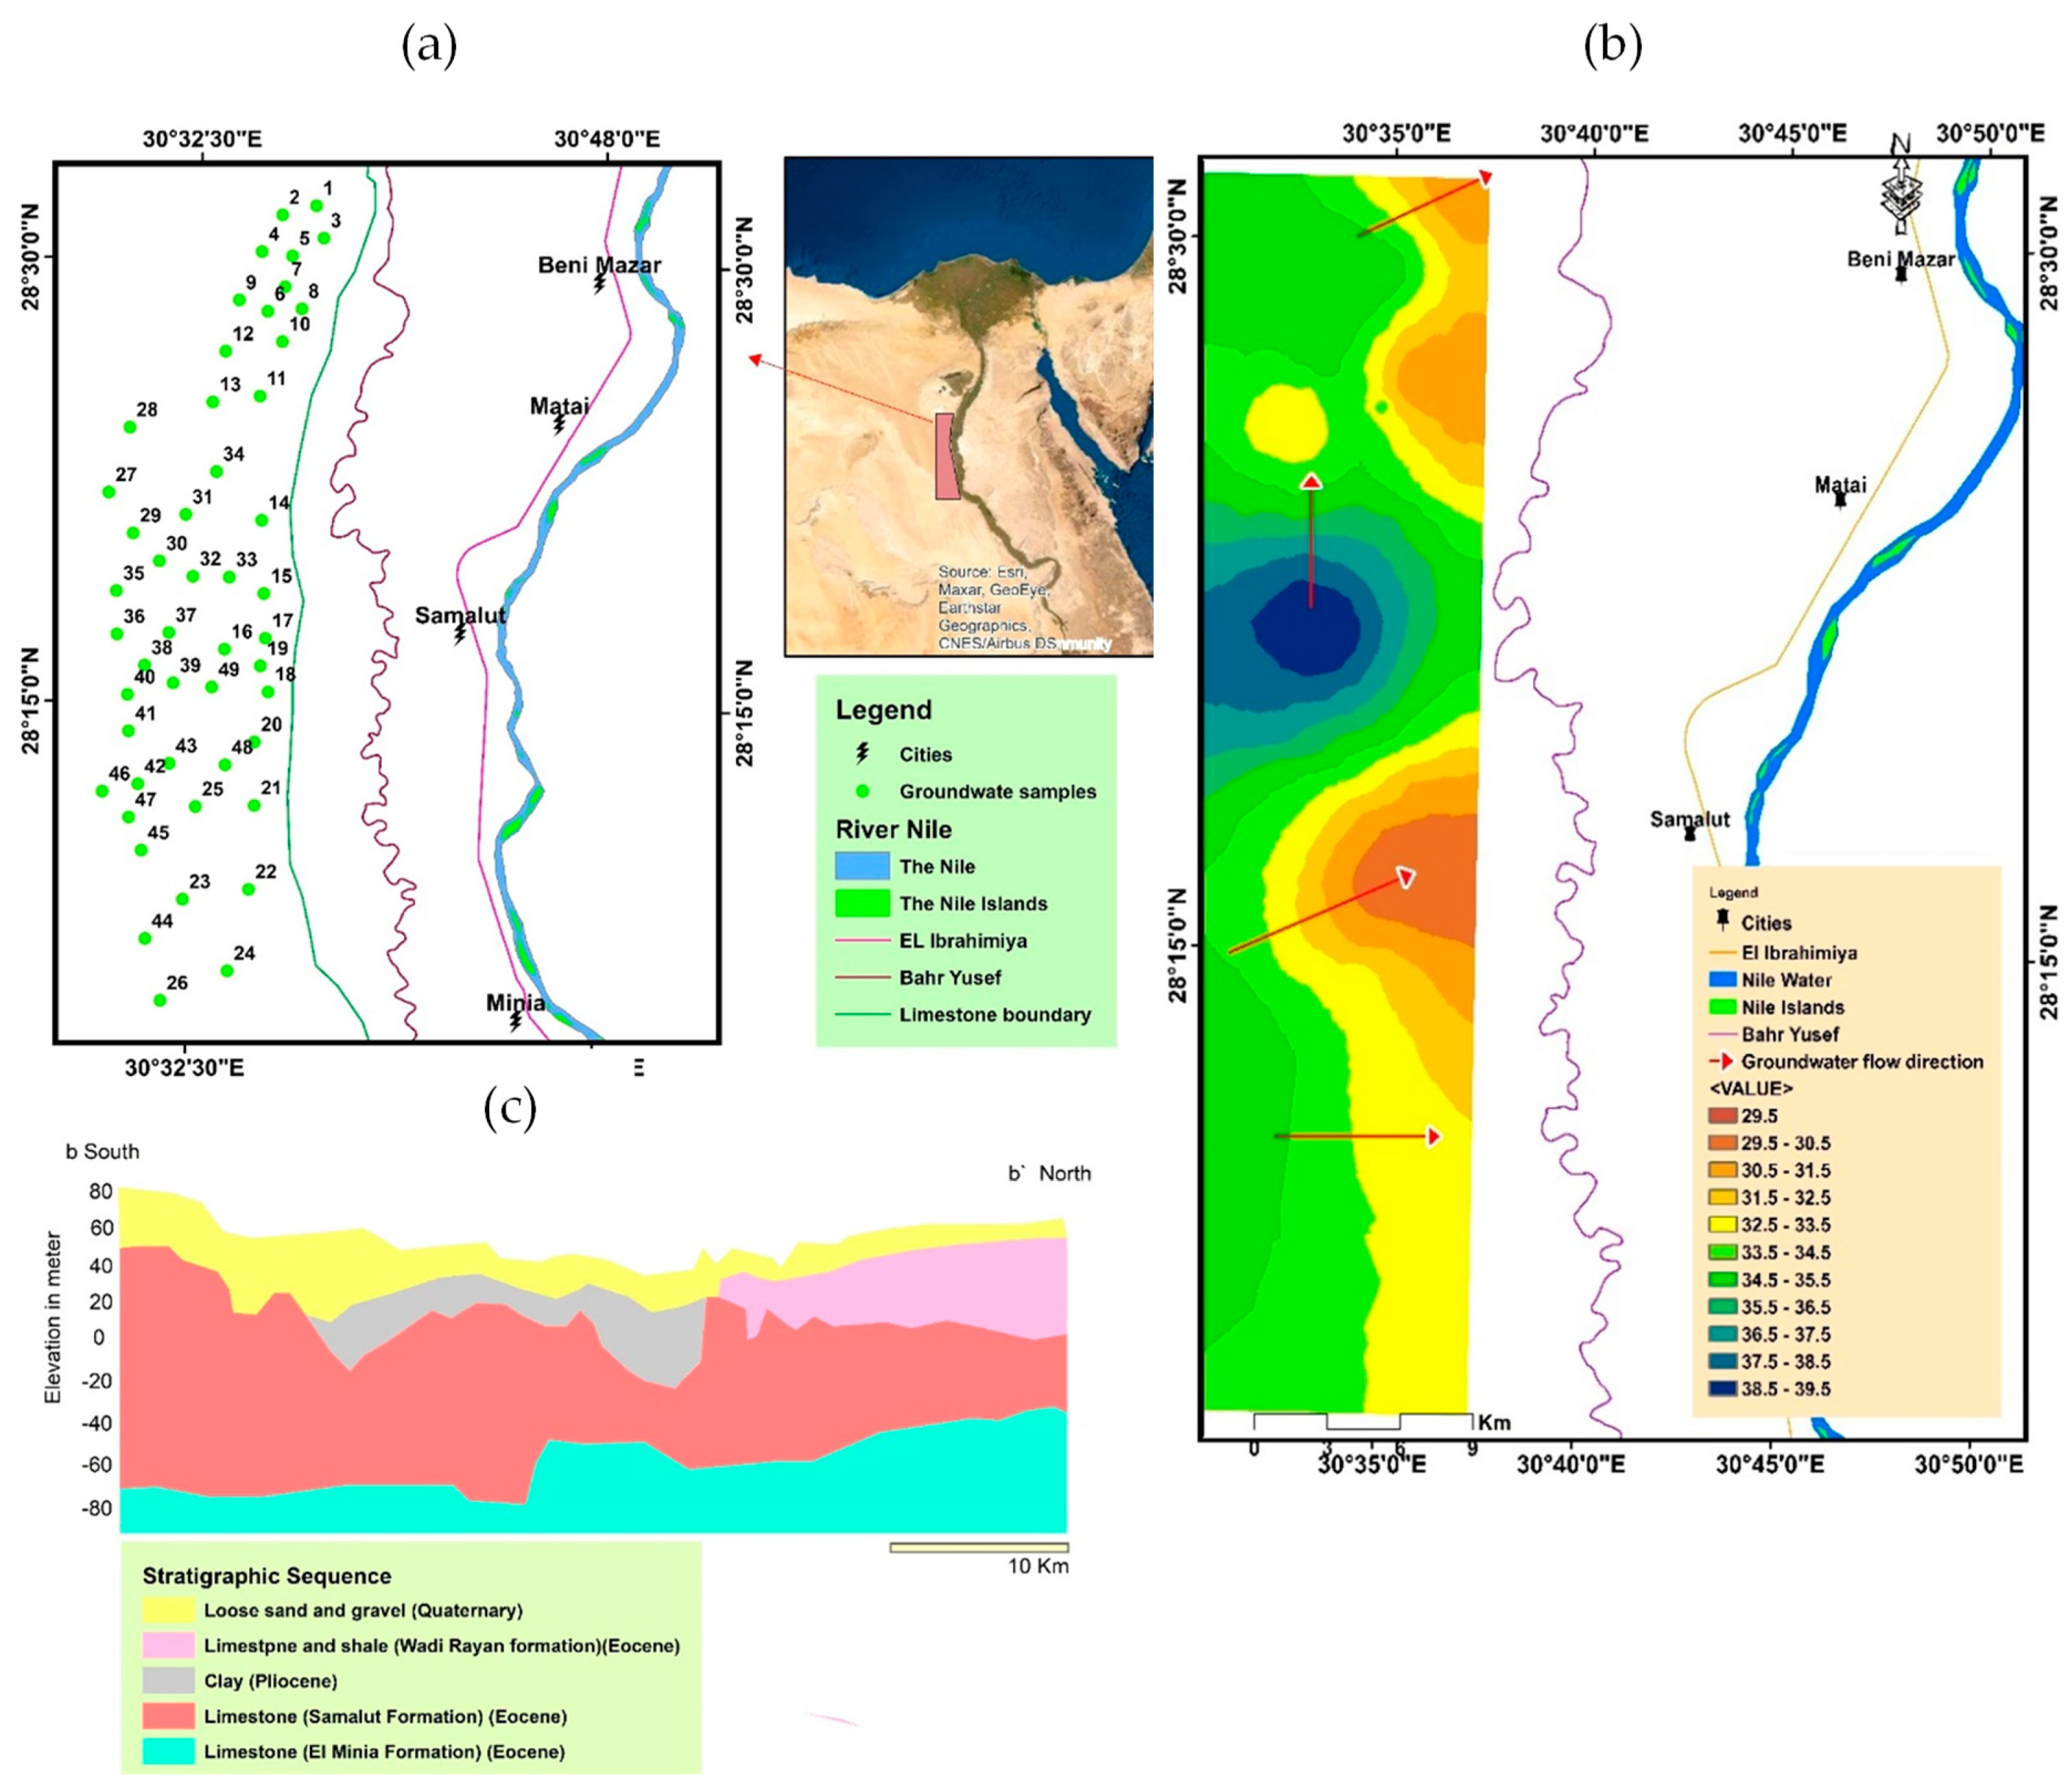
The study area is located between the longitudes of 29°75′ and 30°86′ E and the latitudes of 28°00′ and 28°58′ N in the western part of Minia governorate, Egypt covering an area of 5,400 km2 (Figure 1). It is an arid region where the average low-temperature ranges between 1 °C in the winter (in January) and 18 °C in the summer (in August), the average high temperature ranges from 25 °C in the winter (in January) to 45 °C in the summer (in June) and around 19.6 mm of rain falls on average each year.

2.2. Geomorphological and Geological Settings

The area studied is situated on a high plateau above the Nile. It primarily comprises limestone and is covered with alluvial sand and gravel deposits (Figure 1). It can be categorized into three geomorphological units: the young alluvial plain (the original agricultural land), the ancient alluvial plains (terraced fields that have recently been reclaimed and are perched above a young alluvial plain at various heights), and the calcareous structural plateau.
The region is geologically positioned on the Nile Valley’s western bank. The area’s stratigraphic sequence contains sedimentary rocks from the Eocene to the Quaternary (Figure 1). Based on the previous stratigraphic and geologic studies [37,38,39,40], the stratigraphic sequence of the study area is predominantly comprised of the following lithostratigraphic units, from the youngest (top) to the oldest (bottom): (a) Nile silts, sand dunes, and Fanglomeates (Holocene sediments); (b) gravels and sands intercalated with clays creating the Neonile, Prenile, and Protonile deposits (Pleistocene sediments); (c) sands and gravels (Plio-Pleistocene sediments); (d) clays (Pliocene sediments); and (e) basalts (Oligocene).

2.3. Hydrogeological Settings

According to data from the drilled wells (Samalut Formation), the Eocene aquifer is the dominant aquifer in the studied area, a fractured white limestone interbedded with clay and marl. The aquifer is unconfined and recharged by the excess water used in irrigation, the underlying Nubian aquifer, and water discharged by groundwater extraction wells and lateral outflow to the Quaternary aquifer to the east because of its higher elevation. The aquifer’s typical groundwater flow direction is northeast (Figure 1) [41]. The Eocene aquifer’s average transmissivity value is 11,607 m2/day [26], and pumping rates range from 80 to 120 m3/h. The major flow regime is mainly northeast toward the Nile, and groundwater levels range between 29 and 40 m [42].
Figure 1. (a) Map showing the location of the study area; (b) Eocene limestone aquifer groundwater levels in the studied area; and (c) a geological cross-section of the area (modified after [41]).
Water 15 02909 g001

3. Materials and Methods

3.1. Sampling and Analytical Procedures

Forty-nine groundwater samples were collected in the study area (Figure 1). Using a global positioning system (GPS), the sample sites’ geographic coordinates and ground elevation were documented. Groundwater depth was measured at each test site to determine groundwater flow and create a map showing water levels in the study area. The stagnant water was purged by groundwater pumping for one h before collecting the samples. Before storing water samples in bottles, the bottles were cleaned with diluted HCl (1:1) and washed using distilled water. The water samples were stored in polyethene, sealed, labelled, and transported to the laboratory according to the guidelines proposed by [43]. Bioevopeak Ultrameter SM101 equipment was used to determine temperature, pH, total dissolved solids (TDS), and electrical conductivity in the field (EC). At the Ministry of Agriculture Laboratory in Minia Governorate, Egypt, chemical analysis of the acquired water samples was carried out using techniques advised by the American Public Health Association [44]. Volumetric titration methods were used to examine calcium (Ca2+), magnesium (Mg2+), bicarbonate (HCO3), and chloride (Cl). A flame photometer was used to determine sodium (Na+) and potassium (K+) in water samples. A UV spectrophotometer was used to determine sulfate (SO42−) concentrations in water samples. The ionic balance error fell within the permitted limit of 5% for all water samples. The concentration of ions was compared with the guideline values for drinking water established by the World Health Organization [45] (Table 1).
Based on the physico-chemical testing of groundwater samples, irrigation quality metrics (EC, SAR, sodium per cent (Na%), residual sodium carbonate (RSC), Kelley’s ratio (KR), magnesium hazard (MH), and permeability index (PI)) were produced. The analytical data were related by projecting different graphical representations, including Piper, Wilcox, and Gibbs diagrams, to classify the groundwater and its suitability for employment in diverse purposes. Aquachem software was used to evaluate the quality measurements and the graphs mentioned above to study the hydrochemical features of groundwater.

3.2. Statistical Investigation Approaches

Two correlation methods were used to identify the relationships between the hydrochemical parameters: Pearson’s coefficient, which measures the linear associations between the variables, and Spearman’s rank-order coefficient, which finds the monotonic correlations. Principal component analysis (PCA) and hierarchical cluster analysis (HCA) are used to distinguish the chemical parameters that control the geochemistry of the groundwater system and its origin. The statistical investigations performed in this study were conducted using IBM SPSS Statistics and Python modules for data analysis and visualizations, including Numpy and Matplotlib.

3.3. Spatial Mapping

For groundwater explorations, continuous monitoring and evaluation of a wide range of physical and chemical characteristics are required. Geographical Information Systems (GIS) are helpful tools for gathering, preserving, analyzing, and displaying the spatial and non-spatial data. It is widely used in assessing water quality, spatial mapping, and evaluation of risks [46,47,48]. This study applied the inverse distance weighted (IDW) method to create spatial variability maps of the groundwater quality parameters using ArcGIS.

4. Results and Discussion

4.1. Hydrochemical Characteristics

The general characteristics of hydrochemical parameters of major elements are summarized with values of the highest permitted limits, as defined by the World Health Organization [45] in Table 1.
Electric conductivity (EC) is used to identify salinity hazards and irrigation suitability. Values obtained in this study varied from 1147 to 9344 μS/cm, with a mean of 3044.18 μS/cm, a standard deviation of 2263.390 μS/cm, and a variance of 5,122,932.486 μS/cm. TDS values range from 734 to 5980 mg/L, with a mean of 1948.29 mg/L, a standard deviation of 1448.579, and a variance of 2,098,380.708. Sodium is the dominant ion among major examined cationic concentration, ranges from 100 to 1800 mg/L (mean 500.24mg/L), followed by calcium ranging from 30 to 215 mg/L (mean 91.84 mg/L), magnesium varies between 28 and 121 mg/L (mean 59.80 mg/L), and potassium varies between 11and 125 mg/L (mean 500.24 mg/L). The dissolved anions of groundwater samples were found to have the principal dominating ions of Cl, SO42−, HCO3, and CO32− in a range of 135 to 2010 mg/L, 96 to 1600 mg/L, 92 to 275 mg/L, and 15 to 90 mg/L, with average values of 650.76 mg/L, 453.43 mg/L, 199.14 mg/L, and 43.12 mg/L, respectively. The sequence of the major ions in the groundwater sample sites is Na+> Ca2+> Mg2+> K+ and Cl> SO42−> HCO3> CO32−.
Elevated level of solids and ions present in groundwater may have adverse effects on human health. The data presented in Table 1 indicate that the maximum acceptable Total Dissolved Solids (TDS) concentration in water, as per WHO guidelines, is 1000 mg/L. In the northern region of the study area, 37% of the groundwater samples have TDS values exceeding this limit. Sodium content in groundwater exceeds the recommended limit in 73% of the samples analyzed, whereas only 6% of the water samples have calcium levels that exceed the permissible limit, and these are also situated in the north of the research area. The manganese concentration in water is below the permissible limit, indicating no risks associated with manganese in the study area. Potassium concentration is above the recommended limit in 94% of the samples analyzed, while bicarbonate contents exceed the allowable limit in 98% of the groundwater samples. Additionally, chloride levelin water samples of the study area exceeds the recommended limit in 88% of the samples. Taken together, 61% of the samples analyzed exceed WHO guidelines, which suggests that the presence of TDS, sodium, potassium, bicarbonate, chloride, and sulfate may pose potential health hazards in the study area.

4.2. Spatial Variability of Groundwater Parameters

Figure 2 displays the distribution of major cations (calcium, magnesium, sodium, potassium) and anions (bicarbonate, chloride, sulfate) and EC, TDS, and TH. The study area is characterized by a shale layer intermixed with limestone, which is highly susceptible to weathering and rock–water interaction, causing an increase in ion concentration towards the northern part of the research zone. Moreover, most parameters exhibit higher values towards the west, which is attributed to limestone degradation and a lack of direct surface water recharge. Sodium concentration exceeds that of other principal cations and increases in the northwest direction, corresponding to the direction of calcium increase. Manganese and potassium concentrations are lower than sodium and calcium concentrations, with their values increasing towards the north and west and decreasing towards the middle and east. Chloride and sulfate exhibit higher cation concentrations than carbonate and bicarbonate. The maps of cation distribution illustrate that chloride and sulfate concentrations significantly increase towards the north. The northern and western directions towards Bahr Yusef exhibit higher values of EC, TDS, and TH due to recharging from surface water and infiltration of additional irrigation water into the aquifer.

4.3. Correlation and Multivariate Analysis

4.3.1. Scatter Matrix and Correlation Analysis

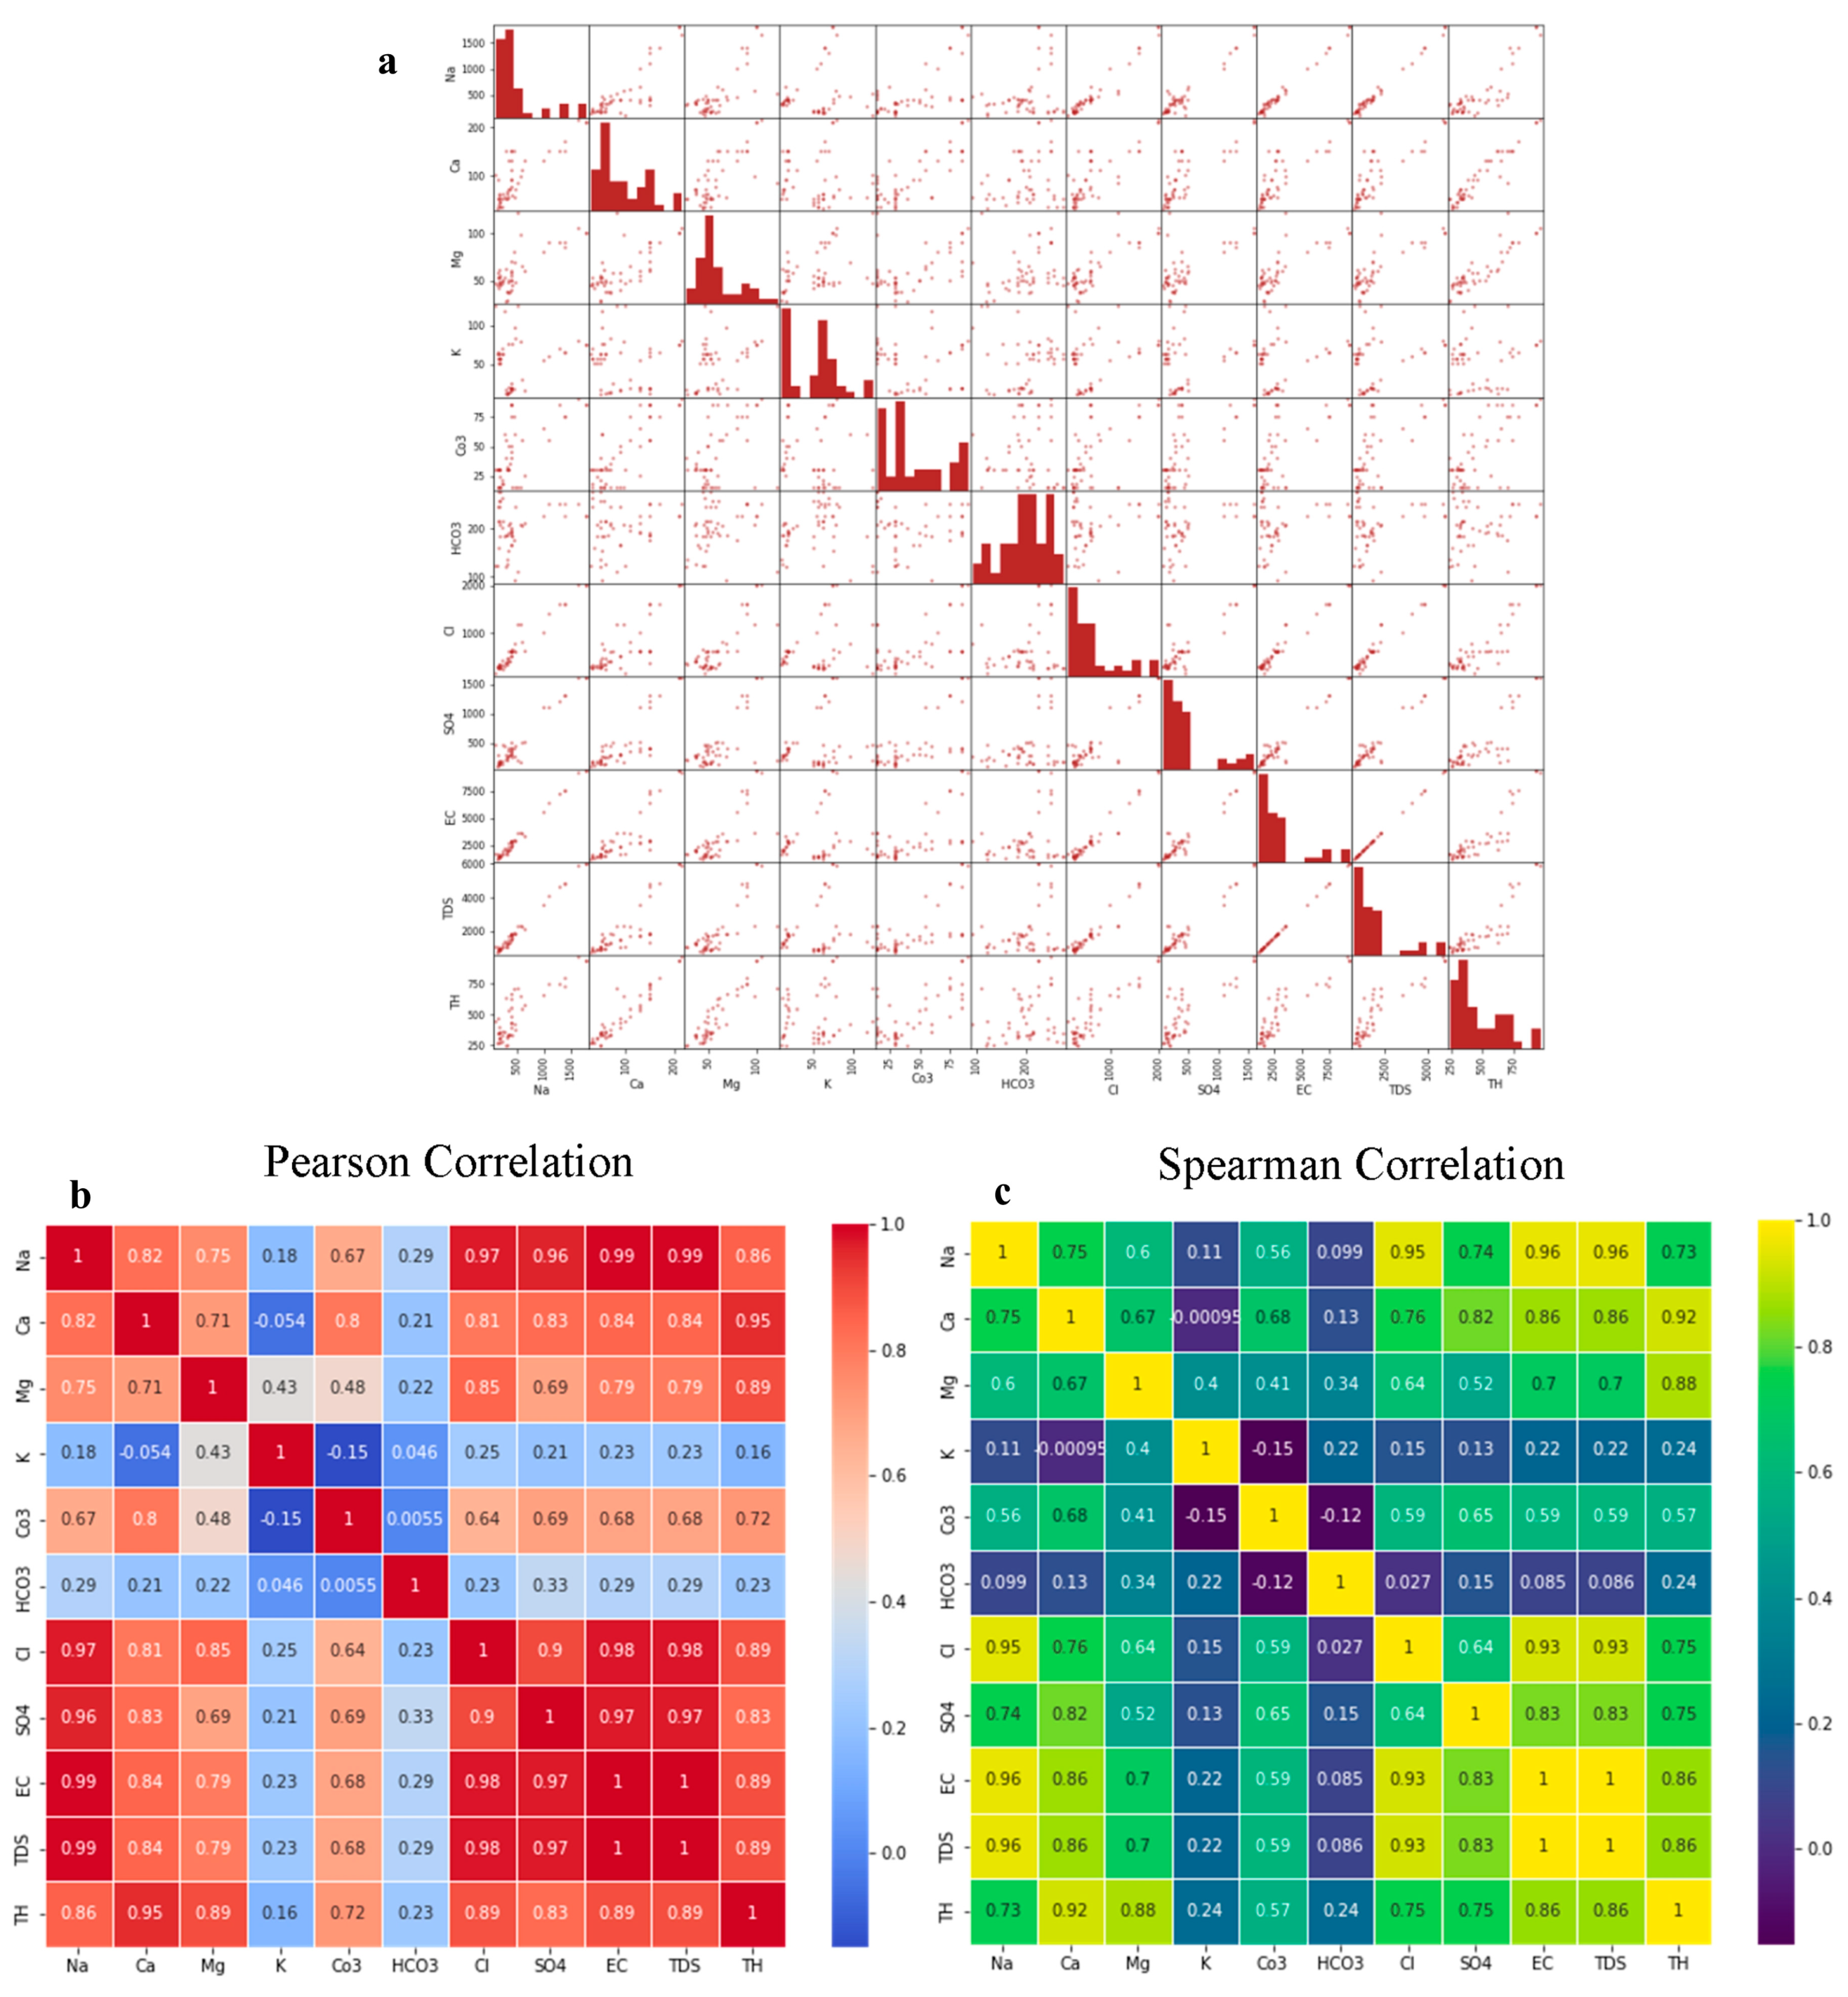
The relationships and distribution of various hydrochemical parameters in the research area were investigated using a scatter matrix (Figure 3). The scatter matrix shows that some elements have linear relations, such as TDS and most other parameters, especially EC; the other elements show non-linear or no relationships. The matrix’s plotted histograms show that most parameters are not normally distributed. Two different correlation types were used to study and present the relations between various parameters to describe the variables that affect groundwater quality: Pearson correlation which requires the analyzed data to be normally distributed, and Spearman correlation, which does not rely on normality.
Figure 3 displays two heat maps of the resulted correlation coefficients (r) of the two types of correlations. For both correlation types, strong correlations are between 0.7 and 1, moderate correlations are between 0.5 and 0.7, weak correlations are between 0.5 and 0.3, and values lower than 0.3 reflect no correlations. Positive values represent positive correlations, while negative values represent negative correlations. A significant positive relationship pointed to a common cause, whether anthropogenic or natural.
The results of the two-correlation analysis indicate that TDS shows strong positive correlations with EC, Na, Cl, Ca, Mg, Cl, and SO4, showing that these ions control groundwater salinity and electric conductivity in the aquifer and both EC and TDS are highly dependent. Groundwater hardness is linked to these constituents, as evidenced by a strong positive correlation between TH and Ca2+ (r Spearman = 0.92) and Mg2+ (r Spearman = 0.88). A strong positive correlation appears between Na and Cl, Na and Ca, Na and SO4, Ca and SO4, and Ca and Cl, mainly originating from natural processes, such as dissolution and rock–water interaction. This can be attributed to the dissolution of rocks such as gypsum, halite, and silicates.

4.3.2. Principal Component Analysis (PCA)

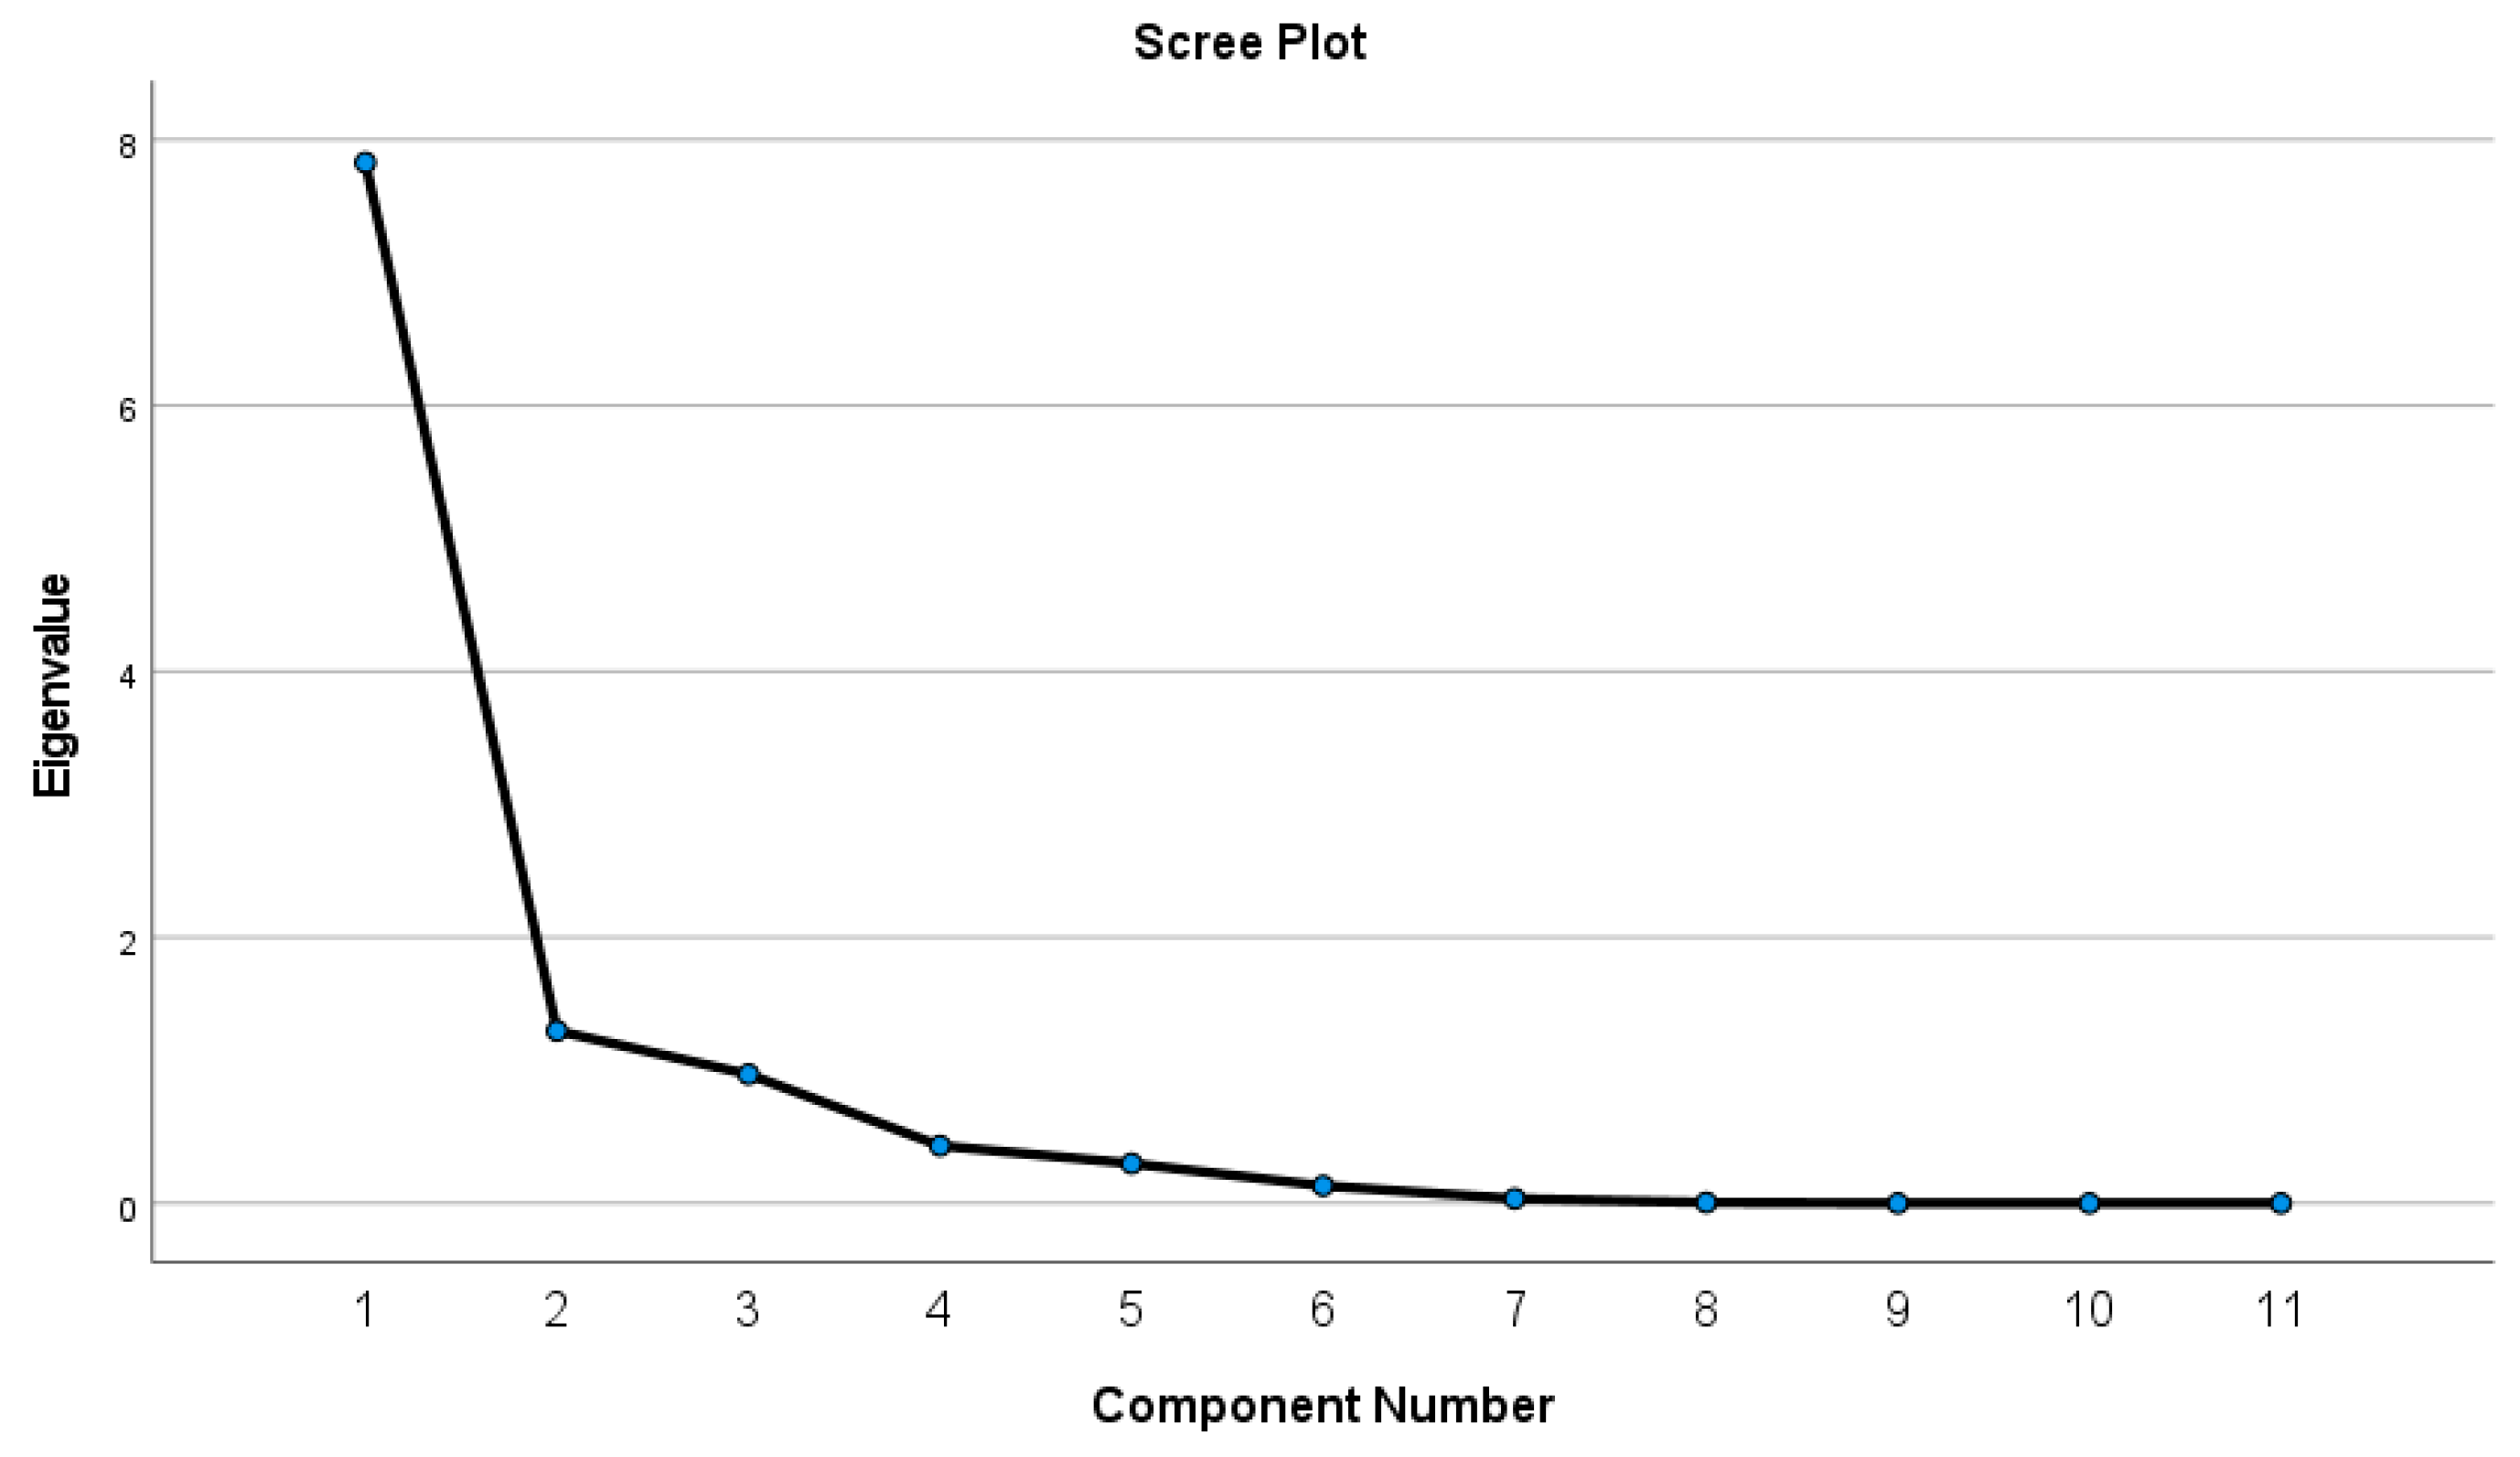
The key factors influencing groundwater quality in the area under research were identified using Principal Component Analysis. The analysis used varimax rotation and only considered eigenvalues more significant than one. Table 2 and Figure 4 display the PCA results, including eigenvalues, variance, and cumulative percentages for each principal component (PC). Three principal eigenvalues (PC1, PC2, and PC3) were calculated, accounting for 91.789% of the total variance. These components are the main factors which mainly control groundwater composition in the study area:
PC 1 represents the main component and comprises 71.174% of the total variance. It is composed primarily of EC, TDS, TH Na+, Ca2+, Mg2+, CO32−, Cl, and SO42−, with the loading of 0.986, 0.986, 0.949, 0.969, 0.904, 0.845, 0.212, 0.741, 0.294, 0.966, and 0.950, respectively, that show strong positive loading. PC1 mainly shows that the major ions are produced by natural processes, while anthropogenic factors may not yet be present. This represents the influence of common natural processes, including weathering and dissolution of minerals and rocks (rock–water interaction) on groundwater hydrochemistry. The strong positive loading of EC indicates a strong ion exchange through mineral dissolution. The component also illustrates that the increase in EC, TDS, and TH is mainly caused by the high ion levels of Na+, Ca2+, Mg2+, CO32−, Cl, and SO42−. PC2 has 11.795% of the entire variance, mainly represented by K+ with a strong loading of 0.889 and CO32− with a moderate negative loading of −0.499. This implies that anthropogenic activities could potentially affect groundwater quality in the research area. PC3 contains 8.820% of the total variance and is composed of HCO3 with a high load of 0.905. This factor can be described by groundwater recharge from the Nile River and the irrigation canals containing high bicarbonate concentration [49].

4.3.3. Hierarchical Cluster Analysis (HCA)

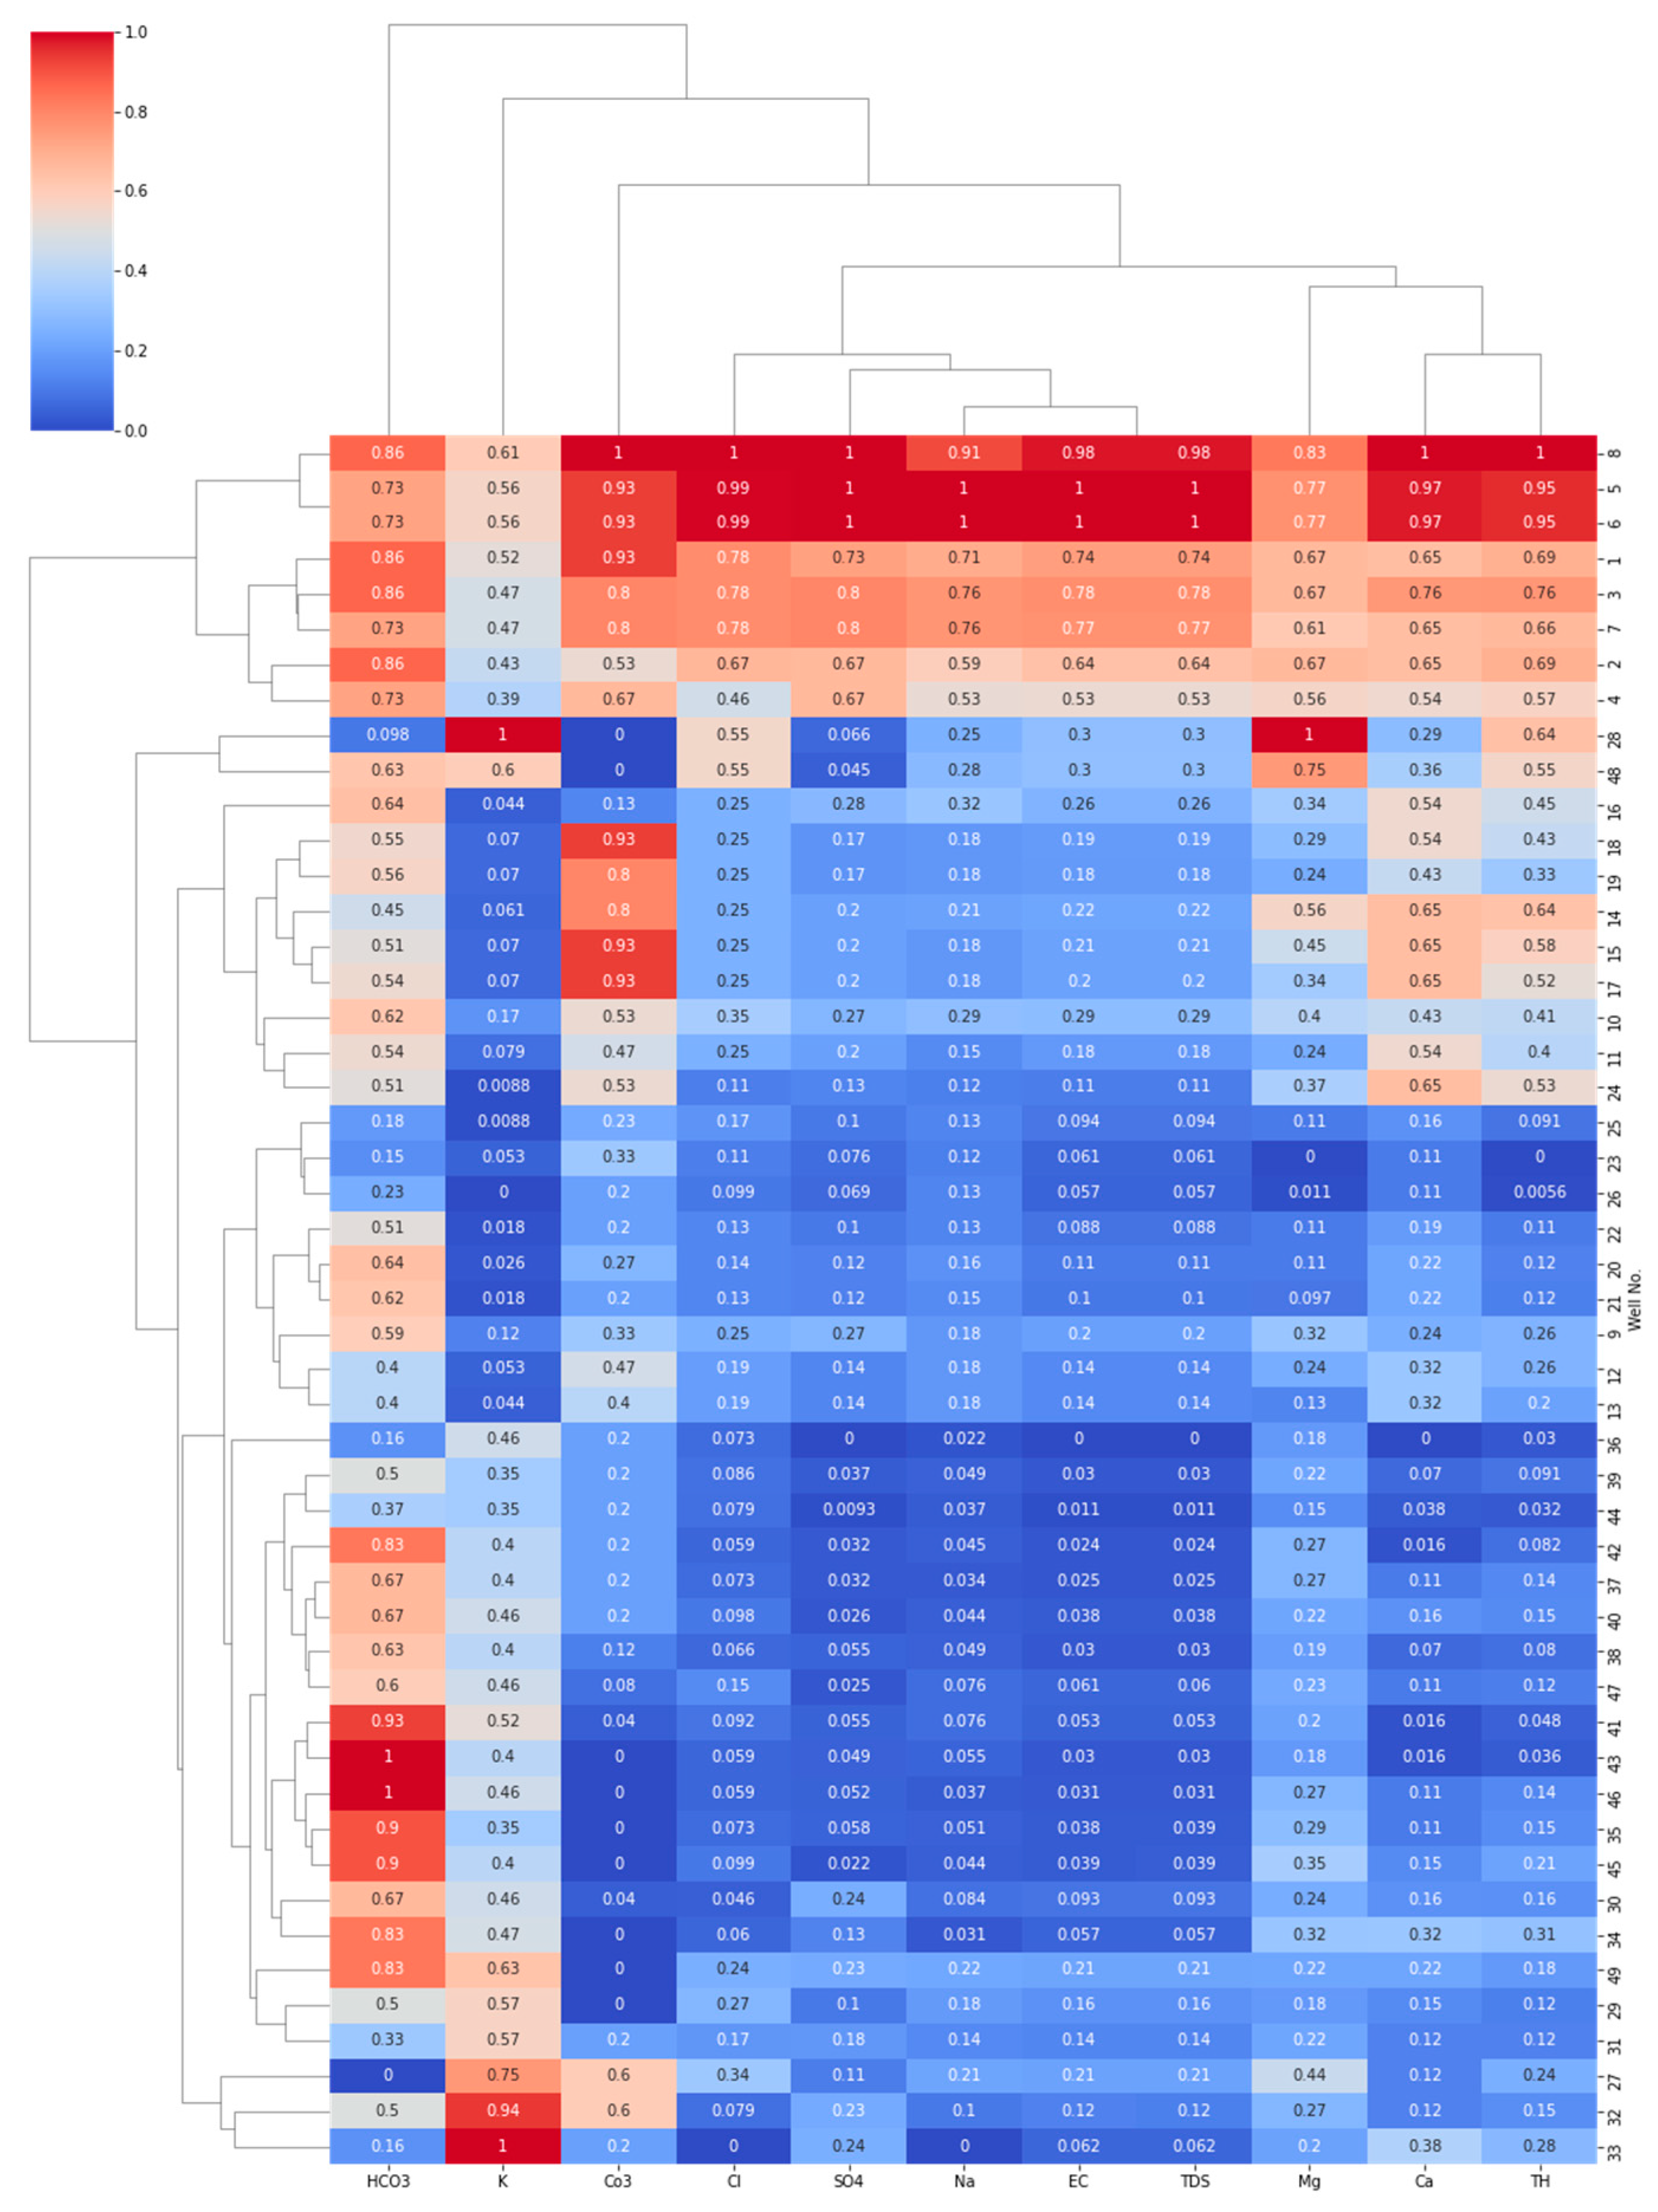
The hierarchical cluster analysis used the ward’s linkage method and squared Euclidean distances to categorize the hydrochemical parameters. Figure 5 illustrates the findings of the analysis in a dendrogram. The dendrogram displays clusters in a horizontal direction according to the physicochemical parameters producing clusters comprising comparable features and in a vertical orientation to classify the wells based on the hydrochemical parameters. The dataset was resized before the analysis to provide more accurate findings.
In the horizontal orientation, three primary clusters were generated. Cluster 1 (matches PC1) includes Na+, Ca2+, Mg2+, CO32−, Cl, SO42−, EC, TDS, and TH showing that these parameters were produced by rock weathering and mineral dissolution through water–rock interaction. This cluster can be classified into two sub-clusters, a cluster contains TH, Ca2+, and Mg2+ reflecting that these two ions have the same origin and are responsible for groundwater hardness and a cluster includes Na+, CO32−, Cl, SO42−, EC, and TDS demonstrating the role of theses ions in groundwater salinity. Cluster 2 (matches PC2) is constituted of K+, implying that human-made sources, such as potassium-rich fertilizers, are responsible for the creation of potassium in the groundwater. Cluster 3 (matches PC3) is constituted of HCO3 which may arise from a different source such as penetration of surface water into the aquifer.
However, the vertical axis indicates two primary clusters possessing identical ion concentrations. The first cluster comprises eight water samples (sample 1 to sample 8) in the area’s northern half. These samples have high concentrations of main ions and high TDS, EC, and TH. Consequently, groundwater geochemistry is predominantly regulated by water–rock interaction at this site. This cluster can also relate to the interaction between groundwater and the Shale layer found in this location. The other cluster contains the additional groundwater samples (samples 9 to 48) that mostly contain low to moderate quantities of the analyzed ions.

4.4. Hydrochemical Analysis

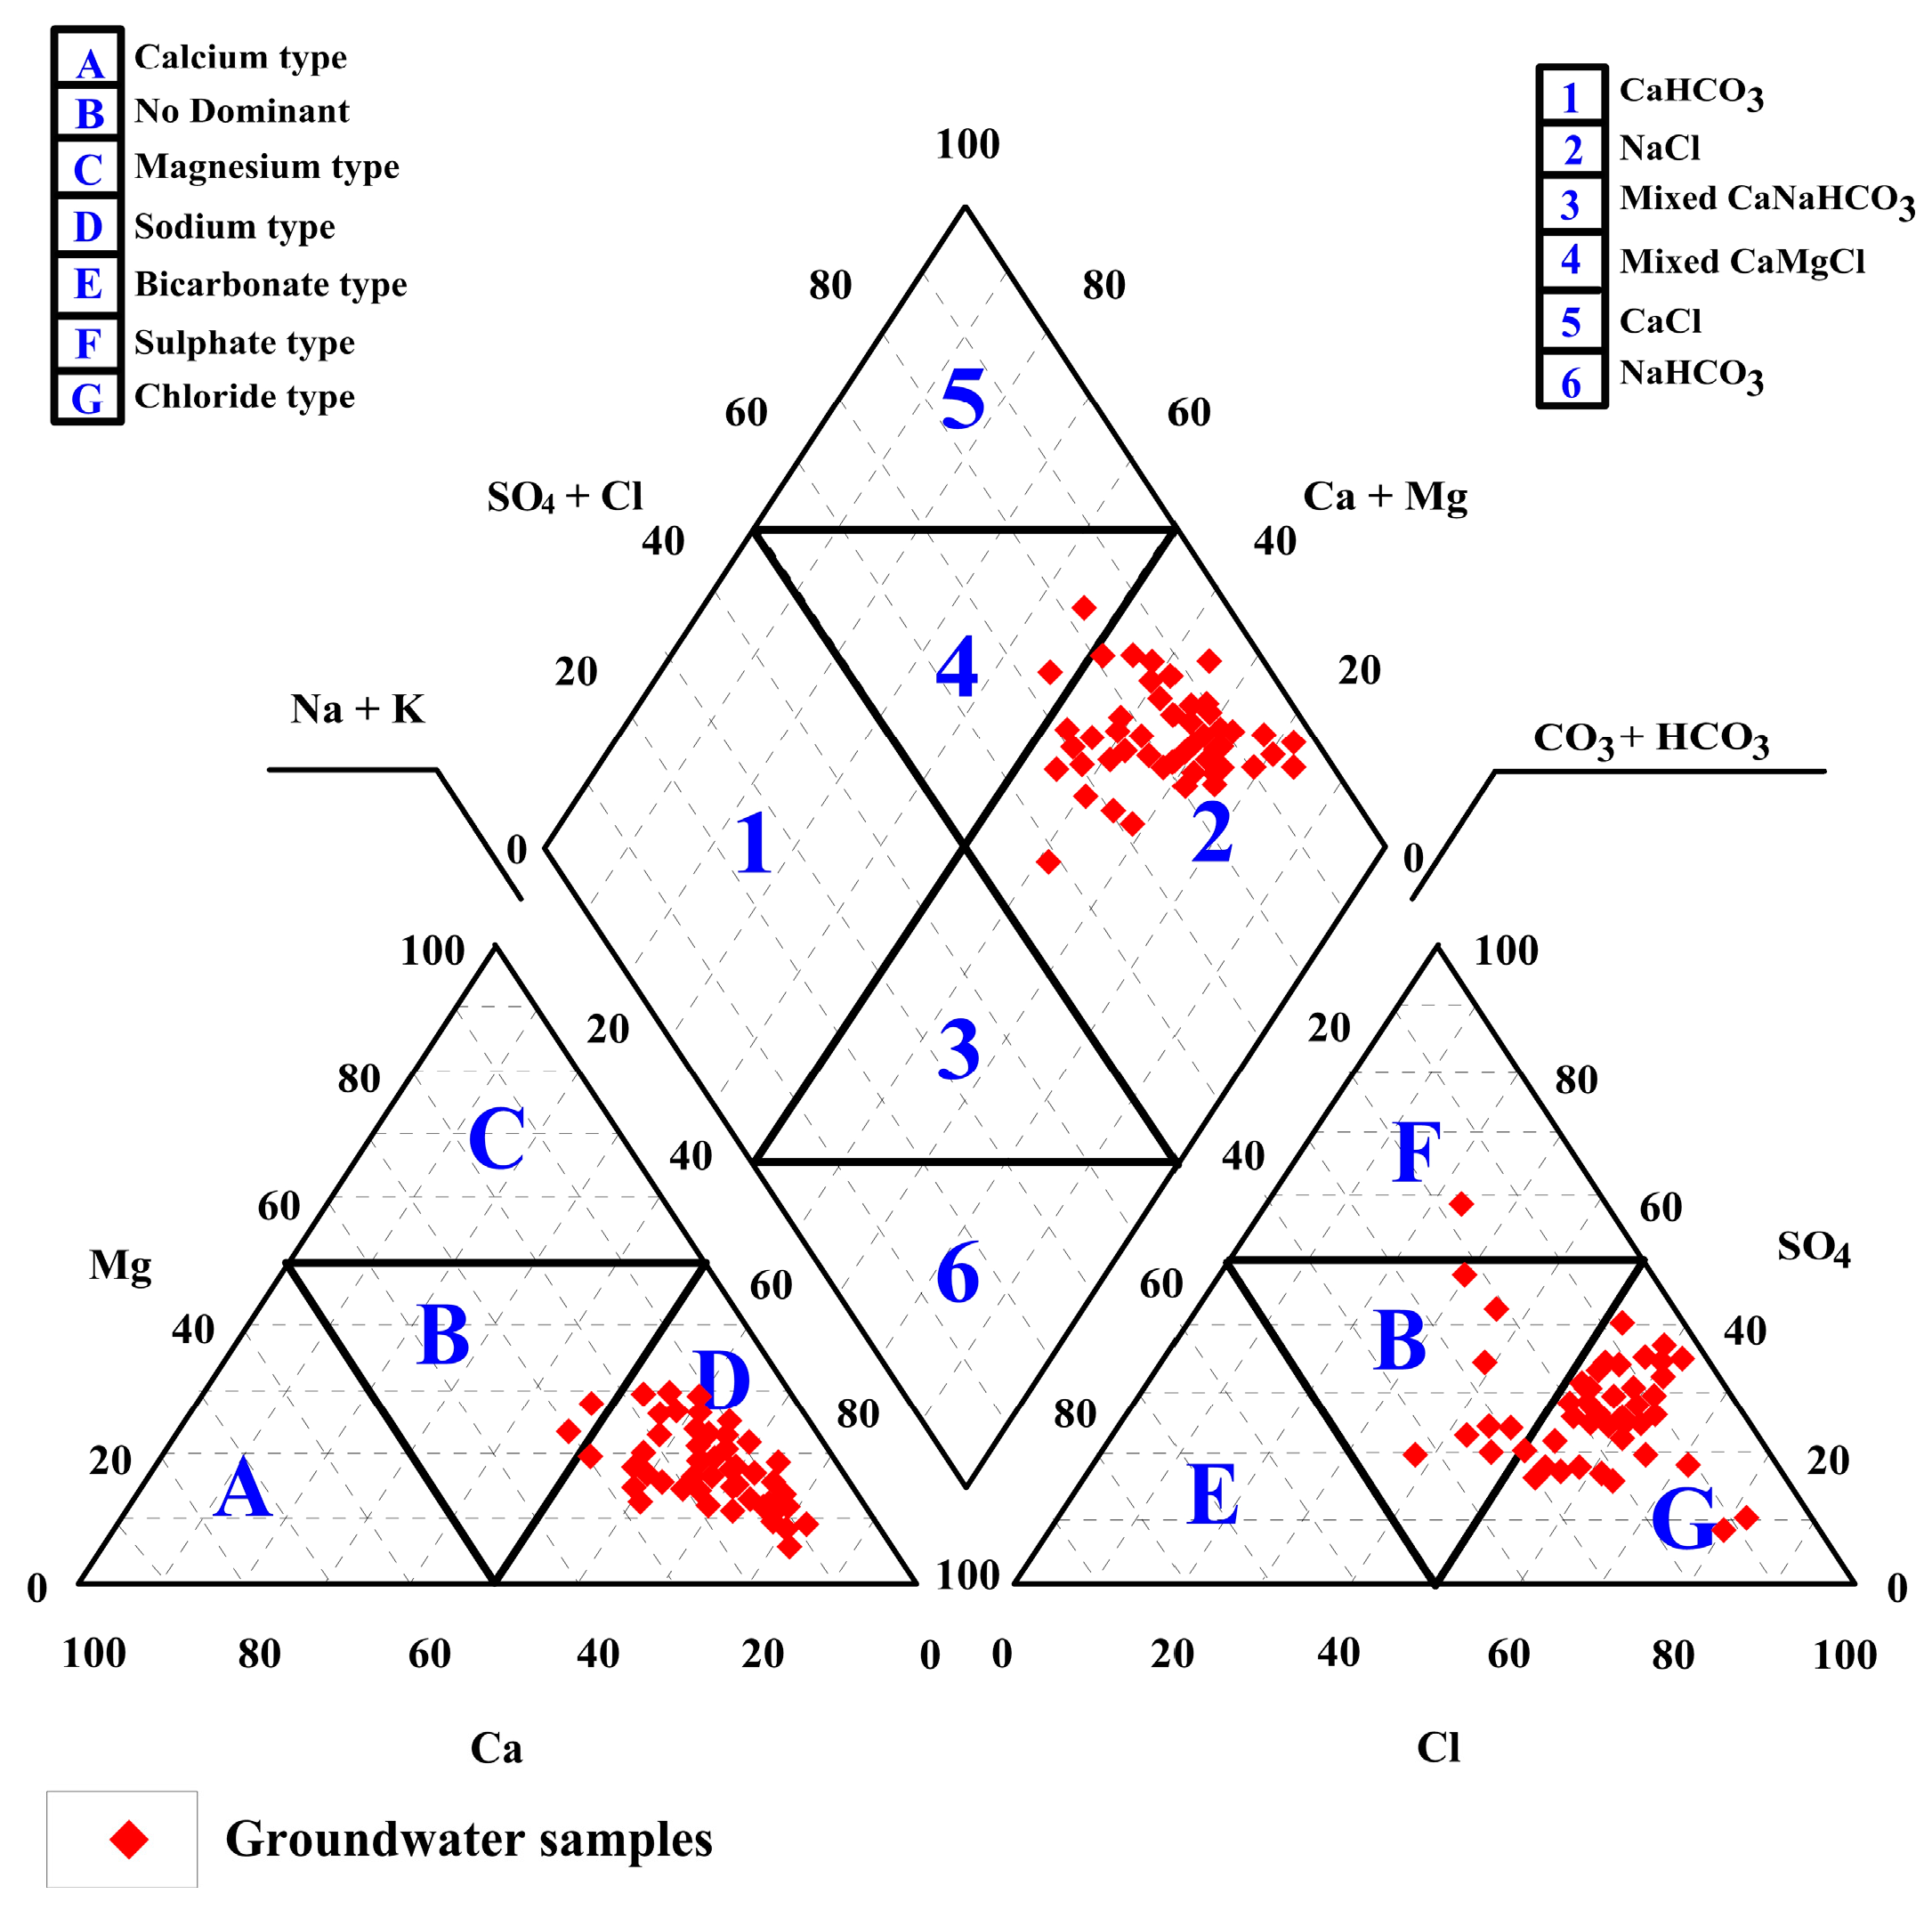
The chemical features of an aquifer system are represented by hydrochemical facies that present the impact of the interaction between water and aquifer minerals within a lithological framework. Hydrochemical facies describes the variations in the chemical make-up of varying groundwater bodies within an aquifer. The aquifer’s lithology, solution kinetics, flow patterns solution, kinetics, and flow patterns of the aquifer all influence the facies [50]. The Piper diagram is a handy tool for categorizing and comparing different types of water depending on their ionic content. It divides into three parts, two triangular shapes and a diamond-shaped part, all of which have been widely examined to understand groundwater geochemical evolution issues better. In the right triangle, the anions are plotted as a single point as a % age of total cations in meq/L, whereas the cations are plotted in the triangle to the left as a single point as a percentage of total cations in meq/L [51].
According to the hydrochemical facies presented on the diagram, the dominating cation is Na+, while the principal anion is Cl (Figure 6). The most prevalent facies are Na-Cl, which accounts for most groundwater samples, and Ca-Mg-Cl, which accounts for only two samples. This implies the presence of surface and paleo-water replenishment, ion exchange, long-term interaction between groundwater and formations, and low groundwater velocity, all of which are conducive to halite deposit disintegration.

4.5. Geochemical Processes

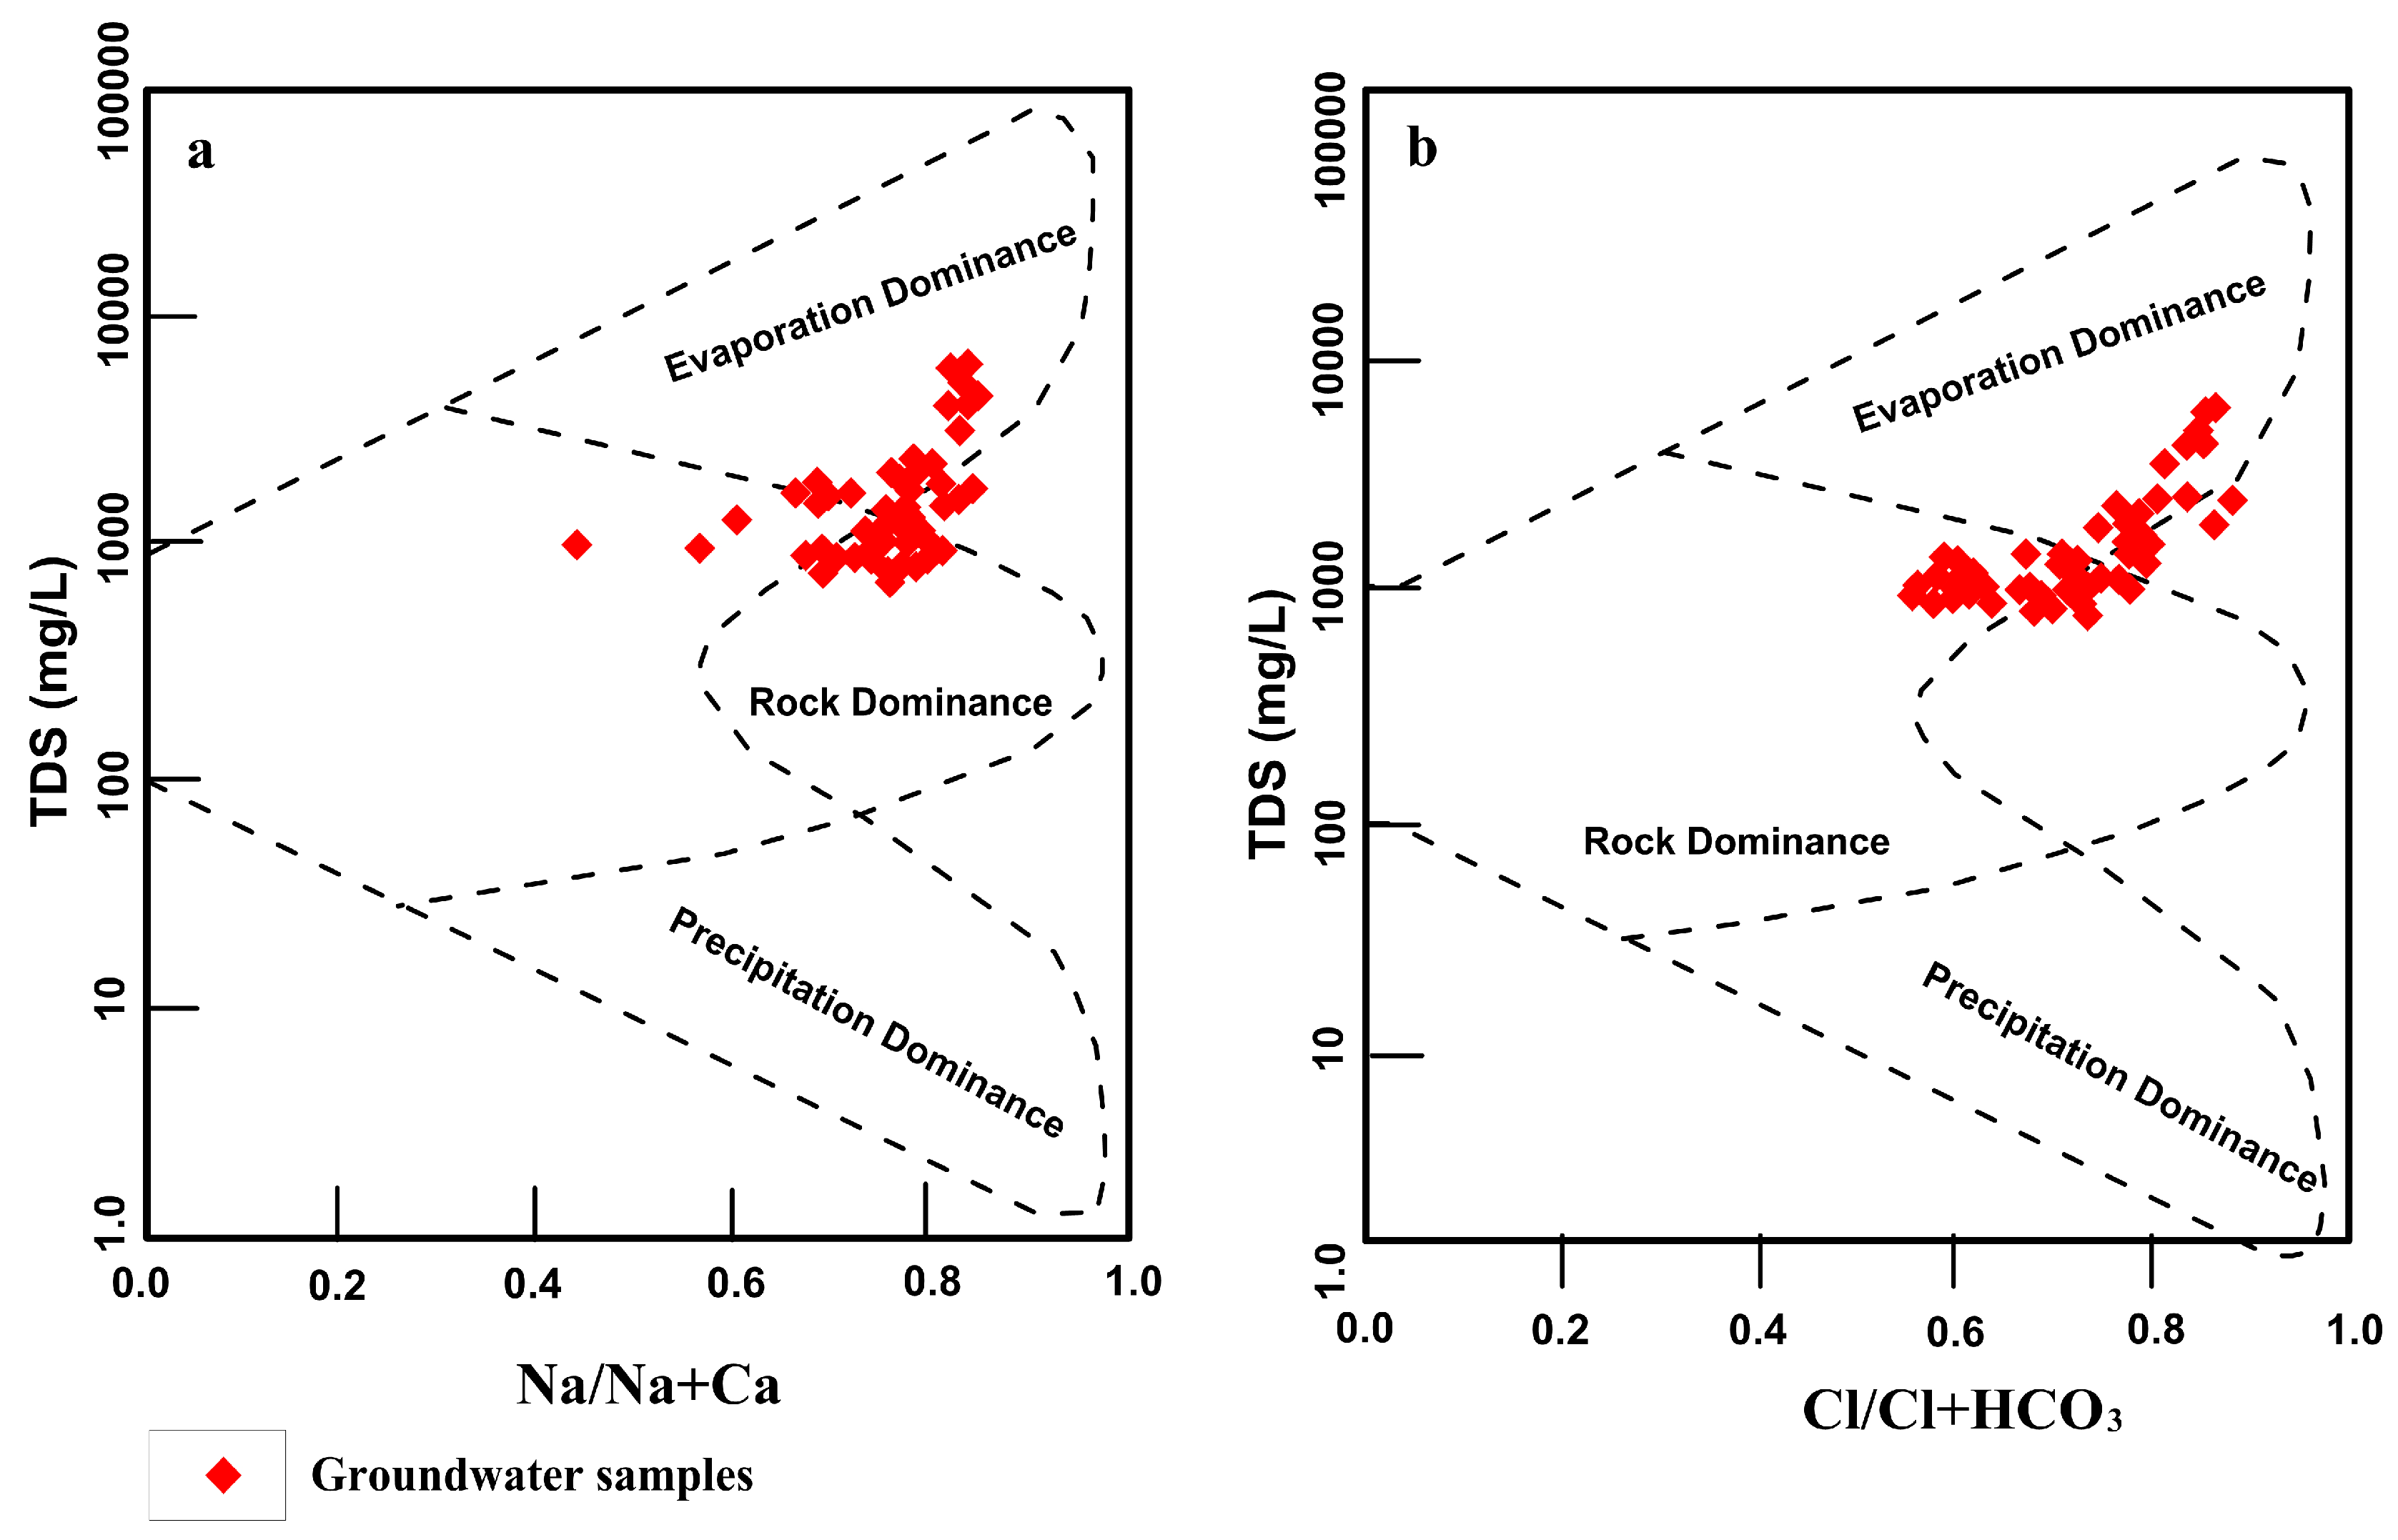
Gibbs [52] devised a diagram to examine the primary natural factors that impact groundwater chemistry and to aid in the determination of the interaction between an aquifer’s lithological features and water composition.
The Gibbs plot shows three domains of dominance: evaporation, precipitation, and rock–water interaction. The first diagram shows the link between TDS and the cationic ratio (Na+/Na+ + Ca2+) and the second diagram demonstrates the connection between the anionic ratio and TDS (Cl/(Cl + HCO3). Figure 7 plots the gathered samples shown in the Gibbs diagram. The chart reveals that most of groundwater samples (61%)(30 samples) is dominated by rock, whereas only 39% (19 samples) are dominated by evaporation, and no samples are dominated by precipitation. This reflects the importance of the water–rock interaction in the groundwater chemistry of the area under study, implying that the chemical weathering of minerals regulates groundwater quality via dissolving the surrounding rocks. In addition, water evaporation in the unsaturated zone and bedrock leaching can alter the characteristics of groundwater in the research area, but precipitation has no effect on groundwater composition.

4.6. Evaluation of Drinking and Household Groundwater Quality

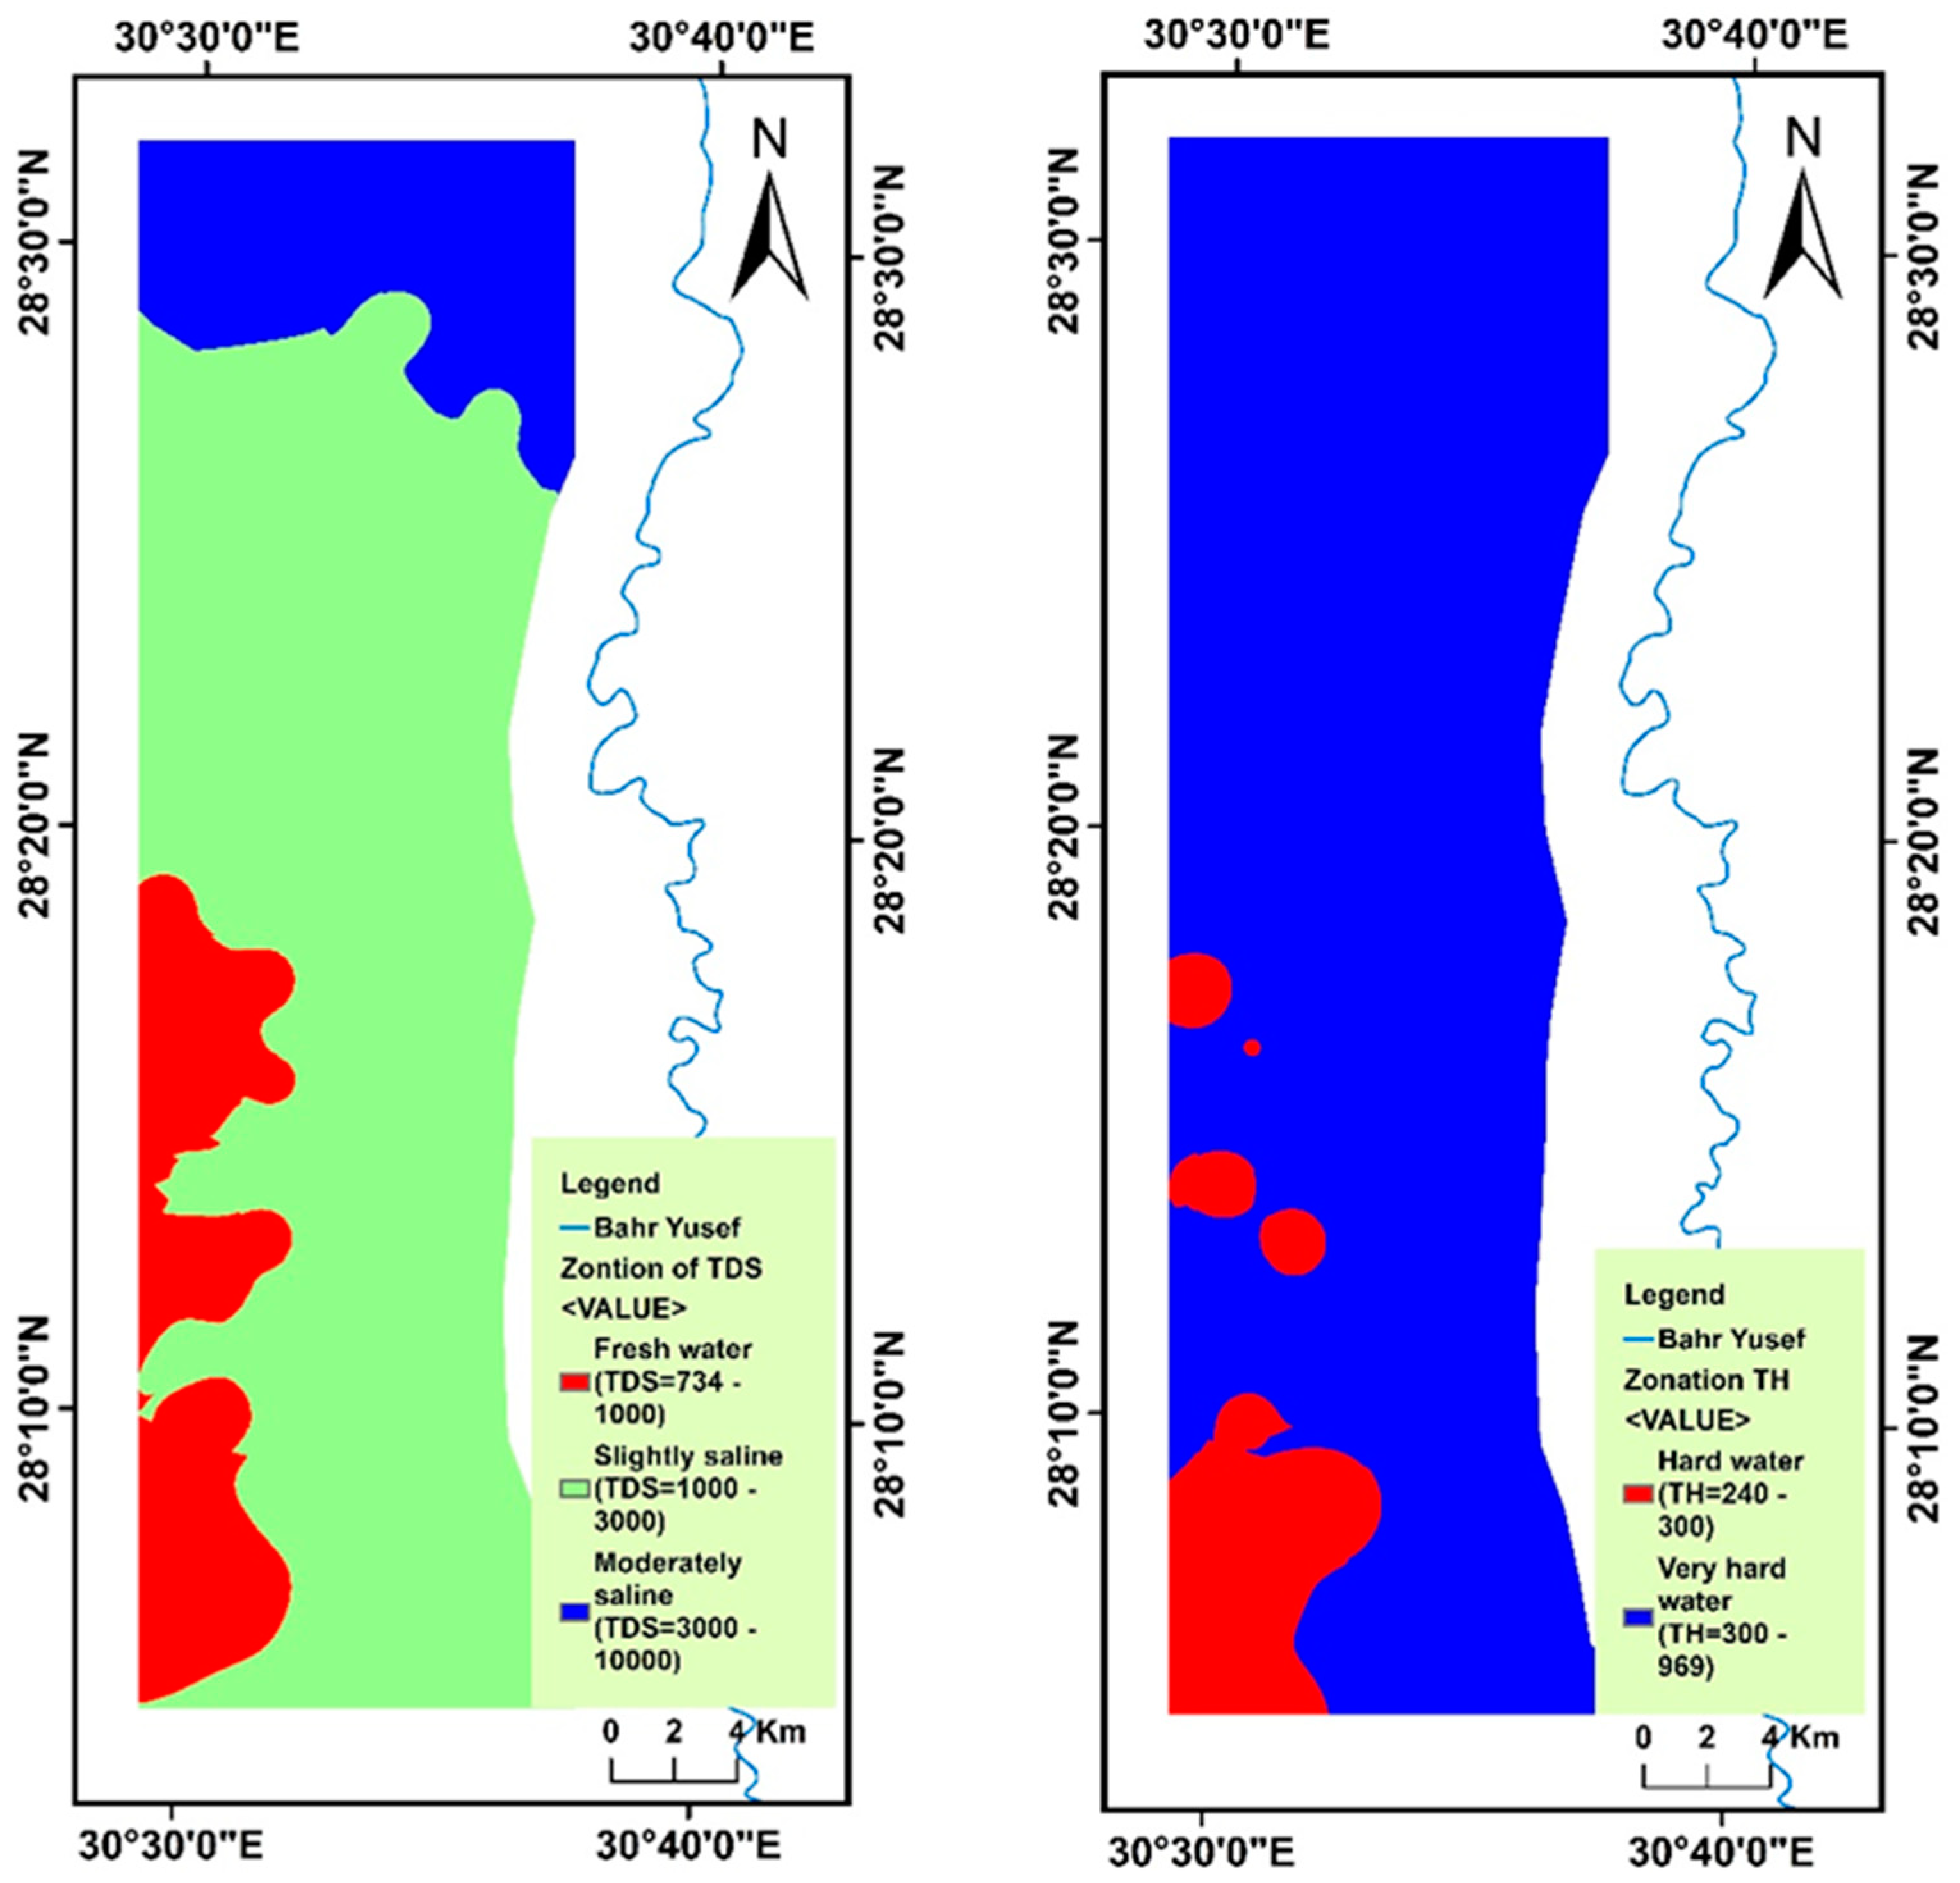
Using Hem classification [53], approximately 22% of the groundwater samples are freshwater, 62% are somewhat saline, and 16% are moderately saline (Table 3). As a result of the low salinity (TDS < 1000 ppm), 78% of water samples are unsuitable due to the high salinity, while only 22% are safe for drinking (TDS > 1000 ppm). Groundwater use for domestic purposes is evaluated by the total hardness and Hem classification [53]. The results indicated that the Eocene water samples are unsuitable for domestic use due to the high amounts of hardness (Table 4). Figure 8 illustrates the TDS and TH value classification zones in the study area. According to TDS zonation, the research region’s western south contains freshwater suitable for drinking, whereas the northern and the rest of the area contain slightly and moderately saline water, respectively. Based on TH zonation, it is clear that most of the groundwater in the area studied is hard, with specific places in the south being extremely hard, and thus unsuitable for home use.

4.7. Evaluation of Groundwater Quality for Irrigation Use

4.7.1. Sodium Absorption Ratio (SAR)

According to sodium, magnesium, and calcium ions concentration, the sodium absorption ratio (SAR) determines the appropriateness of groundwater for irrigation purposes. The permeability of the soil and the uptake of water by plants is affected by high sodium ion concentration [54]. It can harm the soil composition by replacing adsorbed magnesium, and calcium, causing it to become solid and impenetrable, increasing the soil hardness and decreasing the permeability [55]. The sodium adsorption ratio (SAR) is defined by Equation (1) [56]:
S A R = N a / ( C a + M g ) / 2
where all ions are expressed in meq/L.
The SAR value ranges from 2.07 to 26.6 in the study area, with an average of 9.62. Table 5 presents groundwater classification according to SAR values. It was found that 88% of SAR values (<10) fall into the excellent category (low-sodium class (S1)), 12% into the good category (medium-sodium class (S2)), and 10% into the doubtful category (high-sodium class (S3)).
These findings show that groundwater is acceptable for irrigation use in the study area. The distribution of SAR values is presented in Figure 9. The majority of the land is covered by a low alkalinity hazard with excellent water (SAR < 10) and good water (SAR = 10–18) for irrigation usage, with the exception of a small portion in the far northeastern corner (doubtful water, SAR > 18).
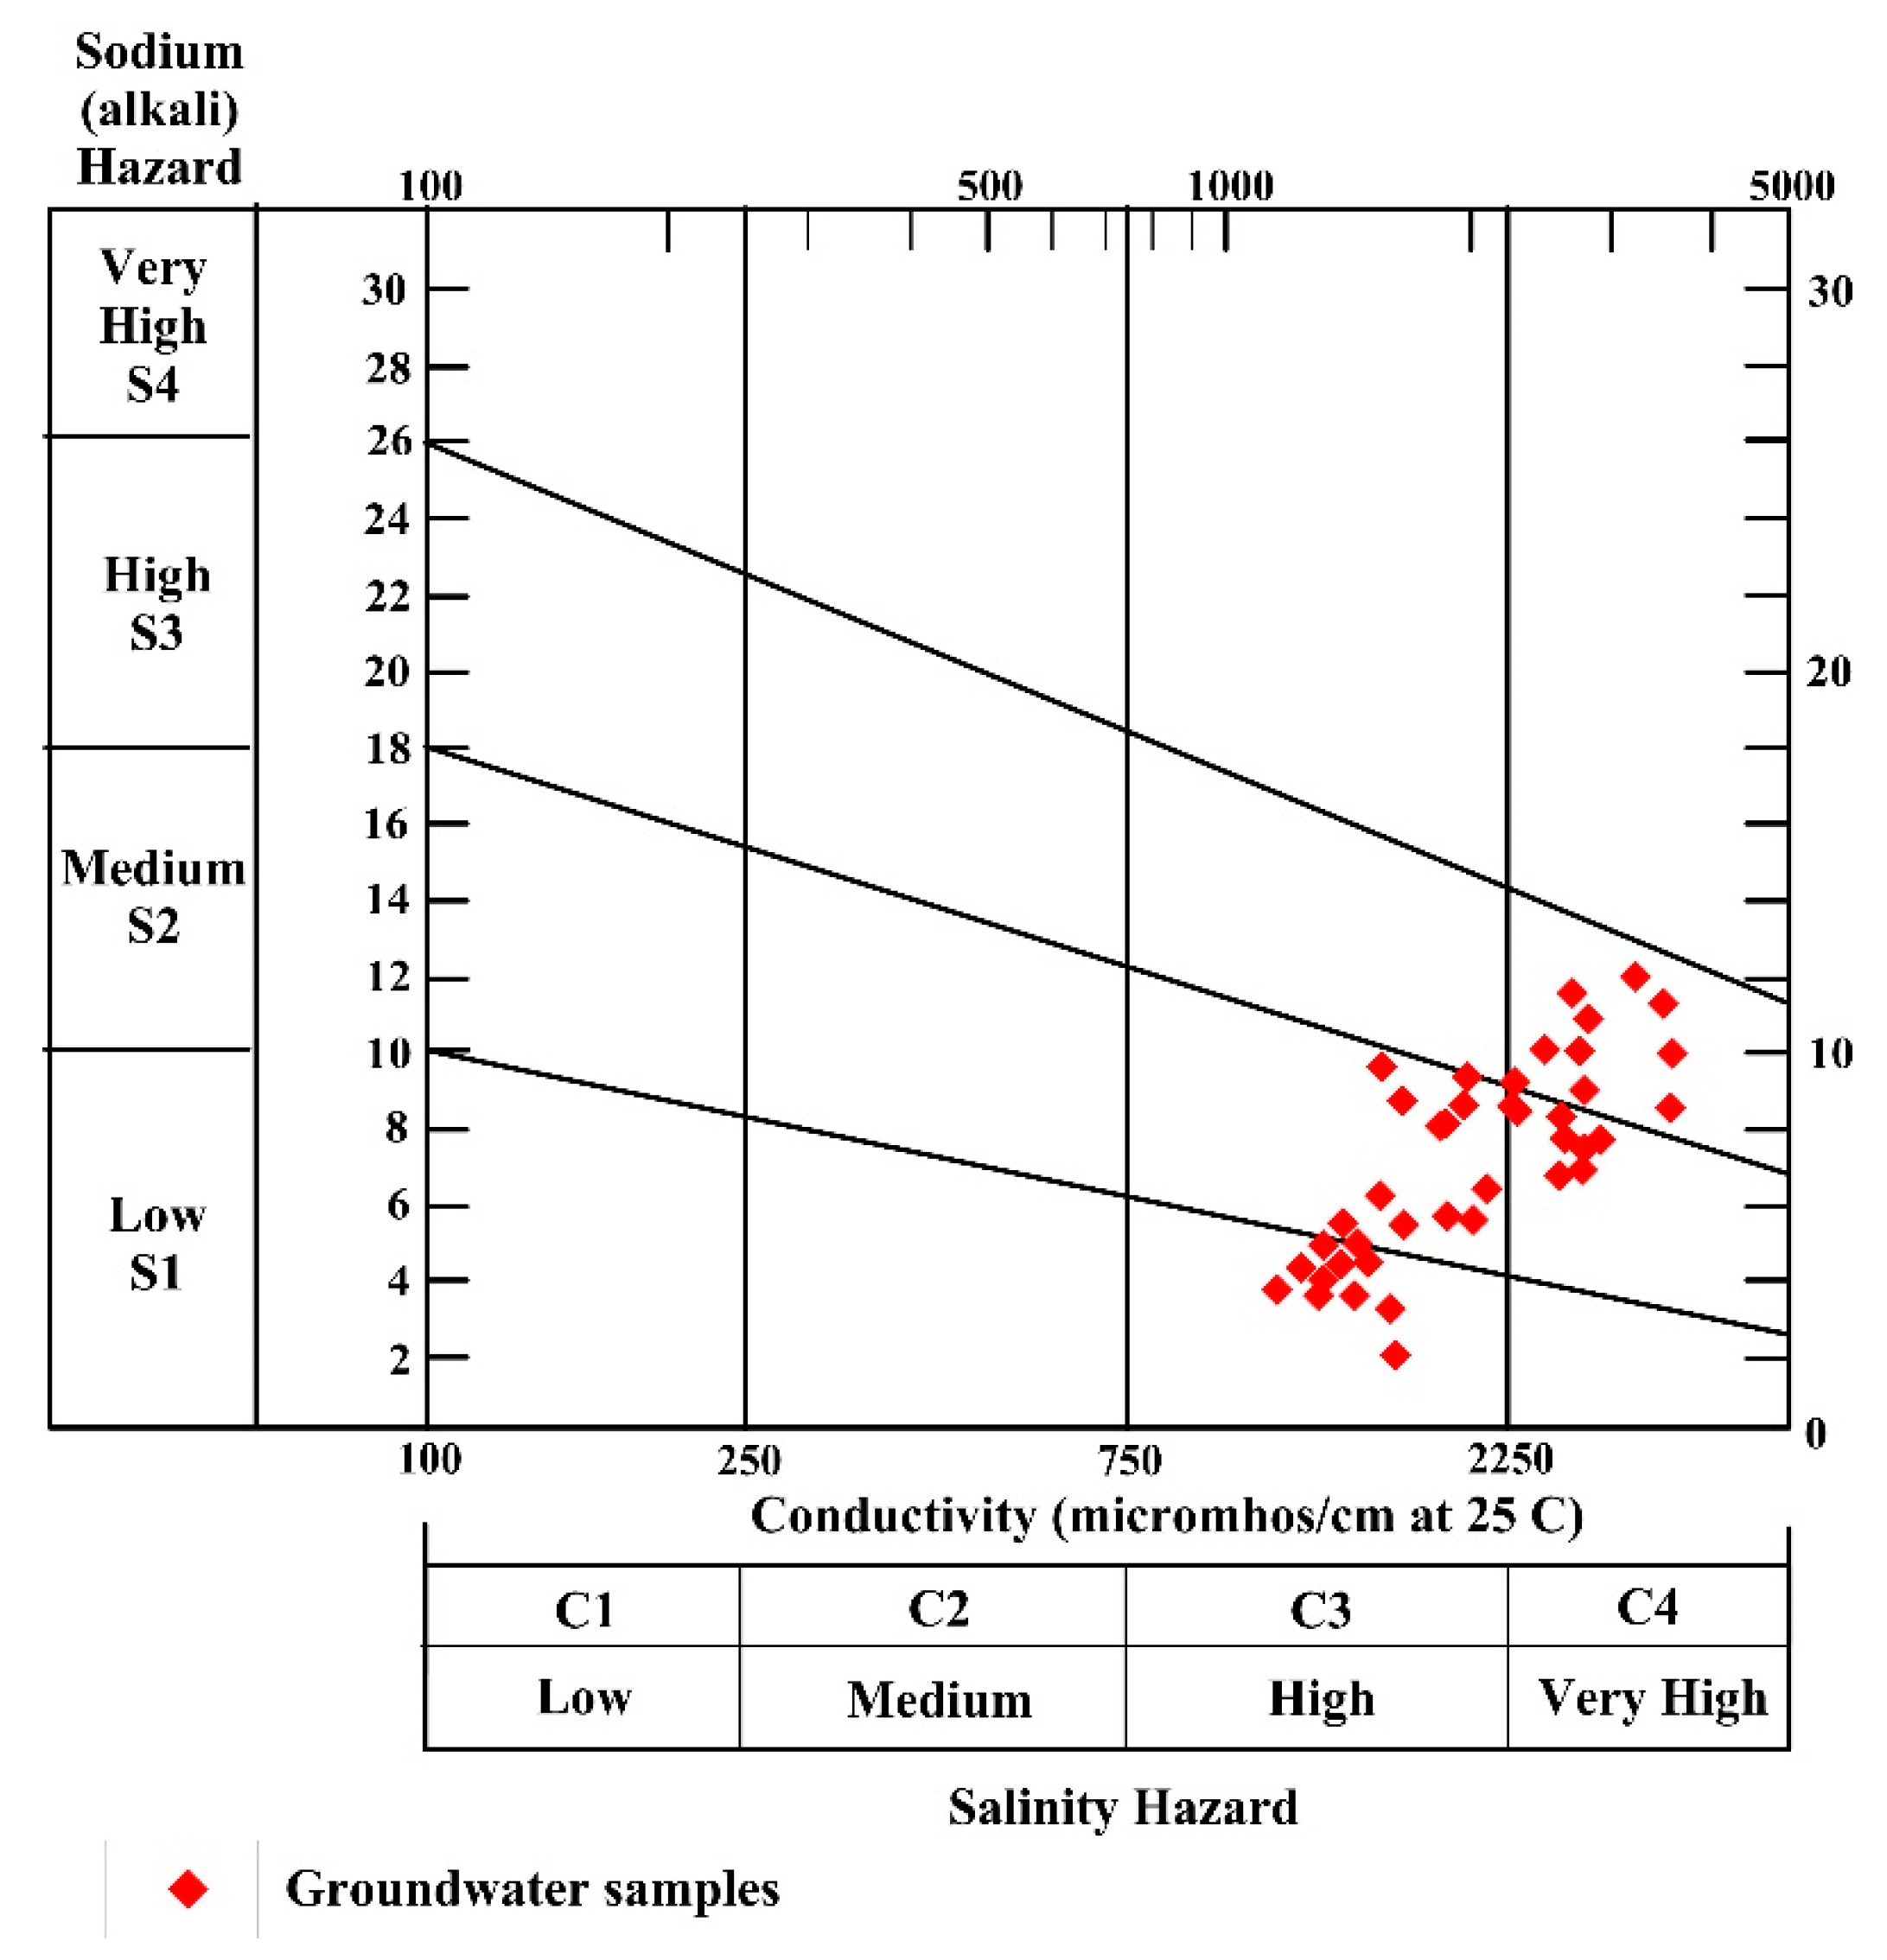
The United States Salinity Laboratory [57] evaluates groundwater quality for irrigation in detail, including the interaction between EC and SAR to designate distinct water classes for agriculture usage regarding sodium and salinity hazards. Figure 10 depicts the analytical groundwater data for the research area on the USSL. C3-S1 (high salinity–low sodium) represented over 23% of the studied samples, C3-S2 (high salinity–low sodium) accounted for 25%, C4-S2 accounted for 18%, and 16% of water samples fell outside the diagram. The salinity hazard in the study area ranges from high to very high, but the sodium hazard is usually low to high, as shown in the diagram. This means that most groundwater samples (84%) are acceptable for irrigation to irrigate most kinds of soil under normal conditions.

4.7.2. Sodium Percentage (Na%)

The sodium percentage is used to assess the groundwater’s sodium risk and decide whether it is suitable for agricultural use. High salt content in irrigation water inhibits soil permeability, impacting plant growth [58]. Equation (2) [59] is applied for the estimation of Na%:
N a % = ( N a + K ) ( C a + M g + N a + K ) × 100
where all ions are expressed in meq/L.
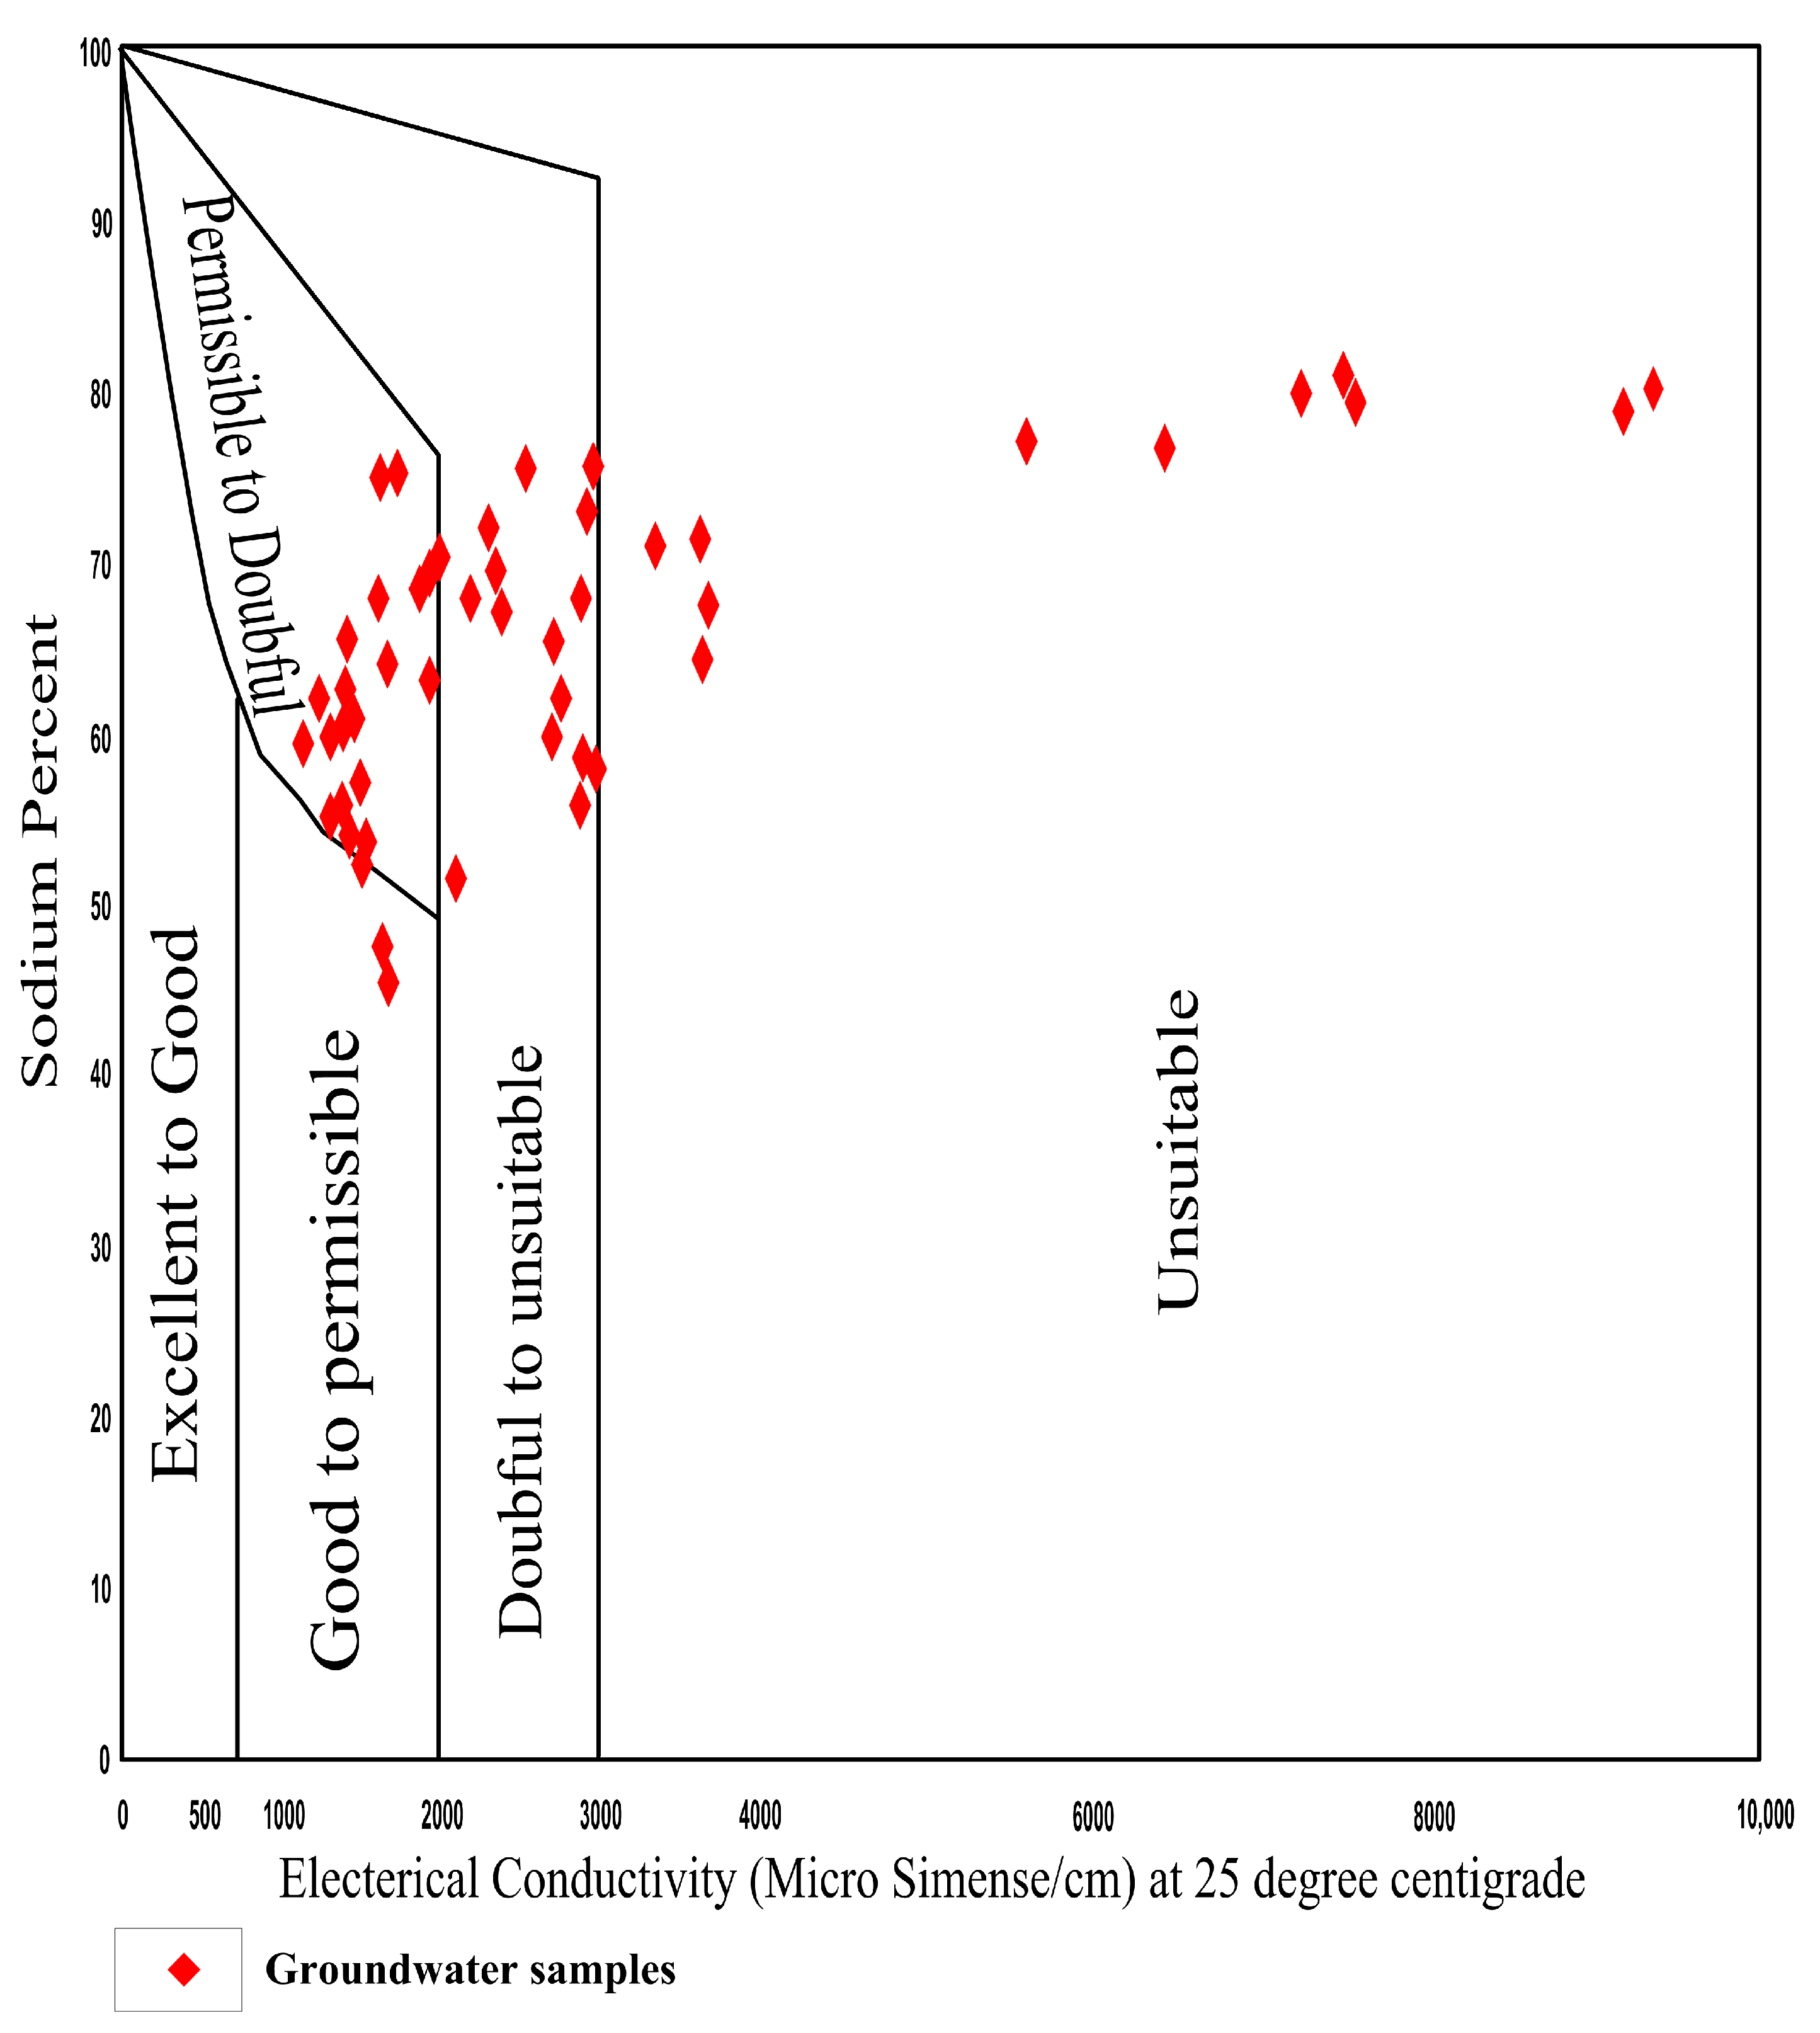
Na% ranged from 46.18 to 81.2 in the area studied, with a mean of 66.49. The Na% shows that only 27% of the samples are appropriate for irrigation use, while 73% are doubtful (Table 6). Groundwater with less than 60% Na content is deemed appropriate for irrigation. The majority of the study area has doubtful water (Na% = 60–80), permissible water (60) in some sites, and unacceptable water (>80) in the far north-eastern section (Figure 9).
The Wilcox diagram [59] explores the relationship between EC and Na% to classify groundwater. Based on the Wilcox diagram (Figure 11), 22% of the water samples in the study area are unsuitable for irrigation use.
While 29% and 45% of the samples fall into the doubtful to unsuitable and permissible to the doubtful category, respectively, which can be used in irrigation after appropriate treatment, 4% fall into the category of good to permissible.

4.7.3. Residual Sodium Carbonate (RSC)

RSC is the term used to describe the relative abundance of sodium as measured by surplus bicarbonate and carbonate over alkaline sediments. It influences the appropriateness of groundwater for irrigation use. It is detrimental to plants above the recommended levels. Equation (3) proposed by [56] was applied to calculate RSC values:
R S C = H C O 3 + C O 3 2 ( C a 2 + + M g 2 + )
where all ions are expressed in meq/L.
RSC varies between 13.77 and 0.57 in the groundwater of the study area, with a mean value of 5.52. An RSC value of 1.25 meq/L was deemed a suitable water class for irrigation, RSC ranging from 1.25 to 2.50 meq/L was considered a dubious water class, and RSC > 2.50 meq/L was considered an undesirable water class for irrigation. All groundwater samples in the study area show RSCs lower than 1.25 (Figure 9), suggesting they can be used for irrigation.

4.7.4. Kelley’s Ratio (KR)

KR is a sodium indicator that monitors the level of sodium in terms of calcium and magnesium in water used in irrigation. Kelley’s ratio [60] is determined using Equation (4):
K R = N a ( C a + M g )
where all ions are expressed in meq/L. KR values in the area vary between 0.49 and 4.2, with an average of 2.06. A KR value of more than 1 indicates that the water contains too much sodium and is unfit for irrigation, whereas a KR of less than 1 indicates the suitability of water for irrigation. With a KR greater than 1, 91% of the groundwater samples cannot be used for irrigation. Figure 9 depicts the distribution of KR values, indicating the unsuitability of groundwater use in irrigation in most of the study area, particularly in the northern section.

4.7.5. Magnesium hazard (MH)

Magnesium hazard (MH) is another tool to assess groundwater’s suitability for irrigation, which is proposed by [61]. Equation (5) was used to determine MH [62]:
M H = M g ( C a + M g ) × 100 ,
where all cations are expressed in meq/L. In the research area, MH’s maximum, minimum, and average values are 38.81, 72.3, and 53.79, respectively. MH greater than 50 is regarded as being unsuitable for irrigation. Thus, 51% of the analyzed water samples are unsuitable for irrigation. Figure 9 presents the MH distribution throughout the research area, indicating that the eastern part is suitable for irrigation while most of the western portion is not.

4.7.6. Permeability Index

Because long-term irrigation water use alters soil permeability, PI evaluates the overall amount of sodium, calcium, magnesium, and bicarbonate in groundwater that could decrease the capacity of the soil for infiltration. Equation (6) was applied to determine the PI [63]:
P I = N a + H C O 3 C a + M g + N a
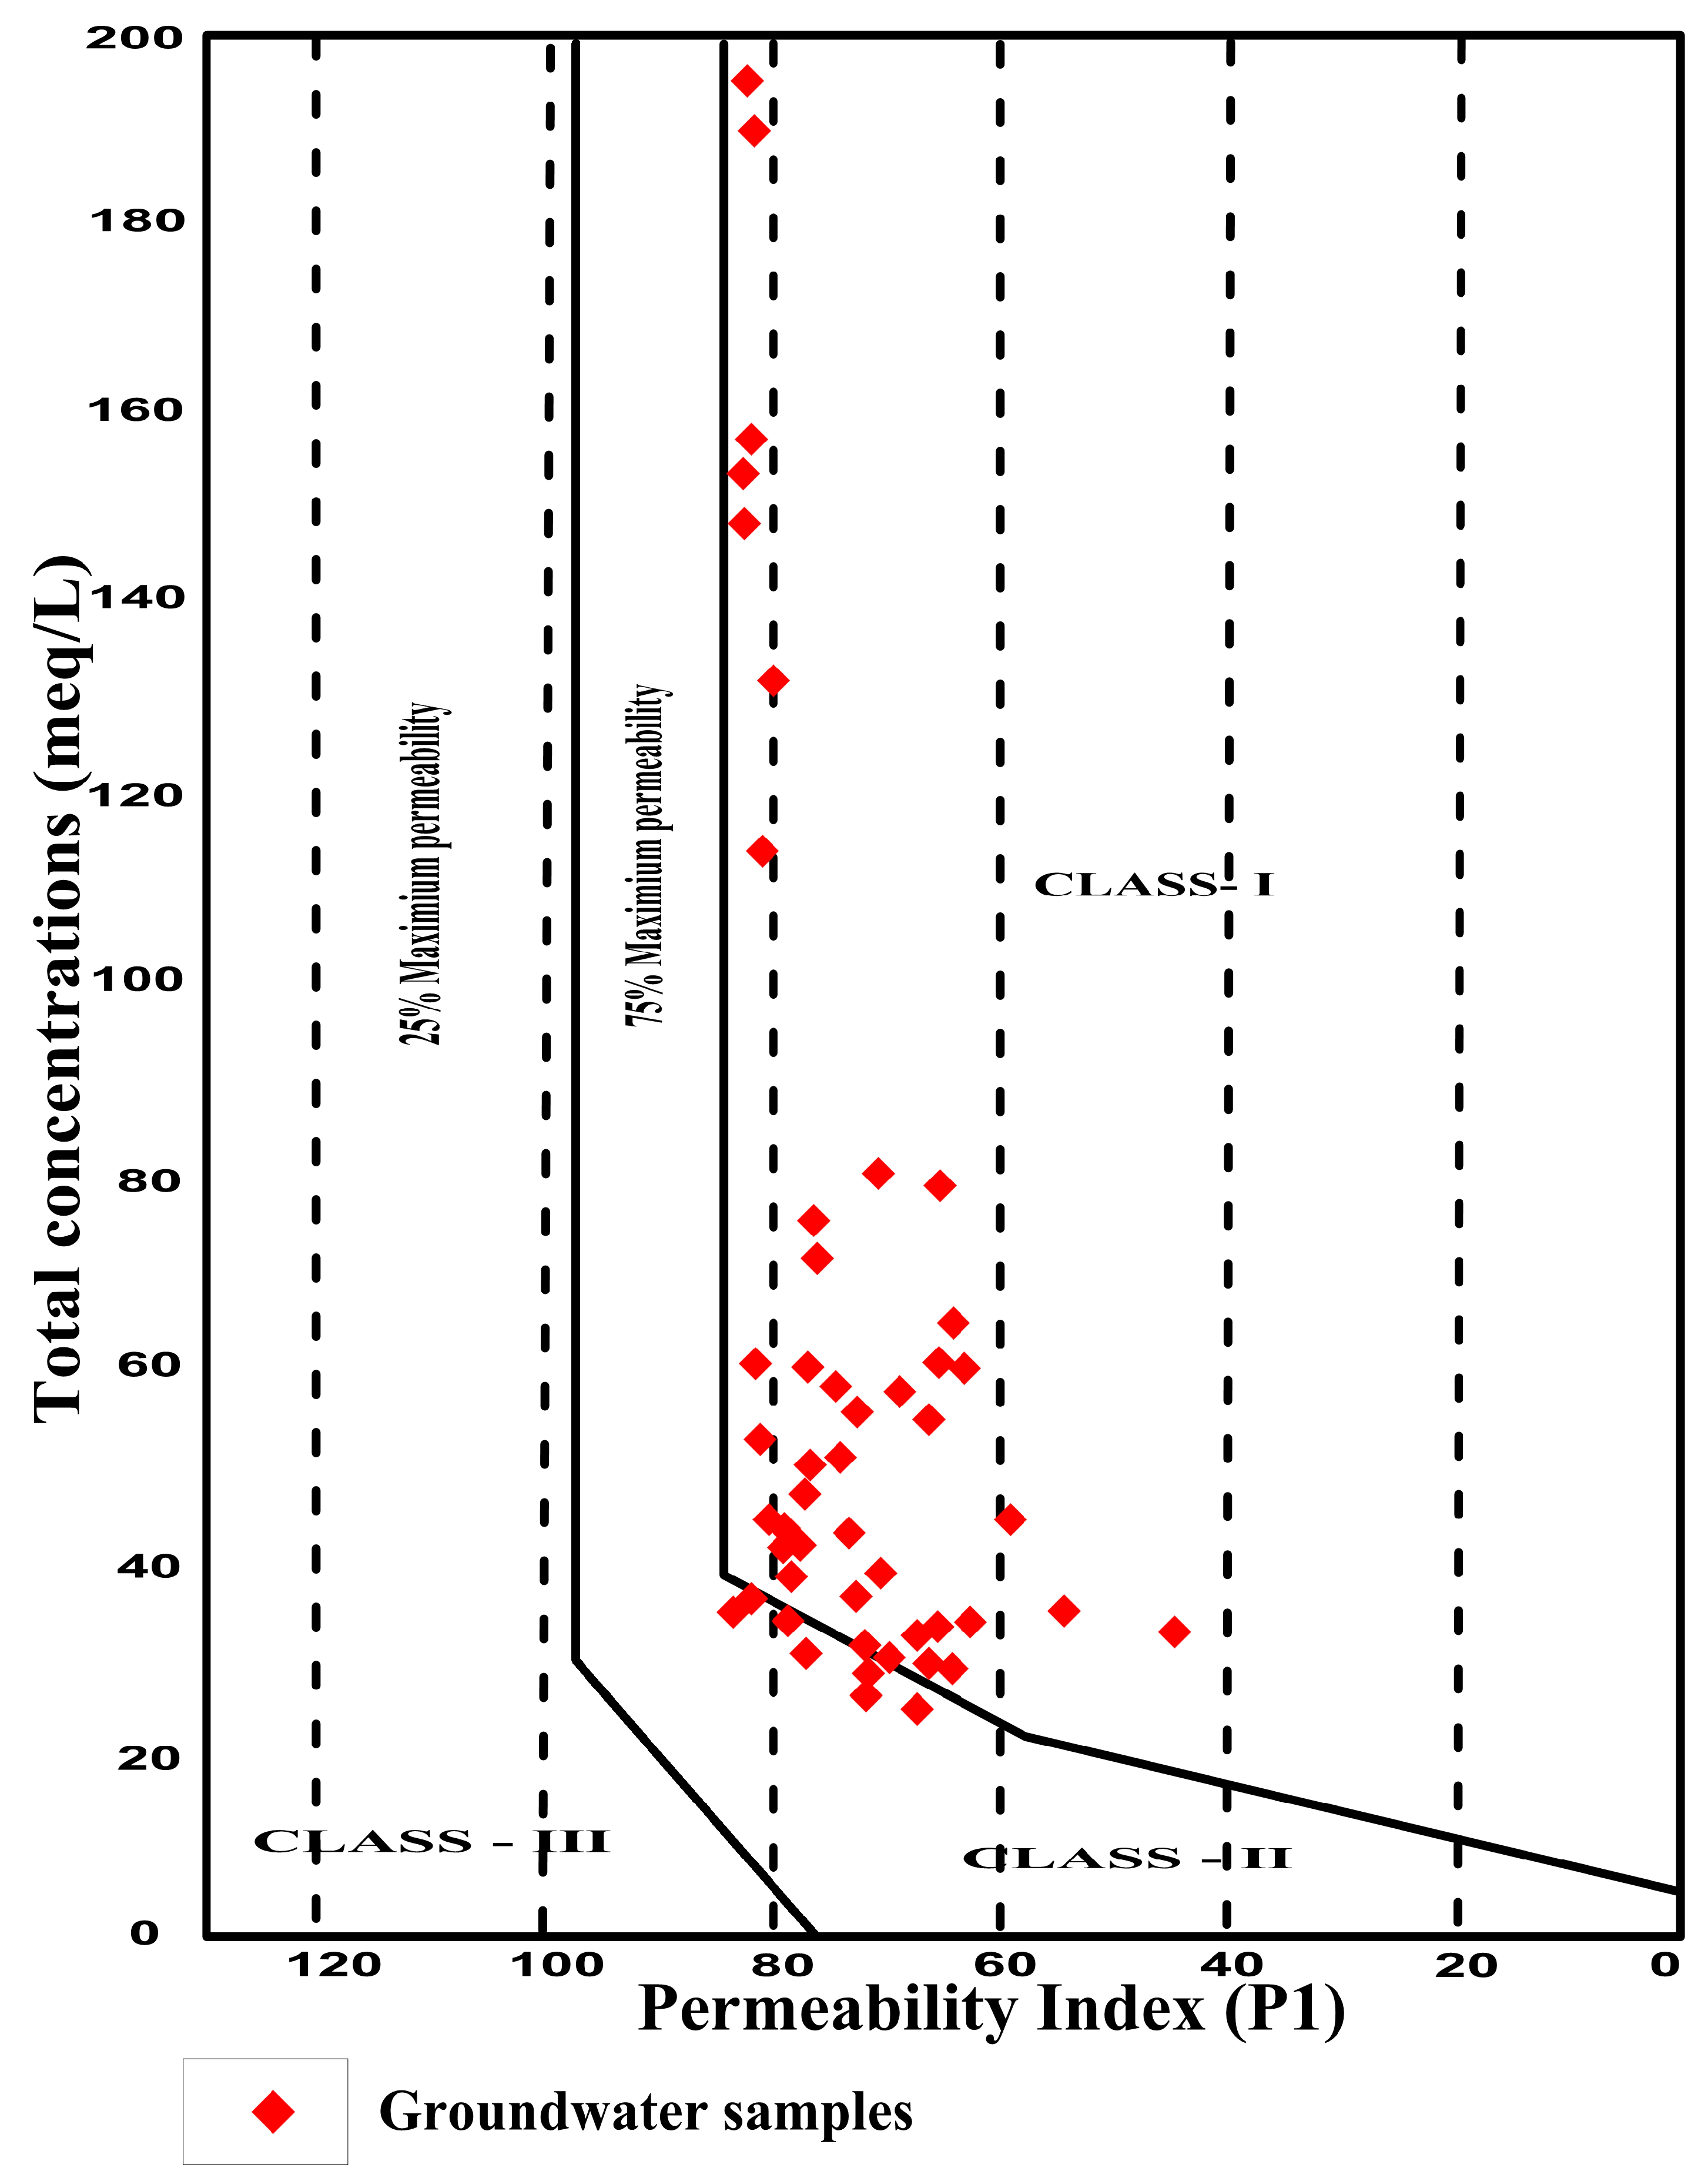
where all ions are in meq/L. PI values are classified into three classes: class I is greater than 75%, class II ranges between 75 and 25%, and class III is less than 25% (Figure 12). Class III is inappropriate due to the extremely low soil permeability properties, whereas classes I and II are acceptable for irrigation uses. PI ranged from 45.07 to 83.73% in the research area, with a mean of 72.98%. Table 7 demonstrates that 47% of the samples are suitable for irrigation, 53% are moderately suitable, and none are unsuitable for irrigation. The distribution of PI in the area is depicted in Figure 9, suggesting that groundwater in the study area is suitable for irrigation use.

5. Conclusions

This research indicates that the dominant cations and anions in groundwater of the area studied are sodium and calcium, chloride, and sulfate. The proportion of the examined groundwater samples exceeding the maximum permissible limit for TDS, Na+, K+, HCO3, Cl, and SO42− are 78%, 73%, 94%, 98%, 88%, and 61%, respectively. Therefore, groundwater treatment is required, especially for drinking use. Strong correlations were observed between EC, TDS, calcium, sodium, chloride, sulfate, and magnesium based on Pearson and Spearman correlations. The multivariate statistical approach using PCA and HCA showed that groundwater geochemistry is mainly influenced by mineral dissolution via water–rock interaction, particularly in the northern part of the study area, due to the presence of the shale layer. The infiltration of irrigation water into the aquifer, excessive usage of fertilizers, and industrial waste disposal, particularly in the western part of the research area, may also impact the groundwater quality. The Gibbs diagram indicates that rock dominates groundwater chemistry in the area, indicating the impact of aquifer lithology on groundwater chemistry. The groundwater quality assessment for drinking and domestic purposes indicates that 22% of the groundwater samples are freshwater, 62% are slightly saline, and 16% are moderately saline. However, all the water samples are deemed unsuitable for domestic use due to their high hardness levels (TH>300 mg/L). Spatial analysis shows that freshwater can be extracted from the southwestern part of the area for drinking, but other locations contain slightly to moderately saline water. Based on SAR, 88% of the samples are in the low-sodium class (S1), indicating excellent irrigation water. Based on Na%, only 27% of the examined water samples are suitable for irrigation, while 73% are classified as doubtful. All the examined groundwater samples are acceptable for irrigation, according to RSC. Regarding KR, 91% of the samples have a value greater than one and are thus unsuitable for irrigation. Regarding MH, 51% of the analyzed water samples are unsuitable for irrigation. All the examined samples fall in the good and moderate PI classes and can be used in irrigation. Based on Wilcox and USSL’s proposed classification system, most samples are permissible to the doubtful zone and can be used for irrigation with proper handling in most soil types under normal circumstances. Overall, the findings of this study suggest that various factors, including natural water–rock interactions, aquifer lithology, and anthropogenic activities, influence groundwater quality in the study area. The high values of hardness and other contaminants render the water unsuitable for domestic use, highlighting the need for treatment before consumption. The irrigation water quality is also affected, with most samples being unsuitable for irrigation due to their high salt content. The spatial maps show that the groundwater quality varies across the study area, and specific locations should be selected for different purposes. However, the results also pose challenging points for managing groundwater resources in the region, which should be addressed through proper planning and implementation of sustainable management practices.

Author Contributions

Conceptualization, E.I., M.G.S. and A.A. (Ahmed Abdelhalim); methodology, E.I., M.G.S., E.E.S. and A.A. (Ahmed Abdelhalim); validation, E.I., D.E.A., D.E.G., A.A. (Ahmed Abdelhalim) and A.A. (Ahmed Ali); data curation, E.I. and A.A. (Ahmed Abdelhalim); writing—review and editing, E.I., A.A. (Ahmed Abdelhalim), D.E.A., D.E.G., A.A. (Ahmed Ali) and M.S.A.; visualization, E.I., D.E.A., D.E.G. and M.S.A.; supervision, E.I., E.E.S., G.H. and D.E.A. All authors have read and agreed to the published version of the manuscript.

Funding

This work is funded by the Researchers Supporting Project number (RSP2023R455), King Saud University, Riyadh, Saudi Arabia.

Data Availability Statement

This article has no associated data, and all the data used in this study are present in the article.

Acknowledgments

The editor and the anonymous reviewers are thanked for their constructive comments which enhanced the manuscript. This work is funded by Researchers Supporting King Saud University, Riyadh, Saudi Arabia.

Conflicts of Interest

The authors declare no conflict of interest.

References

  1. Alexakis, D.; Gotsis, D.; Giakoumakis, S. Assessment of drainage water quality in pre- and post-irrigation seasons for supplemental irrigation use. Environ. Monit. Assess. 2012, 184, 5051–5063. [Google Scholar] [CrossRef] [PubMed]
  2. Bekas, G.K.; Alexakis, D.E.; Gamvroula, D.E. Forecasting discharge rate and chloride content of karstic spring water by applying the Levenberg–Marquardt algorithm. Environ. Earth Sci. 2021, 80, 404. [Google Scholar] [CrossRef]
  3. Gamvroula, D.; Alexakis, D.; Stamatis, G. Diagnosis of groundwater quality and assessment of contamination sources in the Megara basin (Attica, Greece). Arab. J. Geosci. 2013, 6, 2367–2381. [Google Scholar] [CrossRef]
  4. Gamvroula, D.E.; Alexakis, D.E. Evaluating the Performance of Water Quality Indices: Applicationin Surface Waterof Lake Union, Washington State-USA. Hydrology 2022, 9, 116. [Google Scholar] [CrossRef]
  5. Tsitsis, C.; Alexakis, D.E.; Moustris, K.; Gamvroula, D.E. Combining Artificial Neural Network and Driver–Pressure–State–Impact–Response Approach for Evaluating a Mediterranean Lake. Water 2023, 15, 266. [Google Scholar] [CrossRef]
  6. Latha, P.S.; Rao, K.N.; Kumar, P.V. Hydrochemical evaluation of subsurface water in the aquaculture region of coastal India using multivariate statistics, GWQI and GIS. Int. J. Energy Water Resour. 2022, 1–21. [Google Scholar] [CrossRef]
  7. Sajjad, M.M.; Wang, J.; Abbas, H.; Ullah, I.; Khan, R.; Ali, F. Impact of Climate and Land-Use Changeon Ground water Resources, Study of Faisalabad District, Pakistan. Atmosphere 2022, 13, 1097. [Google Scholar] [CrossRef]
  8. Alexakis, D.E. Linking DPSIR model and water quality indices to achieve sustainable development goals in groundwater resources. Hydrology 2021, 8, 90. [Google Scholar] [CrossRef]
  9. Stamatis, G.; Alexakis, D.; Gamvroula, D.; Migiros, G. Groundwater quality assessment in Oropos-Kalamos basin, Attica, Greece. Environ. Earth Sci. 2011, 64, 973–988. [Google Scholar] [CrossRef]
  10. Giakoumakis, S.; Alexakis, D.; Gotsis, D. An approximate method for estimating nutrient loads in drainage water from a coastal irrigated area. Earth Sci. Res. J. 2013, 17, 115–118. [Google Scholar]
  11. Alexakis, D.; Kiskira, K.; Gamvroula, D.; Emmanouil, C.; Psomopoulos, C. Evaluating toxic element contamination sources in groundwater bodies of two Mediterranean sites. Environ. Sci. Pollut. Res. 2021, 28, 34400–34409. [Google Scholar] [CrossRef] [PubMed]
  12. Gautam, S.K.; Maharana, C.; Sharma, D.; Singh, A.K.; Tripathi, J.K.; Singh, S.K. Evaluation of groundwater quality in the Chotanagpur plateau region of the Subarnarekha river basin, Jharkhand State, India. Sustain. Water Qual. Ecol. 2015, 6, 57–74. [Google Scholar] [CrossRef]
  13. WHO; UNICEF. Progress on Household Drinking Water, Sanitation and Hygiene 2000–2020: Years into the SDGs; World Health Organisation and United Nations Children Fund 2021: Geneva, Switzerland, 2021. [Google Scholar]
  14. Nag, S.K.; Das, S. Quality assessment of groundwater with special emphasis on irrigation and domestic suitability in suri I & II Blocks, Birbhum District, West Bengal, India. Am. J. Water. Res. 2014, 2, 81–98. [Google Scholar]
  15. Honarbakhsh, A.; Tahmoures, M.; Tashayo, B.; Mousazadeh, M.; Ingram, B.; Ostovari, Y. GIS-based assessment of groundwater quality for drinking purposes in northern part of Fars province, Marvdasht. J. Water Supply Res. Technol. Aqua 2019, 68, 187–196. [Google Scholar] [CrossRef]
  16. Mukherjee, I.; Singh, U.K.; Chakma, S. Evaluation of groundwater quality for irrigation water supply using multi-criteria decision-making techniques and GIS in an agroeconomic tract of Lower Ganga basin, India. J. Environ. Manag. 2022, 309, 114691. [Google Scholar] [CrossRef] [PubMed]
  17. Pandey, K.; Kumar, S.; Malik, A.; Kuriqi, A. Artificial neural network optimized with a genetic algorithm for seasonal groundwater table depth prediction in Uttar Pradesh, India. Sustainability 2020, 12, 8932. [Google Scholar] [CrossRef]
  18. ElBaba, M.; Kayastha, P.; Huysmans, M.; DeSmedt, F. Evaluation of the Groundwater Quality Using the Water Quality Index and Geostatistical Analysis in the Dieral-Balah Governorate, Gaza Strip, Palestine. Water 2020, 12, 262. [Google Scholar] [CrossRef] [Green Version]
  19. BenMoussa, A.; Chandoul, S.; Mzali, H.; BelHajSalem, S.; Elmejri, H.; Zouari, K.; Hafiane, A.; Mrabet, H. Hydrogeochemistry and evaluation of groundwater suitability for irrigation purpose in the Mornag region, northeastern Tunisia. Environ. Dev. Sustain. 2021, 23, 2698–2718. [Google Scholar] [CrossRef]
  20. Shadrin, D.; Nikitin, A.; Tregubova, P.; Terekhova, V.; Jana, R.; Matveev, S.; Pukalchik, M. An Automated Approach to Groundwater Quality Monitoring—Geospatial Mapping Based on Combined Application of Gaussian Process Regression and Bayesian Information Criterion. Water 2021, 13, 400. [Google Scholar] [CrossRef]
  21. Chen, K.; Liu, Q.; Peng, W.; Liu, X. Source apportionment and natural background levels of major ions in shallow groundwater using multivariate statistical method: A case study in Huaibei Plain, China. J. Environ. Manag. 2022, 301, 113806. [Google Scholar] [CrossRef]
  22. Farid, H.U.; Ayub, H.U.; Khan, Z.M.; Ahmad, I.; Anjum, M.N.; Kanwar, R.M.A.; Mubeen, M.; Sakinder, P. Groundwater quality risk assessment using hydro-chemical and geospatial analysis. Environ. Dev. Sustain. 2022, 25, 8343–8365. [Google Scholar] [CrossRef]
  23. ElOsta, M.; Masoud, M.; Lqarawy, A.; Elsayed, S.; Gad, M. Groundwater Suitability for Drinking and Irrigation Using Water Quality Indices and Multivariate Modeling in Makkah Al-Mukarramah Province, Saudi Arabia. Water 2022, 14, 483. [Google Scholar] [CrossRef]
  24. El-Kholy, R.A.; Zaghlool, E.; Isawi, H.; Soliman, E.A.; Khalil, M.M.; El-Aassar, A.H.M.; Said, M.M. Groundwater quality assessment using water quality index and multivariate statistical analysis case study: East Matrouh, Northwestern coast, Egypt. Environ. Sci. Pollut. Res. 2022, 29, 65699–65722. [Google Scholar] [CrossRef]
  25. Selvakumar, S.; Chandrasekar, N.; Srinivas, Y.; Selvam, S.; Kaliraj, S.; Magesh, N.S.; Venkatramanan, S. Hydrogeochemical processes controlling the groundwater salinity in the coastal aquifers of Southern Tamil Nadu, India. Mar. Pollut. Bull. 2022, 174, 113264. [Google Scholar] [CrossRef] [PubMed]
  26. Ismail, E.; El-Sayed, E.; Sakr, S.; Youssef, E. Characteristic of groundwater potentialities in West Nile Valley South, Minia Governorate, Egypt. Arab. J. Geosci. 2017, 10, 521. [Google Scholar] [CrossRef]
  27. Ismail, E.; Abdelhalim, A.; AbouHeleika, M. Hydrochemical characteristics and quality assessment of groundwater aquifers northwest of Assiut district, Egypt. J. Afr. Earth Sci. 2021, 181, 104260. [Google Scholar] [CrossRef]
  28. Ismail, E.; El-Rawy, M. Assessment of groundwater quality in West Sohag, Egypt. Desal. Wat. Treat. 2018, 123, 101–108. [Google Scholar] [CrossRef]
  29. Abd-Elaty, I.; Pugliese, L.; Zelenakova, M.; Mesaros, P.; Shinawi, A.E. Simulation-based solutions reducing soil and groundwater contamination from fertilizers in arid and semi-arid regions: Case study the eastern Nile delta, Egypt. Int. J. Environ. Res. Publ. Health 2020, 17, 9373. [Google Scholar] [CrossRef]
  30. Snousy, M.G.; Ismail, E.; Zaki, R. Trace element occurrence and distribution problems in the irrigation water at El-Minia district, north upper Egypt. Arab. J. Geosci. 2019, 12, 582. [Google Scholar] [CrossRef]
  31. Geriesh, M.H.; Mansour, B.M.H.; Farouk, H. Assessment of drinking water quality along Port Said Canal treatment plants, Suez Canal corridor, Egypt. Arab. J. Geosci. 2019, 12, 738. [Google Scholar] [CrossRef]
  32. Abdelhalim, A.; Sefelnasr, A.; Ismail, E. Numerical modeling technique for groundwater management in Samalutcity, Minia Governorate, Egypt. Arab. J. Geosci. 2019, 12, 124. [Google Scholar] [CrossRef]
  33. Abdelhalim, A.; Sefelnasr, A.; Ismail, E. Response of the interaction between surface water and groundwater to climate change and proposed megastructure. J. Afr. Earth Sci. 2020, 162, 103723. [Google Scholar] [CrossRef]
  34. Abdalazem, A.H.; Gamee, M.A.; Hamdan, A.; Awad, A.A.M.; Mohamed, A.G. Groundwater quality assessment for irrigation in West Edfuregion, Aswan, Egypt. Assiut J. Agric. Sci. 2020, 51, 125–149. [Google Scholar]
  35. Sharaky, A.M.; Abdoun, S.H. Assessment of groundwater quality in bahariyaoasis, westerndesert, Egypt. Environ. Earth Sci. 2020, 79, 145. [Google Scholar] [CrossRef]
  36. Snousy, M.G.; Wu, J.; Su, F.; Abdelhalim, A.; Ismail, E. Groundwater Quality and Its Regulating Geochemical Processes in Assiut Province, Egypt. Expo.Health 2022, 14, 305–323. [Google Scholar] [CrossRef]
  37. Omara, S.; El-Tahlawi, M.R.; Mansour, H.H. The geology of the environs of Assiut. Bull. Soc. Geograph. Egypt 1970, 8, 43. [Google Scholar]
  38. Osman, H.Z. Geological Studies on the Northwest of Assiut, Egypt. Ph.D. Thesis, Assiut University, Asyut, Egypt, 1980. [Google Scholar]
  39. CONOCO. Geological Maps of Egypt Scale 1: 500,000; Sheet Nos. NG36NW Cairo; The Egyptian General Petroleum Corporation: Cairo, Egypt, 1987. [Google Scholar]
  40. Said, R. The Geology of Egypt; Balkema Publ.: Rotterdam, The Netherlands, 1990; p. 734. [Google Scholar]
  41. AbouHeleika, M.M.; Niesner, E. Configuration of the limestone aquifers in the central part of Egypt using electrical measurements. Hydrogeology 2009, 17, 433–446. [Google Scholar] [CrossRef]
  42. Abdelhalim, A.; Howard, G.; Howden, N.J.K.; Ahmed, M.S.; Ismail, E. Carcinogenic and non-carcinogenic health risk assessment of heavy metals contamination in groundwater in the west of Miniaarea, Egypt. Hum. Ecol. Risk Assess. Int. J. 2022, 29, 571–596. [Google Scholar] [CrossRef]
  43. APHA. Standard Methods for the Examination of Water and Waste water, 22nd ed.; American Public Health Association: Washington, DC, USA, 2012; p. 1496. [Google Scholar]
  44. APHA. Standard Methods of Analysis of Water, Wastewater, 14th ed.; American Public Health Association: Washington, DC, USA, 2005; p. 1457. [Google Scholar]
  45. WHO. Guidelines for Drinking-Water Quality: Fourth Edition Incorporating the First Addendum; World Health Organization: Geneva, Switzerland, 2017; Licence: CCBY-NC-SA3.0IGO. [Google Scholar]
  46. Tiwari, K.; Goyal, R.; Sarkar, A. GIS-based spatial distribution of groundwater quality and regional suitability evaluation for drinking water. Environ. Proc. 2017, 4, 645–662. [Google Scholar] [CrossRef]
  47. Duarte, L.B.C.B.; Gonçalves, J.A.A.P.; Teodoro, A.C. Open-Source GIS Tools: Two Environmental Applications. Front. Inf. Syst. GIS—Overv. Appl. 2018, 1, 102. [Google Scholar] [CrossRef]
  48. Zolekar, R.B.; Bhagat, V.S. Multi-criteria land suitability analysis for agriculture in hilly zone: Remote sensing and GIS approach. Comput. Electron. Agric. 2018, 118, 300–321. [Google Scholar] [CrossRef]
  49. El-Rawy, M.; Ismail, E.; Abdalla, O. Assessment of groundwater quality using GIS, hydrogeochemistry, and factor statistical analysis in Qena Governorate, Egypt. Desalination Water Treat. 2019, 162, 14–29. [Google Scholar] [CrossRef]
  50. Raju, N.J.; Ram, P.; Dey, S. Groundwater quality in the lower Varuna river basin, Varanasi district, Uttar Pradesh. J. Geol. Soc. India 2009, 73, 178–192. [Google Scholar] [CrossRef]
  51. Piper, A.M. A Graphical Interpretation of Water Analysis. Eos. Trans. Am. Geophys. Union 1944, 25, 914–928. [Google Scholar] [CrossRef]
  52. Gibbs, R.J. Mechanisms controlling world water chemistry. Science 1970, 170, 1088–1090. [Google Scholar] [CrossRef] [PubMed]
  53. Hem, J.D. Study and interpretation of the chemical characteristics of natural water. USGS Water-Supply Pap. 1985, 2254, 19–32. [Google Scholar] [CrossRef]
  54. Kumar, P.S.; Balamurugan, P. Suitability of groundwater for irrigation purpose in Omalur Taluk, Salem, Tamil Nadu, India. Indian J. Ecol. 2019, 46, 1–6. [Google Scholar]
  55. Tijani, M.N. Hydrogeochemical assessment of groundwater in Moro area, Kwara State, Nigeria. Environ. Geol. 1994, 24, 194–202. [Google Scholar] [CrossRef]
  56. Richards, L.A. Diagnosis and Improvement of Saline and Alkali Soils, Agriculture Handbook; US Department of Agriculture: Washington, DC, USA, 1954; p. 160. [Google Scholar] [CrossRef]
  57. United States Salinity Laboratory (USSL). Diagnosis and Improvement of Saline and Alkaline Soils; Handbook No. 60; US Department of Agriculture: Washington, DC, USA, 1954; p. 160. [CrossRef]
  58. Amiri, V.; Sohrabi, N.; Dadgar, M.A. Evaluation of groundwater chemistry and its suitability for drinking and agricultural uses in the Lenjanat plain, central Iran. Environ. Earth Sci. 2015, 74, 6163–6176. [Google Scholar] [CrossRef]
  59. Wilcox, L.V. Classification and Use of Irrigation Waters; Circular 969; US Department of Agriculture: Washington, DC, USA, 1955; p. 19. [Google Scholar]
  60. Kelley, W.P. Permissible composition and concentration of irrigation waters. Am. Soc. Civ. Eng. 1963, 66, 607–613. [Google Scholar] [CrossRef]
  61. Szabolcs, I.; Darab, C. The influence of irrigation water of high sodium carbonate content of soils. In Proceedings of the 8th International Congress of ISSS, Bucharest, Romania, 8 August 1964; pp. 802–812. [Google Scholar]
  62. Paliwal, K.V. Irrigation with Saline Water, Monogram No.2 (New Series); IARI: NewDelhi, India, 1972; p. 198. [Google Scholar]
  63. Doneen, I.D. Noteson Water Quality in Agriculture; Published as a Water Science and Engineering. Paper 4001; Department of Water Sciences and Engineering, University of California: Berkeley, CA, USA, 1964. [Google Scholar]
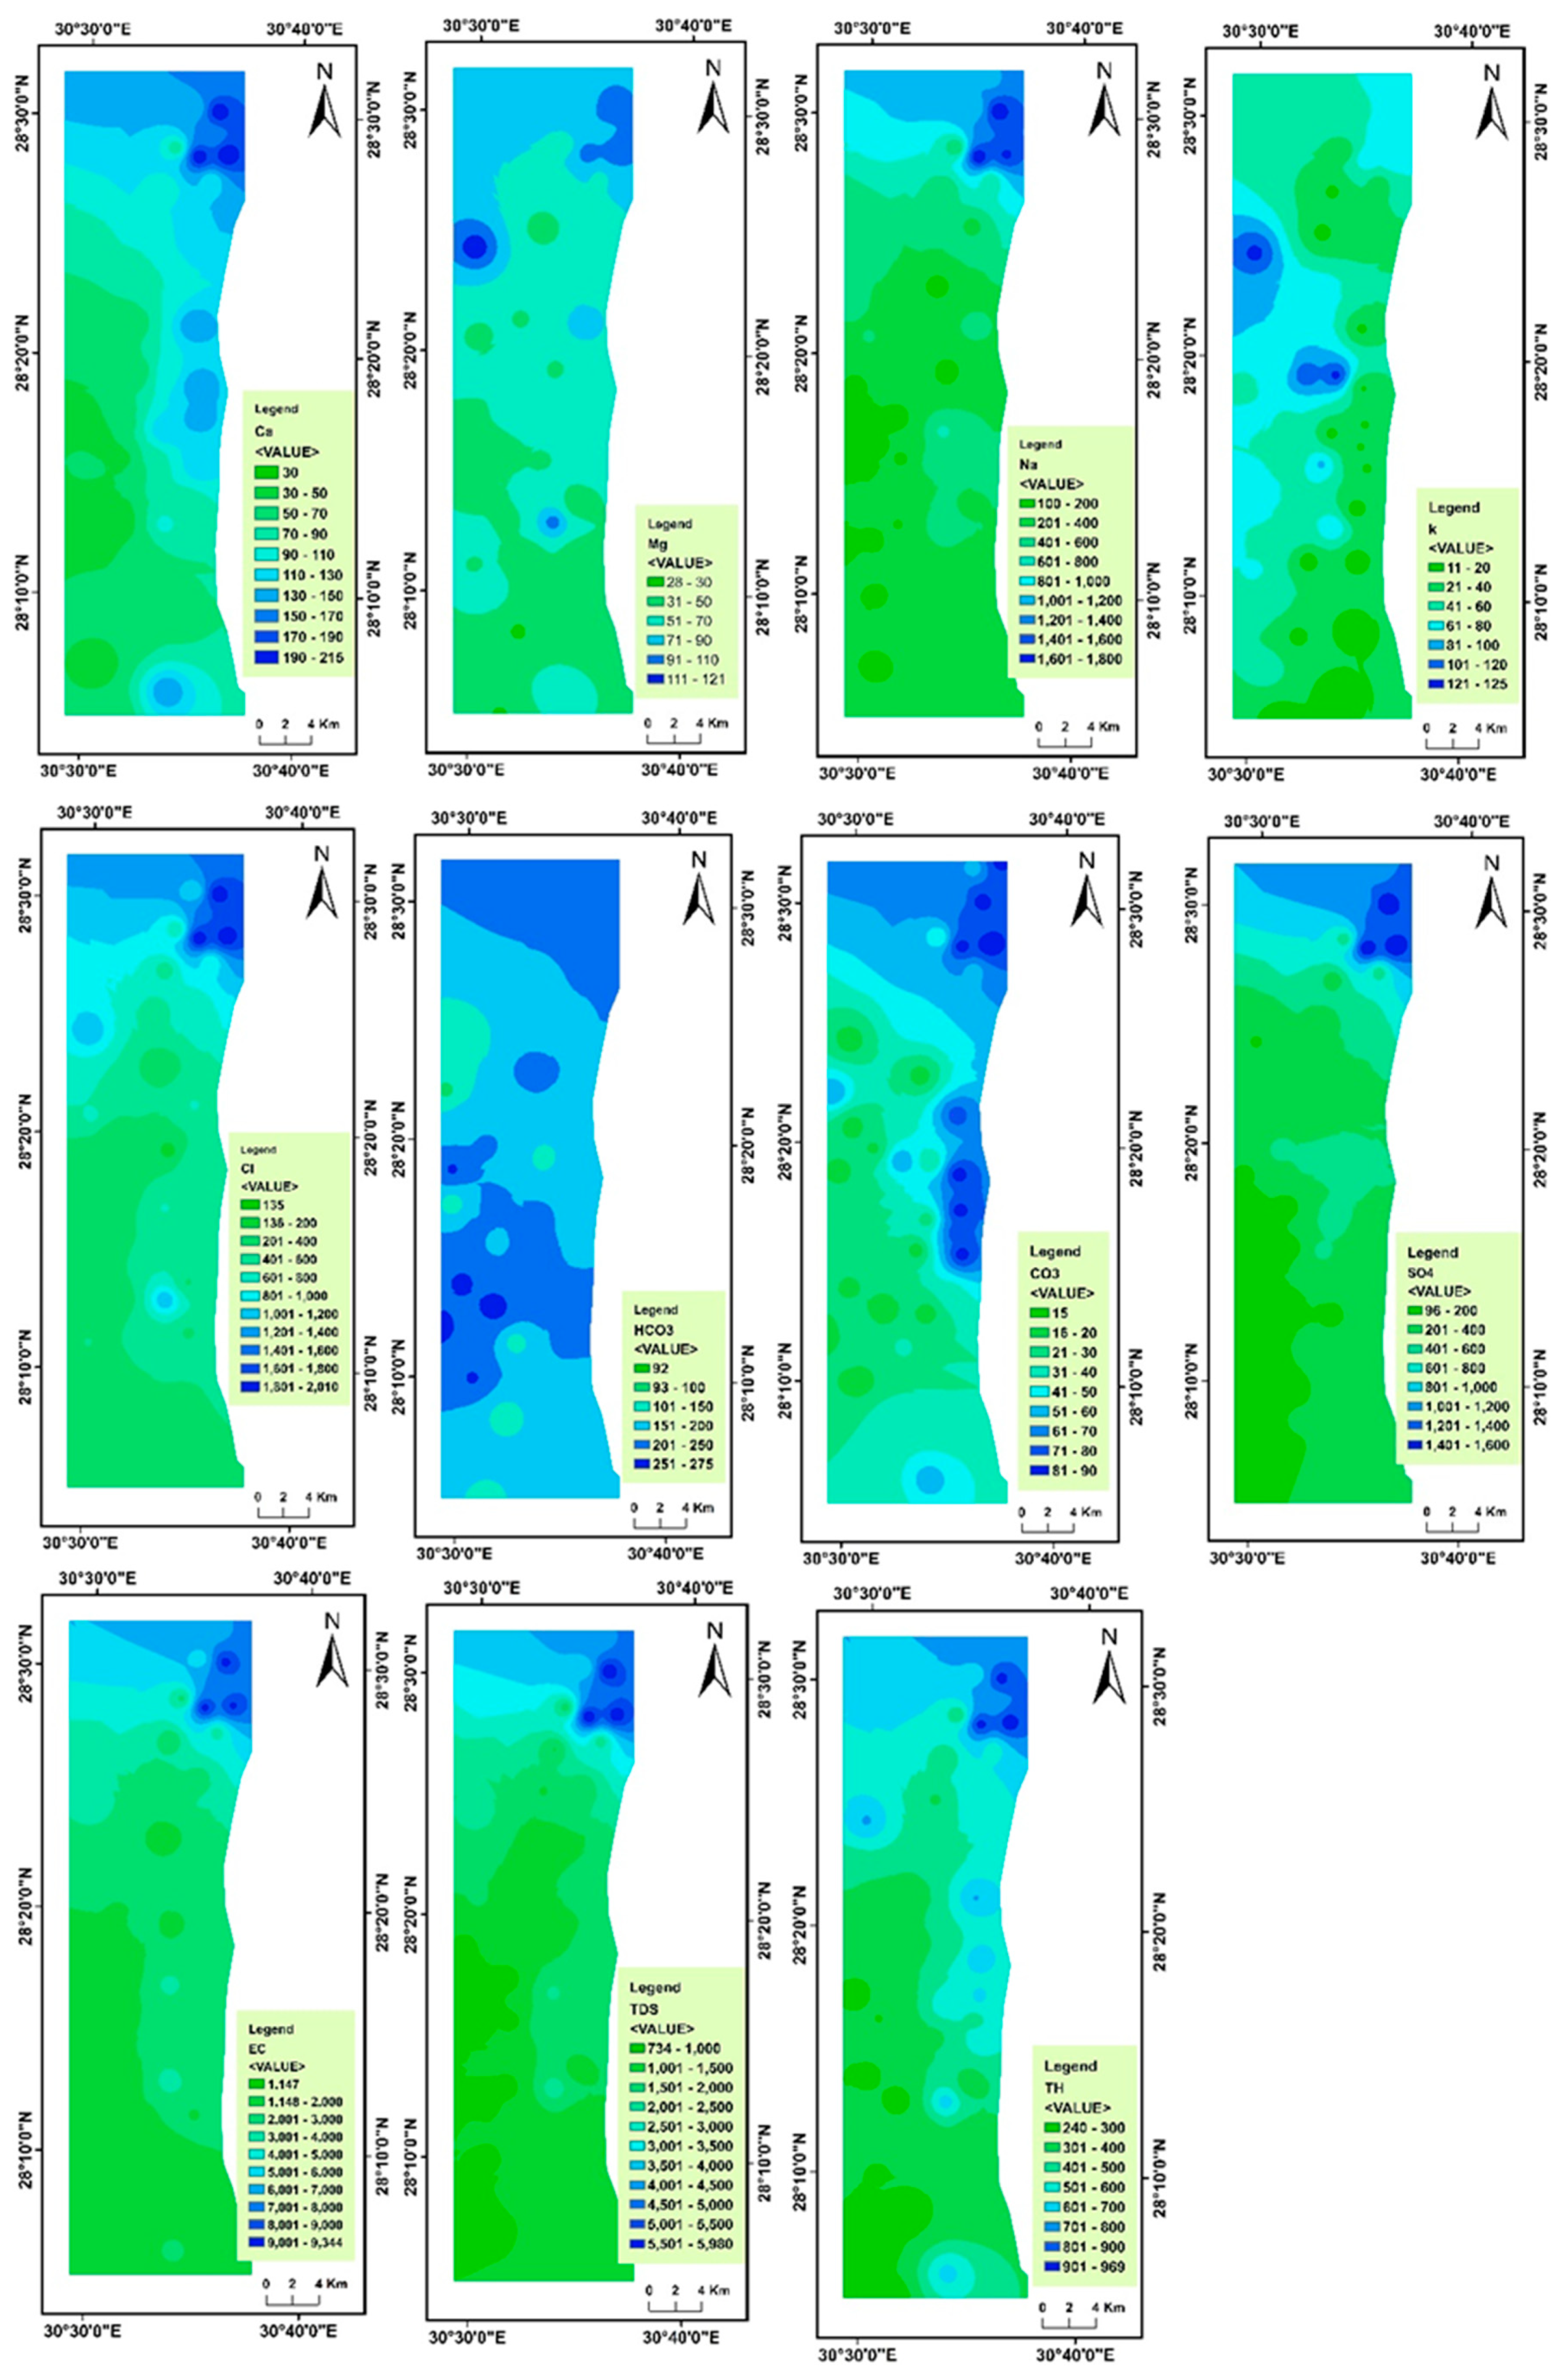
Figure 2. Spatial distribution of major cations in the study area (units are in mg/L).
Water 15 02909 g002
Figure 3. (a) Heat maps analysis, (b) Pearson and (c) Spearman’s correlation matrices of correlations between the hydrochemical variables in the area studied.
Water 15 02909 g003
Figure 4. The scree plot shows the resulting principal components.
Water 15 02909 g004
Figure 5. The hierarchical cluster analysis of groundwater parameters in the studied area.
Water 15 02909 g005
Figure 6. Piper diagram presenting the hydrochemical facies in the study area.
Water 15 02909 g006
Figure 7. Groundwater samples gathered in the studied area are shown in Gibb’s diagram (a) Cations (b) Anions.
Water 15 02909 g007
Figure 8. Zonation maps of TDS and TH for groundwater assessment in drinking and domestic uses according to the classification of Hem [53].
Water 15 02909 g008
Figure 9. Zonation maps of irrigation indices in the study area.
Water 15 02909 g009
Figure 10. United States Salinity Laboratory plot of groundwater classification for irrigation use [56].
Water 15 02909 g010
Figure 11. The Wilcox diagram for the classification of irrigation water [59].
Water 15 02909 g011
Figure 12. Permeability index used to classify the collected water samples [63].
Water 15 02909 g012
Table 1. Descriptive statistics of major elements (in mg L−1) and EC (in μS/cm) in the groundwater of the area studied.
MinMaxMeanStd.
Deviation
VarianceSkewnessKurtosisWHO
Maximum Permissible Limit
No. of
Samples
Exceeding WHO Limit
Percentage (%) of
Samples
Exceeding WHO Limit
Na+1001800500.24449.046201,642.3141.8252.3562003673
Ca2+3021591.8450.9222593.0560.849−0.21420036
Mg2+2812159.8021.396457.7911.0580.44310024
K+1112551.4730.899954.7540.430−0.255124694
CO32−159043.1225.009625.4430.578−1.077---
HCO392275199.1445.0842032.583−0.458−0.3041004898
Cl1352010650.76511.884262,025.2721.5541.4082504388
SO42−961600453.43424.131179,886.7921.7591.9242503061
EC114793443044.182263.3905,122,932.4861.7872.14914004286
TDS73459801948.291448.5792,098,380.7081.7872.14910003778
TH240969467199.6539,863.270.915−0.1385001837
Table 2. Eigenvalues, factor loadings, variability, and cumulative% of the resulted components.
VariablePC1PC2PC3Communalities
Na+0.9690.0110.0350.941
Ca2+0.904−0.2970.0050.905
Mg2+0.8450.295−0.1410.821
K+0.2120.889−0.3030.927
CO32−0.741−0.499−0.1520.821
HCO30.2940.2610.9050.974
Cl09660.083−0.0620.944
SO42−0.9500.0060.0820.909
EC0.9860.0430.0160.974
TDS0.9860.0430.0160.974
TH0.949−0.059−0.0610.907
% of Variance71.17411.7958.820
Cumulative%71.17482.96991.789
Table 3. Classification of groundwater suitability for drinking based on TDS.
Water TypeTDS (mg/L)No. of SamplesPercentage (%)
Fresh water<10001122
Slightly saline1000–30003062
Moderately saline3000–10,000816
Very saline10,000–35,00000
Brine>35,00000
Table 4. Classification of groundwater quality for domestic purposes according to the total hardness [53].
Total Hardness (mg/L)Water ClassNo. of SamplesPercentage (%)
<70Soft00
70–150Moderate hard00
150–300Hard00
>300Very hard49100
Table 5. Groundwater quality for irrigation use based onSAR.
SARAlkalinity HazardGroundwater ClassNo. of SamplesPercentage (%)
<10S1Excellent3888
10–18S2Good612
18–26S3Doubtful510
>26S4Unsuitable-
Table 6. Groundwater quality for irrigation use according to Na%.
Na%Groundwater ClassNo. of SamplesPercentage (%)
<20Excellent00
20–40Good00
40–60Permissible1327
60–80Doubtful3367
>80Unsuitable36
Table 7. Groundwater quality for irrigation use based on PI.
PI (%)ClassificationWater QualityNo. of SamplesPercentage (%)
>75Class IGood2347
25–75Class IIModerate2653
<25Class IIIPoor00
Disclaimer/Publisher’s Note: The statements, opinions and data contained in all publications are solely those of the individual author(s) and contributor(s) and not of MDPI and/or the editor(s). MDPI and/or the editor(s) disclaim responsibility for any injury to people or property resulting from any ideas, methods, instructions or products referred to in the content.