Article

Water Temperature Changes Related to Strong Earthquakes: The Case of the Jinjia Well, Southwest China

1
Key Laboratory of Active Tectonics and Volcano, Institute of Geology, China Earthquake Administration, Beijing 100029, China
2
State Key Laboratory of Earthquake Dynamics, Institute of Geology, China Earthquake Administration, Beijing 100029, China
3
College of Earth Sciences, Guilin University of Technology, Guilin 541006, China
*
Author to whom correspondence should be addressed.
Water 2023, 15(16), 2905; https://doi.org/10.3390/w15162905
Submission received: 3 July 2023 / Revised: 28 July 2023 / Accepted: 4 August 2023 / Published: 11 August 2023
(This article belongs to the Section Hydrogeology)

Abstract

:
Systematic measurements of water temperature are lacking but useful in understanding the relationship between water temperature and earthquakes. Based on the water temperature data, geological structure, borehole structure, and temperature gradient in the Jinjia well, Southwest China, we systematically analysed the water temperature changes related to earthquakes. The water temperature of the Jinjia well recorded the coseismic changes caused by the Wenchuan M7.9 and Panzhihua M6.1 earthquakes in 2008. We also found abnormal changes in the water temperature, after which moderate to strong earthquakes occurred in the surrounding region. The preseismic abnormal changes of the Jinjia well were rising-recovery (rising to a high value and continuing for a period of time before decreasing or quickly recovering), with the range of 0.007–0.07 °C. The maximum change (0.07 °C) occurred before the M7.9 Wenchuan earthquake in 2008. According to the Molchan error diagram, the most likely time for an earthquake to occur is within approximately 4 months after the water temperature exceeds the threshold temperature. In the Jinjia well, the installation depth of the temperature sensor affected the correlation between the temperature changes and earthquakes with a seismic energy density above 10−3 J·m−3. The shorter the distance between the sensor and the fault, the higher the probability of water temperature changes related to earthquakes.

1. Introduction

Changes in water temperature related to earthquakes have been documented over the past decades [1,2,3]. Mogi et al. [4] reported that the coseismic temperature increased in a stepped manner after an earthquake in a well in Izu Peninsula, Japan. They also observed long-term (10 months) and short-term (several days) abnormal changes in the water temperature, of 1–2 °C, prior to several regional earthquakes. Shi et al. [5] found that the water level oscillation in the Tangshan well was caused by an earthquake, which reduced the well water temperature from 0.01 °C to 0.1 °C. Orihara et al. [6] observed a synchronous decrease in the water level and temperature in a spring, about three months before the 2011 M9.0 earthquake in Japan, from 155 km away. Cox et al. [7] observed the coseismic temperature drop of a hot spring in New Zealand, owing to a combination of relatively cold, near-surface groundwater and the upwelling of hot water. Sun et al. [8] studied the relationship between the preseismic changes in water temperature in the Yushu well in Western China and the earthquakes inside and near the Tibetan Block. Chien et al. [9] analysed the water temperature precursor signals in two wells in Taiwan, using the Hilbert–Huang transform (HHT) analysis method. He and Singh [10] reported the coseismic change in water temperature in a wide range of wells in mainland China, caused by the 2008 Wenchuan M7.9 earthquake. Yan [11] analysed the coseismic and preseismic water temperature changes at Banglazhang hot spring in Longling County, Yunnan province, China. The numerical simulation results show that the decrease in the Balazhang spring water flow and temperature is attributed to the decrease in permeability caused by earthquakes [12]. Water temperatures usually show abnormal changes 1–6 months before strong earthquakes in mainland China, e.g., the 2008 Wenchuan M7.9 [13], 2021 Yangbi M6.4 [14], and 2022 Menyuan M6.9 [15] earthquakes.
Moreover, groundwater flow is effective in the transfer of heat. In recent years, the coseismic water temperature of multiple wells in a region, and the temperature–depth profile of a well (before and after earthquakes) can be used to study groundwater flow changes induced by earthquakes [16,17,18,19]. Earthquake-induced or earthquake-related changes in the temperature of the groundwater contain rich information about the subsurface hydrogeological processes [20]. However, due to the lack of systematic and long-term measurements, research on water temperature changes related to strong earthquakes is lacking, and much remains to be explored and learned. Therefore, it is necessary to collect as much data on temperature changes related to earthquakes and carry out thorough and detailed research.
The Jinjia well is located in the southeast edge of the Tibetan Plateau (China) and has experienced frequent and strong seismic activity. The water temperature in the well showed changes related to moderate and strong earthquakes. Some water temperature change in the Jinjia well was qualitatively mentioned after experiencing abnormal changes in the 2007 M6.4 Ninger [21], the 2008 Wenchuan M7.9 [22], and the 2014 Ludian M6.5 [23] earthquakes, but there was a lack of systematic and comprehensive analysis of the long-term data.
In this study, structural data of the geology and borehole were gathered, with measurements of the water temperature gradient within the Jinjia well. First, the focus was on analysing the coseismic and preseismic temperature changes by the thermometer at 130 m depth. Second, quantitative analysis was conducted on the effectiveness of water temperature to predict earthquakes using the Molchan error diagram method. Then, the probability of coseismic and preseismic changes was compared with data at the depth of 135 m to analyse the influence of sensor location on recording preseismic water temperature changes.

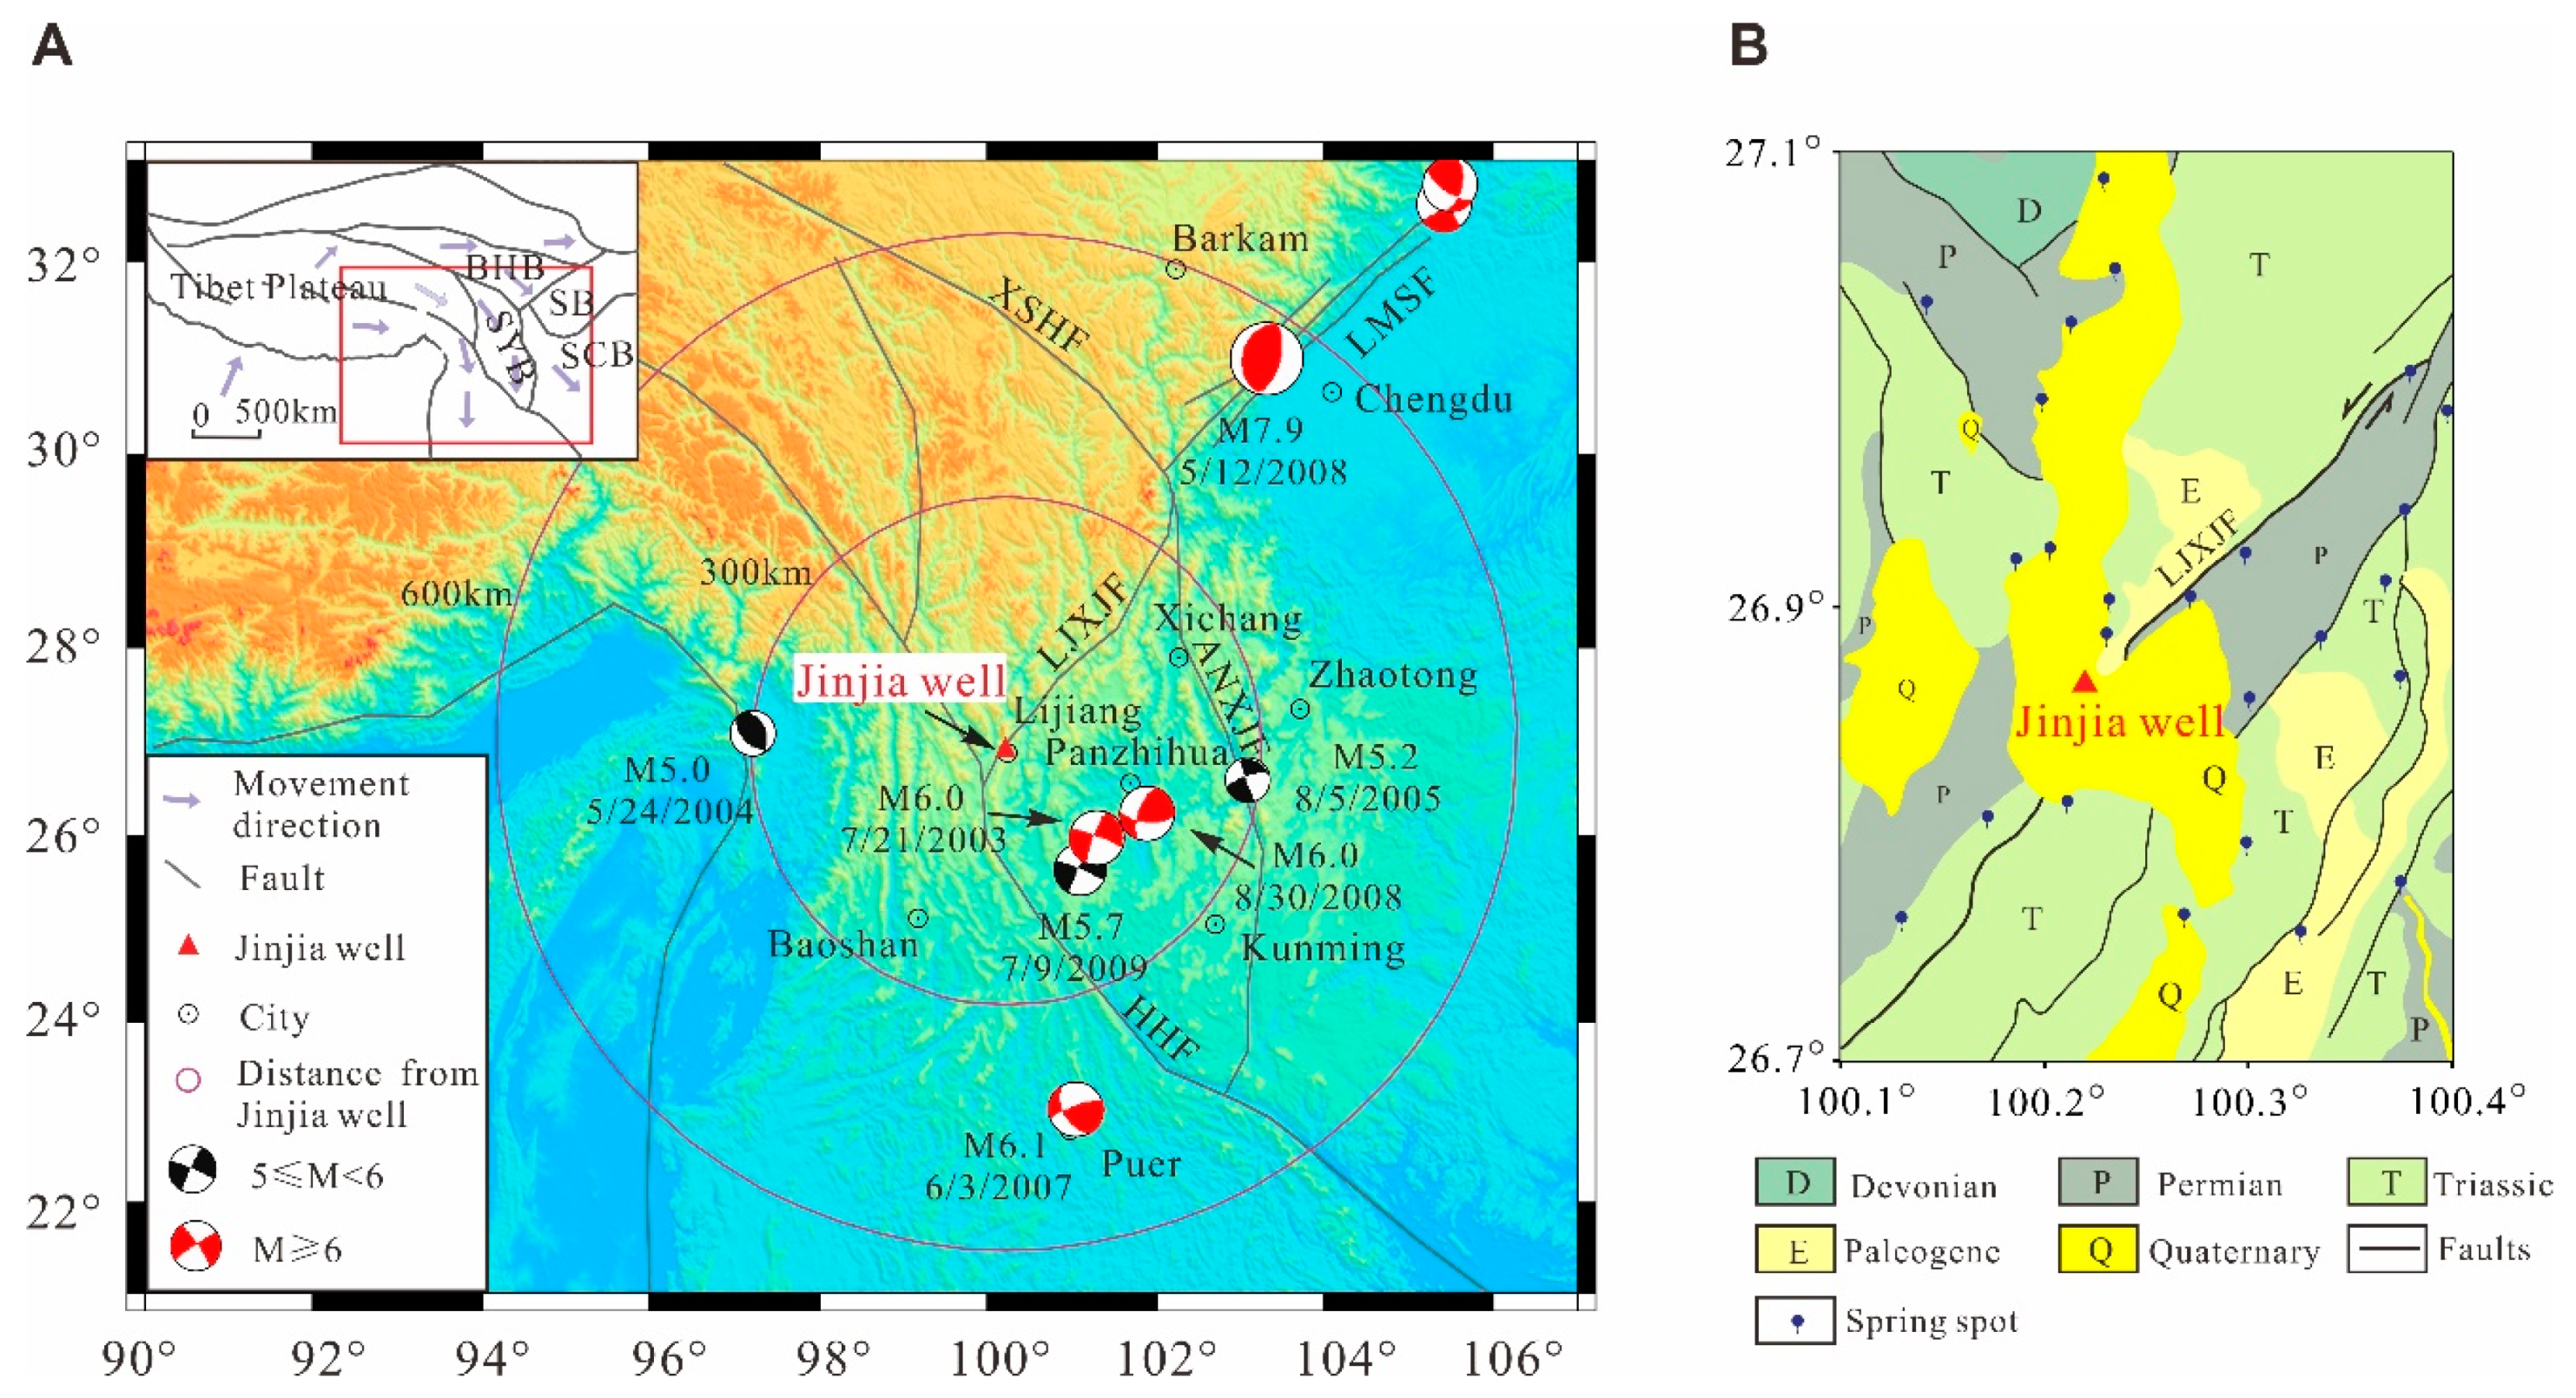
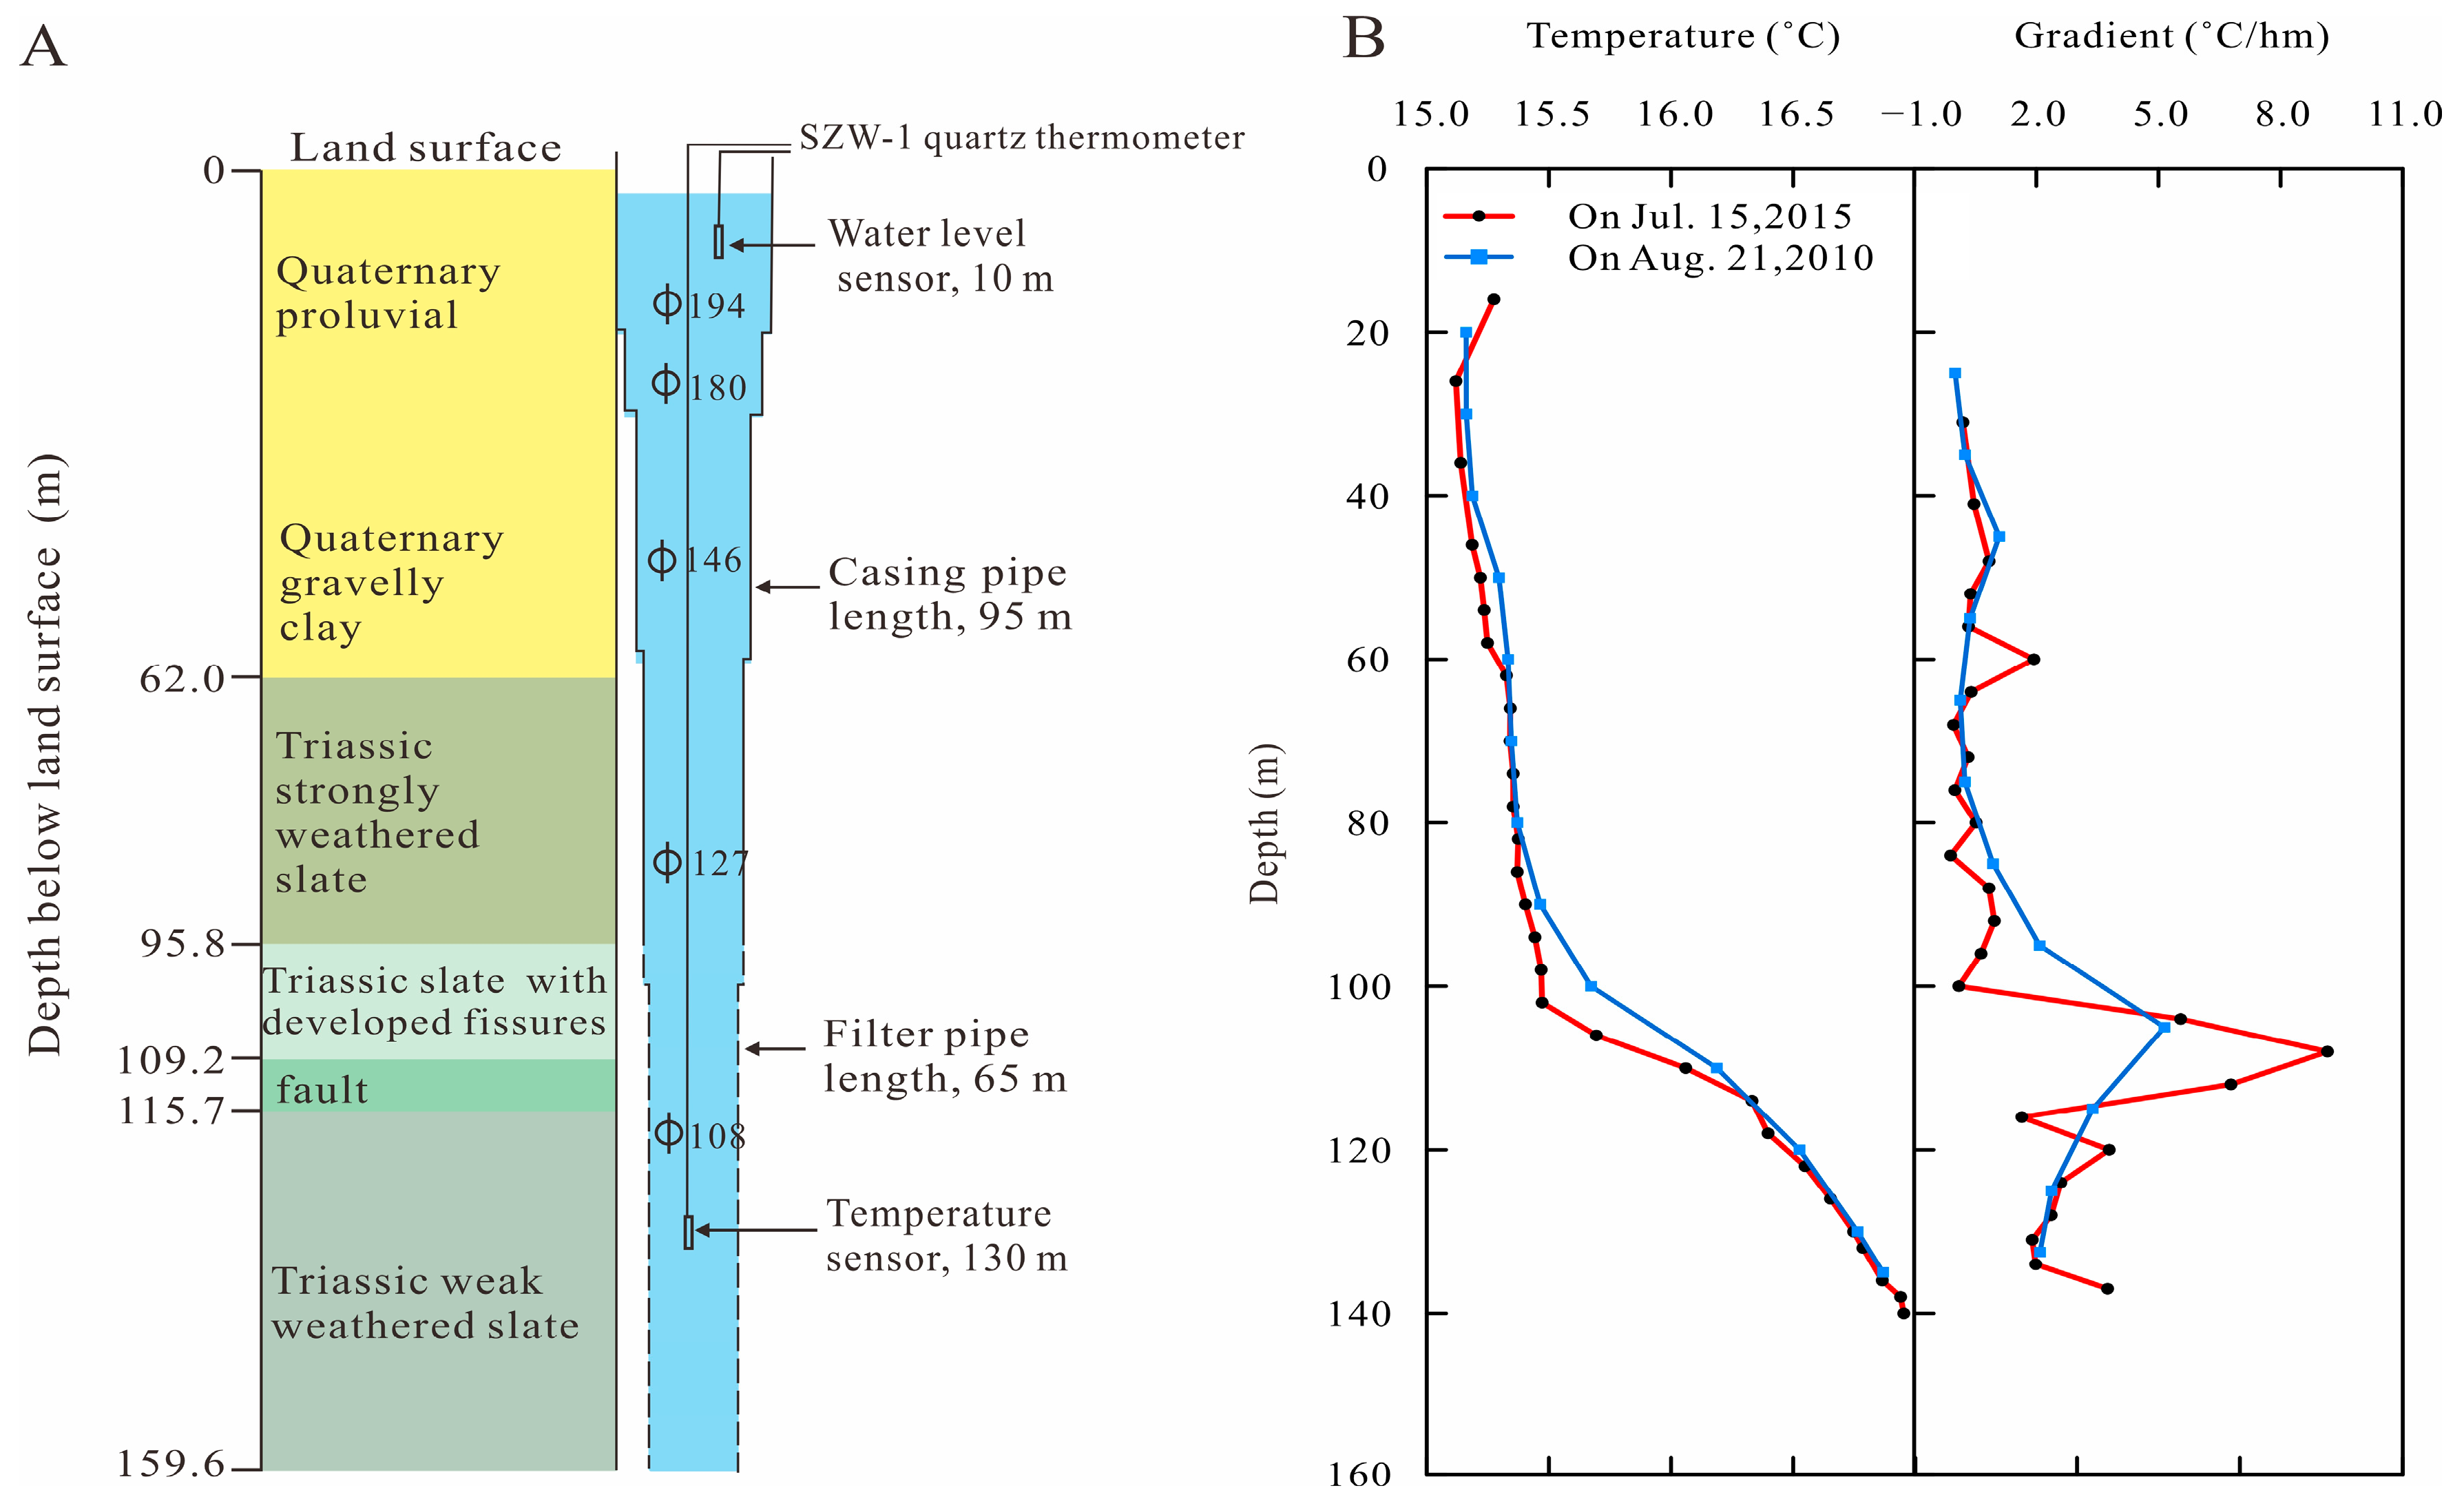
2. Observational Background

Since the Cenozoic era, the eastward flow of material from the Tibetan Plateau has been strongly blocked by the Sichuan Basin (SB) and the South China Block (SCB) (Figure 1A). Geological and geodetic studies have confirmed that the blocked materials move in a clockwise direction around the eastern part of the Himalayan tectonic knot [24]. The Longmenshan fault zone (LMSF) on the southeast edge of the Tibetan Plateau, the Xianhuihe fault zone (XSHF), the Anninghe-Xiaojiang fault zone (ANXJF), and the Honghe fault (HHF) on the boundaries of the Sichuan-Yunnan block (SYB) have strong and frequent seismicity. These are the areas with the strongest seismicity in mainland China. The Wenchuan M7.9 earthquake on 12 May 2008 was a massive earthquake that occurred on the LMSF, causing many casualties and extensive infrastructure damage. The surface rupture zone determined by detailed field investigation were approximately 240 km [25] and 275 km [26], respectively.
The Jinjia well is in Jinjia village, Lijiang city. It is located on the NE trending Lijiang-Xiaojinhe fault (LJXJF), which cuts the SYB obliquely (Figure 1A). Global positioning system results show that the velocities in the north and south parts of the SYB are 13 and 9 mm/a, respectively [27].
The Jinjia well area is covered by Quaternary sediments [28]. The LJXJF is an active reverse sinistral strike-slip fault (Figure 1B). According to the Quaternary sediments on the north and south sides, the maximum amount of sinistral offset caused by the fault activities is 7.4–7.6 km since the Quaternary. The maximum vertical offset of the fault is 500–700 m. The horizontal and vertical slip rates are estimated to be 3.7–3.8 and 1.0–1.5 mm/a, respectively [29]. The depth of the Jinjia well is 159 m, and the Quaternary sediments extend down to 62 m below the ground. The strongly weathered and weakly weathered Triassic slates form the successive lower layers (Figure 2A). At a depth of 109.2–115.7 m, the borehole penetrates a fault zone. The borehole is sealed with casing pipe from the surface down to a depth of 95 m. The section between the casing pipe and the depth of the well (95–159 m) is equipped with a filter pipe. The aquifer is mainly composed of slate fissure water, with a chemical composition of HCO3-Ca·Na. At the end of 1999, an SZW-1 quartz thermometer with a resolution of 0.0001 °C was used to measure the water temperature in the Jinjia well. The sensor can withstand a pressure of more than 10 MPa. The thermometer was placed at a depth of 130 m, with an hourly sampling rate. The observation of the water level in the Jinjia well began in August 2010, by using a DRSW-1 type comprehensive observation instrument. A differential pressure sensor with a resolution of 0.001 m and a sampling rate of one per minute measures the water level. During this time, the quartz thermometer was located at a depth of 135 m.
The geothermal gradient of the well was measured on 21 August 2010 and 15 July 2015. The temperature measurements were similar. The more detailed 2015 measurement showed that the geothermal gradient curve of the well could be divided into three sections. These were the upper (41–102 m), middle (106–114 m), and lower sections (118–140 m), with average geothermal gradients of 5, 72, and 26 °C/km, respectively. The temperature increases slowly in the upper section but rapidly in the middle section. The geothermal gradient in the lower section is near the average value in this region [30].

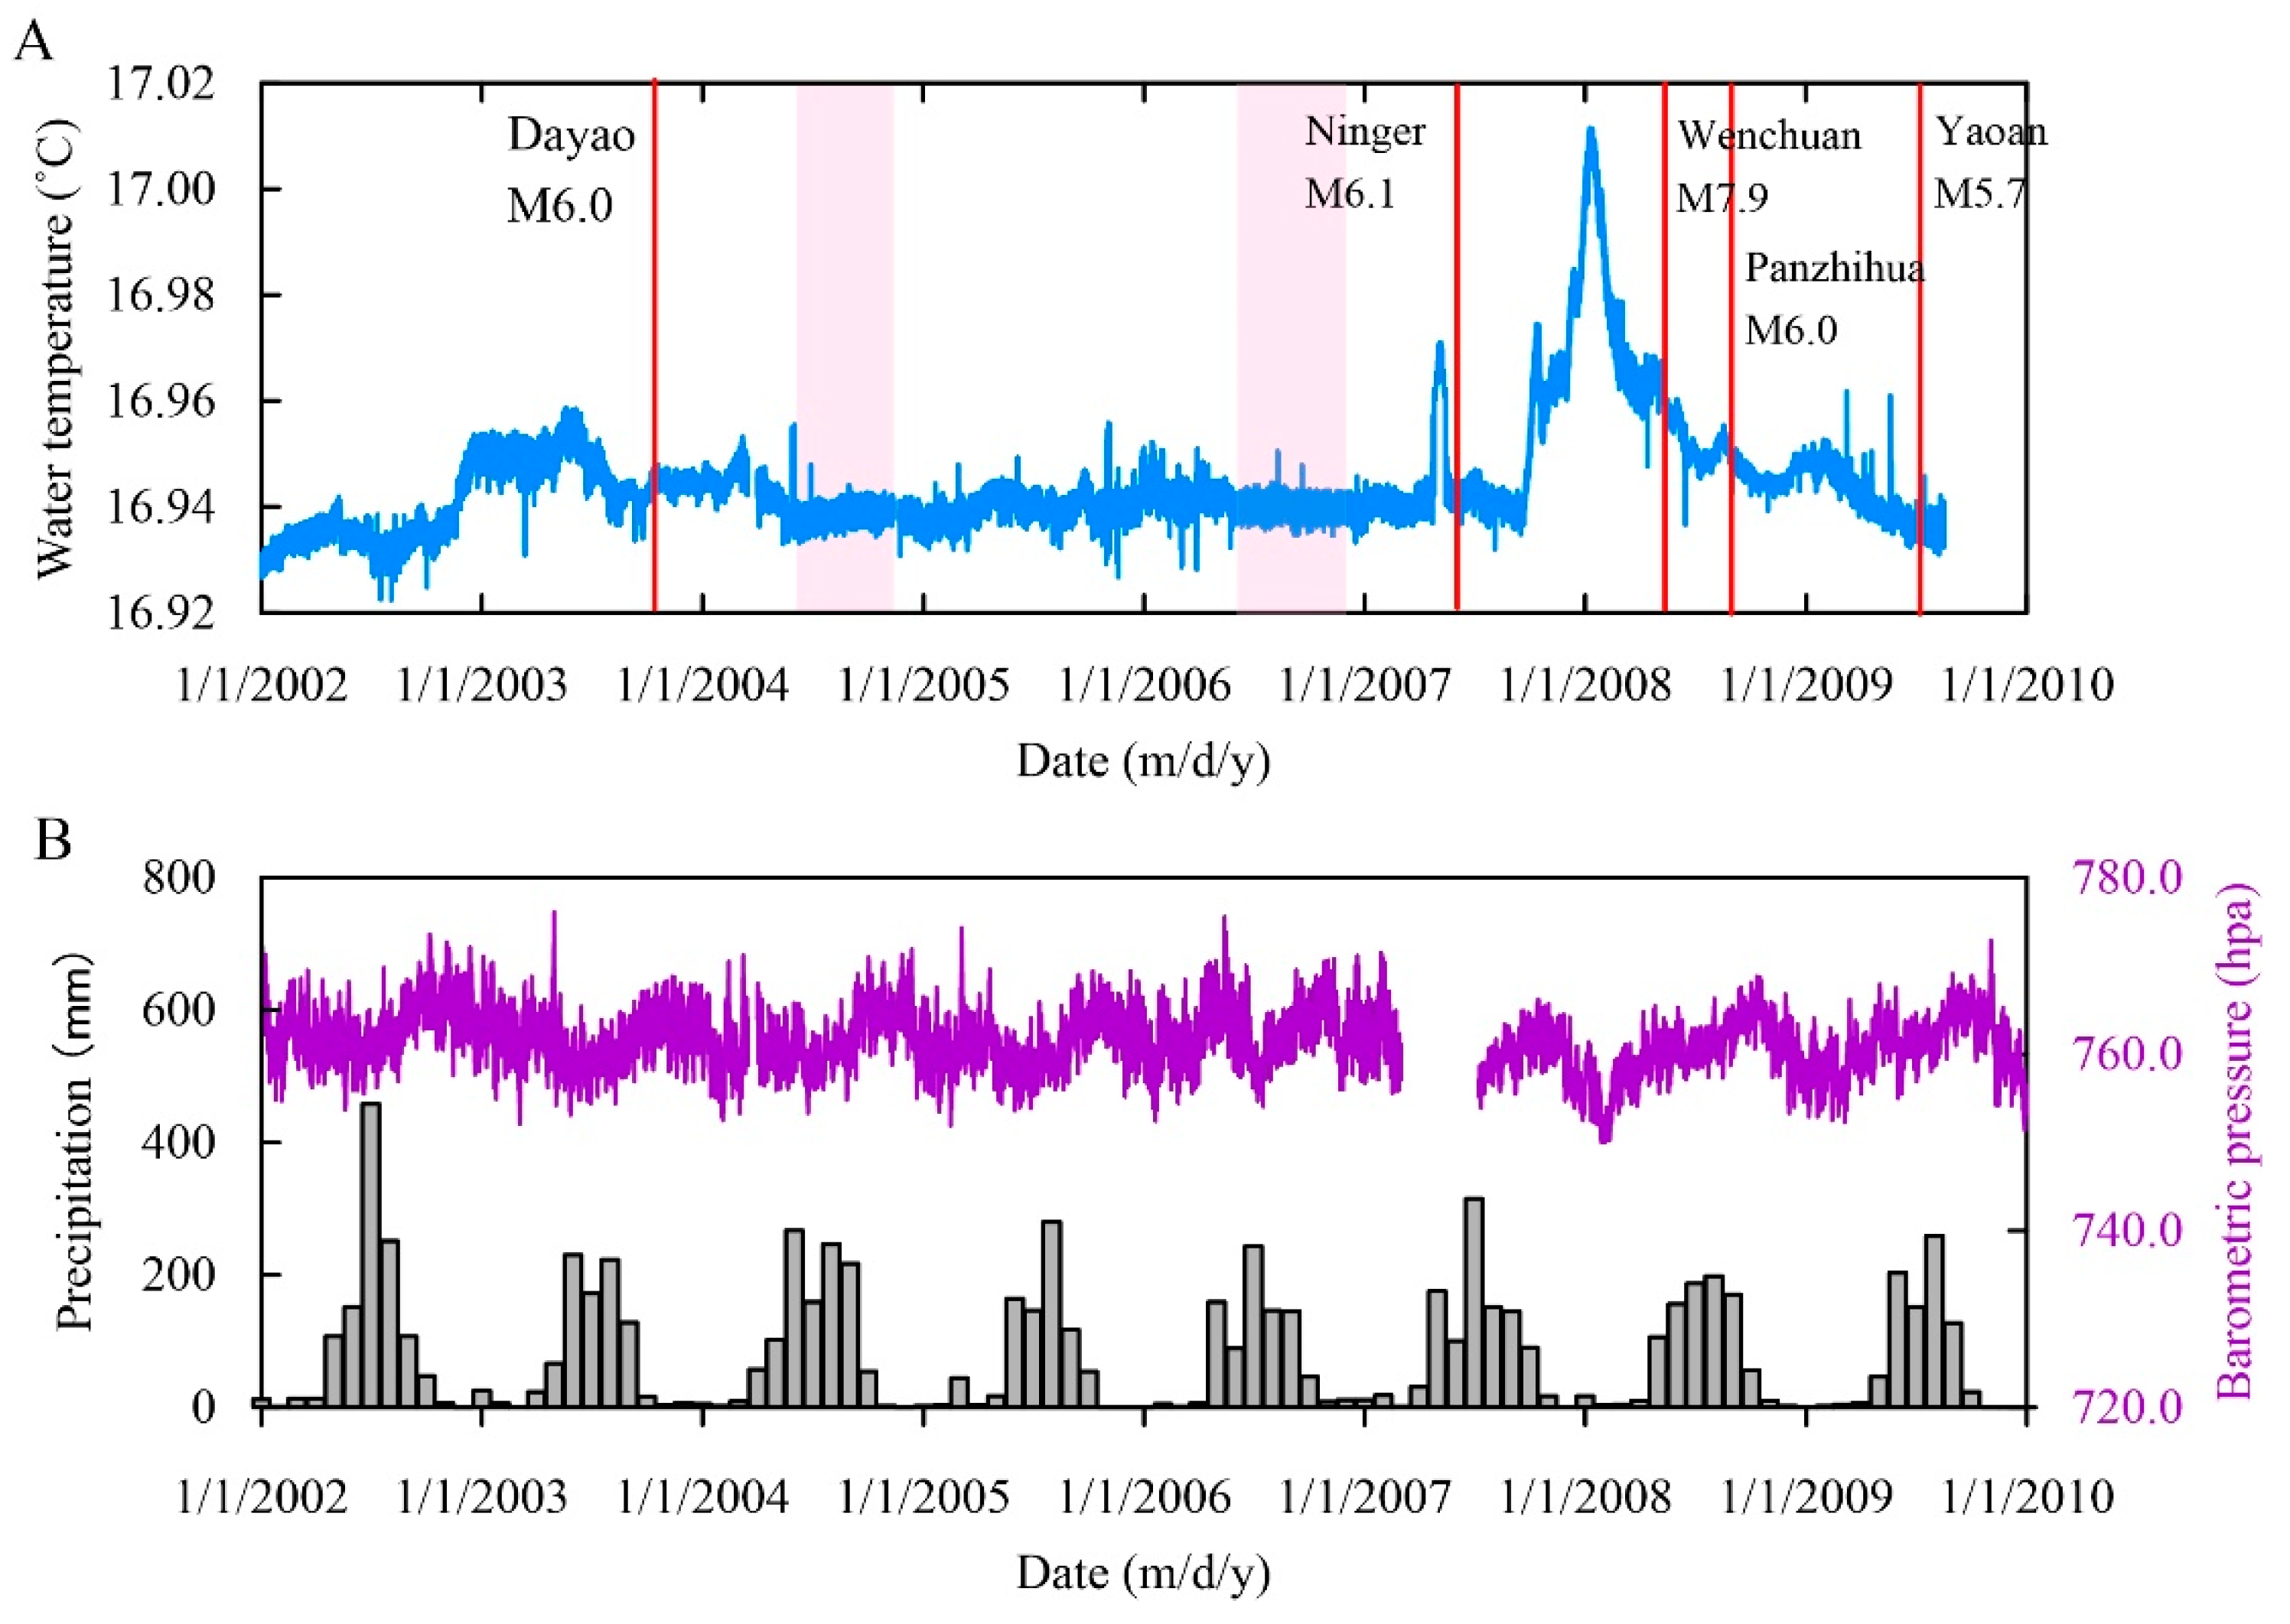
3. Water Temperature Changes

3.1. Standard Deviation of Normal Water Temperature Changes

Figure 3 shows the hourly water temperature and air pressure values and the monthly precipitation of the Jinjia well from 2002 to 2009. It shows that there is no obvious correlation between the well water temperature and barometric pressure or rainfall. The standard deviations of the water temperature were calculated for two durations of no earthquakes and stable water temperature from 1 June 2004 to 31 October 2004, and 1 June 2006 to 30 November 2006 (two pink rectangles in Figure 3A), as 0.0016 °C and 0.0014 °C, respectively. The average standard deviation of the two periods was 0.0015 °C, and it was assumed to be the standard deviation of the water temperature for the Jinjia well.

3.2. Coseismic Water Temperature Changes

From 2002 to 2009, when the temperature sensor was placed at a depth of 130 m, two coseismic changes in water temperature were recorded, which were caused by the Wenchuan earthquake on 12 May 2008 and the Panzhihua earthquake on 30 August 2008 (Figure 4). The Wenchuan earthquake caused a step-drop change of 0.007 °C, while the Panzhihua earthquake caused a pulse-drop change of 0.006 °C. The two temperature coseismic changes showed that the geological and hydrological environments of the Jinjia well can respond to the stress and strain related to earthquakes.

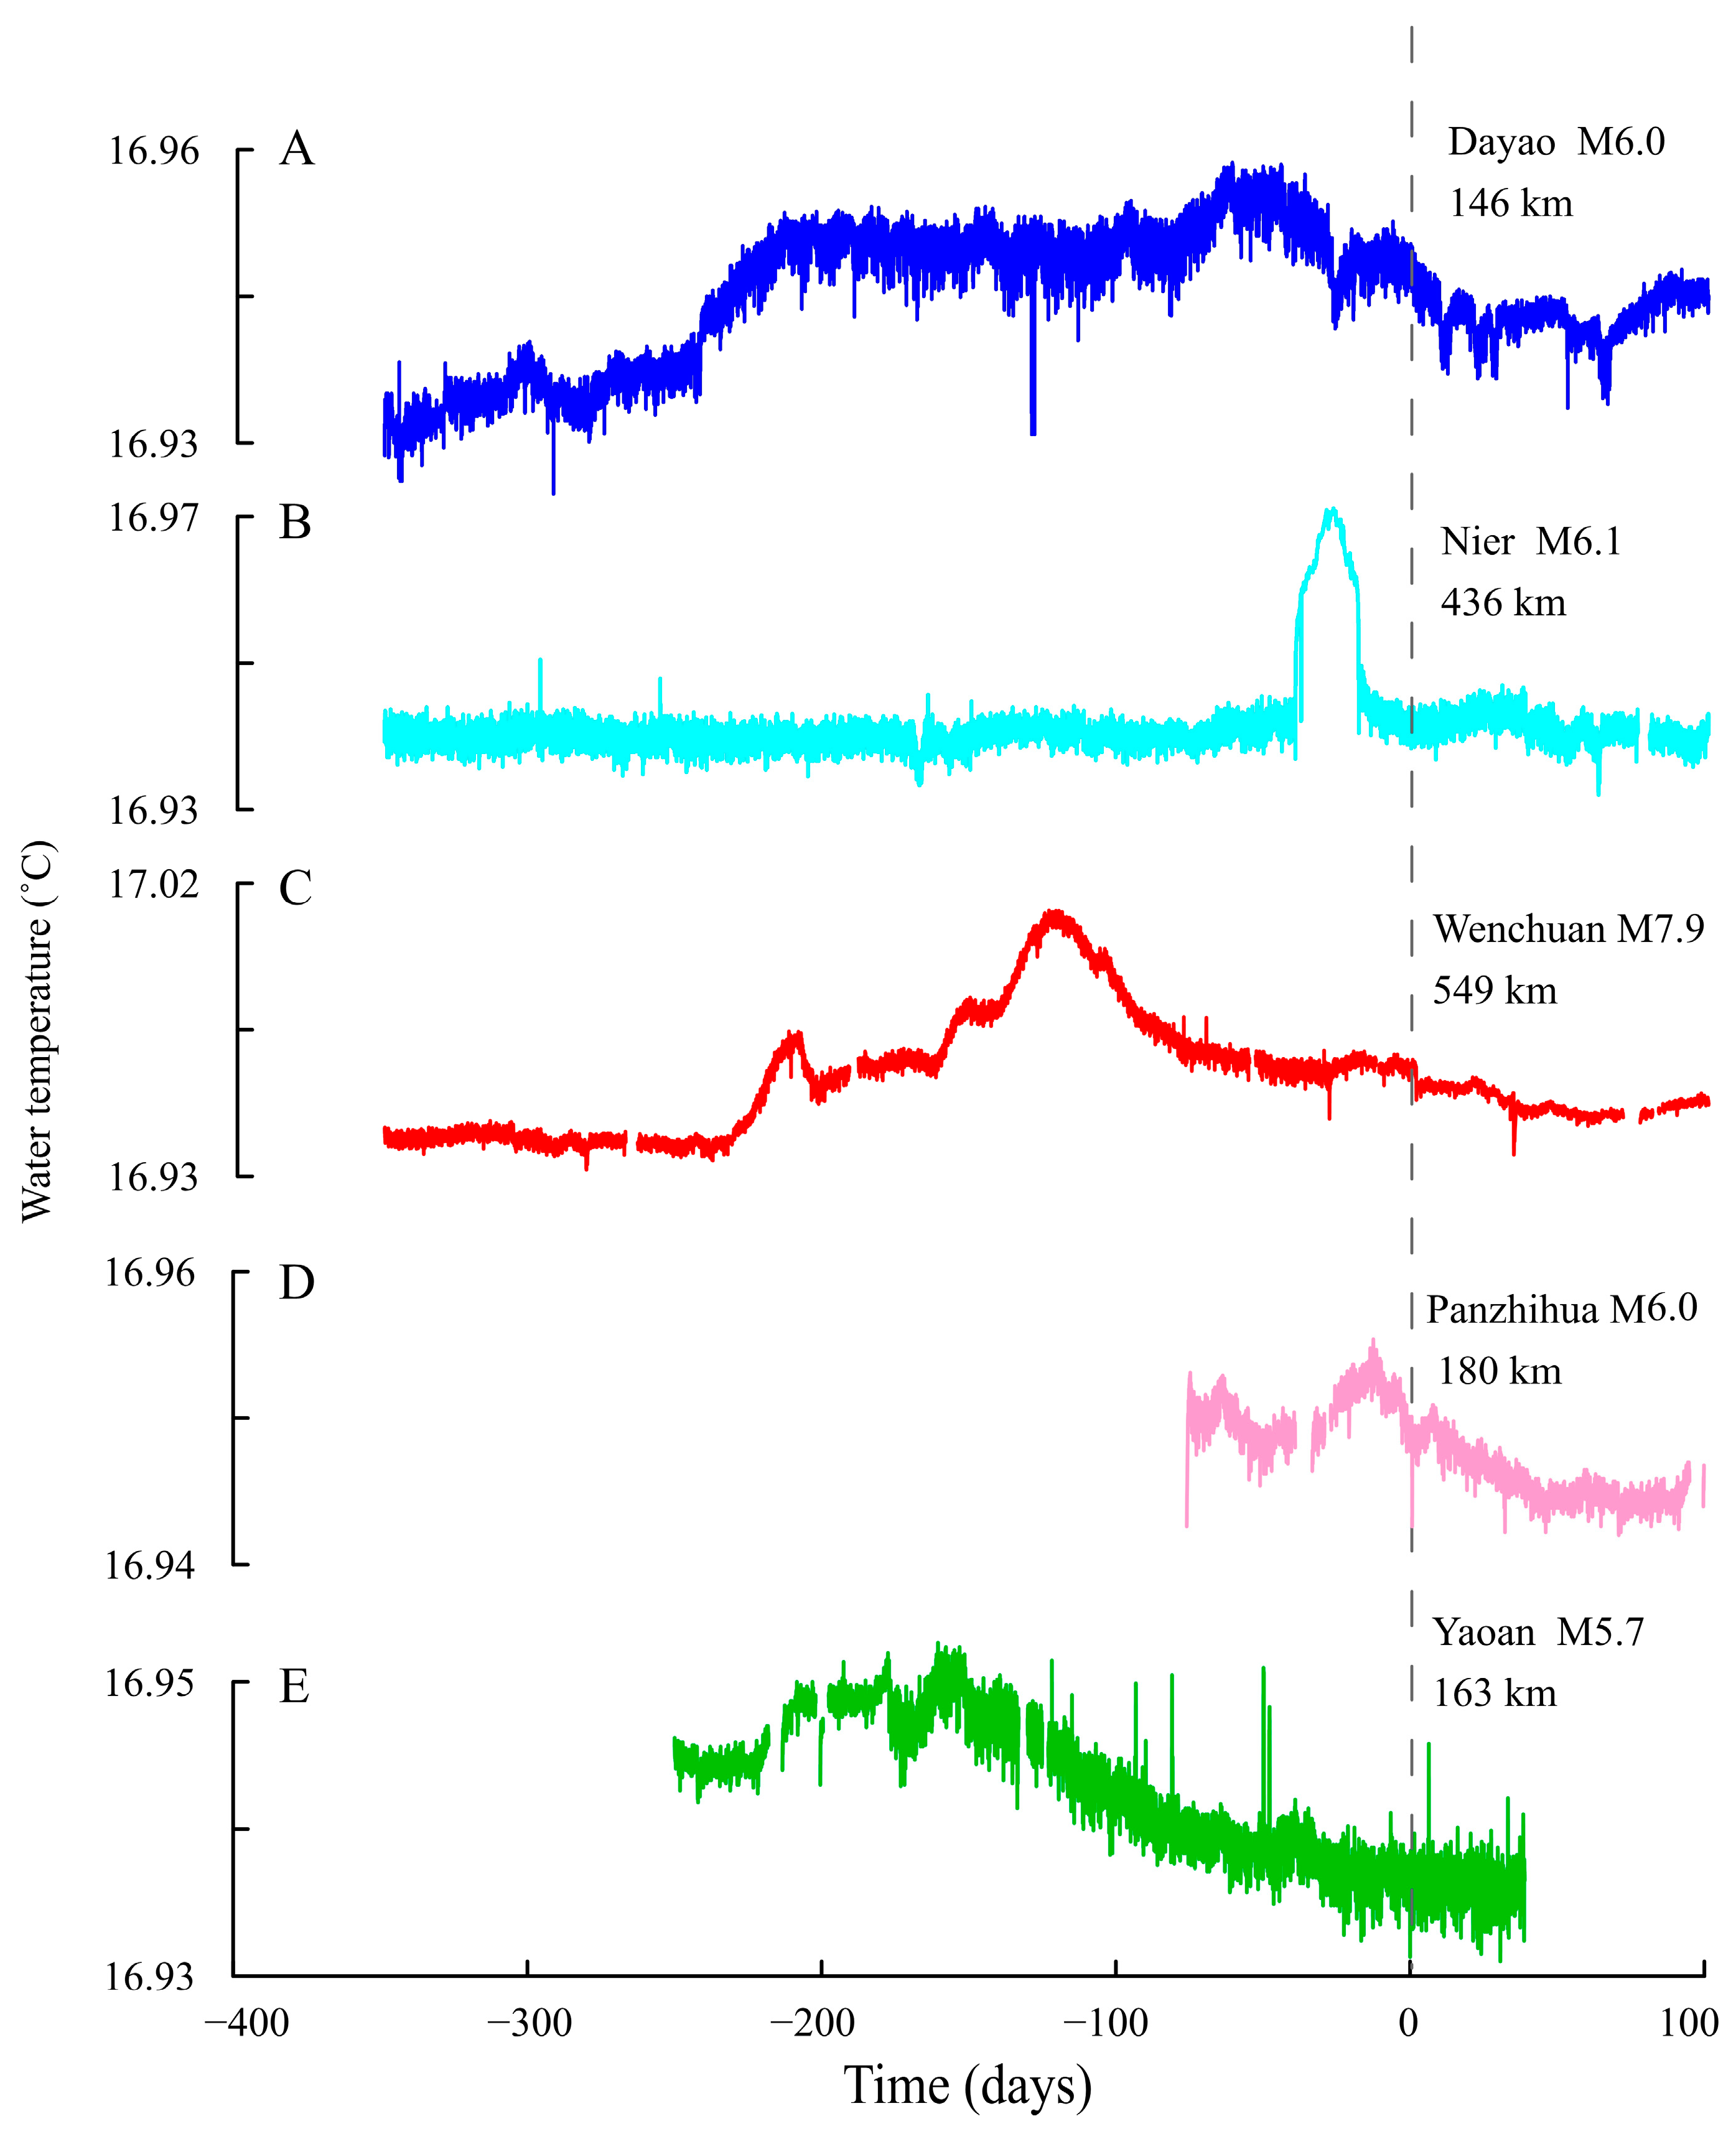
3.3. Preseismic Water Temperature Changes

The water temperature in the Jinjia well showed some abnormal increase changes from 2002 to 2009 (Figure 3A). Additionally, after these changes there were five moderate-to-strong earthquakes which occurred in the surrounding regions. No other environmental factors were found which caused the changes in water temperature. The hourly water temperature time series was plotted for 350 days before and 100 days after the five earthquakes (Figure 5).
The general shape of the abnormal variations displays the rising-recovery (rising to a high value and continuing for a period of time before decreasing or quickly recovering). For example, the water temperature before the 2013 Dayao M6.0 earthquake (146 km from the well) slowly increased to the maximum value 62 days before the earthquake and then began to decrease (Figure 5A).
Prior to the 2007 Ninger M6.1 earthquake (436 km from Jinjia well), the well water temperature increased and decreased rapidly by 0.03 °C from 23 April to 15 May (Figure 5B). The water temperature began to rise 231 days before the Wenchuan M7.9 earthquake (549 km from the well). After an unstable rise in temperature, it reached a maximum value 123 days before the earthquake. The temperature difference was 0.07 °C above the normal level. This anomaly has the largest amplitude among the five earthquakes. During the descending period, the Wenchuan M7.9 earthquake occurred when the temperature decreased to 0.025 °C higher than the normal value. The descending period continued until the second half of 2009 (Figure 5C).
The Panzhihua M6.0 earthquake occurred on 30 August 2008, 180 km from the well (Figure 5D); the Yaoan M5.7 earthquake occurred on 9 July 2009, 163 km from the well (Figure 5E). Both occurred during the descending period of abnormal water temperature variations. The water temperature began to rise 34 days before the Panzhihua M6.0 earthquake, with a maximum value 14 days before it. The increase was 0.007 °C. The Yaoan earthquake showed an increase of 0.016 °C. The water temperature began to rise 222 days before the event and reached a maximum level 154 days before it.
The magnitude and epicentral distance are useful parameters for comparing and measuring hydrogeological responses. Earthquake energy density is a parameter that unites these two parameters and also has a clear physical meaning. The earthquake energy density is defined as the maximum earthquake energy per unit volume and is approximately proportional to the square of the ground acceleration. For an earthquake of magnitude M, the seismic energy density e, at a distance from the source r, can be calculated empirically using the following equation [31].
L o g ( r ) = 0.48 M 0.33 L o g e ( r ) 1.4
The seismic energy densities of the five earthquakes were calculated. Table 1 shows the parameters of the five earthquakes, their seismic energy density, and the abnormal water temperature changes in the Jinjia well. The abnormal duration ranged between 34–242 days, and the abnormal temperature variation range was 0.007–0.07 °C.

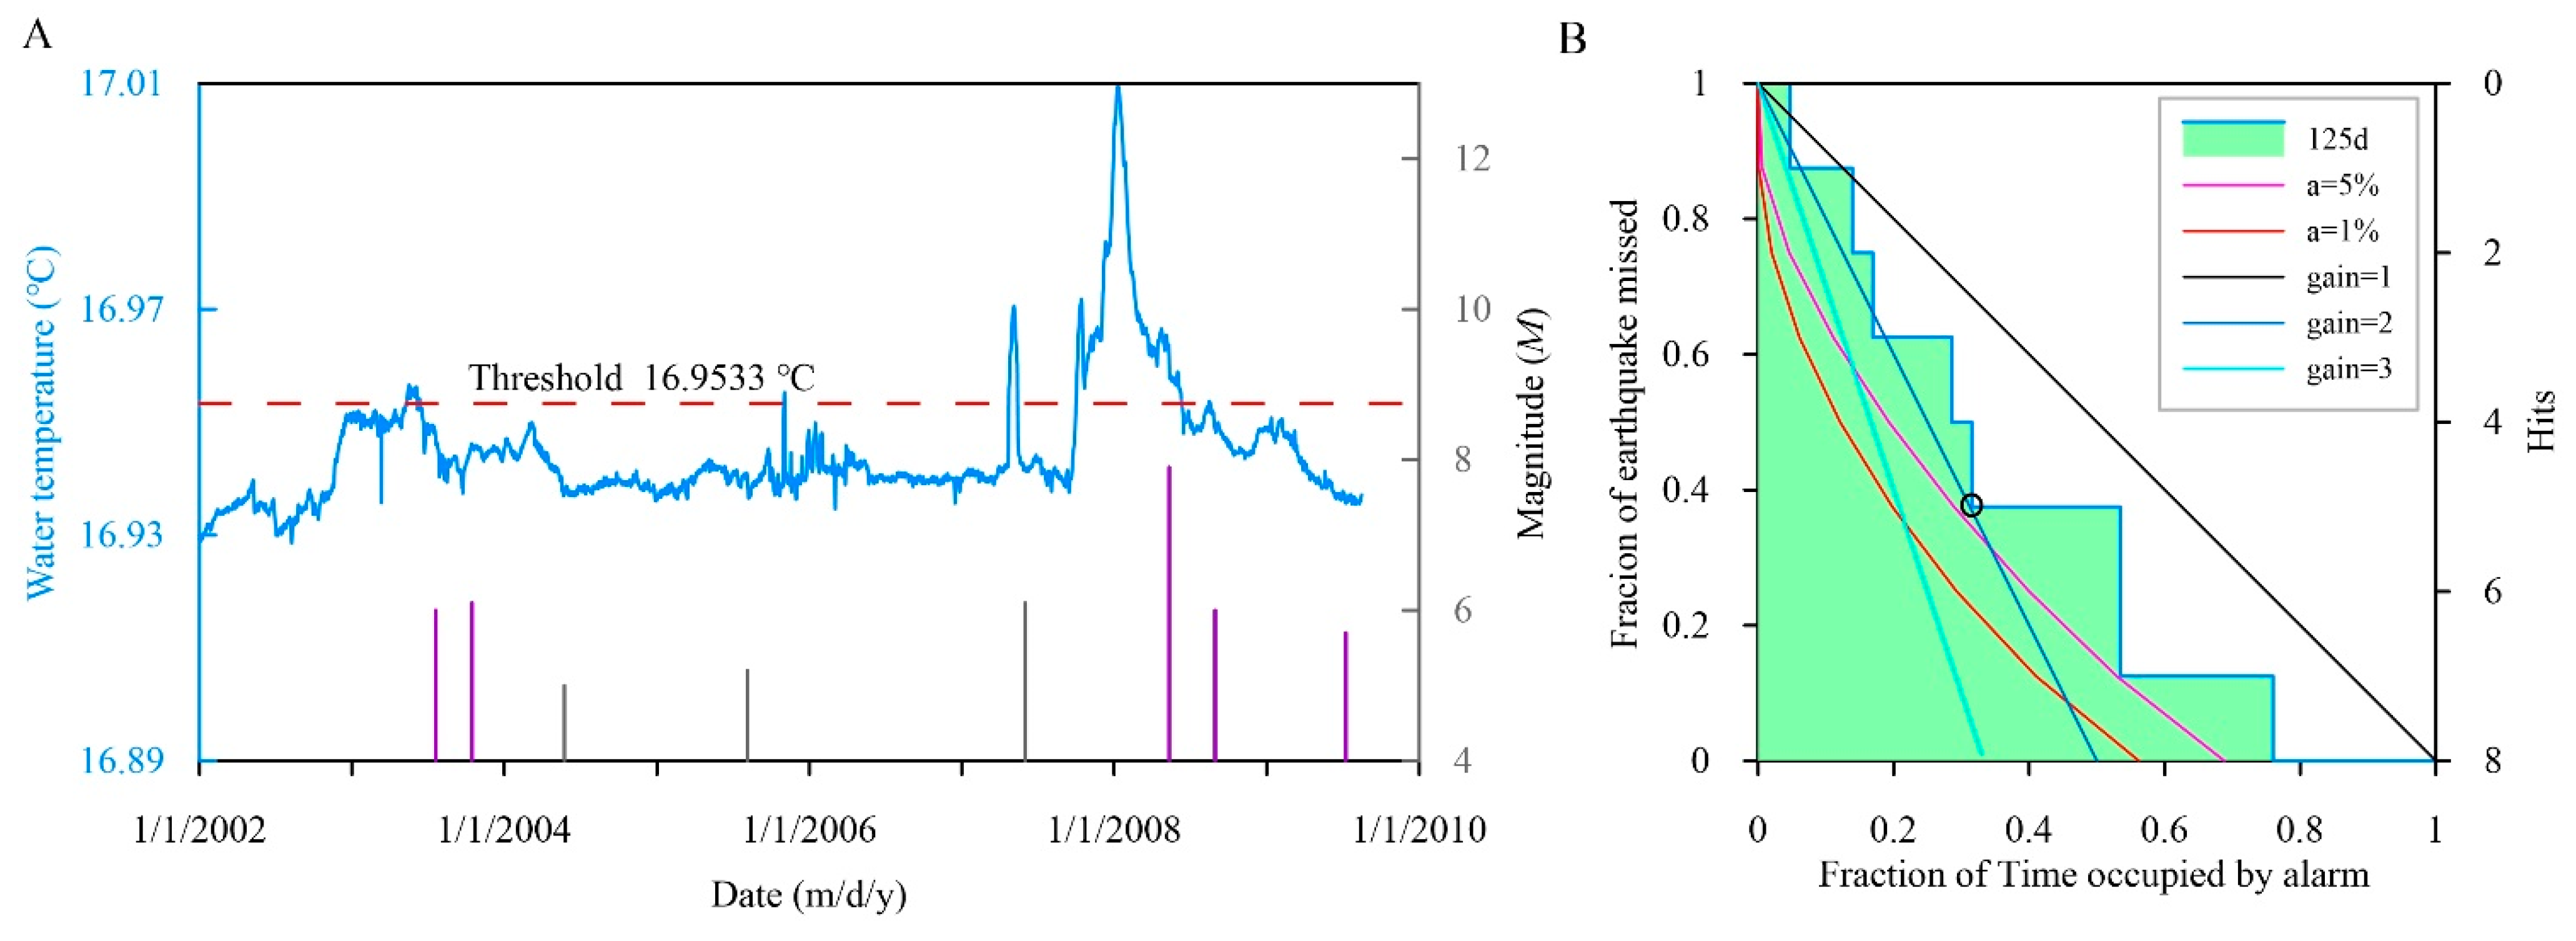
4. Analysis of Preseismic Water Temperature Changes Using the Molchan Error Diagram

The area between 21° N–40° N and 90° E–107° E was selected to systematically analyse the relationship between preseismic water temperature changes with surrounding earthquakes during 2002–2009 (Figure 1A). Earthquakes used in the analysis was extracted from the US Geological Survey Earthquake Catalogue (http://earthquake.usgs.gov/earthquakes) (accessed on 6 March 2022). For the selected earthquakes (M5.0–6.0 earthquakes within 300 km and ≥M6.0 within 600 km), the aftershocks were removed, and the time was adjusted to Beijing Standard Time. A total of eight earthquakes were selected: three M5.0–6.0 within 300 km and five ≥M6.0 within 600 km of the well. Figure 1 shows the distributions and focal mechanism solutions of these earthquakes. Then, we used the Molchan error diagram to find the optimum threshold and the most likely time period for the subsequent earthquake to occur (Figure 6).
The Molchan error diagram method mainly examines the difference between the predicted results and the observed data of the target earthquake [8,32,33,34]. In addition to reflecting the prediction performance and evaluating the observed data, the method can also quantitatively analyse the outliers and obtain the outlier identification indices that correspond to the optimum threshold. The fraction of time occupied by the alarm (τ) and the fraction of the earthquake missed (ν) are calculated, based on which a τ–ν curve is plotted in a Molchan error diagram, by continuously lowering the threshold for earthquake prediction (Figure 6B). The area enclosed by the boundary of the diagram and the τ–ν curve indicates the prediction effect of the τ–ν curve compared to a stochastic prediction. The smaller the area is, the better the prediction effect is. Meanwhile, it is necessary to examine the probability gain (gain) and significance level (a). The greater the probability gain, the better the prediction effect. After a threshold is determined, the data exceeding the threshold are regarded as outliers. When an earthquake occurs in the time period during which an outlier occurs as well as in its effective prediction period, it is correctly predicted. When an earthquake occurs in a time period outside the time period during which an outlier occurs as well as its effective prediction, it is missed. The fraction of time occupied by the alarm is determined by dividing the total length of all the anomalous times and the effective prediction periods (with repeats removed) by the total length of time of the checked data.
For the Jinjia well, the optimum threshold is 16.9533 °C, and the most likely time for an earthquake to occur is within 125 d, namely approximately 4 months after the water temperature exceeds the threshold. At the position of the hollow circle in Figure 6B, the fraction of time occupied by the alarm and the fraction of earthquake missed are both small, approximately 0.32 and 0.38. At this time, the number of predicted earthquakes is 5, and the predictions have a probability gain of approximately 2 and a significance level of approximately 5%, indicating a good prediction effect.
Among the five predicted earthquakes, four were consistent with the earthquakes mentioned in the previous study with preseismic changes, namely Dayao M6.0, Ninger M6.1, Wenchuan M7.9, and Panzhihua M6.0. The water temperatures in the Jinjia well all showed changes above the threshold line before the four earthquakes. The Yaoan M5.7 earthquake in 2009 was not included in the predicted earthquakes due to its highest temperature being below the threshold line. Another predicted earthquake was the Dayao M6.1 earthquake that occurred on 16 October 2003, and the earthquake occurred only 7 km away from the epicentre of the Dayao 6.0 earthquake on 21 July 2003. The inconsistency between the two indicates the complexity and difficulty of earthquake prediction.

5. Discussion

5.1. Characteristics of Water Temperature Changes before Earthquakes

As mentioned above, the average standard deviation of the Jinjia well water temperature was 0.0015 °C. The variation range of water temperature changes before the five earthquakes was 0.007–0.07 °C (Table 1). The minimum variation (0.007 °C) was more than four times the standard deviation. Previous studies (Table 2) showed that the anomalous changes in thermal districts or artesian spring sites which had strong groundwater activity could reach 1–2 °C or more [4,6,32,33,34,35,36]; However, the amplitude of anomalies in the nonartesian well was usually small. For example, the temperature variation of the Yushu well in Western China was 0.01–0.03 °C before five earthquakes, including the Wenchuan earthquake [8].
Table 2 summarizes four types of preseismic water temperature anomalies which are rising, declining, declining-recovery (an initial decrease followed by a subsequent increase), and rising-recovery (an initial increase followed by a subsequent decrease).
Compared with conduction, the water flow can transfer heat more quickly and efficiently. The vertical flow of groundwater makes the geothermal gradient deviate from the linear increase with depth, causing a concave upward profile in recharge areas and a convex upward profile in discharge areas [16]. There is usually vertical groundwater activity in thermal spring districts or artesian spring observation sites. The geothermal gradients of the Yushu well [8] and the Jinjia well (Figure 2B) also showed deviations that increase linearly with depth. In the Yushu well, the groundwater temperature gradually decreased with increasing depth; at a depth below ~80 m, the change in the water temperature gradually decreased. A thermometer sensor, located at a depth of 100 m, recorded anomalous changes at the Yushu well before multiple earthquakes, and these changes were recorded as the declining-recovery type. In the Jinjia well, the groundwater temperature gradually increased with increasing depth; however, at a depth of ~100 m, the change in the water temperature rapidly increased. The thermometer sensor located at a depth of 130 m recorded anomalous changes before multiple earthquakes as type rising-recovery. Orihara et al. [6] suggested that approximately three months prior to the 2011 M9.0 earthquake in Japan, the decrease in water temperature in a spring was caused by the influx of cold water from other aquifers. This indicates that it is easier to observe the abnormal changes before the earthquake in an area which has vertical groundwater movement. The hydrogeological structure near the borehole may influence and control the type of abnormal water temperature changes before an earthquake.

5.2. Influence of Sensor Location on Water Temperature

During 2002–2009 and 2010–2015, the temperature sensor was placed in the Jinjia well at 130 m and 135 m, respectively. The abnormal change ratio of water temperature at these two locations related to earthquakes was compared to analyse the influence of sensor placement.
When the temperature sensor was at 130 m, for four earthquakes with seismic energy density above 10−3 J·m−3, the water temperature recorded the coseismic changes caused by two of the earthquakes, namely the Wenchuan M7.9 earthquake and the Panzhihua M6.0 earthquake (Figure 4 and Figure 7A). However, at 135 m, no significant coseismic water temperature changes were recorded for five earthquakes with seismic energy densities above 10−3 J·m−3.
The seismic energy density was applied to the abnormal changes before the earthquakes, assuming that the impact on the observation point was positively correlated with the energy density of future earthquakes at this location (when the stress and strain gradually accumulate in the seismic source area). The analysis showed that at 130 m, temperature anomalies were observed before four earthquakes with an energy density above 10−3 J·m−3 and even one with an energy density of 4.3 × 10⁻⁴ J·m−3 (Table 1, Figure 7A). At 135 m, for the five earthquakes with seismic energy density above 10−3 J·m−3, only one preseismic water temperature anomaly was recorded (Figure 7B and Figure 8A).
The borehole histogram of the Jinjia well shows that the fault was located at 110–116 m (Figure 2A), and the main water inflow was at a depth of 100–110 m. The lower ratio of coseismic and preseismic changes recorded at 135 m depth may be mainly due to the temperature sensor being further away from the fault. The position of the sensor may be important for pre-earthquake water temperature observations. Fault zones are relatively weak locations. In the process of stress and strain accumulation in the source area, the regional tectonic stress changes. Non-seismogenic faults are prone to deformation and changes in pore pressure or permeability, leading to changes in fluid migration. However, in the case of long distances, the variation is relatively small, and the range of influence is limited. Therefore, the shorter the distance between the sensor and the fault, the higher the probability of water temperature changes related to earthquakes.

5.3. Mechanism of Water Temperature Anomalies

Several mechanisms have been proposed to explain the anomalous change in water temperature prior to an earthquake. Che et al. [37] proposed that the deformation of an aquifer by force leads to water flow movement and heat convection between the well and aquifer, causing a change in water temperature. If borehole water originates from multiple aquifers with different temperatures, the contribution of groundwater from each aquifer should be analysed. Hamza [38] illustrates the abnormal temperature rise in the short time before an earthquake, using deformation-induced leakage at fault zones which intersect at confined aquifers. Cicerone [35] deduced that changes in groundwater circulation patterns are the main cause. New cracks, and widening existing fractures, force the limited groundwater circulation into a deeper position, with an increased temperature. The deep heat conduction and convection lead to an increase in the near-surface water temperature. All mechanisms emphasise the importance of groundwater movement in heat transfer.
It would be favourable to have synchronous observations of water levels to explain water temperature anomalies. From 2002 to 2009, when the 130 m deep sensor was measuring temperatures, there were no corresponding water level observations. Subsequent to the upgrade in 2010, both the water temperature and level were recorded; however, the temperature sensor was placed at a depth of 135 m. From 2010 to 2015, abnormal changes in the water temperature in the Jinjia well were recorded before the 2014 Ludian M6.2 earthquake (317 km from the Jinjia well) [23]. The days of temperature rising (262 d), the anomaly amplitude, and the type (0.011 °C and rising-recovery) before this earthquake were similar to other temperature anomalies mentioned above at a depth of 130 m (Figure 8A). Abnormal changes in the water level were recorded synchronously before the Ludian M6.2 earthquake. Specifically, the water level was defined as the distance from the water surface to the well mouth. Figure 8B showed water level changes between 4.0 and 7.0 m from 2010 to 2015, and the rainfall was a significant factor that induces changes in the water level of the Jinjia well. In the rainy season, the water level rose and fluctuated greatly; outside the rainy season, the water level continued to drop and change, characterised by negligible fluctuations. Before the Ludian M6.2 earthquake, the water level drop in Jinjia was not related to rainfall or other environmental factors.
From the recording of temperature sensors placed at 130 m and 135 m, it can be seen that the recording ability of coseismic and preseismic abnormal changes is closely related to the distance between the sensor and the fault. Therefore, the small change of stress and strain in the fault intersecting with the aquifer may be the main reason for the abnormal change in water level and water temperature.
Among all earthquakes that recorded preseismic abnormal changes in water temperature in the Jinjia well, the farthest one was the Wenchuan M7.9 earthquake, 549 km from the well. The correlation between abnormal changes in the water temperature and long-distance earthquakes is worth further consideration.
An earthquake is a sudden slip of a fault, prior to which might occur a physical process from slow to fast. Consequently, observable precursors should appear before earthquakes. A seismic source is not isolated, and its movement is caused by the coordination of the seismogenic fault. Faults are also not isolated; they are the boundaries of a block. There are at least four interfaces that jointly control the movement of a block. One of which is located at the base, and its activity involves a deep decoupling process. Therefore, earthquake precursors are not limited to the vicinity of the source and the seismogenic fault [39]. It is possible to observe the anomalous changes of tectonically related earthquakes from hundreds of kilometres away. The Jinjia well and the earthquakes in this study are located in the stress-strain active region caused by the eastward movement of the Tibetan Plateau blocked by the SCB (Figure 1A). The borehole penetrates a fault at a depth of 109.2–115.7 m. The important tectonic and structural factor is that the water temperature of the Jinjia well can record changes related to earthquakes. The placement of the temperature sensor is another important factor. According to our research, as the temperature sensor was placed at a depth of 135 m or deeper between 2002 and 2009, the proportion of coseismic or preseismic abnormal changes recorded was less. Therefore, the Jinjia well has a special tectonic setting, well structure, and placement of the temperature sensor; these reasons account for the multiple abnormal changes in water temperature related to earthquakes between 2002 and 2009.
Changes in water temperature before and during earthquakes are inseparable from the movement of groundwater. The heat carried by the water can be used to track the flow of groundwater [16], and this method has been used increasingly in recent years at multiple depths. Fulton and Brodsky [40] reported variations in the fluid transient vertical flow caused by the aftershocks of the 2011 M9.0 Tōhoku earthquake in Japan, using a group of dense, multi-depth, and high-precision temperature sensors. Miyakoshi et al. [19] observed the flow of groundwater caused by earthquakes, using repeated geothermal gradient measurements. Thus, multi-depth temperature observations around the fault will be more beneficial for the comparison of abnormal temperature changes at different locations and aid in understanding the mechanisms involved.

6. Conclusions

Combined with the geological structure, borehole structure, and temperature gradient, this study systematically analysed the temperature changes related to earthquakes in the Jinjia well. The main conclusions are as follows:
(1)
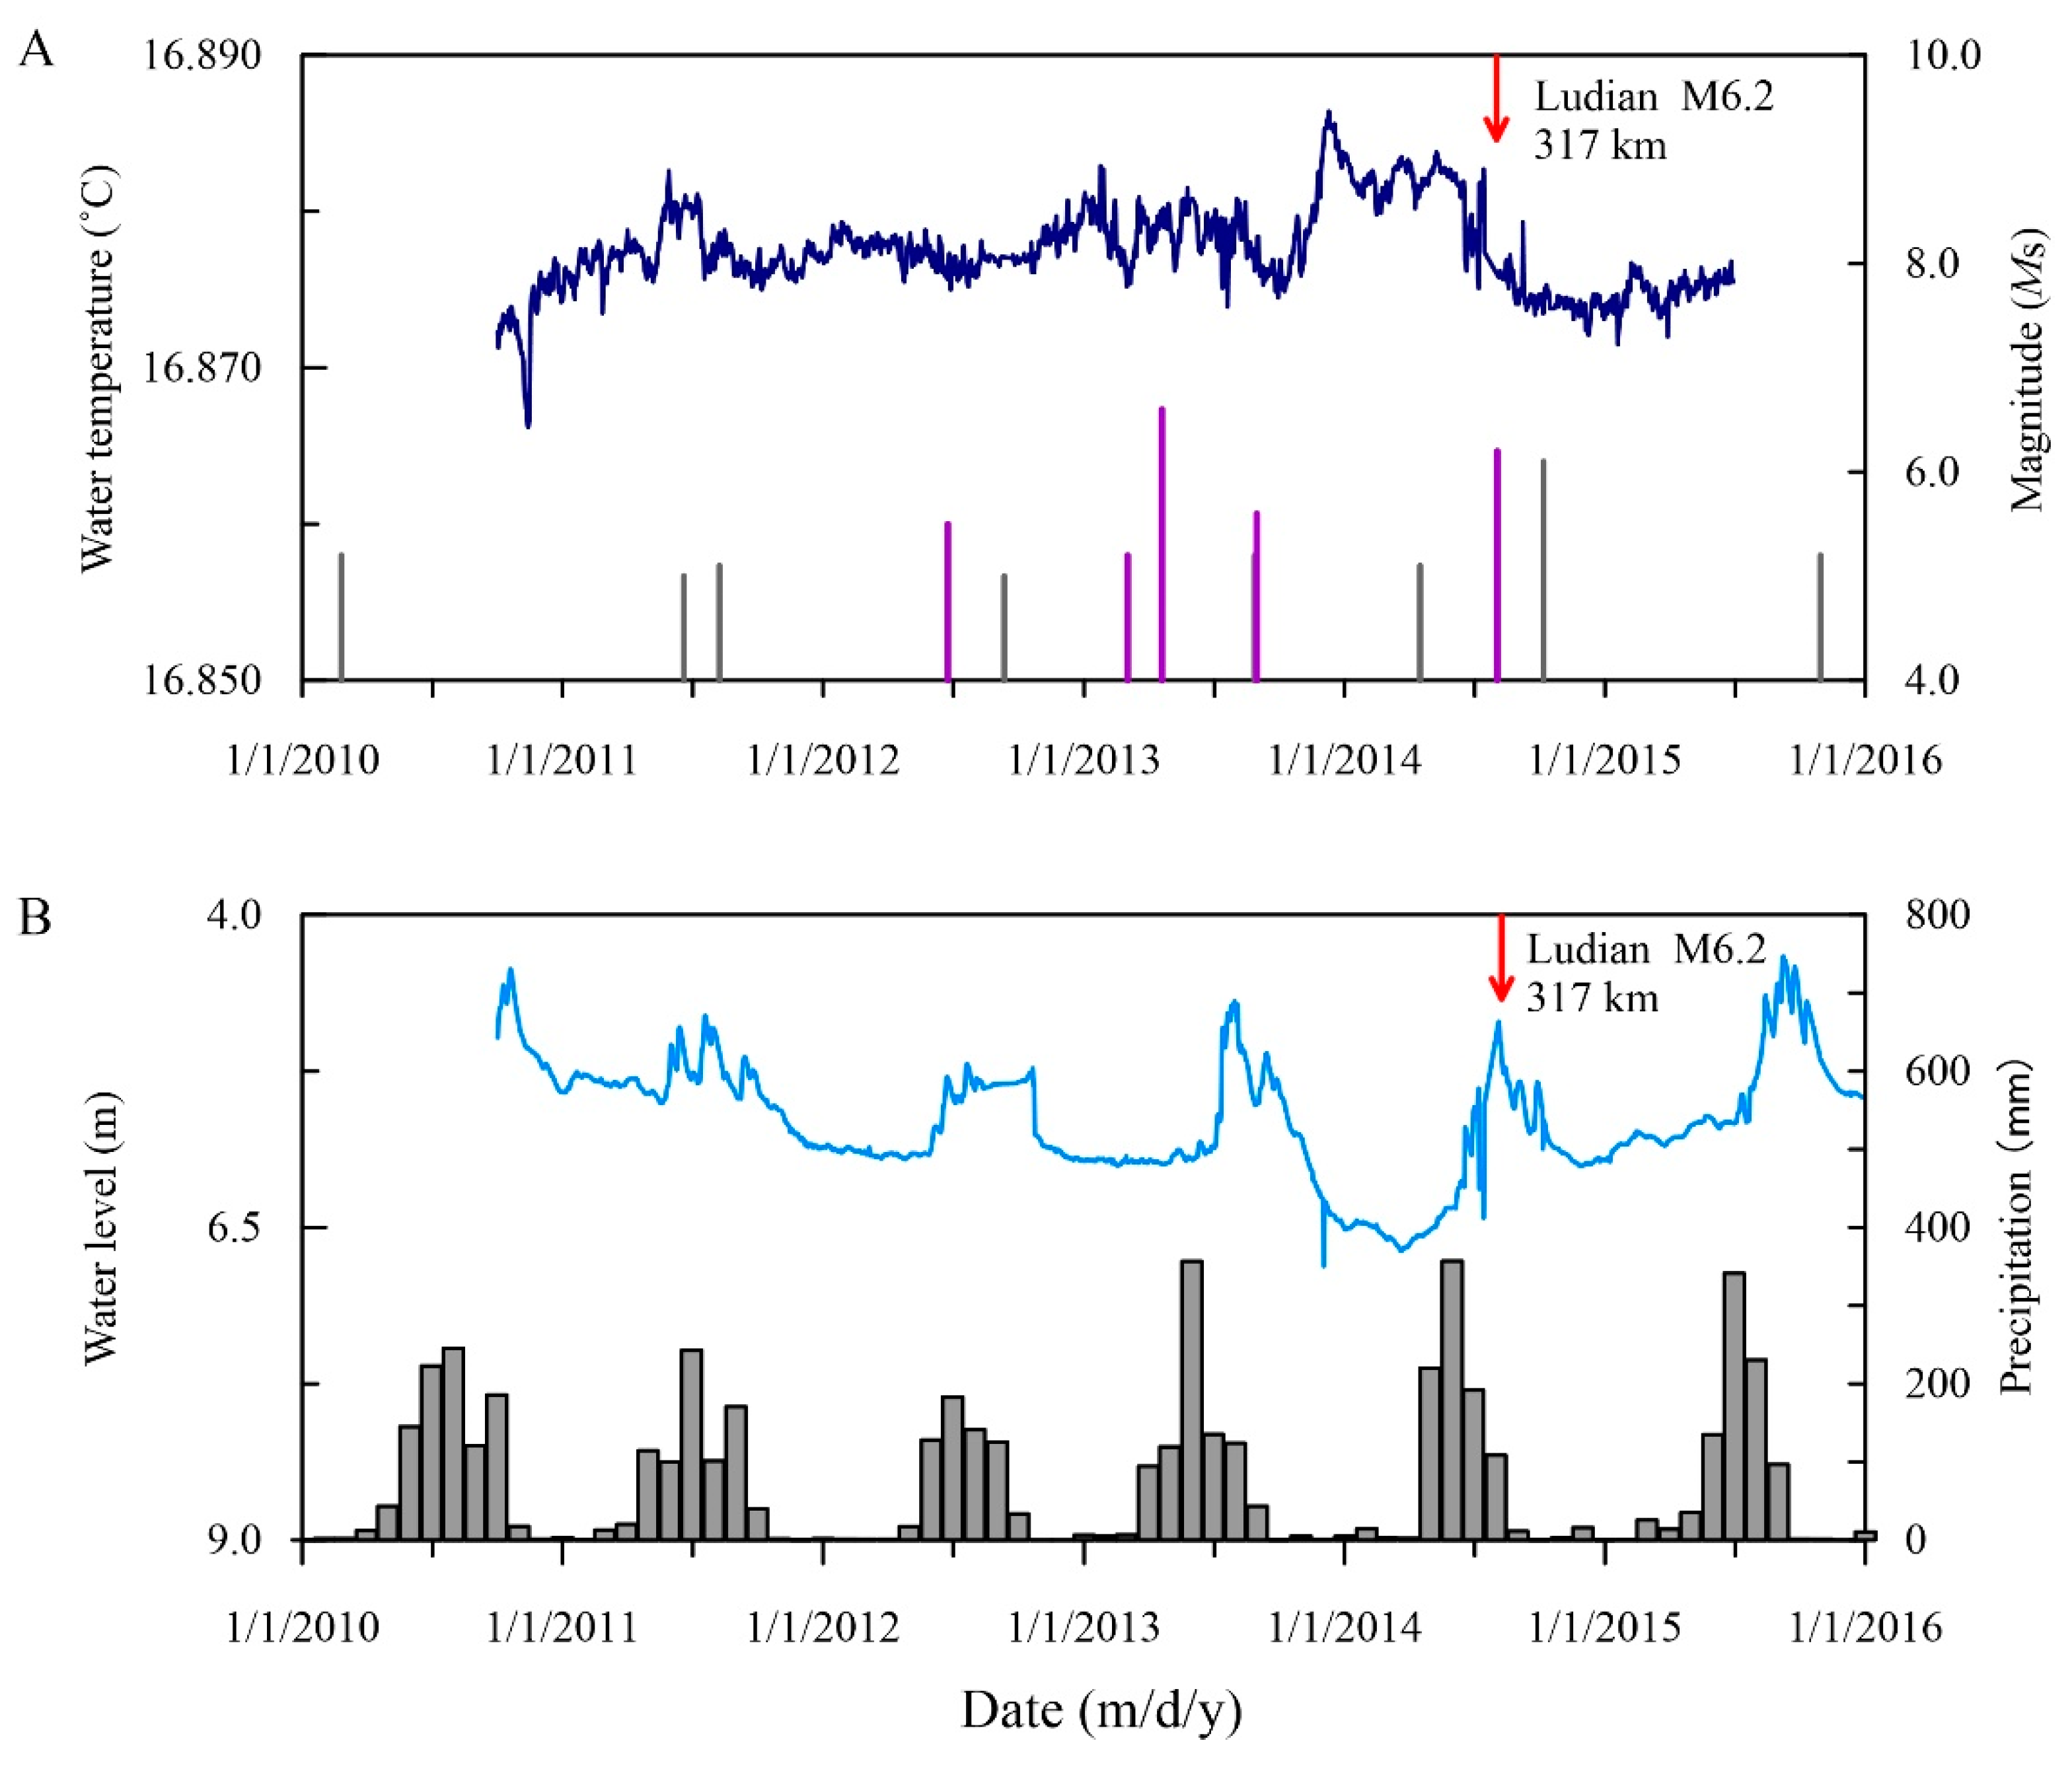
After abnormal changes in water temperature, moderate to strong earthquakes occurred in the surrounding region. The preseismic change of the Jinjia well is rising-recovery (rising to a high value and continuing for a period of time before decreasing or quickly recovering), with an amplitude range of 0.007–0.07 °C. The maximum change (0.07 °C) occurred before the largest earthquake, which was the M7.9 Wenchuan earthquake in 2008. The abnormal duration is 34–242 days.
(2)
Using the Molchan error diagram, the optimum threshold is 16.9533 °C, and the most likely time for an earthquake to occur is within approximately 4 months after the water temperature exceeds the threshold.
(3)
When the temperature sensor was installed at 130 m depth, the ratio of coseismic and preseismic changes for the earthquakes with seismic energy density above 10−3 J·m−3 was higher than that of the sensor at 135 m. The shorter the distance between the sensor and the fault, the higher the probability of water temperature changes related to earthquakes.
The Jinjia well and the earthquakes in this study are located in the stress-strain active region caused by the eastward movement of the Tibetan Plateau blocked by the South China Block. The special tectonic location, well structure, and placement of the temperature sensor were the reasons for the multiple abnormal changes in the water temperature related to earthquakes between 2002 and 2009 in the Jinjia well.
The placement of water temperature probes is important for recording temperature changes related to earthquakes. Multi-parametric monitoring is particularly important both for identifying spurious anomalies and understanding the origin of hydrological changes. Combined water level, multi-depth water temperature, chemical composition of the water [41], and stable isotopes [42] would be more beneficial for studying groundwater flow and understanding the mechanisms related to earthquakes.

Author Contributions

Conceptualization, Z.Y. and S.C.; methodology, Z.Y.; software, Z.Y.; formal analysis, Z.Y., S.C. and L.C.; investigation, L.C.; data curation, Z.Y.; writing—original draft preparation, Z.Y.; writing—review and editing, Z.Y., S.C. and Q.L.; visualization, S.C.; supervision, S.C.; project administration, Z.Y.; funding acquisition, Z.Y. All authors have read and agreed to the published version of the manuscript.

Funding

This work was supported by the National Key Research and Development Program of China (Grant number: 2019YFC1509203), and the Basic Research Funds from the Institute of Geology, China Earthquake Administration (Grant number: IGCEA2002).

Data Availability Statement

Water temperature data used in this study were collected from the National Earthquake Data Center of the China Earthquake Administration (https://data.earthquake.cn) (accessed on 12 September 2020).

Acknowledgments

We thank Yuewen Yang, Shengchang Deng and Qing Li for collecting temperature–depth profiles and rainfall. We thank Bo Wang for helping with the analysis of Molchan error diagram. Three reviewer are appreciated for their thoughtful and helpful comments on the manuscript for further improvement.

Conflicts of Interest

The authors declare no conflict of interest.

References

  1. Nakamura, Y.; Wakita, H. Precise temperature measurement of groundwater for earthquake-prediction study. Pure Appl. Geophys. 1984, 122, 164–174. [Google Scholar] [CrossRef]
  2. Shimamura, H.; Ino, M.; Hikawa, H.; Iwasaki, T. Groundwater microtemperature in earthquake regions. Pure Appl. Geophys. 1984, 122, 933–936. [Google Scholar] [CrossRef]
  3. Fu, Z.Z. The observation and earth-thermal precursor. In Thesis on Geological Tectonic and Stress in Earth Crust (1); Seismological Press: Beijing, China, 1988; pp. 1–8. (In Chinese) [Google Scholar]
  4. Mogi, K.; Mochizuki, H.; Kurokawa, Y. Temperature changes in an artesian spring at Usami in the Izu Peninsula (Japan) and their relation to earthquakes. Tectonophysics 1989, 159, 95–108. [Google Scholar] [CrossRef]
  5. Shi, Y.; Cao, J.; Ma, L.; Yin, B.J. Teleseismic coseis mic well temperature changes and their interpretation. Acta Seismol. Sin. 2007, 29, 265–273. [Google Scholar]
  6. Orihara, Y.; Kamogawa, M.; Nagao, T. Preseismic Changes of the Level and Temperature of Confined Groundwater related to the 2011 Tohoku Earthquake. Sci. Rep. 2014, 4, 6907. [Google Scholar] [CrossRef] [PubMed] [Green Version]
  7. Cox, S.C.; Menzies, C.D.; Sutherland, R.; Denys, P.H.; Chamberlain, C.; Teagle, D.A.H. Changes in hot spring temperature and hydrogeology of the Alpine Fault hanging wall, New Zealand, induced by distal South Island earthquakes. Geofluids 2015, 15, 216–239. [Google Scholar] [CrossRef] [Green Version]
  8. Sun, X.; Xiang, Y.; Shi, Z.; Wang, B. Preseismic Changes of Water Temperature in the Yushu Well, Western China. Pure Appl. Geophys. 2018, 175, 2445–2458. [Google Scholar] [CrossRef]
  9. Chien, S.J.; Chi, W.; Ke, C. Precursory and coseismic groundwater temperature perturbation: An example from Taiwan. J. Hydrol. 2020, 582, 124457. [Google Scholar] [CrossRef]
  10. He, A.; Singh, R.P. Coseismic Groundwater Temperature Response Associated with the Wenchuan Earthquake. Pure Appl. Geophys. 2020, 177, 109–120. [Google Scholar] [CrossRef]
  11. Yan, R. Study on the Characteristics and Mechanism of Hydrological Changes at Banglazhang Hot Spring Site in Longling county, Yunnan Province. Ph.D. Thesis, China University of Geosciences, Beijing, China, 2018. [Google Scholar]
  12. Yan, X.; Shi, Z.; Zhou, P.; Zhang, H.; Wang, G. Modeling earthquake—Induced spring discharge and temperature changes in a fault zone hydrothermal system. J. Geophys. Res. Solid Earth 2020, 125, e2020JB019344. [Google Scholar] [CrossRef]
  13. Yan, R.; Tian, L.; Wang, G.C.; Zhong, J.; Liu, J.; Zhou, Z.H. Review and statistically characteristic analysis of underground fluid anomalies prior to the 2008 Wenchuan Ms8.0 earthquake. Chin. J. Geophys. 2018, 61, 1907–1921. (In Chinese) [Google Scholar]
  14. Ma, Y.C.; Yan, R.; Hu, X.J. The anomaly characteristics of water temperature in the Eryuan well before the 2021Yangbi Ms6.4 earthquake in Yunnan, China. Acta Seismol. Sin. 2021, 43, 674–677. (In Chinese) [Google Scholar] [CrossRef]
  15. Zhong, J.; Feng, X.B.; Wang, B.; Zhou, Z.H.; Ran, R. Analysis on anomalous characteristics of underground fluid before the Menyuan, Qinghai Ms6. 9 earthquake in 2022. J. Seismol. Res. 2022, 45, 308–317. (In Chinese) [Google Scholar]
  16. Anderson, M.P. Heat as a Ground Water Tracer. Ground Water 2005, 43, 951–968. [Google Scholar] [CrossRef]
  17. Wang, C.Y.; Manga, M.; Wang, C.H.; Chen, C.H. Earthquakes and subsurface temperature changes near an active mountain front. Geology 2012, 40, 119–122. [Google Scholar] [CrossRef]
  18. Lee, S.H.; Lee, J.M.; Yoon, H.; Kim, Y.; Hwang, S.; Ha, K.; Kim, Y. Groundwater Impacts from the M5.8 Earthquake in Korea as Determined by Integrated Monitoring Systems. Groundwater 2020, 58, 951–961. [Google Scholar] [CrossRef] [Green Version]
  19. Miyakoshi, A.; Taniguchi, M.; Ide, K.; Kagabu, M.; Hosono, T.; Shimada, J. Identification of changes in subsurface temperature and groundwater flow after the 2016 Kumamoto earthquake using long-term well temperature–depth profiles. J. Hydrol. 2020, 582, 124530. [Google Scholar] [CrossRef]
  20. Wang, C.Y.; Manga, M. Water and Earthquakes; Springer Nature Switzerland AG: Cham, Switzerland, 2021; pp. 231–232. [Google Scholar]
  21. Liu, Y.W.; Sun, X.L.; Wang, S.Q.; Ren, H.W. Relationship of Bore-hole water temperature anomaly and the 2007 Ning’er M6.4 earthquake. J. Seismol. Res. 2008, 31, 347–353. (In Chinese) [Google Scholar]
  22. Fu, H.; Zhao, X.Y. Analysis on remarkable precursory anomalies observed in Yunnan area before Wenchuan Ms8.0 earthquake. Acta Seismol. Sin. 2013, 35, 477–484. (In Chinese) [Google Scholar]
  23. Yang, Z.Z.; Deng, Z.H.; Yang, Y.W.; Deng, S.C. Study for abnormal variations of underground fluid in Lijiang area, Yunnan Province before Ludian Ms6.5 earthquake in 2014. Seismol. Geol. 2018, 40, 480–498. (In Chinese) [Google Scholar]
  24. Zhang, P.Z.; Shen, Z.; Wang, M.; Gan, W.; Bürgmann, R.; Molnar, P.; Wang, Q.; Niu, Z.; Sun, J.; Wu, J.; et al. Continuous deformation of the Tibetan Plateau from global positioning system data. Geology 2004, 32, 809–812. [Google Scholar] [CrossRef]
  25. Xu, X.W.; Wen, X.Z.; Yu, G.H.; Chen, G.H.; Klinger, Y.; Hubbard, J.; Shaw, J. Coseismic reverse- and oblique-slip surface faulting generated by the 2008 Mw 7.9 Wenchuan earthquake, China. Geology 2009, 37, 515–518. [Google Scholar] [CrossRef]
  26. Li, H.B.; Wang, Z.X.; Fu, X.F.; Si, J.L.; Qiu, Z.H.; Li, N.; Wu, F.R.; Hou, L.W. The surface rupture zone distribution of the Wenchuan earthquake (Ms 8.0) happened on May 12th, 2008. Geol. China 2008, 35, 803–813. (In Chinese) [Google Scholar]
  27. Zhang, P.Z.; Deng, Q.D.; Zhang, G.M.; Ma, J.; Gan, W.J.; Min, W.; Mao, F.Y.; Wang, Q. Active tectonic blocks and strong earthquakes in the continent of China. Sci. China Ser. D Earth Sci. 2003, 46, 13–24. [Google Scholar]
  28. Kang, X.B.; Wang, Y.; Zhang, H.; Cao, J. Hydrogeologic features and influence factors of zero flow of the Heilongtan spring groups in Lijiang. Carsologica Sin. 2013, 32, 398–403. (In Chinese) [Google Scholar]
  29. Xiang, H.F.; Xu, X.W.; Guo, S.M.; Zhang, W.X.; Li, H.W.; Yu, G.H. Sinistral Thrusting Along the Lijiang-Xiaojinhe Fault Since Quaternary And its Geologic-Tectonic Significance-shielding effect of transverse structure of intracontinental active block. Seismol. Geol. 2002, 24, 188–198. (In Chinese) [Google Scholar]
  30. Institute of Geology, State Seismological Bureau, Seismological Bureau of Yunnan Province. Active Faults in the Northwest Yunnan Region; Seismological Press: Beijing, China, 1990; p. 69. (In Chinese) [Google Scholar]
  31. Wang, C.Y.; Manga, M. Hydrologic responses to earthquakes and a general metric. Geofluids 2010, 10, 206–216. [Google Scholar]
  32. Molchan, G.M. Strategies in strong earthquake prediction. Phys. Earth Planet. Inter. 1990, 61, 84–98. [Google Scholar] [CrossRef]
  33. Molchan, G.M. Structure of optimal strategies of earthquake prediction. Tectonophysics 1991, 193, 267–276. [Google Scholar] [CrossRef]
  34. Jordan, T.H. Earthquake predictability, brick by brick. Seismol. Res. Lett. 2006, 77, 3–6. [Google Scholar] [CrossRef]
  35. Cicerone, R.D.; Ebel, J.E.; Britton, J. A systematic compilation of earthquake precursors. Tectonophysics 2009, 476, 371–396. [Google Scholar] [CrossRef]
  36. Tian, L.; Wang, B.; Yan, R.; Zhou, Z.H. Temperature anomaly changes of Litang hot spring before major earthquakes and its forcast efficiency. Earthq. Res. China 2022, 38, 213–225. (In Chinese) [Google Scholar]
  37. Che, Y.T.; Liu, C.L.; Yu, J.Z. Micro-behavior of well-water temperature and its mechanism. Earthquake 2008, 4, 20–28. (In Chinese) [Google Scholar]
  38. Hamza, V.M. Tectonic leakage of fault bounded aquifers subject to non-isothermal recharge: A mechanism generating thermal precursors to seismic events. Phys. Earth Planet. Inter. 2001, 126, 163–177. [Google Scholar] [CrossRef]
  39. Ma, J. On “whether earthquake precursors help for prediction do exist”. Chin. Sci. Bull. 2016, 61, 409–414. [Google Scholar] [CrossRef] [Green Version]
  40. Fulton, P.M.; Brodsky, E.E. In situ observations of earthquake-driven fluid pulses within the Japan Trench plate boundary fault zone. Geology 2016, 44, 851–854. [Google Scholar] [CrossRef] [Green Version]
  41. Skelton, A.; Andrén, M.; Kristmannsdóttir, H.; Stockmann, G.; Mörth, C.-M.; Sveinbjörnsdóttir, Á.; Jónsson, S.; Sturkell, E.; Guðrúnardóttir, H.R.; Hjartarson, H.; et al. Changes in groundwater chemistry before two consecutive earthquakes in Iceland. Nat. Geosci. 2014, 7, 752–756. [Google Scholar] [CrossRef]
  42. Hosono, T.; Yamada, C.; Manga, M.; Wang, C.Y.; Tanimizu, M. Stable isotopes show that earthquakes enhance permeability and release water from mountains. Nat. Commun. 2020, 11, 2776. [Google Scholar] [CrossRef] [PubMed]
Figure 1. (A) Tectonic background of the Jinjia well and the distribution of earthquakes (M5.0–6.0 within 300 km, and ≥M6.0 within 600 km) from 1 January 2002 to 31 December 2009. The inset map shows the tectonic background of the study area. The elevation data were extracted from the 1 km digital elevation model (DEM) data downloaded from https://www.ngdc.noaa.gov/mgg/topo/gltiles.html (accessed on 16 October 2017). SYB: Sichuan-Yunnan Block; SB: Sichuan Basin; SCB: South China Block; LMSF: Longmenshan fault zone; XSHF: Xianshuihe fault zone; ANXJF: Anninghe-Xiaojiang fault zone; HHF: Honghe fault; LJXJF: Lijiang-Xiaojinhe fault. (B) Geologic map of the Jinjia well.
Water 15 02905 g001
Figure 2. (A) Wellbore structure and sketch of the measurement system in the Jinjia well, and (B) water temperature and gradient values at different depths.
Water 15 02905 g002
Figure 3. Time series for the Jinjia well from 2002 to 2009 for (A) hourly water temperature (the red vertical lines indicate earthquakes with location and magnitude marked; two pink rectangles indicate the two durations of no earthquake and stable water temperature for the standard deviation calculation) and (B) hourly barometric pressure and monthly precipitation.
Water 15 02905 g003
Figure 4. Curves showing two coseismic water temperature changes in the Jinjia well for earthquakes: (A) Wenchuan M7.9 earthquake on 12 May 2008, (B) Panzhihua M6.0 earthquake on 30 August 2008. The grey dotted lines denote the origin time of the two earthquakes.
Water 15 02905 g004
Figure 5. Curves showing five abnormal changes in water temperature in the Jinjia well for earthquakes with location, magnitude, and distance from the well marked: (A) Dayao M6.0 earthquake on 21 July 2003, (B) Ninger M6.1 earthquake on 3 June 2007, (C) Wenchuan M7.9 earthquake on 12 May 2008, (D) Panzhihua M6.0 earthquake on 30 August 2008, and (E) Yaoan M5.7 earthquake on 9 July 2009. The vertical dotted line indicates the occurrence of the earthquake, labelled as 0 days.
Water 15 02905 g005
Figure 6. Molchan test results. The blue line (A) represents the daily time series of water temperature in the Jinjia well; the vertical lines represent earthquakes around the Jinjia well (M5.0–6.0 earthquakes within 300 km and ≥M6.0 earthquakes within 600 km), with the purple vertical lines representing the earthquakes with a seismic energy density ≥10−3 J·m−3. The hollow circle (B) represents the location where the time fraction occupied by the alarm and the seismic miss rate are both small, corresponding to the threshold (A).
Water 15 02905 g006
Figure 7. Distribution of water temperature changes in the Jinjia well as a function of earthquake magnitude and distance (M5.0–6.0 within 300 km, and ≥M6.0 within 600 km) at 130 m depth from 2002 to 2009 (A) and at 135 m depth from 2010 to 2015 (B). Also plotted are the log (epicentre distance, r) versus earthquake magnitude (M) contours of constant seismic energy density. Data and sources of the water temperature changes are listed in Table 1, Figure 6 and Figure 8. The numbers indicate the amplitude of the water temperature anomalies.
Water 15 02905 g007
Figure 8. Time series of the Jinjia well for (A) water temperature and (B) water level (blue line) and monthly precipitation (grey bars). The vertical lines represent earthquakes around the well (M5.0–6.0 within 300 km and ≥M 6.0 within 600 km), with the purple lines representing the earthquakes with a seismic energy density ≥10−3 J·m−3. The red arrow represents the Ludian M6.2 earthquake on 3 August 2014.
Water 15 02905 g008
Table 1. Earthquakes with preseismic water temperature anomaly in the Jinjia well from 1 January 2002 to 31 December 2009.
Date
(d/m/y)
Longitude
(E°)
latitude
(N°)
Magnitude
(Mw)
LocationEpicentral Distance, r
(km)
e
(J·m−3)
Duration
(d)
Anomaly
(°C)
21 July 2003101.29 25.98 6.0 Dayao1468.4 × 10−32420.01
3 June 2007101.05 23.03 6.1 Ninger4364.3 × 10−4400.03
12 May 2008103.32 31.00 7.9 Wenchuan5498.8 × 10−22310.07
30 August 2008101.89 26.24 6.0 Panzhihua1804.5 × 10−3340.007
9 July 2009101.10 25.63 5.7 Yaoan1632.2 × 10−32220.016
Note: e represents the seismic energy density, which was calculated from log (r) = 0.48M − 0.33 log e(r) − 1.4 [31]. The duration is the number of days between the water temperature of the well beginning to rise and the date of the earthquake.
Table 2. The preseismic water temperature anomalies in previous studies and in this study.
Observation StationEarthquake (Year)Magnitude
(M)
Extent of Anomaly
(°C)
Type of AnomalyDuration
(d)
Epicentral Distance
(km)
spring, Japan aIzu-Oshima-kinkai (1978)
Izu-Hanto-Toho-Oki (1980)
7.0
6.7
1~2rising~3–30016–31
spa, Japan bTohoku in 20119.01~2declining~90155
well, China cWenchuan (2008 and others) 5.0–7.90.01–0.03declining-recovery29–12722–690
well, China dWenchuan (2008 and others) 6.0–7.90.007–0.07rising-recovery34–242100–560
Note: a Mogi et al. [4]; b Orihara et al. [6]; c Sun et al. [8]; d this study.
Disclaimer/Publisher’s Note: The statements, opinions and data contained in all publications are solely those of the individual author(s) and contributor(s) and not of MDPI and/or the editor(s). MDPI and/or the editor(s) disclaim responsibility for any injury to people or property resulting from any ideas, methods, instructions or products referred to in the content.

