1. Introduction
Easterly low-pressure structures form the WDs across the region of the Mediterranean. They lose their marked frontal structure while moving eastward to reach India [
1]. Specifically in the western Himalayan region on the west coast of India and the adjacent Arabian region during the winter, these WDs generate heavy precipitation, cool waves, snowfall, avalanche release, fog, frost, rainstorms, hailstorms, and thunderstorms during the post-monsoon period [
2]. The WDs’ interactions with the terrain of the northern region affect rainfall. Precipitation across northern India is also influenced by topographical elements [
3].
Orographic precipitation produces a large amount of freshwater consumed by humans. Throughout hills and mountains, rainfall is formed by competing cloud systems using several ways, like the front, convection, and topographic elevations; this aids in the condensation of moisture into liquid or solid rainfall [
4]. Across different regions of the world, snowfall accumulates throughout mountainous regions and provides a vital freshwater repository [
5]. Moreover, orographic precipitation is affected by a combination of factors, including geographical features, cross-mountain width, low-level water content, mountain height, atmospheric stability, upslope velocity, and surface temperature; water vapor condenses in the chemical composition, concentration, and size spectrum of aerosols [
6,
7].
Beginning in February, WDs are the principal sources of water in this region, which has a population of over a billion people. The WDs provide water for human use, hydroelectric power generation, and irrigated agriculture [
7]. A significant quantity of anthropogenic aerosols are created by industrial growth, urbanization, or other human activities; the Indian subcontinent’s Indo-Gangetic Plain (IGP) area seems to be the most prominent source [
8,
9].
In terms of climatic factors, the interaction of aerosols–clouds–precipitation (ACP) is mainly regarded as an indirect influence of aerosols [
10,
11,
12]. Because this interaction is incredibly challenging and inconsistent and shows regional fluctuation, it requires a specific analysis [
13]. Atmospheric aerosols contribute significantly to cloud formation by acting as CCNs. Consequently, the cloud albedo increases and changes in the cloud lifetime occur [
14]. More latent heat is released and aids in the start of energetic updrafts by rainfall delay, leading to droplet freezing [
15,
16].
The aerosol loading impacts on the Indian monsoon have been studied through correlation analyses [
17,
18]. Aerosols influence rainfall patterns in many ways, including semi-direct, indirect, and direct effects [
19,
20]. The level of radiation is decreased by direct aerosols absorbing and scattering incoming astral energy, which reaches the Earth’s surface [
21]. Warm cloud precipitation is decreased, and the water particle level is affected by the enhancement of CCN with steady liquid water [
22,
23].
The CCN controls the mixed convective cloud phase through the effect of hygroscopic aerosols due to cooling and riming, which can change according to changes in the length and density of cloud droplets. Dirty and clean atmospheres may experience distinct changes [
24]. Furthermore, in a clean atmosphere, the region of the convective cloud’s mixed phase is more profound than in a polluted atmosphere [
25]. Due to precipitation and cloud formation incidence, distinguishing the influence of climatology is difficult when significant aerosols are present.
Various observational [
26] and modeling approaches [
27,
28] indicate that aerosols from near and distant sources, whether artificial or natural, affect daily-to-seasonal variations of monsoonal rainfall. Over monsoon regions, among numerous rainfall seasons in India, aerosol loading is significantly associated with cloud invigoration and cloud droplet effective radius, and cloud growth is suppressed through a negative association evident during periods of low rainfall [
29]. Aerosols slow the collision–coalescence (CC) process, and they have a positive impact on the development of clouds since they are negatively correlated with CTT (cloud top temperature) and CTP (cloud top pressure) and positively correlated with the CF. As a result, monsoon rainfall rises. During the monsoon season, the number of dry days increases, and precipitation is suppressed by the influence of local aerosols in the South Asian region. On the other hand, isolated aerosols enhance the frequency of rainy episodes northwest of the Indian subcontinent [
30].
Aerosols also influence the dynamic and microphysical structures of cumulus and stratocumulus clouds and the mechanisms of rainfall [
31,
32]. Much research indicates that aerosols suppress the rain produced by CC development [
33], while other studies suggest an overall increase in rain rate (Polson et al., 2014). However, the correlation analysis model’s simulation results indicate that in moderately dirty environments, if the initial formation of convective clouds is delayed, the rainfall intensity decreases [
34,
35].
In addition to recognizing the challenges for the interaction of ACP as previously mentioned, the current study attempts to examine and comprehend the following: (1) relevant weather and climate describes the effects of western disturbances during February 2016; (2) prevalent aerosol qualities; (3) relevant cloud microphysical parameters; and (4) consecutive rainfall incidence, as well as distributions over the studied region.
The main contributions of this research include:
The potential impact of aerosols on cloud and droplet formation;
Identifying the cloud’s microphysical properties;
Governing the amount of successive precipitation and distribution with western disturbance over the study area during February 2016.
Although recognizing the difficulties of ACP interaction outlined above, the current research focuses on investigating and analyzing:
Section 2 describes the observational challenges and the datasets used.
Section 3 represents the methods for classifying dirty/clean days and generating mixed precipitation and cloud parameters.
Section 4 discusses the findings and associated uncertainty and provides an in-depth description of the underlying mechanisms. Lastly,
Section 5 describes the significant findings and conclusions.
2. Problem Statement
Research is needed to address current modeling and observational issues to reduce the uncertainty of climate forecasts. Secondary ice production often conceals observations of ice nucleation, limiting observation. In ecology, various elements like temperature, relative humidity, aerosol characteristics, and even if there are other hydrometeors, should influence ice nucleation. Because the diversity of each aspect is so great in real contexts, developing a consistent parameterization relevant to all scenarios is extremely difficult.
Most present climate models underestimate aerosol features such as aerosol optical depth and fail to reflect the magnitude and distribution of WDs.
In a convective cloud, the mixed-phase area is shallower in a clean atmosphere than in a polluted one. On the other hand, the influence of meteorology is challenging to detect.
To overcome these challenges using an ERA-Interim reanalysis ensemble with back trajectory simulation at various climate regions through integrating satellite and in situ aircraft observations provide a strategy to obtain data.
3. Spatial Location, Data, and Processing Method
The current research relates the Aerosol Orographic Precipitation Interaction that occurs when WDs affect the west coast of India and the adjacent Arabian Sea region that is affected by unseasonal precipitation. The weather in India is tropical dry/wet, and semi-arid. In the western part of India, the daily high temperature in the winter are below 15 °C, and in summer is above 40 °C [
36]. In this research, satellite and situ observations were utilized. Among aerosol–cloud microphysics, for correlation analysis have used AOD retrievals, CTP, CWP (cloud water path), CTT, cloud effective radius (CER), Ångström exponent (AE), COD (cloud optical depth), and CF from the Aqua spacecraft’s (MODIS) Moderate Resolution Imaging Spectroradiometer [
37]. The Aqua satellite MODIS, level-3 products are used. The retrieved datasets are 1° × 1° resolution, and also 550 nm wavelength [
38,
39]. The MODIS AOD has been established comprehensively overland [
40].
With information from India Meteorological Department (IMD, a new dataset (0.25° × 0.25° gridded), high-resolution daily rainfall (RF) was prepared, and then utilized to signify the surface accumulated precipitation [
41]. The quality-ensured quantities of RF are used in the country utilizing an inverse distance-weighted interpolation. Against previous IMD rainfall products, this product is comprehensively exclaimed and evaluated for precipitation [
41], and the APHRODITE is used. Various researchers investigate the climatology of rainfall and its intra-seasonal and inter-seasonal variability using the periodic precipitation modeled datasets from the IMD [
42,
43].
According to data from CALIPSO, aerosol transport from the northwest, dry areas into the western disturbances and over India is found to be vertically extended to high altitudes (up to 5 km). According to historical rainfall statistics, the early summer monsoon rainfall across India increased by more than 20% for the pre-mature, mature, and dissipating phases. A potential prospect of an evolving rainfall pattern with a wetter monsoon over India in early summer followed by a drier phase is suggested by an integrated analysis of changes in summer monsoon rainfall and tropospheric temperatures over the past three decades.
In the lack of concealed cloud contamination is 0.05 ± 0.15τ and 0.03 ± 0.05τ for the uncertainty of MODIS AOD among land and ocean [
44], where AE denotes distinctive spectral characteristics, τ indicates the optical depth, and the size distribution of aerosols are indicated as α.
In this research, the (LWP) liquid water path (gm
−2) utilized is essentially a CER and COD (μ) derived product, reflecting the quantity of ice water or liquid that has been integrated into the atmospheric column [
45]. Cloud LWP (gm
−2) of non-raining and raining clouds is received using “10 to 87 GHz” channel frequencies of “22 GHz” channel for vertically polarized MODIS [
46]. Considering radiative transfer principles, near-surface wind speed, upwelling radiation’s effective radiative temperature, columnar cloud liquid water content, columnar water vapor, and rainfall rate, CF is determined using a 41 km radius across the pixel. And it is the percentage of each pixel covered by a cloud [
47]. CER (μ) represents the cloud droplet mean radius (weighted) [
48]. For optically dense clouds, the CER variation range is within 1.0–3.0
[
49]. The recovered MODIS-CER has a standard deviation of 0.11
[
50]. MODIS water-absorbing (1.6, 2.1, and 3.7
) and non-absorbing (0.65 m for land) bands are combined to calculate the COD. COD’s level of uncertainty might range from 10% to 21%. To generate CTT (K) estimates that can be connected to CTP, the radiance ratio approach is employed [
50].
For precipitation analysis, daily rainfall data from the (TRMM-3B42) Tropospheric Rainfall Measuring Mission (version 7) are utilized. The dataset’s grid size is 0.25° × 0.25°. Furthermore, for examining the current meteorological conditions, ERA-Interim global analysis data at noon (
http://apps.ecmwf.int/datasets accessed on February 2016) spatial resolution of 0.25° UTC is used from ECMWF, and for this reason, considered the climatic variables like wind field, relative humidity (RH), and near-surface temperature (at 1000 hPa) [
51]. The range in the RH fields and ERA-Interim temperature is 0.4 percent and 0.05; accordingly, HYSPLIT back-trajectory daily analysis is given to air mass movement across the Indian region [
52]. The description of the dataset of our proposed research is shown in
Table 1.
Based on the overall impact of climate, the WDs in February 2016 were split into 3 phases: (12–16 February) pre-mature; (17–22 February) mature; and (23–28 February) dissipating [
12]. With a two-sample Student’s
t-test, the probability (P) range of MODIS recovered cloud characteristics and AOD between these occurrences was analyzed. The
p-value shows the datasets with a 95% confidence level. To calculate the correlation coefficient, the Pearson method is used in this research.
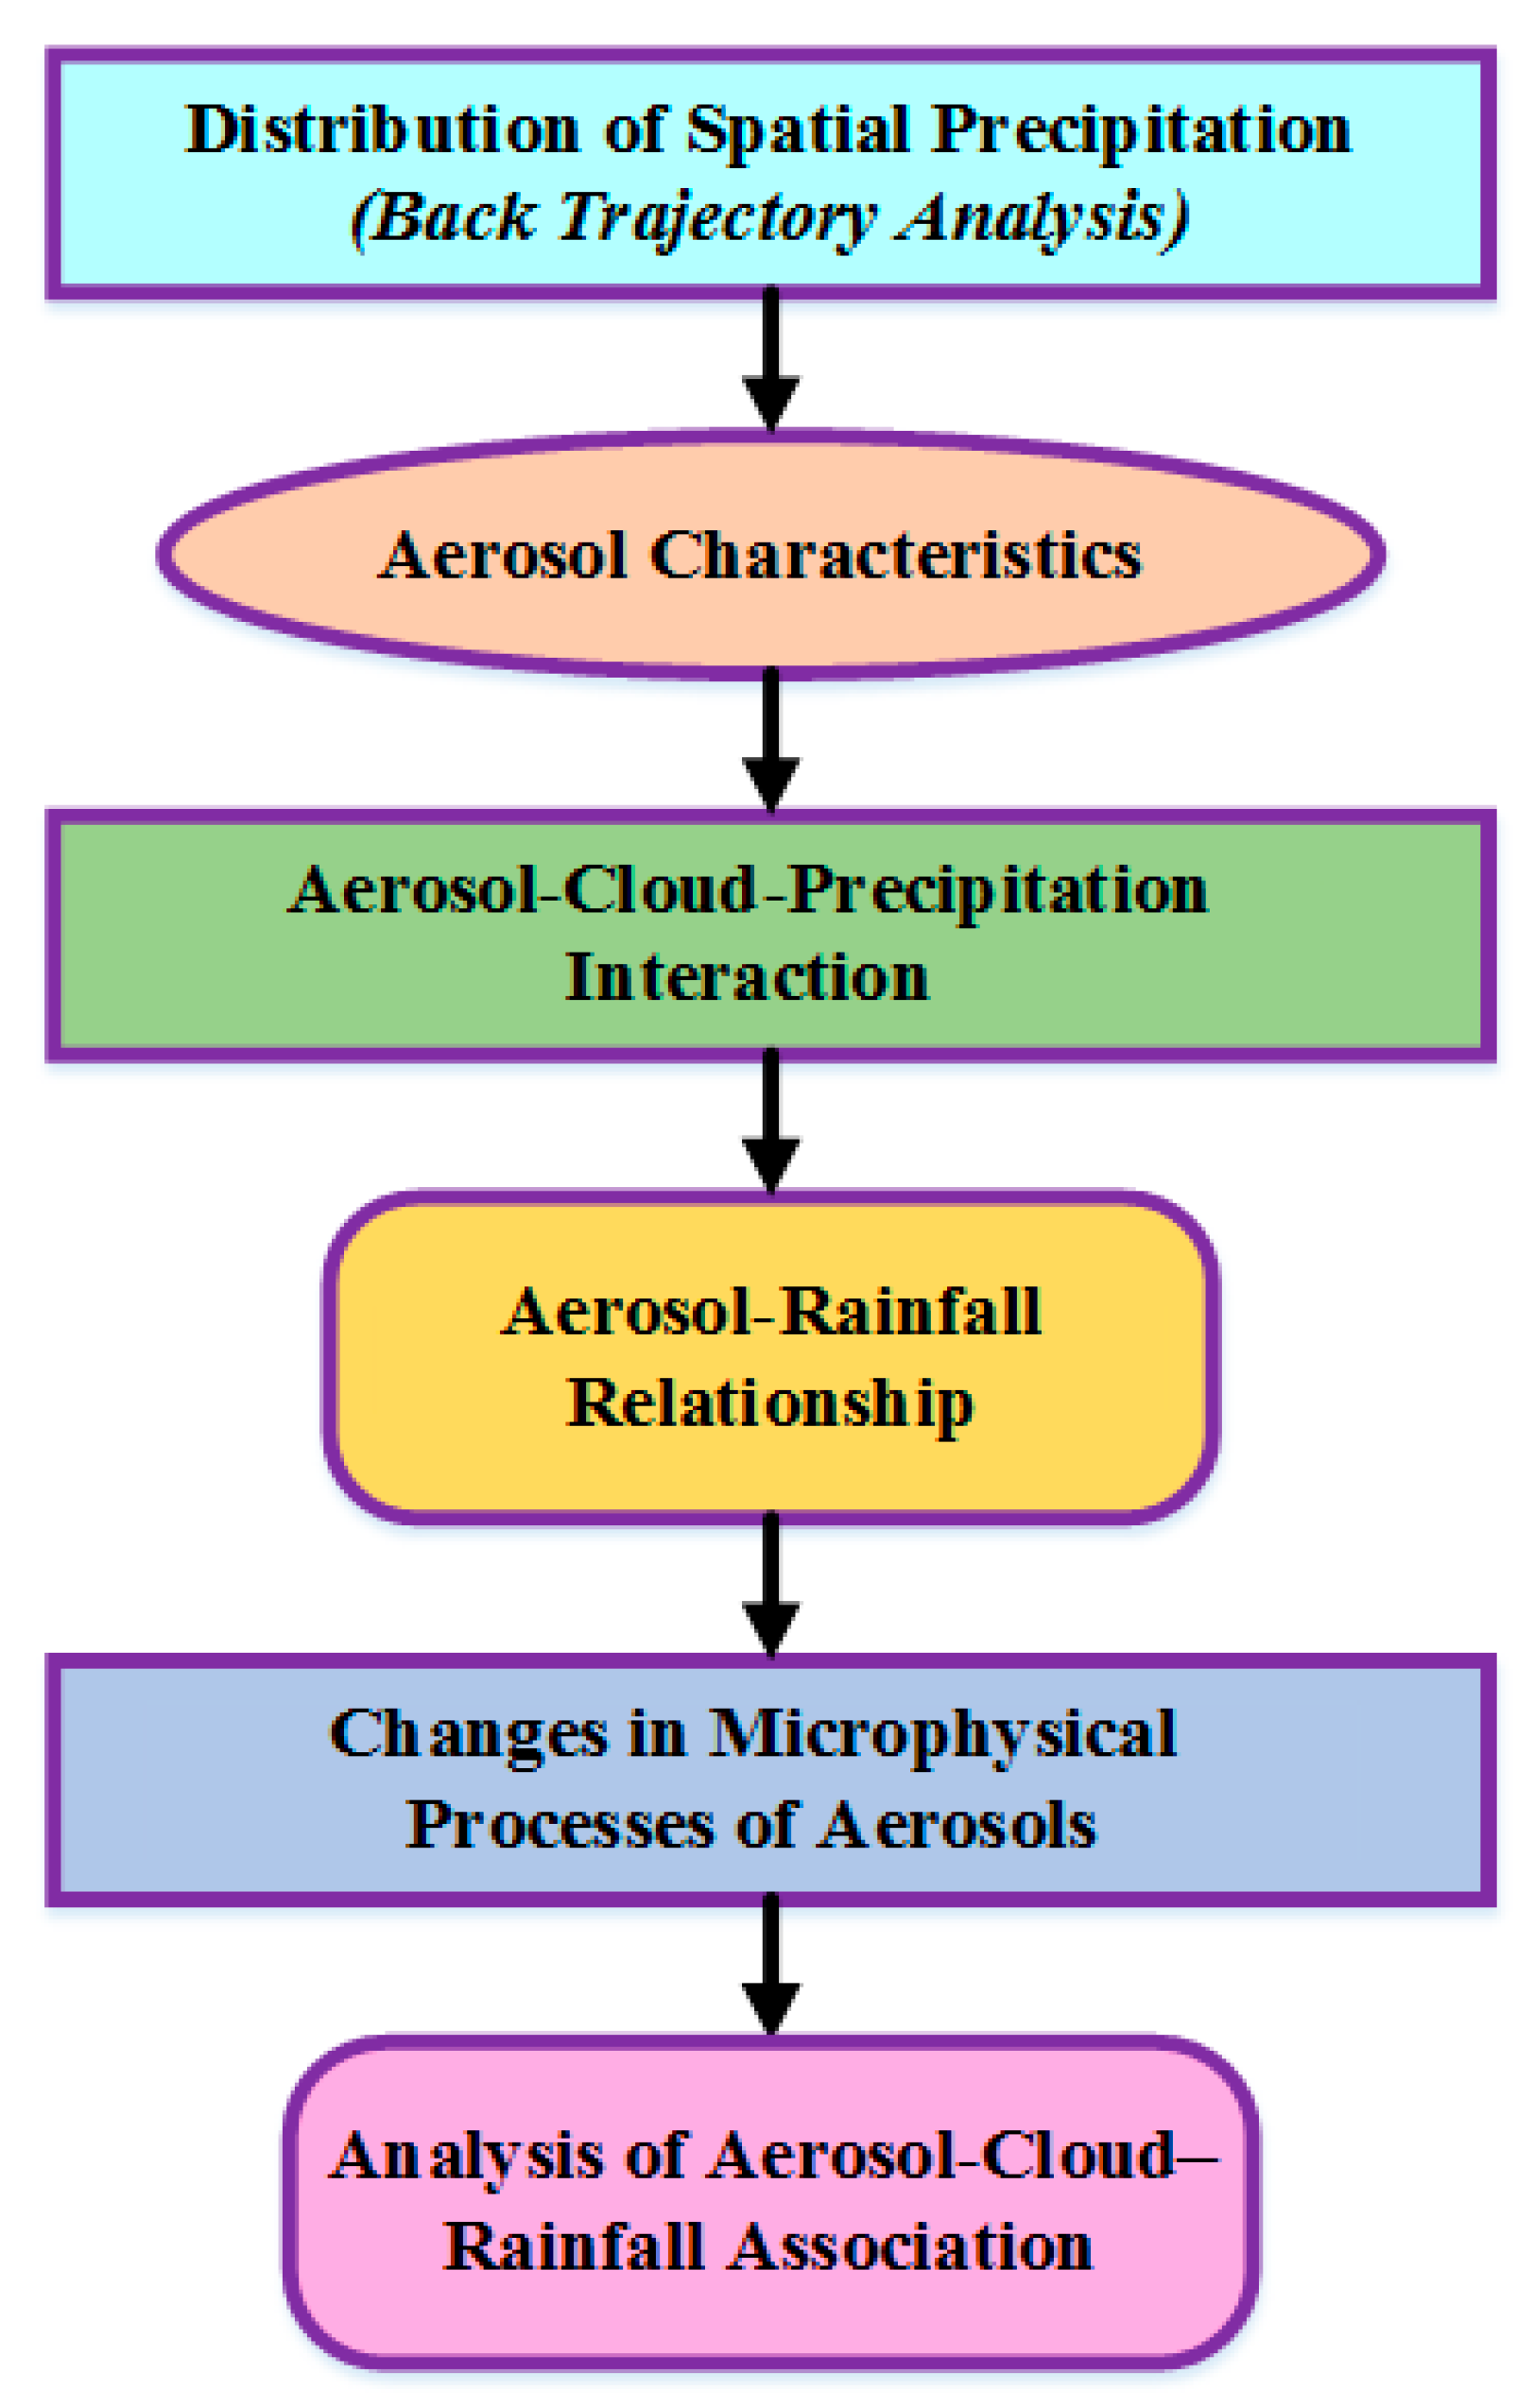
To analyze ACP interaction among the west coast of India and adjacent Arabian regions during the WDs, for 12–28 February 2016, all datasets are considered based on the prevailing weather circumstances. As a result, the following section analyzes and presents the relevant results. The flowchart of the proposed methodology is given in
Figure 1.
4. Results and Discussion
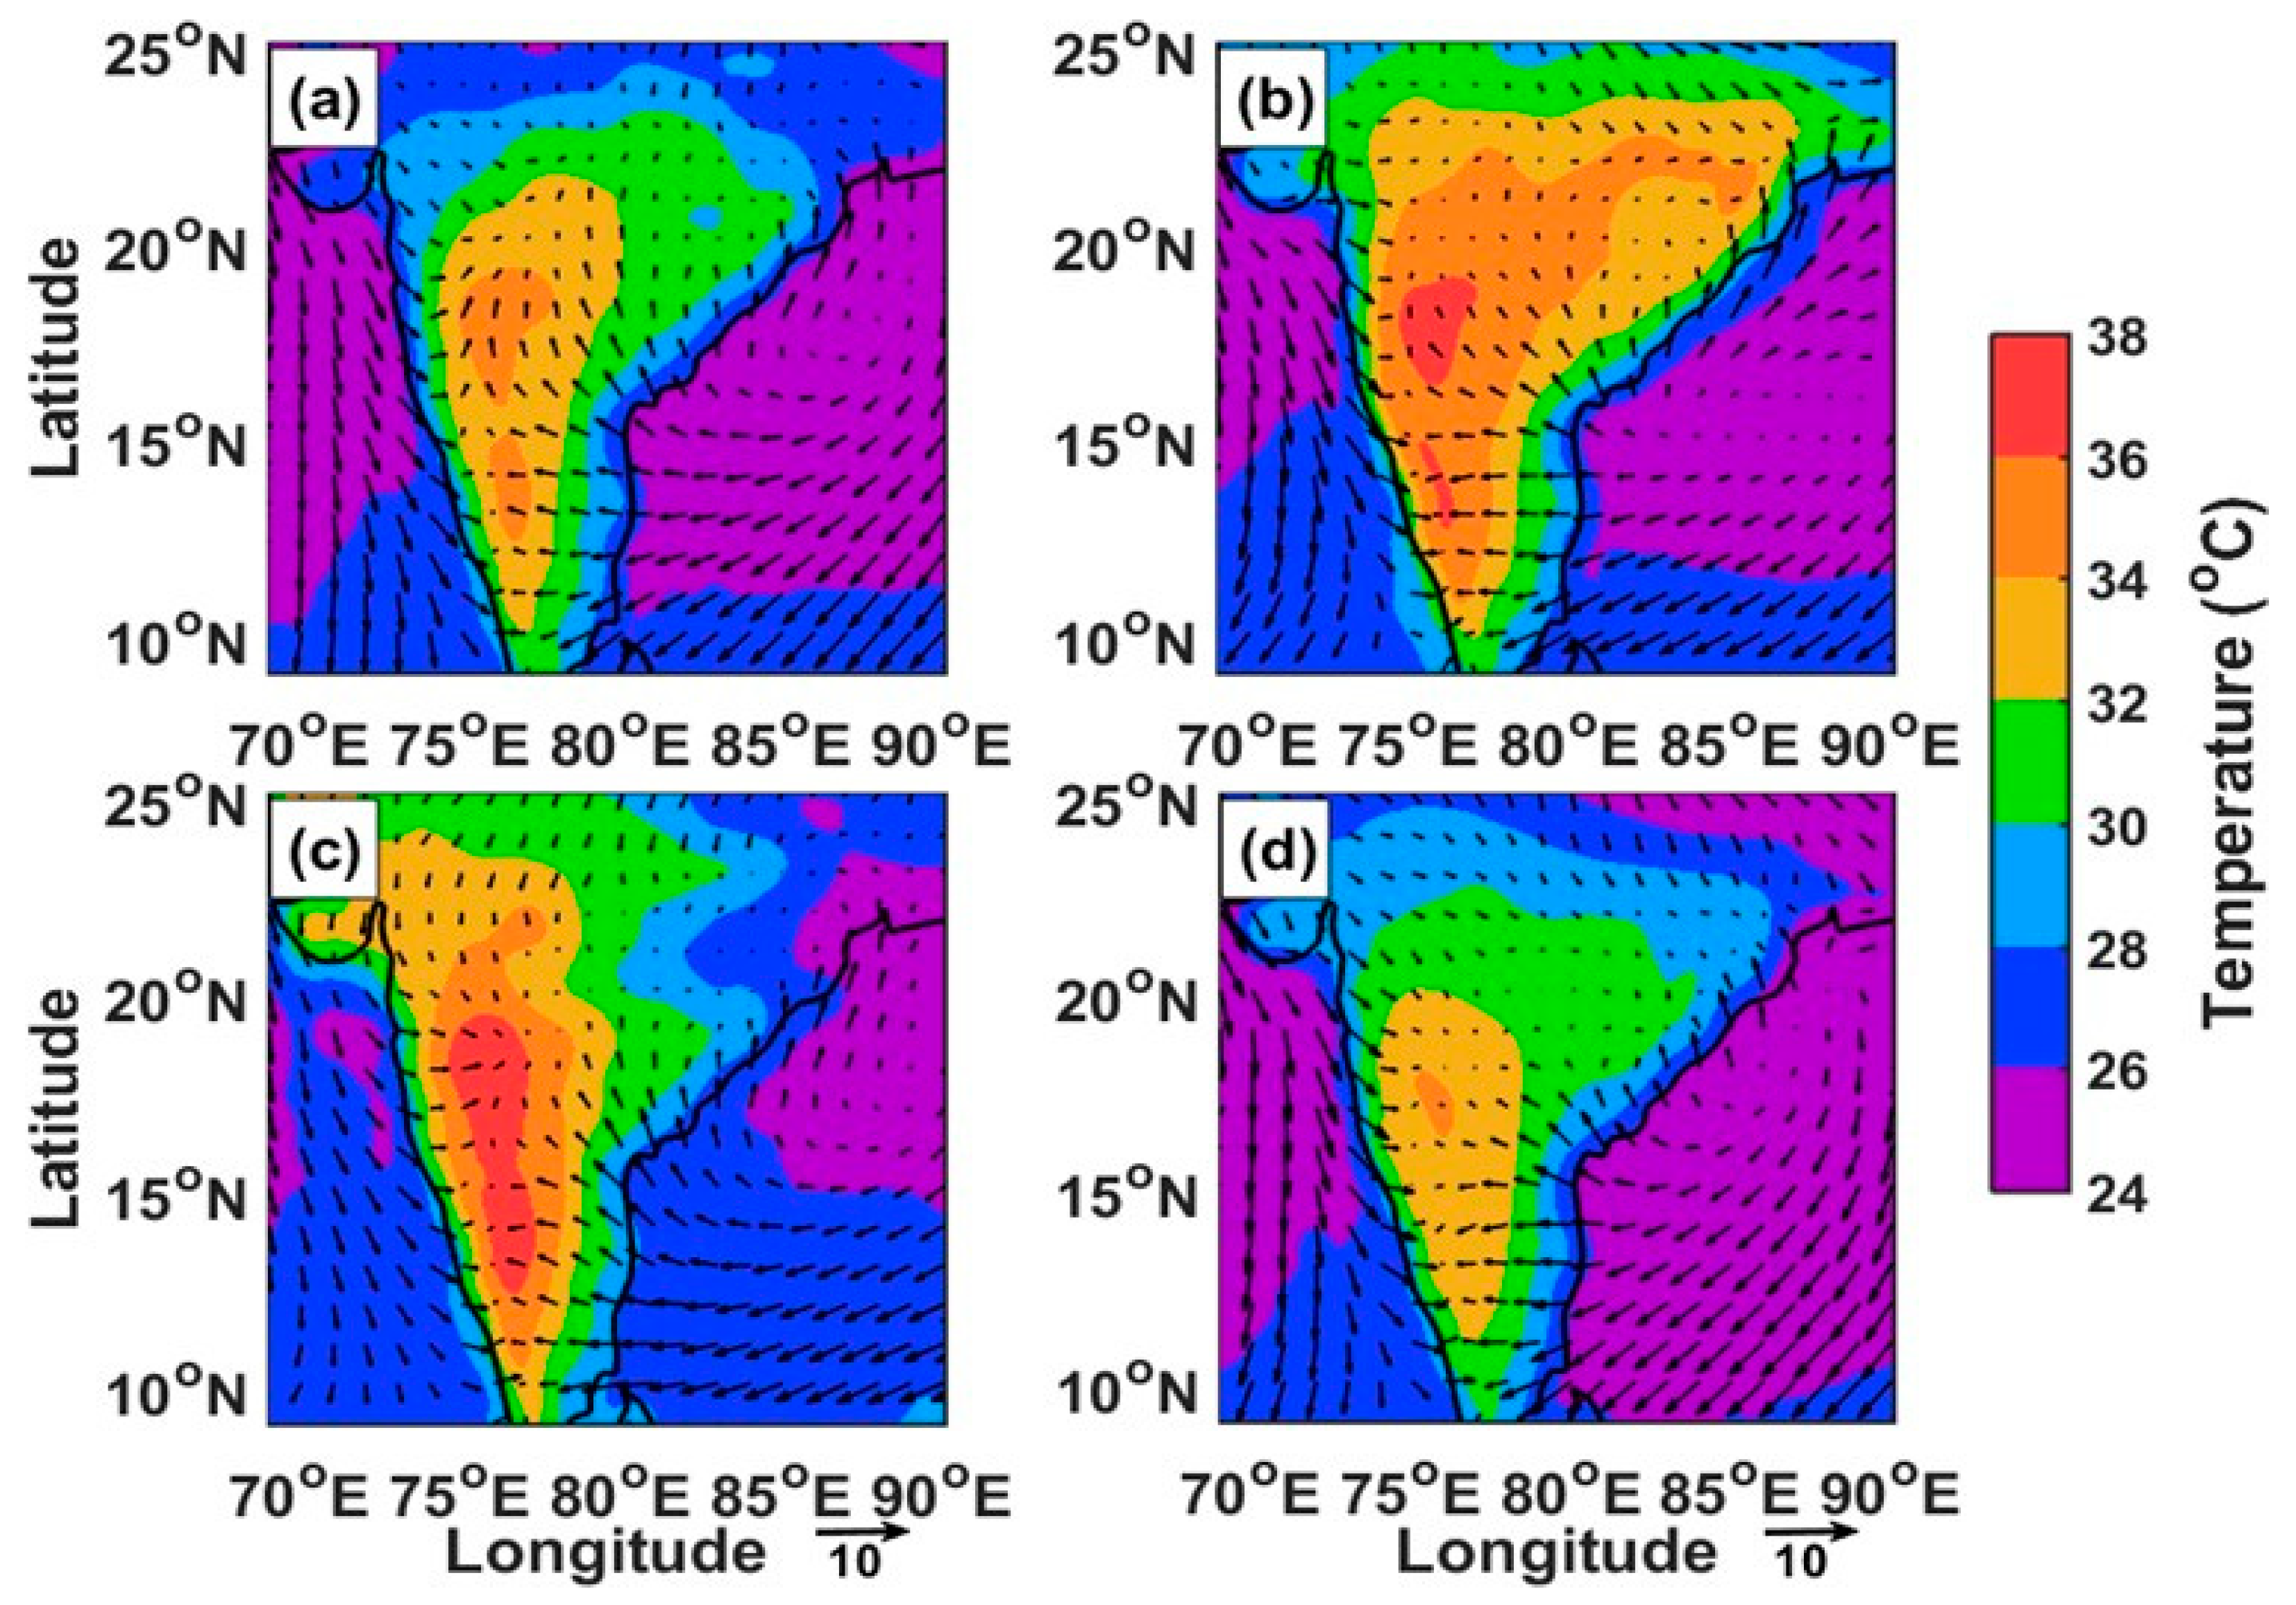
Temperature, relative humidity (RH), wind fields, and water vapor mixing ratio were used under the influence of WDs to examine the climatic conditions for the target period. During various stages of the event in February 2016,
Figure 2a–c show the 30-year mean climatology at 1000 hPa. Based on ERA-Interim data, 2d shows the weather and climate mean temperature and wind for the last 30 years (1985–2015). A correlation of the different climatic mean temperatures with the various climate stages is carried out.
In the pre-mature stage, a heat wave formed (
Figure 2a) with maximum temperatures daily ranging from 34 to 36 °C in the afflicted area. The optimum thirty-year mean temperatures (
Figure 2d) are in the 32–36 °C range. According to the highest temperature’s maximum value, as measured by the IMD, this is a westerly change compared to the regional February’s variation of near-surface mean climatological values of 33.13 °C (
Figure 2d). As a result, the temperature in the pre-mature phase is equal to or higher than the maximum daily mean value, and a significant region is influenced at this level.
In the mature phase, temperatures of the area increase to 36 °C among sections of Eastern and Western India (
Figure 2b), while regions with temperatures of 35 to 36 °C grow and spread in a comparably greater region, even up to the domain’s far west and south. Through advection, dry and hot winds appear to be as high as 26 °C among the eastern, southern, and central areas of India’s inland regions. In contrast, coastal areas observe temperatures of 24 °C (
Figure 2c). However, in the western and southern regions, the thirty-year different climatic mean temperature was determined to be 21–25 °C (
Figure 2d). Although climatology reveals continued development of the impacted area in this phase, in dissipating phase, the zone affected by significantly high 23 °C temperatures eventually decreases, as demonstrated (
Figure 2c). During the dispersing phase, the different climatic mean temperature throughout the defined area is medium to high (31–35 °C range) between India’s south and west (
Figure 2c).
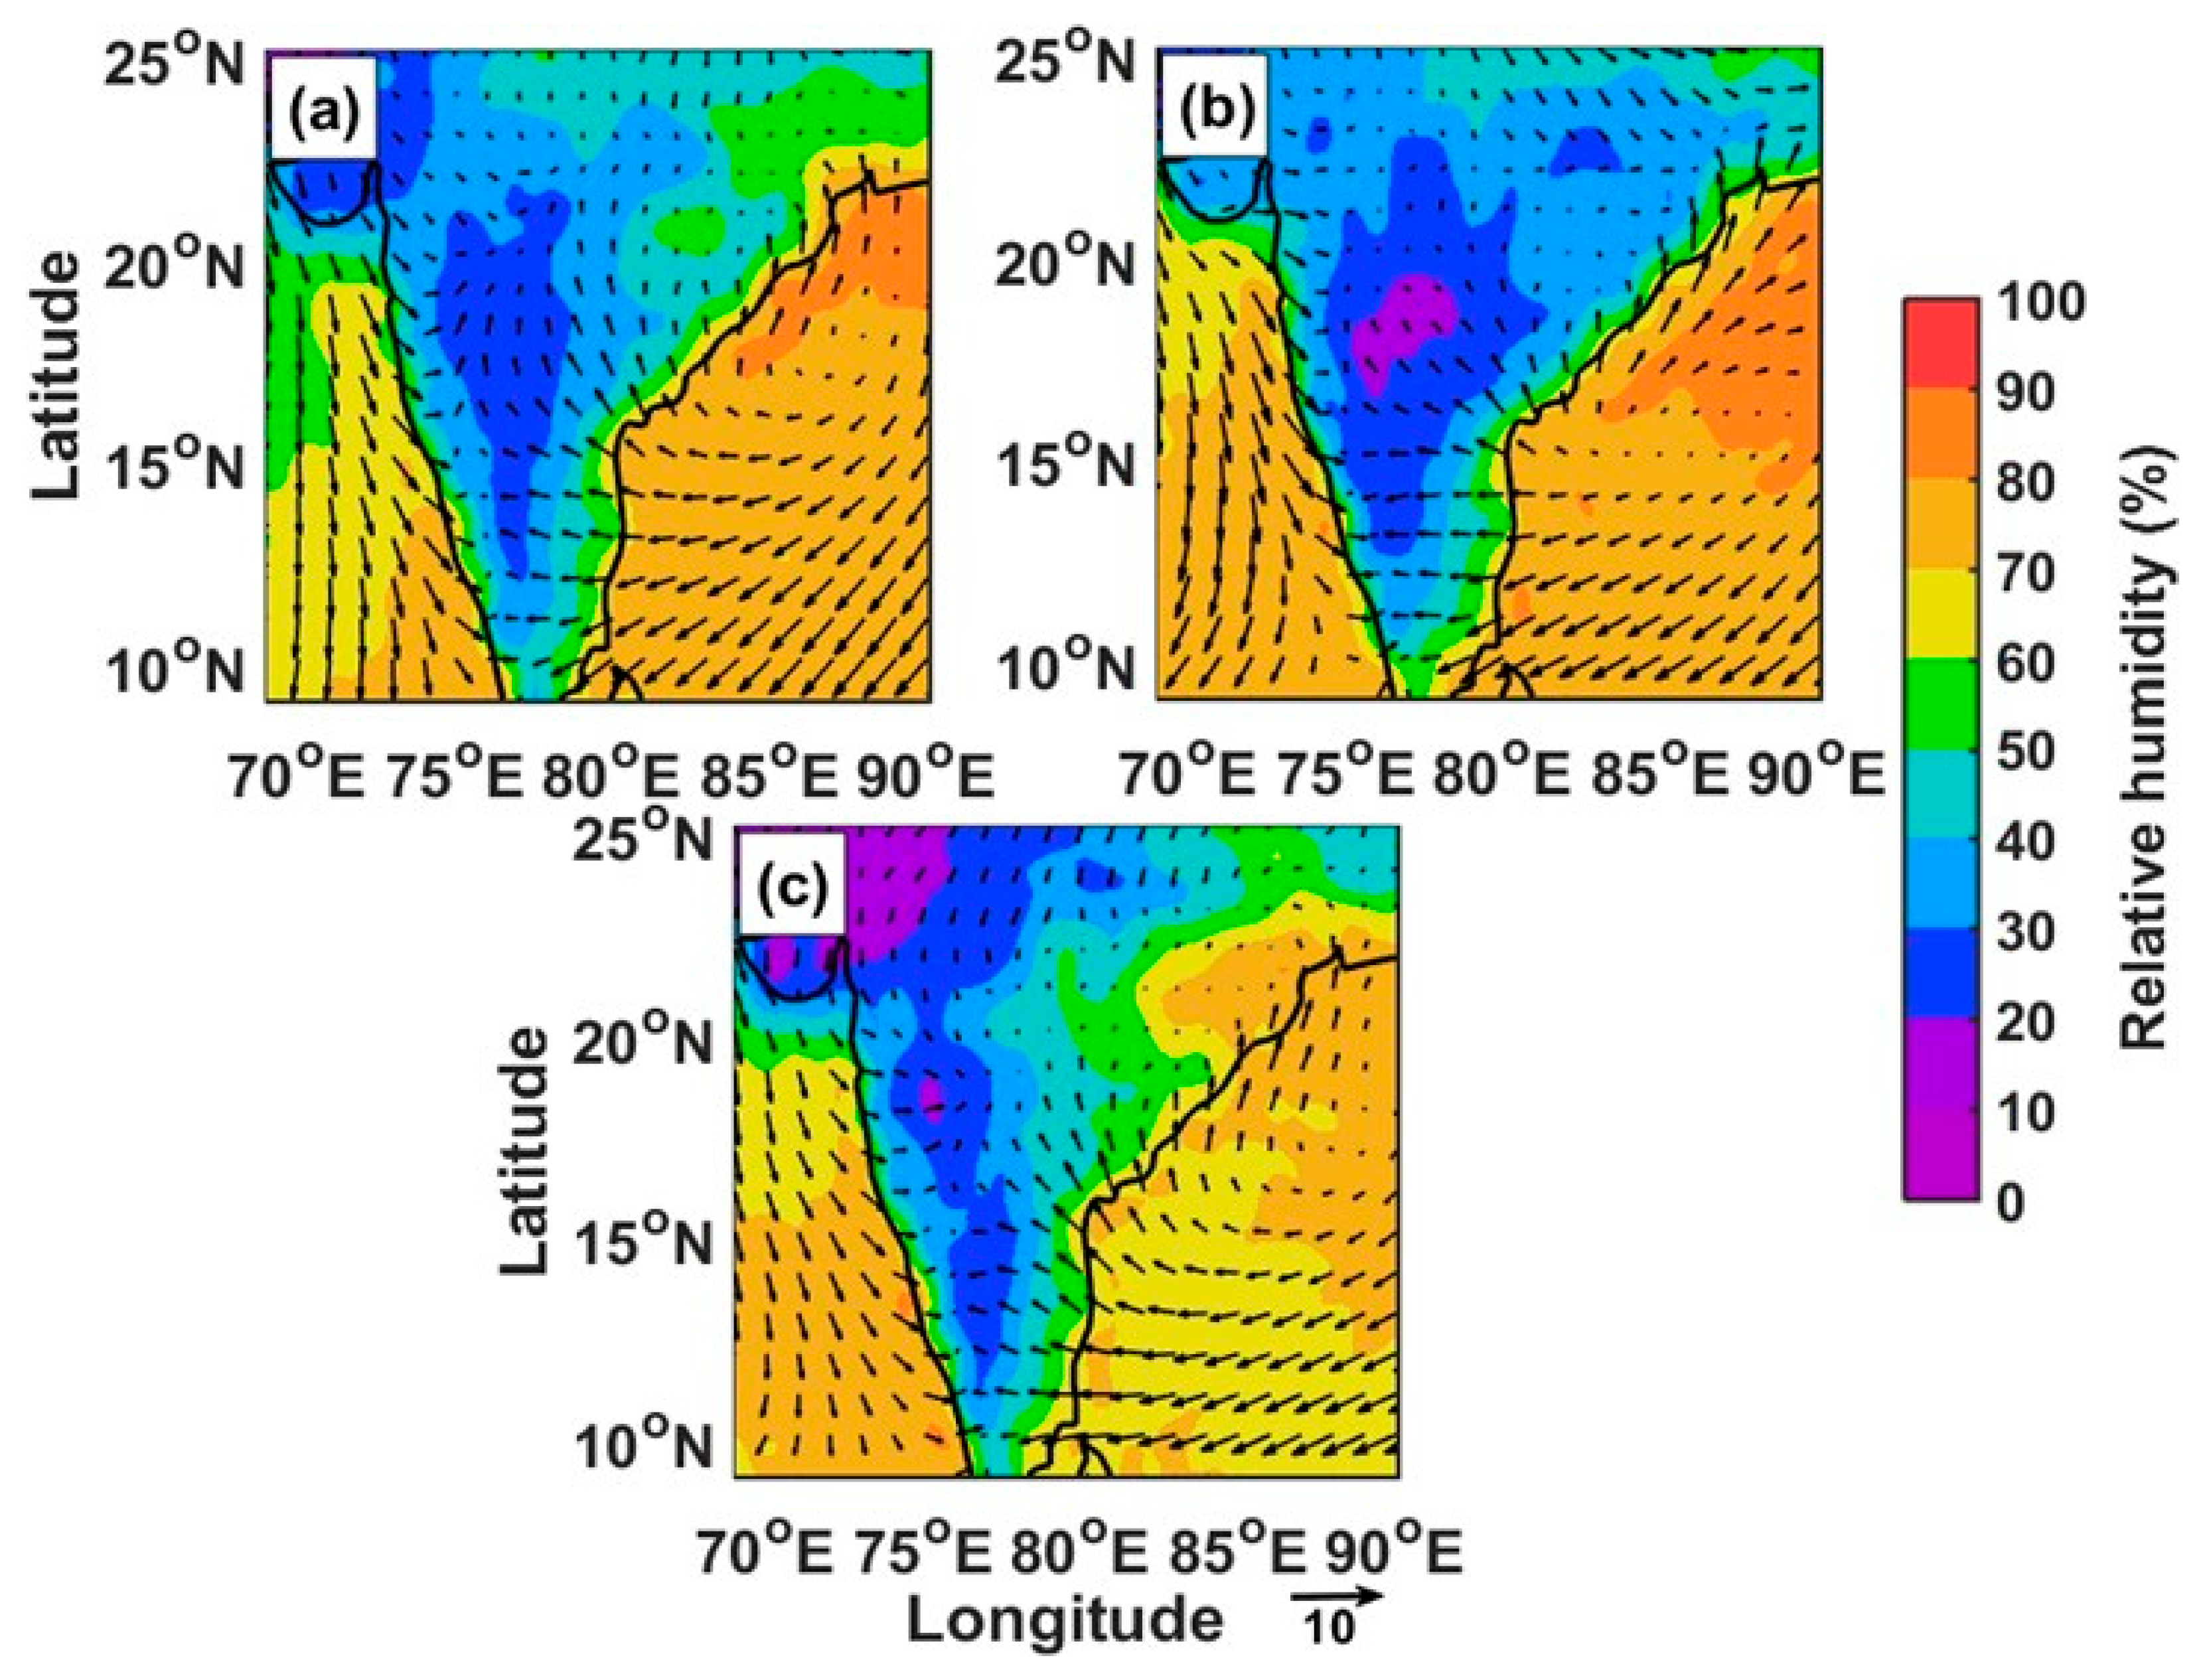
As evidenced by ERA-Interim simulations and mean temperatures among the northern, southern, and western parts of India, generally, westerly winds are typically low in the mature and pre-mature phases (
Figure 3a,b). Within the dissipating phase, in comparison, westerly and easterly winds are similar. The predicted circulation pattern for the three phases of the relative humidity is identical to different mean climatology and ERA-Interim (
Figure 3). The winds of easterly and northwesterly concentrated along the domain’s northeastern and central regions, forming a spatial circulation. The accumulation of transported aerosols is aided by atmospheric circulation [
11,
12], as well as an increase in moisture. As evidenced by the spatial distribution, easterly winds may have absorbed considerable moisture from the nearby ocean and coastal zones. As a result of the convergence of easterly and northwesterly winds, which lead to the production of convective clouds, this is used by the circulating pattern and accompanying moisture movement. Rainfall may have happened due to various sections of the research areas. Precipitation was thus enhanced by wind convergence, aerosol movement, moisture, and relatively hot temperatures.
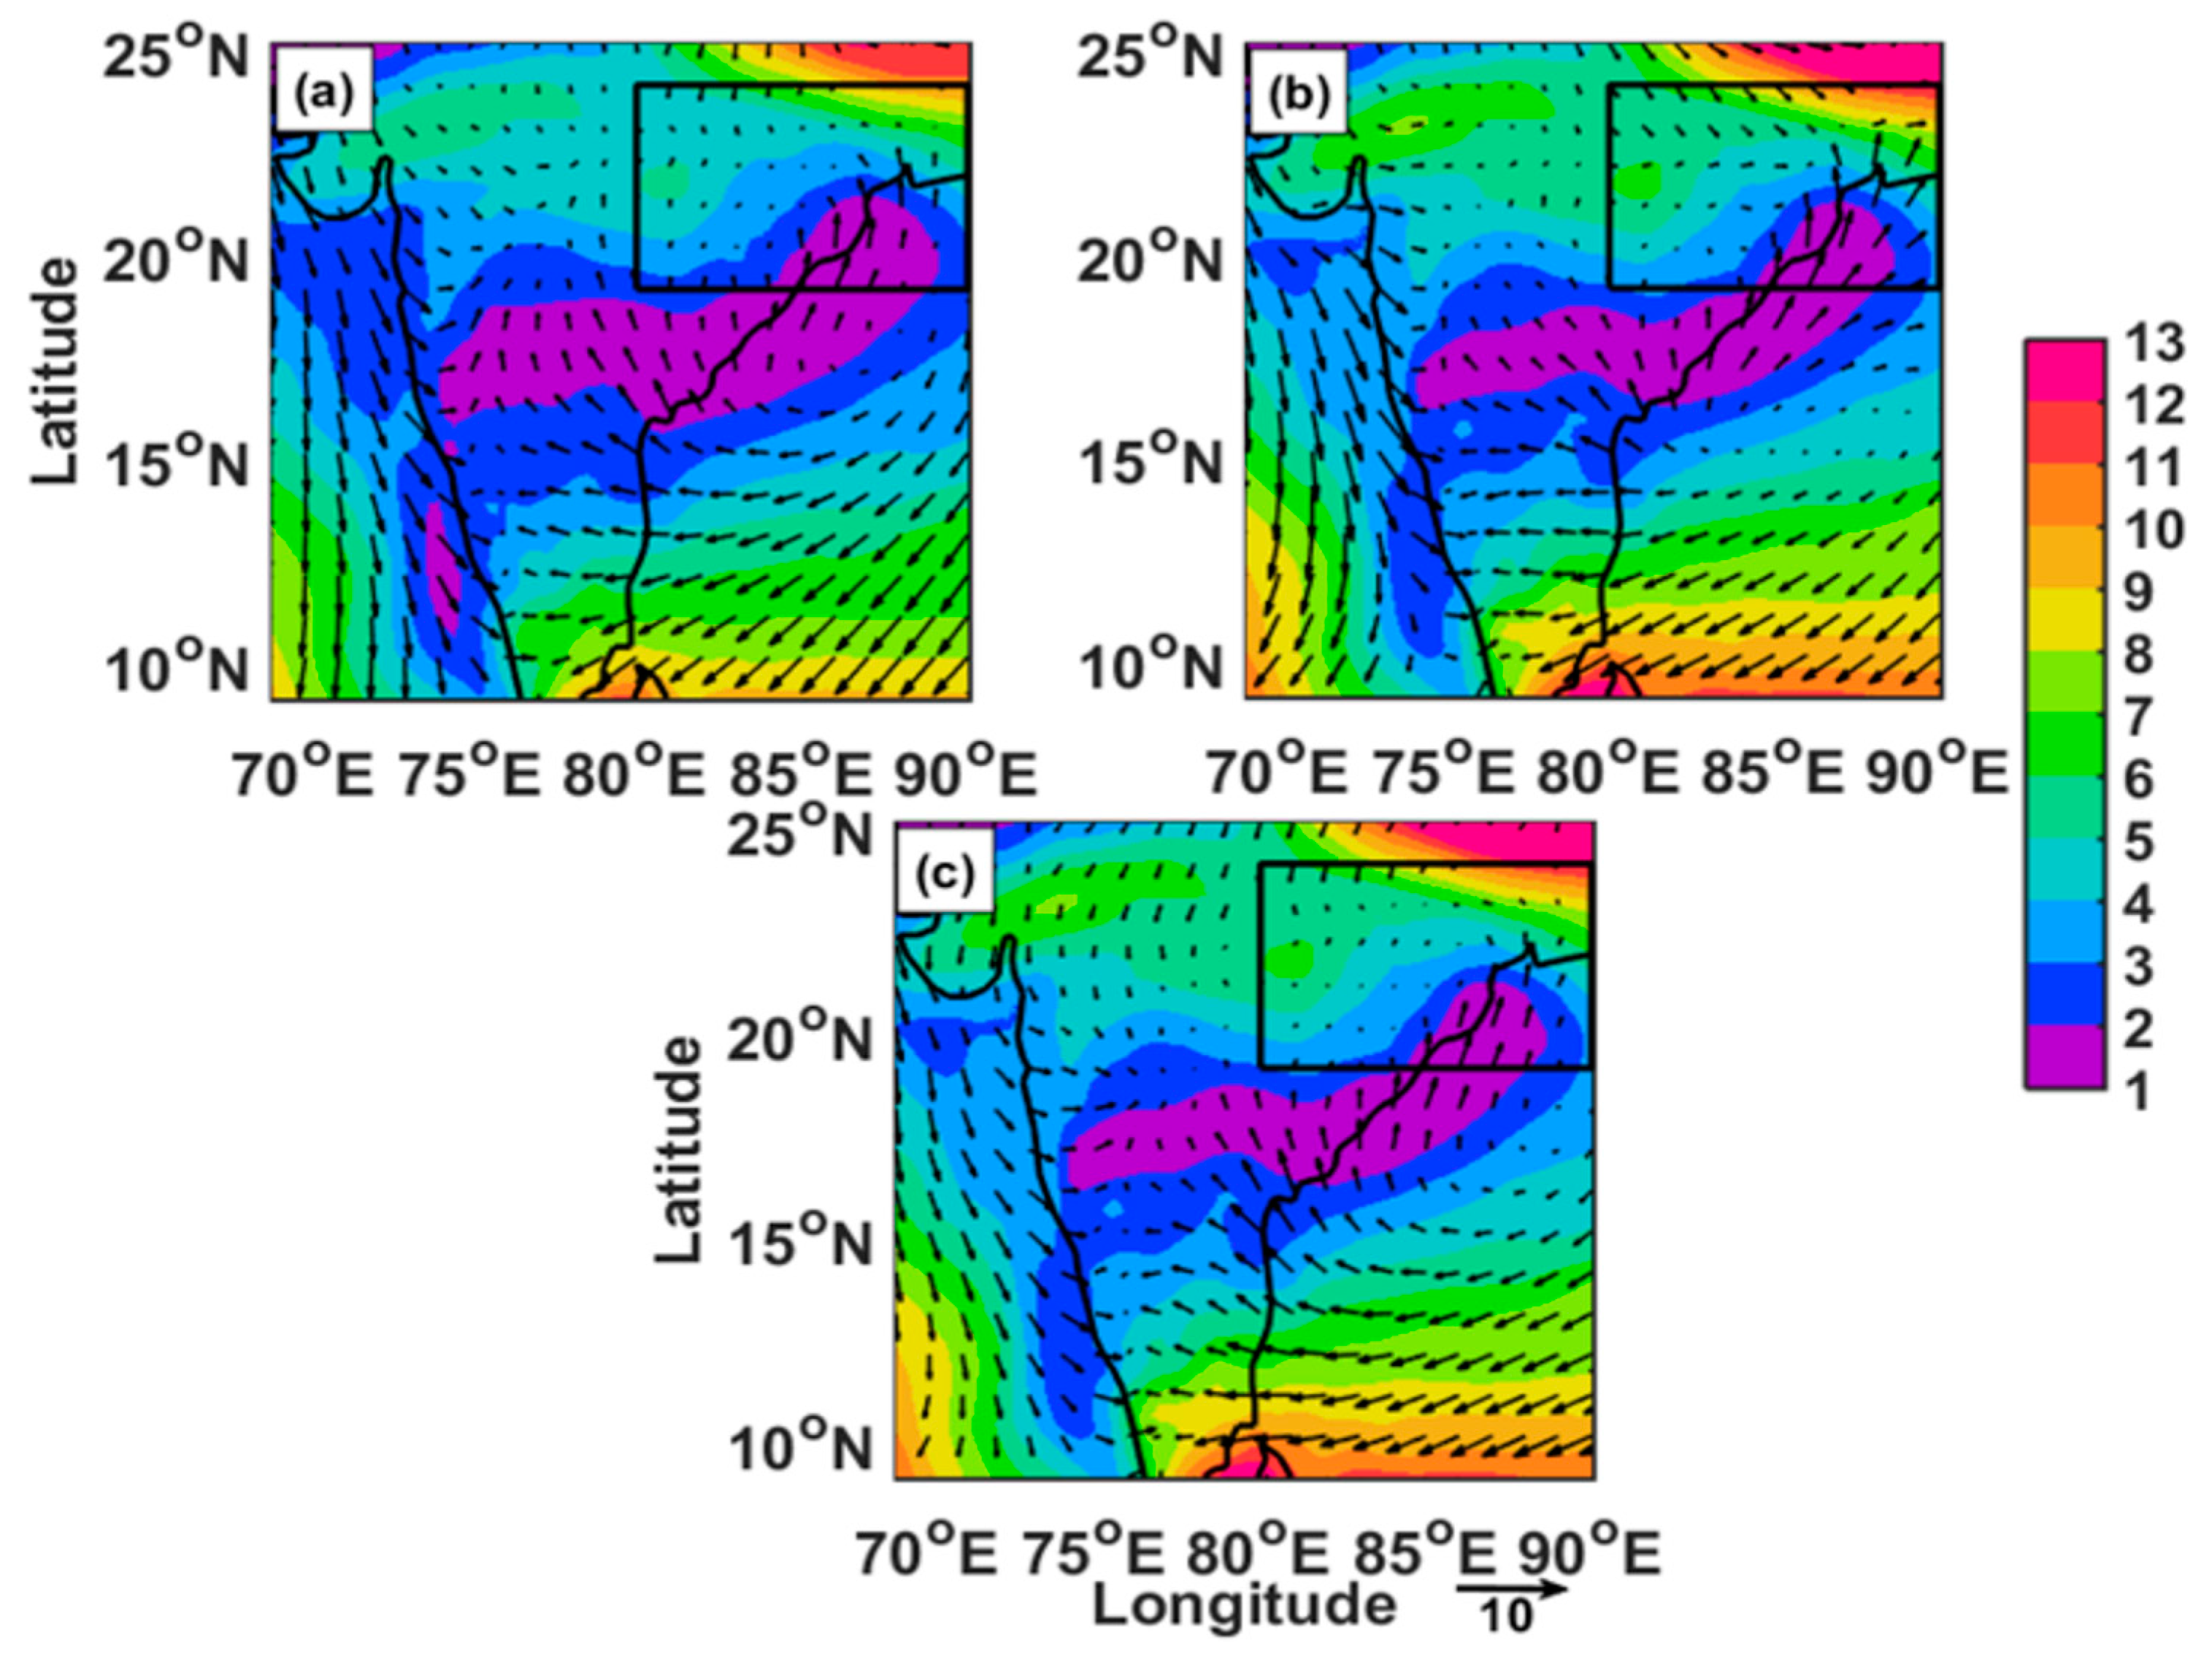
The global pattern of vertically integrated moisture transport during the 3 phases is represented in
Figure 4, which is overlaid with the wind field. It is calculated in the same way as Panda et al. (2015), with 500 and 1000 hPa specific humidity and the related horizontal wind components considered. Regardless of the phases of the episode, a zone of minimal vertical moisture transfer (one–two kilogram m
−2s
−1) can be detected in India’s southwest to northeast regions, with half positioned between longitudes 80–90° E (
Figure 4). The increased moisture vertical transport (>4-kg m
−1s
−1) in other places is related to higher wind variability related to the current convection activity. Convection and near-surface wind feedback loop with higher evaporation are produced by higher wind variation patterns to form improved convection. Stronger vertical winds can aid convective transport activity in coastal areas, whereas moisture is abundant.
Because of the encouragement from high winds and increasing relatively close temperature (
Figure 2,
Figure 3 and
Figure 4), moderate quantities of moisture flux of vertically integrated (two–seven-kilogram m
−1s
−1) indicate the potential for moist in airflow and subsequent convection behavior in the mature phase (
Figure 4b). Among the mature phase (
Figure 2b), regional warm air advection gave substantial support for convective action and associated rainfall, which occurred primarily in the dissipating phase (
Figure 4c). In the dissipating phase, higher easterly winds aided moisture transfer from the neighboring Atlantic (
Figure 3 and
Figure 4c).
4.1. Back Trajectory Analysis
Among the mature and pre-mature WD cases (
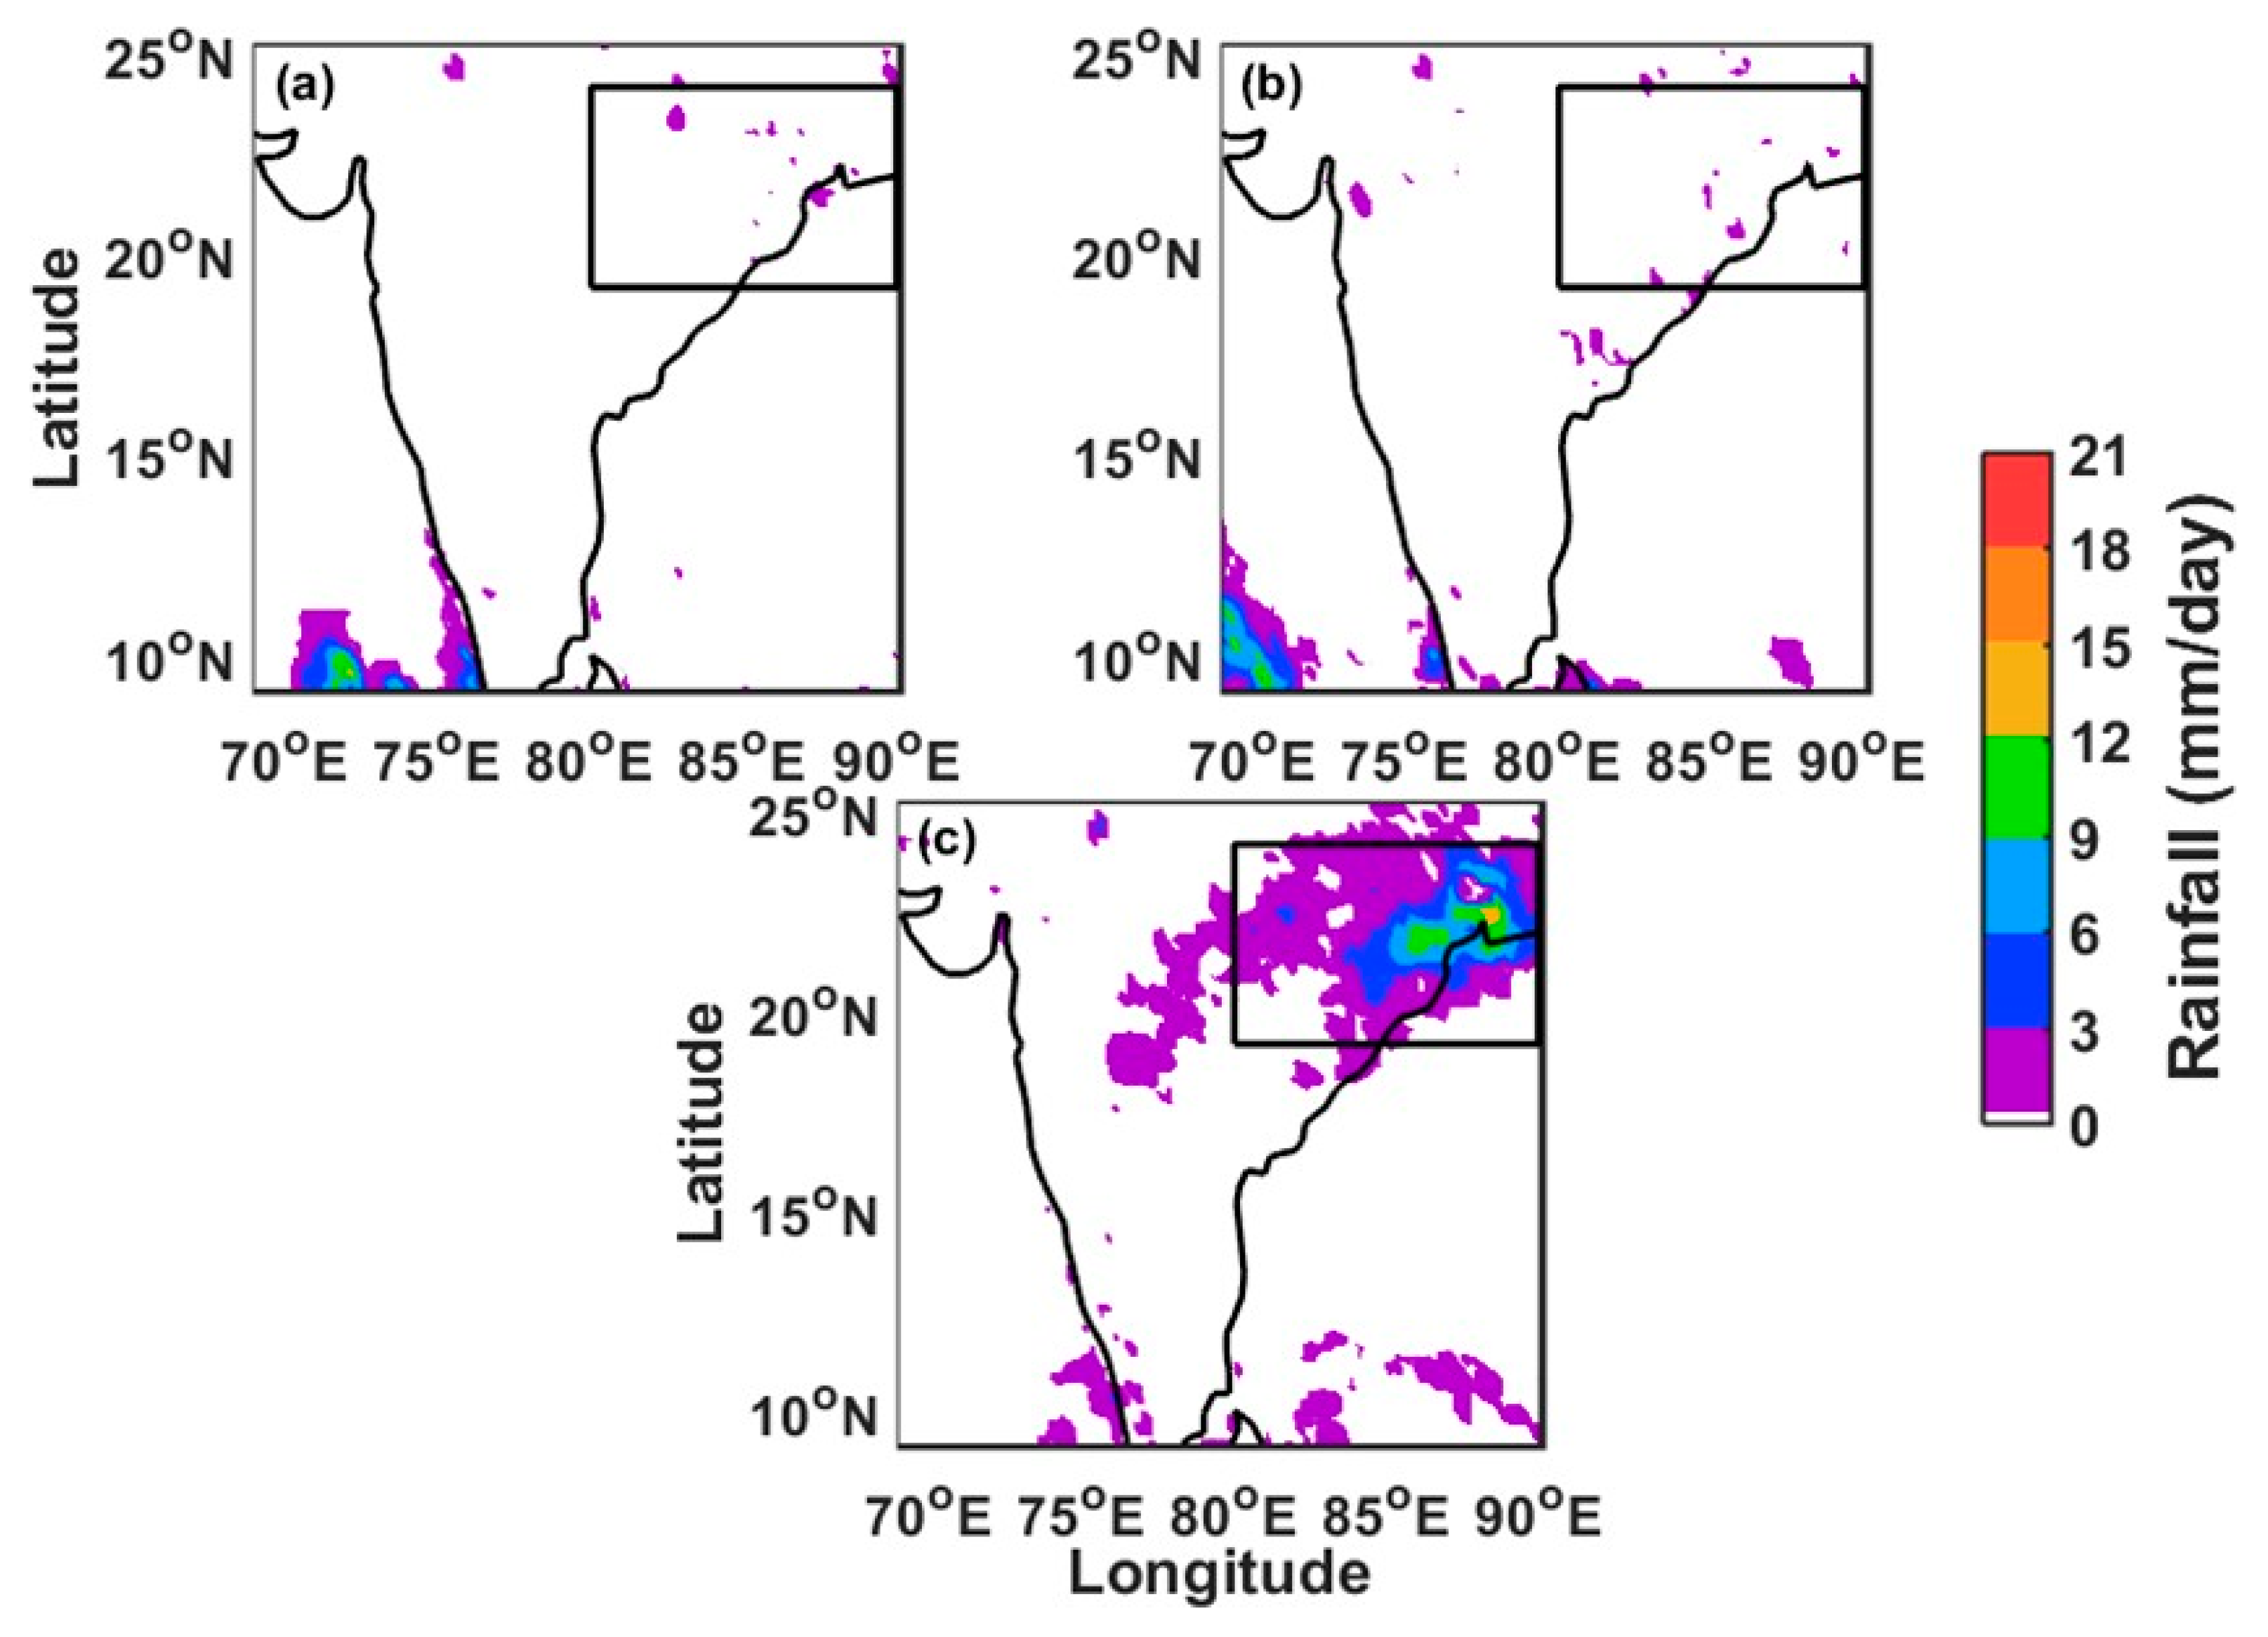
Figure 5a,b), there was no considerable rainfall [
12] in contrast to the dispersing stage. As a result, during the dissipating phase, the regional concentration of rainfall (mm/day), as well as the discrepancy among simulated and observed (from TRMM) values, are examined (
Figure 5). Among the dissipating phase (
Figure 5c), significant rainfall (0.1–18 mm day
−1) was observed in NMVMF (around 19–24° N, 80–90° E; that is, primarily across West Bengal and sections of northern Odisha and Jharkhand). NMVMF describes the horizontal rate of moisture flow (water vapor, cloud liquid, and cloud ice) per meter across a column of air extending from the earth’s surface to the top of the atmosphere. Its horizontal divergence is the rate of moisture spreading outward from a point per square meter.
When the simulated findings were compared to each other and the TRMM measurements, precipitation was mostly centered in the northeastern and eastern parts of the region; the geographic variation is typically east of 83° E and north of 21° N with slight differences (
Figure 5a–c). The TRMM satellite (
Figure 5a) reported reasonably low rainfall values (range 0–16 mm/day) throughout India’s northeastern and eastern regions within the specified range of 19–24° N and 83–90° E, respectively. The calculations (
Figure 5b,c) revealed significantly greater rainfall values (>16 mm/day) than the TRMM observations (
Figure 5a). The area of most significant rainfall has changed to the left approximately at least 1 degree longitudinally, and then a little about 1 degree latitudinally.
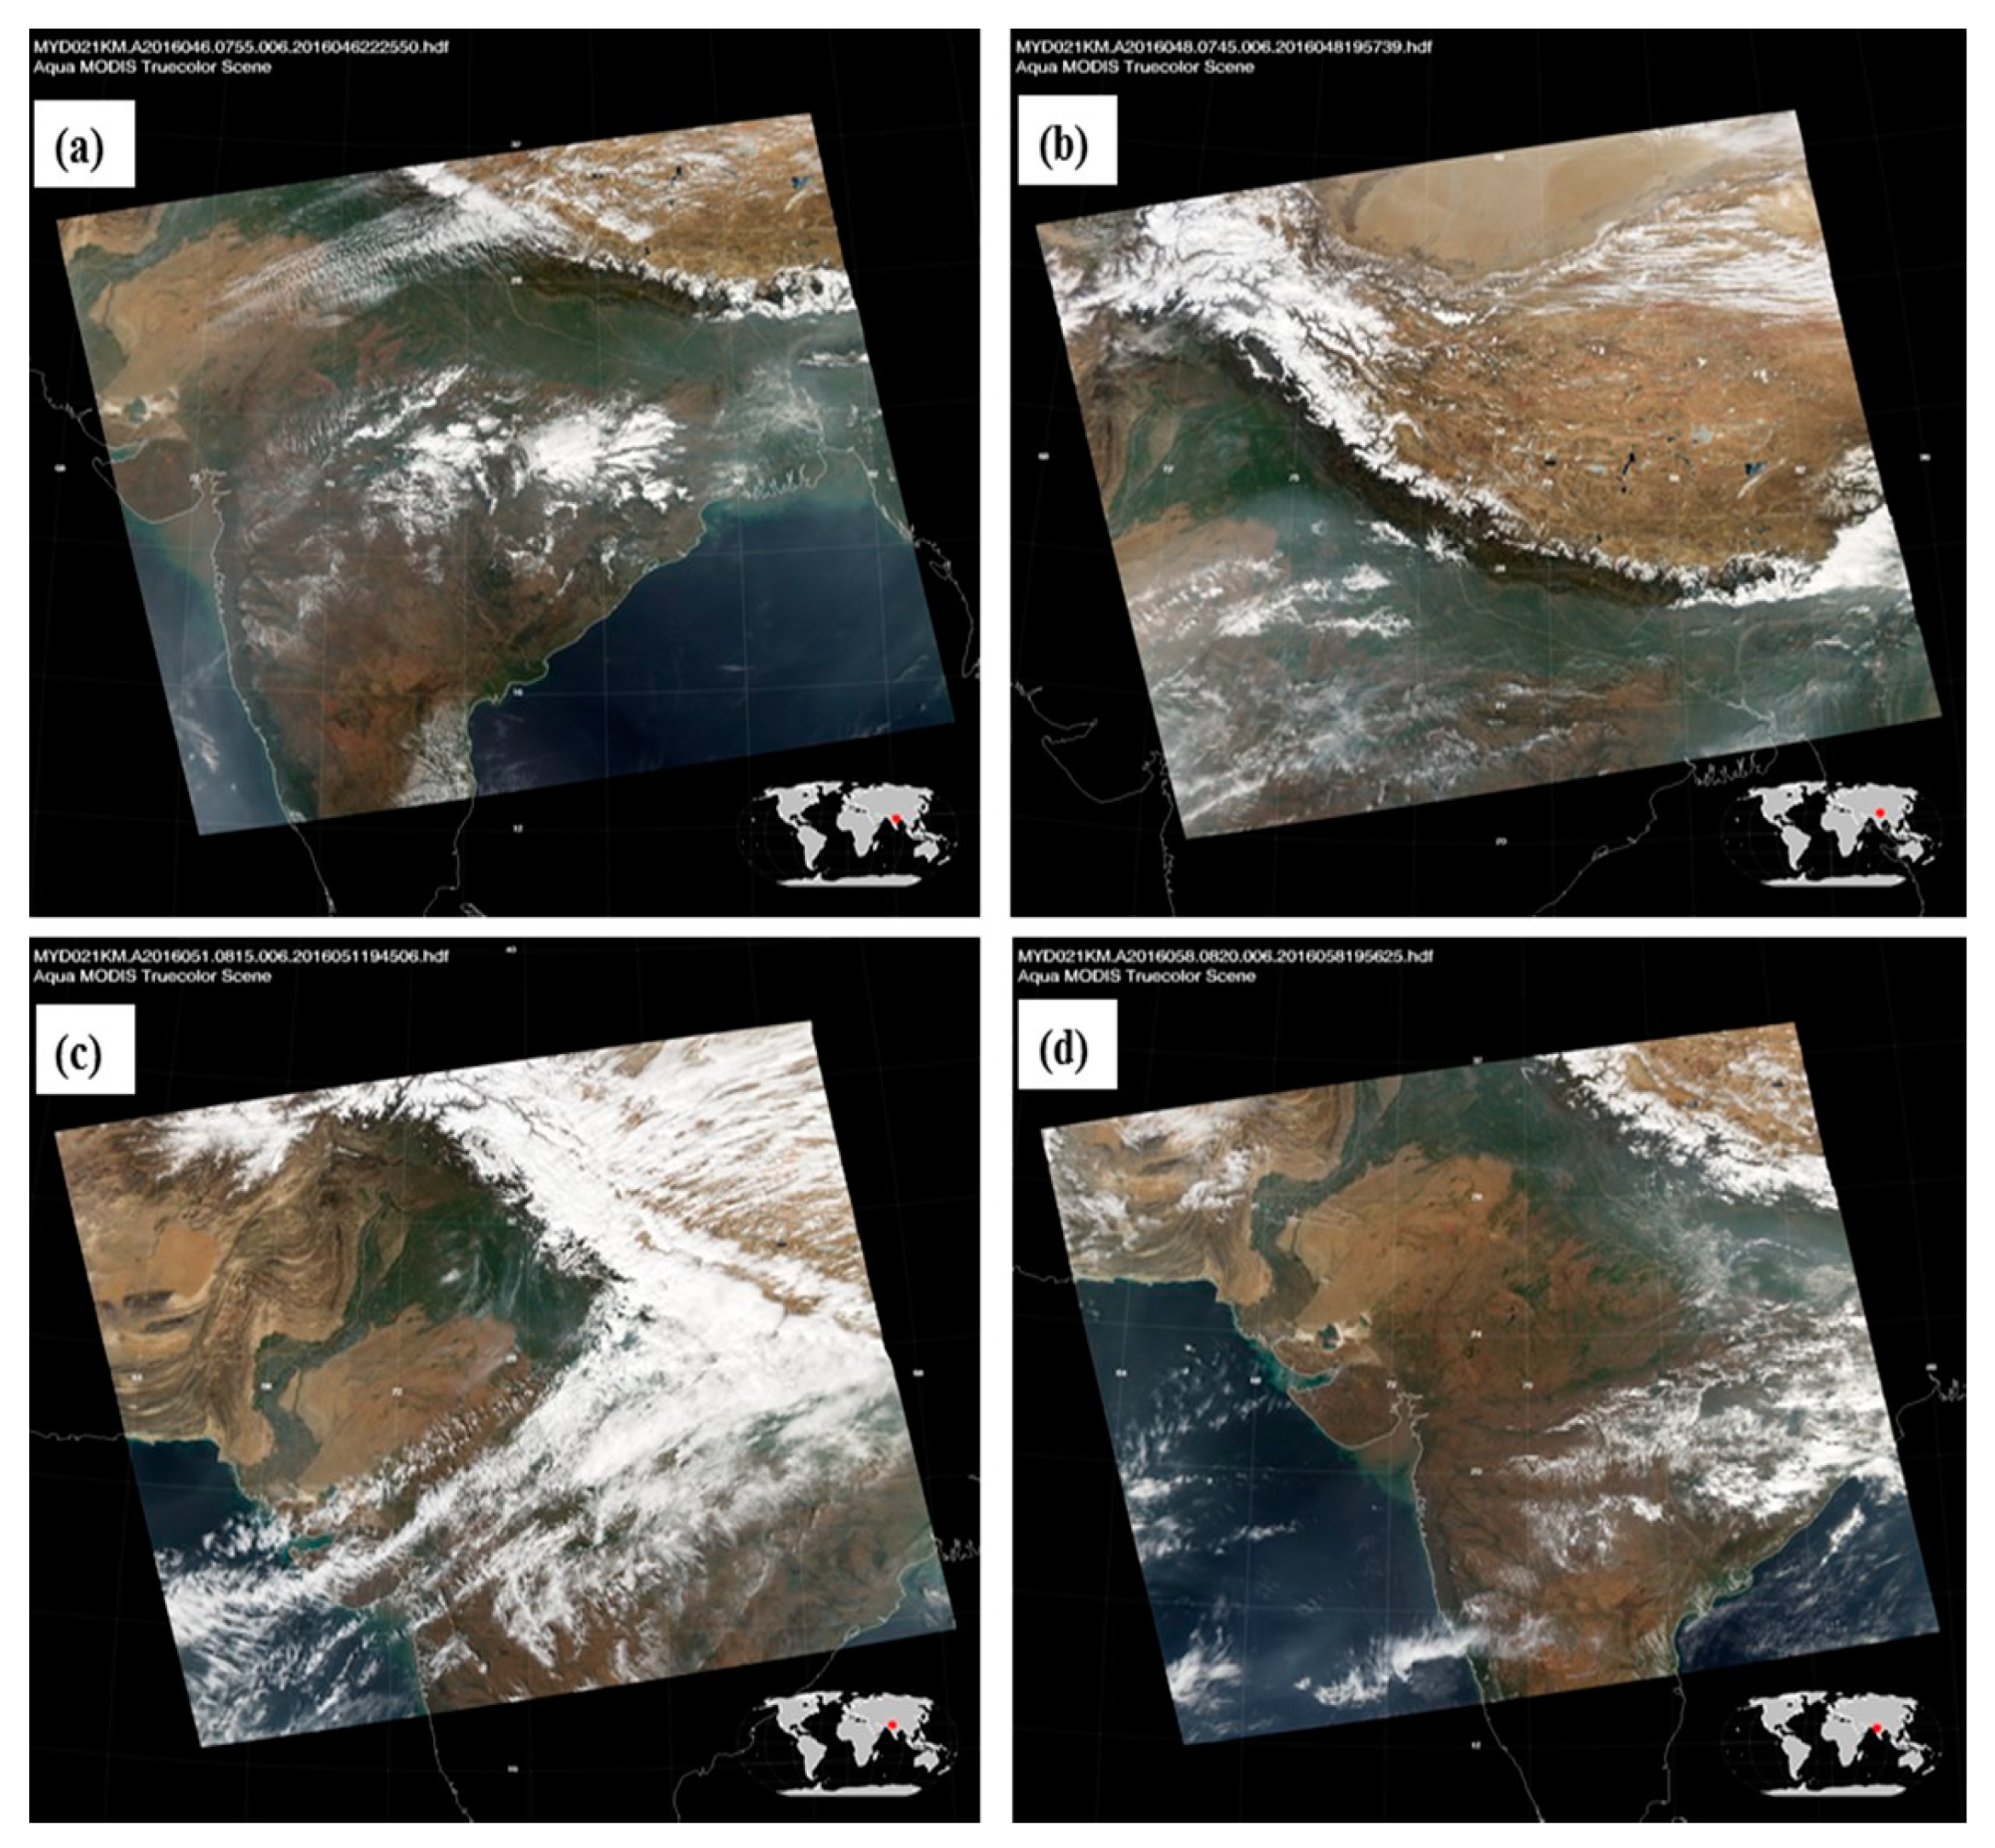
Then, using MODIS images, the movement of particles and air movement (in all phases) to these wet areas may be shown (
Figure 6). And this is significant proof of the aerosol occurrence in a given area; the back trajectory method is utilized to relate to more major possible origins.
The back trajectory analysis helps to determine seven days during each phase. NOAA’s Global Data Assimilation System (GDAS) information (
Figure 7) is used. The trajectories at 500, 1000, and 1500 m above ground level (AGL) have been regarded. In the western, southern, and eastern regions, the movement is mainly indicated using airflow trajectories. The February (Figures 12 and 15) trajectories (
Figure 7a,b) reveal that the weather patterns of West Asia and Arabia are dominant. Those from the east or south are in the pre-mature phase. The 15 February MODIS Aqua satellite image (
Figure 6b) depicts transit to the parts of India, West Asia, and the Arabian Peninsula.
4.2. Aerosol Characteristics
Trajectories from 17 February reveal the Arabian Peninsula and the Arabian Sea are the primary contributors of westerly wind (
Figure 7c) in the mature phase. Dust and sea salts are likely comparable aerosols from these places [
11]. Around 27 February, long-range airflow movement happened from the Indian subcontinent’s southeast area (i.e., BOB) or at the end of the dispersing phase (
Figure 7f). This can be seen in (
Figure 6d) MODIS. Easterly winds aid in transporting sea salt and sulfate formed by fossil fuel and biofuel combustion, as well as biomass combustion, from Southeast Asia.
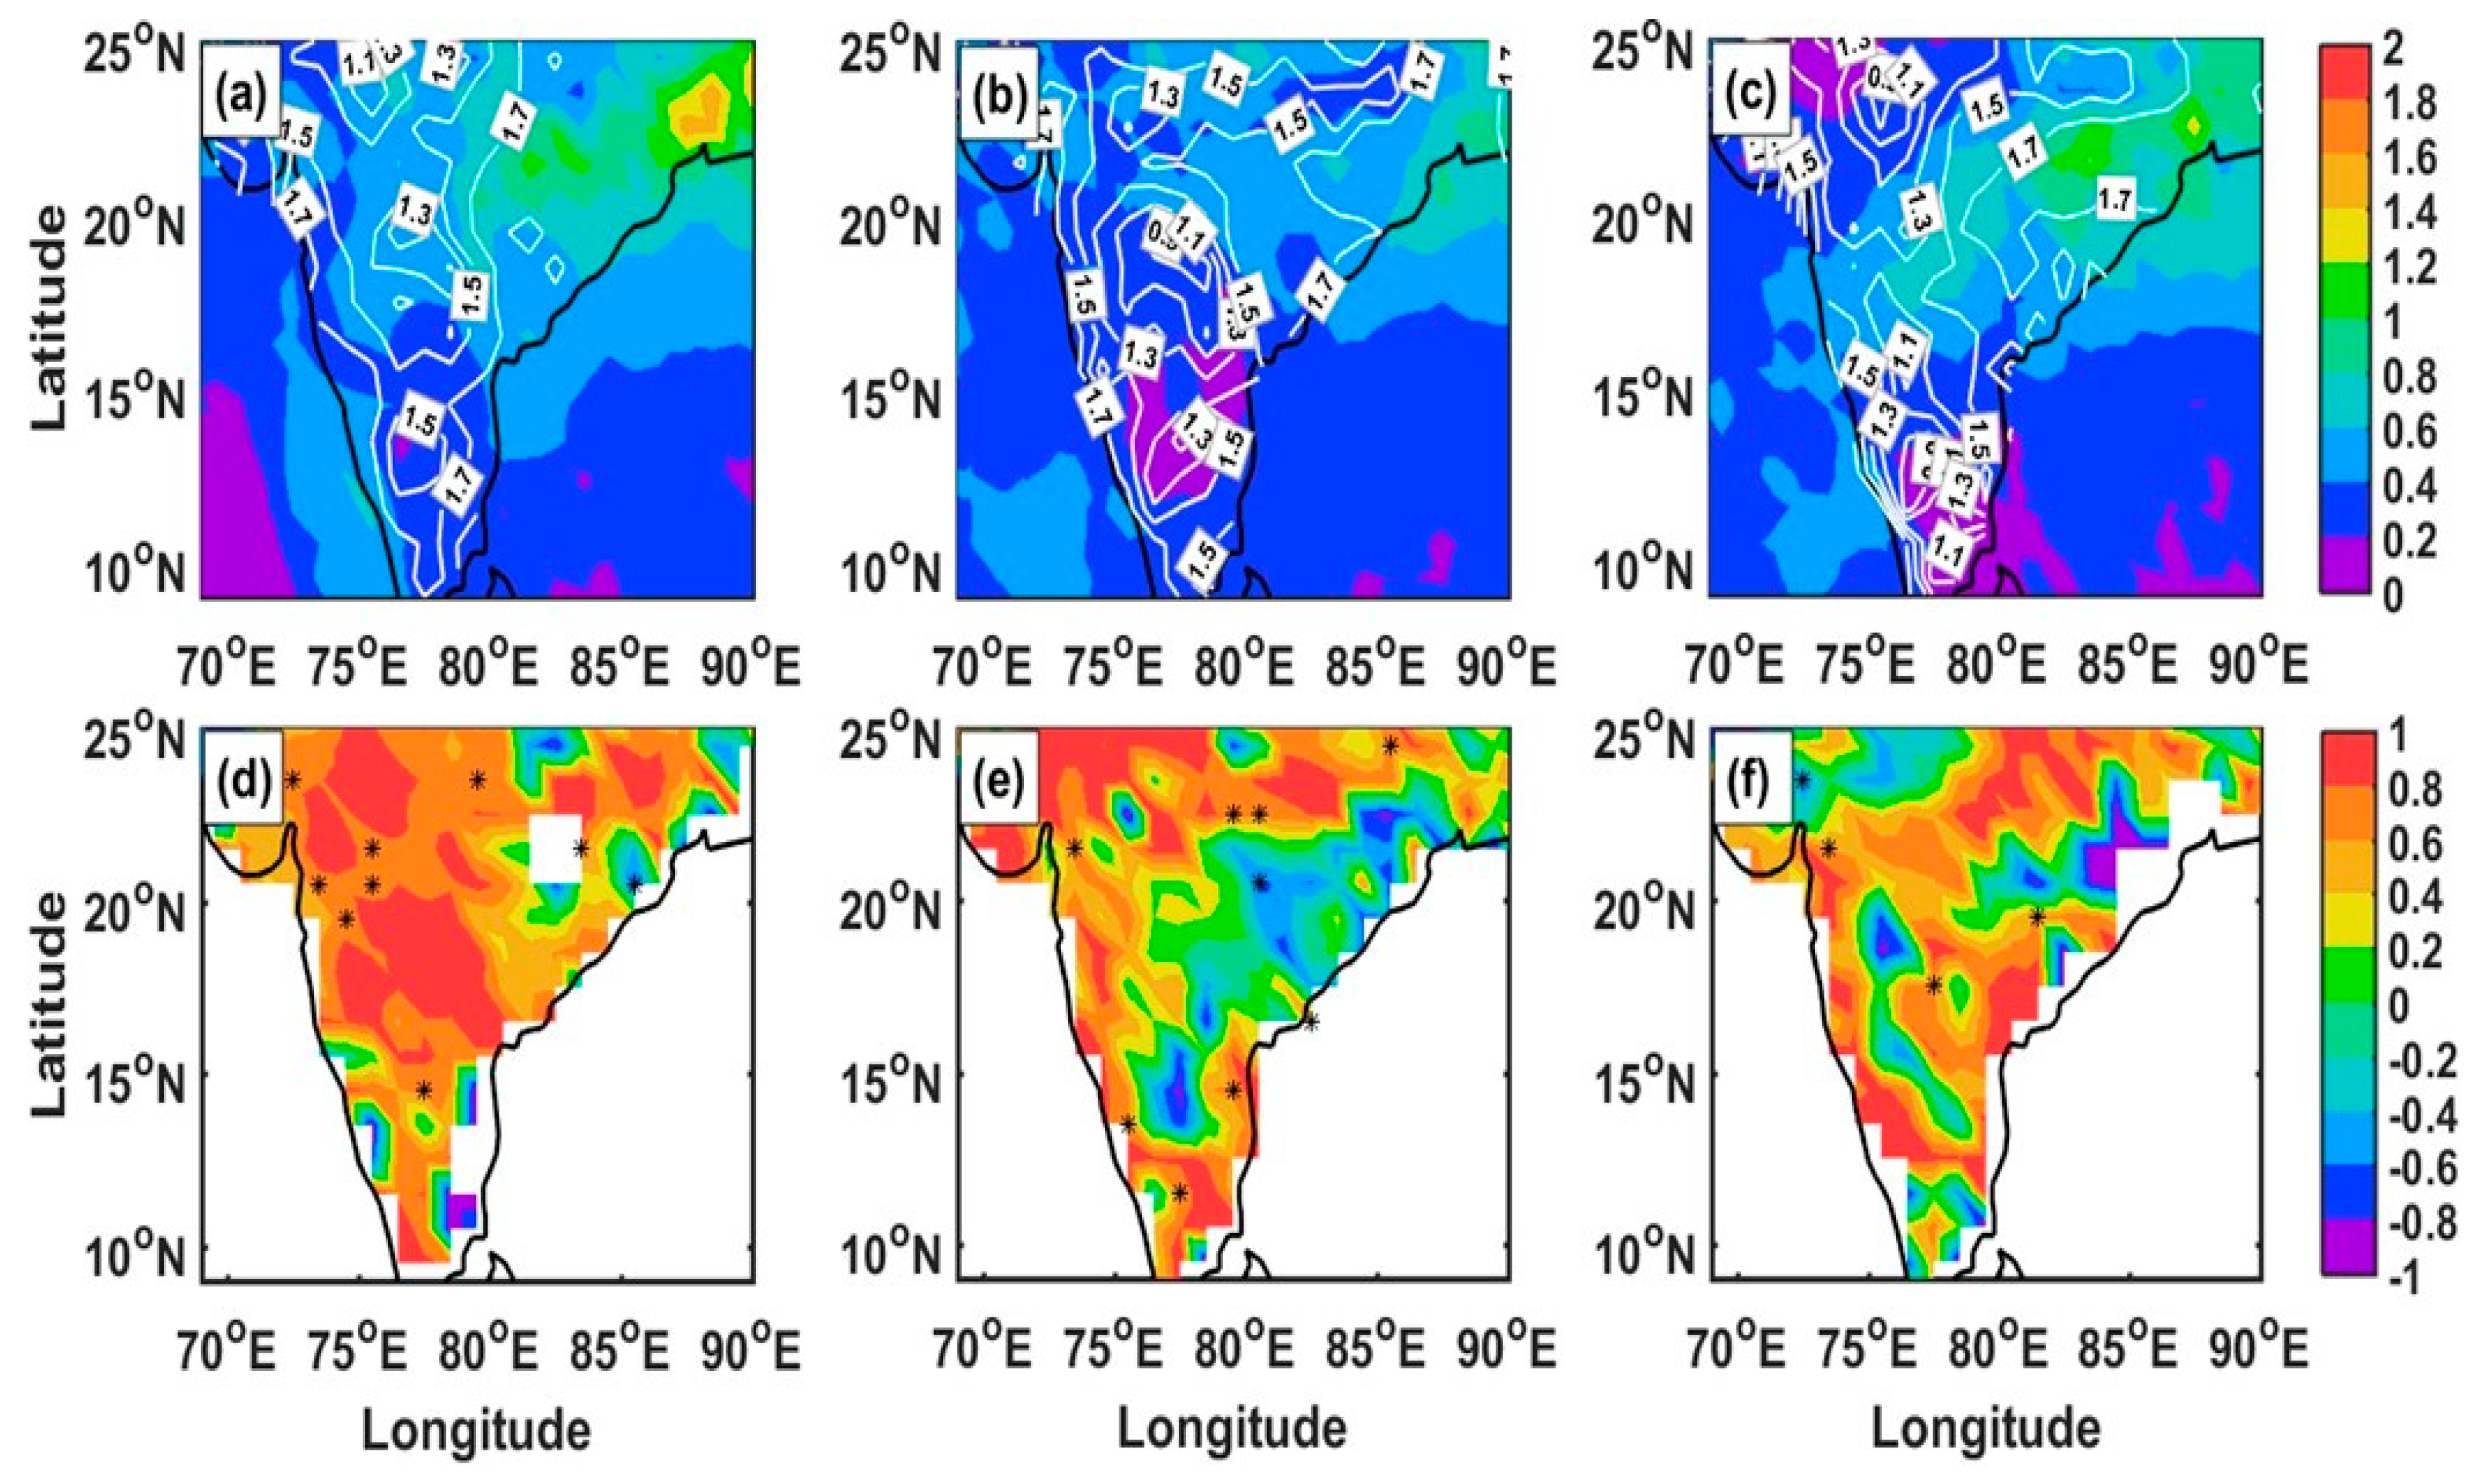
For a better understanding of primary aerosol features, the correlation and spatial distribution among mean AE and AOD
among the mature, dissipating phases and pre-mature (
Figure 8) are examined. In the pre-mature phase, AOD is usually in the range of 0.2–1.6, having AE (α) values as high as 1.7 across the research region (
Figure 8a). Around some portions of the eastern region (18–25° N, 80–90° E), the AOD is much greater. The findings reveal that perfect aerosols play a significant part in the atmosphere above the research region in the pre-mature stage.
During the mature phase, in the research area, in the atmosphere, the aerosol loading declines with a changing spatial distribution of (
Figure 8b). The AE range does not change. For convective processes, the mature phase’s hot and dry conditions will likely aid the aerosol vertical mixing. During the dissipating phase, AOD is usually between 0.2 and 1.4, with an AE range of 0.4 to 1.7 (
Figure 8c) with easterly winds dominating, as easterly winds aid in the movement of aerosols from the area under consideration (
Figure 6,
Figure 7 and
Figure 8), particularly (
Figure 4 and
Figure 8c) to the NMVMF region. As a result, the presence of these increased aerosols is expected to disrupt the CCN of the background for the cloud in the defined area (
Figure 8).
Figure 8d–f demonstrate the spatial association among AE and AOD between all phases of the specific weather condition. Missing data are shown by the white hue in the figures. Among the pre-mature phase, the NMVMF area shows a mostly positive correlation (
Figure 8d). Between the dissipating and mature phases among the areas where rainfall occurred, a negative correlation (−1.0 to −0.2) is seen (
Figure 8e–f). At the 95 percent confidence level, all phases of asterisks indicate statistically significant datasets (which is valid for other figures, too). In the atmosphere, the ratio of coarse- and fine-mode particle changes can also affect the value of AE.
4.3. Aerosol–Cloud–Precipitation Interaction
Aerosols were present around the region of NMVMF (
Figure 4,
Figure 6 and
Figure 7), where the majority of obtained precipitation was achieved, as indicated in
Section 4.1 and
Section 4.2 (See
Figure 5). To further acquire action for the interaction of ACP throughout a specific location, various cloud factors like CWP (g m
−2), CTT (K), CF, CER (μ), RF, and COD are evaluated.
4.3.1. CF and AOD Relationship
A positive CF level analyzes that the effect is warming, whereas a negative value suggests that the effect is cooling. Between the pre-mature with initial to mid-dissipating phases, the cooling influence dominates, while the warming influence dominates between the mature and final dissipating phases. The CF has a decreased intensity at the mature and pre-mature stages, implying a higher radiative effect, which inhibits cloud droplet growth and production. The invigoration impact is indicated by a rise in CF among the dissipating stages. A high AOD and CF relation signifies the development of cloud droplets and, hence, the suppression of the precipitation process of collision–coalescence and the cloud’s lifetime increasing. The negative relationship between them indicates that the CC process encourages the reduction of cloud droplets (decreasing CF) [
12].
With the number of aerosols present, the relation between cloud fraction (CF) and AOD can change; with the increase in AOD, some investigations imply a rise in CF, while others show a decline [
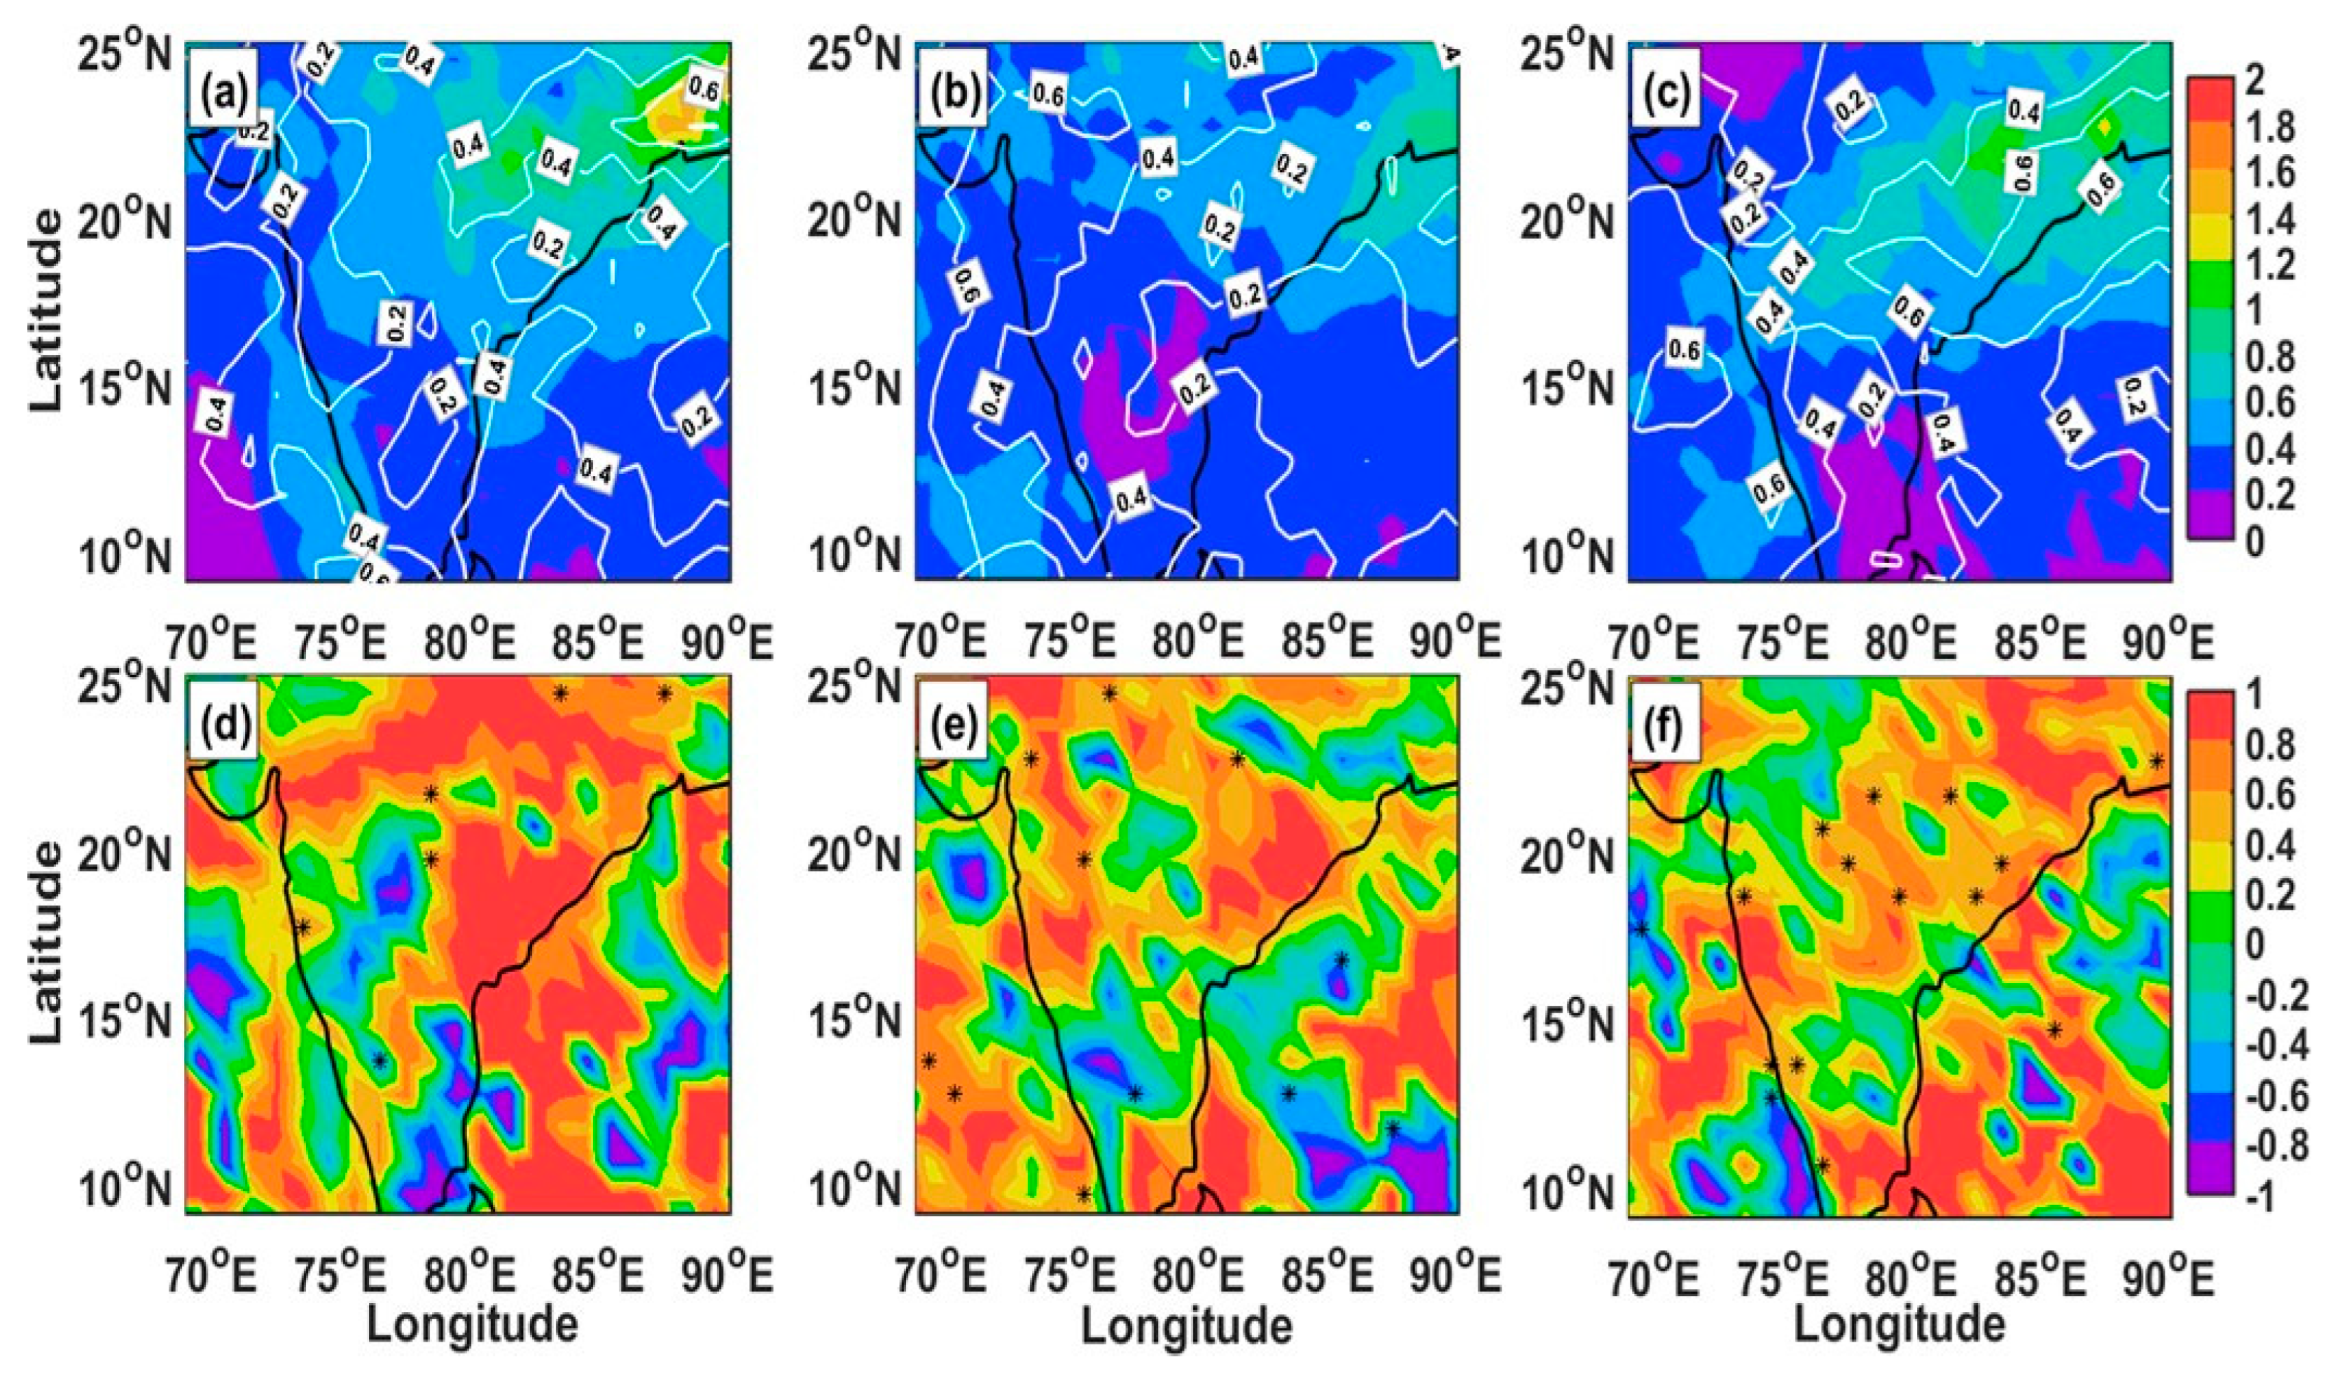
27]. The value of CF in this study ranges from 0.1 to 0.7, with the highest ranges in the NMVMF region (
Figure 9a) across the pre-mature phase, the AOD levels of (0.6–1.6) are found. During the mature phase, AOD, as well as CF, significantly dropped (duration: 0.4–1.2) in this area (
Figure 9b). Lower values of CF imply stronger radiative effects during the mature phase over the NMVMF region [
37], but significant rainfall was observed among the dissipating phases (
Figure 5c). During the mature phase, absorption impacts are predicted to limit cloud development and creation.
Aerosol absorption of solar energy can result in evaporation. During the dissipating stage, AOD grew to 1.4 within the NMVMF region, while CF values increased to 0.6 (
Figure 9c). To support the observed rainfall, the increase in the CF range for AOD can cause a considerable impact on invigoration [
28], notably in the development of additional clouds of deeper during the dispersing phase.
4.3.2. Cloud Top Temperature and Cloud Optical Depth Relationship
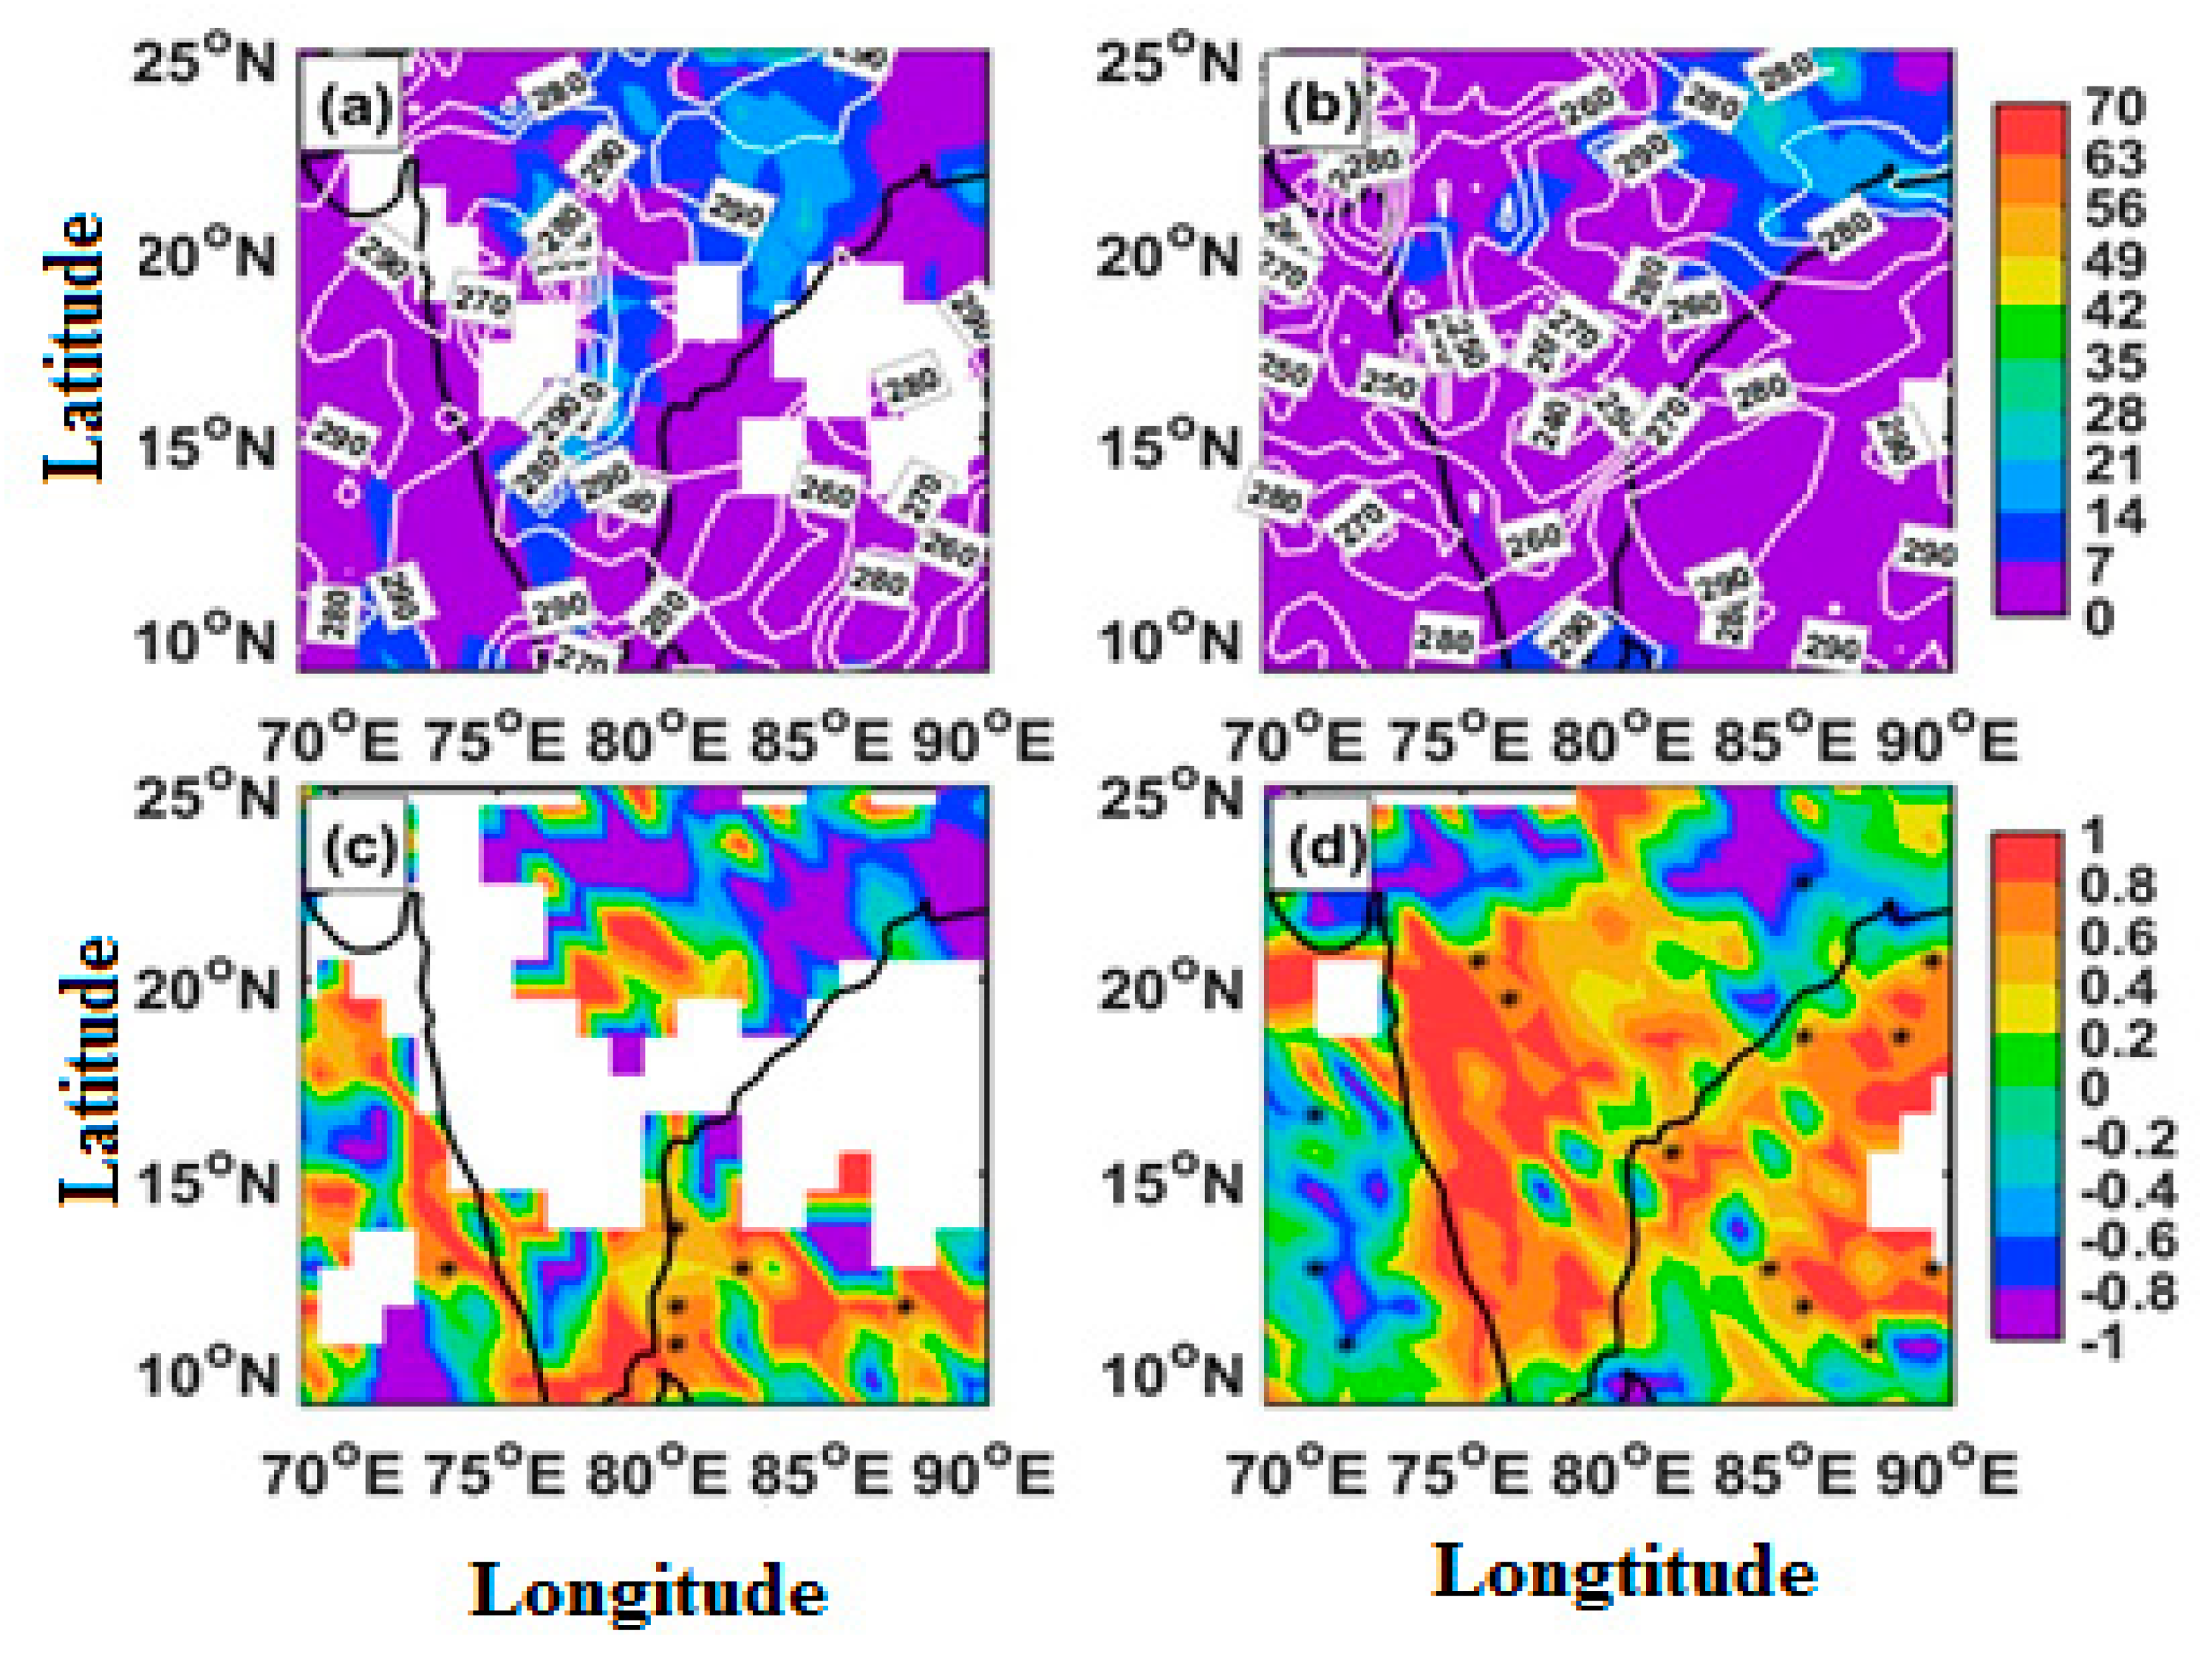
COD refers to the scattering and absorption of light by cloud droplets as it travels through the atmosphere. It has the potential to indirectly impact the budgets of radiation from the ground and the atmosphere. The temperature at the cloud top is measured in CTT (K), and it is also essential for establishing the earth’s net radiation budget. In the dissipating and pre-mature phases of a weather event, (
Figure 10) depicts the correlation coefficient and regional distribution of CTT and COD. During the pre-mature phase, COD can reach 28 with CTT ranging from 280 to 290° K over NMVMF.
However, when they grow to 42 (
Figure 10b), the associated COD values in the dissipating phase CTT remain unchanged. Among the pre-mature stage (
Figure 10c), a CTT and COD have a largely negative correlation (−1.0 to −0.2) across NMVMF. The correlation coefficient over the NMVMF among the dissipating phase ranges from −1.0 to 0.8 (
Figure 10d). The asterisks in
Figure 10c,d show at a 95% confidence level, the dataset is statistically significant. COD over NMVMF is increased when there is a lot of moisture in the atmosphere (
Figure 10d); this is determined by the cloud’s vertical density as well as depth [
51].
With absorbing aerosol occurrence, the negative correlation is probably encouraging cloud droplet evaporation (lower COD) and results in relatively thin clouds. It means that droplets of clouds are not getting any bigger and that there is not enough moisture and liquid water within the clouds. On the other hand, certain clouds may develop to be quite large, but they may lack sufficient liquid water content and, hence, cannot produce rain.
Because cloud vertical and horizontal development may not occur at the same time, cloud duration in the atmosphere increases with AOD and decreases (
Figure 10c) across CER [
14]. During the dissipating phase in the atmosphere, a moisture incursion (
Figure 10c) around NMVMF correlates with a corresponding rise in COD (
Figure 10b), and convective and raining clouds are developed as a part of this action. Due to a lack of relevant data, the mature phase is confined to this location.
4.4. Aerosol–Rainfall Relationship
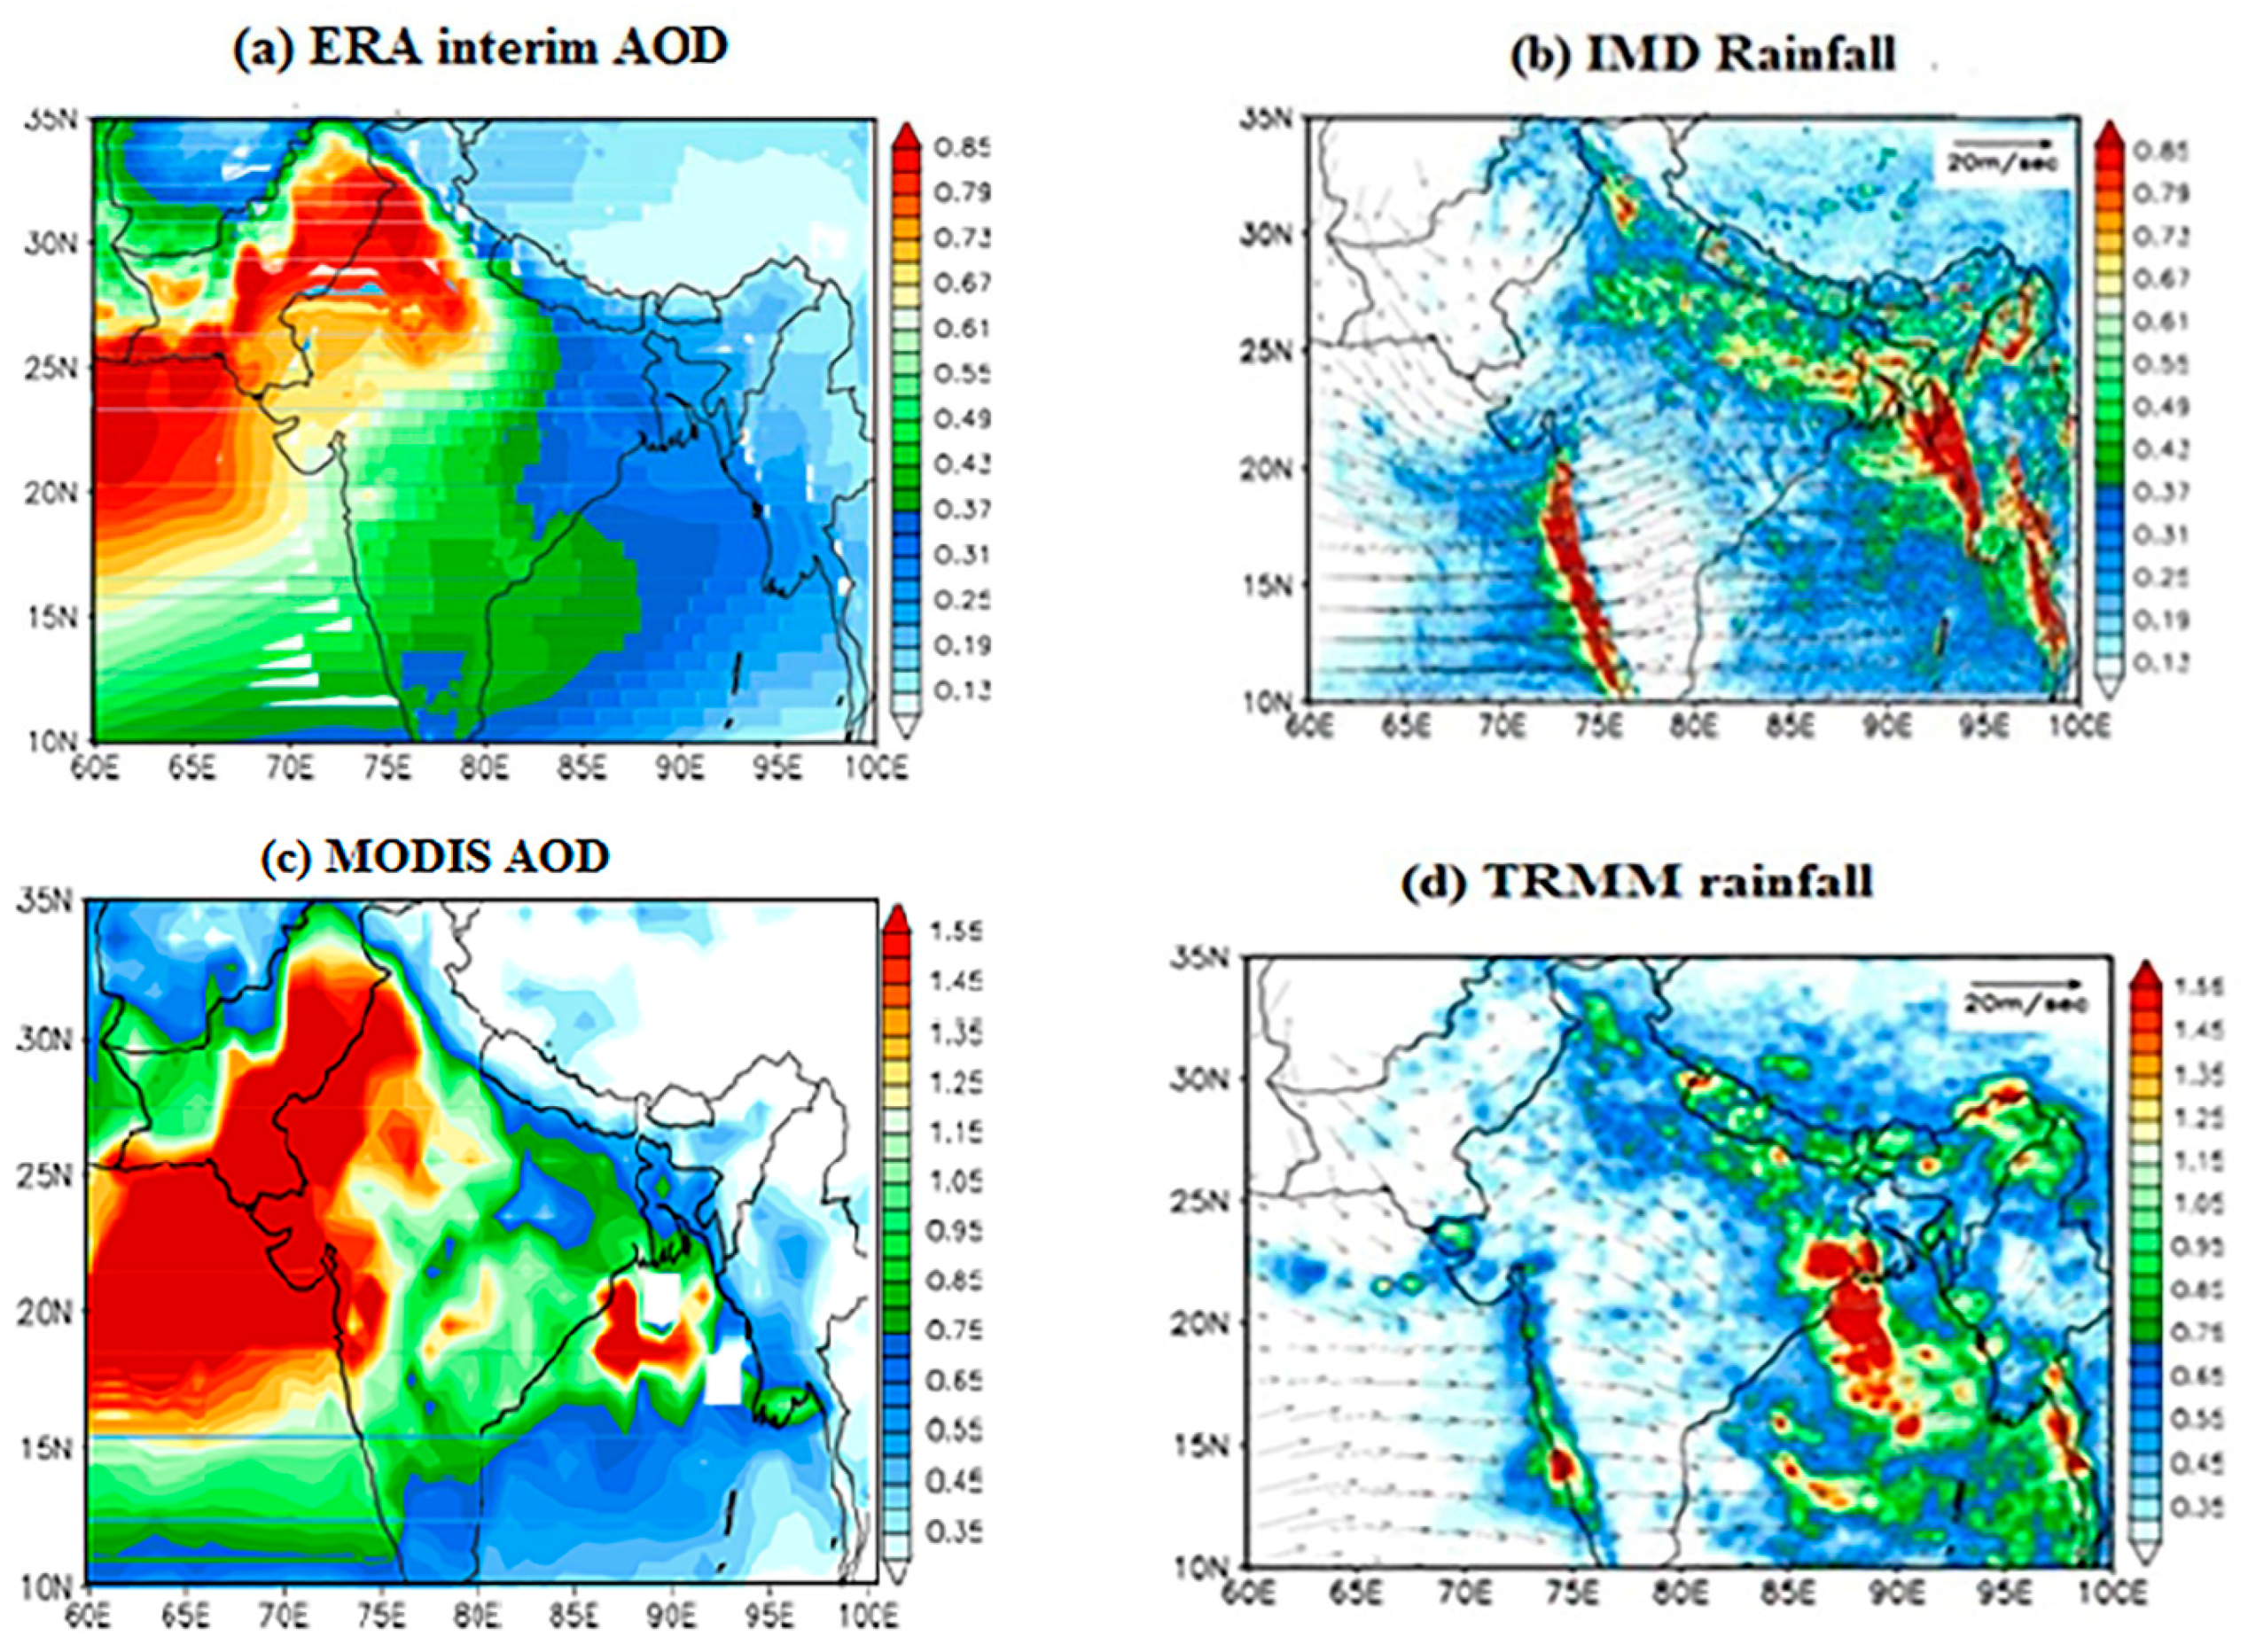
The effects of WD for the initiation period of February 2016 evaluate the range of AOD, rainfall, and 900 hPa winds of real TRMM rainfall, MODIS AOD, and ERA-Interim winds (
Figure 11). In comparison to MODIS, reanalysis of ERA-Interim accurately predicts the mean geographical distribution of aerosol AOD, exhibiting extremely high aerosol loading across the Indo-Gangetic Plain of northwestern and northern Arabian Sea as well as low aerosol loading across the Bay of Bengal and northeastern India (
Figure 11).
The AOD magnitude is generally understated, with certain regions having approximately half of the MODIS AOD magnitude. An investigation on the formation of aerosols, a considerable portion of the AOD across the Arabian Sea and northwestern India, has been established using ERA-Interim. The wind patterns and TRMM mean rainfall resemble observations in general (
Figure 11c,d), although there are some noticeable variances. The moderate prevailing winds in the model are far too strong. As a result, rainfall upwind across the Western Ghats’ mountain ridges is overstated. The model also understated the severe rainfall area that ranged from northern India’s east coast to the Bay of Bengal. The excessive rainfall and low-level prevailing winds across central and southern India are the cause.
4.5. Changes in Microphysical Processes of Aerosols
Various research has revealed that the concentration of CCN influences the warm precipitation and collision–coalescence mechanisms. The functional range of MODIS-retrieved droplets as a CTP variable was segmented into high- and low-aerosol-loading instances. It can be helpful to explore changes in warm rain processes, such as transmission and coalescence caused by the aerosol process [
26].
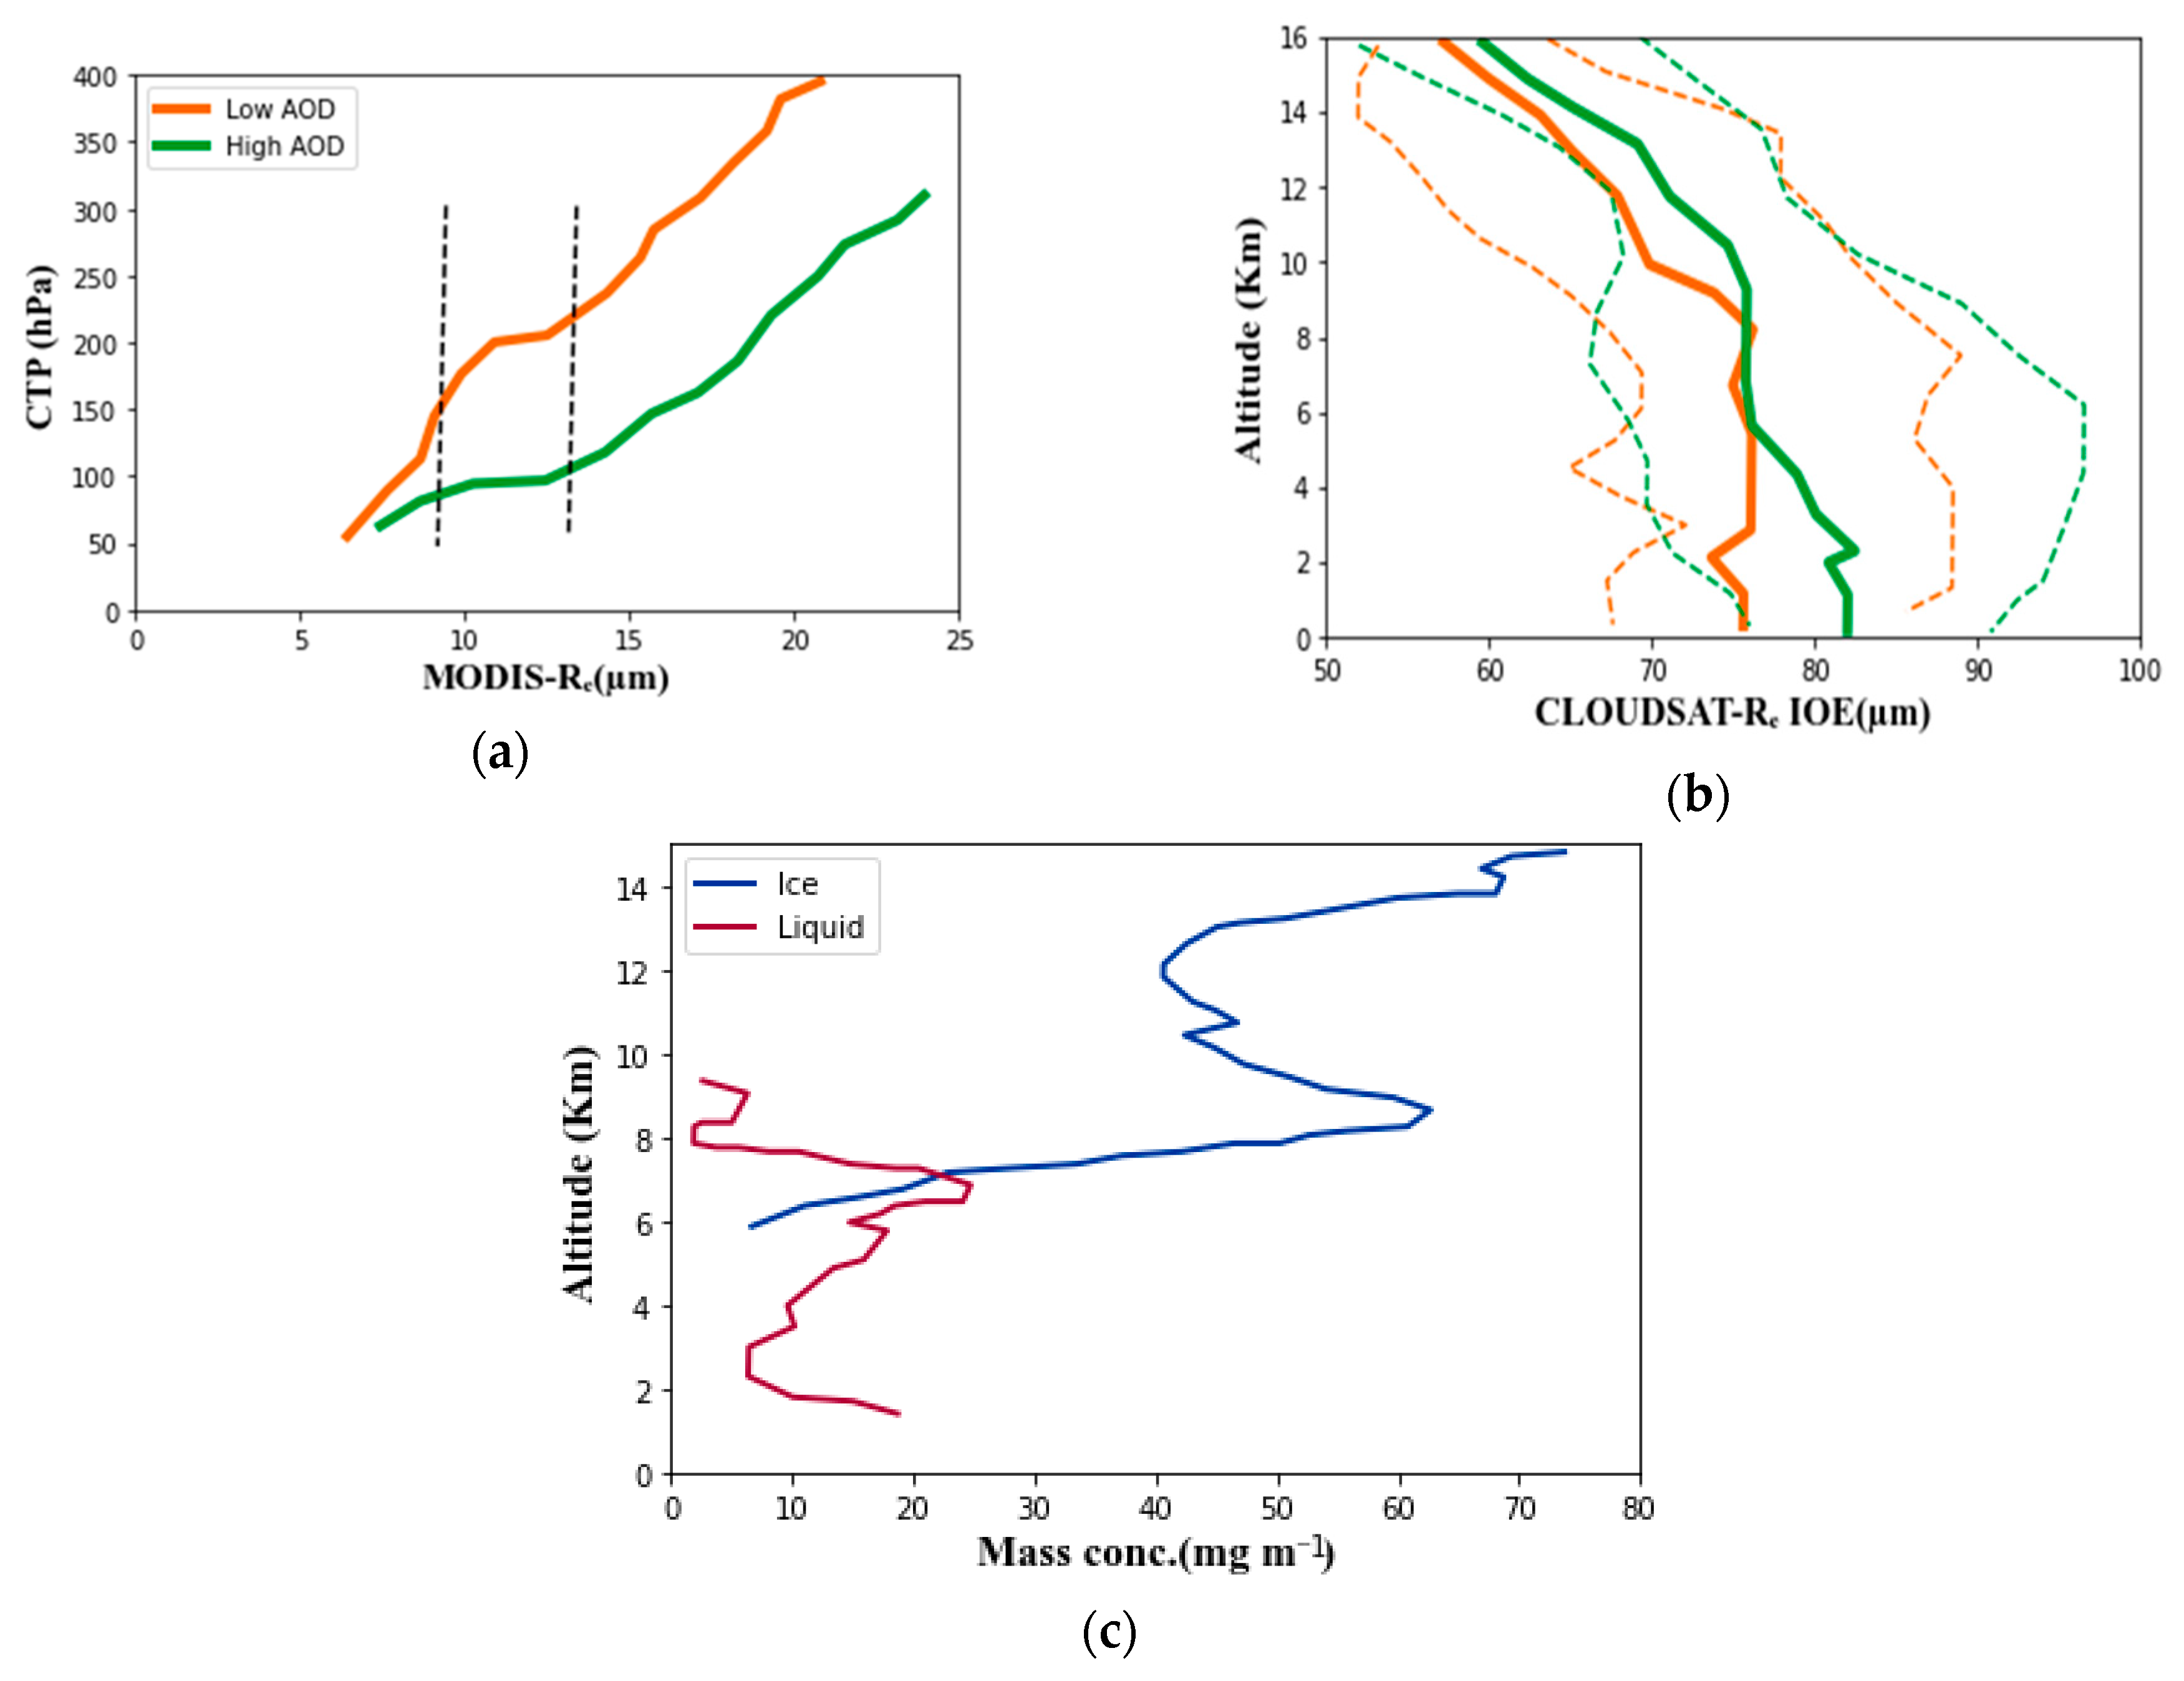
Figure 12, combining MODIS and CloudSat datasets, presents microphysical cloud changes for minimum and maximum aerosol loading.
Figure 12a illustrates that the Re in clouds generated under higher AOD levels at the cloud base liquid droplets were smaller (6 m). Similarly, relative to the vertical gradient development in Re
with comparatively clean clouds, the effects on the development of Re in polluted conditions grew at a moderate rate
for Re 14 m with low aerosol loading. It is also important to note that in moderate AOD situations (50 hPa), the altitude variation among the cloud base and initiation of more negligible warm rain than in high-AOD states (250 hPa). In contrast to low-AOD instances, the high-AOD instance’s mean Re is modest (less than 10 m) around the freezing level, leading to an improvement in smaller droplets at higher levels with aerosol loading increase (
Figure 12a). Under polluted conditions, a considerable rise in and preservation of supercooled liquid smaller droplets was seen above the freezing point.
Figure 12b explains the mean patterns of ice-phase functional radius (Re; ICE/) observed by CloudSat among high- and low-pressure loading states of aerosol; the dotted lines denote the 25&75th metrics correspondingly.
Figure 12c explains the mean ice-phase and liquid-phase water content variation shown by CloudSat (high AOD–low AOD).
4.6. Relationship between Relative Humidity and Surface Temperature Based on Clean and Dirty Days
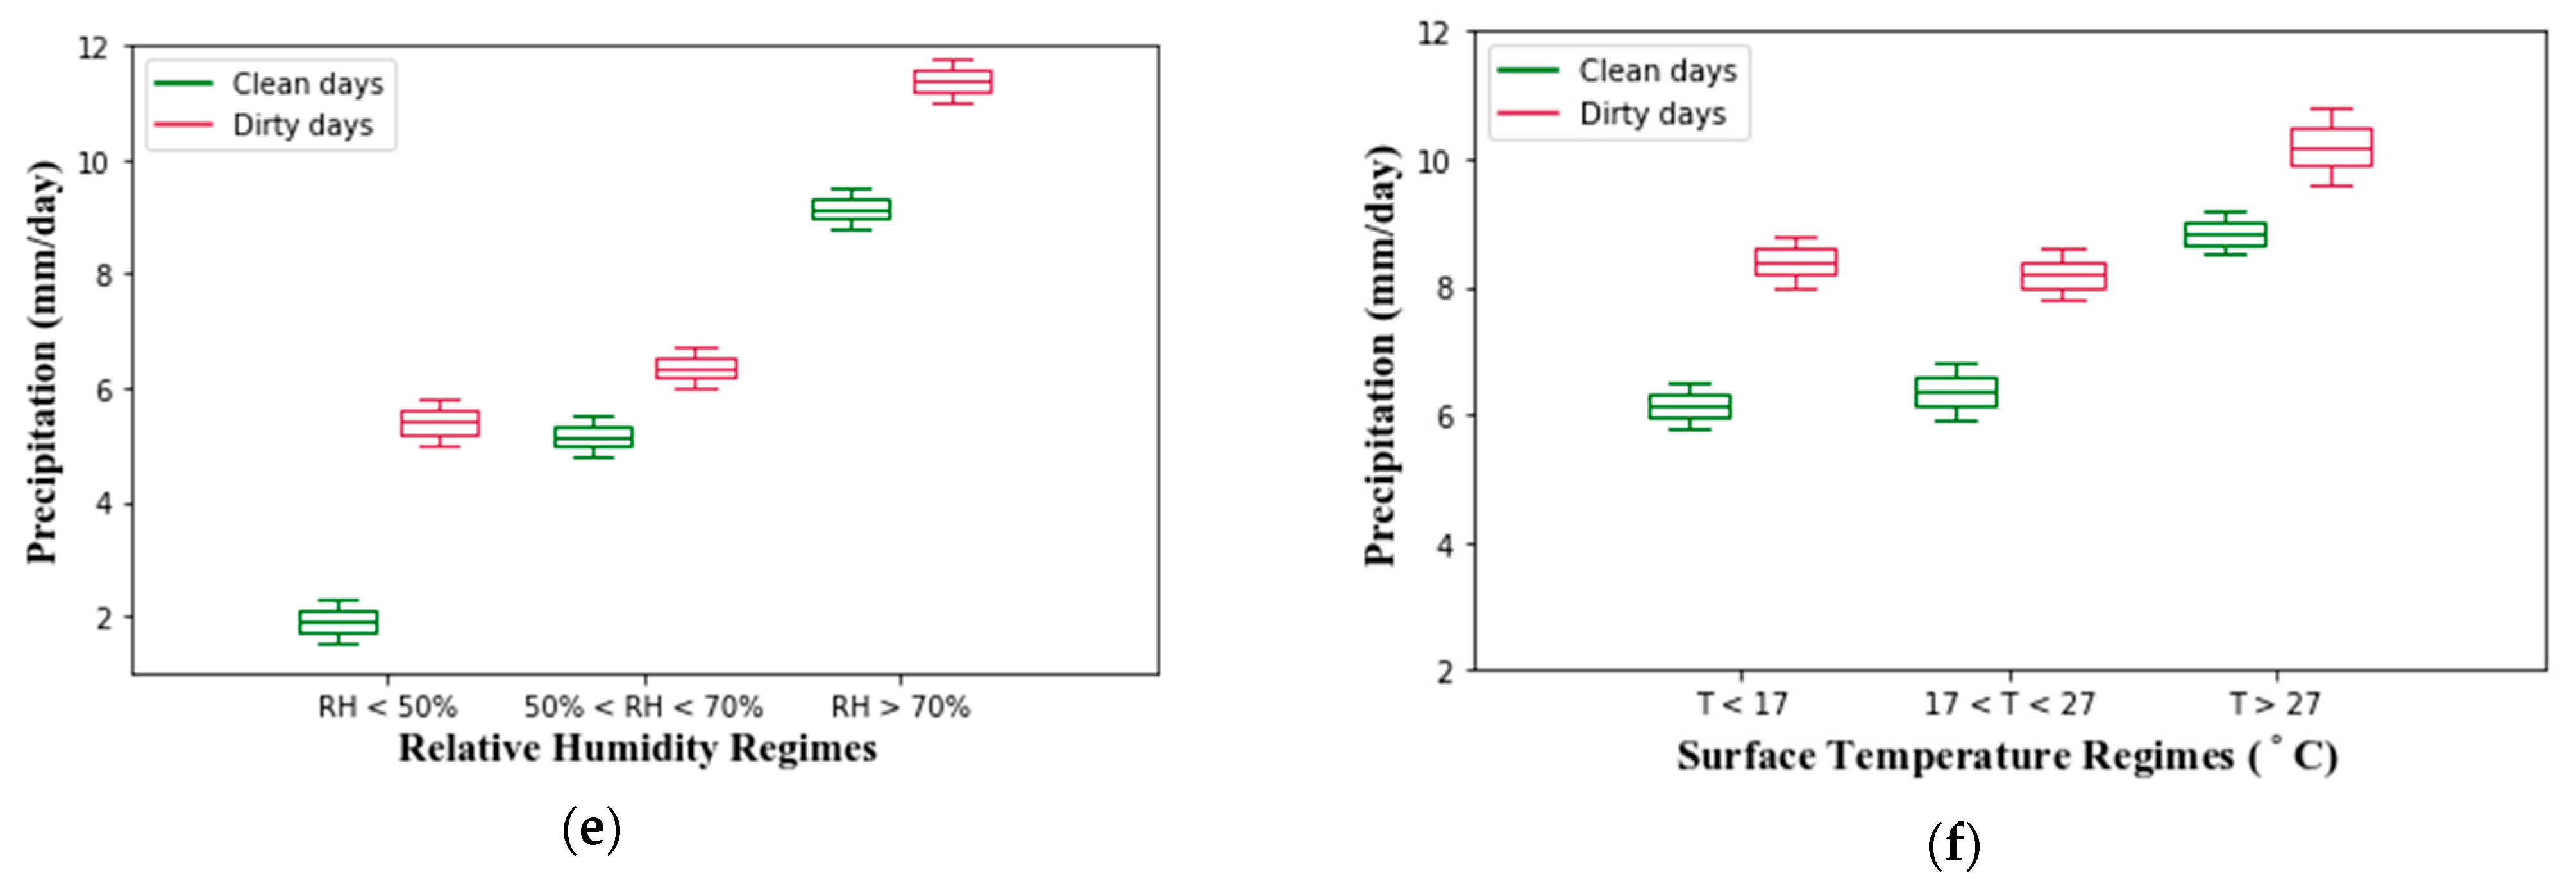
The strength of regional transients and the weather system’s intensity (climatology) achieved throughout the WDs may influence the relation between aerosols, cloud characteristics, and precipitation. Since these were most closely related to cloud parameters at the same pressure levels, to distinguish the weather influence from the aerosol–cloud–precipitation correlation (RH at 500 hPa and temperature at 600 hPa) were used. During the WD instance, the daily spatial average (RH at 500 hPa, 68.78, 17.91%) and (temperature at 600 hPa, 0.16, 0.08 Pa/s (mean, standard deviation)) among the climate for 3 WD cases. CF, CTP, and pixel-level rainfall data were collected on clean and dirty days and split into three different weather regimes. RH < 50% (low), 50%< RH < 70% (intermediate), and RH> 70% (high) are the three sub-regimes of RH. Similarly, T was used to classify the data into three convective sub-regimes: T < 17, 17 < T < 27 (weak convection regime), and T > 27 (severe convection condition) [
37]. On clean and dirty days, the boot-strapped distribution of every sub-regime is shown in the box and whisker plot (
Figure 13).
Figure 13a,b indicate that shallower clouds arose due to reduced relative humidity (RH) and downward motion (positive T). In contrast, in higher RH (CTP = 450 hPa), deeper clouds form, as well as a more robust upward surface temperature. There was a considerable difference between dirty and clean days for all three RH and T sub-regimes, with deeper clouds forming on more significant aerosol loading days than on clean days. Among the tropics is also the Amazon region [
28], and given the impact of a cloud of mixed-phase invigoration, which forms with a sufficient amount of aerosol, the clouds will grow taller. And this also supports our findings. Nonetheless, among dirty days, as opposed to clean days, more expansive clouds were observed in all three RH and T regimes (
Figure 13c,d). The generation of extensive clouds with a more excellent CF was aided by higher RH and more robust updraft settings; with subsidence and moderate RH conditions, only a few clouds were seen. RH and T are crucial meteorological variables that alter cloud characteristics, according to this finding. Increased RH convective conditions tended to enhance rainfall, as shown in (
Figure 13e,f). Furthermore, irrespective of T and RH sub-conditions, higher precipitation levels were found on dirty days compared to clean days.
Our findings were consistent with previous observational studies, suggesting that the direct association of aerosols for identifying low, moderate, and high-value climatic conditions, cloud formations, and rainfall remained relatively consistent. Aerosols and weather patterns (RH and T) were established by [
37] and both impacted the clouds of convection invigoration in the Atlantic. Among India’s central areas, according to [
41], CTP and aerosol loading were connected to rainfall for both days with lower humidity and higher humidity. More cloud condensation nuclei (CCN) are produced when aerosol concentration rises, slowing the CC phase by triggering smaller cloud droplets and, therefore, the generation of raindrops.
The AOD estimate is influenced by the hygroscopic development of aerosol caused by atmospheric RH, which can increase ambiguity in the aerosol–cloud–precipitation relation. However, the extent of the shift in AOD related to humidity depends on the aerosol characteristics and humidity changes between dirty and clean days. It was revealed that AOD grows up 1.8 times in high humidity with an RH of 98 percent compared to dry AOD. Among dirty and clean days, the variation in regionally averaged RH at 500 hPa is 1.65%. AOD over the west coast of India and the adjacent Arabian Sea regions between the mean dirty days is 3.5 times larger related to clean days. Moreover, when the data is segmented into several sub-regimes, the mean changes in RH among dirty and clean days range between 0.2 and 3.53 percent. Although modest changes in RH do not always explain the shift in AOD magnitude among dirty days, this is about three times the number of clean days; they lower biases related to the aerosol humidification effect.
4.7. Analysis of Aerosol–Cloud–Rainfall Association
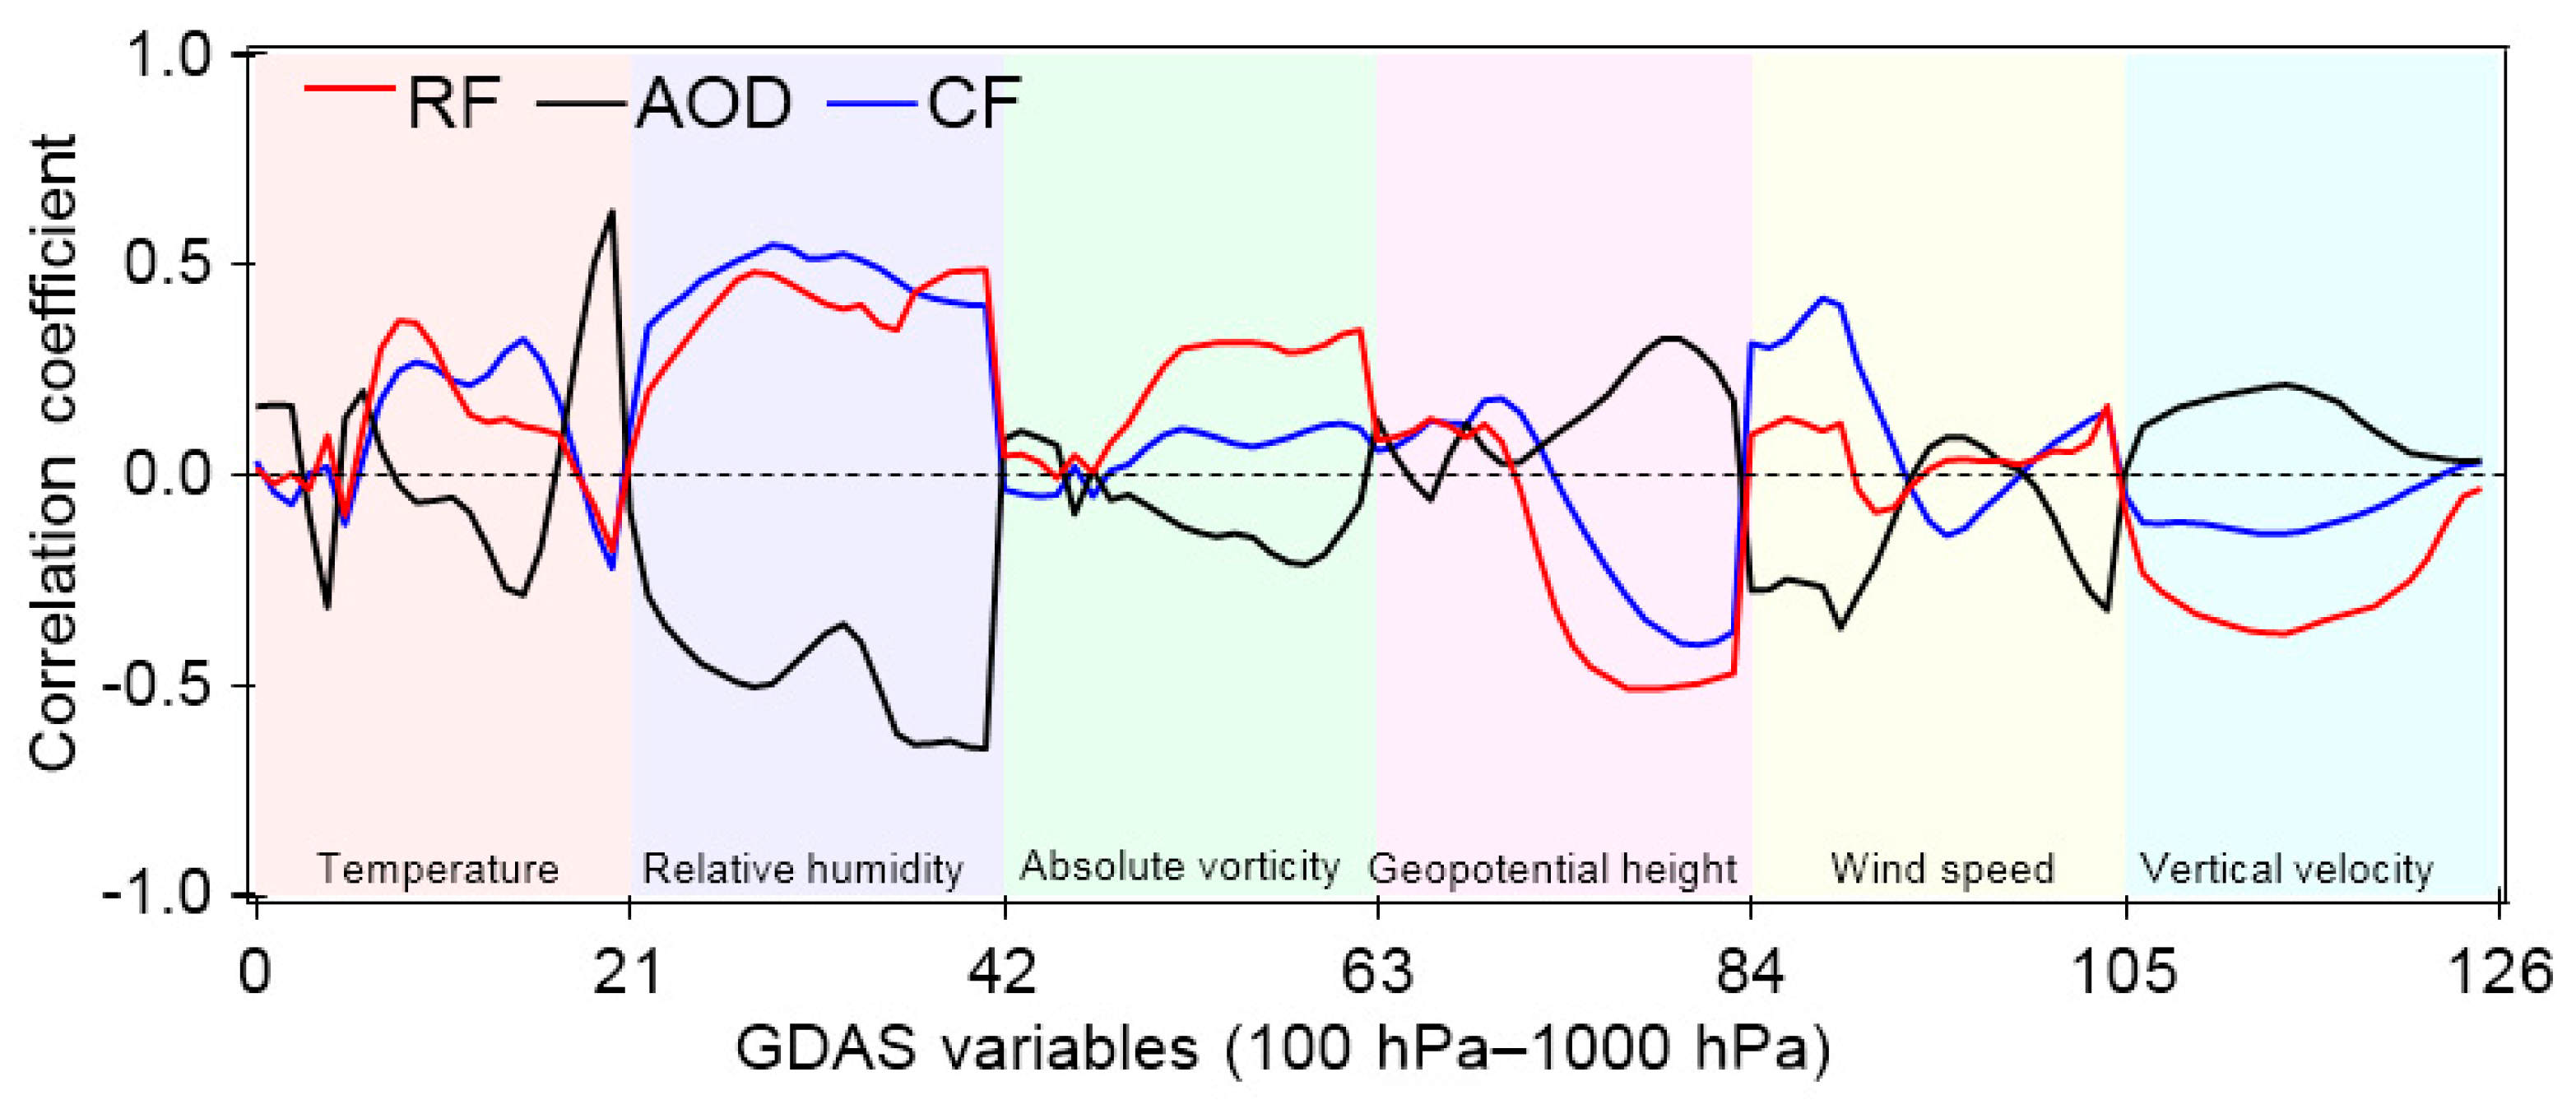
The significant relation between aerosol–cloud and rainfall features appears to be substantial, based on stimulating and modeling indications of the microphysical influence of aerosol over the region in the case of WD. We looked into the possibility of meteorology playing a part in our research. The coefficients of correlation for AOD, RF, and CF with ERA-Interim meteorological variables are shown in
Figure 14. A decline in AOD was shown to be related to heavy rainfall and deeper clouds under certain meteorological circumstances (
Figure 14).
Relative humidity had a positive connection with CF and RF, as expected. A rise in RH, on the other hand, was directly proportional to the amount of aerosol in the air, implying that overcast or rainy conditions were related to reduced aerosol loading. CF and RF were shown to be inversely connected, having geopotential heights typically less than 500 hPa; AOD, on the other hand, was discovered to be linearly associated. This emphasizes the importance of establishing a limited area or possessing a more significant RH in the lower atmosphere, encouraging rain and cloud development, but aerosol generation is not.
Such characteristics are similar to climate periods with a lot of rain, where a moderate region is correlated to the convection of further moisture at low elevations, increased cloud condensation, and increased rainfall. A drop in the intensity of aerosol through the region is related to the propagation of a low-pressure process for propagation. It moves from the Bay of Bengal to the Indian mainland, making significant rainfall and moisture to the region during the monsoon, according to recent modeling research [
46]. The drop could be due to a combination of cloud absorption, wet scavenging, and the diluting of comparatively ocean air masses that are clean and moist. At altitudes over 400 hPa, a significant relation among wind speed, CF, and RF has also been related to lower AOD (
Figure 14). The heavy wind velocity (with over 350 hPa) tends to disrupt the cloud-forming activity (
Figure 11). Two main climatic factors were detected: RH and geopotential height (under 500 hPa) affecting rainfall and cloud and qualities in the region based on the correlation study (magnitude of correlation coefficient >0.25).
4.8. Cloud, Rainfall, and Radiation Associations with Aerosol Loading
The association between IMD RF and AOD is seen in
Figure 15a. As AOD grew from 0.25 to 0.75, RF increased from 5.9 to 7.1 mm. The TRMM PR in
Figure 15b also revealed a similar relationship. For a 0.25 to 0.75 AOD increase, increases the precipitation rate from 0.31 to 0.38 mm h
−1. Aerosol-induced changes in cloud macrophysics were revealed by a contemporary investigation of aerosol and cloud parameters. The AOD increased from 0.25 to 0.75 and increased from 0.78 to 0.92 in cloud fraction, resulting in a widening of the clouds (
Figure 15c).
Another indication that the cloud is developing vertically with increased aerosol loading is a mono-phasic drop in CTP and CTT of approximately 200 hPa and 22 K, respectively, for the same increase in AOD. Studies on aerosols and clouds have shown that places with high absorbing aerosol loading have less cloudiness when the AOD is high. A significant reduction in the amount of solar radiation is observed by the widespread cloud coverage over the WDs during February 2016 (CF of ~0.75 for AOD ~0.3).
In February 2016, similar aerosol–cloud–rainfall associations with WDs were seen, as shown in
Figure 15. Although low-level and high-level clouds had significantly different mean CTP and CTT, both regimes’ overall associations were similar. It indicates that the observed relationships have significantly less intra-seasonality.
5. Conclusions
Among the three phases from February 2016, the interactions of aerosol–clouds–precipitation (ACP) observed in this research during WD moves across the west coast of India and the adjacent Arabian zone are analyzed by simulated back trajectory analysis utilizing satellite-based reanalysis observations. It is discovered that the pre-mature phase’s temperature is considerably lower. Eventually, within the mature phase, dry and hot westerly winds get more substantial, increasing temperature, and as a result, temperatures gradually increase in magnitude and regional extent. The modeled thirty-year mean climatology is identical to the wind speeds from ERA-Interim. During the dissipating phase, winds converge across the studied Indian region’s parts of the northeast and east continents. India’s northeastern, eastern, and central areas can be classified as suitable climates for moisture buildup and aerosol transmission.
During the dissipating phase, water vapor mixing ratios and RH are relatively high across the research area’s eastern and northeastern parts, indicating sufficient moisture between 19–24° N and 80–90° E. It would aid in producing and expanding cloud droplets and the aerosols’ hygroscopic growth. Rainfall occurs throughout the northeastern and eastern areas of the research area in the dissipating phase. The variation among observed and simulated values across all simulation sets suggests that the model has overestimated rainfall in the northeastern region (between 22.3–23.8° N and 83–90° E) while underestimating rainfall in the rest of the studied areas. Back trajectory simulation results show when related to MODIS recovered values, the model has overestimated AOD over Odisha, Gujarat, and West Bengal across the pre-mature phase as well as undervalued AOD in other locations of Kerala, Karnataka, and Goa during all three phases.
A positive relationship between rainfall and AOD indicates a stimulating effect, while a negative relationship shows a microphysical impact. Throughout the dissipating phase, the impact of invigoration predicts an increase in rainfall. A significant amount of aerosol presence is responsible for the rise in rainfall in the dissipating phase is supported by the findings.
The simulated hydrometeors for vertical profiles of four sets show that there is a sufficient water vapor higher than or equal to pressure value just above 600 hPa, which might aid throughout the formation and development of other cloud droplets for cloud droplet to raindrop phase change between the mature and pre-mature phases, lowering the auto-conversion process. Smaller water droplets may be transported to higher elevations, aided by a stronger updraft. As a result, droplets above the 0 °C isotherm freeze. Among the cloud droplets’ phase change, a significant quantity of latent heat is released, leading to the convective systems’ invigoration and increased rainfall rates during the dissipating stage.
Concerning terrain-induced meteorological conditions, climatic characteristics that influence the aerosol–cloud–precipitation interaction dynamics are unrestricted by the variables used here, as well as raising the amount of uncertainty in our analysis. Furthermore, observational data are scarce on CCN/INP concentrations. The west coast of India and the nearby Arabian regions can impose uncertainty in our research because of a need for more empirical evidence. The influence of thermodynamic, dynamic, and microphysical processes can be seen in the rainfall and cloud response to aerosols when an active WD moves across the region. The findings contribute to the different roles of aerosols in affecting cloud characteristics and precipitation incidence, distribution, and amount among the WDs.
The significance of aerosols in modulating precipitation and cloud characteristics is highlighted in our research under the influence of each WD event over the west coast of India and the adjacent region of the Arabian Sea. To understand this issue better, an analysis of the relative impact of local and distant aerosols using the radiative and cloud microphysical processes and the research utilizing high-resolution simulation is necessary.
