Article

Groundwater Circulation in the Shallow Crystalline Aquifer of Tharisa Mine, South Africa: Evidence from Environmental Isotopes and Near-Surface Geophysics

School of Geosciences, University of the Witwatersrand, Johannesburg 2050, South Africa
*
Author to whom correspondence should be addressed.
Water 2023, 15(16), 2876; https://doi.org/10.3390/w15162876
Submission received: 25 June 2023 / Revised: 1 August 2023 / Accepted: 3 August 2023 / Published: 9 August 2023

Abstract

:
For underground mining, efficient groundwater management is one of the critical mining economics components. The region of interest, known as Tharisa Mine, is situated on the western limb of the Bushveld Igneous Complex, which is home to South Africa’s premier platinum-group metal resources. This work aimed to provide the findings from the investigation and imaging of the near-subsurface hydrogeological architecture in a shallow profile using stable isotopes of water (18O and 2H) and radioactive water isotopes (3H). Regarding isotope data, 18O varied from −3.5 to 1.5‰; 2H from −24 to 4.7‰; and 3H from 2.0 to 3.4 T.U. Utilizing combined geophysical techniques, the results were verified. Additionally, the geophysical methods, including seismic refraction tomography, multichannel analysis of surface waves, electrical resistivity tomography, and magnetics, helped identify the fluid’s pathways and lineaments during migration to verify the isotope results. The groundwater inflow volumes into the open pit were initially determined by integrating the following findings: the delineation of fracture systems/zones and fluid migration pathways; mining activities enhance the storage and transmission ability of the aquifer; and the main sources of water in the mine include mixing of surface and deep water sources, recycling of water possibly via lineaments, and tailings dam seepages.

1. Introduction

Effective groundwater management is one of the most problematic parts of mining economics. A thorough understanding of groundwater flow dynamics is essential for a mining operation to be profitable [1]. Large land tracts are disturbed by mining activities, exposing additional eroded material. For hard-rock mining sites, especially open pit regions, waste rock dumps, tailings dams, and exploration areas, subsequent erosion of this material is a serious problem [2]. This is because sediments are chemically contaminated as a result of eroded material. Groundwater and surface water effects are caused by chemically contaminated sediments, especially those that contain heavy metals [2]. This includes acidification of the pH or metal loading in surface runoff due to the mobilization of heavy metals infiltrating the nearby subsurface or surface waters [2]. Flooding and structural damage are two examples of the physical effects connected to higher runoff volumes and velocities caused by disruption from mining activities [2]. Waste rock dumps and wet tailings impoundments negatively affect the water quality as surface waterways and the groundwater underneath these facilities are also impacted [3]. The groundwater may subsequently be contaminated by the leaching of harmful materials from these operations [3]. Groundwater enters an open pit when it is in contact with the water table. To facilitate the recovery of the ore when the mine is in operation, mine water must be continuously withdrawn from the mine [3]. The accompanying groundwater decrease may also impact surface water quality and flow rates.
Furthermore, the pumped groundwater’s return to surface waters downstream from the dewatered area may impact the water’s quality or quantity [3]. Because of this, effective mine water management design, which is both economically and ecologically sustainable, may minimize ineffective and expensive dewatering strategies with a complete understanding of the mine’s groundwater storage and flow direction [4]. Studies [5,6,7] have considered and reported impacts related to the author’s findings.
In previous hydrogeological studies, the physicochemical characteristics of groundwater were used to comprehend the hydrogeochemistry of water and the variables that affect ion concentration in aquifers [8,9,10,11,12]. Ref. [8] made the argument that hydrogeochemistry can be used to pinpoint the source of ion concentration in groundwater. Rock weathering and evaporation are responsible for determining the ion concentration of primary hydrochemical facies, according to [10]. To determine the main hydrogeochemical processes (silicate and carbonate weathering, ion exchange processes, and dissolution processes) responsible for groundwater chemistry and specify the groundwater quality parameters, [11] employed hydrogeochemical modeling. Ref. [12] investigated the silicate and carbonate weathering, evaporation, dissolution, and ion exchange in groundwater as well as its quality, origin, and chemistry. To define groundwater quality, origin, evolution, and aquifer chemical processes, the research mentioned above confirmed the use of hydrogeochemistry. Due to the complexity of groundwater flow, conventional hydrological methods and flow models are typically unable to characterize groundwater flow in open pit mining circumstances [13]. Hydrogeological approaches such as hydrogeochemistry must thus be used.
Groundwater evaluation requires geophysical investigations because they offer spatially broad, non-invasive, non-destructive subsurface investigative techniques that may address groundwater potentiality. Groundwater and vadose zone hydrology are the key fields where geophysical techniques have been used to map geological structures, define aquifer borders, and map fracture zones. These techniques are regarded as the most effective and appropriate for groundwater prospecting [14,15,16,17] and have been utilized often for mapping aquifer geometry. The techniques have been extensively applied in groundwater-related research in arid and semiarid locations, such as in the estimation and monitoring of groundwater levels [18,19], general groundwater exploration [15,20,21], and groundwater potential assessment [22]. Geophysics has also been employed extensively to characterize the groundwater–surface water interaction, as shown in several case studies [23,24,25,26]. However, only a small number of studies simultaneously combined geophysical and isotopic investigations.
Geophysical techniques have significantly advanced over the past few decades for near-surface and hydrogeophysical applications [23,27]. While seismic methods are infrequently used to discover and enhance groundwater resources, electrical resistivity methods are widely acknowledged for characterizing aquifers and groundwater salinity. This may result from the high prices, ambiguous outcomes, and challenging interpretive issues. The use of S- and/or P-wave seismic reflections in northern Germany, Denmark, and Canada has been extensively studied and presented in studies [28,29,30], as well as in studies [31,32,33,34], which incorporated airborne electromagnetic surveys with direct-push technology (DPT) and combined these two technologies with S- and/or P-wave seismic reflections.
In this work, groundwater pathways in the Tharisa Mine, one of South Africa’s platinum mines, are characterized using combined hydrogeological and geophysical methods. The mine’s main concern is determining the water infiltration in the region that has flooded the open pit. The mine intends to explore underground mining in the future. However, water leaking into underground mines/adits may obstruct mining operations in the future. The maximum predicted inflows are:
  • East Pit: 2698 m3/day (31 L/s);
  • West Pit: 1432 m3/day (17 L/s).
Sump pumping is a viable management method for the anticipated groundwater inflows because they are not regarded as large inflows. However, seepage water is what causes a problem during mining since it often forms undesirable ponds in the pit and does not quickly gather in the pit sump.
We sampled the water for hydrogeochemical and geophysical investigations to ascertain the connection between groundwater chemistry and the water source. The primary focus was to assess the groundwater’s quality and environmental features, as well as its movement and water sources in the mining region. To conduct stable environmental isotopes (18O and 2H) and radioactive water isotopes (3H), we collected water samples from the pit and monitoring boreholes. To further delineate the shallow (50 m deep) subsurface geological features and fluid migration pathways connected to the potential water source in the study area, the use of integrated geophysical methods, such as electrical resistivity tomography (ERT), multichannel analysis of surface waves (MASW), and ground magnetic surveys, was required. In the shallow aquifer, we examined and imaged the near-subsurface architecture (weathered and non-weathered zones and fluid migration channels).

Study Area

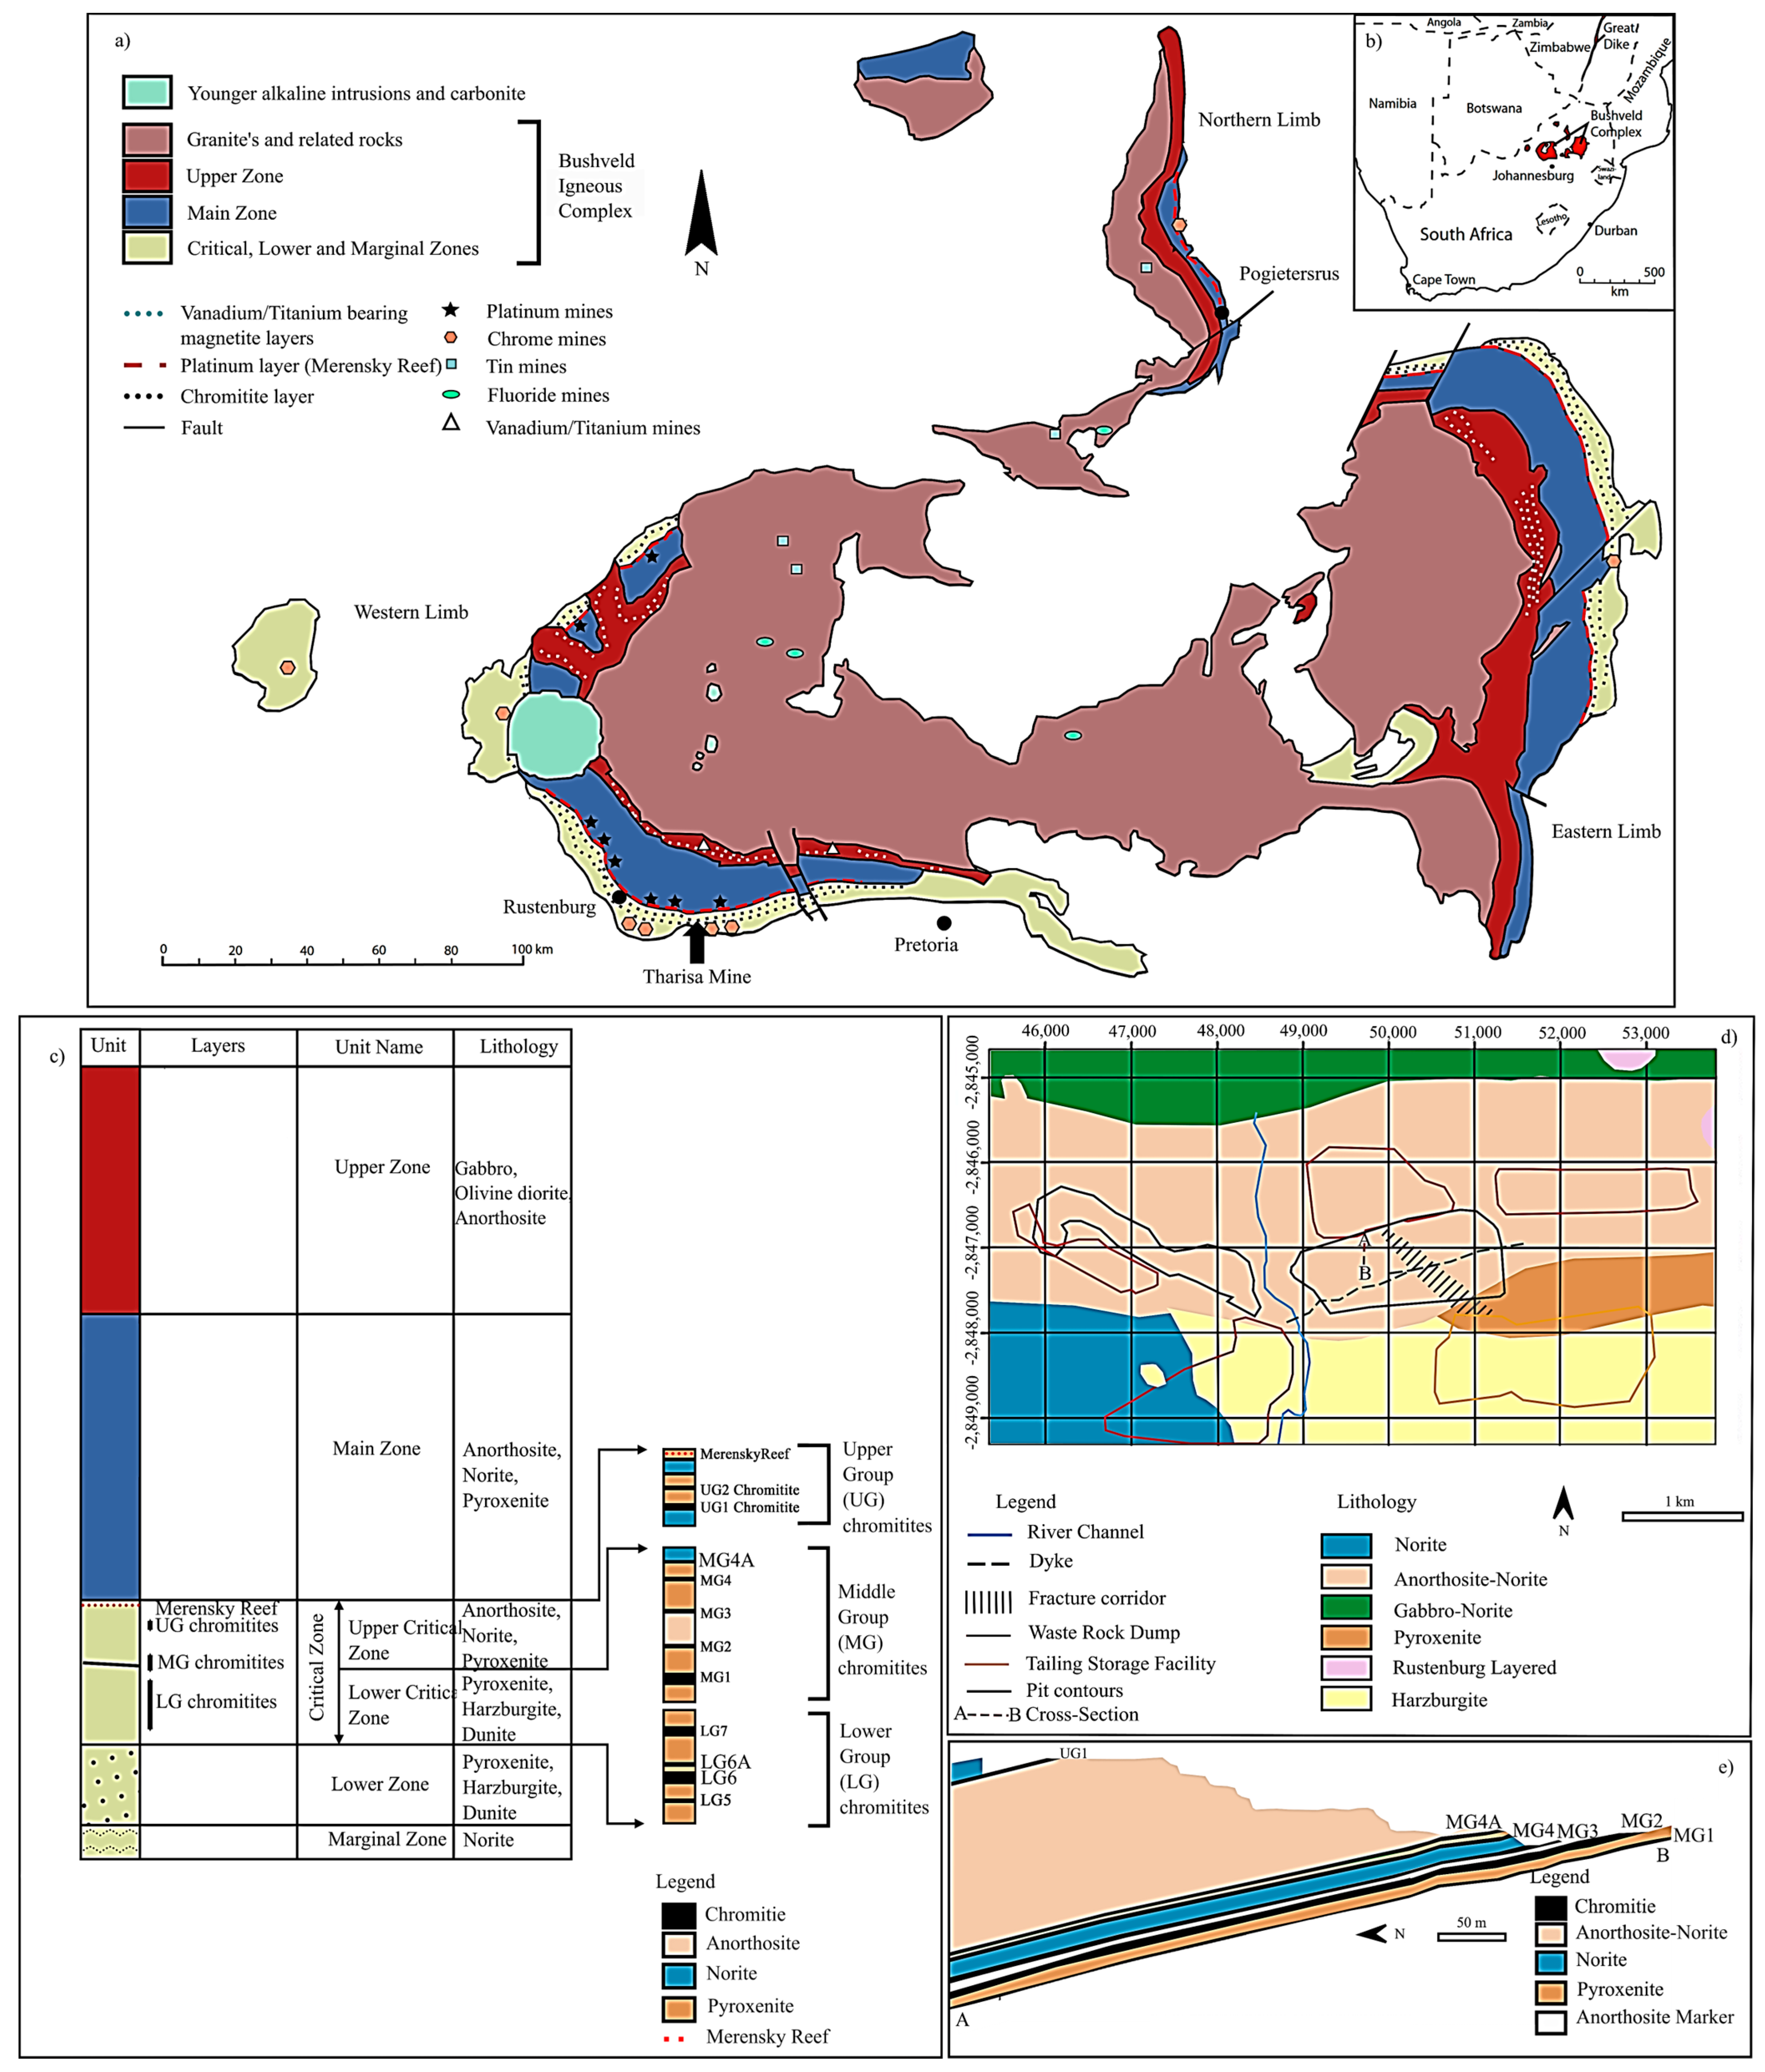
The Tharisa Mine is situated in the Marikana section of the Bushveld Igneous Complex (BIC) on its southwest limb (Figure 1). The Critical Zone’s chromite packages (Figure 1a) are the major economic prospects of interest for Tharisa Mine [35]. The periodic layering of well-defined cumulus chromite and pyroxenites, olivine-rich rocks, and plagioclase-rich rocks (norites, anorthosites; Figure 1c) defines the Critical Zone [36,37,38,39]. The Critical Zone includes deposits for platinum-group metals (PGMs), which are significant economically (Figure 1c). There are up to fourteen identified chromitite layers in the Bushveld Complex, all of which are found in the Critical Zone [36,37,38,39]. From the base up, the next three chromitite cycles are significant [36,37,38,39]:
  • Lower Group (LG) Chromitite Layers;
  • Middle Group (MG) Chromitite Layers;
  • Upper Group (UG) Chromitite Layers [36,37,38,39].
These chromitite layers are notable because they have high concentrations of chromite and PGMs [40]. The Merensky and Bastard units are the topmost units in the Critical Zone [36,37,38,39]. Based on the latest occurrence of cumulus feldspar (between the UG and MG Chromitite Layers), the Critical Zone may be further separated into the Upper and Lower Critical Zones [36,37,38,39]. The MG and UG Chromitite Layers at Tharisa Mine are mined (Figure 1e).
Figure 1. (a) Geological map illustrating the relations of the Tharisa Mine on the western limb of the Bushveld Igneous Complex, South Africa (modified from [41]). (b) Location of the Bushveld Igneous Complex in South Africa. (c) Generalized stratigraphic column of Rustenburg Layered Suite (RLS) (modified from [42]). The Tharisa Mine’s main economic horizons are those of the Critical Zone’s Middle Group (MG) Chromitite Layers: MG1, MG2, MG3, MG4, and MG4A. (d) Local geological map of Tharisa Mine with cross section A–B labeled. (e) Local geology of Tharisa summarized in a north–south cross section (A–B) showing the main horizons of economic interest. UG1 crops out further north of the Middle Group Chromitite Layers.
Water 15 02876 g001
Intergranular and fractured crystalline systems are the different types of aquifers found in the Bushveld Igneous Complex. The intergranular aquifer of the Bushveld Igneous Complex is confined inside the weathered zone, which has a thickness that varies between 12 and 50 m [43]. The fractured and unweathered aquifer extends to depths where increased overburden pressure has sealed the fractures [43]. Under the weathered zone is where it is located. The groundwater flow between the shallow fractured aquifer and the deeper weathered aquifer is controlled by mining voids, fast vertical inflow, and coupled fracture networks [44]. Additionally, the shear zone and areas affected by regional tectonics are involved in this groundwater flow. The Rustenburg Layered Suite of the Bushveld Igneous Complex, which makes up the norites, anorthosites, and pyroxenites in the Tharisa mining region, is composed of:
  • Unweathered rock matrix with minimal porosity and permeability;
  • Rock matrix with discontinuity planes, including faults and joint planes (together referred to as fractures) [45].
The Tharisa aquifer system might initially be categorized as a shallow bedrock with intergranular porosity and permeability [45]. The norites, anorthosites, and pyroxenites underwent extensive in situ weathering, which led to the formation of the shallow unconfined to semi-confined water table aquifer [45]. It is regarded as a single weathered aquifer unit and includes the variably weathered and fractured bedrock underneath the regolith. The second option is a deeper bedrock aquifer system that is unweathered and cracked [45]. Norites, anorthosites, and pyroxenites with faults and fractures make up the unweathered bedrock aquifer [45]. It is considered that the complete bedrock matrix has a relatively low matrix permeability, but faults and mine voids increase the bedrock’s effective permeability [45].
To avoid any hydraulic interference with the hydraulic stress elements, such as open pits, waste rock dumps, tailings storage facilities, and boreholes, the preliminary hydrogeological model domain for the Tharisa Mine was chosen exclusively based on catchment areas and divided between the catchments [45]. The main river system at Tharisa Mine is the Sterkstroom River. The Sterkstroom River is a tributary of the Crocodile River (West) and is considered a perennial river with an average flow rate of less than 0.5 m/s. The Tharisa Mine site is divided between the East Pit and West Pit, which are situated on each side of the Sterkstroom River (Figure 1d and Figure 2). The watercourse and the nearby infrastructure that runs parallel to the river are both protected by the pits.
Figure 2 depicts the model domain and the primary hydraulic stress components used by the groundwater model. The following are the boundaries established for the Tharisa groundwater model:
  • No-Flow Boundary: Along this portion of the model borders, there is no fluid exchange (into or out of the groundwater system). The no-flow boundary was chosen to be along the lines of high elevation that represent watershed boundaries on the southern and western edges of the model domain;
  • Specified Head Boundary: Fluid exchange happens both within and outside the model area, ensuring that the hydraulic head boundaries are kept at their initial values:
    • External Boundary: along the low-elevation river on the eastern side and partially on the northern side of the model domain limits;
    • Internal Boundary: established along the rivers that are a part of the model domain for the groundwater domain [45].
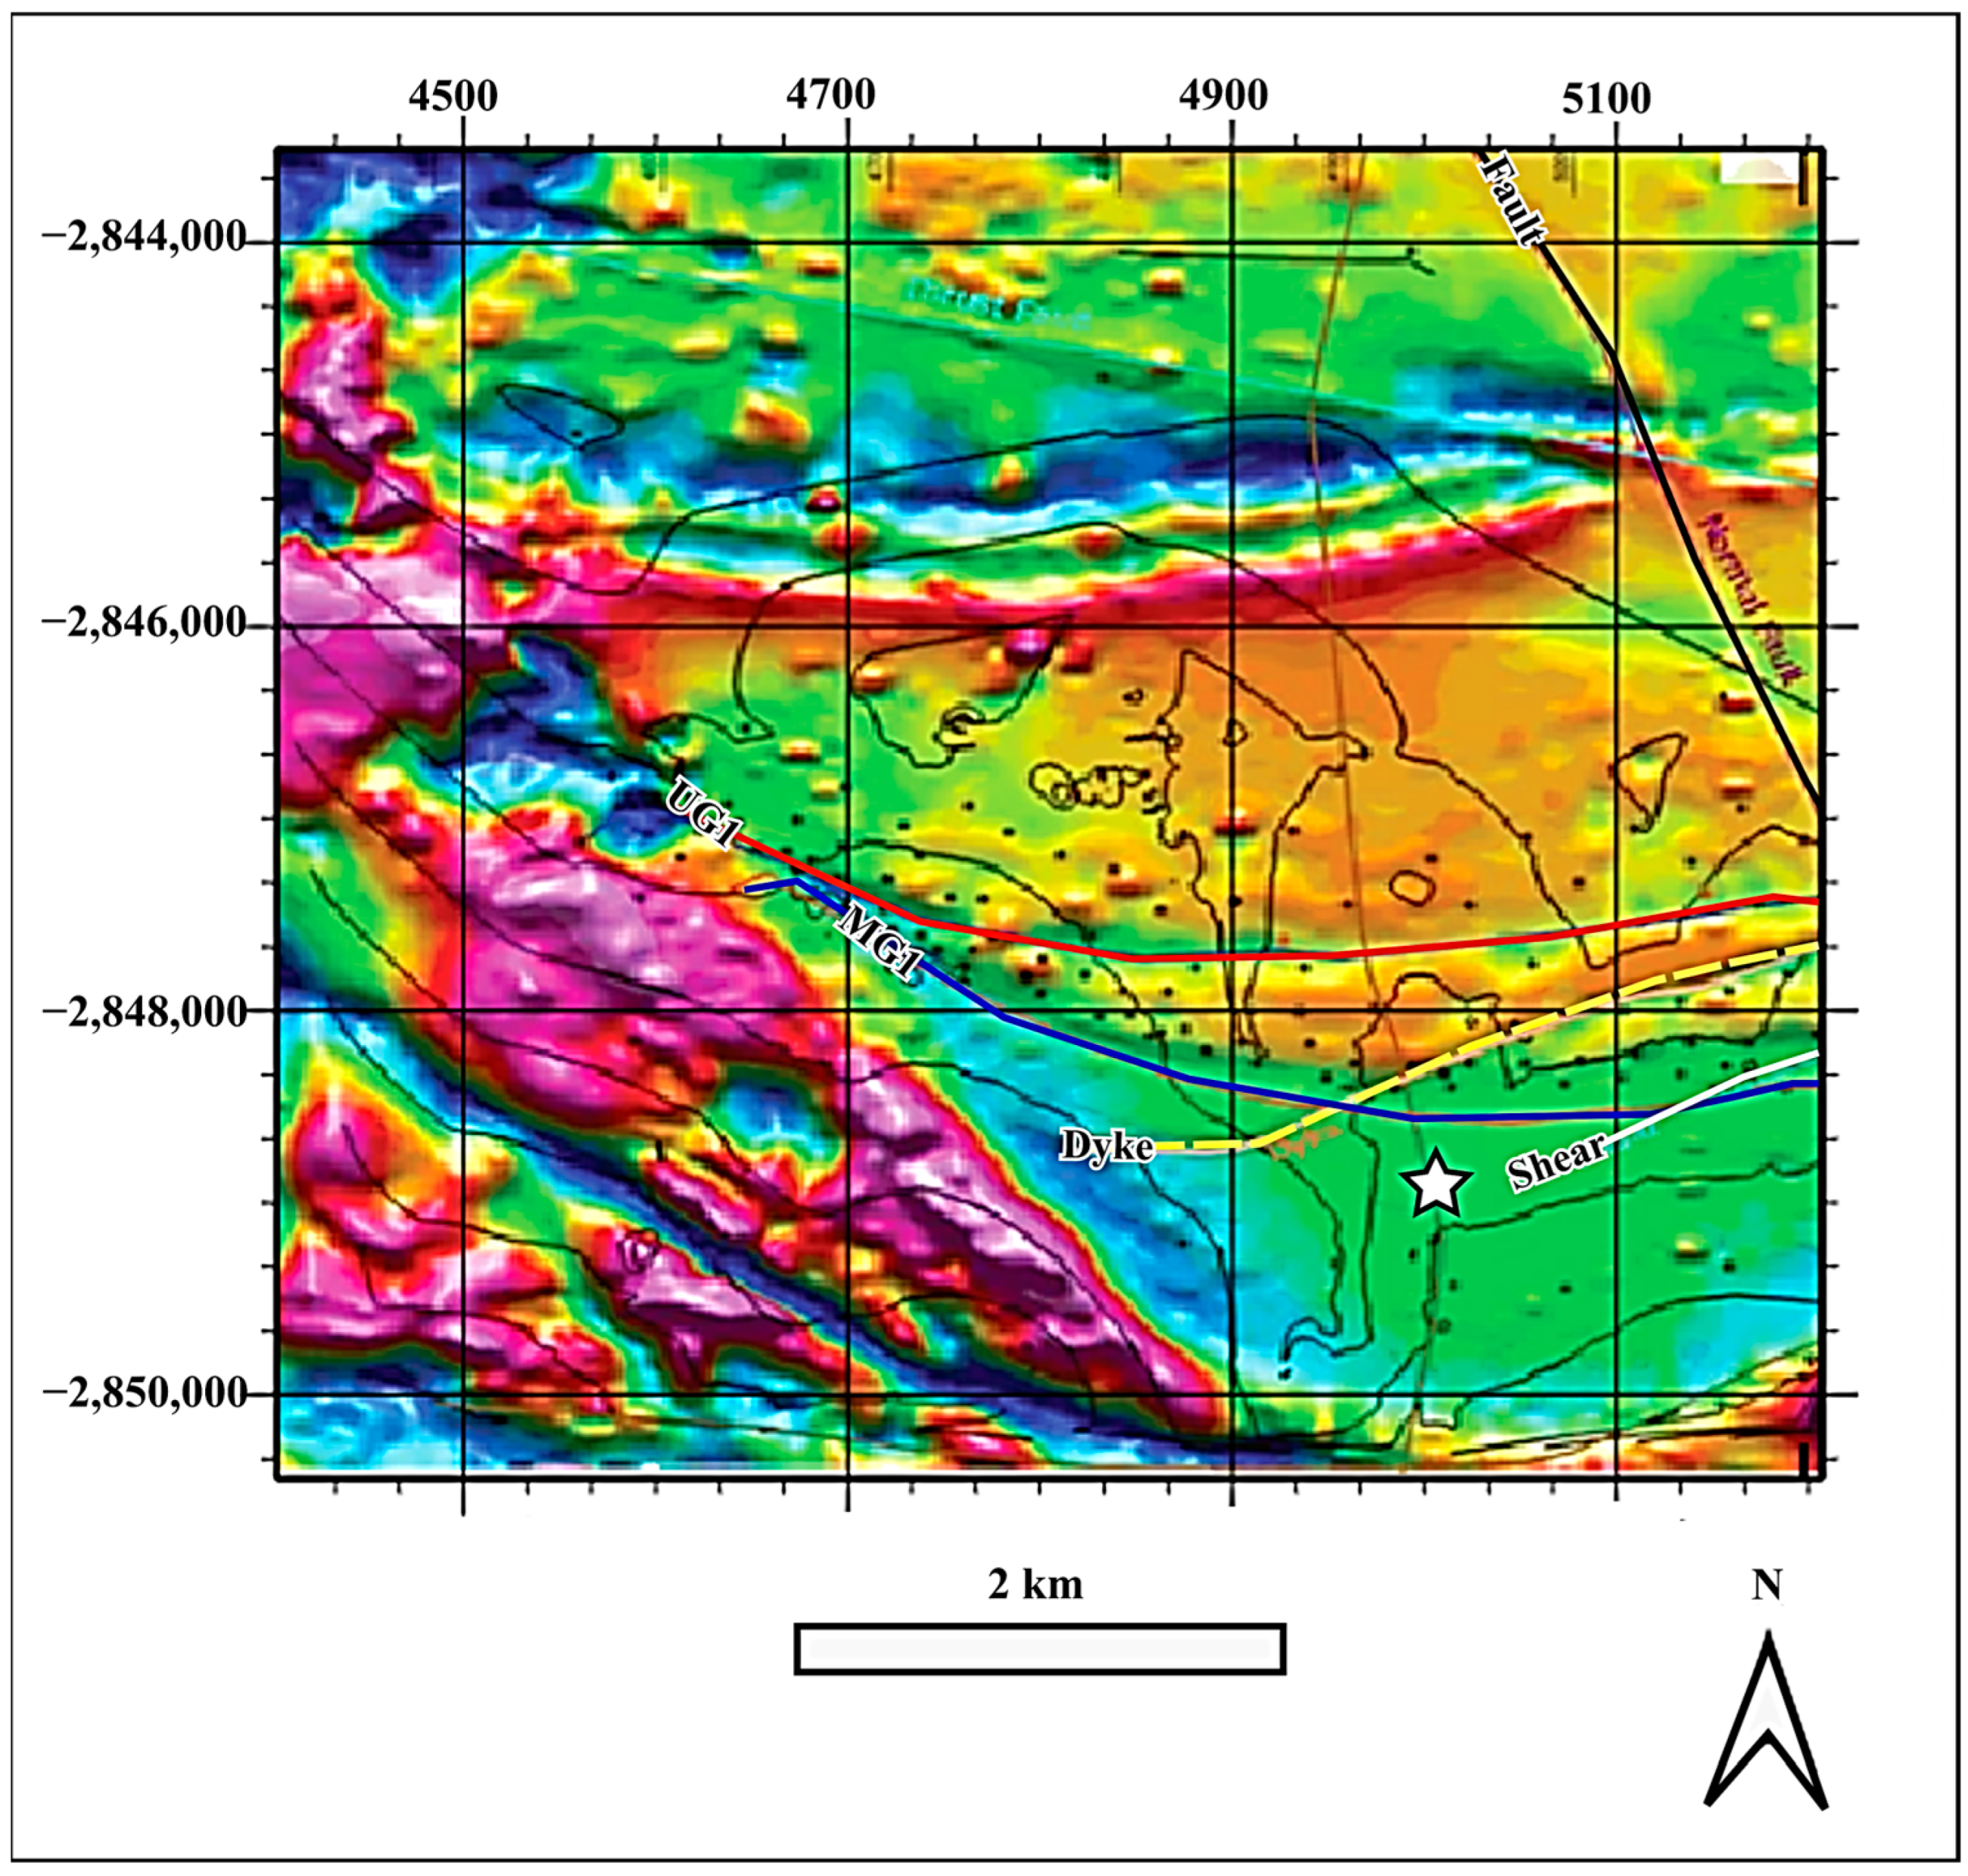
Based on drilling and aeromagnetic data, the current structural interpretation of the Tharisa Mine region is presented in [46]. In August 2007, an aeromagnetic survey was conducted over the Tharisa Mine region to map regional structures (Figure 3). The distance traveled was 900 km, with a line spacing of 100 m at 0 degrees (true north). Tie lines were set 500 m apart and parallel to the survey lines. The ground clearance was 40 m, and the sample spacing along the flight lines was 6.5 m. A steeply sloping NW–SE trending normal fault is the significant fault in the mining region. Only the extreme northeastern part of the land is affected by the fault. The main lineation on the aeromagnetic data is a low-angled WNW–ESE trending thrust fault. The aeromagnetic survey was used to interpret a NE–SW striking sub-vertical dyke with a thickness of around 10 m. In the far eastern pit, a NE–SW running sub-vertical shear zone was seen. In the aeromagnetic data, it is visible as a lineation. Around the shear, the thickness of the MG1 Chromitite Layer decreases. Aeromagnetic anomalies are considered to be the anorthosite and norite in the UG1 Chromitite Layer footwall and are located north of the MG Chromitite outcrops, following the strike’s northwesterly flexion.
The region has a typical summer rainy climate with a mean annual precipitation of around 680 mm and evaporation of about 1800 mm yearly; summer rain is primarily thunderstorms [46]. In the summer, between November and January, the region often has a high S-pan evaporation rate [46]. There is a high relative humidity as a result. Additionally, more water evaporates because the ambient temperature is higher in the summer than in the winter [46].
Winds are light and come mostly from the northwest [46]. Dry and chilly winters prevail. Frost, which happens between two and twenty times a year, and rare hailstorms are examples of extreme meteorological conditions [46].
The average annual temperature for the year is roughly 19 °C, with average maximum temperatures ranging between 22 °C and 32 °C and average minimum temperatures ranging between 2 °C and 18 °C [46]. December through February has the most heat. Winter officially begins when the temperature falls in April and May [46]. June and July have the lowest temperatures [46].

2. Materials and Methods

2.1. Water Sampling Methods (Physicochemical Field Parameters): Electrical Conductivity, Total Dissolved Solids, pH, and Temperature

Since they directly detect the dissolved ionic matter in the water, electrical conductivity measurements are useful in aquatic investigations [3]. High values denote salinity and eutrophic issues, whereas low values indicate waters with high quality and low nutrient levels. If extremely high readings are noted, they can indicate potentially contaminated sites [3]. Water with a pH below 7 suggests an acidic solution, whereas water with a pH over 7 indicates an alkaline solution [3]. The bioavailability of heavy metals is another factor possibly influenced by pH [3].
The aforementioned field characteristics may be used in hydrogeological research to analyze subsurface water flow through strata or lineaments (e.g., groundwater intrusion) and show a potential relationship between water chemistry and preferential weathering [8,9,10,11,12]. Therefore, confirming groundwater circulation and quality can help shed light on the genesis of subsurface features and open the door to suggest several mitigating measures.
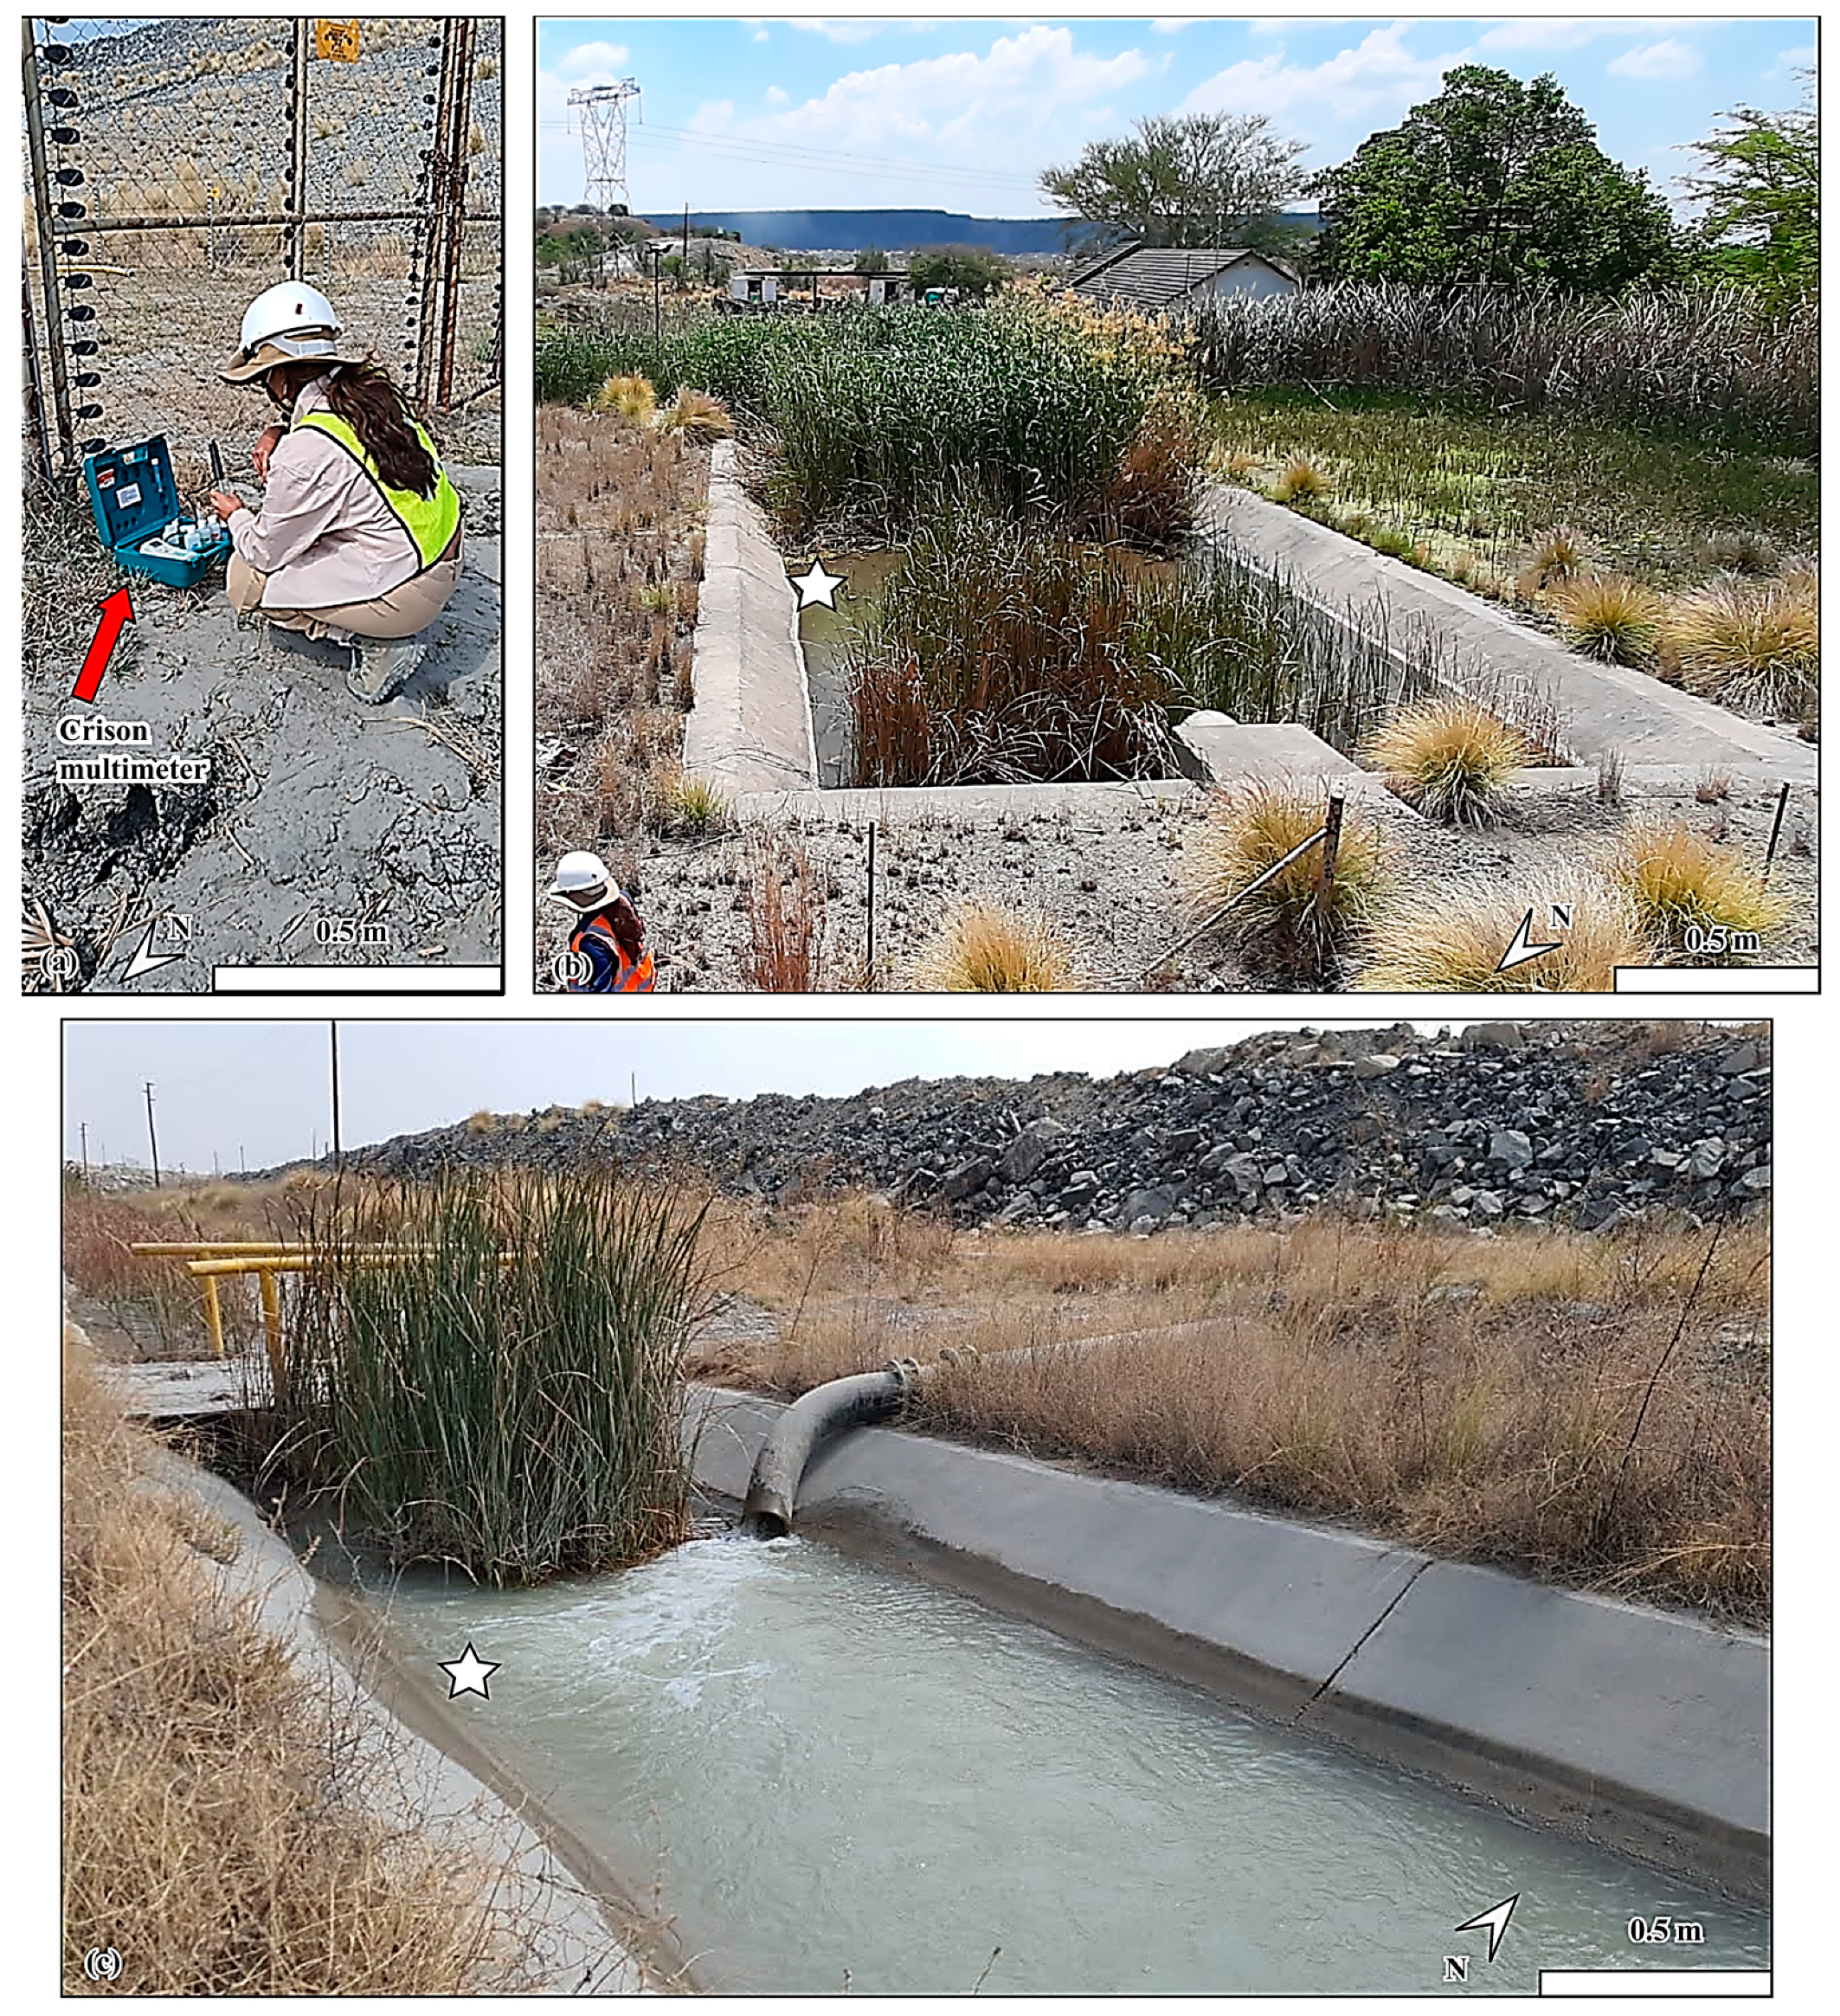
After calibration, physicochemical variables such as temperature, pH, electrical conductivity, and total dissolved solids were measured outdoors using a Crison MM40 Multiparameter Instrument (Figure 4). The process for the hydrogeological field sample parameters (Figure 4) is summarized in Table 1.

2.2. Environmental Isotopes of Water

Groundwater flow patterns are revealed by studying water isotopes. They are frequently used to conceptually map out a groundwater flow pattern, pinpoint recharge and discharge zones, and determine the mixing and salinization processes that occur in groundwater [47]. Hydrogen and oxygen isotope fractionation results from several hydrologic cycle events, including evaporation, condensation, recharge, mixing, and water–rock interaction [47]. As a result, the processes to which the water is subjected may be determined by methodically sampling the isotopic ratio of different water sources [48,49].
The water samples collected for environmental isotope analysis (δ18O, δ2H, and 3H) were used to understand the inter-relationship between water points, interconnection, water source, and mixing. Water samples were collected from different lithologies in the area for this task. All available monitoring wells were sampled for isotopes. All the samples were collected in one day (11 August 2021) and then submitted to the lab on the same day (18 August 2021).

2.2.1. δ18O and δ2H

Water samples were collected in 10 mL glass bottles with screw-top lids, washed with sample water before filling, ensuring there were no air bubbles, and properly labeled for measurement of the 18O and 2H values. While being transported to the lab, samples were placed in a cooler box to keep them from being exposed to light. The Liquid Water Isotope Analyzer model 45-EP was used at the University of the Witwatersrand in South Africa to analyze the stable isotopes of 18O and 2H. When testing liquid water samples with dissolved salt concentrations up to 1000 mg/L, the laser apparatus can deliver precise results with an accuracy of around 1‰ for 2H and 0.2‰ for 18O [50].

2.2.2. Tritium 3H

Bottles with 500 mL volume with screw-top lids were used and washed with sample water before filling, ensuring there were no air bubbles. Each bottle was properly labeled as tritium for sampling. For examination, tritium samples were delivered to the iThemba Labs in Gauteng. A 0.2 T.U detection limit analyzer was used for the electrolytic enrichment technique of tritium analysis [50].

2.3. Electrical Resistivity Tomography (ERT)

Numerous ERT surveys with varying spread lengths (80–300 m) and electrode spacings (1–3 m) were conducted in the mine using the automated ABEM 1200 multielectrode resistivity unit, which is a multi-core cable system. The resistivity data were acquired by injecting direct current into the ground using a pair of current electrodes (A and B) and measuring the resulting potential difference using a second pair of electrodes (M and N) called potential electrodes. To reasonably map horizontal and vertical subsurface changes, the resistivity data were acquired using multiple array types, i.e., Wenner, Dipole–Dipole, and Schlumberger arrays. The collected data were manually de-spiked and then inverted in RES2DInv to obtain 2D resistivity inverse models using a least-squares regression. Gomo et al. (under review) further detail the ERT data acquisition.
Each geological material has a characteristic resistivity value enabling easy delineation of lithological boundaries [51,52,53]. Therefore, resistivity was a valuable method for this study as it allows for characterizing geological subsoil conductive anomalies using the spatial distribution of the underground electrical resistivity [53,54,55]. Furthermore, resistivity methods allow geological mapping of structures, groundwater flows, and fracturing by delineating respective geological boundaries and detecting zones of low resistivity associated with water saturation [51,52,53,54,55].

2.4. Multichannel Analysis of Surface Waves (MASW)

The MASW surveys were acquired using a standard MASW roll-along technique [53]. This entailed using a 24-channel seismic system with a 46 m profile length, 2 m spaced receivers (14 Hz, 1-component geophones), a 12 m source to the nearest receiver offset, and a roll-along shift of 2 m and 4 m at sites one and two, respectively. A 6 kg sledgehammer was used as an impact source, and an aluminium base plate was used to improve the seismic source–ground coupling. The data were acquired using five shot stacks, a sampling interval of 1 ms, and a recording length of 1000 ms. The MASW data processing involved converting the acquired data into the phase velocity–frequency domain, picking the fundamental mode to obtain a dispersion curve from the produced phase velocity–frequency spectrum, and inverting the dispersion curves to obtain a 1D shear wave (Vs) velocity profile at each shot location. The process was repeated for each shot location, and the obtained 1D Vs profiles were then integrated to obtain a 2D Vs section of the MASW profiles.
MASW is useful in imaging shear wave velocity structure, low-velocity zones, and fractures [51,53,56]. Moreover, it can map the shear wave velocity profile of an upper weathered aquifer and subsequent water table/saturated zone to a depth of about 15 m [51,53,56].

2.5. Seismics

Multiple profiles with varying lengths (46–96 m) and receiver/shot (1–2 m) spacings were collected with a combination of 14 Hz (1 component) geophones and a land streamer set up to accommodate the hard-rock environment in the mine. The seismic sources used included an accelerated weight drop (24 kg) and sledgehammer (6.3 kg) with an aluminium plate to improve the seismic source coupling. The data processing flow started with fixing and adding the geometry for all the seismic profiles and assigning the common depth points (CDP). The P-wave first breaks were manually picked on each profile for refraction statics and to generate a two-layered P-wave velocity model. Rapetsoa et al. (under review) further detail the seismic data acquisition.
Rock and structural qualities can be determined with the use of seismic studies. The subsurface’s velocity and density structure can be detected using seismic techniques [27]. The field design is based on transmitting seismic signals from an energy source and measuring the signals at geophone receivers located at various distances [28,29,33]. When propagating through the earth’s crust, P and S waves behave differently regarding the motion of the wave’s constituent particles. Given the same frequency content, S waves’ having shorter wavelength and slower propagation velocities than P-waves enables them to resolve tiny subsurface features more effectively [27,28,29,33]. The primary prerequisite for reflected seismic waves at a layer boundary is that the layers must have distinct impedance values calculated using the seismic velocity and density of the layers [27]. Porosity affects density and seismic velocity; both decrease as porosity rises [27]. As observed, velocities may correlate to physical qualities, compaction and saturation levels, and strength in the bedrock; this aids in discovering lithological and hydrological limits in the subsurface [52]. Reflection seismics is a common geophysical exploration method, particularly for applications in hydrogeology and the environment (such as determining aquifer depth or the water table) [57,58,59,60].

2.6. Magnetics

Two G856 proton precession magnetometers were used as base stations to acquire the ground magnetic data. A G859 cesium vapor magnetometer was used as a rover to collect the data for a total area of 16,300 m2. The collected data were then inspected and compared for spikes in the diurnal curve. The regional magnetic field was corrected for diurnal variations, de-spiked, and interpolated using the minimum curvature technique to produce a total magnetic intensity (TMI) map (further processing is given in Rapetsoa et al. (under review)). Finally, the vertical tilt angle filter was applied to enhance the edges of magnetic sources influencing the data. Rapetsoa et al. (under review) further detail the magnetic data acquisition and processing.
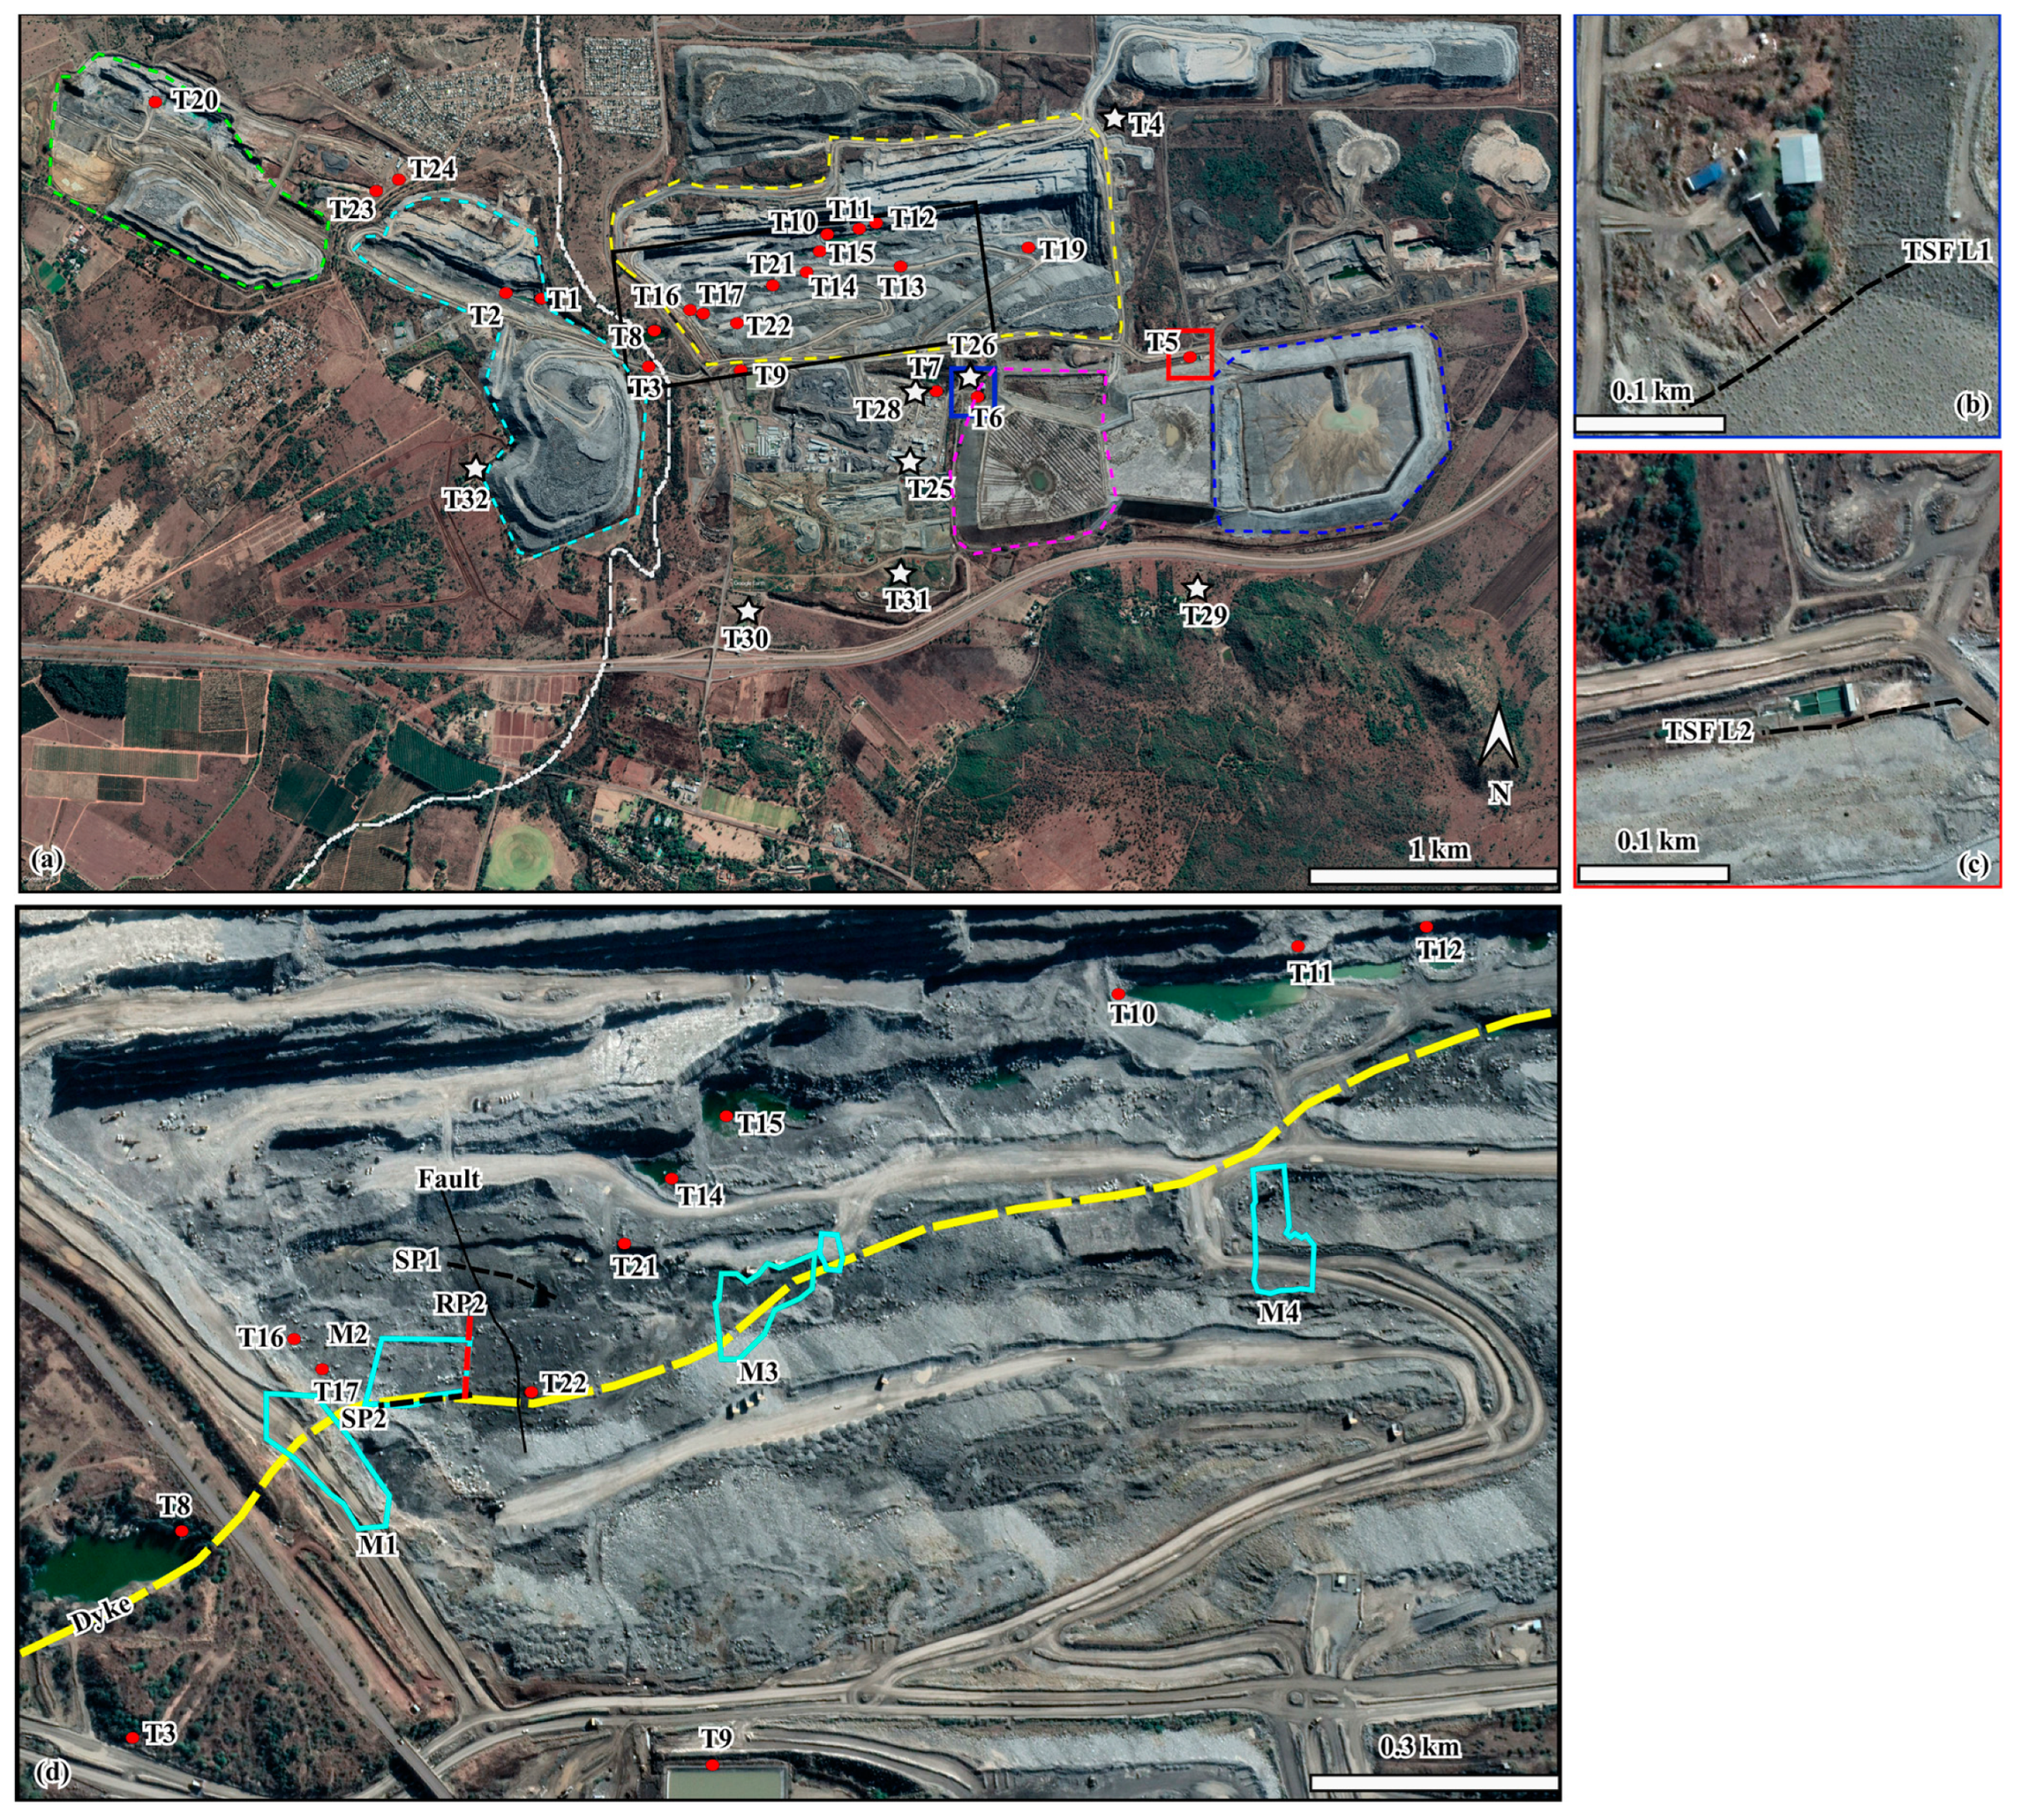
Each subsurface material displays a characteristic magnetic signature [61]. Metal materials within the substrate contain an induced field of force superimposed on the Earth’s magnetic field at that location, creating a magnetic anomaly [62]. The location of these magnetic anomalies allows for the analysis of regional geological trends or mineralization (e.g., may indicate the presence of dykes) [63]. This also allows for delineating subsurface features such as faults or intrusive features. Figure 5 demonstrates the location of the respective geophysical profiles used in this study at the sampling points.

3. Results

3.1. Hydrogeological Results

Table 2 summarizes the physicochemical and isotope results. The overall pH of the mine water lay within the suitable range for healthy water: 6.5–8.5 [64]. However, this may be subject to change due to chemicals associated with human waste and mining activities.
Total dissolved solids (TDS) and electrical conductivity (EC) are two parameters that are closely related; both are indicators of salinity. Natural water has a TDS value ranging from ~0.1 to ~528,000 mg∙L−1 and EC values of 500 to 3000 µS∙cm−1 [65]. The average TDS value and EC measured in the mine site were 785.4 mg∙L−1 and 1225.1 µS∙cm−1, respectively. This suggests the majority of mine samples were saline.
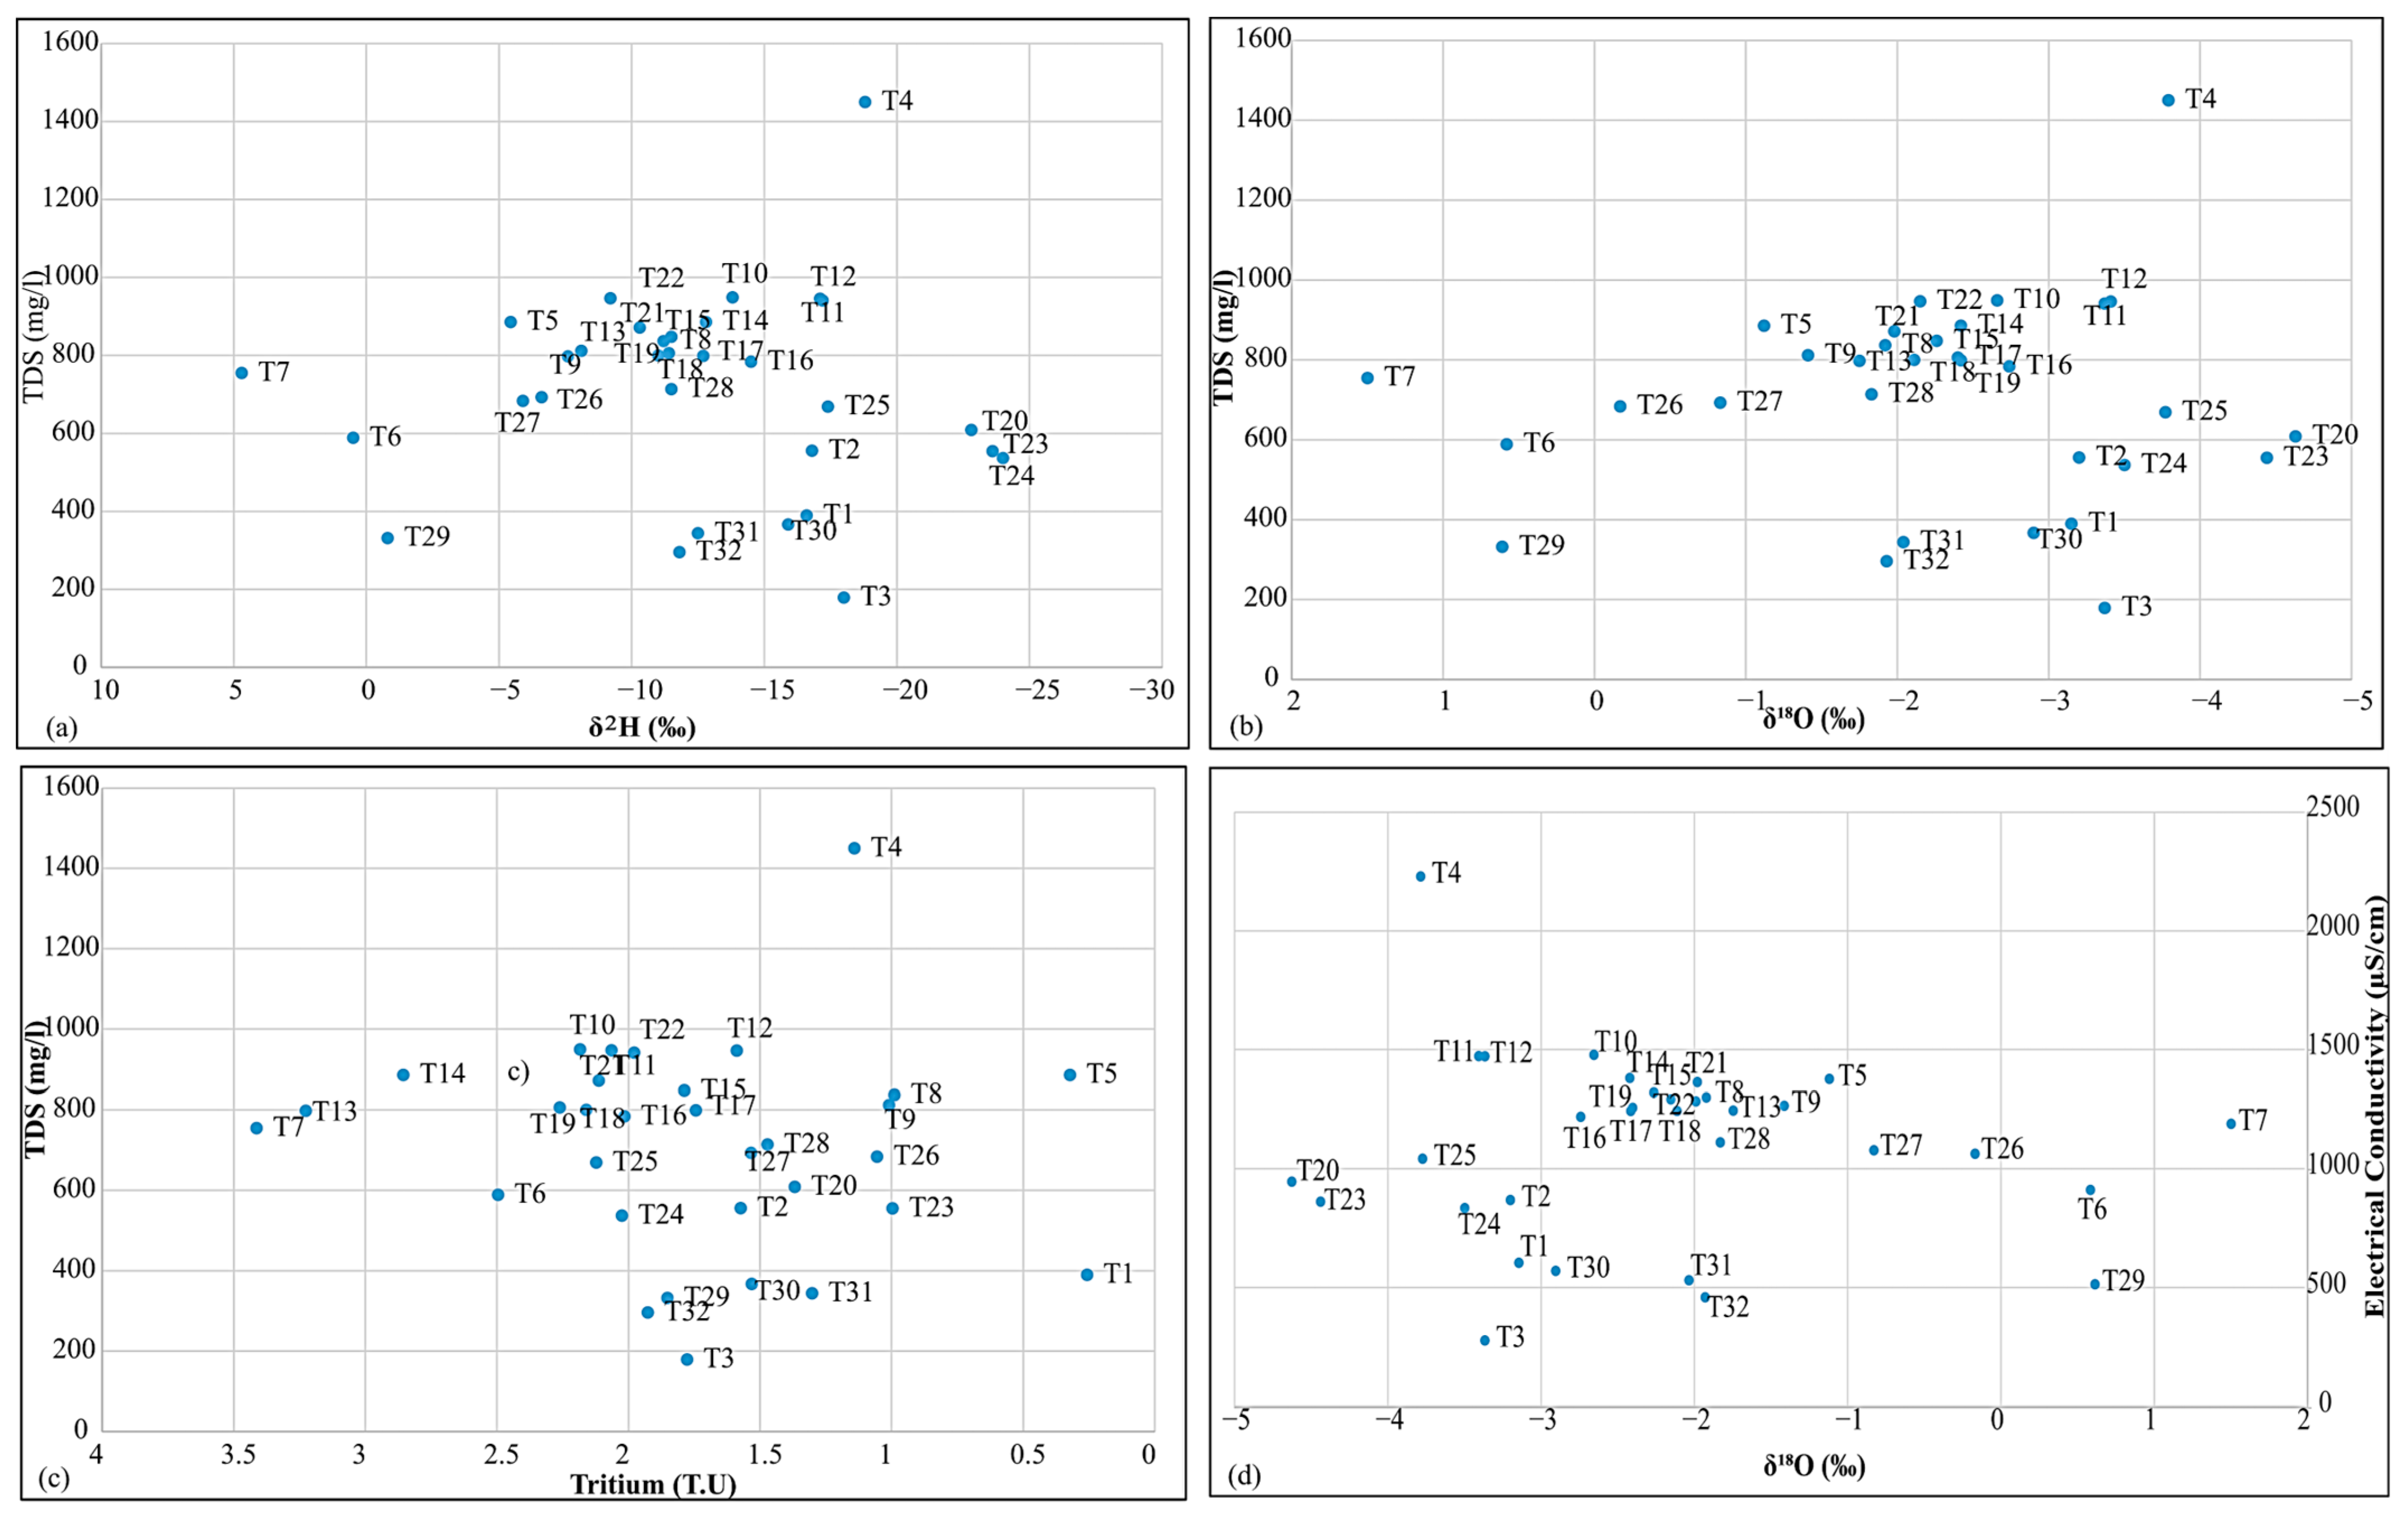
There was evidence of mixing in certain samples, as shown in Figure 6a–c, which shows decreasing 18O, 2H, and tritium with increasing salinity (TDS). Salinity may result from mixing fresh water that has been isotopically enhanced with water depleted of isotopes, which has a greater salinity [66]. This indicates that most of these liquids were likely connate waters mixing with meteoric water from the contemporary hydrological cycle. In addition to mixing, the dispersion of the points on the plots of TDS vs. 18O, 2H, and tritium (Figure 6a–c) may also indicate that the samples were affected by water–rock interaction processes such as leaching, dissolution, and precipitation, to mention a few [66].
The plot of δ18O vs. EC (Figure 6d) was used to establish the degree of mineralization, i.e., whether the salinization was due to evaporation (high EC), causing enriched δ18O. Due to evaporation, the heavy isotopes are enriched in surface waters. Low EC values may depend on the recharging rainfall (e.g., T3). Due to variations in seasonal recharge, high EC water contains a depleted δ18O value (e.g., T4). As the depth of the water table increases, limited external processes affect the isotope signature. Only water–rock interaction via fractures/migration pathways affect water at depth and therefore display a high EC value (possibly due to mixing). Groundwater undergoing evaporation positively correlates with δ18O and conductivity (e.g., T6, T7, and T29).
In the diagram of δ18O vs. EC (Figure 6d), it can be observed that a negative correlation was obtained with R2 = 0.005; furthermore, in most samples, an increase in electrical conductivity (EC) values took place without a significant change in isotopic composition, which may be due to mineralization. Few of the groundwater samples and all the surface water samples showed an enrichment of the heavier isotopes without a simultaneous increase in EC; this confirms that some of the groundwater was recharged by evaporated (isotopically enriched) water on the surface or in the unsaturated zone.
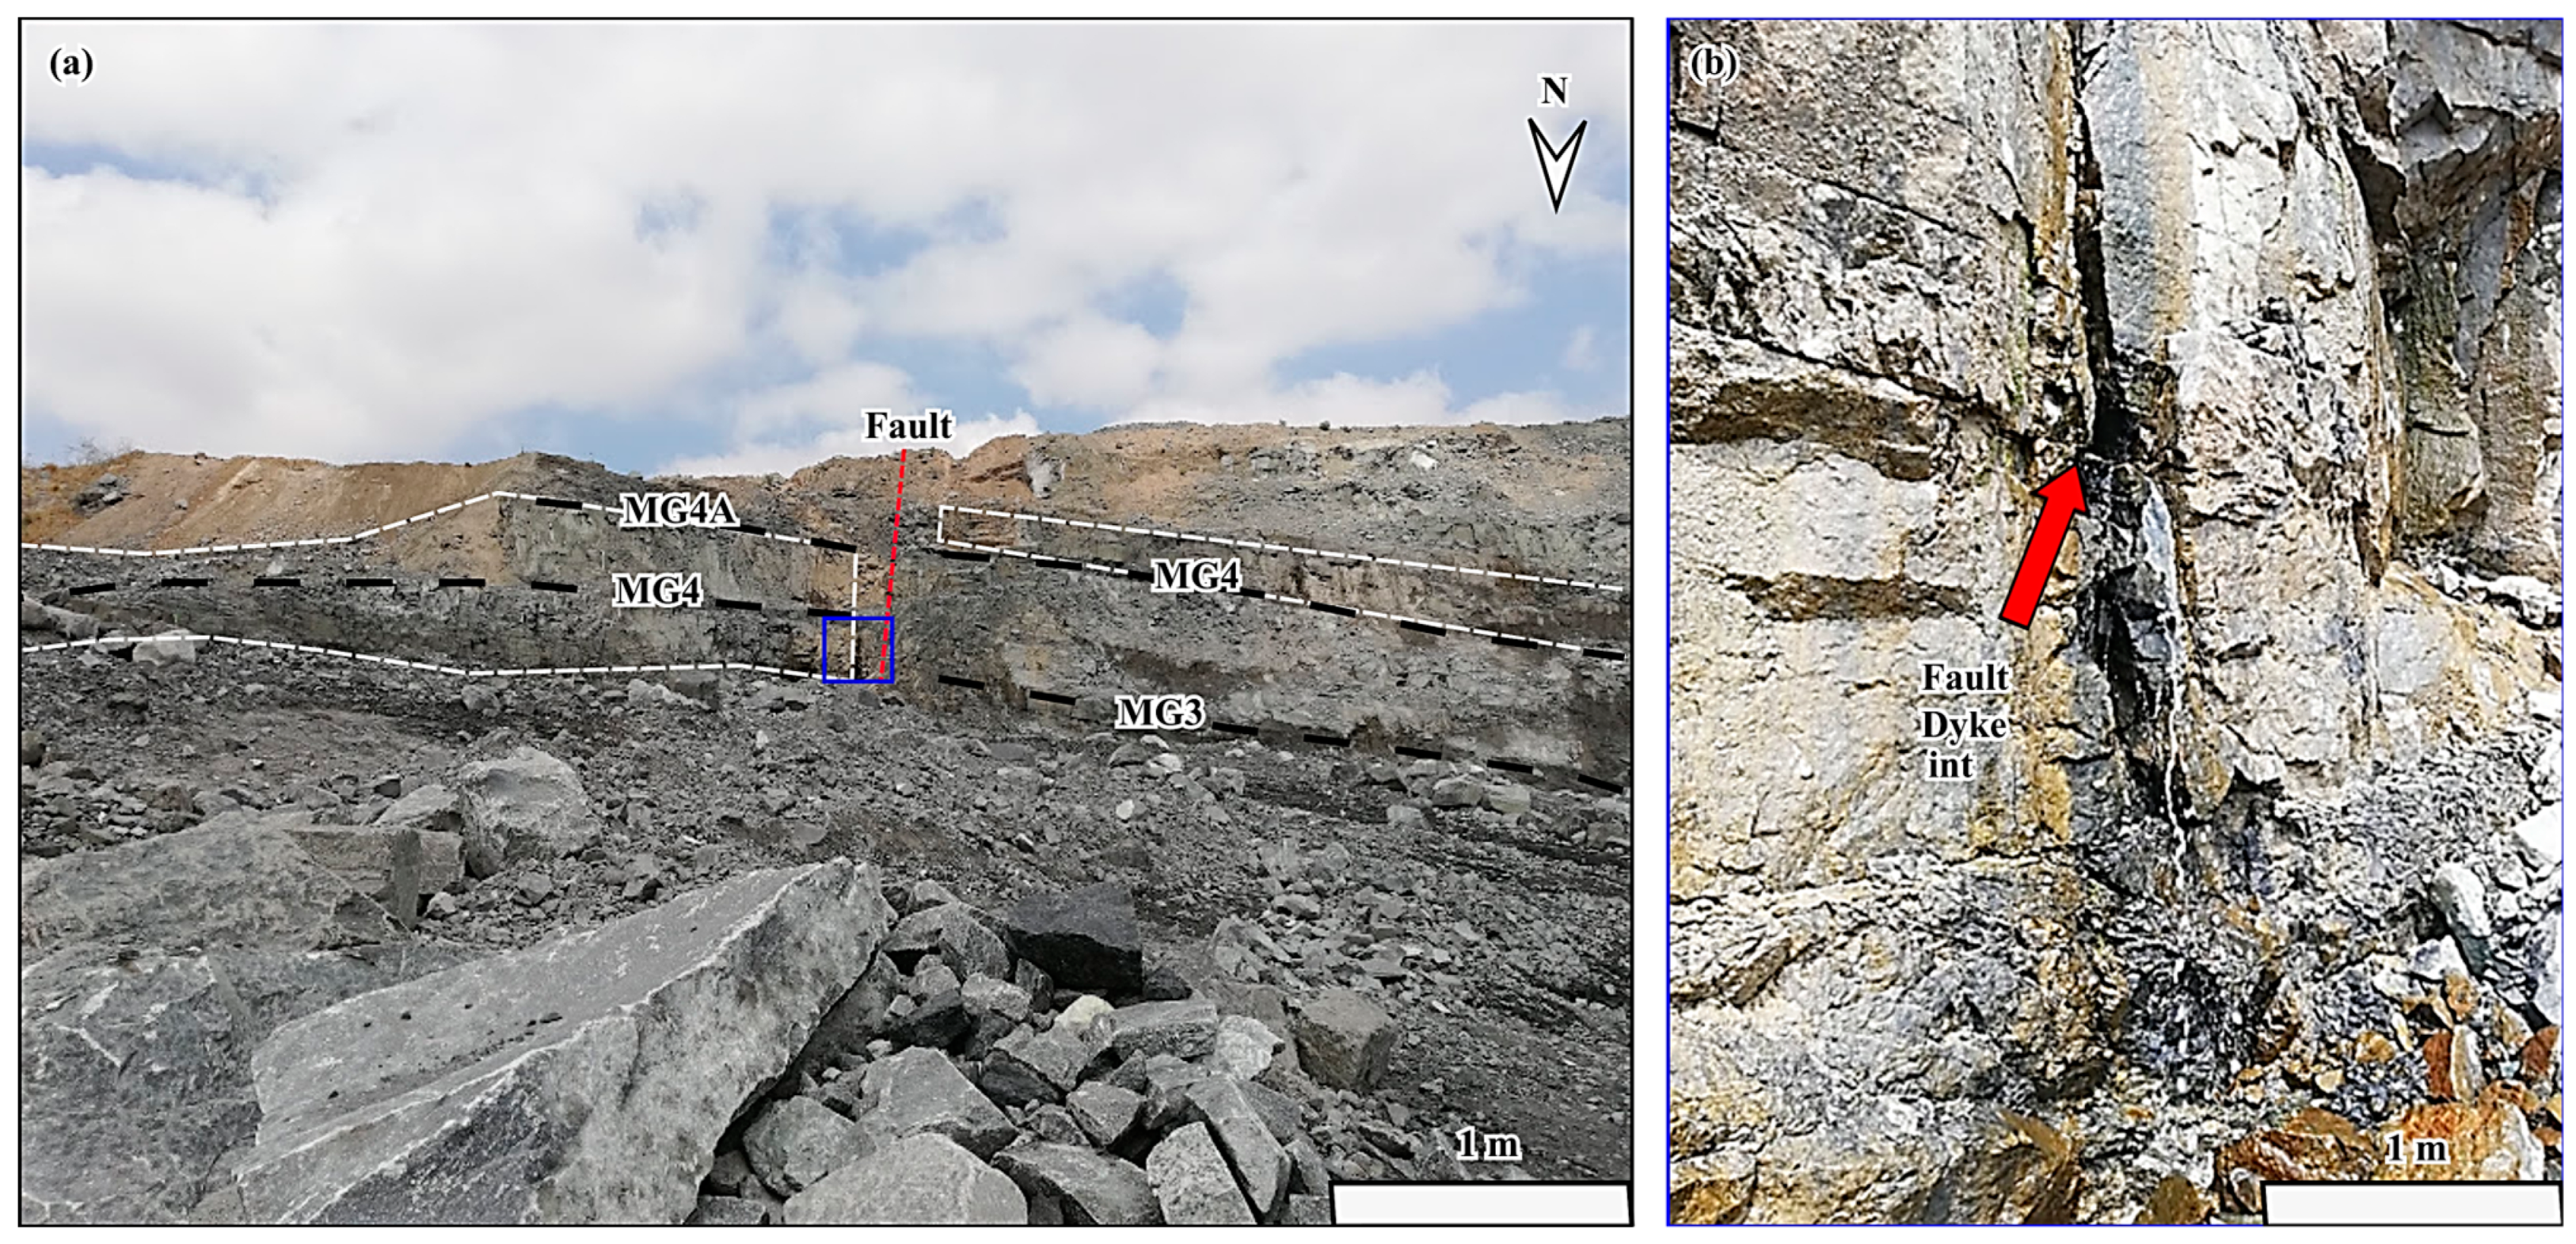
This indicates the possibility of repumping, as the water is observed in the pit. The water is pumped via pumps used for dewatering and enters the river. The fault and dyke that run through the pit may bring the water back into the pit. This may be further justified by the high flow rate (~1 L/min) observed at the interaction point of the dyke and fault along the northern East Pit face (T22, Figure 7). A high flow rate is concerning/unlikely in an arid area with a mean annual rainfall of ~680 mm/year, which cannot recharge an area with such a rate. The suggested reasoning is thus that water is being repumped back into the subsurface. The river water sample (T3), on the other hand, was different from that from the mine. Evidence for this is shown at point T3 in Figure 6d; it displayed a depleted EC and δ18O. This suggests that the water sampled was rainwater (as it was more enriched in lighter/depleted isotopes).
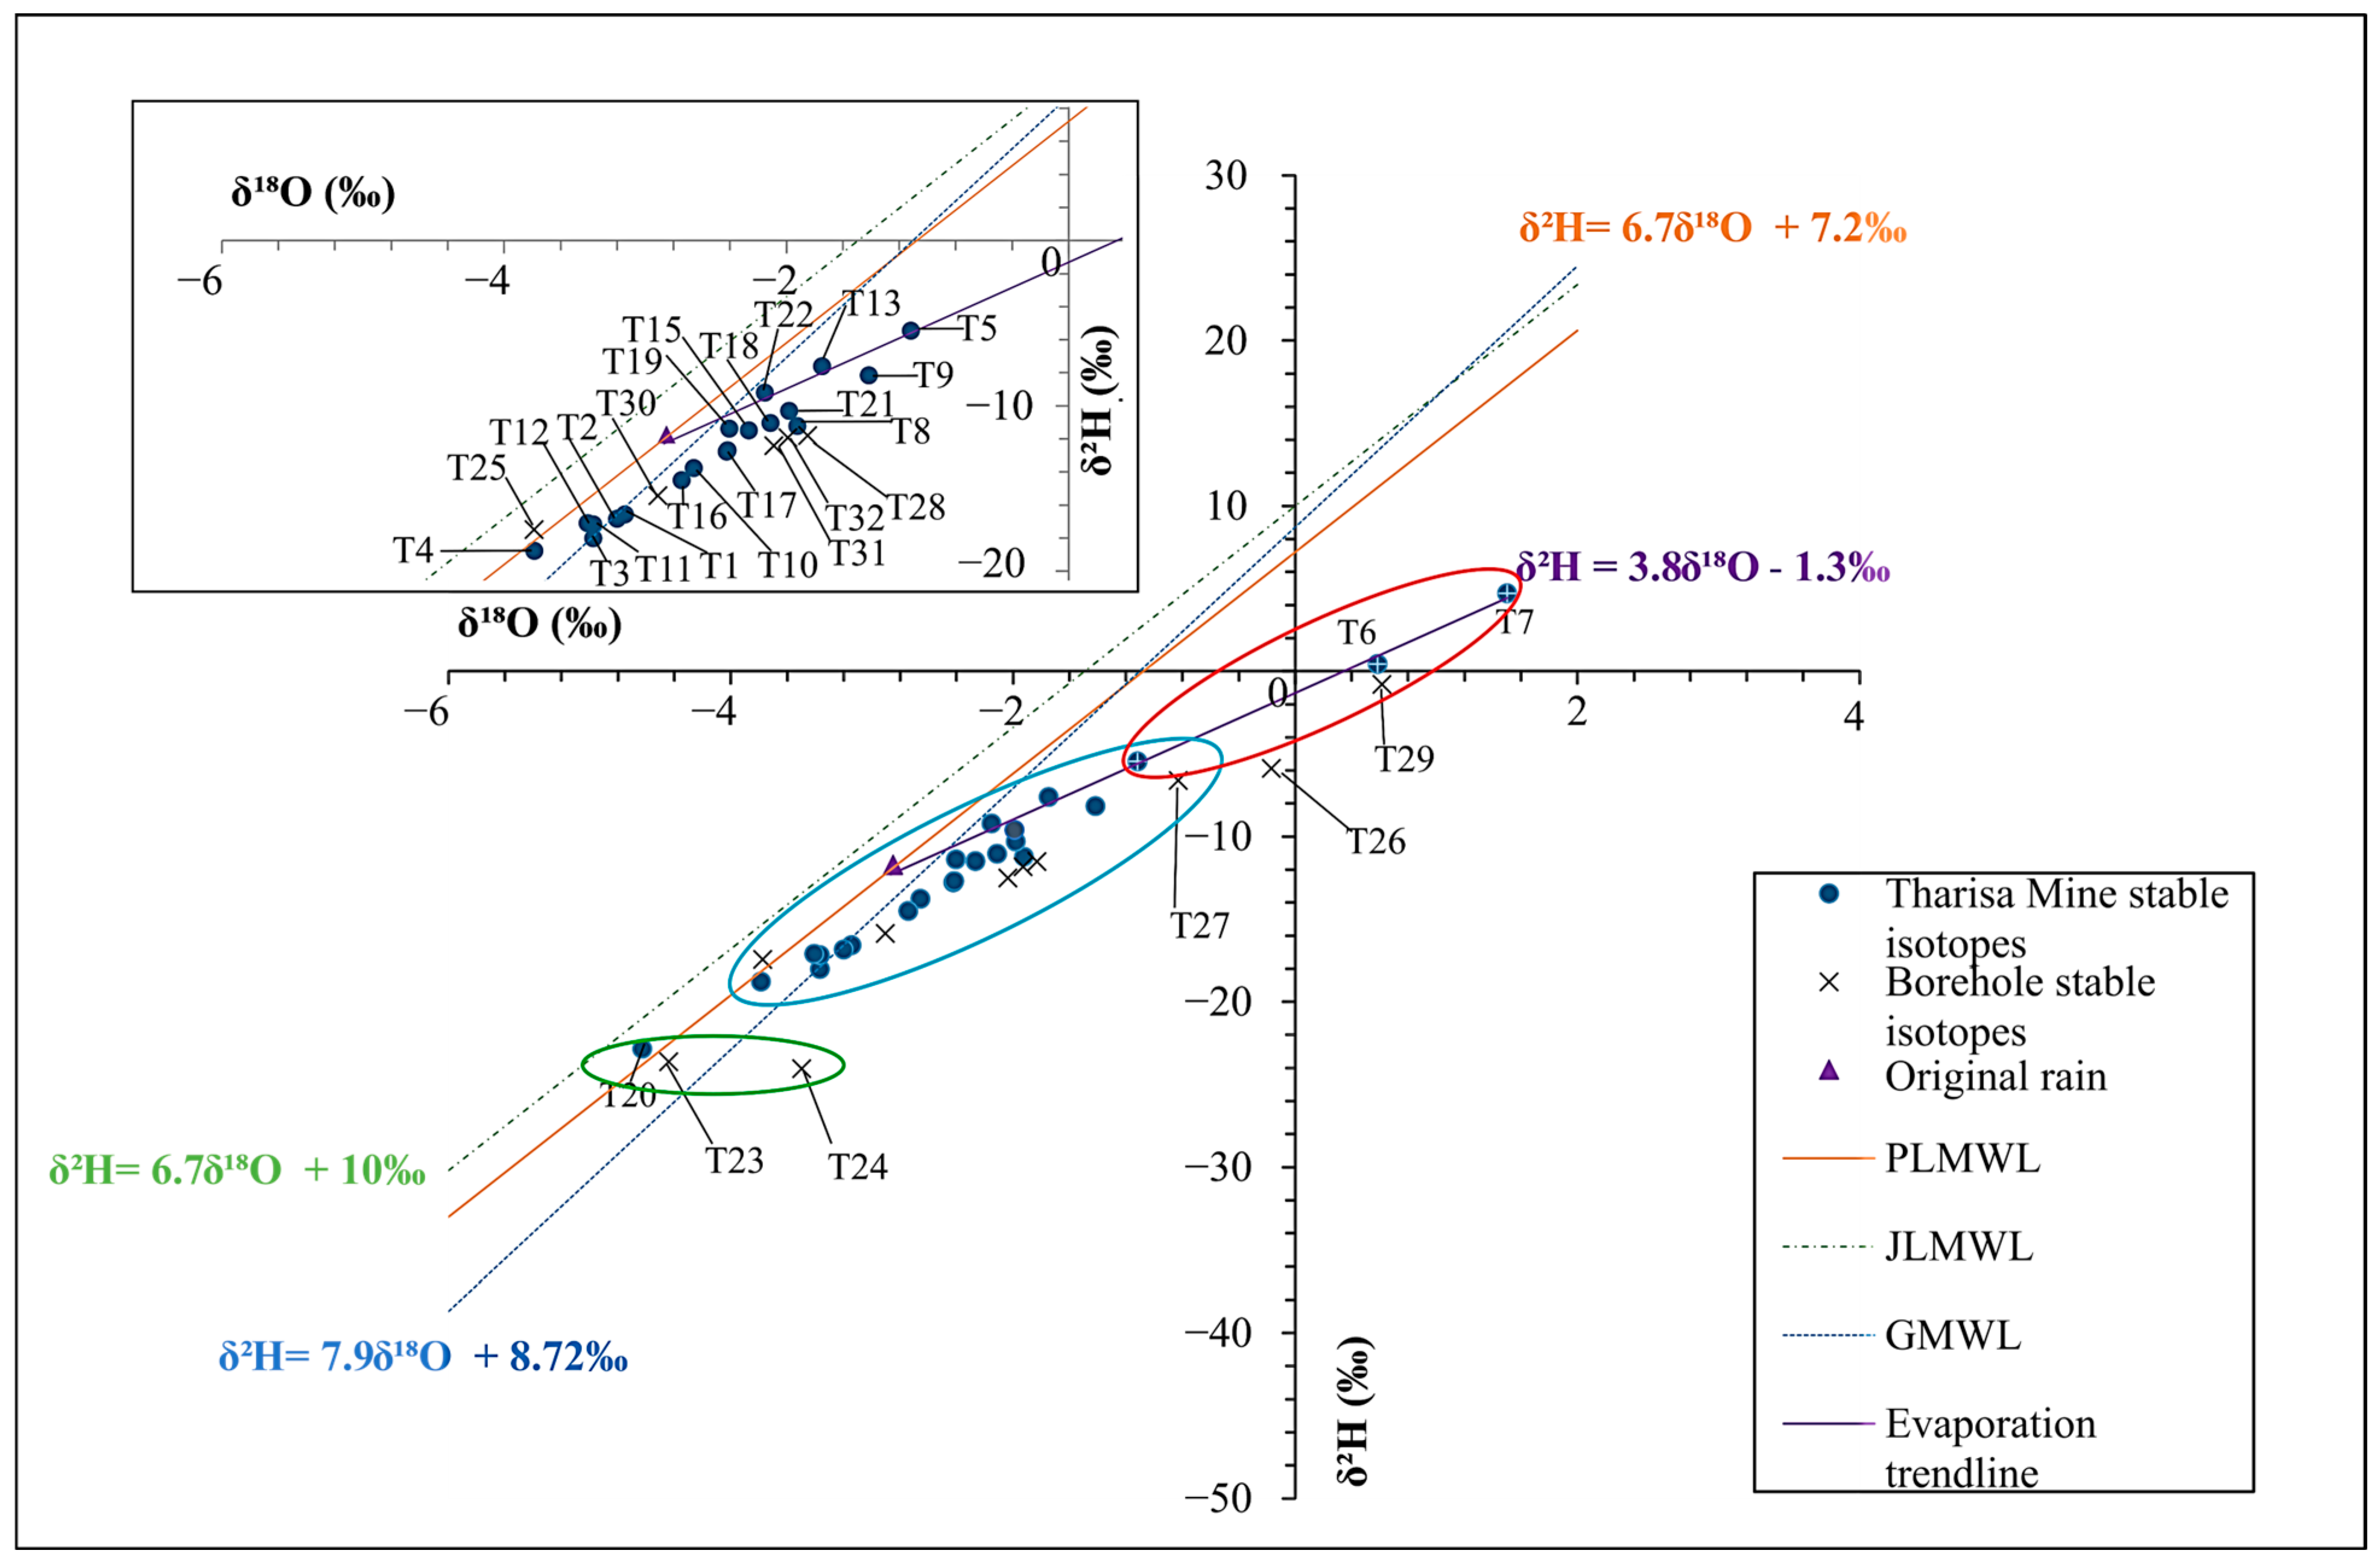
Multiple source interpretations are shown in the stable isotope map (Figure 8). Environmental stable isotope measurements for 2H ranged from the most depleted value of −24‰ in a borehole that draws water from a deeper aquifer to 4.7‰ in surface water from a tailings dam, while values for 18O ranged from −4.63‰ to 1.5‰. Surface water and seepage water are shown on a plot of the data against the Pretoria Local Meteoric Water Line (PLMWL), which also reveals a substantially enriched isotopic signal brought on by fractionation during evaporation. The shallow waters were more enriched than the deeper waters and may indicate a substantial mixture of surface waters with recent recharge infiltrating into relatively deep water systems in addition to possible water recycling. Isotopically depleted waters signified the third type of water, hence deeper water systems. However, borehole T20 (Far West Pit borehole) was particularly depleted isotopically, suggesting a different flow/aquifer system. There was also evidence of mixing in the tailings dam (e.g., T5 from TSF 2), and, consequently, tailings dam seepage, as a tailings sample (T6 from TSF 1) had a similar isotope signature to Monitoring Borehole T29 (TMGW COMM 02). Clustering the stable isotope data revealed a similarity in the water source that may not have occurred simultaneously.
Generally, the 3H results (Figure 9) supported recent water recharge or an active zone of shallow groundwater and surface water mixing. The mine water samples’ higher tritium levels compared to rainwater and lower 18O and 2H values than the corresponding data from shallow boreholes could be explained by the fact that the mine water contains a significant amount of deep circulating groundwater that is drawn from a larger hydrogeological basin and mixes with recharging rainwater. A suggestion of active mixing was not anticipated as mining activity dynamically adds substantial recharge to the local aquifer. However, the highly depleted stable isotope sample (T20) exhibited an elevated 3H level, alluding to a recent recharge from a depleted moisture (rainfall) source but a geographically isolated area of influence. This was similarly seen for samples T4 (Samancor Borehole), T24 (TMGWFW BH 24), and T26 (TMGW Dissipater 1).
Given that most of the baseflow samples (groundwater) were collected near the water table or at the bottom of the pits, the water was anticipated to show the same depleted stable isotope and 3H values as deep groundwater. As a result, the stable isotope data demonstrated and validated the existence of a short-cycle circulation zone or active surface water mixing (circled in red). It should be noted that samples grouped based on 18O and 2H but differing 3H values suggest that comparable properties were recharged at separate periods (years), even though the samples came from the same source. The difference between stable and radiogenic isotopes may be caused by mixing.
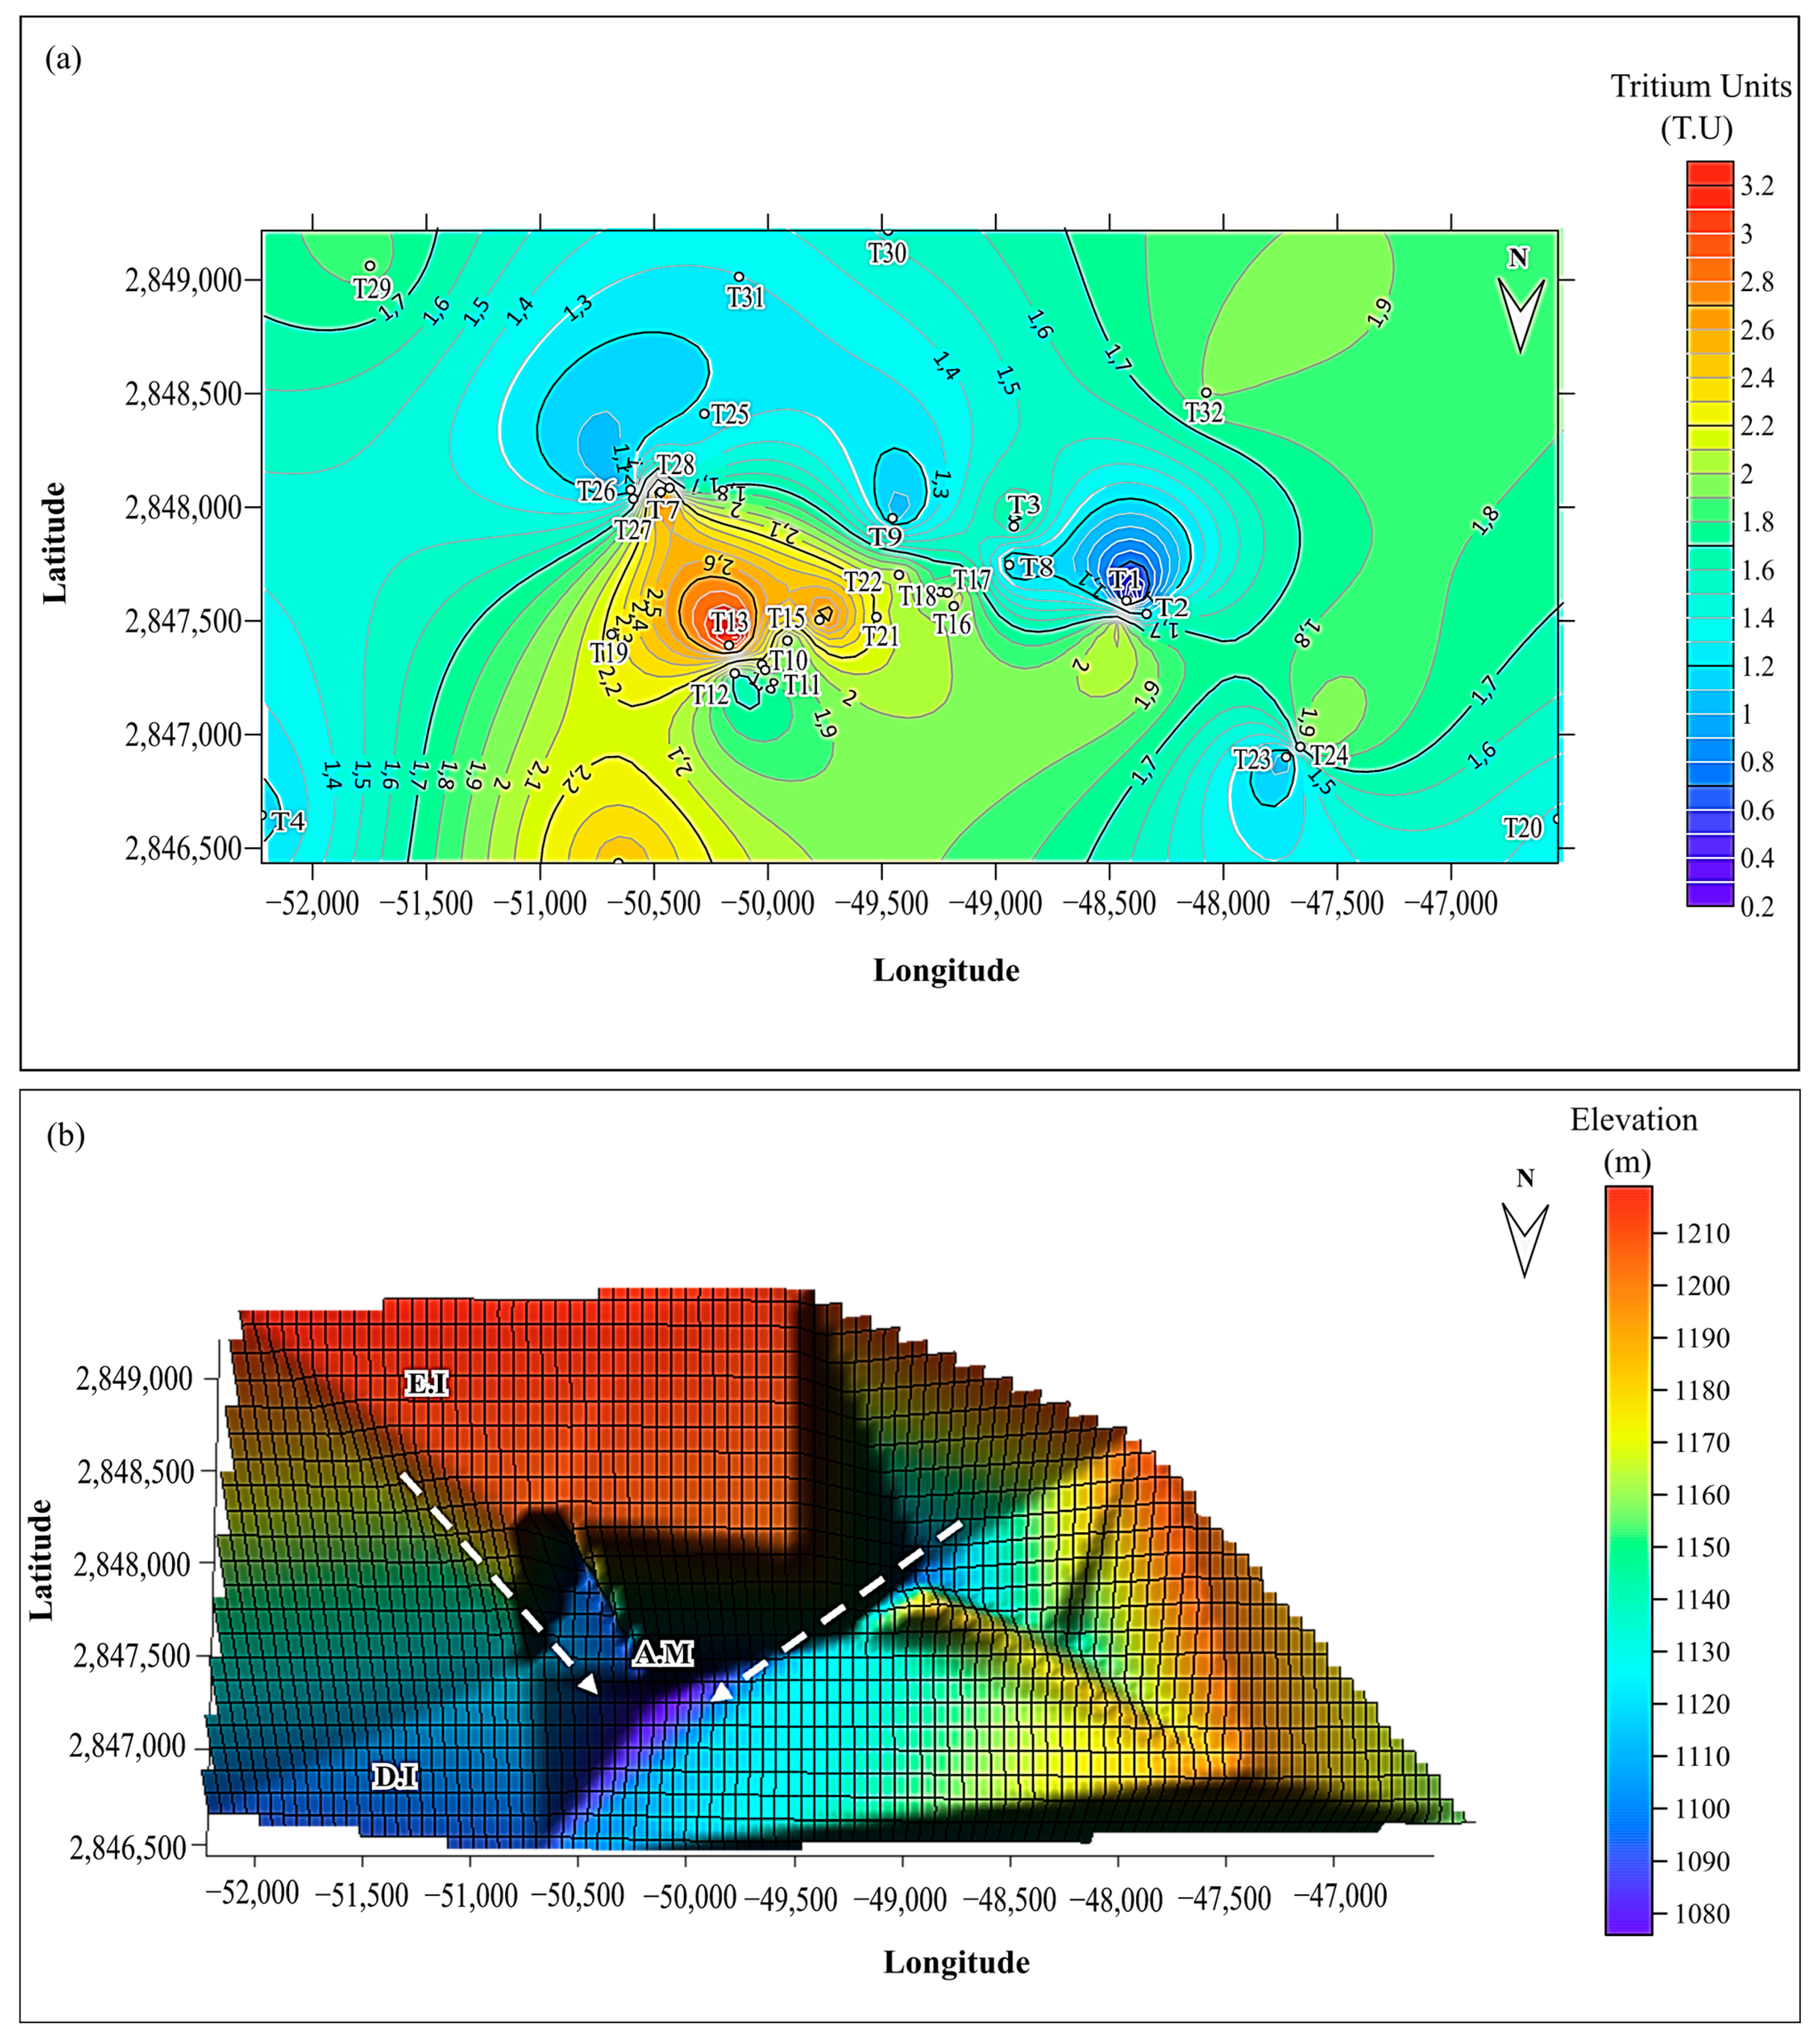
Generally, samples with a lower T.U content are older deep circulating waters, whereas samples with a higher T.U content are younger and shallower waters. From the tritium data (Figure 9), it was evident that there was a mixing of deep circulating water with young surface water. Most of the groundwater samples collected displayed characteristics of this mixing signature. Young surface waters may also have rainwater mixing, accounting for the relatively recent recharge. Figure 10a illustrates a surface contour map joining areas of equal tritium value and, therefore, showing a similar recharge period. When these values were plotted as a function of elevation (Figure 10b), it was noted that higher elevation areas displayed more enriched isotope signatures than lower elevation areas. An active mixing surface was also apparent along the descent from higher to lower elevations.
Equation (1) [49] states that when mixing happens in isotopically different water, the process proceeds according to isotopic proportion:
δ s a m p l e = X δ A + ( 1 X ) δ B
where X represents the sample’s specific mixing fraction from end members A and B. This suggests that the isotopic signature may adjust per the proportionate mixing when A and B combine in the aquifer. Regarding seepages (interflow), we may consider the mixing proportion of T22, where the seepage occurs through a fault/dyke fracture zone in the East Pit. T22 displayed mixing of T2 (West Pit) and T21 (East Pit). T22 comprised 13% of T2 and 87% of T21; this further suggests the possible recycling of water throughout the mine and via lineaments. Similarly, T5 (TSF 2) displayed the mixing of T7 and the original rain signature calculated from Figure 6. T5 comprised 62% of the original rain and 38% of T7.
The mixing may further be attributed to diffuse recharge in the high elevation undergoing deep circulation through tectonically induced fractures. Increased water–rock interaction makes the water more depleted. When this depleted water mixes with surface water (enriched due to evaporation), it signifies an intermediate isotope value between the two sources. This further implies the possibility of recycling along lineaments such as fractures or faults (Figure 10b).

3.2. Geophysical Results

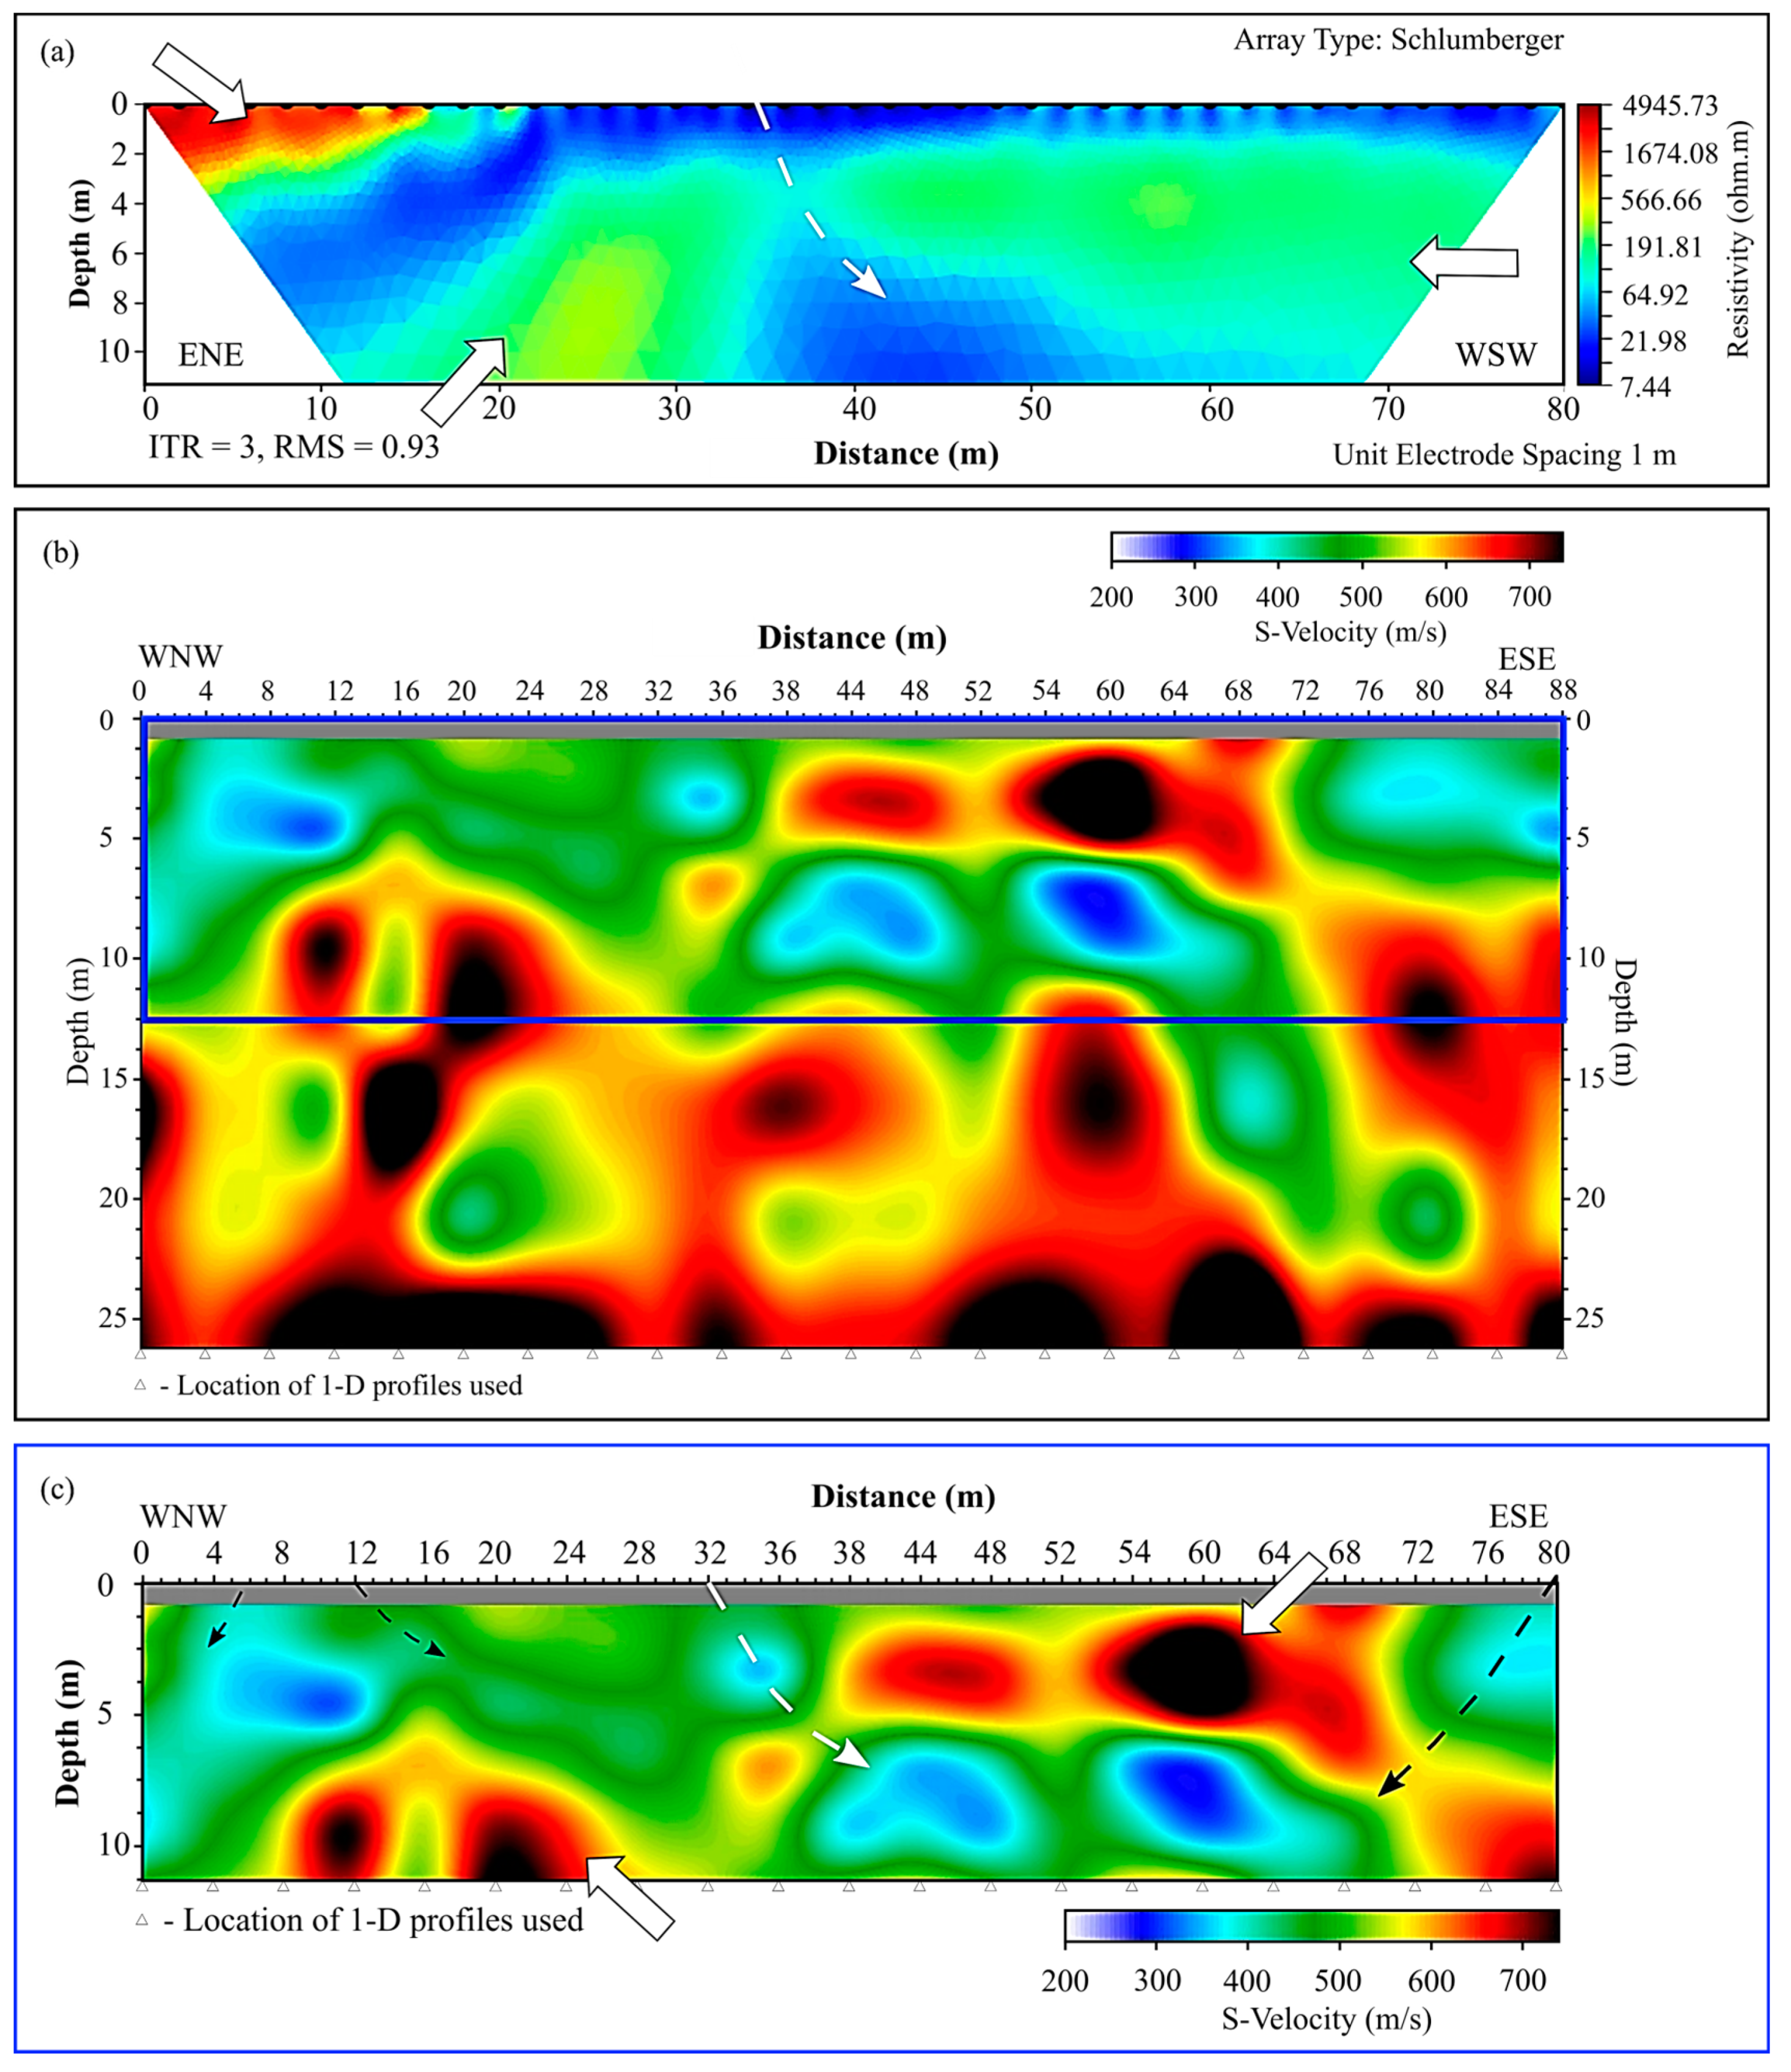
Along Tailings Storage Facility Line 1 (TSF L1; Figure 5b), the ERT line (Figure 11a) displays a high resistivity zone (of ~168–447 ohm.m) that extends from the surface to a depth of approximately 6 m and laterally from 0 to ~40 m; this zone is indicated by a solid white arrow in Figure 11a. This high-resistivity zone, and most of the resistivity section, is characterized by low-resistivity zones (low-irregularity zones), indicated by white dashed arrows. These irregular zones are considered fracture zones that connect surface water with deeper water and may be classified as fractures or lineaments displaying active mixing. These lineaments are further apparent in the MASW line in Figure 11b,c (indicated by dashed white arrows in Figure 11b) and correspond to a shear wave velocity zone(s) < 500 m/s extending from the surface to a depth of 12 m. Further, the lineaments that connect the surface to depth may represent evidence of possible water recycling along lineaments.
Along Tailings Storage Facility Line 2 (TSF L2; Figure 5c), the ERT (Figure 12a) and MASW (Figure 12b) survey results reveal the presence of a low-resistivity zone (21–64 ohm.m) and shear wave velocity zone (< 1000 m/s), interpreted as the upper weathered zone, extending from the surface to a depth of about 25 m. At various depths in the profile, discontinuous (probably fractured) high-resistivity (~191 ohm.m) and -shear-wave-velocity (~700 m/s) zones were observed and interpreted as less weathered zones within the upper weathered zone. Further, a lineament (indicated in Figure 12a,b as a dashed white arrow) of ~21 ohm.m and ~400 m/s connects the upper and lower weathered zones. It was interpreted as a possible fracture zone (allowing deep infiltration). Low-resistivity and low-shear-wave-velocity fractured and weathered zones (indicated by black dashed arrows in Figure 12b) may permit surface water migration to a greater depth within the subsurface. The evidence of surface waters mixing with deep water is thus depicted in Figure 12.
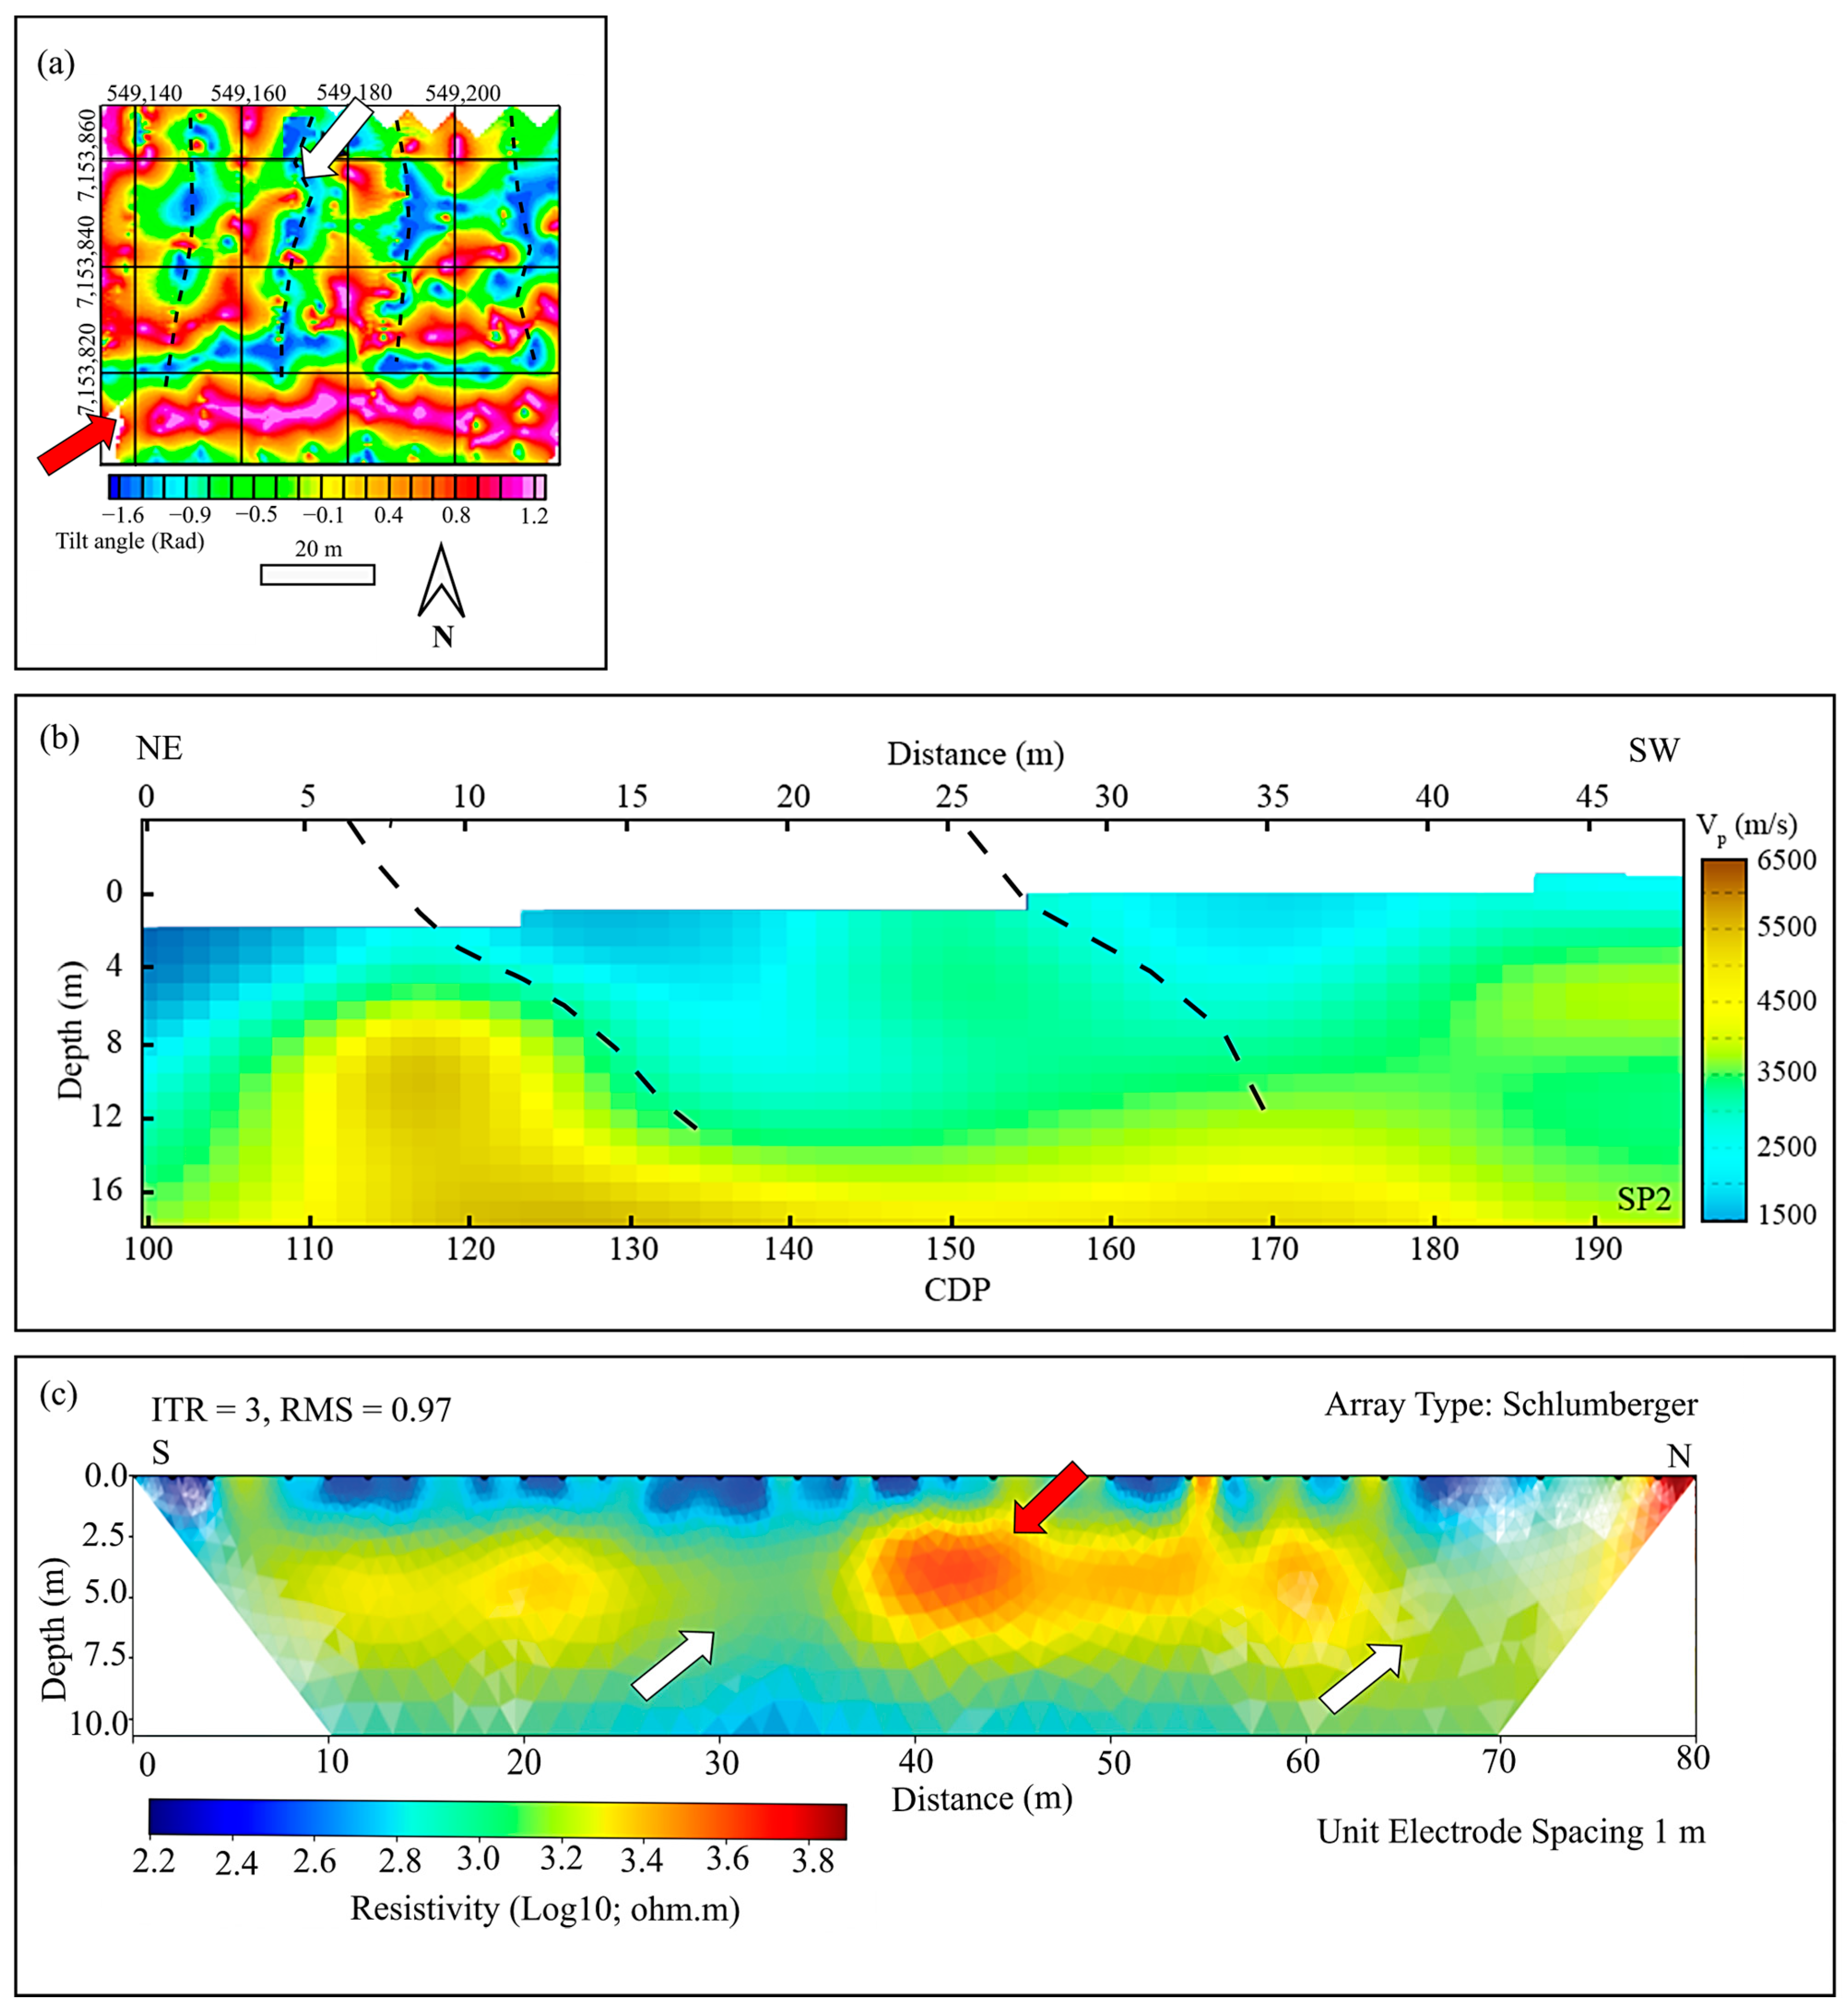
From the total magnetic intensity (TMI) magnetic grids (Figure 5d; M1, M2, M3, and M4), a vertical tilt angle was applied to enhance lineaments in the East Pit (Figure 13). On grid M2 (Figure 13b), a strong positive anomaly occurred on the southern edge and was characterized as a dyke. This anomaly is again delineated in Figure 13a,c and can be mapped as an E–W trending feature. This anomaly was correlated with the dyke in the East Pit (Figure 5d) as they followed the same trend. The negative magnetic anomalies may be linked to possible lineaments such as fracture zones. This was not unexpected as there is an enhancement of the dyke edges (high magnetic signature) associated with low magnetic signatures, possibly related to fracturing. The negative magnetic signatures attributed to fracturing are delineated in Figure 13 as black dashes.
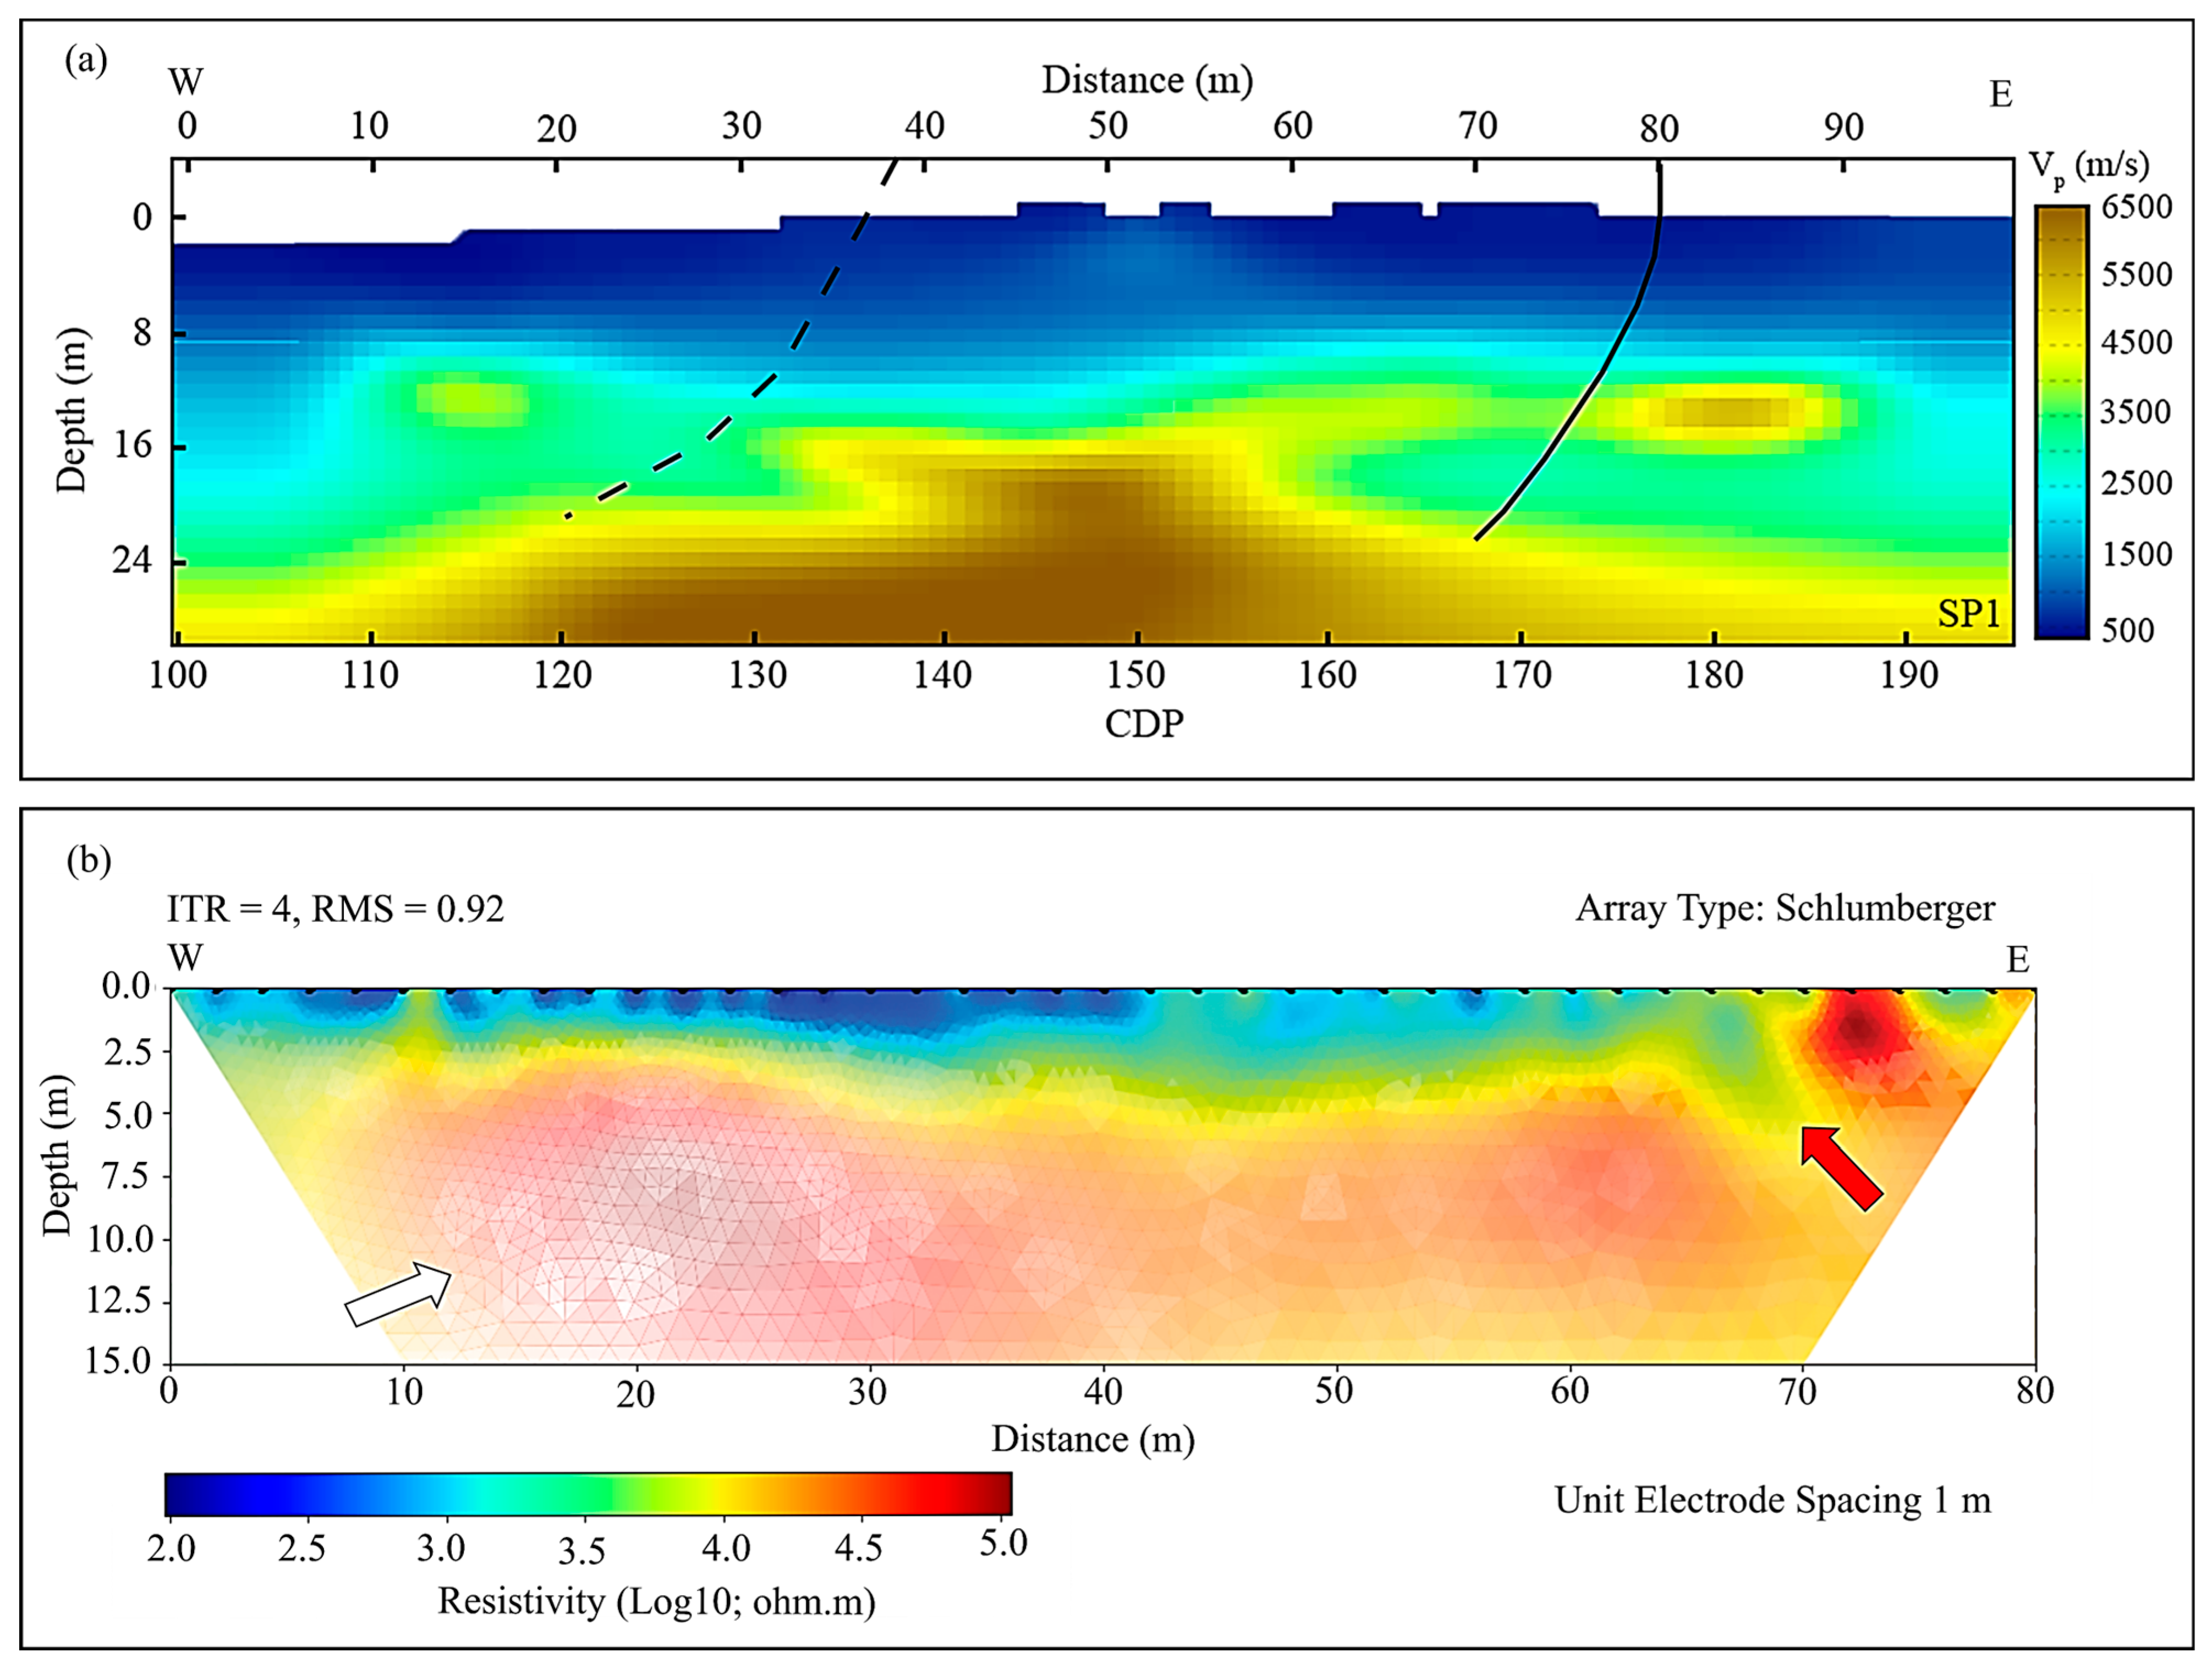
Seismic Profile 1 (SP1; Figure 5d) shows a disturbance at 30–40 m on the tomographic section along a reflector and is associated with depression in P-wave velocity (represented by a black dashed line in Figure 14a). This discontinuity is associated with the mapped fault within the East Pit (Figure 5d). This is further correlated with the resistivity discontinuity in Resistivity Profile 1 (RP1), interpreted as the slight decrease in resistivity at around 40–50 m into the profile (Figure 14b). RP1 (Figure 5d) is a W to E trending line and further intersects the mapped fault. An interpreted fault was further apparent in SP1.
Resistivity values between 89 and 213 ohm.m and P-wave velocities between 500 and 1300 m/s on SP1 (Figure 14a) describe the dark-blue to light-green zones on RP1 (Figure 14b). This area, thought to represent the top layer of highly fractured norite, may have been caused by blasting in the pit. Subsurface rocks exhibit an increase in resistivity and P-wave velocity with depth. A transitional region of intermediate resistance (light green to yellow: 213–3274 ohm.m.) is then present, along with P-wave velocities of 1300–2100 m/s. A zone of much greater resistivities (between 3274 and 20,000 ohm.m.) lies under the intermediate-resistivity zone; this zone appears as orange to red and may represent fresh bedrock. The Schlumberger model shows conductive layers (low-resistivity, blue-colored zone) with a thickness between 2.5 and 14 m across the profiles.
The electrical resistivity and seismic velocity models showed inhomogeneous horizons with sudden resistivity changes that may be attributed to fracturing.
Seismic Profile 2 (SP2) was conducted on top of the dyke (Figure 5d), with the dyke covered by a highly fractured rock from mine workings (Figure 15b). The highly fractured rock’s thickness increases towards the profile’s center and creates a syncline structure that might result from the fault zone on the eastern part of the profile (indicated by a black dashed line in Figure 15b). This was evident on SP2, as it showed low-velocity regions towards the southwestern side of the profile at varying depths (Figure 15b). Multiple discontinuities were further noted in the profile and may have resulted from fracturing along the dyke edges. This fracturing along the dyke was further apparent on the southern edge of Magnetic Grid 2 (Figure 15a) and Resistivity Profile 2 (RP2; Figure 5d and Figure 15c). RP2 has an S–N trend and was surveyed across the dyke to characterize the association with the dyke. Resistivity values over the dyke ranged from 3000 to ~4000 ohm.m. A notable discontinuity was observed at a distance of 25–36 m with resistivity values between 120 and 3900 ohm.m (Figure 15c). The average thickness of the dyke at the profile was 25 m, and the anomaly had a thickness of ~8 m. The discrepancy in thickness might be due to the edges of the dyke being fractured due to differential weathering of the host rock at the contacts with the dyke (Figure 15a; represented as black dashed lines). Such areas have potential for hosting groundwater and are supported by the Schlumberger results as they exhibit low-resistivity zones (Figure 15c at 30–40 m).

4. Discussion

Based on the preliminary data presented, the weathered overburden has a very varied thickness ranging from 3 m to 25 m. The fine- to coarse-grained sandy soil that makes up this differentially weathered overburden in the area of Tharisa was created by the in situ breakdown of the underlying norites, anorthosites, and pyroxenites. Norites, anorthosites, and pyroxenites that are fractured and underlie the weathered aquifer are all parts of a deeper, unweathered, semi-confined bedrock aquifer. Open fracture systems that are linked to one another determine the material’s effective permeability. However, these fracture structures may occasionally enable fast vertical groundwater flow from weathered overburden and surface water bodies to deeper levels of the fractured aquifer. While, generally speaking, there is limited connectivity between the lower fractured aquifer and the weathered aquifer, this is not the case for Tharisa Mine.
The geophysical data and 18O and 2H isotope groundwater data from the Tharisa Mine were combined to comprehend the recharge sources, processes, and isotopic variability. The findings show that the levels of 18O and 2H in the groundwater at the time of sampling did not always match the overall isotopic composition of the recharging water in the mine. Due to evaporation and mixing, the replenishing groundwater significantly altered the values of 18O and 2H. Through evaporation and mixing with the surface impoundments, the indirect recharge and recycling from surface water that predominates changes the composition of the 18O and 2H.
The mixing tendency is further supported by the observed alignment of the isotopic data along the meteoric water line. The very closely clustered data suggest the likelihood of a comparable source and homogeneous water mixing. These aquifers have a narrow range of maximum and lowest values. However, a large gap may indicate climatic control over recharging, fluctuation in the source of the recharge, and a reduced possibility of mixing. In addition, stable isotope data (2H and 18O) and tritium data show that a large amount of the mine water comprises relatively ancient (low 3H value) and deep circulating water (low 18O) in addition to relatively young (high 3H value) and shallow circulating water (high 18O). According to stable isotope data, the groundwater recharge to the region’s bedrock aquifers may further be attributable to both diffuse and concentrated recharge mechanisms.
According to the study, the direct recharge in the high-elevation regions experiencing deep circulation through tectonically produced fractures may have been responsible for the depletion in some samples. Low-salinity fluids exist inside the aquifer system that contains depleted 18O because rapid infiltration through fractures may lead to a low degree of water–rock interaction. Characterizing potential fracture systems in the mine was made attainable by Figure 14 and Figure 15. Furthermore, samples T16, T17, and T22 (Figure 8 and Figure 9), gathered in Figure 14 and Figure 15, showed the isotope signatures of an active mixing zone, supporting the likelihood of mixing and rapid infiltration along these structures.
According to the study, diffuse recharging in high-elevation locations experiencing deep circulation through tectonically produced fractures may also be responsible for the mixing. An intermediate isotope value is produced when the depleted water combines with surface water, enhanced by evaporation. This also suggests that mixing might occur along lineaments such as faults or fractures. Figure 12 clearly shows this indication of mixing. T5, taken at TSF 2, shown in Figure 12, showed a mixing signature of depleted and enriched water (Figure 8 and Figure 9), which accounts for potential mixing along the joint/fracture zones indicated.
According to the geophysical findings, the source of the dominating groundwater circulation is located about 20 m away from the possible recharge zone, close to the surface (Figure 11 and Figure 12). A fairly recent and shallow-moving locally recharged water component combines with an older groundwater component that is slower moving (depleted in 18O and low in 3H) within the weathered crystalline aquifer. This further suggests the likelihood of an active groundwater and surface water mixing zone. Mixing shallow and deep water from different mine regions may be possible due to these fractures acting as groundwater conduits. Additionally, the permeability and porosity of the aquifer may rise due to the junction of many lineaments, enabling enhanced fluid movement due to higher hydraulic conductivity [67]. Groundwater migrates via linked conductive zones and through interconnected fracture systems, with the potential for fast vertical groundwater flow from weathered overburden (and surface water bodies) to increased depths [67,68]. Along the lines of SP1, SP1, RP1, and RP2, there are intersections of various lineaments (Figure 14 and Figure 15).
The hydrogeological and geophysical studies for TSF 1 show the potential for tailings dam seepages, another noteworthy finding. Monitoring Borehole T29 may have leaked into TSF 1 sample T6 (sampled along the line shown in Figure 11; see Figure 8), shown by the deep infiltration zones in Figure 11 at TSF 1.
The early outputs of the groundwater inflow volumes into the open pit (East Pit) are as follows after integrating the findings:
  • The majority of groundwater influx volumes may come from different fracture systems or zones;
  • By continuously developing the mine, a bigger aquifer volume is reached, promoting rising groundwater inflows into the open pit;
  • During mining operations (such as unloading rock masses, blasting operations, and dewatering plans), the aquifer material’s capacity to transfer and retain groundwater is significantly enhanced close to the open pit.

5. Conclusions

We demonstrated the use of hydrogeological and geophysical techniques to identify possible groundwater extraction zones for the Tharisa Mine and provided a qualitative interpretation. The underlying aquifers of the Tharisa Mine were delineated, and it is evident that there is variable connectivity between the lower fractured aquifer and the weathered aquifer. Further, the geological structure, including fluid movement channels and appropriate lineaments, was further revealed by integrating the hydrogeological and geophysical data. Additionally, the geophysical findings support the hydrogeological information in that the primary water sources in the mine include mixing surface/rain water with nearby deep water sources, possible water recycling through lineaments, and tailings dam seepages.
Based on the early data, it is advised that the mine upgrade its dewatering systems and make more appropriate storage facility investments. Seepages will also be reduced via techniques for managing boreholes and monitoring tailings dams. Lastly, it is argued that regular monitoring of the extraction from the open pit will precisely confirm the groundwater inflow rates.

Author Contributions

Conceptualization, M.S.D.M., T.A. and J.D.; methodology, J.D., S.G. and M.K.R.; software, J.D., S.G. and M.K.R.; validation, M.S.D.M., T.A. and J.D.; formal analysis, J.D.; investigation, J.D.; resources, M.S.D.M., T.A. and G.D.; data curation, J.D.; writing—original draft preparation, J.D.; writing—review and editing, J.D., M.S.D.M., T.A. and G.D.; visualization, J.D.; supervision, M.S.D.M., T.A. and G.D.; project administration, M.S.D.M. and J.D.; funding acquisition, M.S.D.M. All authors have read and agreed to the published version of the manuscript.

Funding

This research was funded by Tharisa Mine, Wits Seismic Research Centre, and Centre of Excellence for Integrated Mineral and Energy (CIMERA).

Data Availability Statement

The data are not publicly available due to privacy restrictions.

Acknowledgments

The authors would like to acknowledge Tharisa Mine and CIMERA for funding this research. Further recognition goes to Michael Butler from iThemba Labs, Gauteng, for providing the analysis of the tritium results. Lastly, appreciation is given to Tharisa Mine for providing access to the mine for this project and for allowing us to publish the results.

Conflicts of Interest

The authors declare no conflict of interest.

References

  1. Lines, G.C. The Ground-Water System and Possible Effects of Underground Coal Mining in the Trail Mountain Area, Central Utah; Department of the Interior, US Geological Survey: Reston, WV, USA, 1985.
  2. MINEO Consortium. Review of Potential Environmental and Social Impact of Mining; MINEO Consortium: Gela, Italy, 2000. [Google Scholar]
  3. Environment Australia. Overview of Best Practice Environmental Management in Mining; Environment Australia: Canberra, Australia, 2002. [Google Scholar]
  4. Mengistu, H.A.; Demlie, M.B.; Abiye, T.A.; Xu, Y.; Kanyerere, T. Conceptual Hydrogeological and Numerical Groundwater Flow Modelling around the Moab Khutsong Deep Gold Mine, South Africa. Groundw. Sustain. Dev. 2019, 9, 100266. [Google Scholar] [CrossRef]
  5. Szczepiński, J. The Significance of Groundwater Flow Modeling Study for Simulation of Opencast Mine Dewatering, Flooding, and the Environmental Impact. Water 2019, 11, 848. [Google Scholar] [CrossRef] [Green Version]
  6. Jhariya, D.C.; Khan, R.; Thakur, G.S. Impact of Mining Activity on Water Resource: An Overview Study. In Proceedings of the Recent Practices and Innovations in Mining Industry, Raipur, India, 19–20 February 2016; pp. 271–277. [Google Scholar]
  7. Yang, Y.; Guo, T.; Jiao, W. Destruction Processes of Mining on Water Environment in the Mining Area Combining Isotopic and Hydrochemical Tracer. Environ. Pollut. 2018, 237, 356–365. [Google Scholar] [CrossRef] [PubMed]
  8. Ruiz, F.; Gomis, V.; Blasco, P. Application of Factor Analysis to the Hydrogeochemical Study of a Coastal Aquifer. J. Hydrol. 1990, 119, 169–177. [Google Scholar] [CrossRef]
  9. Subramani, T.; Rajmohan, N.; Elango, L. Groundwater Geochemistry and Identification of Hydrogeochemical Processes in a Hard Rock Region, Southern India. Environ. Monit. Assess. 2010, 162, 123–137. [Google Scholar] [CrossRef] [PubMed]
  10. Al-Ahmadi, M.E. Hydrochemical Characterization of Groundwater in Wadi Sayyah, Western Saudi Arabia. Appl. Water Sci. 2013, 3, 721–732. [Google Scholar] [CrossRef] [Green Version]
  11. Chebbah, M.; Allia, Z. Geochemistry and Hydrogeochemical Process of Groundwater in the Souf Valley of Low Septentrional Sahara, Algeria. Afr. J. Environ. Sci. Technol. 2015, 9, 261–273. [Google Scholar] [CrossRef] [Green Version]
  12. Al-Hmani, A.; Jamaa, N.B.; Kharroubi, A.; Agoubi, B. Assessment of Groundwater in Sana’a Basin Aquifers, Yemen, Using Hydrogeochemical Modeling and Multivariate Statistical Analysis. Arab. J. Geosci. 2022, 15, 684. [Google Scholar] [CrossRef]
  13. Yihdego, Y.; Webb, J.A.; Leahy, P. Modelling of Lake Level under Climate Change Conditions: Lake Purrumbete in Southeastern Australia. Environ. Earth Sci. 2015, 73, 3855–3872. [Google Scholar] [CrossRef]
  14. Mogaji, K.A.; Omobude, O.B. Modeling of Geoelectric Parameters for Assessing Groundwater Potentiality in a Multifaceted Geologic Terrain, Ipinsa Southwest, Nigeria—A GIS-Based GODT Approach. NRIAG J. Astron. Geophys. 2017, 6, 434–451. [Google Scholar] [CrossRef] [Green Version]
  15. Mohamaden, M.I.I.; Hamouda, A.Z.; Mansour, S. Application of Electrical Resistivity Method for Groundwater Exploration at the Moghra Area, Western Desert, Egypt. Egypt. J. Aquat. Res. 2016, 42, 261–268. [Google Scholar] [CrossRef] [Green Version]
  16. Wattanasen, K.; Elming, S.-Å. Direct and Indirect Methods for Groundwater Investigations: A Case-Study of MRS and VES in the Southern Part of Sweden. J. Appl. Geophys. 2008, 66, 104–117. [Google Scholar] [CrossRef]
  17. Younis, A.; Soliman, M.; Moussa, S.; Massoud, U.; ElNabi, S.A.; Attia, M. Integrated Geophysical Application to Investigate Groundwater Potentiality of the Shallow Nubian Aquifer at Northern Kharga, Western Desert, Egypt. NRIAG J. Astron. Geophys. 2016, 5, 186–198. [Google Scholar] [CrossRef] [Green Version]
  18. Song, L.; Zhu, J.; Yan, Q.; Kang, H. Estimation of Groundwater Levels with Vertical Electrical Sounding in the Semiarid Area of South Keerqin Sandy Aquifer, China. J. Appl. Geophys. 2012, 83, 11–18. [Google Scholar] [CrossRef]
  19. Lopes, D.D.; Silva, S.M.C.P.; Fernandes, F.; Teixeira, R.S.; Celligoi, A.; Dall’Antônia, L.H. Geophysical Technique and Groundwater Monitoring to Detect Leachate Contamination in the Surrounding Area of a Landfill—Londrina (PR—Brazil). J. Environ. Manag. 2012, 113, 481–487. [Google Scholar] [CrossRef] [PubMed]
  20. Mohamaden, M.I.I.; Ehab, D. Application of Electrical Resistivity for Groundwater Exploration in Wadi Rahaba, Shalateen, Egypt. NRIAG J. Astron. Geophys. 2017, 6, 201–209. [Google Scholar] [CrossRef]
  21. Ruthsatz, A.D.; Sarmiento Flores, A.; Diaz, D.; Reinoso, P.S.; Herrera, C.; Brasse, H. Joint TEM and MT Aquifer Study in the Atacama Desert, North Chile. J. Appl. Geophys. 2018, 153, 7–16. [Google Scholar] [CrossRef]
  22. Helaly, A.S. Assessment of Groundwater Potentiality Using Geophysical Techniques in Wadi Allaqi Basin, Eastern Desert, Egypt—Case Study. NRIAG J. Astron. Geophys. 2017, 6, 408–421. [Google Scholar] [CrossRef] [Green Version]
  23. Binley, A.; Hubbard, S.S.; Huisman, J.A.; Revil, A.; Robinson, D.A.; Singha, K.; Slater, L.D. The Emergence of Hydrogeophysics for Improved Understanding of Subsurface Processes over Multiple Scales. Water Resour. Res. 2015, 51, 3837–3866. [Google Scholar] [CrossRef] [Green Version]
  24. McLachlan, P.J.; Chambers, J.E.; Uhlemann, S.S.; Binley, A. Geophysical Characterisation of the Groundwater–Surface Water Interface. Adv. Water Resour. 2017, 109, 302–319. [Google Scholar] [CrossRef] [Green Version]
  25. Singha, K.; Day-Lewis, F.D.; Johnson, T.; Slater, L.D. Advances in Interpretation of Subsurface Processes with Time-Lapse Electrical Imaging: Time-Lapse Electrical Imaging. Hydrol. Process. 2015, 29, 1549–1576. [Google Scholar] [CrossRef]
  26. Dailey, D.; Sauck, W.; Sultan, M.; Milewski, A.; Ahmed, M.; Laton, W.R.; Elkadiri, R.; Foster, J.; Schmidt, C.; Al Harbi, T. Geophysical, Remote Sensing, GIS, and Isotopic Applications for a Better Understanding of the Structural Controls on Groundwater Flow in the Mojave Desert, California. J. Hydrol. Reg. Stud. 2015, 3, 211–232. [Google Scholar] [CrossRef] [Green Version]
  27. Wiederhold, H.; Kallesøe, A.J.; Kirsch, R.; Mecking, R.; Pechnig, R.; Skowronek, F. Geophysical Methods Help to Assess Potential Groundwater Extraction Sites. Grund. Z. Fachsekt. Hydrogeol. 2021, 26, 367–378. [Google Scholar] [CrossRef]
  28. Polom, U.; Bagge, M.; Wadas, S.; Winsemann, J.; Brandes, C.; Binot, F.; Krawczyk, C.M. Surveying Near-Surface Depocentres by Means of Shear Wave Seismics. First Break 2013, 31, 67–79. [Google Scholar] [CrossRef]
  29. Krawczyk, C.M.; Polom, U.; Trabs, S.; Dahm, T. Sinkholes in the City of Hamburg—New Urban Shear-Wave Reflection Seismic System Enables High-Resolution Imaging of Subrosion Structures. J. Appl. Geophys. 2012, 78, 133–143. [Google Scholar] [CrossRef]
  30. Pugin, A.J.-M.; Pullan, S.E.; Hunter, J.A.; Oldenborger, G.A. Hydrogeological Prospecting Using P- and S-wave Landstreamer Seismic Reflection Methods. Near Surf. Geophys. 2009, 7, 315–328. [Google Scholar] [CrossRef]
  31. Burschil, T.; Scheer, W.; Kirsch, R.; Wiederhold, H. Hydrogeological Characterisation of a Glacially Affected Barrier Island—The North Frisian Island of Föhr. Groundw. Hydrol. Instrum. Obs. Tech. 2012, 9, 5085–5119. [Google Scholar] [CrossRef] [Green Version]
  32. Høyer, A.-S.; Jørgensen, F.; Piotrowski, J.A.; Jakobsen, P.R. Deeply Rooted Glaciotectonism in Western Denmark: Geological Composition, Structural Characteristics and the Origin of Varde Hill-Island: Deeply Rooted Glaciotectonism in Western Denmark. J. Quat. Sci. 2013, 28, 683–696. [Google Scholar] [CrossRef]
  33. Tamiru, G.; Wiederhold, H. P- and S-Wave Reflection Profiling for near-Surface Investigation of Glacial Sediments. J. Appl. Geophys. 2020, 183, 104216. [Google Scholar] [CrossRef]
  34. Hoffmann, S.; Beilecke, T.; Polom, U.; Werban, U.; Leven, C.; Engeser, B. Integrierter Einsatz von Scherwellenseismik und Direct-Push-Verfahren zur Erkundung eines urbanen Grundwasserleiters. Grundwasser 2008, 13, 78–90. [Google Scholar] [CrossRef]
  35. Clarke, B.M. Intrusion Mechanisms of the Southwestern Rustenburg Layered Suite as Deduced from the Spruitfontein Inlier. S. Afr. J. Geol. 2000, 103, 120–127. [Google Scholar] [CrossRef]
  36. Eales, H.V.; Reynolds, I.M. Cryptic Variations within Chromitites of the Upper Critical Zone, Northwestern Bushveld Complex. Econ. Geol. 1986, 81, 1056–1066. [Google Scholar] [CrossRef]
  37. Eales, H.V.; Field, M.; De Klerk, W.J.; Scoon, R.N. Regional Trends of Chemical Variation and Thermal Erosion in the Upper Critical Zone, Western Bushveld Complex. Mineral. Mag. 1988, 52, 63–79. [Google Scholar] [CrossRef] [Green Version]
  38. Eales, H.V.; De Klerk, W.J.; Butcher, A.R. The Cyclic Unit beneath the UG1 Chromitite (UGIFW Unit) at RPM Union Section Platinum Mine—Rosetta Stone of the Bushveld upper Critical Zone? Mineral. Mag. 1990, 54, 23–43. [Google Scholar] [CrossRef] [Green Version]
  39. Teigler, B.; Eales, H.V.; Scoon, R.N. The Cumulate Succession in the Critical Zone of the Rustenburg Layered Suite at Brits, Western Bushveld Complex. S. Afr. J. Geol. 1992, 95, 17–28. [Google Scholar]
  40. Cawthorn, R.G. Pressure Fluctuations and the Formation of the PGE-Rich Merensky and Chromitite Reefs, Bushveld Complex. Min. Depos. 2005, 40, 231–235. [Google Scholar] [CrossRef]
  41. Taylor, C.D.; Schulz, K.J.; Doebrich, J.L.; Orris, G.; Denning, P.; Kirschbaum, M.J. Geology and Nonfuel Mineral Deposits of Africa and the Middle East; Open-File Report; US Geological Survey: Reston, WV, USA, 2009.
  42. Zientek, M.L.; Causey, J.D.; Parks, H.L.; Miller, R.J. Global Mineral Resource Assessment: Platinum-Group Elements in Southern Africa—Mineral Inventory and an Assessment of Undiscovered Mineral Resources; Scientific Investigations Report; US Geological Survey: Reston, WV, USA, 2014.
  43. Lourens, P. The Relation between South African Geology and Geohydrology. Ph.D. Thesis, University of the Free State, Bloemfontein, South Africa, 2013. [Google Scholar]
  44. Titus, R.; Witthüser, K.; Walters, B. Groundwater and Mining in the Bushveld Complex. In Proceedings of the International Mine and Water Conference, Extended Abstracts, Pretoria, South Africa, 19–23 October 2009. [Google Scholar]
  45. Loseby, B. Tharisa Mine Dewatering Strategy; SLR Consulting (Pty)Ltd.: Johannesburg, South Africa, 2021. [Google Scholar]
  46. Lomberg, K.; Bornman, H.; Goldschmidt, A.D.; James, J.; Lotheringen, J.; Pheiffer, A.; Stobart, B.; Wiid, G. Tharisa Chrome and PGM Mine; South Africa Competent Persons Report; Coffey Mining(Pty)Ltd.: Johannesburg, South Africa, 2016. [Google Scholar]
  47. Mazor, E. Chemical and Isotopic Groundwater Hydrology; Marcel Dekker Inc.: New York, NY, USA, 1997; Volume 413. [Google Scholar]
  48. Dotsika, E.; Lykoudis, S.; Poutoukis, D. Spatial Distribution of the Isotopic Composition of Precipitation and Spring Water in Greece. Glob. Planet. Chang. 2010, 71, 141–149. [Google Scholar] [CrossRef]
  49. Clark, I.; Fritz, P. Environmental Isotopes in Hydrogeology; CRC Press: Boca Raton, FL, USA, 2013; p. 328. [Google Scholar]
  50. Abiye, T.A.; Mengistu, H.; Masindi, K.; Demlie, M. Surface Water and Groundwater Interaction in the upper Crocodile River Basin, Johannesburg, South Africa: Environmental Isotope Approach. S. Afr. J. Geol. 2015, 118, 109–118. [Google Scholar] [CrossRef]
  51. Paz, M.; Alcalá, F.; Medeiros, A.; Martínez-Pagán, P.; Pérez-Cuevas, J.; Ribeiro, L. Integrated MASW and ERT Imaging for Geological Definition of an Unconfined Alluvial Aquifer Sustaining a Coastal Groundwater-Dependent Ecosystem in Southwest Portugal. Appl. Sci. 2020, 10, 5905. [Google Scholar] [CrossRef]
  52. Rey, J.; Martínez, J.; Mendoza, R.; Sandoval, S.; Tarasov, V.; Kaminsky, A.; Hidalgo, M.C.; Morales, K. Geophysical Characterization of Aquifers in Southeast Spain Using ERT, TDEM, and Vertical Seismic Reflection. Appl. Sci. 2020, 10, 7365. [Google Scholar] [CrossRef]
  53. Schoor, M.V.; Fourie, C.J.S. Introduction to the Geophysical Methods Applicable to Coal. In A Guide for Applying Geophysics to Coal Mining Problems in South Africa; Struik Nature: South Africa, Workflow;14822. [place unknown]: Coaltech; 2015; pp. 32–99. Available online: http://hdl.handle.net/10204/8280 (accessed on 31 July 2023).
  54. Martínez-Segura, M.A.; Conesa-García, C.; Pérez-Cutillas, P.; Martínez-Pagán, P.; Vásconez-Maza, M.D. Identifying Changes in Sediment Texture along an Ephemeral Gravel-Bed Stream Using Electrical Resistivity Tomography 2D and 3D. Appl. Sci. 2021, 11, 3030. [Google Scholar] [CrossRef]
  55. Sendrós, A.; Urruela, A.; Himi, M.; Alonso, C.; Lovera, R.; Tapias, J.C.; Rivero, L.; Garcia-Artigas, R.; Casas, A. Characterization of a Shallow Coastal Aquifer in the Framework of a Subsurface Storage and Soil Aquifer Treatment Project Using Electrical Resistivity Tomography (Port de La Selva, Spain). Appl. Sci. 2021, 11, 2448. [Google Scholar] [CrossRef]
  56. Alcalá, F.J.; Martínez-Pagán, P.; Paz, M.C.; Navarro, M.; Pérez-Cuevas, J.; Domingo, F. Combining of MASW and GPR Imaging and Hydrogeological Surveys for the Groundwater Resource Evaluation in a Coastal Urban Area in Southern Spain. Appl. Sci. 2021, 11, 3154. [Google Scholar] [CrossRef]
  57. Malehmir, A.; Durrheim, R.; Bellefleur, G.; Urosevic, M.; Juhlin, C.; White, D.J.; Milkereit, B.; Campbell, G. Seismic Methods in Mineral Exploration and Mine Planning: A General Overview of Past and Present Case Histories and a Look into the Future. Geophysics 2012, 77, WC173–WC190. [Google Scholar] [CrossRef] [Green Version]
  58. Manzi, M.S.D.; Gibson, M.A.S.; Hein, K.A.A.; King, N.; Durrheim, R.J. Application of 3D Seismic Techniques to Evaluate Ore Resources in the West Wits Line Goldfield and Portions of the West Rand Goldfield, South Africa. Geophysics 2012, 77, WC163–WC171. [Google Scholar] [CrossRef]
  59. Manzi, M.; Malehmir, A.; Durrheim, R.J. 3D Reflection Seismics for Deep Platinum Exploration in the Bushveld Complex, South Africa. In Proceedings of the 2nd Conference on Geophysics for Mineral Exploration and Mining, Porto, Portugal, 9–12 September 2018; European Association of Geoscientists & Engineers: Porto, Portugal, 2018; pp. 1–5. [Google Scholar] [CrossRef]
  60. Manzi, M.S.D.; Durrheim, R.J.; Hein, K.A.A.; King, N. 3D Edge Detection Seismic Attributes Used to Map Potential Conduits for Water and Methane in Deep Gold Mines in the Witwatersrand Basin, South Africa. Geophysics 2012, 77, WC133–WC147. [Google Scholar] [CrossRef]
  61. Pazzi, V.; Di Filippo, M.; Di Nezza, M.; Carlà, T.; Bardi, F.; Marini, F.; Fontanelli, K.; Intrieri, E.; Fanti, R. Integrated Geophysical Survey in a Sinkhole-Prone Area: Microgravity, Electrical Resistivity Tomographies, and Seismic Noise Measurements to Delimit Its Extension. Eng. Geol. 2018, 243, 282–293. [Google Scholar] [CrossRef]
  62. Robinson, D.A.; Binley, A.; Crook, N.; Day-Lewis, F.D.; Ferré, T.P.A.; Grauch, V.J.S.; Knight, R.; Knoll, M.; Lakshmi, V.; Miller, R.; et al. Advancing Process-Based Watershed Hydrological Research Using near-Surface Geophysics: A Vision for, and Review of, Electrical and Magnetic Geophysical Methods. Hydrol. Process. 2008, 22, 3604–3635. [Google Scholar] [CrossRef]
  63. Lubczynski, M.; Roy, J. Hydrogeological Interpretation and Potential of the New Magnetic Resonance Sounding (MRS) Method. J. Hydrol. 2003, 283, 19–40. [Google Scholar] [CrossRef]
  64. World Health Organization. The World Health Report 2007: A Safer Future: Global Public Health Security in the 21st Century; World Health Organization: Geneva, Switzerland, 2007.
  65. Rusydi, A.F. Correlation between Conductivity and Total Dissolved Solid in Various Type of Water: A Review. IOP Conf. Ser. Earth Environ. Sci. 2018, 118, 012019. [Google Scholar] [CrossRef]
  66. Porowski, A. Isotopic Evidence of the Origin of Mineralized Waters from the Central Carpathian Synclinorium, SE Poland. Environ. Geol. 2004, 46, 661–669. [Google Scholar] [CrossRef]
  67. Chilton, P.J.; Foster, S.S.D. Hydrogeological Characterisation and Water-Supply Potential of Basement Aquifers in Tropical Africa. Hydrogeol. J. 1995, 3, 36–49. [Google Scholar] [CrossRef]
  68. Howard, R.T.K. A Tectono-Geomorphic Model of the Hydrogeology of Deeply Weathered Crystalline Rock: Evidence from Uganda. Hydrogeol. J. 2000, 8, 279–294. [Google Scholar]
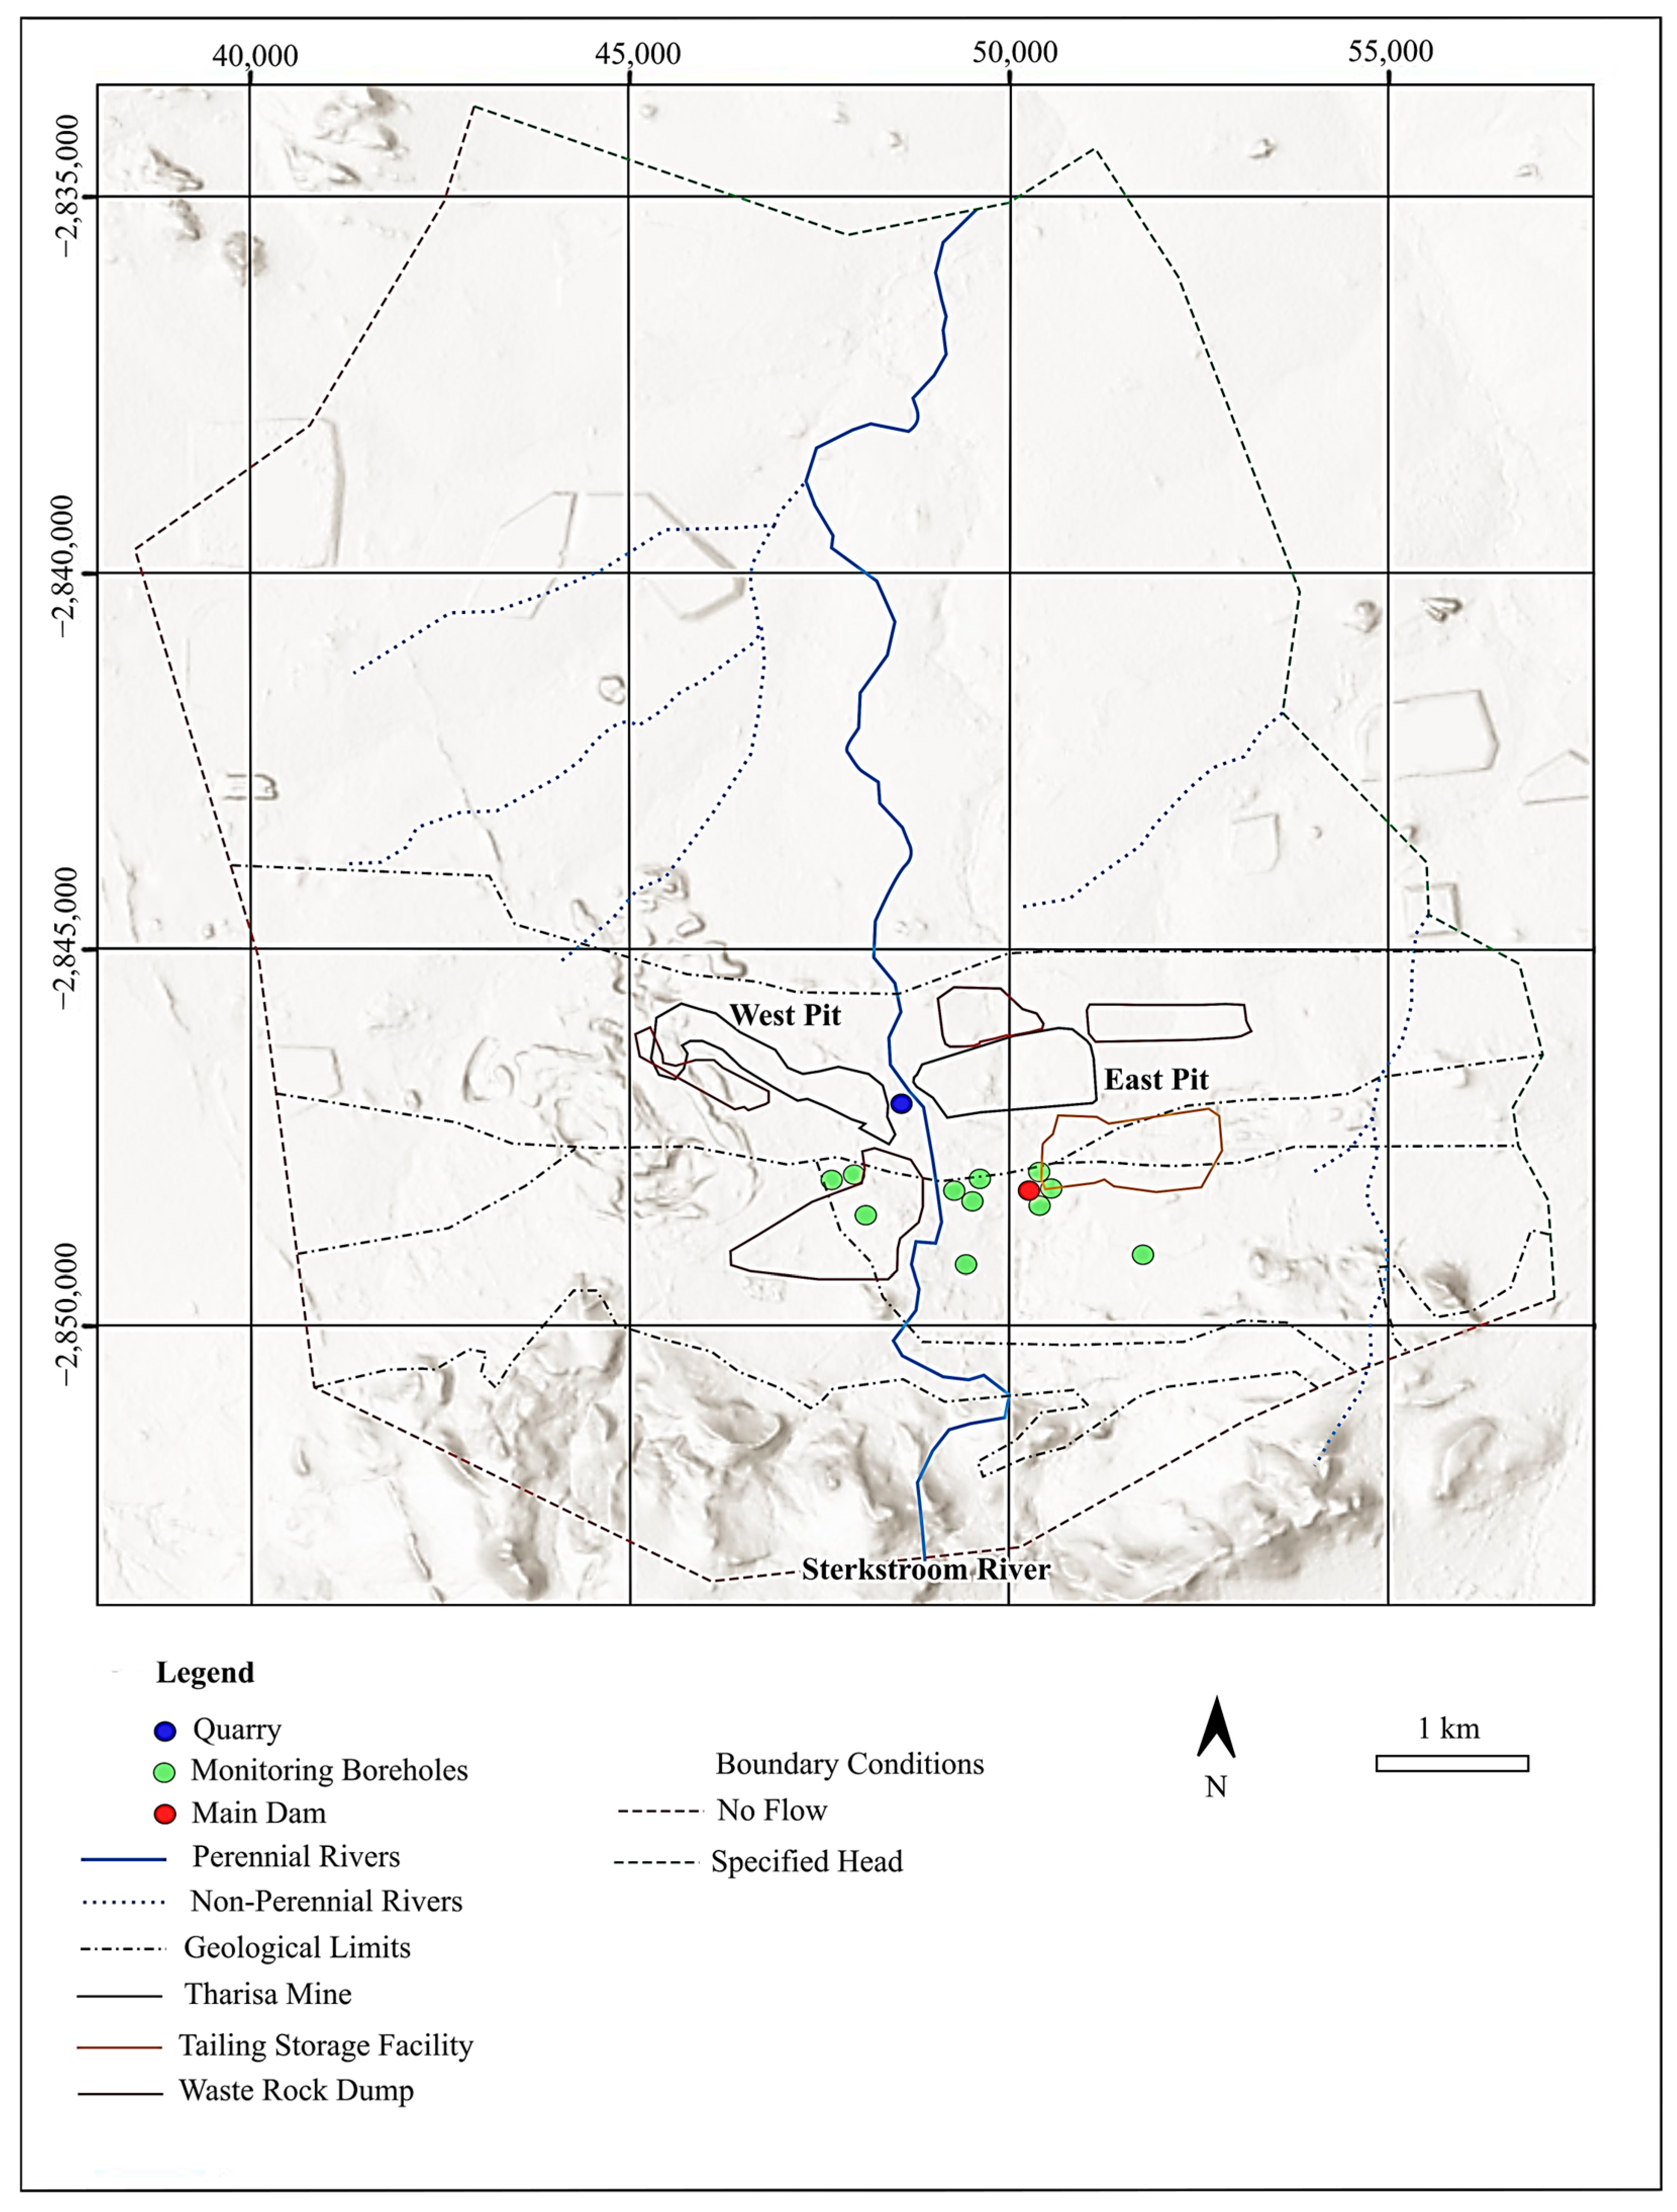
Figure 2. Preliminary Tharisa groundwater model illustrating the various boundary conditions.
Water 15 02876 g002
Figure 3. Interpreted aeromagnetic survey map [46]. The black line indicates a normal thrust fault. The Upper Group 1 (UG1) outcrop and Middle Group 1 (MG1) outcrop are represented by a red and blue line, respectively. The main dyke is shown by a yellow dashed line whilst the shear zone is defined as a white line. The white star indicates the location of Tharisa Mine. Magnetic high zones are indicated by the pink color sections, whilst, magnetic low zones are indicated by the dark blue color sections.
Water 15 02876 g003
Figure 4. (a) An example of how the field sampling was carried out in the study area using the Crison Multimeter. (b) Tailings Storage Facility 1 (TSF 1) sample location (indicated by the white star). (c) Tailings Storage Facility 2 (TSF 2) sample location (indicated by the white star).
Water 15 02876 g004
Figure 5. (a) Locality map of the study area with in situ field sampling locations. Red dots are sampled surface water; white stars are sampled boreholes. A green dashed line indicates Far West Pit; West Pit indicated by a light-blue dashed line; East Pit by a yellow dashed line; Tailings Storage Facility 1 (TSF 1) by a pink dashed line; and Tailings Storage Facility 2 (TSF 2) by the dark-blue dashed line. The white dashed line represents the river separating the East and West Pits. (b) Tailings Storage Facility 1 is represented by the dark-blue square, and the survey position of Tailings Storage Facility Line 1 (TSF L1) is indicated by a black dashed line. Electrical resistivity tomography (ERT) and multichannel analysis of surface waves (MASW) were conducted along this line. (c) Tailings Storage Facility 2 is represented by the red square, and the survey position of Tailings Storage Facility Line 2 (TSF L2) is indicated by a black dashed line. Along this line, both electrical resistivity tomography (ERT) and multichannel analysis of surface waves (MASW) were conducted. (d) Main East Pit surveyed area is indicated by the black square. Light-blue polygons indicate magnetic grids (M1, M2, M3, and M4). Seismic Profile 1 (SP1) and Seismic Profile 2 (SP2) are indicated by black dashes (note: Resistivity Profile 1 (RP1) is located along SP1). A red dashed line indicates Resistivity Profile 2 (RP2). The surveyed dyke is indicated by a yellow dashed line. A solid black line indicates a surveyed fault.
Water 15 02876 g005
Figure 6. (a) Total dissolved solids (TDS; mg/L) vs. δ2H (‰) for all Tharisa Mine samples with R2 = 0.0011. (b) Total dissolved solids (TDS; mg/L) vs. δ18O (‰) for all Tharisa Mine samples with R2 = 0.0057. (c) Total dissolved solids (TDS; mg/L) vs. 3H (T.U) for all Tharisa Mine samples with R2 = 0.0091. (d) Electrical conductivity (µS/cm) vs. δ18O (‰) for all Tharisa Mine samples. A negative correlation was obtained with R2 = 0.005; furthermore, in most samples, an increase in electrical conductivity (EC) values occurred without many changes in isotopic (δ18O) composition.
Water 15 02876 g006
Figure 7. (a) East Pit northern wall face. The Fault Zone (indicated by the red dashed line) intersects with the E–W trending dyke (white dashed line). Example of Middle Group (MG) chromitite reefs (MG3, MG4, and MG4A) indicated by black dashed line. Chromitite reefs are young towards the south. (b) Fault–dyke intersection zone (Fault Dyke int) is indicated by the blue square in (a). A high flow rate (~1 L/min) was observed at the northern East Pit wall face (sampled point T22—East Pit surface water sample).
Water 15 02876 g007
Figure 8. Stable isotopes (δ1⁸O; δ2H) of Tharisa Mine surface water vs. Pretoria Local Meteoric Water Line (PLMWL), Johannesburg Local Meteoric Water Line (JLMWL), and Global Meteoric Water Line (GMWL). Red circle: highly enriched isotopic signal caused by fractionation during evaporation. Blue circle: mixture of surface waters with recent recharge infiltrating deep and possible water recycling. Green circle: isotopically depleted waters, hence deeper water systems.
Water 15 02876 g008
Figure 9. δ1⁸O (‰) vs. tritium (T.U) of Tharisa Mine surface water. Red circle: recent recharge, enriched isotopes, or possible rainfall. Purple circle: highly depleted δ1⁸O with an elevated δ3H level, alluding to a recent recharge from depleted moisture (rainfall) source but a geographically isolated area of influence. Blue circle: active mixing. Green circle: deep circulating water, depleted isotopes.
Water 15 02876 g009
Figure 10. (a) Surface contour map joining areas of equal tritium value (T.U), thus showing a similar recharge period. (b) Elevation map of areas sampled for isotope analysis. Enriched isotopes (E.I) were more concentrated on higher elevations, whilst depleted isotopes (D.I) were concentrated on lower elevations. In addition, active mixing (A.M) was observed along the descent from the higher to lower elevations (indicated by the white dashed arrows), suggesting possible mixing through lineaments.
Water 15 02876 g010
Figure 11. (a) Electrical resistivity tomography (ERT) Schlumberger array inversion results for Tailings Storage Facility (TSF) 1. The solid white arrow represents a high-resistivity zone with multiple irregularities suggestive of possible fractures in the less weathered zone of the profile (indicated by white dashed arrows). The black dashed lines delineate a high-resistivity zone and are classified as a less conductive and weathered zone. The solid red line delineates the location of the MASW line. (b) Multichannel analysis of surface waves (MASW) inversion results for TSF 1. The white dashed arrows delineate low-shear-wave-velocity zones or more weathered zones in the profile, which may allow for water migration. (c). Extension of the MASW line for TSF 1. The blue rectangle represents the section correlating to the MASW profile in image (b).
Water 15 02876 g011
Figure 12. (a) Electrical resistivity tomography (ERT) Schlumberger array inversion results for Tailings Storage Facility (TSF) 2. The solid white arrows delineate high-resistivity zones and, therefore, less conductive zones. The dashed white arrow represents a low-resistivity zone which may allow for possible water migration. (b) Multichannel analysis of surface waves (MASW) inversion results for TSF 2. The white dashed arrow represents a low-shear-wave-velocity zone which may allow for water migration. The black dashed arrows represent other low-shear-wave-velocity zones. The solid white arrows indicate higher shear velocity areas and, therefore, less weathered rock. (c) Extension of the MASW line for TSF 1. The blue rectangle represents the section correlating to the MASW profile in image (b).
Water 15 02876 g012
Figure 13. (a) Vertical tilt angle derivative map of the total magnetic intensity (TMI) for Magnetic Grid 1 (M1). (b) Vertical tilt angle derivative map of the TMI for Magnetic Grid 2 (M2). (c) Vertical tilt angle derivative map of the TMI for Magnetic Grid 3 (M3). The red arrows indicate positive magnetic anomalies, while the white arrows indicate negative magnetic anomalies. Some areas of negative magnetism show discontinuities (indicated by the black dashed lines) and are possible fracture systems/lineaments.
Water 15 02876 g013
Figure 14. (a) Seismic tomogram for input Seismic Profile 1 (SP1). The dotted black line represents the mapped fault, whilst the solid black line indicates an interpreted fault. (b) Schlumberger electrical resistivity inverse sections for Resistivity Profile 1 (RP1). The red arrow indicates a low-resistivity zone, while the white arrow indicates a high-resistivity zone. Depth is on a logarithmic scale.
Water 15 02876 g014
Figure 15. (a) Vertical tilt angle derivative map of the TMI for Magnetic Grid 2 (M2). The red arrow indicates areas of positive magnetic anomalies, while the white arrow indicates negative magnetic anomalies. Some areas of negative magnetism show discontinuities (indicated by the black dashed lines) and are possible fracture systems/lineaments. (b) Seismic tomogram for input Seismic Profile 2 (SP2). The dotted black lines represent the interpreted faults. (c) Schlumberger electrical resistivity inverse sections for Resistivity Profile 2 (RP2). The red arrow indicates high-resistivity areas, while the white arrows indicate low-resistivity areas. Depth is on a logarithmic scale.
Water 15 02876 g015
Table 1. Field sampling procedures.
Collection techniqueA Crison MM 40 multimeter is used to take an in situ reading. Allow it to stabilize. Samples are to be stored in a cooler box to avoid fractionation.
CollectionA sample bottle is used as a means of direct collection of an unfiltered sample. Pre-rinse the sample bottle with sample water before the final collection.
Filling techniqueThe container is tightly capped to the brim to exclude air (air bubbles).
Analysis methodThe electrode is stored in a KCl solution (electrolyte). Dip the electrode in deionized water and then into the beaker with the water to be measured. Let it stabilize before recording the data. Then, dip the electrode back into the deionized water before storing it in the KCl solution.
Table 2. Physiochemical and isotope parameters.
DescriptionXYSamplepHTemperature (°C)TDS (mg/L)EC (µS/cm)δ2H (‰)δ18O (‰)3H (T.U)
River−48,920.472,847,915.65T36.813.3179.4283−18−3.371.8
Dissipator Dam 2-52,223.742,846,645.34T57.516.48861379−5.4−1.122.5
Dissipator Dam 1−50,657.042,846,434.29T67.515.15899150.50.580.3
Main Dam−50,470.182,848,066.6T78.116.575511934.71.53.4
Stormwater Dam−49,453.152,847,951.97T97.615.98121268−8.1−1.411.0
West Pit (Dyke)−48,426.072,847,589.44T16.214.5390609−16.6−3.150.3
West Pit−48,261.842,847,524.26T26.415.7556873−16.8−3.21.6
East Pit−50,026.532,847,308.23T107.419.39491480−13.8−2.662.2
East Pit−50,023.62,847,287.17T117.219.29411474−17.2−3.372.0
East Pit−50,146.092,847,268.8T127.420.89461475−17.1−3.411.6
East Pit−50,171.712,847,392.87T13818.37981248−7.6−1.753.2
Est Pit−49,773.922,847,504.48T147.718.78861383−12.8−2.422.9
East Pit−49,914.752,847,413.06T157.819.28481323−11.5−2.261.8
East Pit (Dyke)−49,184.372,847,564.54T168.1187841222−14.5−2.742.0
East Pit (Dyke)−49,240.632,847,627.68T177.720.17991247−12.7−2.421.7
East Pit (Dyke)−49,211.542,847,624.25T187.920.68001247−11−2.112.2
East Pit−50,687.212,847,441.03T198.216.78061260−11.4−2.42.3
Far West Pit−46,531.232,846,628.66T207.312.8609950−22.8−4.631.4
East Pit−49,524.012,847,516.84T217.513.58721366−10.3−1.982.1
East Pit−49,424.982,847,702.59T227.3622.39471295−9.2−2.152.1
Quarry−48,941.162,847,746.22T87.716.78371303−11.2−1.921.0
Samancor Borehole−52,223.742,846,645.34T46.721.614502230−18.8−3.791.1
Monitoring Borehole (TM GW FW BH 24)−47,662.662,846,946.1T246.8423.5537839−24−3.52.0
Monitoring Borehole (TM GW FW BH 25)−48,480.542,847,484.17T257.520.16691046−17.4−3.772.1
Monitoring Borehole (TM GW Dissipater 1)−50,603.62,848,077.08T266.6721.36841067−5.9−0.171.1
Monitoring Borehole (TM GW Dissipater 2)−50,591.712,848,037.15T276.9821.96931082−6.6−0.831.5
Monitoring Borehole (TM GW RPM)−50,431.982,848,085.29T287.2920.97141115−11.5−1.831.5
Monitoring Borehole (TM GW COMM 02)−51,747.652,849,061.98T297.1421.3332519−0.80.611.9
Monitoring Borehole (TM GW COMM 01)−49,472.52,849,217.25T307.3321.9367575−15.9−2.91.5
Monitoring Borehole (TM GW TSF 01)−50,127.442,849,013.64T317.3221.3344536−12.5−2.041.3
Monitoring Borehole (TM GW COMM 06)−48,075.452,848,504.16T327.1522.6296464−11.8−1.931.9
Disclaimer/Publisher’s Note: The statements, opinions and data contained in all publications are solely those of the individual author(s) and contributor(s) and not of MDPI and/or the editor(s). MDPI and/or the editor(s) disclaim responsibility for any injury to people or property resulting from any ideas, methods, instructions or products referred to in the content.