
Assessing the Dual Use of Red and Yellow Algerian Pomegranate Husks: Natural Antiradical Agents and Low-Cost Biosorbents for Chromium (VI) Removal from Contaminated Waters


Abstract
:1. Introduction
2. Materials and Methods
2.1. Materials
2.2. Preparation of the Biosorbents
2.3. Preparation of Stock Solution
2.4. Concentration Determination Method
2.5. Biosorbents Characterization
2.6. Quencher-Free Radical Scavenging Activity
2.7. Biosorption Studies
2.8. Isotherms Modeling
2.9. Kinetics Modeling
2.10. Statistical Analysis
3. Results
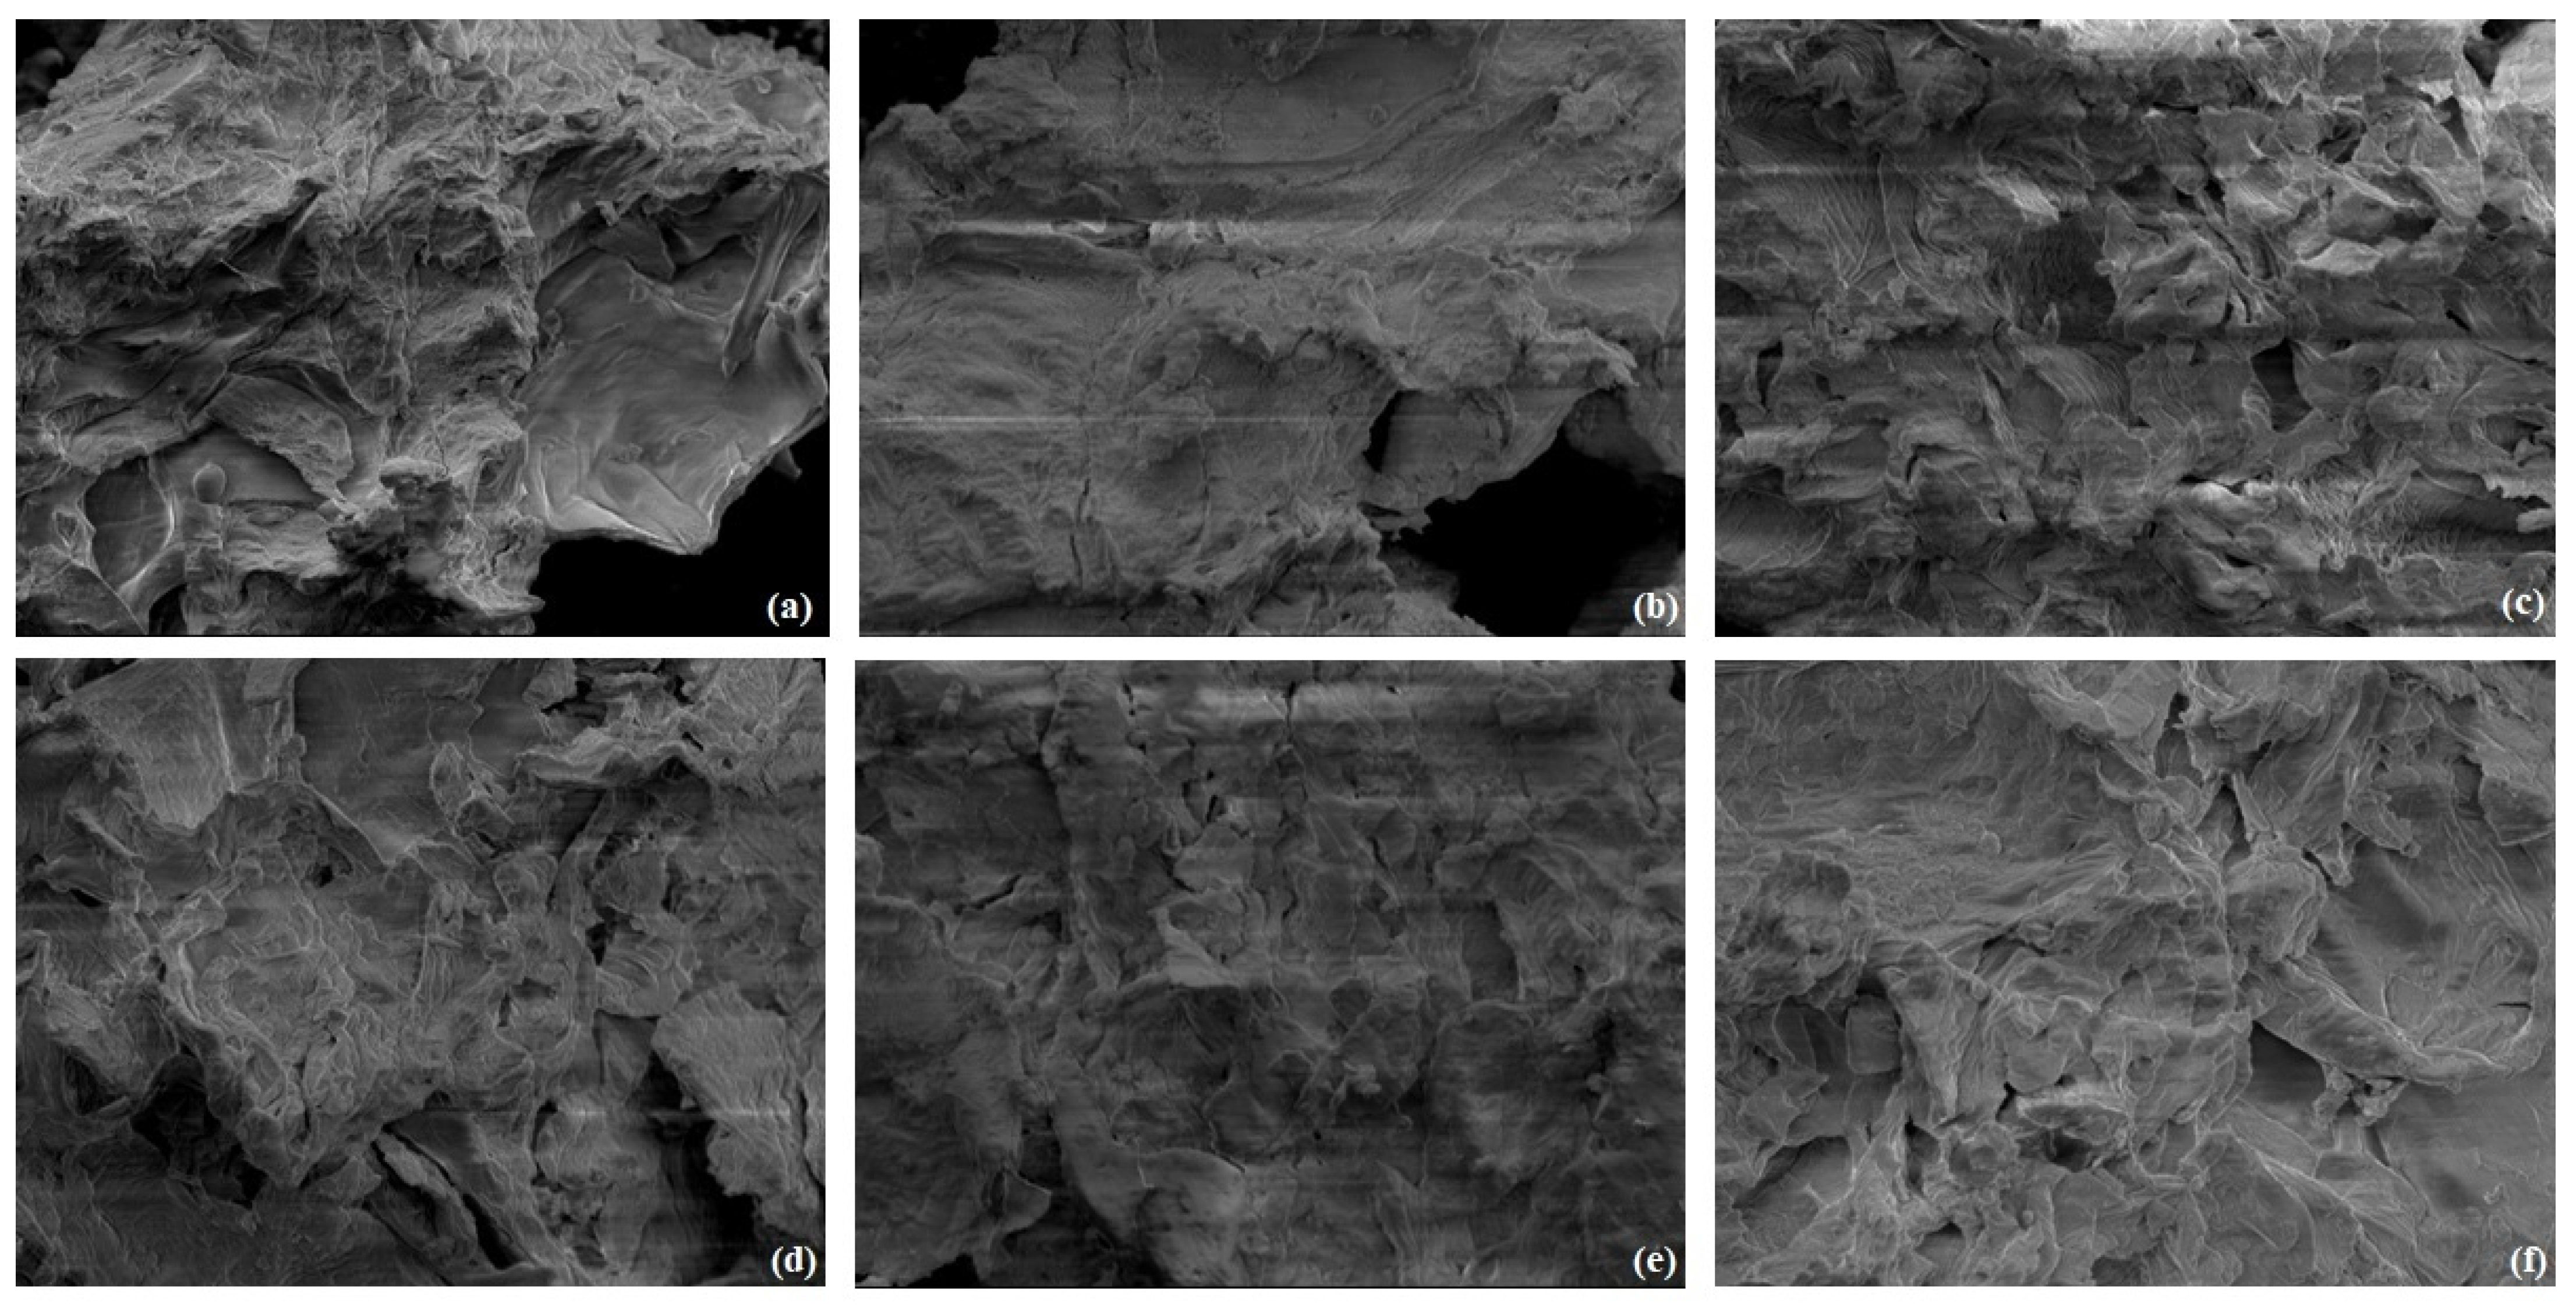
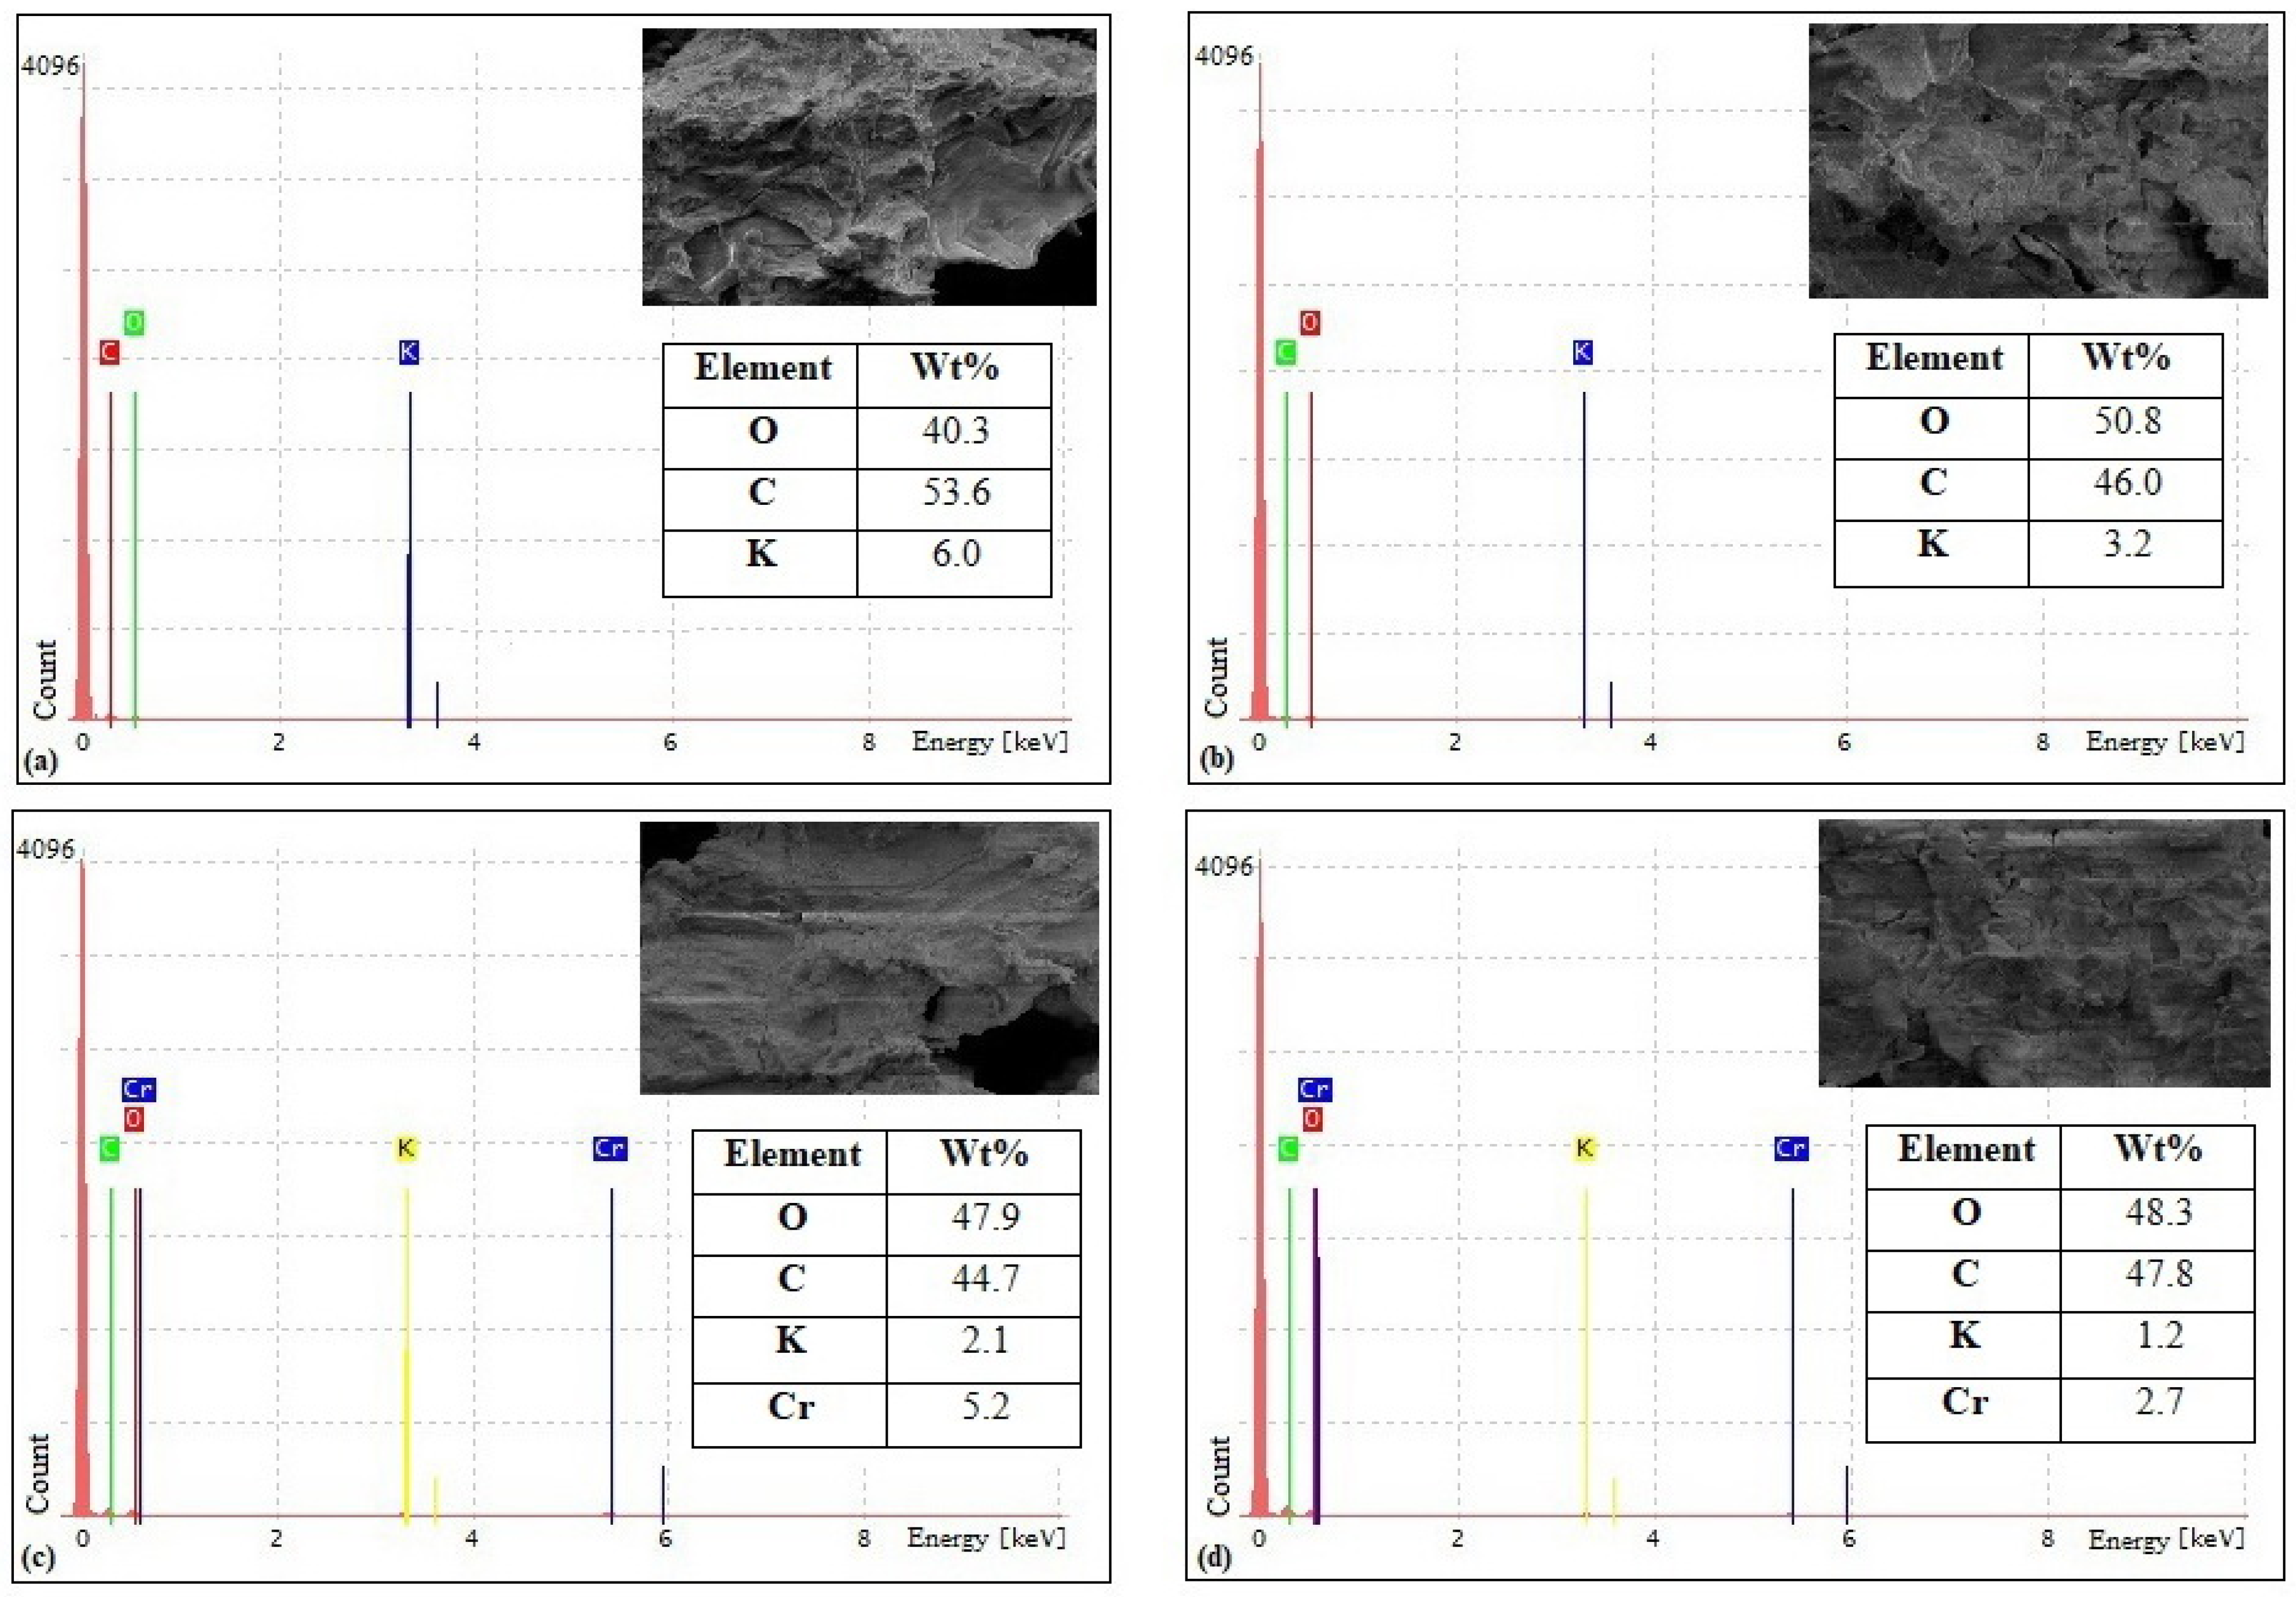
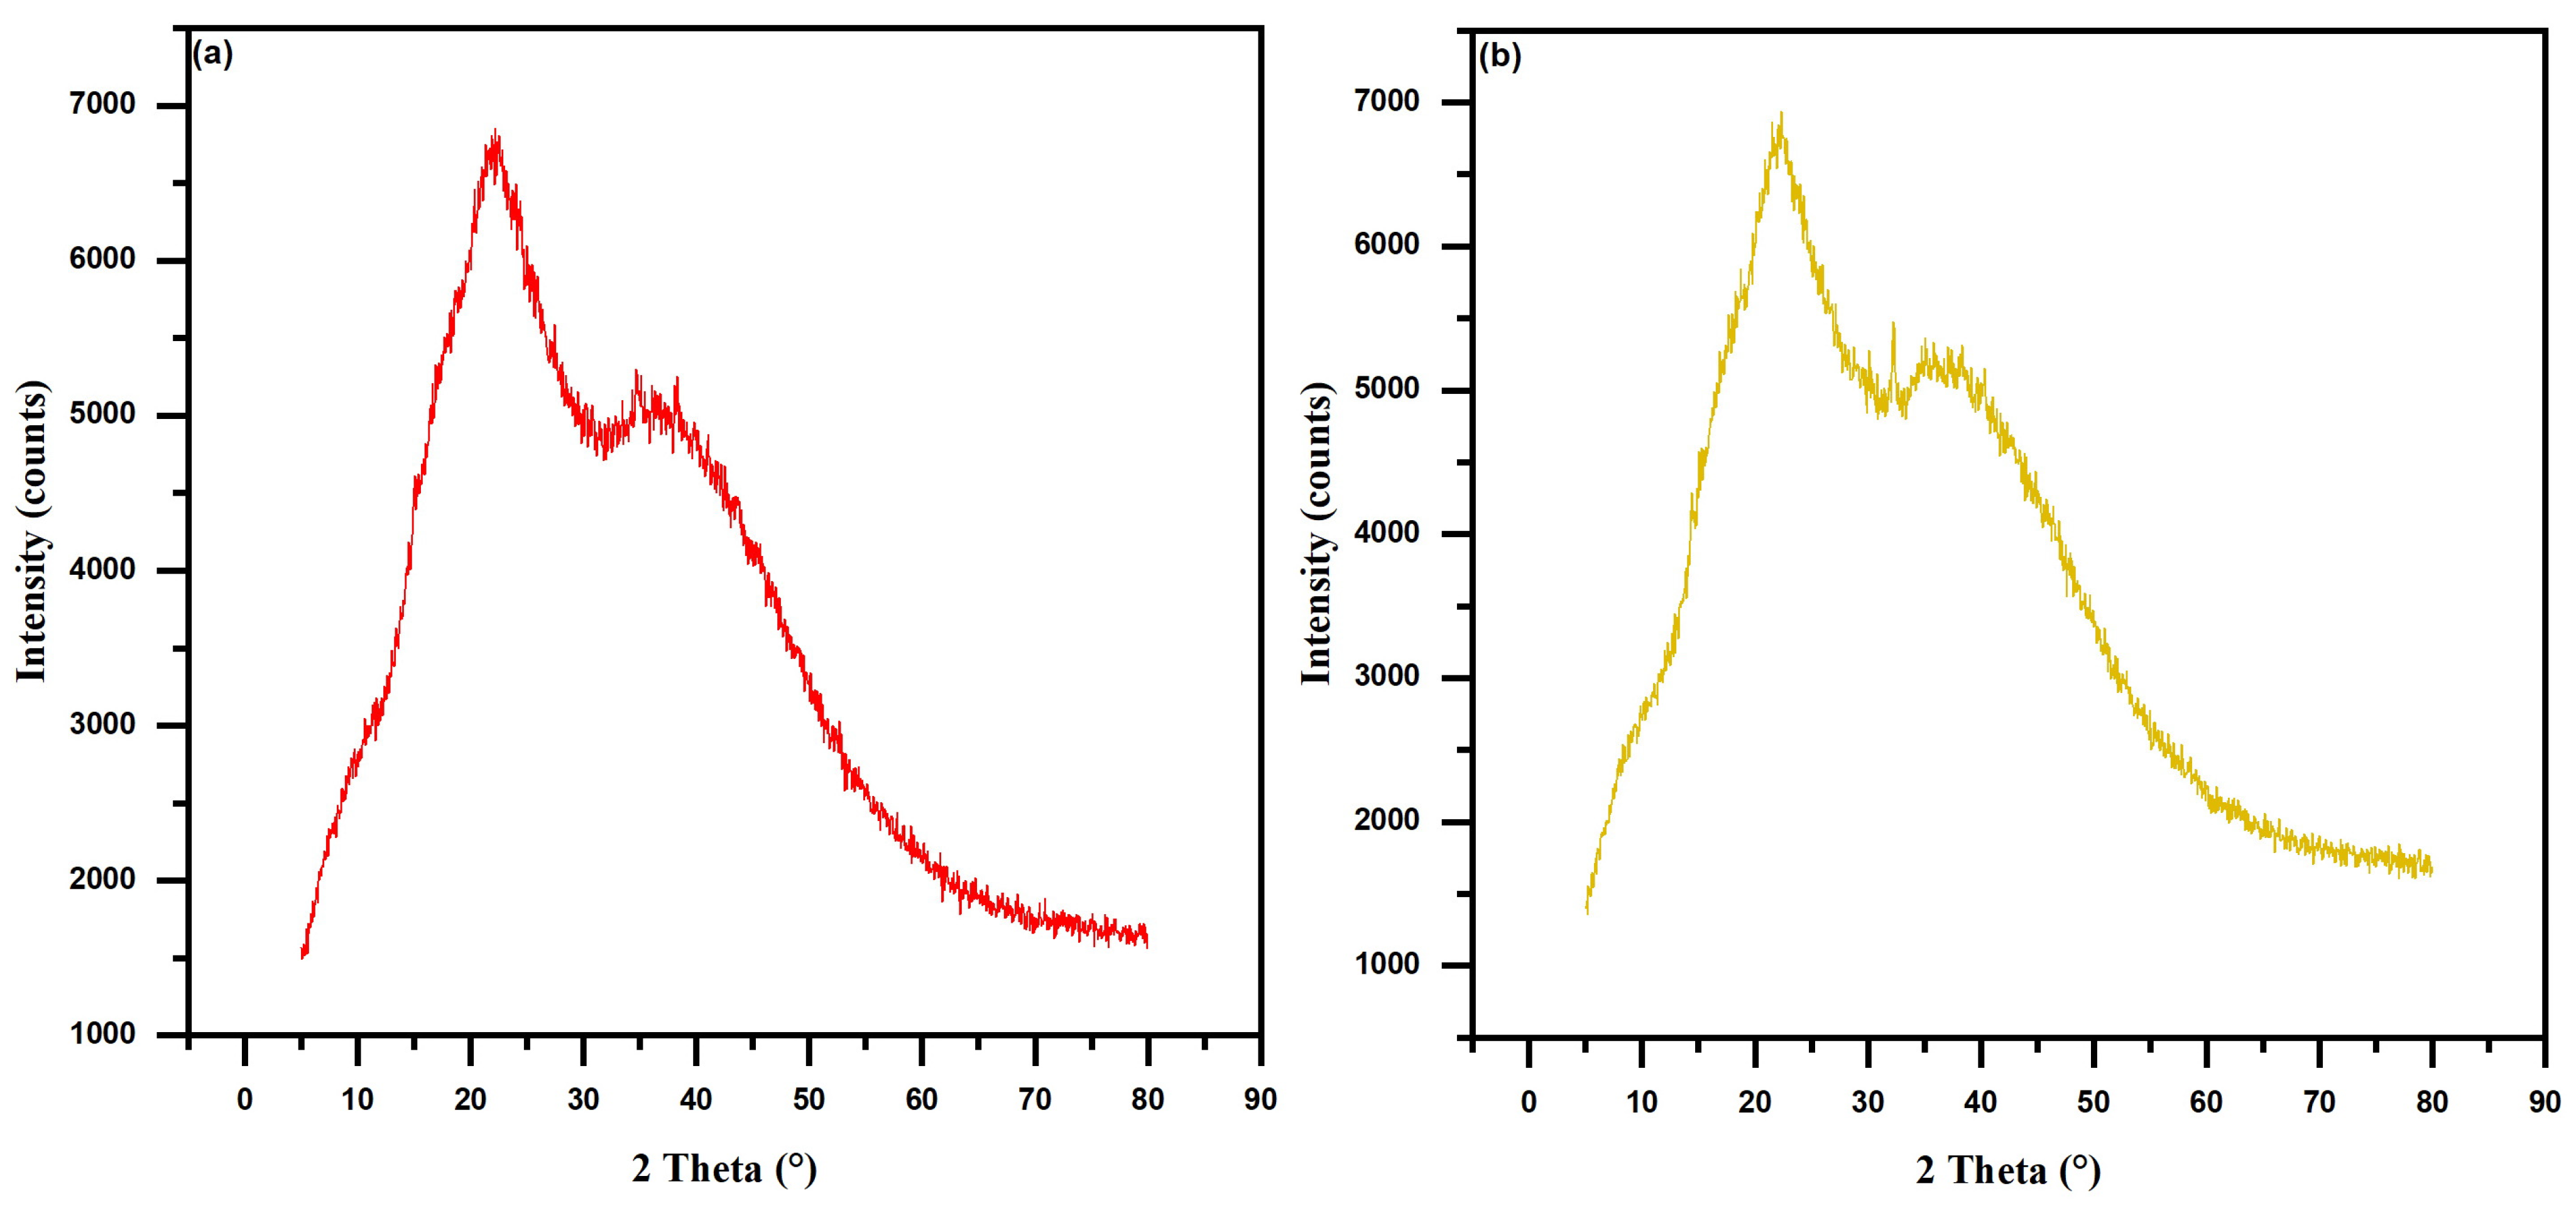
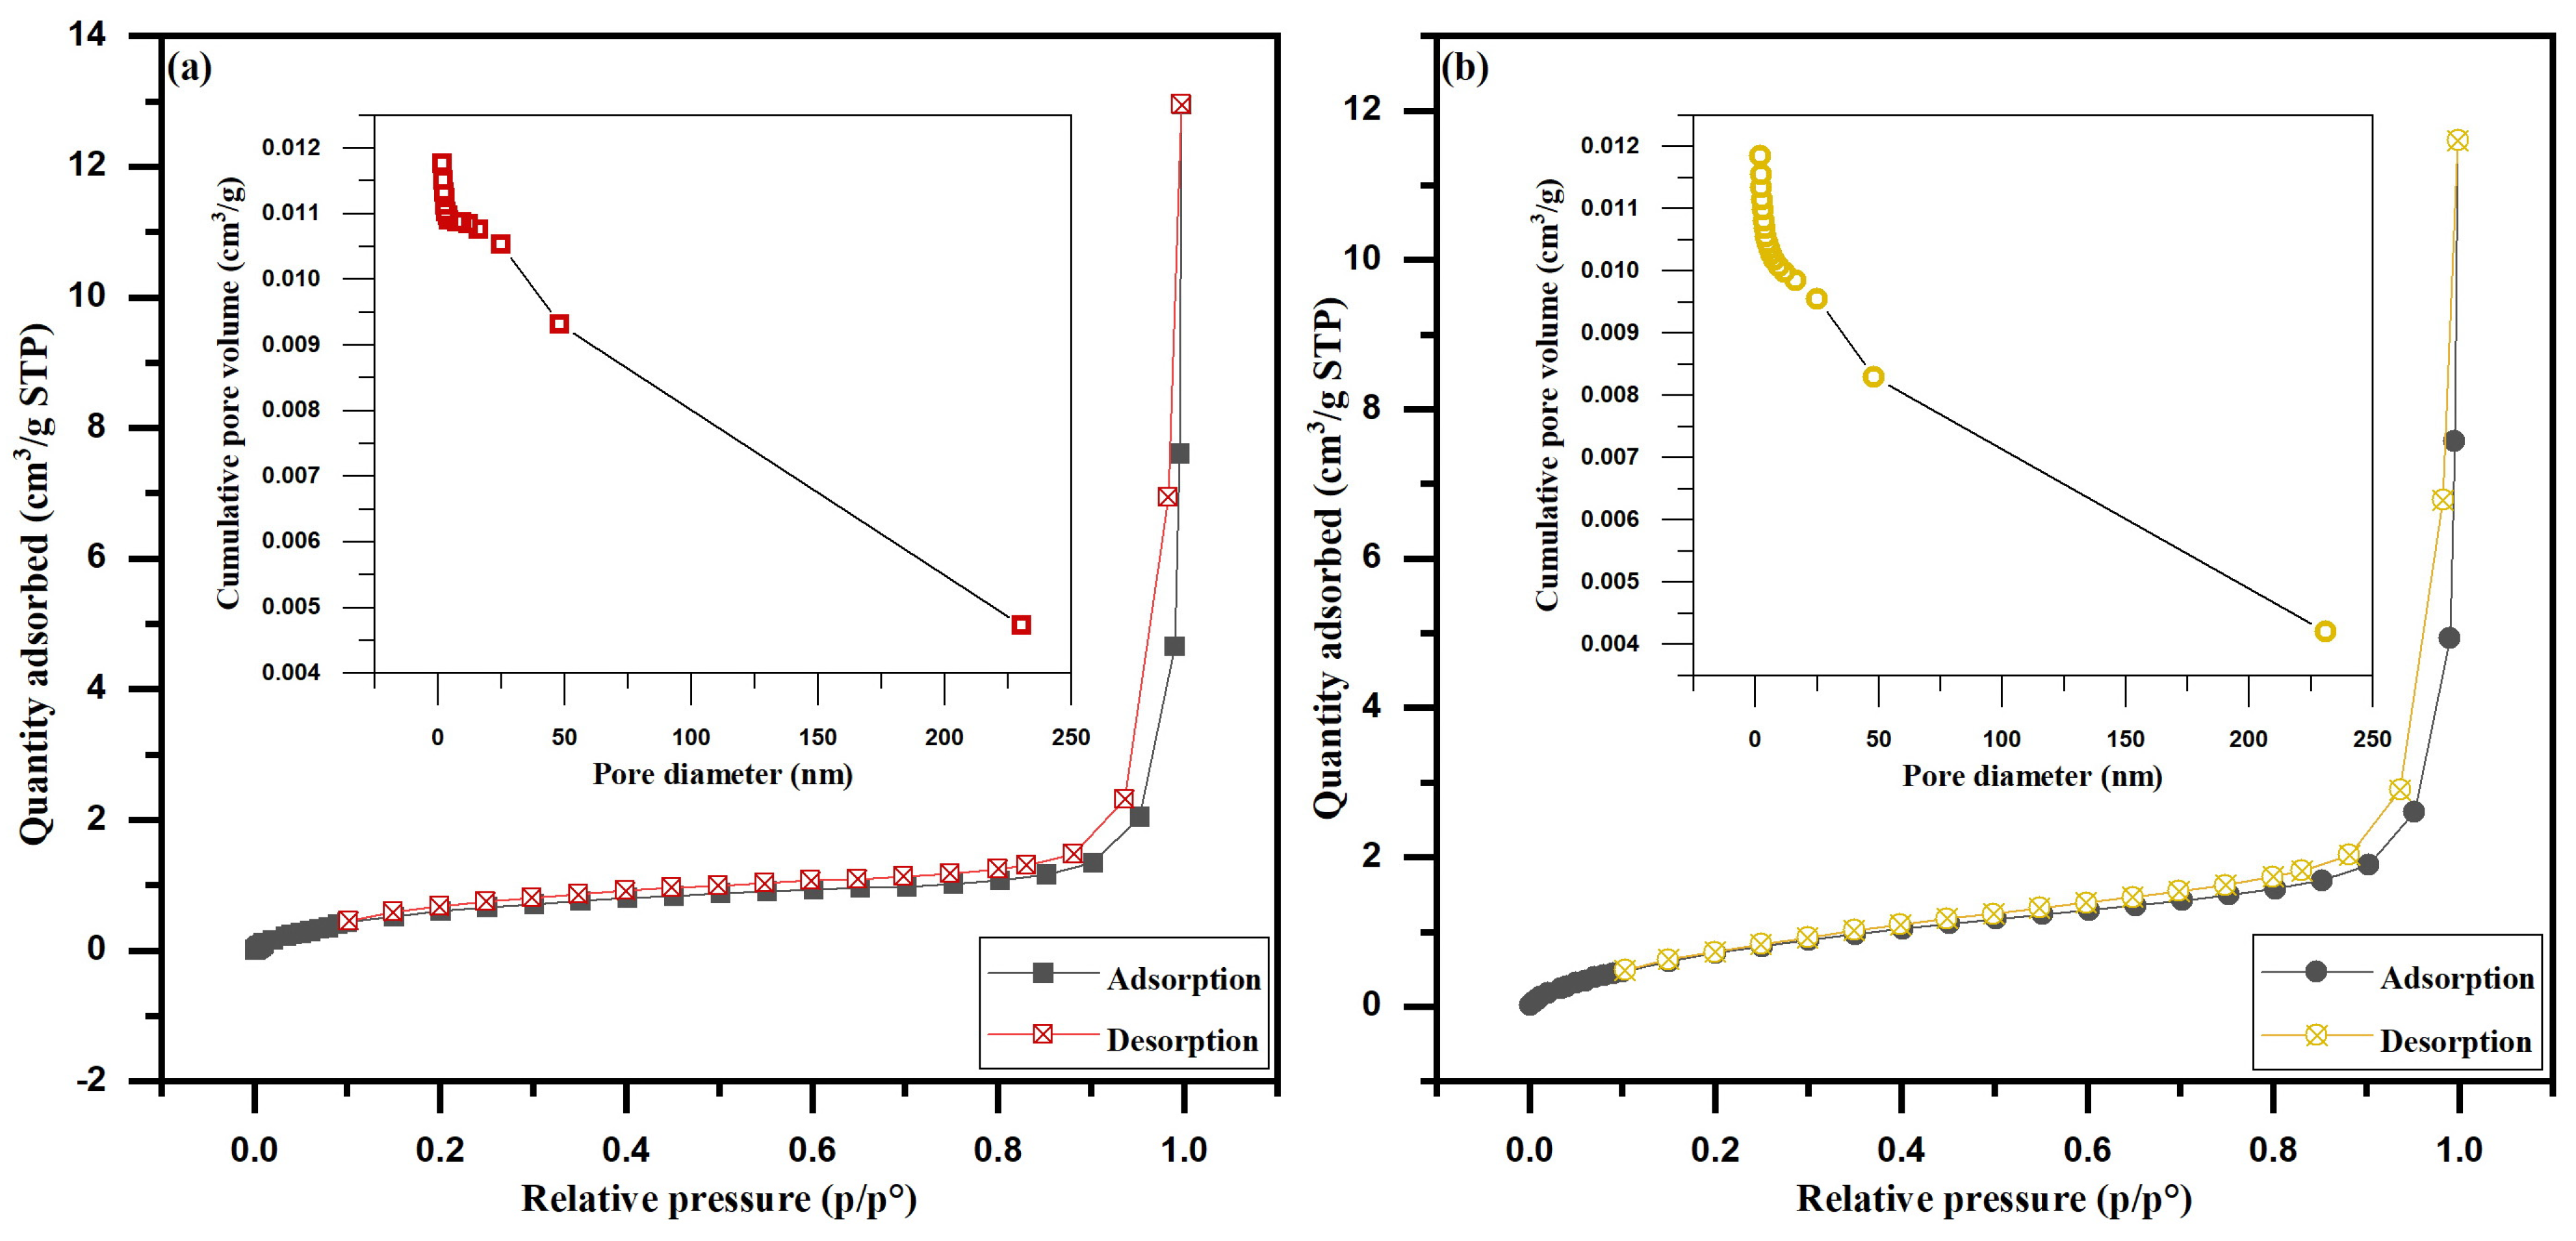
3.1. Biosorbents Characterization
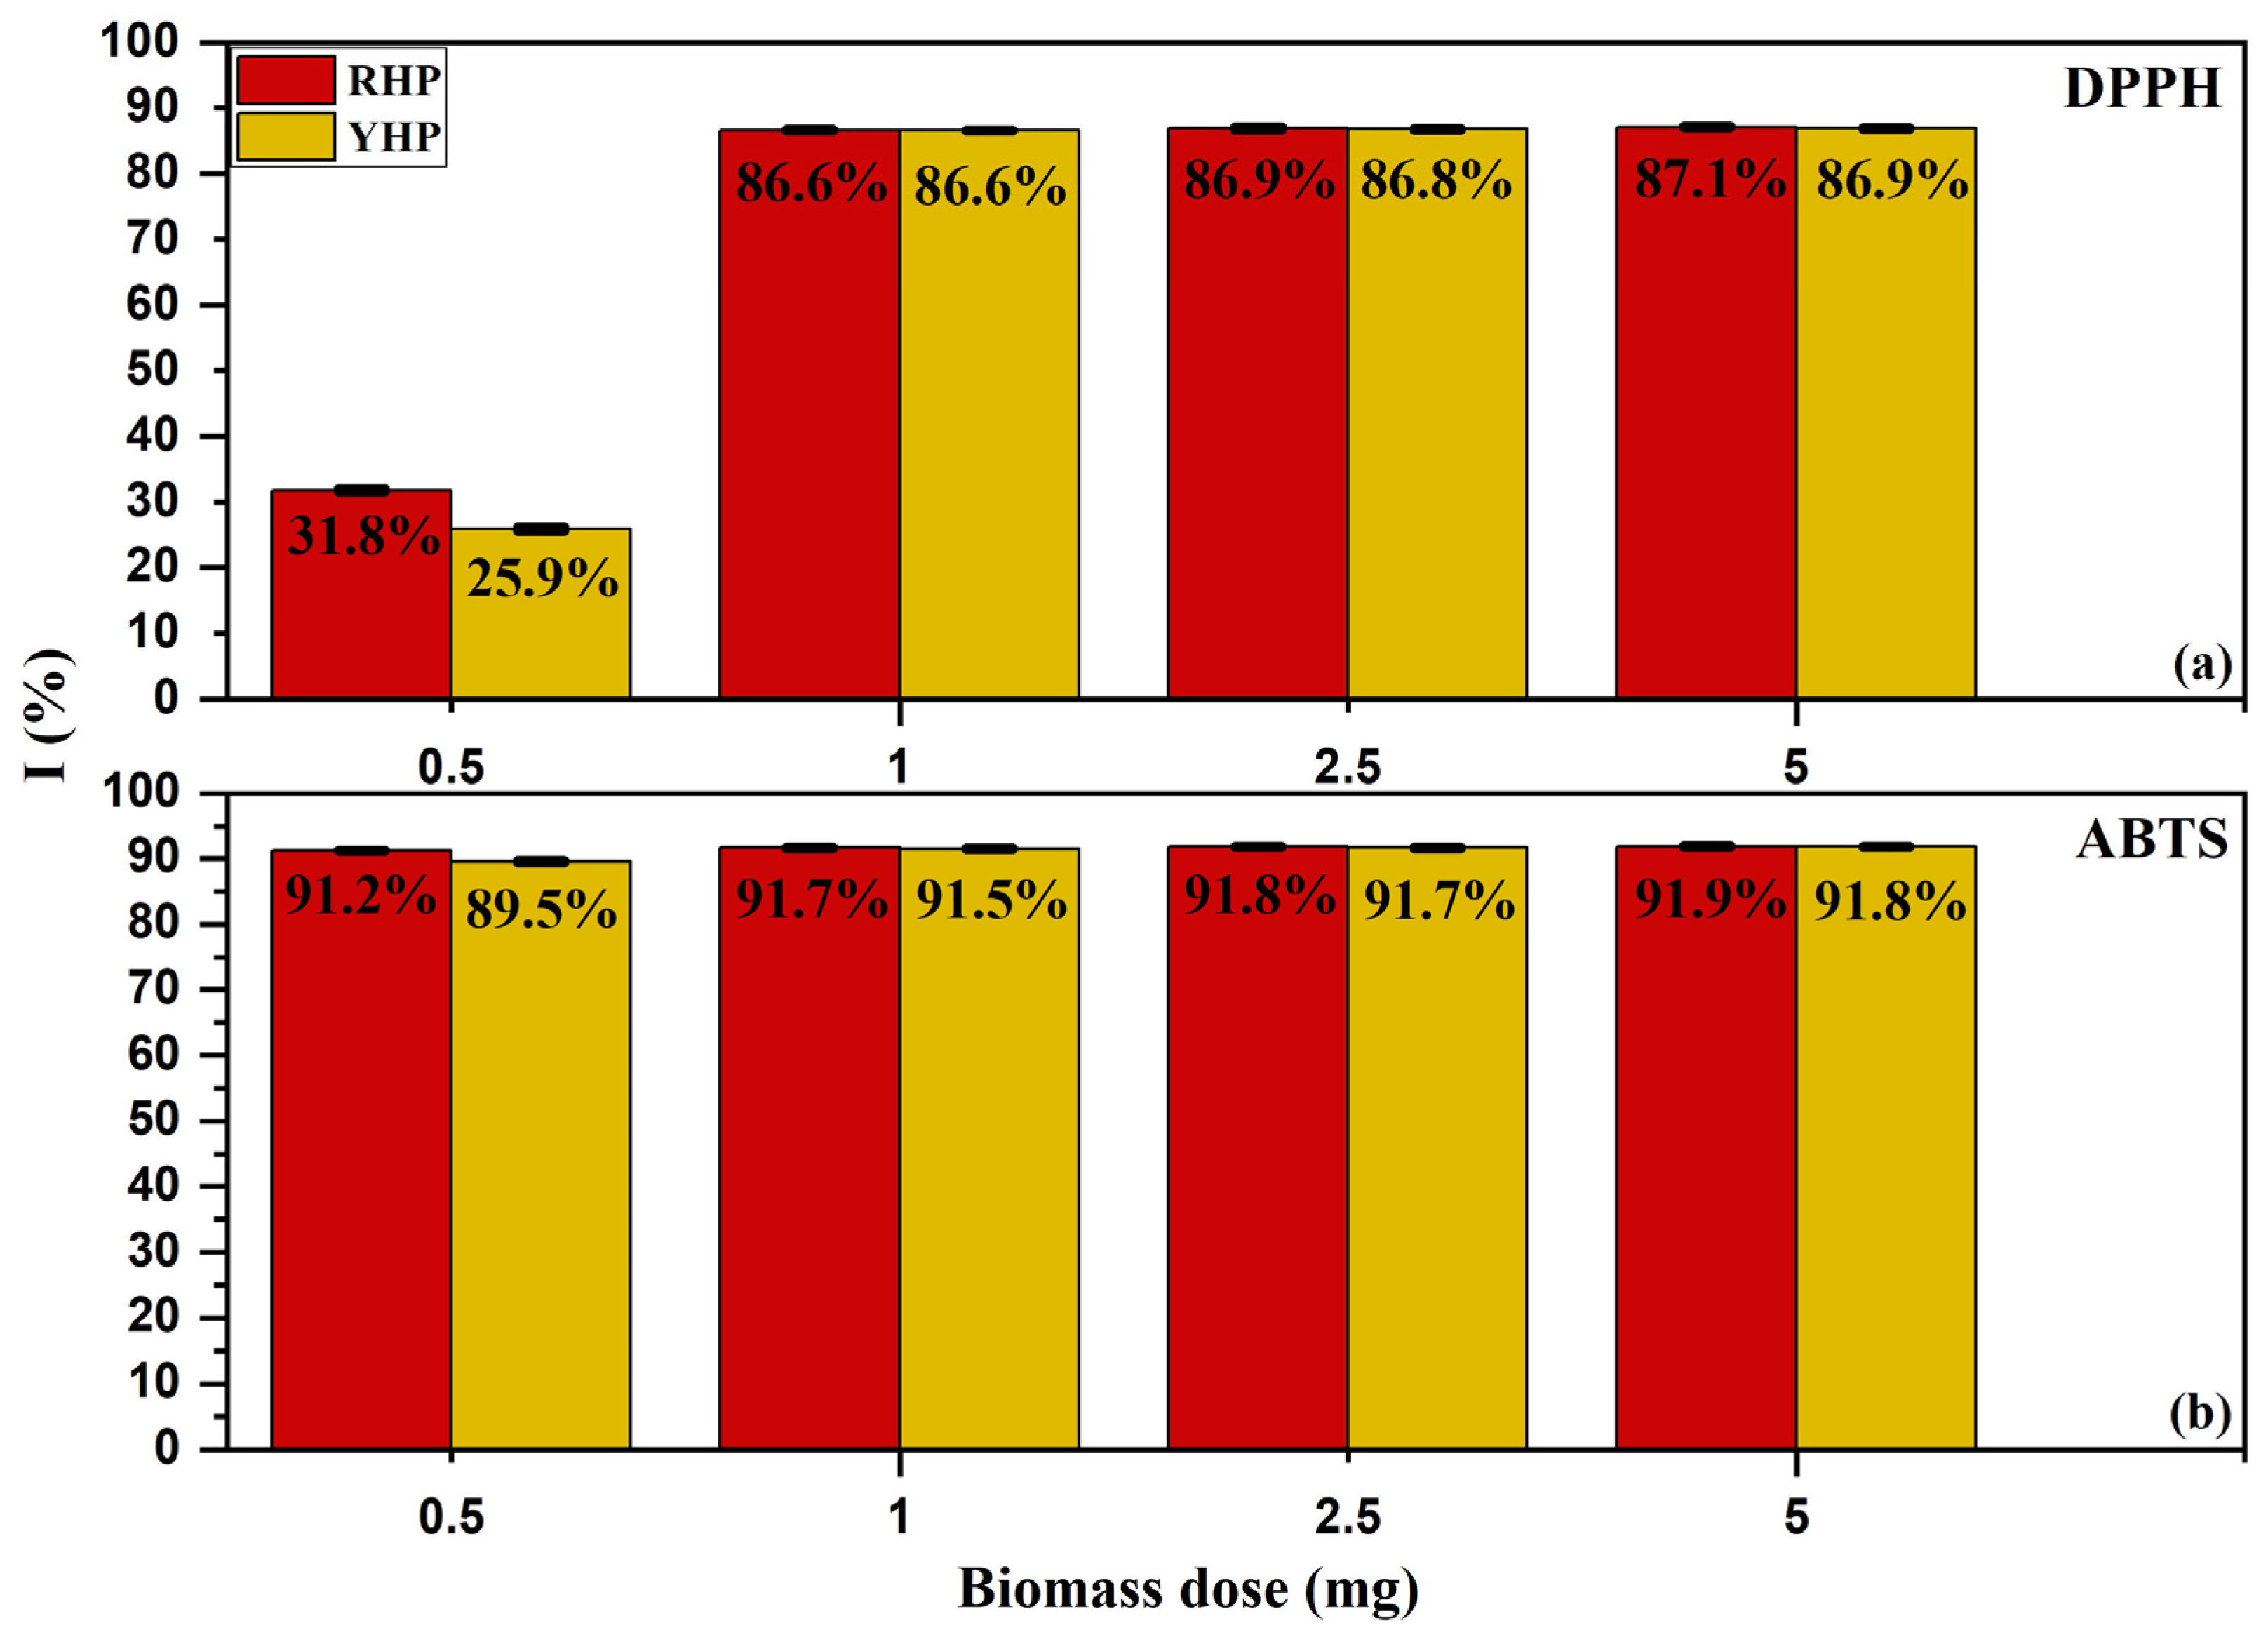
3.2. Quencher-Free Radical Scavenging Activity
3.3. Biosorption Studies
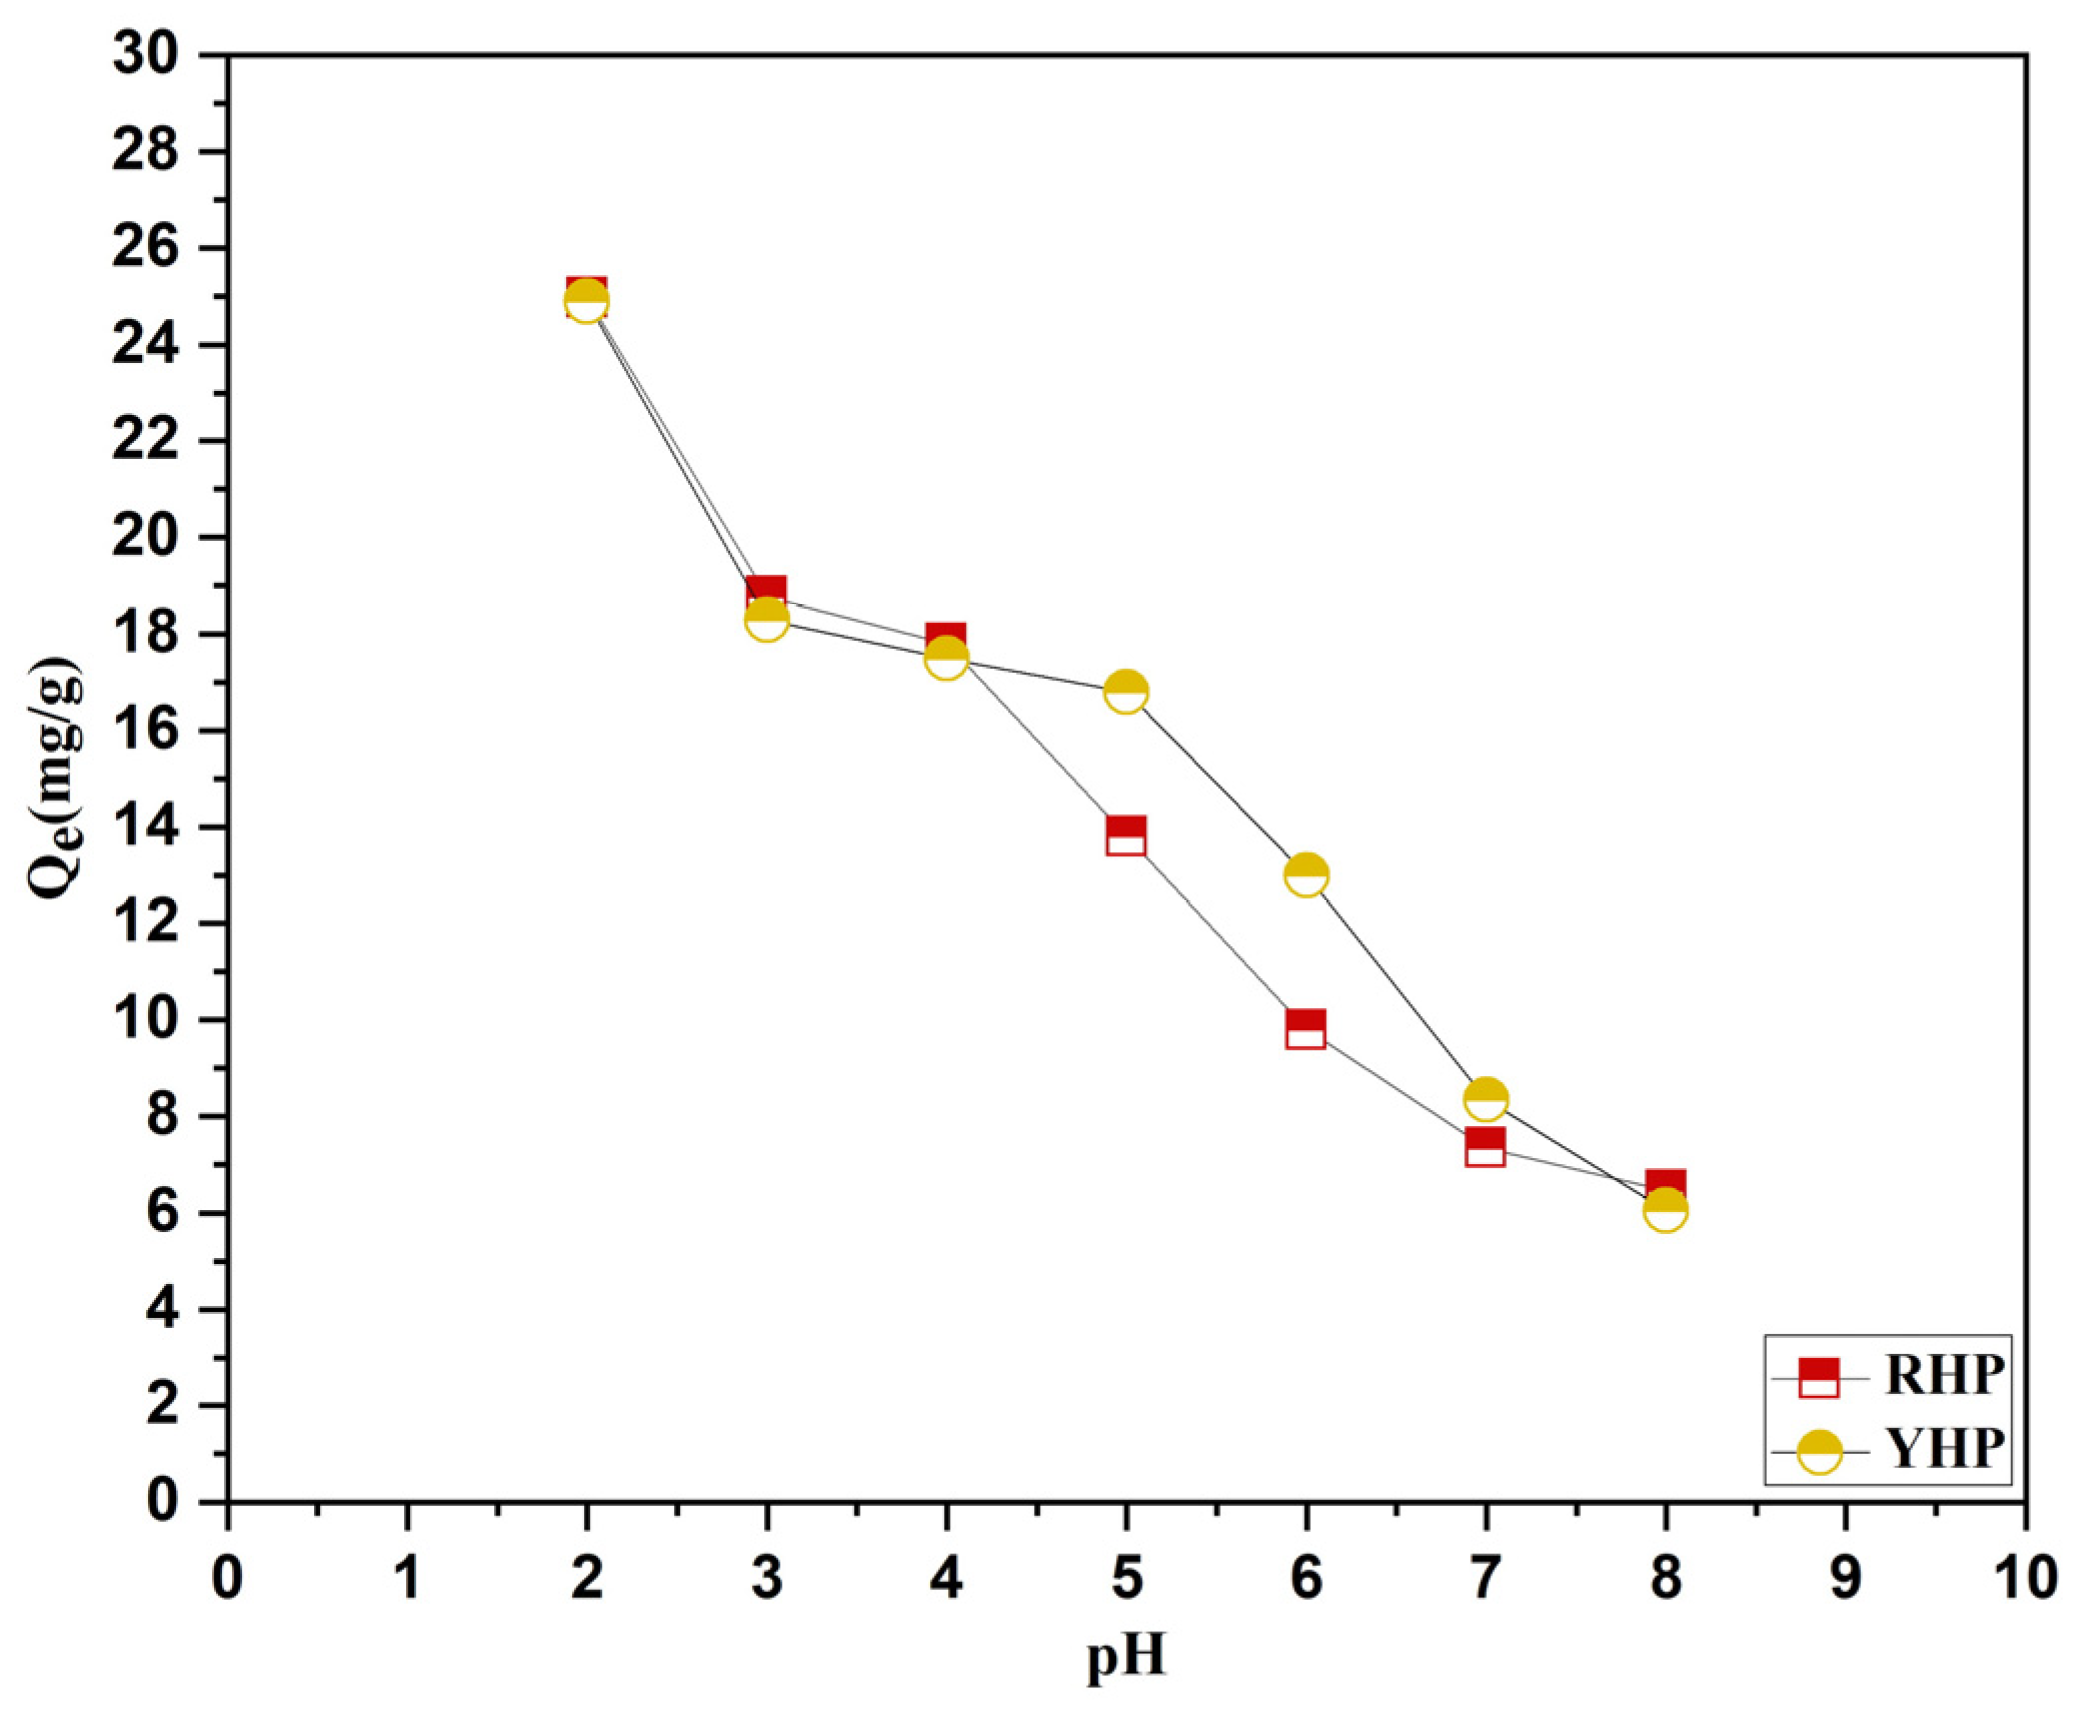
3.3.1. pH Effect
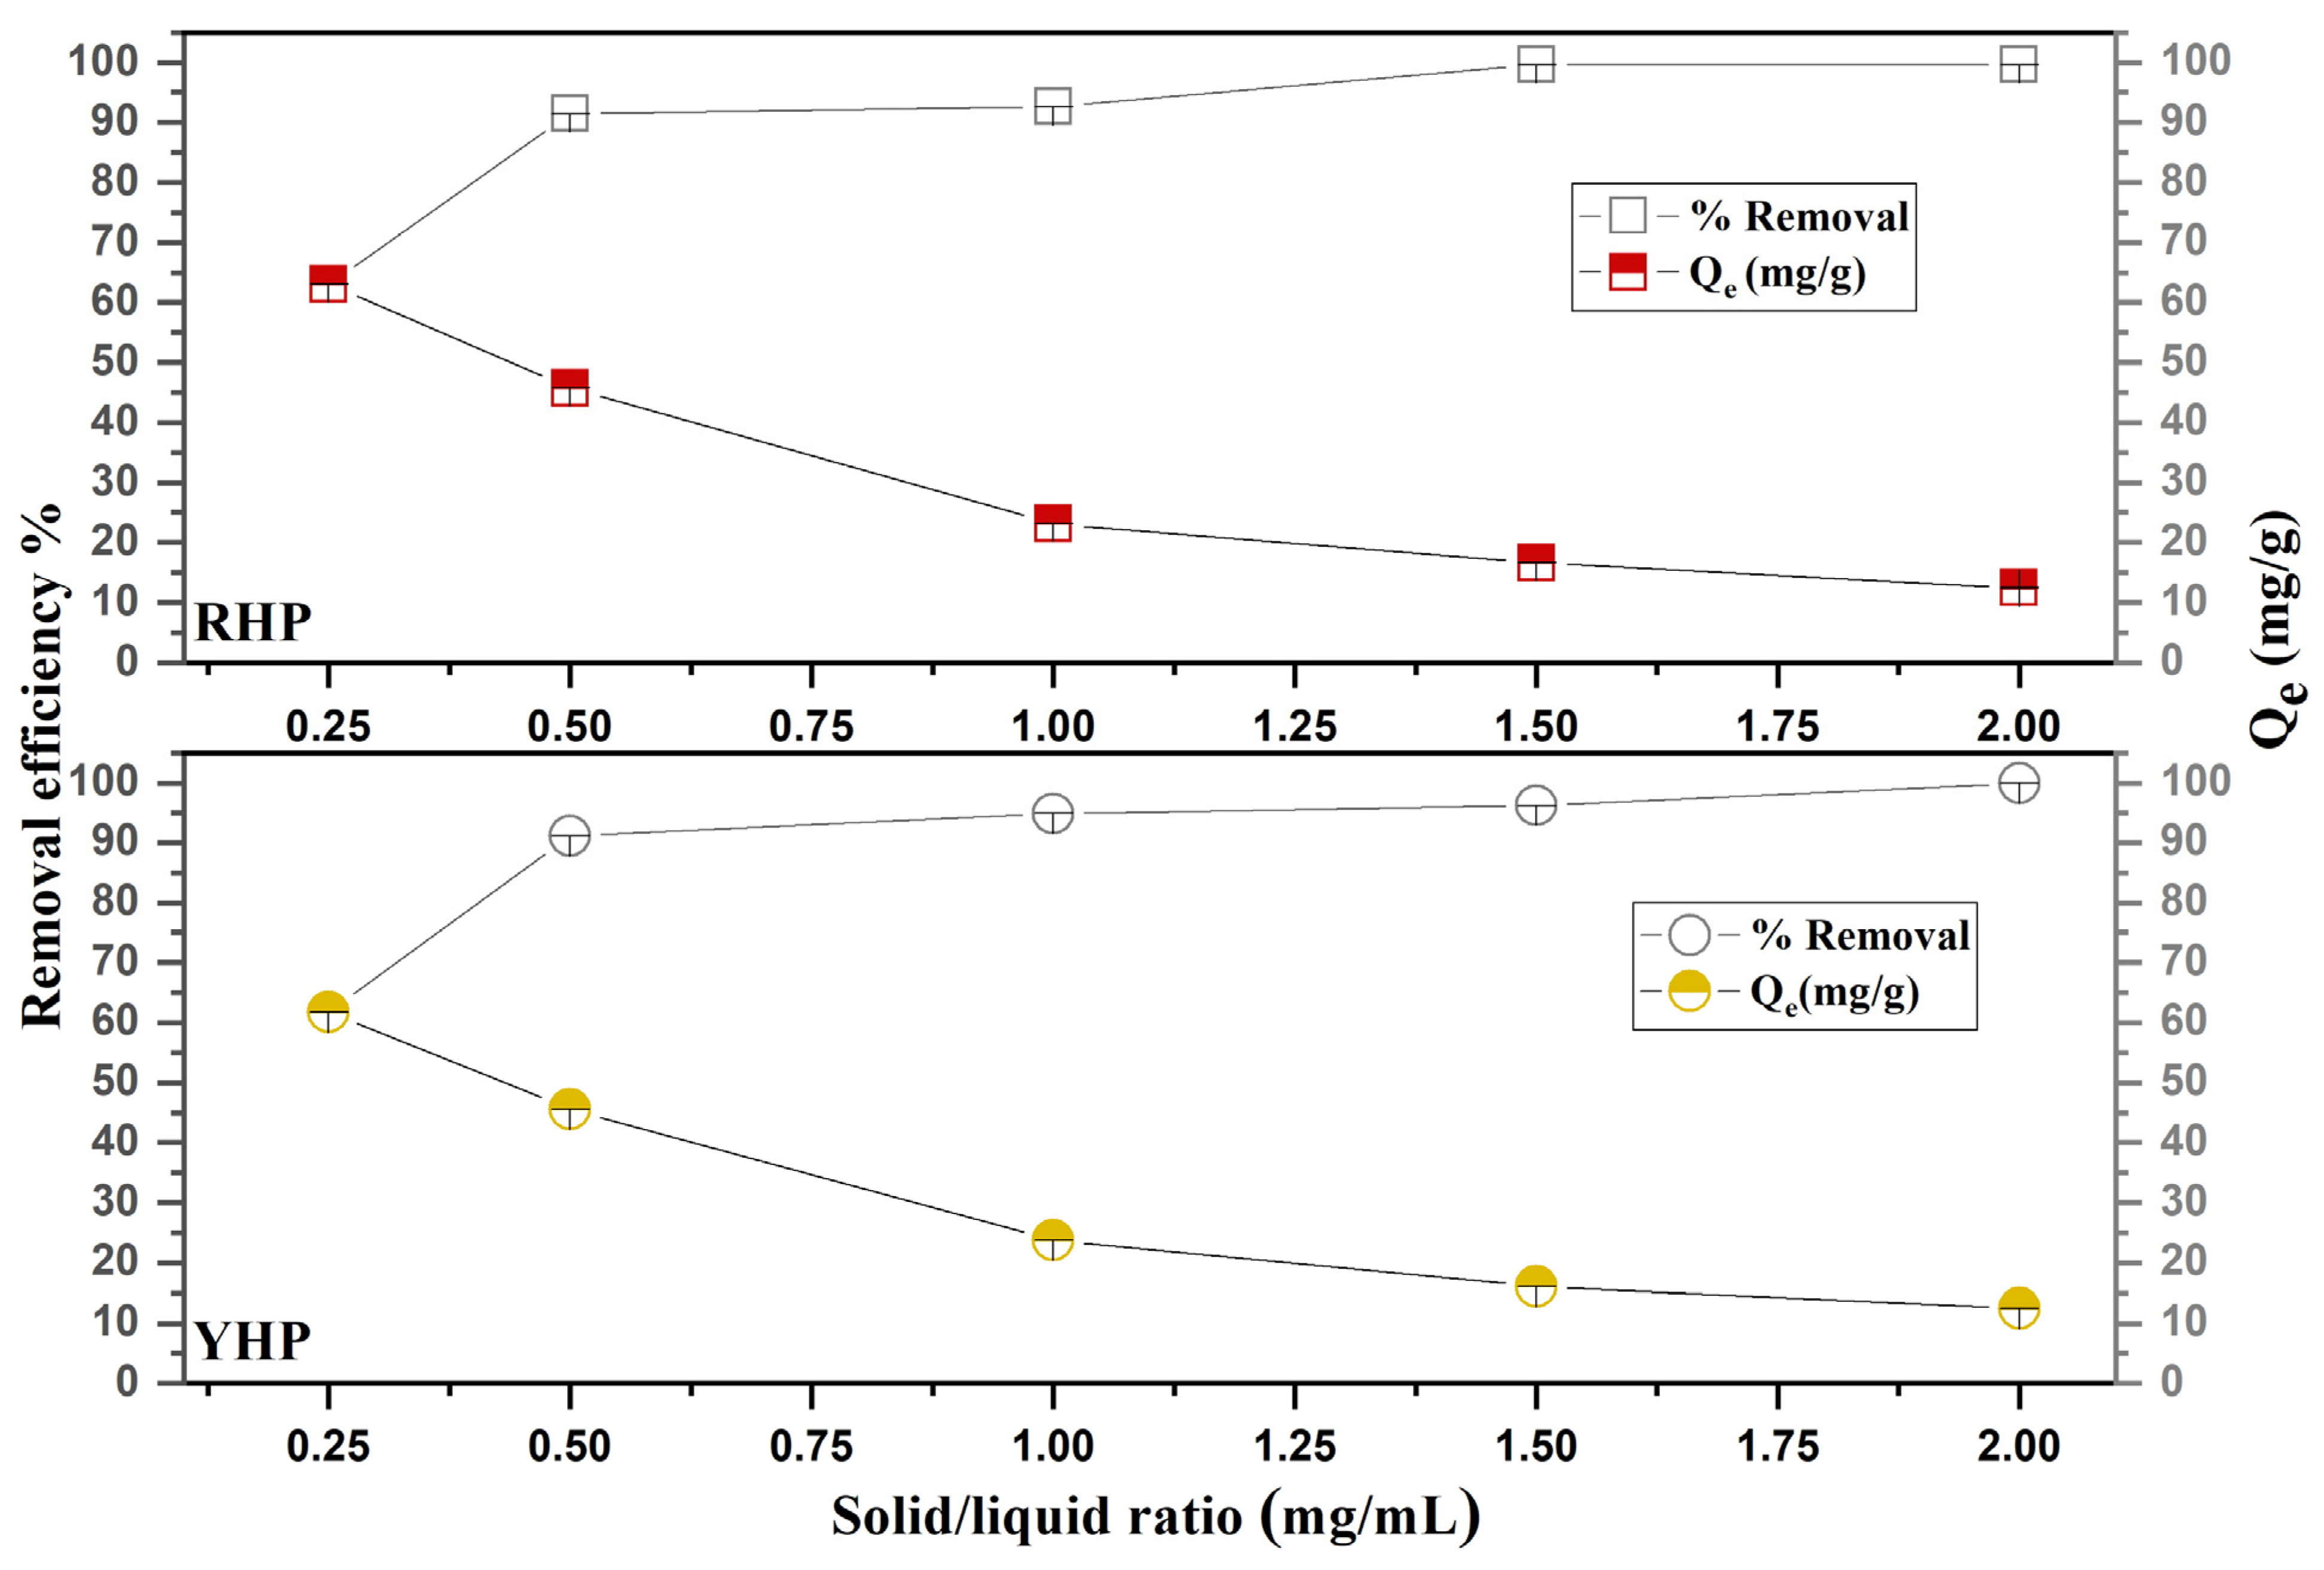
3.3.2. Biosorbent Dose and Solid/Liquid Ratio Effect
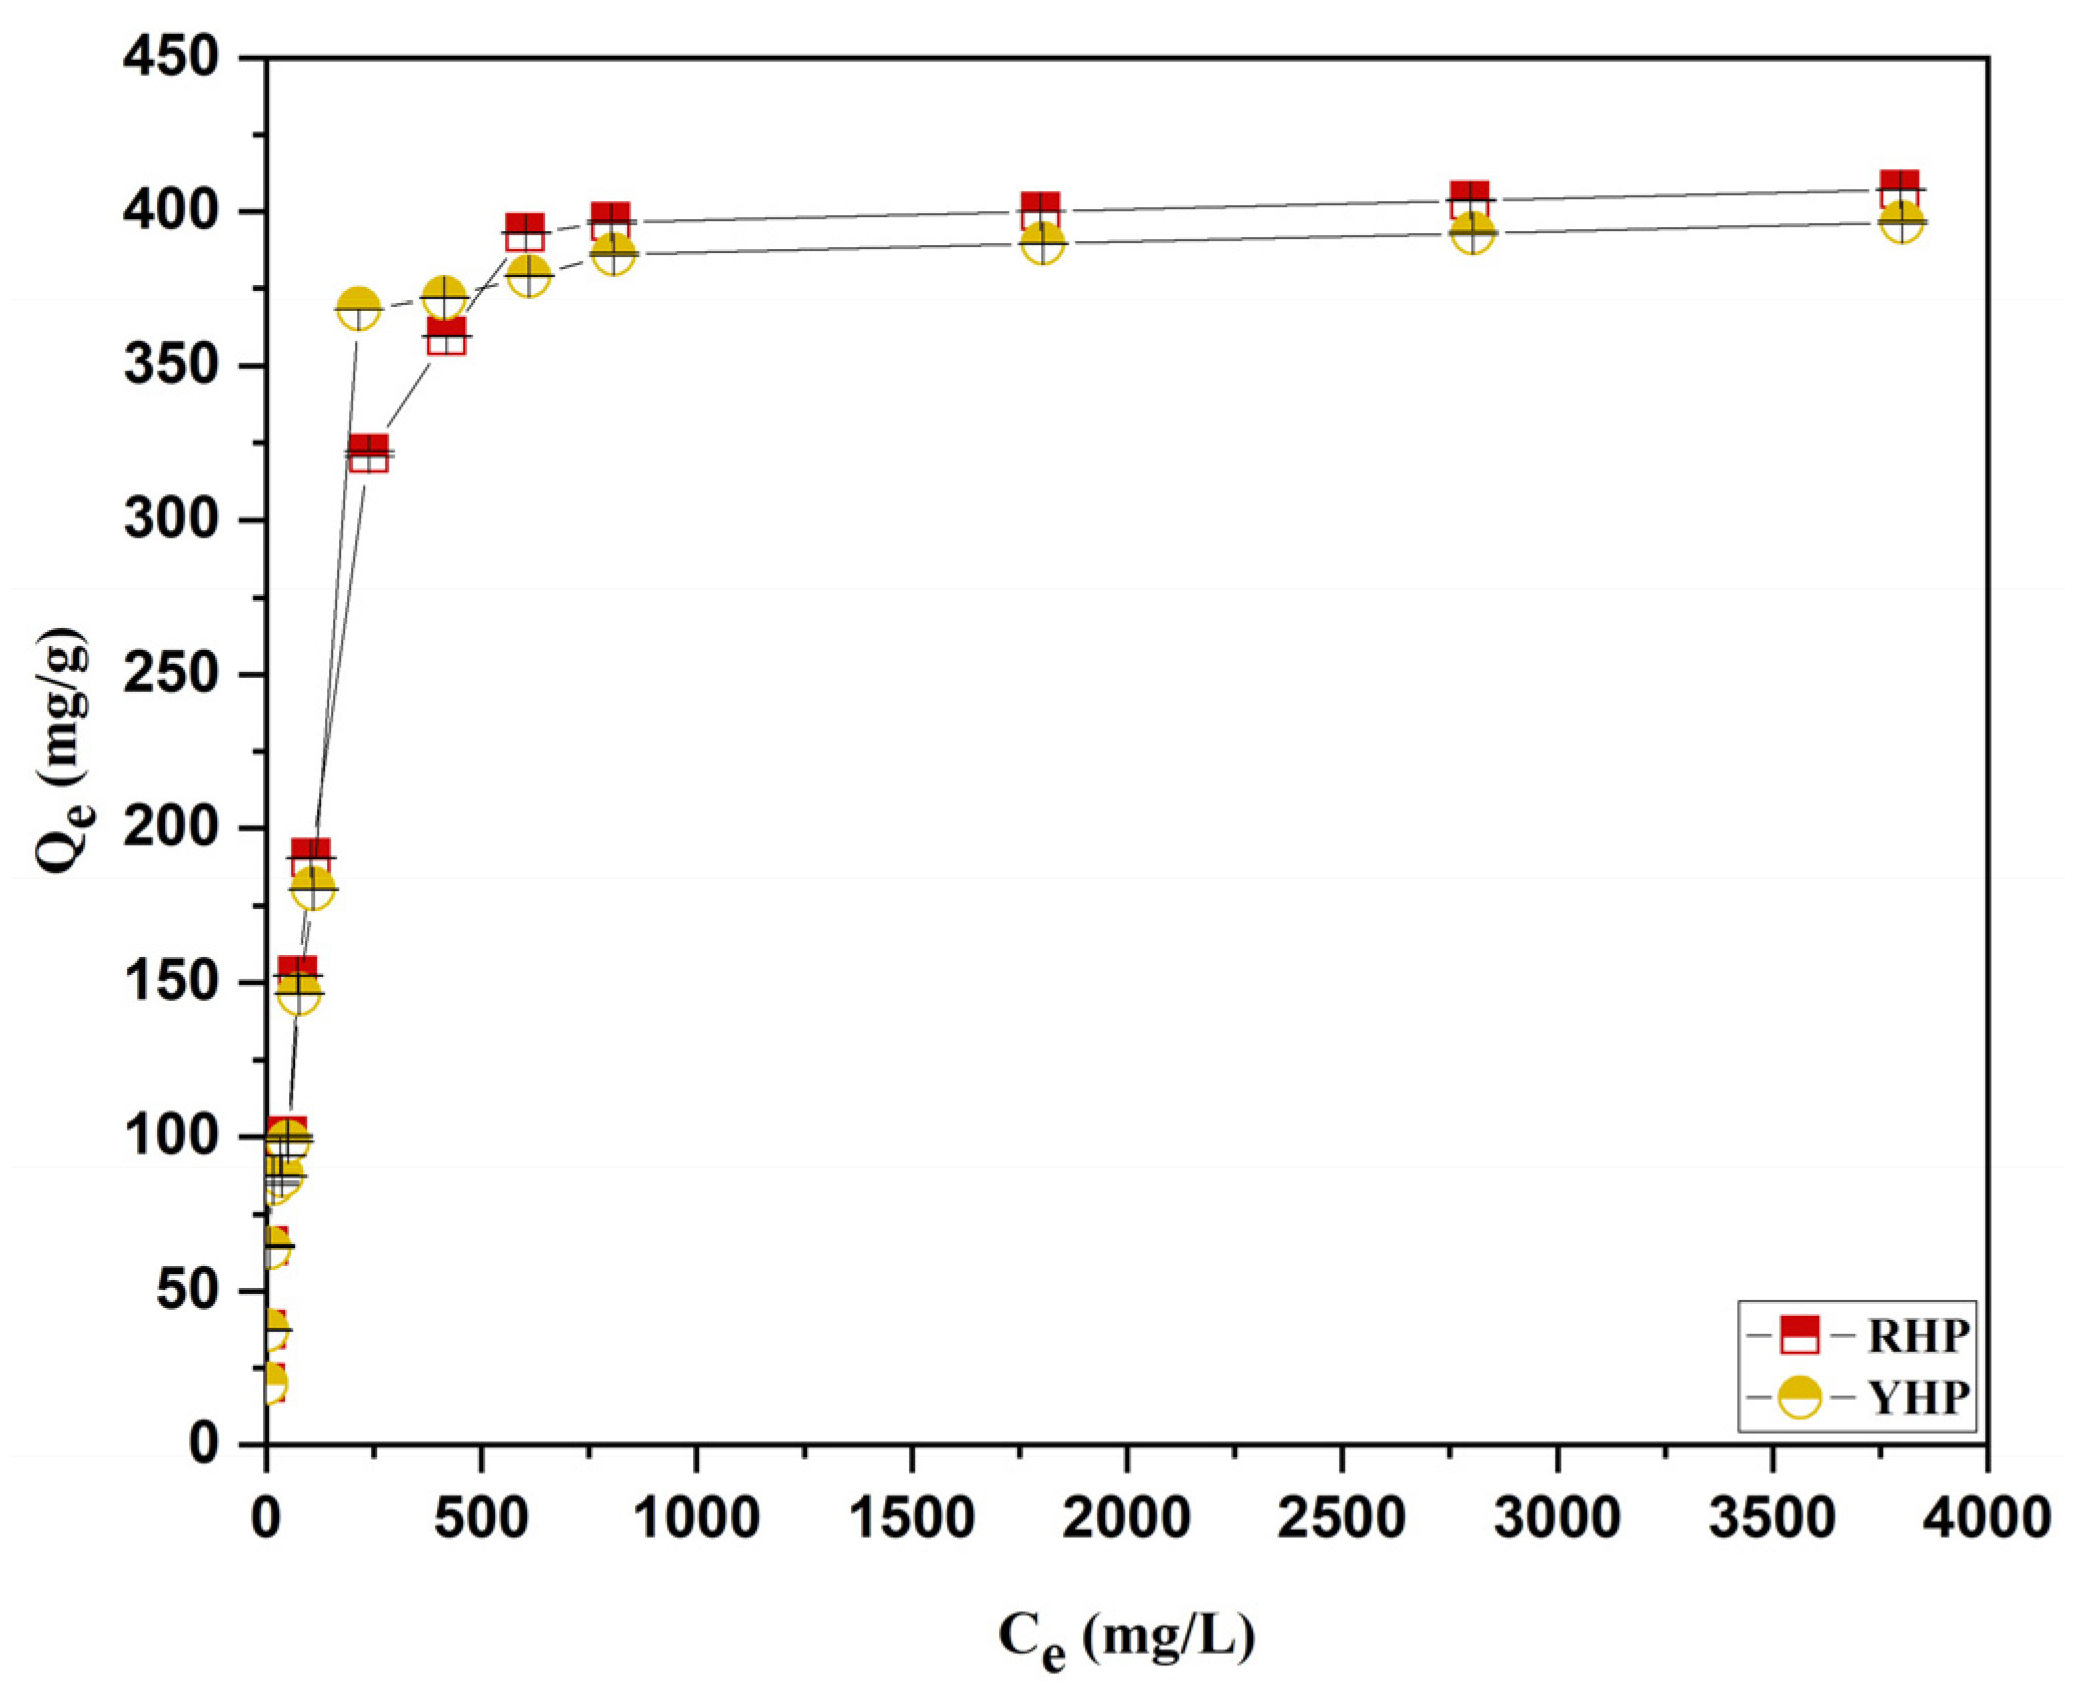
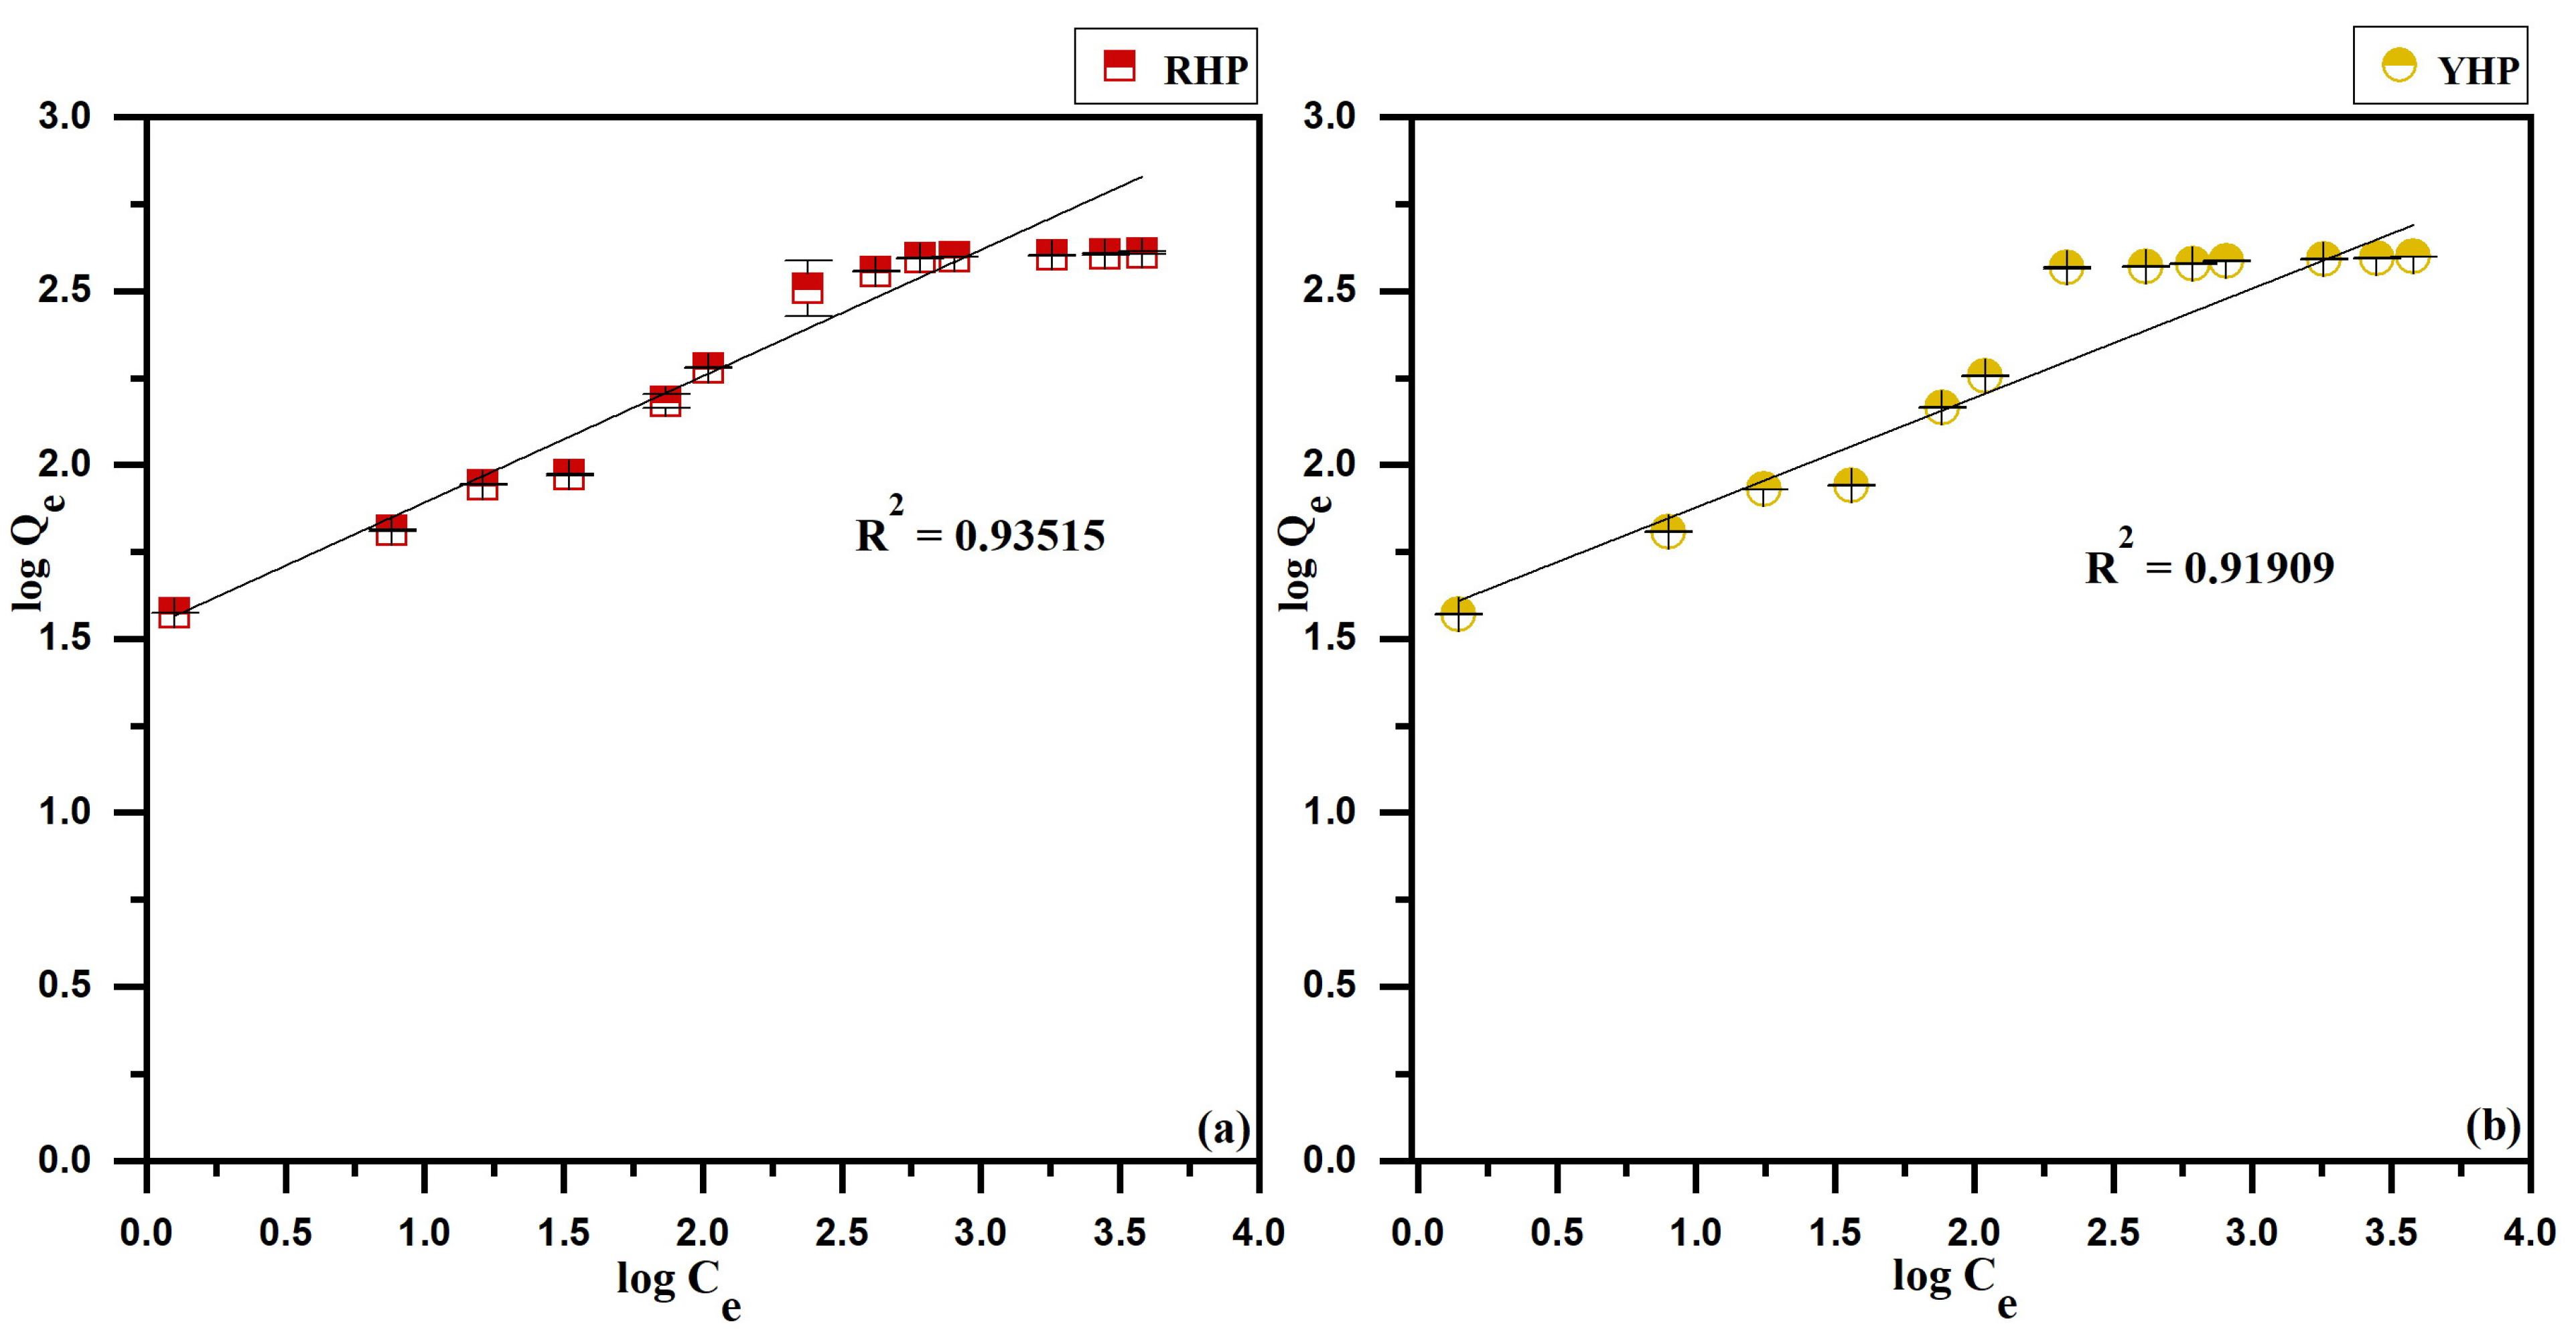
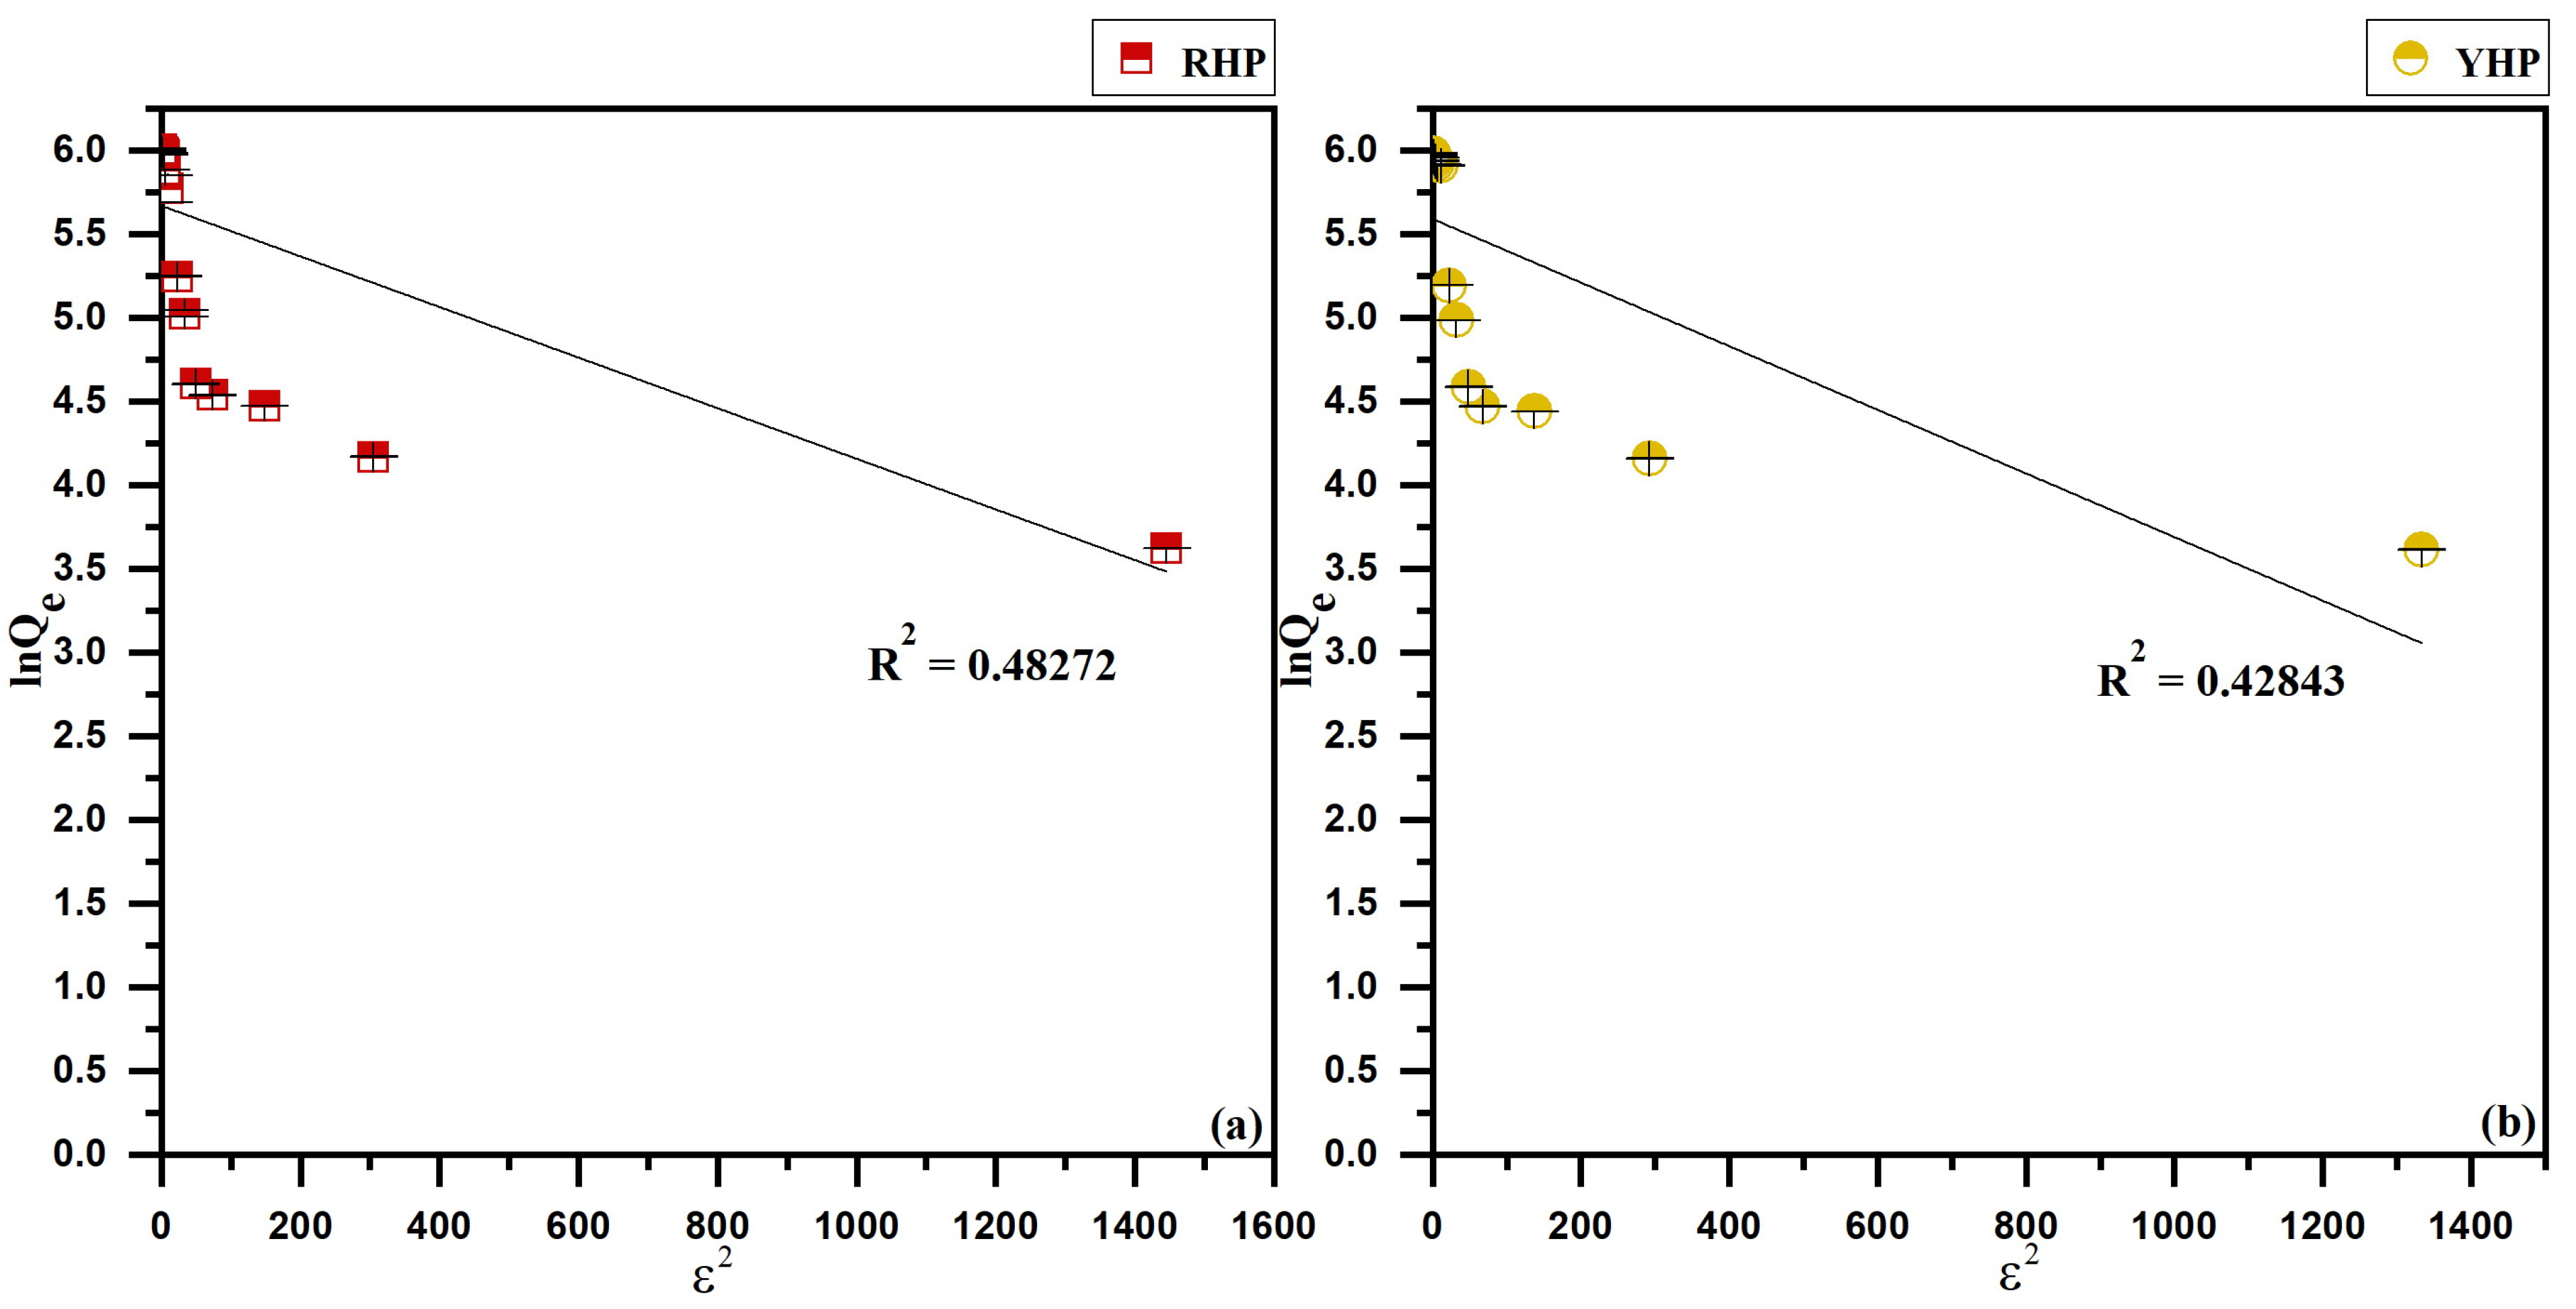
3.4. Isotherms Modeling
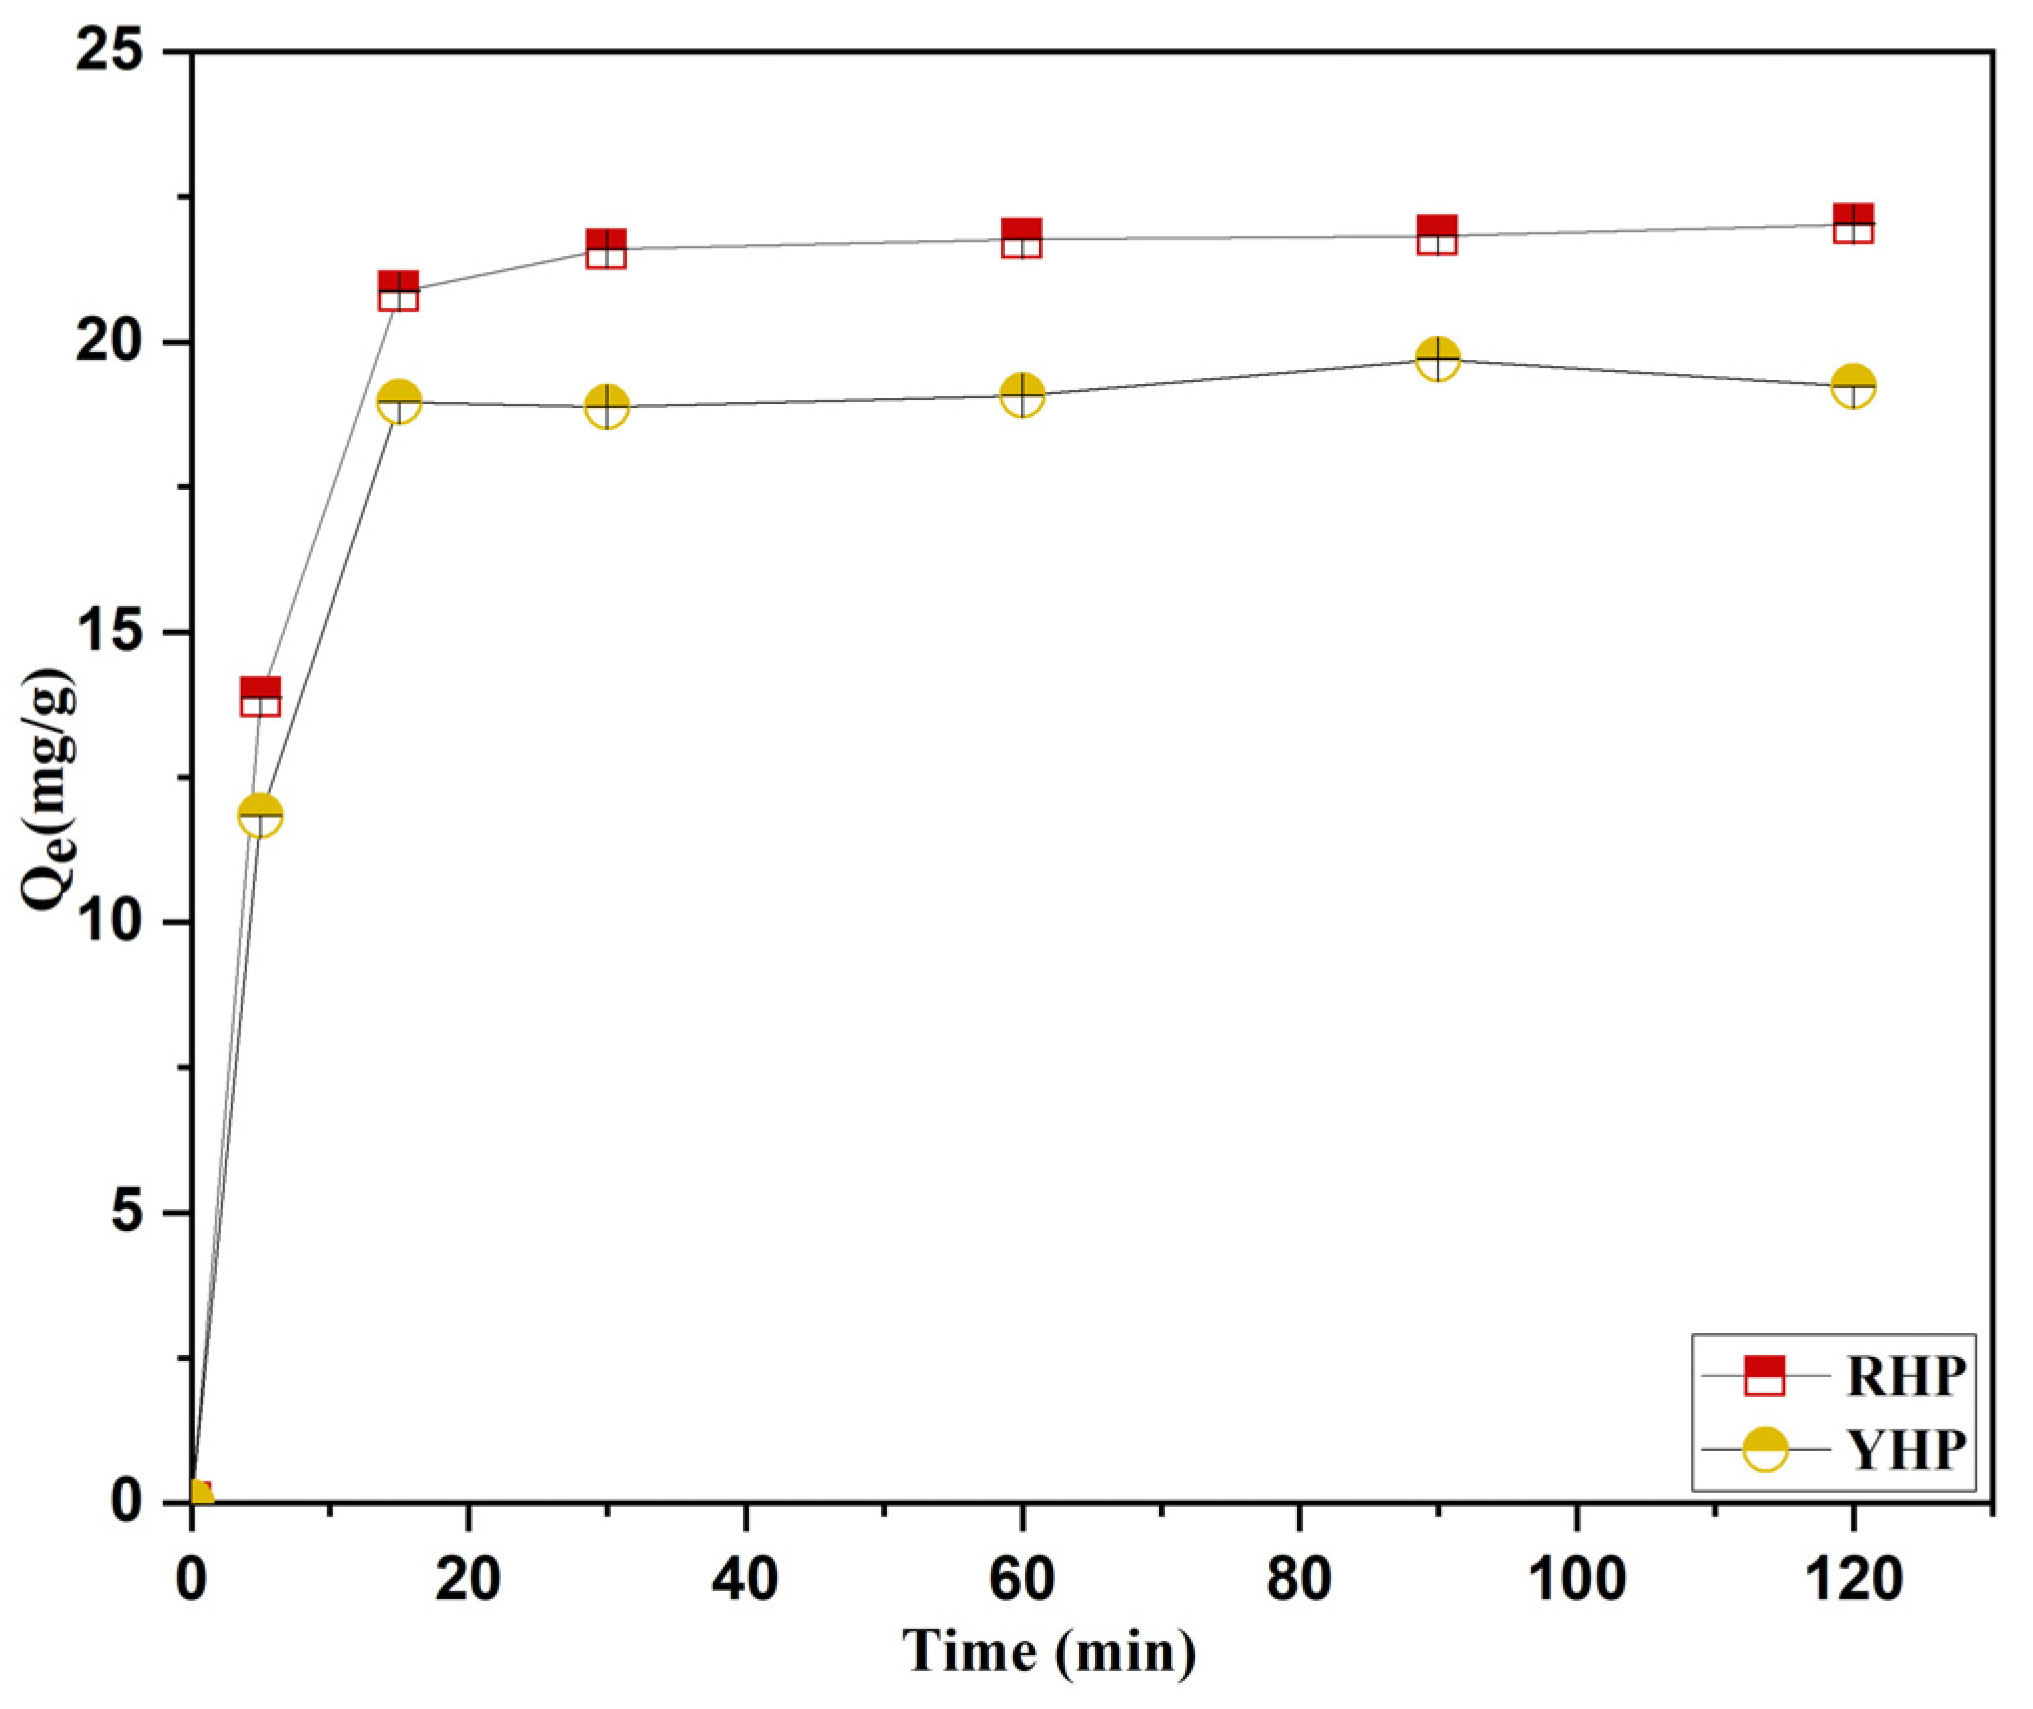
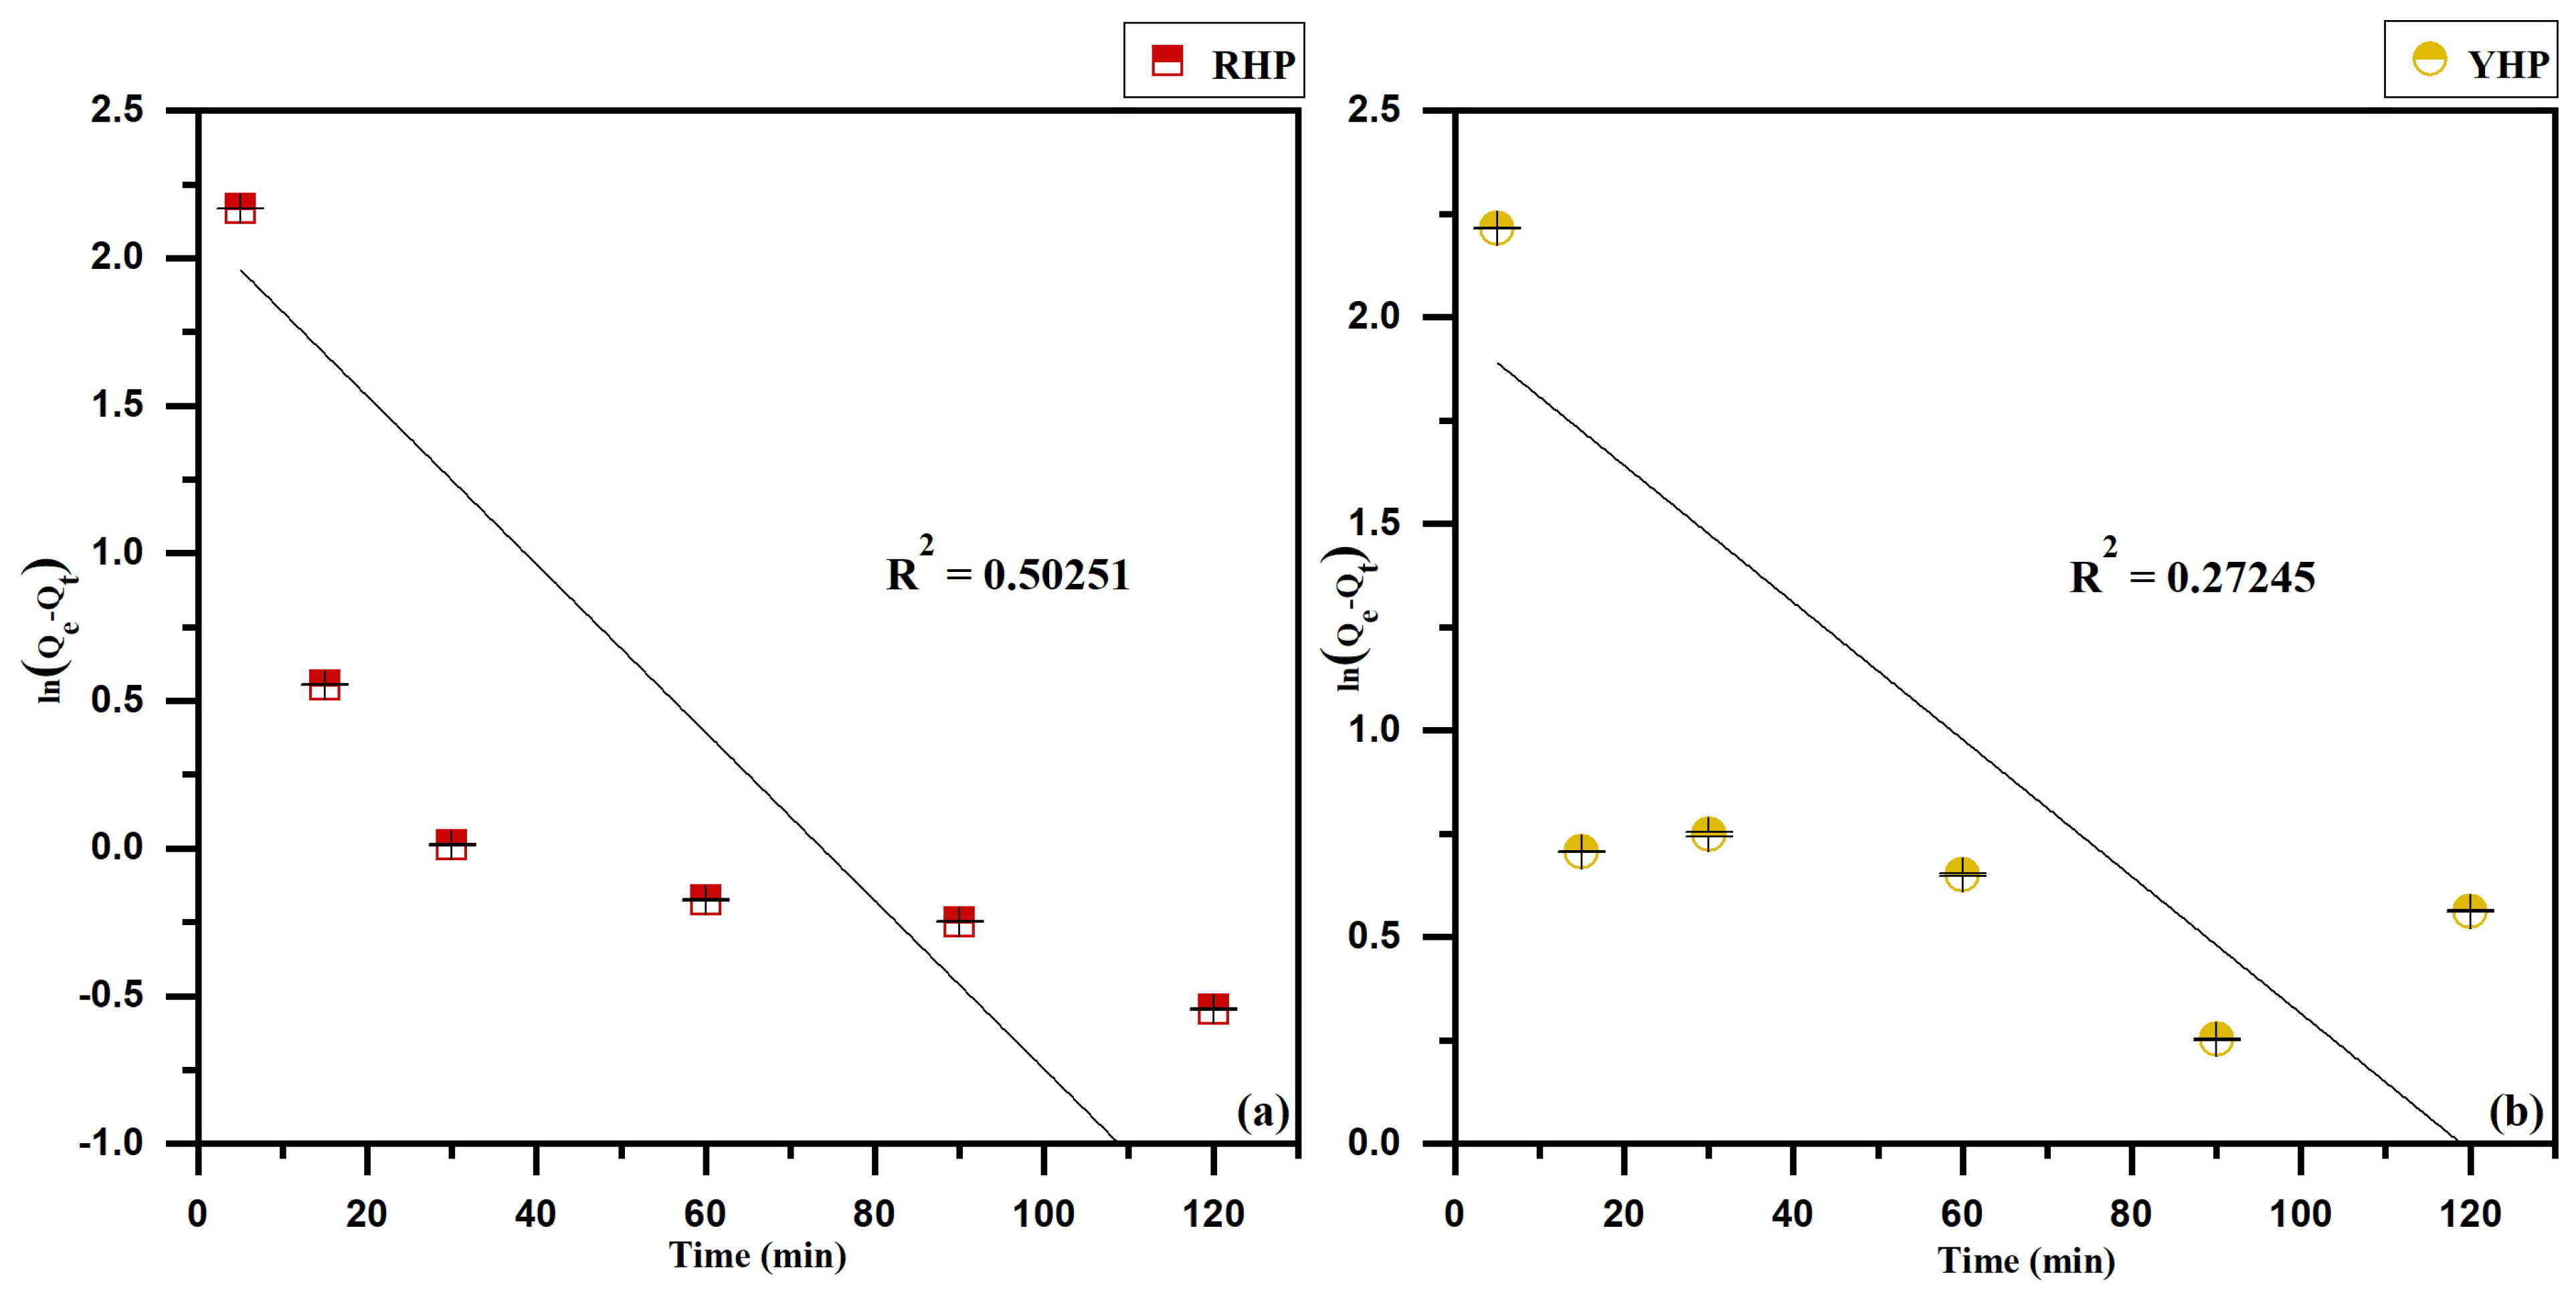
3.5. Kinetics Modeling
4. Discussion
4.1. Biosorbents Characterization
4.2. Quencher-Free Radical Scavenging Activity
4.3. Biosorption Optimization
4.3.1. pH Effect
4.3.2. Biosorbent Dose and Solid/Liquid Ratio Effect
4.4. Biosorption Isotherms
4.5. Biosorption Kinetics
5. Conclusions
Author Contributions
Funding
Data Availability Statement
Acknowledgments
Conflicts of Interest
References
- Mitra, S.; Chakraborty, A.J.; Tareq, A.M.; Emran, T.B.; Nainu, F.; Khusro, A.; Idris, A.M.; Khandaker, M.U.; Osman, H.; Alhumaydhi, F.A.; et al. Impact of Heavy Metals on the Environment and Human Health: Novel Therapeutic Insights to Counter the Toxicity. J. King Saud Univ. Sci. 2022, 34, 101865. [Google Scholar] [CrossRef]
- Zhou, H.; Ouyang, T.; Guo, Y.; Peng, S.; He, C.; Zhu, Z. Assessment of Soil Heavy Metal Pollution and Its Ecological Risk for City Parks, Vicinity of a Landfill, and an Industrial Area within Guangzhou, South China. Appl. Sci. 2022, 12, 9345. [Google Scholar] [CrossRef]
- Pavesi, T.; Moreira, J.C. Mechanisms and Individuality in Chromium Toxicity in Humans. J. Appl. Toxicol. 2020, 40, 1183–1197. [Google Scholar] [CrossRef] [PubMed]
- Yan, G.; Gao, Y.; Xue, K.; Qi, Y.; Fan, Y.; Tian, X.; Wang, J.; Zhao, R.; Zhang, P.; Liu, Y.; et al. Toxicity Mechanisms and Re-mediation Strategies for Chromium Exposure in the Environment. Front. Environ. Sci. 2023, 11, 1131204. [Google Scholar] [CrossRef]
- Shammout, M.; Shatanawi, M.; Awwad, A. Fate and Management of Pollution of Hexavalent Chromium Cr(VI) and Heavy Metals in the Zarqa River Basin in Jordan. J. Ecol. Eng. 2022, 23, 108–115. [Google Scholar] [CrossRef]
- Georgaki, M.N.; Charalambous, M. Toxic Chromium in Water and the Effects on the Human Body: A Systematic Review. J. Water Health 2023, 21, 205–223. [Google Scholar] [CrossRef]
- Shin, D.Y.; Lee, S.M.; Jang, Y.; Lee, J.; Lee, C.M.; Cho, E.-M.; Seo, Y.R. Adverse Human Health Effects of Chromium by Exposure Route: A Comprehensive Review Based on Toxicogenomic Approach. Int. J. Mol. Sci. 2023, 24, 3410. [Google Scholar] [CrossRef]
- Genchi, G.; Lauria, G.; Catalano, A.; Carocci, A.; Sinicropi, M.S. The Double Face of Metals: The Intriguing Case of Chromium. Appl. Sci. 2021, 11, 638. [Google Scholar] [CrossRef]
- Singh, V.; Singh, N.; Verma, M.; Kamal, R.; Tiwari, R.; Sanjay Chivate, M.; Rai, S.N.; Kumar, A.; Singh, A.; Singh, M.P.; et al. Hexavalent-Chromium-Induced Oxidative Stress and the Protective Role of Antioxidants against Cellular Toxicity. Antioxidants 2022, 11, 2375. [Google Scholar] [CrossRef]
- Husain, N.; Mahmood, R. Hexavalent Chromium Induces Reactive Oxygen Species and Impairs the Antioxidant Power of Human Erythrocytes and Lymphocytes: Decreased Metal Reducing and Free Radical Quenching Ability of the Cells. Toxicol. Ind. Health 2017, 33, 623–635. [Google Scholar] [CrossRef]
- Georgaki, M.-N.; Charalambous, M.; Kazakis, N.; Talias, M.A.; Georgakis, C.; Papamitsou, T.; Mytiglaki, C. Chromium in Water and Carcinogenic Human Health Risk. Environments 2023, 10, 33. [Google Scholar] [CrossRef]
- Chen, Y.; Yang, J.; Abbas, A. Enhanced Chromium (VI) Adsorption onto Waste Pomegranate-Peel-Derived Biochar for Wastewater Treatment: Performance and Mechanism. Toxics 2023, 11, 440. [Google Scholar] [CrossRef] [PubMed]
- Environmental Protection Agency (USEPA). National Recommended Water Quality Criteria (4304T); Office of Water, Office of Science and Technology: Washington, DC, USA, 2009. [Google Scholar]
- Environmental Protection Agency (USEPA). Edition of the Drinking Water Standards and Health Advisories; Agency, Office of Water: Washington, DC, USA, 2012. [Google Scholar]
- Peng, X.; Liu, S.; Luo, Z.; Yu, X.; Liang, W. Selective Removal of Hexavalent Chromium by Novel Nitrogen and Sulfur Containing Cellulose Composite: Role of Counter Anions. Materials 2023, 16, 184. [Google Scholar] [CrossRef] [PubMed]
- Kabdaşlı, I.; Tünay, O. Hexavalent Chromium Removal from Water and Wastewaters by Electrochemical Processes: Review. Molecules 2023, 28, 2411. [Google Scholar] [CrossRef] [PubMed]
- Michael Smarte Anekwe, I.; Adedeji, J.; OkiemuteAkpasi, S.; Lewis Kiambi, S. Available Technologies for Wastewater Treatment. In Wastewater Treatment; Ince, M., Kaplan Ince, O., Eds.; IntechOpen: London, UK, 2022; ISBN 978-1-80355-846-2. [Google Scholar] [CrossRef]
- Qasem, N.A.A.; Mohammed, R.H.; Lawal, D.U. Removal of Heavy Metal Ions from Wastewater: A Comprehensive and Critical Review. NPJ Clean Water 2021, 4, 36. [Google Scholar] [CrossRef]
- Antoniadou, M.; Arfanis, M.K.; Ibrahim, I.; Falaras, P. Bifunctional g-C3N4/WO3 Thin Films for Photocatalytic Water Purification. Water 2019, 11, 2439. [Google Scholar] [CrossRef] [Green Version]
- Ibrahim, I.; Belessiotis, G.V.; Arfanis, M.K.; Athanasekou, C.; Philippopoulos, A.I.; Mitsopoulou, C.A.; Romanos, G.E.; Falaras, P. Surfactant Effects on the Synthesis of Redox Bifunctional V2O5 Photocatalysts. Materials 2020, 13, 4665. [Google Scholar] [CrossRef]
- Alhalili, Z. Metal Oxides Nanoparticles: General Structural Description, Chemical, Physical, and Biological Synthesis Methods, Role in Pesticides and Heavy Metal Removal through Wastewater Treatment. Molecules 2023, 28, 3086. [Google Scholar] [CrossRef]
- Benettayeb, A.; Seihoub, F.Z.; Pal, P.; Ghosh, S.; Usman, M.; Chia, C.H.; Usman, M.; Sillanpää, M. Chitosan Nanoparticles as Potential Nano-Sorbent for Removal of Toxic Environmental Pollutants. Nanomaterials 2023, 13, 447. [Google Scholar] [CrossRef]
- Ali, K.; Javaid, M.U.; Ali, Z.; Zaghum, M.J. Biomass-Derived Adsorbents for Dye and Heavy Metal Removal from Wastewater. Adsorp. Sci. Technol. 2021, 2021, 9357509. [Google Scholar] [CrossRef]
- Nguyen, D.T.C.; Tran, T.V.; Kumar, P.S.; Din, A.T.M.; Jalil, A.A.; Vo, D.-V.N. Invasive Plants as Biosorbents for Environmental Remediation: A Review. Environ. Chem. Lett. 2022, 20, 1421–1451. [Google Scholar] [CrossRef]
- Karić, N.; Maia, A.S.; Teodorović, A.; Atanasova, N.; Langergraber, G.; Crini, G.; Ribeiro, A.R.L.; Đolić, M. Bio-Waste Valorisation: Agricultural Wastes as Biosorbents for Removal of (in)Organic Pollutants in Wastewater Treatment. Chem. Eng. J. Adv. 2022, 9, 100239. [Google Scholar] [CrossRef]
- Muhammad, S.; Abdul Khalil, H.P.S.; Abd Hamid, S.; Albadn, Y.M.; Suriani, A.B.; Kamaruzzaman, S.; Mohamed, A.; Allaq, A.A.; Yahya, E.B. Insights into Agricultural-Waste-Based Nano-Activated Carbon Fabrication and Modifications for Wastewater Treatment Application. Agriculture 2022, 12, 1737. [Google Scholar] [CrossRef]
- Lakshmana Naik, R.; Rupas Kumar, M.; Bala Narsaiah, T. Removal of Heavy Metals (Cu & Ni) from Wastewater Using Rice Husk and Orange Peel as Adsorbents. Mater. Today Proced. 2023, 72, 92–98. [Google Scholar] [CrossRef]
- Guevara-Bernal, D.F.; Cáceres Ortíz, M.Y.C.; Gutiérrez Cifuentes, J.A.; Bastos-Arrieta, J.; Palet, C.; Candela, A.M. Coffee Husk and Lignin Revalorization: Modification with Ag Nanoparticles for Heavy Metals Removal and Antifungal Assays. Water 2022, 14, 1796. [Google Scholar] [CrossRef]
- Gryko, K.; Kalinowska, M.; Swiderski, G. The Use of Apple Pomace in Removing Heavy Metals from Water and Sewage. Environ. Sci. Proc. 2021, 9, 24. [Google Scholar] [CrossRef]
- Khan, M.N.; Ullah, H.; Naeem, S.; Uddin, J.; Hamid, Y.; Ahmad, W.; Ding, J. Remediation of Emerging Heavy Metals from Water Using Natural Adsorbent: Adsorption Performance and Mechanistic Insights. Sustainability 2021, 13, 8817. [Google Scholar] [CrossRef]
- Jeyaseelan, C.; Gupta, A. Green Tea Leaves as a Natural Adsorbent for the Removal of Cr(VI) from Aqueous Solutions. Air Soil Water Res. 2016, 9, 13–19. [Google Scholar] [CrossRef] [Green Version]
- Ain, H.B.U.; Tufail, T.; Bashir, S.; Ijaz, N.; Hussain, M.; Ikram, A.; Farooq, M.A.; Saewan, S.A. Nutritional Importance and Industrial Uses of Pomegranate Peel: A Critical Review. Food Sci. Nutr. 2023, 11, 2589–2598. [Google Scholar] [CrossRef] [PubMed]
- Bertolo, M.R.V.; Martins, V.C.A.; Plepis, A.M.G.; Bogusz, S. Utilization of Pomegranate Peel Waste: Natural Deep Eutectic Solvents as a Green Strategy to Recover Valuable Phenolic Compounds. J. Clean. Prod. 2021, 327, 129471. [Google Scholar] [CrossRef]
- Mo, Y.; Ma, J.; Gao, W.; Zhang, L.; Li, J.; Li, J.; Zang, J. Pomegranate Peel as a Source of Bioactive Compounds: A Mini Review on Their Physiological Functions. Front. Nutr. 2022, 9, 887113. [Google Scholar] [CrossRef] [PubMed]
- Smaoui, S.; Hlima, H.B.; Mtibaa, A.C.; Fourati, M.; Sellem, I.; Elhadef, K.; Ennouri, K.; Mellouli, L. Pomegranate Peel as Phenolic Compounds Source: Advanced Analytical Strategies and Practical Use in Meat Products. Meat Sci. 2019, 158, 107914. [Google Scholar] [CrossRef] [PubMed]
- El-Hadary, A.E.; Taha, M. Pomegranate Peel Methanolic-extract Improves the Shelf-life of Edible-oils under Accelerated Oxidation Conditions. Food Sci.Nutr. 2020, 8, 1798–1811. [Google Scholar] [CrossRef] [PubMed]
- Abed, L.; Belattar, N. Polyphenols Content, Chelating Propertiesand Adsorption Isotherms and Kinetics of Redand Yellow Pomegranate Peels (Punica Granatum L.) Towards Lead (II). Pol. J. Environ. Stud. 2022, 31, 5765–5779. [Google Scholar] [CrossRef]
- Lace, A.; Ryan, D.; Bowkett, M.; Cleary, J. Chromium Monitoring in Water by Colorimetry Using Optimised 1,5-Diphenylcarbazide Method. Int. J. Environ. Res. Public Health 2019, 16, 1803. [Google Scholar] [CrossRef] [Green Version]
- Ferslew, K.E.; Nicolaides, A.N.; Robert, T.A. Determination of Chromate Adulteration of Human Urine by Automated Colorimetric and Capillary Ion Electrophoretic Analyses. J. Anal. Toxicol. 2003, 27, 36–39. [Google Scholar] [CrossRef] [Green Version]
- Gökmen, V.; Serpen, A.; Fogliano, V. Direct Measurement of the Total Antioxidant Capacity of Foods: The ‘QUENCHER’ Approach. Trends Food Sci. Technol. 2009, 20, 278–288. [Google Scholar] [CrossRef]
- Condezo-Hoyos, L.; Abderrahim, F.; Arriba, S.M.; Carmen González, M. A Novel, Micro, Rapid and Direct Assay to Assess Total Antioxidant Capacity of Solid Foods. Talanta 2015, 138, 108–116. [Google Scholar] [CrossRef]
- Blois, M. Antioxidant Determinations by the Use of a Stable Free Radical. Nature 1958, 181, 1199–1200. [Google Scholar] [CrossRef]
- Re, R.; Pellegrini, N.; Proteggente, A.; Pannala, A.; Yang, M.; Rice-Evans, C. Antioxidant Activity Applying an Improved ABTS Radical Cation Decolorization Assay. Free Radic. Biol. Med. 1999, 26, 1231–1237. [Google Scholar] [CrossRef]
- Langmuir, I. The Adsorption of Gases on Plane Surfaces of Glass, Mica and Platinum. J. Am. Chem. Soc. 1918, 40, 1361–1403. [Google Scholar] [CrossRef] [Green Version]
- Freundlich, H. Über die Struktur der Kolloidteilchen und über den Aufbau von Solen und Gelen. Berichte Dtsch. Chem. Ges. A/B 1928, 61, 2219–2233. [Google Scholar] [CrossRef]
- Dubinin, M.M. The Potential Theory of Adsorption of Gases and Vapors for Adsorbents with Energetically Nonuniform Surfaces. Chem. Rev. 1960, 60, 235–241. [Google Scholar] [CrossRef]
- Weber, T.W.; Chakravorti, R.K. Pore and Solid Diffusion Models for Fixed-Bed Adsorbers. AIChE J. 1974, 20, 228–238. [Google Scholar] [CrossRef]
- Abin-Bazaine, A.; Campos Trujillo, A.; Olmos-Marquez, M. Adsorption Isotherms: Enlightenment of the Phenomenon of Adsorption. In Wastewater Treatment; Ince, M., Kaplan Ince, O., Eds.; IntechOpen: London, UK, 2022; ISBN 978-1-80355-846-2. [Google Scholar] [CrossRef]
- Lagergren, S. Zur Theorie der Sogenannten Adsorption GelösterStoffe. K. Sven. Vetensk. Handl. 1898, 24, 1–39. [Google Scholar]
- Ho, Y.S.; McKay, G. Pseudo-Second Order Model for Sorption Processes. Process Biochem. 1999, 34, 451–465. [Google Scholar] [CrossRef]
- Low, M.J.D. Kinetics of Chemisorption of Gases on Solids. Chem. Rev. 1960, 60, 267–312. [Google Scholar] [CrossRef]
- Chien, S.H.; Clayton, W.R. Application of Elovich Equation to the Kinetics of Phosphate Release and Sorption in Soils. Soil Sci. Soc. Am. J. 1980, 44, 265–268. [Google Scholar] [CrossRef]
- Cordova Estrada, A.K.; Cordova Lozano, F.; Lara Díaz, R.A. Thermodynamics and Kinetic Studies for the Adsorption Process of Methyl Orange by Magnetic Activated Carbons. Air Soil Water Res. 2021, 14, 11786221211013336. [Google Scholar] [CrossRef]
- Larkin, P.J. General Outline for IR and Raman Spectral Interpretation. In Infrared and Raman Spectroscopy; Elsevier: Amsterdam, The Netherlands, 2018; pp. 135–151. ISBN 978-0-12-804162-8. [Google Scholar] [CrossRef]
- Mekhamer, W.; Al-Tamimi, S. Removal of Ciprofloxacin from Simulated Wastewater by Pomegranate Peels. Environ. Sci.Pollut. Res. 2019, 26, 2297–2304. [Google Scholar] [CrossRef] [PubMed]
- Saadi, W.; Rodríguez-Sánchez, S.; Ruiz, B.; Najar-Souissi, S.; Ouederni, A.; Fuente, E. From Pomegranate Peels Waste to One-Step Alkaline Carbonate Activated Carbons. Prospect as Sustainable Adsorbent for the Renewable Energy Production. J. Environ. Chem. Eng. 2022, 10, 107010. [Google Scholar] [CrossRef]
- M Khairy, G.; Hesham, A.M.; Jahin, H.E.S.; El-Korashy, S.A.; Mahmoud Awad, Y. Green Synthesis of a Novel Eco-Friendly Hydrochar from Pomegranate Peels Loaded with Iron Nanoparticles for the Removal of Copper Ions and Methylene Blue from Aqueous Solutions. J. Mol. Liq. 2022, 368, 120722. [Google Scholar] [CrossRef]
- Jawad, A.H.; Sauodi, M.; Mastuli, M.S.; Aouda, M.; Radzun, K. Pomegranate peels collected from fresh juice shop as a renewable precursor for high surface area activated carbon with potential application for methylene blue adsorption. Desalin. Water Treat. 2018, 124, 287–296. [Google Scholar] [CrossRef] [Green Version]
- Abbach, W.; Laghlimi, C.; Isaad, J. Simultaneous adsorption of cationic and anionic dyes by raw pomegranate peel: Modelling of equilibrium, kinetical and thermodynamical studies. Mor. J. Chem. 2023, 11, 832–853. [Google Scholar] [CrossRef]
- Ahmed, E.; Zeitoun, A.; Hamad, G.; Zeitoun, M.A.M.; Taha, A.; Korma, S.A.; Esatbeyoglu, T. Lignocellulosic Biomasses from Agricultural Wastes Improved the Quality and Physicochemical Properties of Frying Oils. Foods 2022, 11, 3149. [Google Scholar] [CrossRef]
- Sing, K.S.W. Reporting physisorption data for gas/solid systems with special reference to the determination of surface area and porosity (Recommendations 1984). Pure Appl. Chem. 1985, 57, 603–619. [Google Scholar] [CrossRef]
- Jawad, A.H.; Waheeb, A.S.; Abd Rashid, R.; Nawawi, W.I.; Yousif, E. Equilibrium isotherms, kinetics, and thermodynamics studies of methylene blue adsorption on pomegranate (Punica granatum) peels as a natural low-cost biosorbent. Desalin. Water Treat. 2018, 105, 322–331. [Google Scholar] [CrossRef] [Green Version]
- Akkari, I.; Graba, Z.; Bezzi, N.; Merzeg, F.A.; Bait, N.; Ferhati, A. Raw pomegranate peel as promise efficient biosorbent for the removal of Basic Red 46 dye: Equilibrium, kinetic, and thermodynamic studies. Biomass Conv. Bioref. 2023, 13, 8047–8060. [Google Scholar] [CrossRef]
- Salam, F.A.; Narayanan, A. Biosorption—A Case Study of Hexavalent Chromium Removal with Raw Pomegranate Peel. Desalin. Water Treat. 2019, 156, 278–291. [Google Scholar] [CrossRef] [Green Version]
- Cruz-Lopes, L.; Macena, M.; Esteves, B.; Santos-Vieira, I. Lignocellulosic Materials Used as Biosorbents for the Capture of Nickel (II) in Aqueous Solution. Appl. Sci. 2022, 12, 933. [Google Scholar] [CrossRef]
- Esmaeili Bidhendi, M.; Poursorkh, Z.; Sereshti, H.; Rashidi Nodeh, H.; Rezania, S.; Afzal Kamboh, M. Nano-Size Biomass Derived from Pomegranate Peel for Enhanced Removal of Cefixime Antibiotic from Aqueous Media: Kinetic, Equilibrium and Thermodynamic Study. Int. J. Environ. Res. Public Health 2020, 17, 4223. [Google Scholar] [CrossRef]
- Chen, J.; Yang, J.; Ma, L.; Li, J.; Shahzad, N.; Kim, C.K. Structure-Antioxidant Activity Relationship of Methoxy, Phenolic Hydroxyl, and Carboxylic Acid Groups of Phenolic Acids. Sci. Rep. 2020, 10, 2611. [Google Scholar] [CrossRef] [PubMed] [Green Version]
- Platzer, M.; Kiese, S.; Tybussek, T.; Herfellner, T.; Schneider, F.; Schweiggert-Weisz, U.; Eisner, P. Radical Scavenging Mechanisms of Phenolic Compounds: A Quantitative Structure-Property Relationship (QSPR) Study. Front. Nutr. 2022, 9, 882458. [Google Scholar] [CrossRef]
- Cruz-Valenzuela, M.R.; Ayala-Soto, R.E.; Ayala-Zavala, J.F.; Espinoza-Silva, B.A.; González-Aguilar, G.A.; Martín-Belloso, O.; Soliva-Fortuny, R.; Nazzaro, F.; Fratianni, F.; Tapia-Rodríguez, M.R.; et al. Pomegranate (Punica granatum L.) Peel Extracts as Antimicrobial and Antioxidant Additives Used in Alfalfa Sprouts. Foods 2022, 11, 2588. [Google Scholar] [CrossRef]
- Gullón, P.; Astray, G.; Gullón, B.; Tomasevic, I.; Lorenzo, J.M. Pomegranate Peel as Suitable Source of High-Added Value Bioactives: Tailored Functionalized Meat Products. Molecules 2020, 25, 2859. [Google Scholar] [CrossRef]
- Wakeel, A.; Xu, M.; Gan, Y. Chromium-Induced Reactive Oxygen Species Accumulation by Altering the Enzymatic Antioxidant System and Associated Cytotoxic, Genotoxic, Ultrastructural, and Photosynthetic Changes in Plants. Int. J. Mol. Sci. 2020, 21, 728. [Google Scholar] [CrossRef] [Green Version]
- Cruz-Lopes, L.P.; Macena, M.; Esteves, B.; Guiné, R.P.F. Ideal PH for the Adsorption of Metal Ions Cr6+, Ni2+, Pb2+ in Aqueous Solution with Different Adsorbent Materials. Open Agric. 2021, 6, 115–123. [Google Scholar] [CrossRef]
- Islam, M.M.; Mohana, A.A.; Rahman, M.A.; Rahman, M.; Naidu, R.; Rahman, M.M. A Comprehensive Review of the Current Progress of Chromium Removal Methods from Aqueous Solution. Toxics 2023, 11, 252. [Google Scholar] [CrossRef] [PubMed]
- Guo, X.; Liu, A.; Lu, J.; Niu, X.; Jiang, M.; Ma, Y.; Liu, X.; Li, M. Adsorption Mechanism of Hexavalent Chromium on Biochar: Kinetic, Thermodynamic, and Characterization Studies. ACS Omega 2020, 5, 27323–27331. [Google Scholar] [CrossRef]
- Dawodu, F.A.; Akpan, B.M.; Akpomie, K.G. Sequestered Capture and Desorption of Hexavalent Chromium from Solution and Textile Wastewater onto Low Cost Heinsiacrinita Seed Coat Biomass. Appl. Water Sci. 2020, 10, 32. [Google Scholar] [CrossRef] [Green Version]
- Puszkarewicz, A.; Kaleta, J. Chromium (VI) Adsorption on Modified Activated Carbons. Appl. Sci. 2019, 9, 3549. [Google Scholar] [CrossRef] [Green Version]
- Badessa, T.S.; Wakuma, E.; Yimer, A.M. Bio-Sorption for Effective Removal of Chromium(VI) from Wastewater Using Moringa stenopetala Seed Powder (MSSP) and Banana Peel Powder (BPP). BMC Chem. 2020, 14, 71. [Google Scholar] [CrossRef]
- Biswas, S.; Bal, M.; Behera, S.; Sen, T.; Meikap, B. Process Optimization Study of Zn2+ Adsorption on Biochar-Alginate Com-posite Adsorbent by Response Surface Methodology (RSM). Water 2019, 11, 325. [Google Scholar] [CrossRef] [Green Version]
- Elkhaleefa, A.; Ali, I.H.; Brima, E.I.; Shigidi, I.; Elhag, A.B.; Karama, B. Evaluation of the Adsorption Efficiency on the Removal of Lead(II) Ions from Aqueous Solutions Using Azadirachta indica Leaves as an Adsorbent. Processes 2021, 9, 559. [Google Scholar] [CrossRef]
- Akhtar, A.; Hanif, M.A.; Rashid, U.; Bhatti, I.A.; Alharthi, F.A.; Kazerooni, E.A. Advanced Treatment of Direct Dye Wastewater Using Novel Composites Produced from Hoshanar and Sunny Grey Waste. Separations 2022, 9, 425. [Google Scholar] [CrossRef]
- Al-Najar, J.A.; Al-Humairi, S.T.; Lutfee, T.; Balakrishnan, D.; Veza, I.; Soudagar, M.E.M.; Fattah, I.M.R. Cost-Effective Natural Adsorbents for Remediation of Oil-Contaminated Water. Water 2023, 15, 1186. [Google Scholar] [CrossRef]
- Jiang, W.; Hu, Y.; Zhu, Z. Biosorption Characteristic and Cytoprotective Effect of Pb2+, Cu2+ and Cd2+ by a Novel Polysaccharide from Zingiber strioatum. Molecules 2022, 27, 8036. [Google Scholar] [CrossRef]
- Mustapha, S.; Shuaib, D.T.; Ndamitso, M.M.; Etsuyankpa, M.B.; Sumaila, A.; Mohammed, U.M.; Nasirudeen, M.B. Adsorption Isotherm, Kinetic and Thermodynamic Studies for the Removal of Pb(II), Cd(II), Zn(II) and Cu(II) Ions from Aqueous Solutions Using Albizia lebbeck Pods. Appl. Water Sci. 2019, 9, 142. [Google Scholar] [CrossRef] [Green Version]
- Mnasri-Ghnimi, S.; Frini-Srasra, N. Removal of Heavy Metals from Aqueous Solutions by Adsorption Using Single and Mixed Pillared Clays. Appl. Clay Sci. 2019, 179, 105151. [Google Scholar] [CrossRef]
- Al-Ghouti, M.A.; Da’ana, D.A. Guidelines for the Use and Interpretation of Adsorption Isotherm Models: A Review. J. Hazard. Mater. 2020, 393, 122383. [Google Scholar] [CrossRef]
- Rafiaee, S.; Samani, M.R.; Toghraie, D. Removal of Hexavalent Chromium from Aqueous Media Using Pomegranate Peels Modified by Polymeric Coatings: Effects of Various Composite Synthesis Parameters. Synth. Met. 2020, 265, 116416. [Google Scholar] [CrossRef]
- Giri, R.; Kumari, N.; Behera, M.; Sharma, A.; Kumar, S.; Kumar, N.; Singh, R. Adsorption of Hexavalent Chromium from Aqueous Solution Using Pomegranate Peel as Low-Cost Biosorbent. J. Environ. Sustain. 2021, 4, 401–417. [Google Scholar] [CrossRef]
- Boutaleb, Y.; Zerdoum, R.; Bensid, N.; Abumousa, R.A.; Hattab, Z.; Bououdina, M. Adsorption of Cr(VI) by Mesoporous Pomegranate Peel Biowaste from Synthetic Wastewater under Dynamic Mode. Water 2022, 14, 3885. [Google Scholar] [CrossRef]
- Khalil, U.; Shakoor, M.B.; Ali, S.; Rizwan, M.; Alyemeni, M.N.; Wijaya, L. Adsorption-Reduction Performance of Tea Waste and Rice Husk Biochars for Cr(VI) Elimination from Wastewater. J. Saudi Chem. Soc. 2020, 24, 799–810. [Google Scholar] [CrossRef]
- Nithya, K.; Sathish, A.; Kumar, P.S. Packed Bed Column Optimization and Modeling Studies for Removal of Chromium Ions Using Chemically Modified Lantana camara Adsorbent. J. Water Process. Eng. 2020, 33, 101069. [Google Scholar] [CrossRef]
- Enniya, I.; Rghioui, L.; Jourani, A. Adsorption of hexavalent chromium in aqueous solution on activated carbon prepared from apple peels. Sustain. Chem. Pharm. 2018, 7, 9–16. [Google Scholar] [CrossRef]
- Yarkandi, N.H. Kinetic and Isotherm of Toxic Hexavelant Chromium Adsorption onto Natural Adsorbent. Int. J. Curr. Microbiol. Appl. Sci. 2014, 3, 1–15. [Google Scholar]
- Bayuo, J.; Pelig-Ba, K.B.; Abukari, M.A. Adsorptive Removal of Chromium(VI) from Aqueous Solution unto Groundnut Shell. Appl. Water Sci. 2019, 9, 107. [Google Scholar] [CrossRef] [Green Version]
- Mitra, T.; Bar, N.; Das, S.K. Rice Husk: Green Adsorbent for Pb(II) and Cr(VI) Removal from Aqueous Solution–Column Study and GA–NN Modeling. SN Appl. Sci. 2019, 1, 486. [Google Scholar] [CrossRef] [Green Version]
- El-Baz, A.A.; Hendy, I.; Dohdoh, A.M.; Srour, M.I. Adsorption of High Chromium Concentrations from Industrial Wastewater Using Different Agricultural Residuals. J. Environ. Treat. Tech. 2020, 9, 122–138. [Google Scholar] [CrossRef]
- Garg, R.; Garg, R.; Sillanpää, M.; Alimuddin; Khan, M.A.; Mubarak, N.M.; Tan, Y.H. Rapid Adsorptive Removal of Chromium from Wastewater Using Walnut-Derived Biosorbents. Sci. Rep. 2023, 13, 6859. [Google Scholar] [CrossRef] [PubMed]
- Pertile, E.; Dvorský, T.; Václavík, V.; Heviánková, S. Use of Different Types of Biosorbents to Remove Cr(VI) from Aqueous Solution. Life 2021, 11, 240. [Google Scholar] [CrossRef]
- Babu, J.D.; Sumalatha, B.; Narayana, V.A.; Pulipati, K.; Rao, R.A. Simultaneous Biosorption of Chromium (III) and Chromium (VI): Application of Multiple Response Optimizations. J. Agric. Sci. Technol. 2019, 22, 556230. [Google Scholar]
- Castañeda-Figueredo, J.S.; Torralba-Dotor, A.I.; Pérez-Rodríguez, C.C.; Moreno-Bedoya, A.M.; Mosquera-Vivas, C.S. Removal of Lead and Chromium from Solution by Organic Peels: Effect of Particle Size and Bio-Adsorbent. Heliyon 2022, 8, e10275. [Google Scholar] [CrossRef] [PubMed]
- Putz, A.-M.; Ciopec, M.; Negrea, A.; Grad, O.; Ianăşi, C.; Ivankov, O.I.; Milanović, M.; Stijepović, I.; Almásy, L. Comparison of Structure and Adsorption Properties of Mesoporous Silica Functionalized with Aminopropyl Groups by the Co-Condensation and the Post Grafting Methods. Materials 2021, 14, 628. [Google Scholar] [CrossRef] [PubMed]
- Allwin Mabes Raj, A.F.P.; Bauman, M.; Lakić, M.; Dimitrušev, N.; Lobnik, A.; Košak, A. Removal of Pb2+, CrT, and Hg2+ Ions from Aqueous Solutions Using Amino-Functionalized Magnetic Nanoparticles. Int. J. Mol. Sci. 2022, 23, 16186. [Google Scholar] [CrossRef]
- Hu, H.; Zhao, D.; Wu, C.; Xie, R. Sulfidized Nanoscale Zerovalent Iron Supported by Oyster Powder for Efficient Removal of Cr (VI): Characterization, Performance, and Mechanisms. Materials 2022, 15, 3898. [Google Scholar] [CrossRef]
- De Borja Ojembarrena, F.; Sammaraie, H.; Campano, C.; Blanco, A.; Merayo, N.; Negro, C. Hexavalent Chromium Removal from Industrial Wastewater by Adsorption and Reduction onto Cationic Cellulose Nanocrystals. Nanomaterials 2022, 12, 4172. [Google Scholar] [CrossRef]
- Ali, A.; Alharthi, S.; Al-Shaalan, N.H.; Naz, A.; Fan, H.-J.S. Efficient Removal of Hexavalent Chromium (Cr(VI)) from Wastewater Using Amide-Modified Biochar. Molecules 2023, 28, 5146. [Google Scholar] [CrossRef]
- Angaru, G.K.R.; Lingamdinne, L.P.; Koduru, J.R.; Chang, Y.-Y. N-Cetyltrimethylammonium Bromide-Modified Zeolite Na-A from Waste Fly Ash for Hexavalent Chromium Removal from Industrial Effluent. J. Compos. Sci. 2022, 6, 256. [Google Scholar] [CrossRef]
- Li, J.; Dong, X.; Liu, X.; Xu, X.; Duan, W.; Park, J.; Gao, L.; Lu, Y. Comparative Study on the Adsorption Characteristics of Heavy Metal Ions by Activated Carbon and Selected Natural Adsorbents. Sustainability 2022, 14, 15579. [Google Scholar] [CrossRef]
- Tee, G.T.; Gok, X.Y.; Yong, W.F. Adsorption of Pollutants in Wastewater via Biosorbents, Nanoparticles and Magnetic Bio-sorbents: A Review. Environ. Res. 2022, 212, 113248. [Google Scholar] [CrossRef]
- Fernández Pérez, B.; Ayala Espina, J.; Fernández González, M.D.L.Á. Adsorption of Heavy Metals Ions from Mining Metallurgical Tailings Leachate Using a Shell-Based Adsorbent: Characterization, Kinetics and Isotherm Studies. Materials 2022, 15, 5315. [Google Scholar] [CrossRef] [PubMed]
- Rao, R.A.K.; Rehman, F. Adsorption of Heavy Metal Ions on Pomegranate (Punica granatum) Peel: Removal and Recovery of Cr(VI) Ions from a Multi-Metal Ion System. Adsorp. Sci. Technol. 2010, 28, 195–211. [Google Scholar] [CrossRef]


| Parameter | RHP | YHP |
|---|---|---|
| SBET (m2/g) | 2.6844 | 3.3244 |
| Pore volume (cm3/g) | 0.003114 | 0.003987 |
| Average pore diameter (nm) | 21.1781 | 14.5149 |
| Material | pHpzc | Acidic Surface Functional Groups (mmol/g) | Polyphenolic Content (mg Gallic Acid Equivalent/g of Dry Weight) |
|---|---|---|---|
| RHP | 5.11 | 18.5 | 102 ± 0.9 |
| YHP | 4.55 | 16 | 85.9 ± 1.3 |
| Biosorbent | Langmuir | Freundlich | D-R | ||||||||
|---|---|---|---|---|---|---|---|---|---|---|---|
| Qm Experimental (mg/g) | Qmax Theoretical (mg/g) | KL (L/mg) | RL | R2 | KF (mg/g(L/mg)1/nf) | 1/n | R2 | Qmax Theoretical (mg/g) | KDR (mol2/kJ2) | R2 | |
| RHP | 407.01 | 413.22 | 0.0160 | (0.015 – 0.861) | 0.99889 | 4.4067 | 0.3629 | 0.93515 | 235.28 | 0.0015 | 0.48272 |
| YHP | 396.49 | 403.22 | 0.0165 | (0.014 – 0.858) | 0.9985 | 4.3398 | 0.3659 | 0.91909 | 232.52 | 0.0016 | 0.42843 |
| Biosorbent | Pseudo-First Order | Pseudo-Second Order | Elovich | ||||||||
|---|---|---|---|---|---|---|---|---|---|---|---|
| Qe Experimental (mg/g) | Qe Calculated (mg/g) | K1 (min−1) | R2 | Qe Experimental (mg/g) | Qe Calculated (mg/g) | K2 (g/mg/min) | R2 | α (mg/g/min) | β (g/mg) | R2 | |
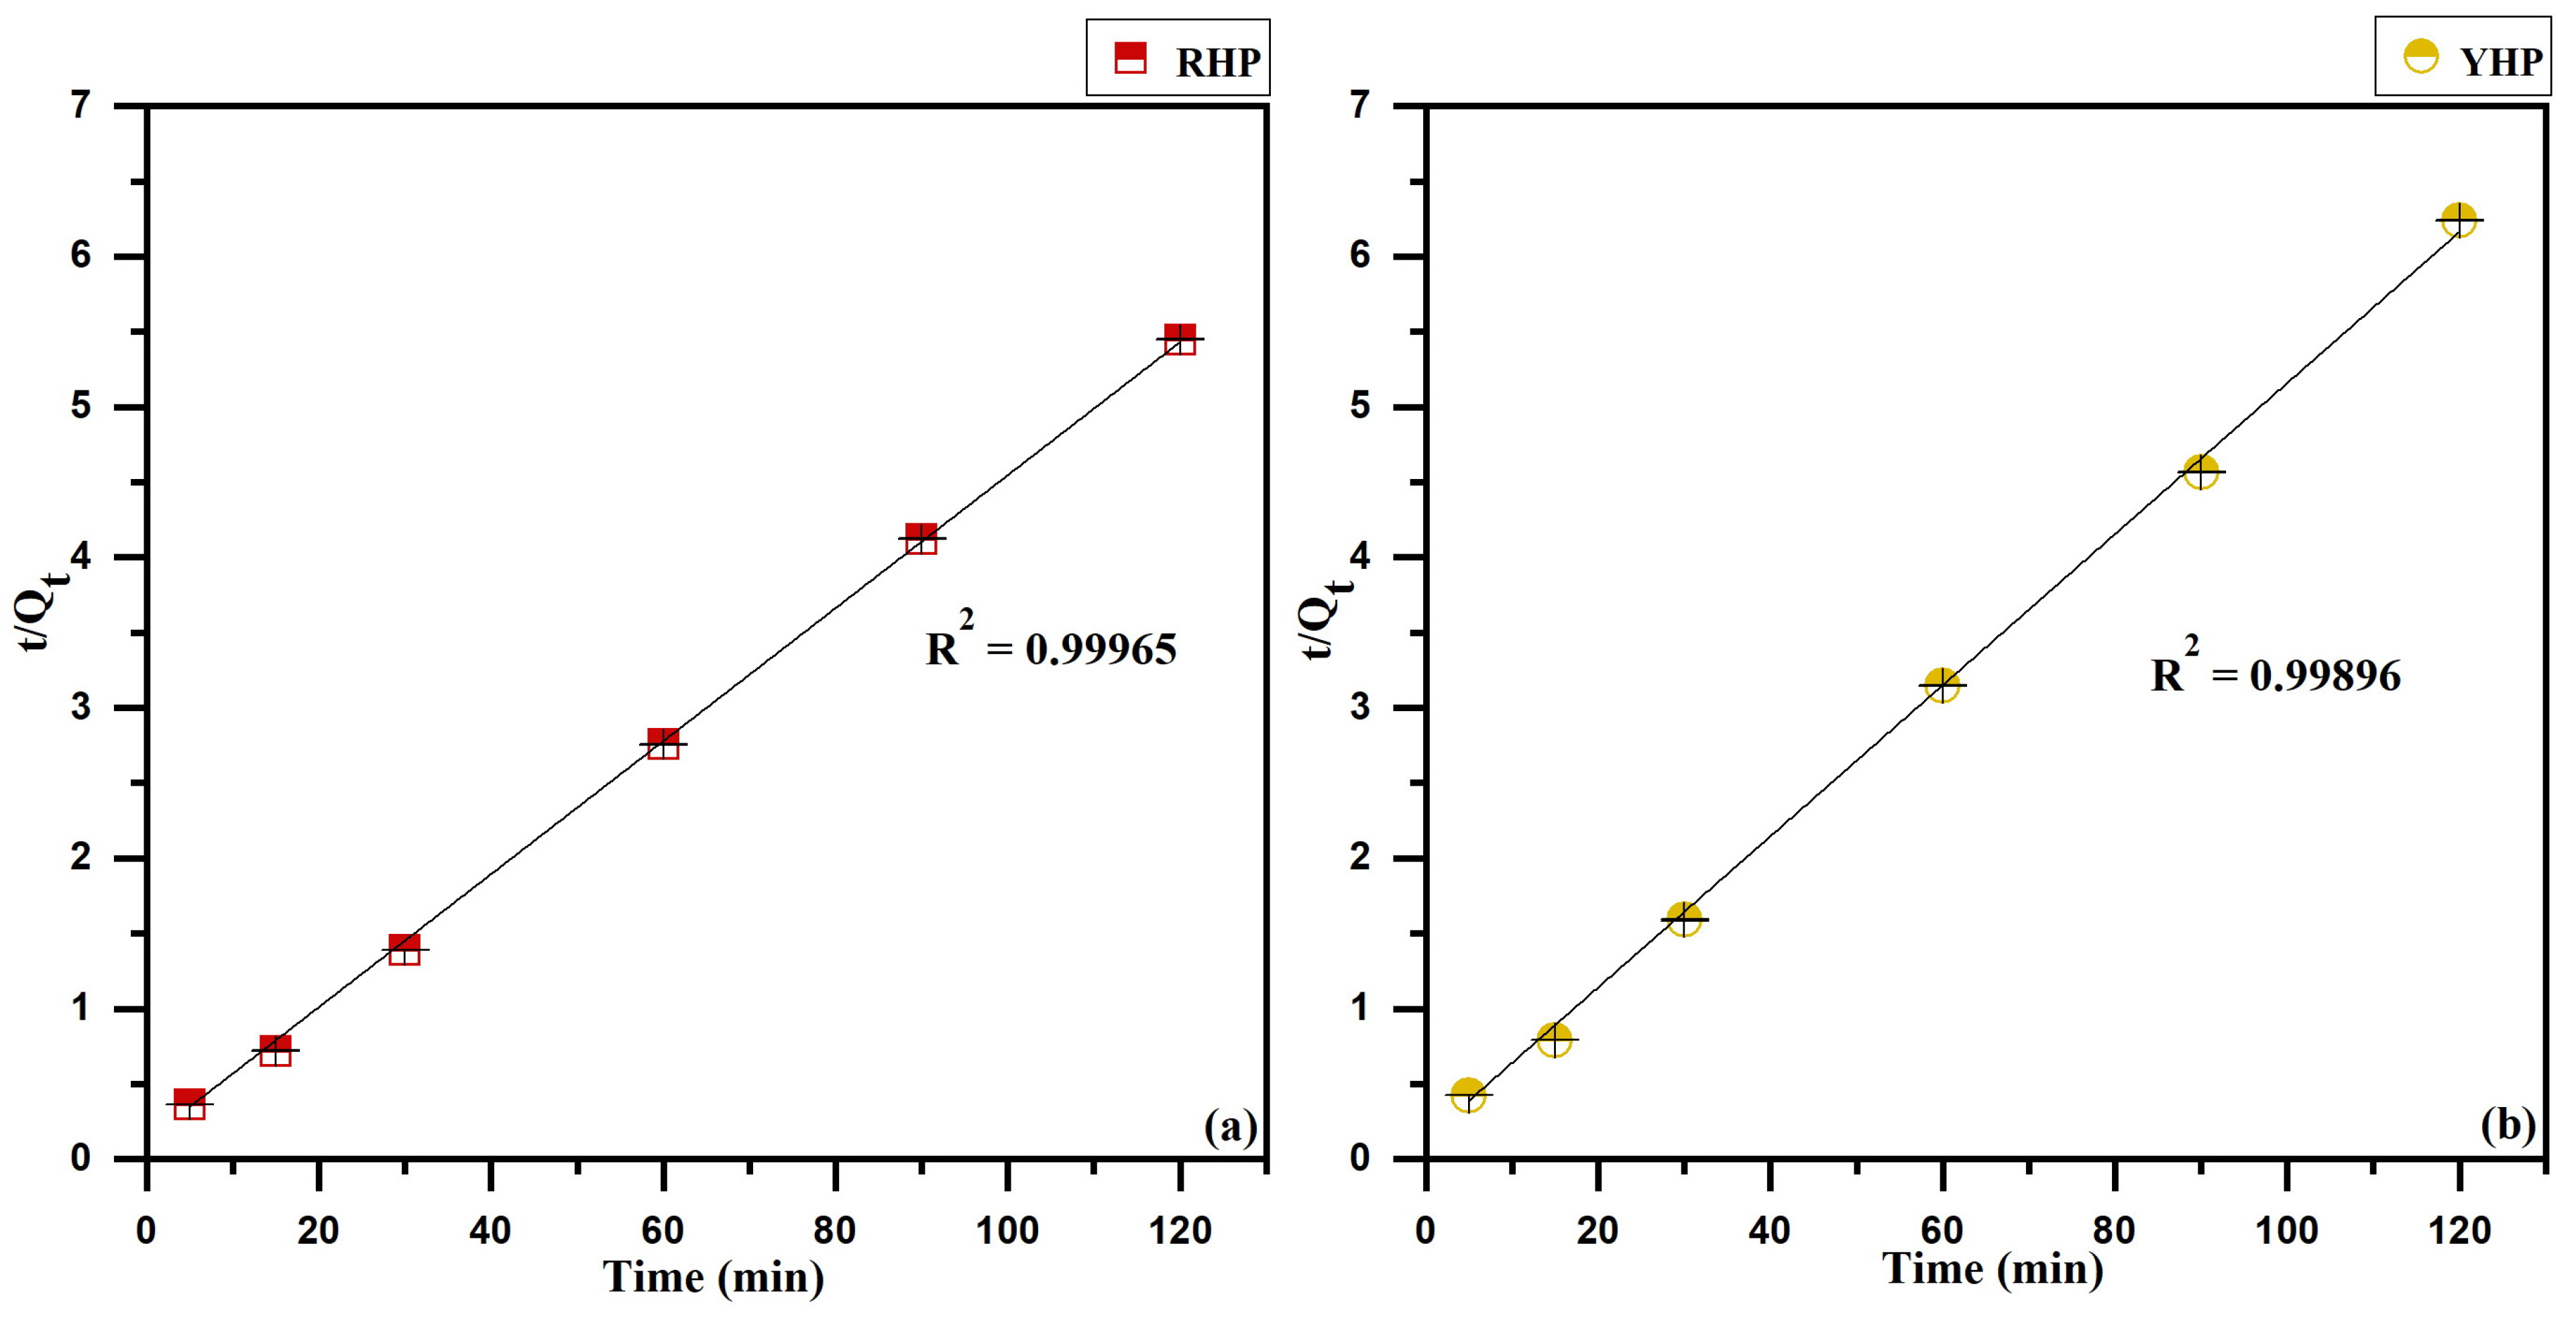
| RHP | 22.60 | 3.31 | 0.01697 | 0.50251 | 22.60 | 22.36 | 0.02464 | 0.99965 | 573.38 | 0.44580 | 0.6443 |
| YHP | 20.99 | 3.98 | 0.00987 | 0.27245 | 20.99 | 19.71 | 0.02948 | 0.99896 | 396.01 | 0.48942 | 0.58122 |
| Biosorbents | Qmax (mg/g) | S/L Ratio | Range of Initial Concentrations (mg/L) | pH | Temperature (°C) | References |
|---|---|---|---|---|---|---|
| Pomegranate husk | 403.22–413.22 | 0.5 mg/mL | 10–4000 | 2 | 25 | Current study |
| Tea waste biochar | 38.62 | 0.6 mg/mL | 10–250 | 5.2 | 20 ± 2 | [89] |
| Modified Lantana camara | 362.8 | Fixed bed column experiment | 100–300 | 1.5 | Not mentioned | [90] |
| (bed height 4 cm) | ||||||
| Apple peel | 36.01 | 1 mg/mL | 10–50 | 2 | 28 | [91] |
| Egg shell | 299.4 | 103 mg/150 mL | 1–100 | 3 | 25 | [92] |
| Groundnut shell | 3.792 | 2 mg/mL | 15–100 | 8 | 41.5 | [93] |
| Rice husk | 11.39 | Fixed bed column experiment | 10–30 | 5 | 25 ± 2 | [94] |
| (bed height 50 cm) | ||||||
| Banana waste | 105.84 | 25 mg/mL | 400–1000 | 3 | 30 | [95] |
| Walnut shell | 64.82 | 1 mg/mL | 20–120 | 2 | 25 | [96] |
| Peach stones | 25.5 | 20 mg/mL | 100–1000 | 1.1 | 25 ± 2 | [97] |
| Gelidilla acerosa (Micro algea) | 270.27 | 0.5 mg/mL | 20–100 | 2.81 | Ambient temperature | [98] |
| Passion fruit | 3.3 | 10 mg/mL | 5–500 | 6 | 22 | [99] |
| Aminopropyl functionalized mesoporous silica by co-condensation | 93.6 | 4 mg/mL | 25–1000 | 3.5 | 25 | [100] |
| Amino functionalized magnetic nanoparticles | 90.4 | 2.25 mg/mL | 200 | 7 | Room temperature | [101] |
| Sulfidized nanoscale zerovalent iron supported by oyster shell | 164.7 | 0.1 mg/mL | 0–10 | 3.5 | 25 | [102] |
| Cationic cellulose nanocrystals | 44 | 0.1 mg/mL | 0.1–70 | 3 | Room temperature | [103] |
| Amide-modified biochar | 229.88 | 2 mg/mL | 100–500 | 2 | 25 | [104] |
| N-cetyltrimethylammonium bromide (CTAB)-modified fly ash-based zeolite Na-A | 108.76 | 0.5 mg/mL | 10–300 | 3 | 25 | [105] |
Disclaimer/Publisher’s Note: The statements, opinions and data contained in all publications are solely those of the individual author(s) and contributor(s) and not of MDPI and/or the editor(s). MDPI and/or the editor(s) disclaim responsibility for any injury to people or property resulting from any ideas, methods, instructions or products referred to in the content. |
© 2023 by the authors. Licensee MDPI, Basel, Switzerland. This article is an open access article distributed under the terms and conditions of the Creative Commons Attribution (CC BY) license (https://creativecommons.org/licenses/by/4.0/).
Share and Cite
Abed, L.; Belattar, N. Assessing the Dual Use of Red and Yellow Algerian Pomegranate Husks: Natural Antiradical Agents and Low-Cost Biosorbents for Chromium (VI) Removal from Contaminated Waters. Water 2023, 15, 2869. https://doi.org/10.3390/w15162869
Abed L, Belattar N. Assessing the Dual Use of Red and Yellow Algerian Pomegranate Husks: Natural Antiradical Agents and Low-Cost Biosorbents for Chromium (VI) Removal from Contaminated Waters. Water. 2023; 15(16):2869. https://doi.org/10.3390/w15162869
Chicago/Turabian StyleAbed, Lina, and Noureddine Belattar. 2023. "Assessing the Dual Use of Red and Yellow Algerian Pomegranate Husks: Natural Antiradical Agents and Low-Cost Biosorbents for Chromium (VI) Removal from Contaminated Waters" Water 15, no. 16: 2869. https://doi.org/10.3390/w15162869
APA StyleAbed, L., & Belattar, N. (2023). Assessing the Dual Use of Red and Yellow Algerian Pomegranate Husks: Natural Antiradical Agents and Low-Cost Biosorbents for Chromium (VI) Removal from Contaminated Waters. Water, 15(16), 2869. https://doi.org/10.3390/w15162869