Article

Assessing the Dual Use of Red and Yellow Algerian Pomegranate Husks: Natural Antiradical Agents and Low-Cost Biosorbents for Chromium (VI) Removal from Contaminated Waters

Laboratory of Applied Biochemistry, Faculty of Nature and Life Sciences, Ferhat Abbas University Setif, Setif 19000, Algeria
*
Author to whom correspondence should be addressed.
Water 2023, 15(16), 2869; https://doi.org/10.3390/w15162869
Submission received: 19 June 2023 / Revised: 1 August 2023 / Accepted: 4 August 2023 / Published: 9 August 2023

Abstract

:
The hexavalent chromium (Cr(VI)) released in industrial wastewaters can cause adverse effects on both the environment and human health. This study aimed to investigate the efficiency of the red and yellow pomegranate husk powders (RHP and YHP) as natural quenchers for free radicals and as adsorbents towards Cr(VI) ions. Fourier transform infrared spectroscopy (FTIR), scanning electron microscopy (SEM), energy dispersive X-ray spectroscopy (EDX), X-ray diffraction (XRD), and Brunauer-Emmett-Teller (BET) surface area analyses were used for biosorbent characterization. The antiradical activity was assessed via 2,2-diphenyl-1-picrylhydrazyl (DPPH) and 2,2′-azinobis-3-ethylbenzothiazoline-6-sulfonic acid (ABTS) assays. The adsorption isotherms and kinetics were conducted by the batch method. The results showed the roughness and heterogeneity of the biosorbent surface in the presence of active functional groups. At a dose of 5 mg, both biomasses showed a radical inhibition activity (I) > 85% for DPPH, and (I) > 91% for ABTS. Finally, the isotherms modeling showed that the Langmuir model was the best fit with a maximum adsorption capacity (Qmax) of 413.22 and 403.22 mg/g at pH 2 within 60 min with a solid/liquid ratio (S/L) of 0.5 mg/mL for RHP and YHP, respectively. The kinetic data aligned better with the pseudo-second-order model. This study demonstrates the effectiveness of these biomasses as natural quenchers for free radicals and as biosorbents for Cr(VI) removal from contaminated waters.

1. Introduction

Heavy metals have a detrimental impact on the environment and can cause catastrophic repercussions for human health due to their high toxicity and deleterious effects through their ability to bioaccumulate, mainly chromium, cadmium, arsenic, lead, nickel, and mercury. Their introduction into our ecosystem is caused to a great degree by intensive agriculture, industrialization, and globalization [1,2]. Chromium (Cr) is the seventh most abundant element in the Earth’s crust. It exists in two common stable valence states: trivalent chromium (Cr(III)), which is a naturally existing form of chromium that is vital for human health, and hexavalent chromium (Cr(VI)), which can be extremely toxic [3,4]. Cr(VI) water pollution is mostly caused by its widespread use in numerous industrial sectors (like leather tanning, electroplating, printing, dyeing, energy generation, etc.) and the subsequent processing of waste and wastewater [5,6].
Human exposure to Cr(VI) can occur through inhalation, ingestion, or skin contact and can lead to respiratory issues, skin irritations, an increased risk of nasal and lung cancer and kidney damage [7,8]. The reduction of Cr(VI) to Cr(III) leads to the production of free radicals (such as reactive oxygen species (ROS)) and intermediate chromium species, including pentavalent chromium (Cr(V)) and tetravalent chromium (Cr(IV)). These free radicals play a significant role in causing oxidative damage to various tissues and disrupting cell organelles such as mitochondria, deoxyribonucleic acid (DNA), ribonucleic acid (RNA), and protein molecules. This oxidative damage can have harmful effects on cellular function and overall health by compromising the integrity and functionality of important cellular components [9,10].
The World Health Organization (WHO) has recently established a temporary guideline value of 0.1 µg/L for Cr(VI) in drinking water, signifying the maximum concentration of this contaminant that is considered safe for human consumption. On the other hand, the European Union has implemented a maximum discharge limit of 0.5 µg/L for Cr(VI) into the aquatic environment [11,12,13,14]. As a result, substantial research has been conducted to address the problem of Cr(VI) pollution and prioritize the remediation of contaminated soil and water bodies [15,16]. Among the existing wastewater treatment technologies (such as filtration, sedimentation, coagulation, reverse osmosis, etc.), adsorption is considered an efficient alternative to these traditional techniques due to its high efficiency, low operating costs, and ease of use [17,18]. Currently, the focus is leaning more and more towards novel water treatment techniques like photocatalysis by using photocatalysts consisting of graphitic carbon nitride on tungsten trioxide (g-C3N4/WO3) or incorporating tween-80 surfactant in vanadium-based photocatalysts for the reduction of heavy metals such as Cr(VI) in wastewaters [19,20], nanotechnology by means of metal oxide nanoparticles and chitosan nanoparticles [21,22], and biosorption, which is a sustainable and eco-friendly technique that uses natural biomasses to treat polluted wastewaters like algae, microorganisms, plants, agro-waste, etc. [23,24].
Every year, the agricultural and agro-food industries generate significant amounts of by-products that can serve as valuable sources of plant biomass [25]. These by-products offer a promising solution to the issue of heavy metal pollution through their abundance, cost-effectiveness, and remarkable efficiency in removing pollutants. Importantly, utilizing these by-products for this purpose does not pose any adverse effects on the environment [26]. Numerous studies have been conducted to explore the potential of using biomasses as effective sorbents for removing heavy metal species from aqueous solutions, including orange peels [27], coffee husk [28], apple pomace [29], wheat straw [30], and green tea leaves [31].
Pomegranate (Punica granatum L.) is a globally cultivated fruit valued for its various health benefits. Its consumption, either as a whole fruit or as a juice, has increased, leading to increased production and processing. This has resulted in significant quantities of pomegranate husks as a primary byproduct, considering the fact that they represent 30 to 40% of the whole fruit [32,33]. Pomegranate husk contains a significant amount of cellulose, lignin, and bioactive compounds, including polyphenolic secondary metabolites like phenolic acids, flavonoids, and hydrolysable tannins, causing it to be rich in functional groups such as phenolic, carboxylic, hydroxylic, and lactonic groups, responsible for its biological activities, notably antioxidant and chelating properties [34,35,36].
In this context, the objective of this work was to explore the potential dual-use applications of red pomegranate husk powder (RHP) and yellow pomegranate husk powder (YHP) by evaluating their antiradical activity in their native state and their ability as biosorbents towards Cr(VI) ions. Fourier transform infrared spectroscopy (FTIR), scanning electron microscopy (SEM), energy dispersive X-ray spectroscopy (EDX), X-ray diffraction (XRD), and Brunauer-Emmett-Teller (BET) surface area analyses were utilized for the characterization of the biomasses. The adsorption study was established via batch method using synthetic Cr(VI) solutions, and the impact of experimental factors on the adsorption process was assessed by varying pH, contact time, and solid/liquid ratio (S/L). The modeling of adsorption isotherms and kinetics was also conducted to evaluate the adsorption efficiency of the biosorbents and to understand the adsorption mechanism. Finally, this research proposes a cost-effective approach to developing natural antioxidants against free radicals on the one hand and effective adsorbents using abundant biomass materials for the efficient removal of heavymetals from contaminated water sources on the other hand.

2. Materials and Methods

2.1. Materials

The reagents and solvents used in this study were of analytical grade. Deionized water (20 μs/cm) obtained from the National Company of Electrochemical Products (ENPEC), Algeria, was utilized in the adsorption studies. Sodium chloride (NaCl, 99.4%, Sigma), sodium hydroxide (NaOH, 98%, Cheminova, Lemvig, Denmark), and hydrochloric acid (HCl, 37%, Biochem, Saitama, Japan) were used in chemical characterization. For the spectrophotometric quantification of the residual chromium; 1,5-diphenylcarbazide (DPC), potassium dichromate (K2Cr2O7), sulfuric acid (H2SO4, 97%), and acetone (99.5%) obtained from Sigma-Aldrich (St. Louis, MO, USA) were used. 2,2-diphenyl-1-picrylhydrazyl (DPPH), 2,2′-azinobis-3-ethylbenzothiazoline-6-sulfonic acid (ABTS), potassium persulfate (K2S2O8), and methanol (99.8%) from Sigma-Aldrich were used in the antiradical activity.

2.2. Preparation of the Biosorbents

The red and yellow pomegranate husks used in this work were obtained from Punica granatum L. fruit bought from the regional market on the eastern side of Algeria (Setif). The fruits were cleaned with tap and distilled water to eliminate any dirt or debris. The husks were separated from the arils and put in the oven at 40 °C for three days until they were completely dry, followed by grounding and sieving to a 500 µm particle size powder [37]. The husk powder was stored inside airtight containers, in the dark, and at ambient temperature until used.

2.3. Preparation of Stock Solution

The chromium stock solution (1000 mg/L) was prepared by dissolving K2Cr2O7 in deionized water. The working solutions were obtained by diluting the stock solution with deionized water to yield the desired concentrations. The pH of the solutions was adjusted by the addition of NaOH (0.1 M) or HCl (0.1 M). The pH measurement was assessed by a glass-electrode Hanna HI 9321 pH meter.

2.4. Concentration Determination Method

The residual Cr(VI) concentration was determined by the DPC method described in the literature with some modifications [38,39]. In which, 30 µL of the metal solution was mixed with 1500 µL of DPC reagent (0.1%) dissolved in 50% acetone (v/v), previously acidified to pH (2.4) using H2SO4 (1 M). After 10 min of incubation in the dark, the absorbance was read at 543 nm against a blank using JENWAY 6300 UV-Vis spectrophotometer. A standard calibration curve was established using known concentrations of Cr(VI) and absorbance to obtain a concentration-absorbance profile.

2.5. Biosorbents Characterization

The RHP and YHP were characterized using different techniques. In order to determine wavenumber variations in the functional groups of the adsorbents, FTIR analyses were recorded between 400 and 4000 cm−1 using SHIMADZU FTIR—8400S spectrophotometer. SEM is visualized at 1.5 KV and a magnification of 2000 X using a JEOL JSM-7001F SEM coupled with EDX for the determination of the elemental composition. The textural properties were deduced from the N2 adsorption-desorption isotherms at liquid nitrogen temperature (−196.3 °C) using Micromeritics ASAP 2020 plus version 2.00. XRD analysis was conducted by a PANalytical Empyrean Diffractometer equipped with a Cu anode (λ = 1.544426 Å), and the diffractions were recorded between 5 and 80° (2θ) at a voltage of 45 kV and a current of 40 mA. The point of zero charge (pHpzc), surface functional group concentration, and polyphenolic content of the husk aqueous extracts were determined earlier in our previous study [37].

2.6. Quencher-Free Radical Scavenging Activity

The free radical scavenging activity of the raw husk powders was assessed via the Quencher method [40,41], using DPPH and ABTS as free radicals [42,43]. In which, different doses of RHP and YHP biomasses ranging between 0.5 and 5 mg were added to 2 mL of DPPH solution (0.004% in methanol) and 2 mL of the ABTS solution separately. For the DPPH, the mixture was agitated in a rotary orbital shaker at 50 rpm for 30 min and then centrifuged for 5 min at 3000 rpm. The absorbance of each supernatant was read at 517 nm along with the absorbance of the control (DPPH solution alone) using a JENWAY 6300 UV-Vis spectrophotometer. As for the ABTS, it was prepared by combining 7 mM of ABTS with 2.45 mM K2S2O8 in water. The mixture was kept in the dark at room temperature for 16 h for activation. Following activation, the ABTS solution was diluted (1/75, v/v) with water. The mixture of the husk powders with the ABTS solution was also agitated in an orbital shaker at 70 rpm for 10 min, followed by centrifugation for 5 min at 3000 rpm. The absorbance of the supernatant and the control (ABTS solution alone) was measured at 734 nm. The inhibition percentage was calculated using the following Equation:
I % = Abs c Abs s Abs C × 100
where AbsC is the absorbance of the control, AbsS is the absorbance of the sample, and I(%) is the inhibition percentage.

2.7. Biosorption Studies

Biosorption studies were carried out using the batch method to determine the effect of different experimental conditions on the adsorption process, such as pH, solid/liquid ratio, and contact time. A fixed dose of the husk powder was put in 15 mL flasks that hold 10 mL of the Cr(VI) solution (25 mg/L), with different solid/liquid ratios (S/L) (0.25–2 mg/mL) at ambient temperature (25 °C) and a pH ranging between (2–8), with a variable contact time (0–120 min). The mixtures were agitated in a rotary orbital shaker at 70 rpm, followed by centrifugation at 3000 rpm for 10 min. Finally, the mixtures were filtered using 0.45 µm filters, and the residual Cr(VI) in the filtrate was determined spectrophotometrically at 543 nm via the DPC method mentioned earlier. The tests were performed in triplicate. The following equations were used to compute both the percentage of removal (R%) and the quantity of Cr(VI) ions sorbed by the biosorbent.
Q e = C 0 C e × V m
R % = C 0 C e × 100 C 0
where C0 is the initial Cr(VI) ion concentration (mg/L), Ce is the equilibrium Cr(VI) concentration (mg/L), Qe is the quantity of Cr(VI) adsorbed per unit weight of the biosorbent (mg/g), V is the volume of solution (L), and m is the weight of the biosorbent (g).

2.8. Isotherms Modeling

The adsorption of Cr(VI) ions was established using (0.5 mg/mL) of the biosorbent at optimal pH (2), as determined earlier with (60 min) of agitation time, using different Cr(VI) concentrations ranging between (10–4000 mg/L) at room temperature (25 °C). The obtained results were adapted to the widely used isotherm models; Langmuir [44], Freundlich [45], and Dubinin-Radushkevich (D-R) [46]. The linear forms of the isotherms are mentioned in Equations (4)–(6):
C e Q e = C e Q m + 1 Q m K L
log Q e = log K f + 1 n f log C e
ln Q e = ln Q m K DR ε 2
R L = 1 1 + K L C 0
ε = RTln 1 + 1 C e
E = 1 2 K DR
where Ce is the concentration of Cr(VI) ions (mg/L) at equilibrium, Qe is the concentration of Cr(VI) ions on the biosorbent (mg/g) at equilibrium, Qm is the maximum adsorption capacity (mg/g), KL is the Langmuir constant (L/mg), RL the Langmuir separation factor as determined by Equation (7) [47], which can be 0 (irreversible), 1 (linear), >1 (unfavorable), or (0–1) favorable (0 < RL< 1). Kf is the Freundlich constant (mg/g(L/mg)1/nf), nf is the adsorption intensity, KDR is the D-R constant related to the adsorption energy (mol2/kJ2), Ɛ is the Polanyi adsorption potential, R is the gas constant (kJ/mol/K), T is the absolute temperature (K), and E is the mean adsorption energy (kJ/mol) calculated by Equation (9), which might be <8 (physical adsorption), >16 (chemical adsorption), or (8–16) (ion exchange) [48].

2.9. Kinetics Modeling

The time effect on the adsorption capacity was studied between (0–120 min), using a S/L of 1 mg/mL at pH (5.5) and under ambient temperature. The obtained experimental data were analyzed using Lagergren-first order [49], pseudo-second order [50], and Elovich models [51,52]; their linear form is given by Equations (10)–(12):
log Q e Q t = log Q e K 1 t
t Q t = 1 K 2 Q e 2 + 1 Q e × t
Q t = 1 β ln α β + 1 β ln t
Q t = C 0 C t × V m
where Qe and Qt represent the concentration of Cr(VI) ions on the adsorbent at equilibrium and at time t, successively (mg/g), and K1 is the first-order model constant (min−1), K2 is the second-order model constant (g/mg/min), α is the initial adsorption rate (mg/g/min), and β is the desorption constant linked to the surface coverage and the activation energy for chemisorption (g/mg), C0 and Ct are the concentrations of Cr(VI) ions (mg/L) at initial time and time t, respectively, V is the volume of the metallic solution used (L), and m is the biosorbent dose (g) [53].

2.10. Statistical Analysis

All the tests were undertaken in triplicate. The results were given as the mean ± SE of three replicates for each sample. The modeling of the adsorption study findings was accomplished via linear fitting using Origin Pro 64 (version 2021 for Windows).

3. Results

3.1. Biosorbents Characterization

The FTIR analysis results of RHP and YHP before and after Cr(VI) ion adsorption are shown in Figure 1a,b. Both raw RHP and YHP adsorbents showed similar spectra. In fact, the peaks are in the range of 2365–3414 cm−1 show the broad stretching vibrations of the hydroxyl group (O-H) as well as the symmetric and asymmetric stretching vibrations of the aliphatic group (C-H). The peaks are at 1735–1736 cm−1 can be assigned to the stretching vibrations of carbonyl groups (C=O). The bands at 1619 cm−1 indicates the bending of the amino group (N-H). The peaks are in the range of 1330–1383 cm−1 correspond to the in-plane bending of hydroxyl groups (O-H). The peaks are around 1024–1233 cm−1 designate stretching vibrations of the carbonyl group (C-O). The spectra of the husk powder after adsorption (Cr(VI)RHP) and (Cr(VI)YHP) showed the shifting of several bands towards higher wavenumbers; the bands observed at 3410 and 3414 cm−1 changed to 3415 cm−1, the bands at 1619 cm−1 changed to 1637–1647 cm−1, the peaks at 1330 and 1348 cm−1 changed to 1368 and 1370 cm−1, the peaks at 1230 and 1233 cm−1 changed to 1260 and 1253 cm−1, and the bands at 1052 and 1053 cm−1 shifted to 1070 and 1075 cm−1 for RHP and YHP, respectively. Moreover, the peaks assigned to carbonyl groups (1735–1736 cm−1) have disappeared after chromium adsorption.
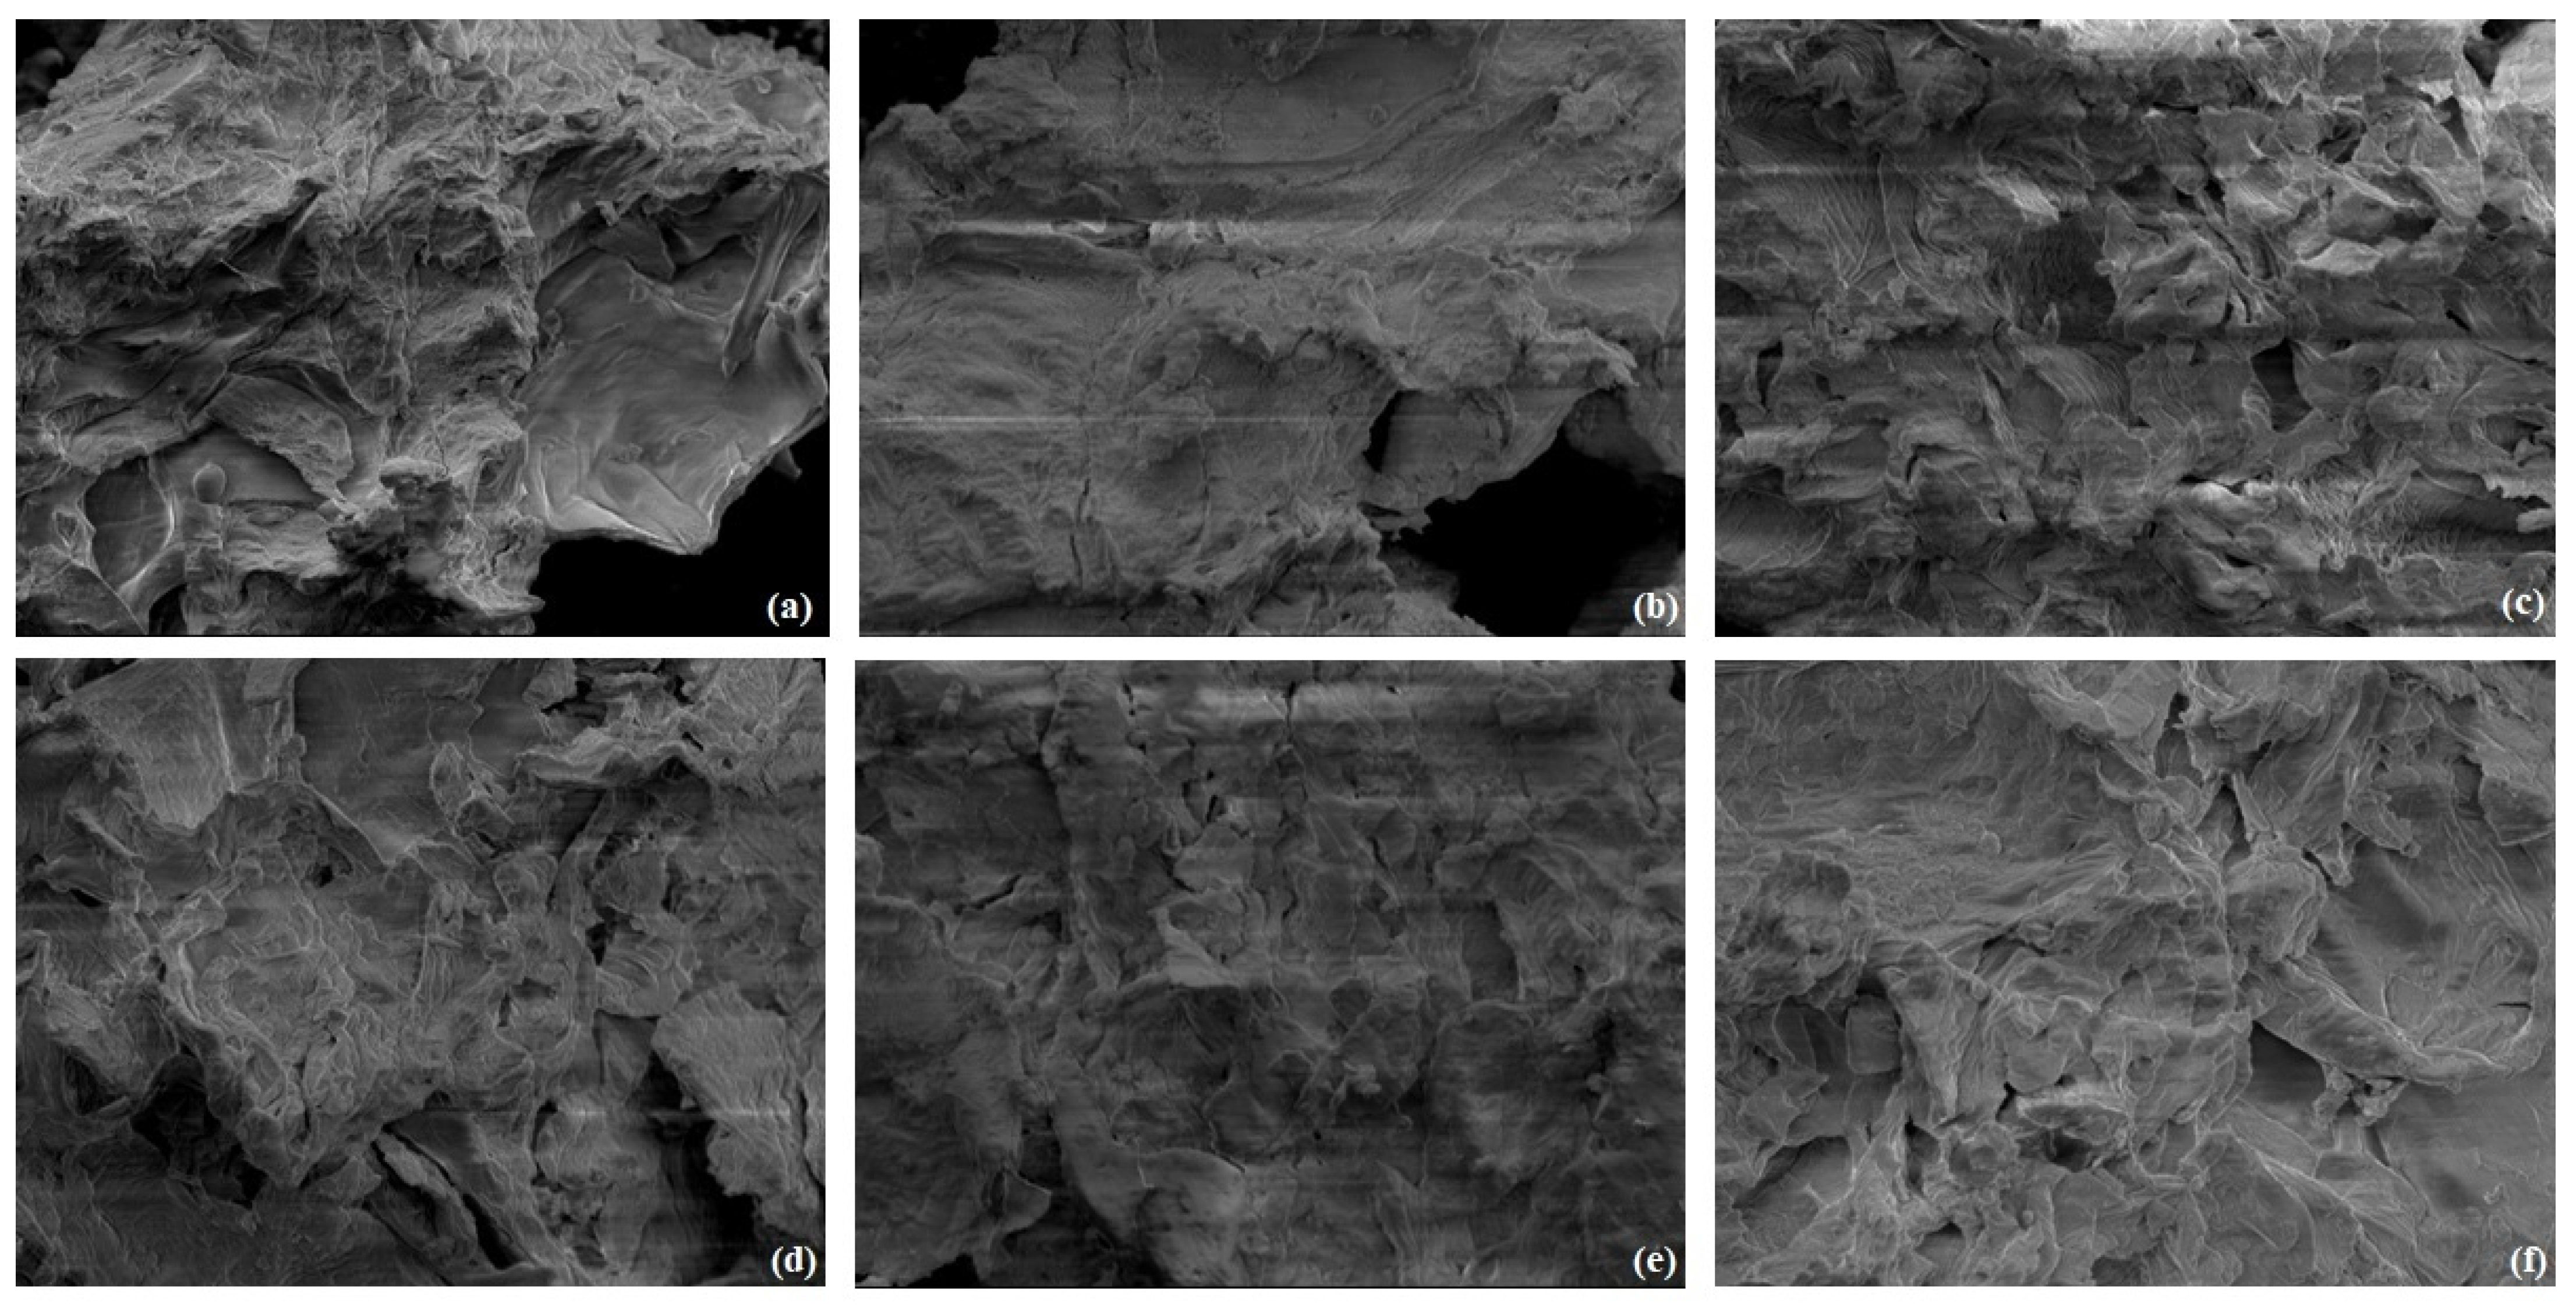
The external morphology of RHP and YHP before and after adsorption and the control samples treated only with deionized water at pH (2) were analyzed using SEM. Before adsorption, both adsorbents seemed to have similar appearances, with a rough surface and heterogeneous texture containing vacant cavities along the surface (Figure 2a,d). However, after adsorption, the surfaces of both adsorbents seemed to be less rough with a more full texture (Figure 2b,e). The control samples of RHP and YHP also exhibited an uneven and hollow texture (Figure 2c,f).
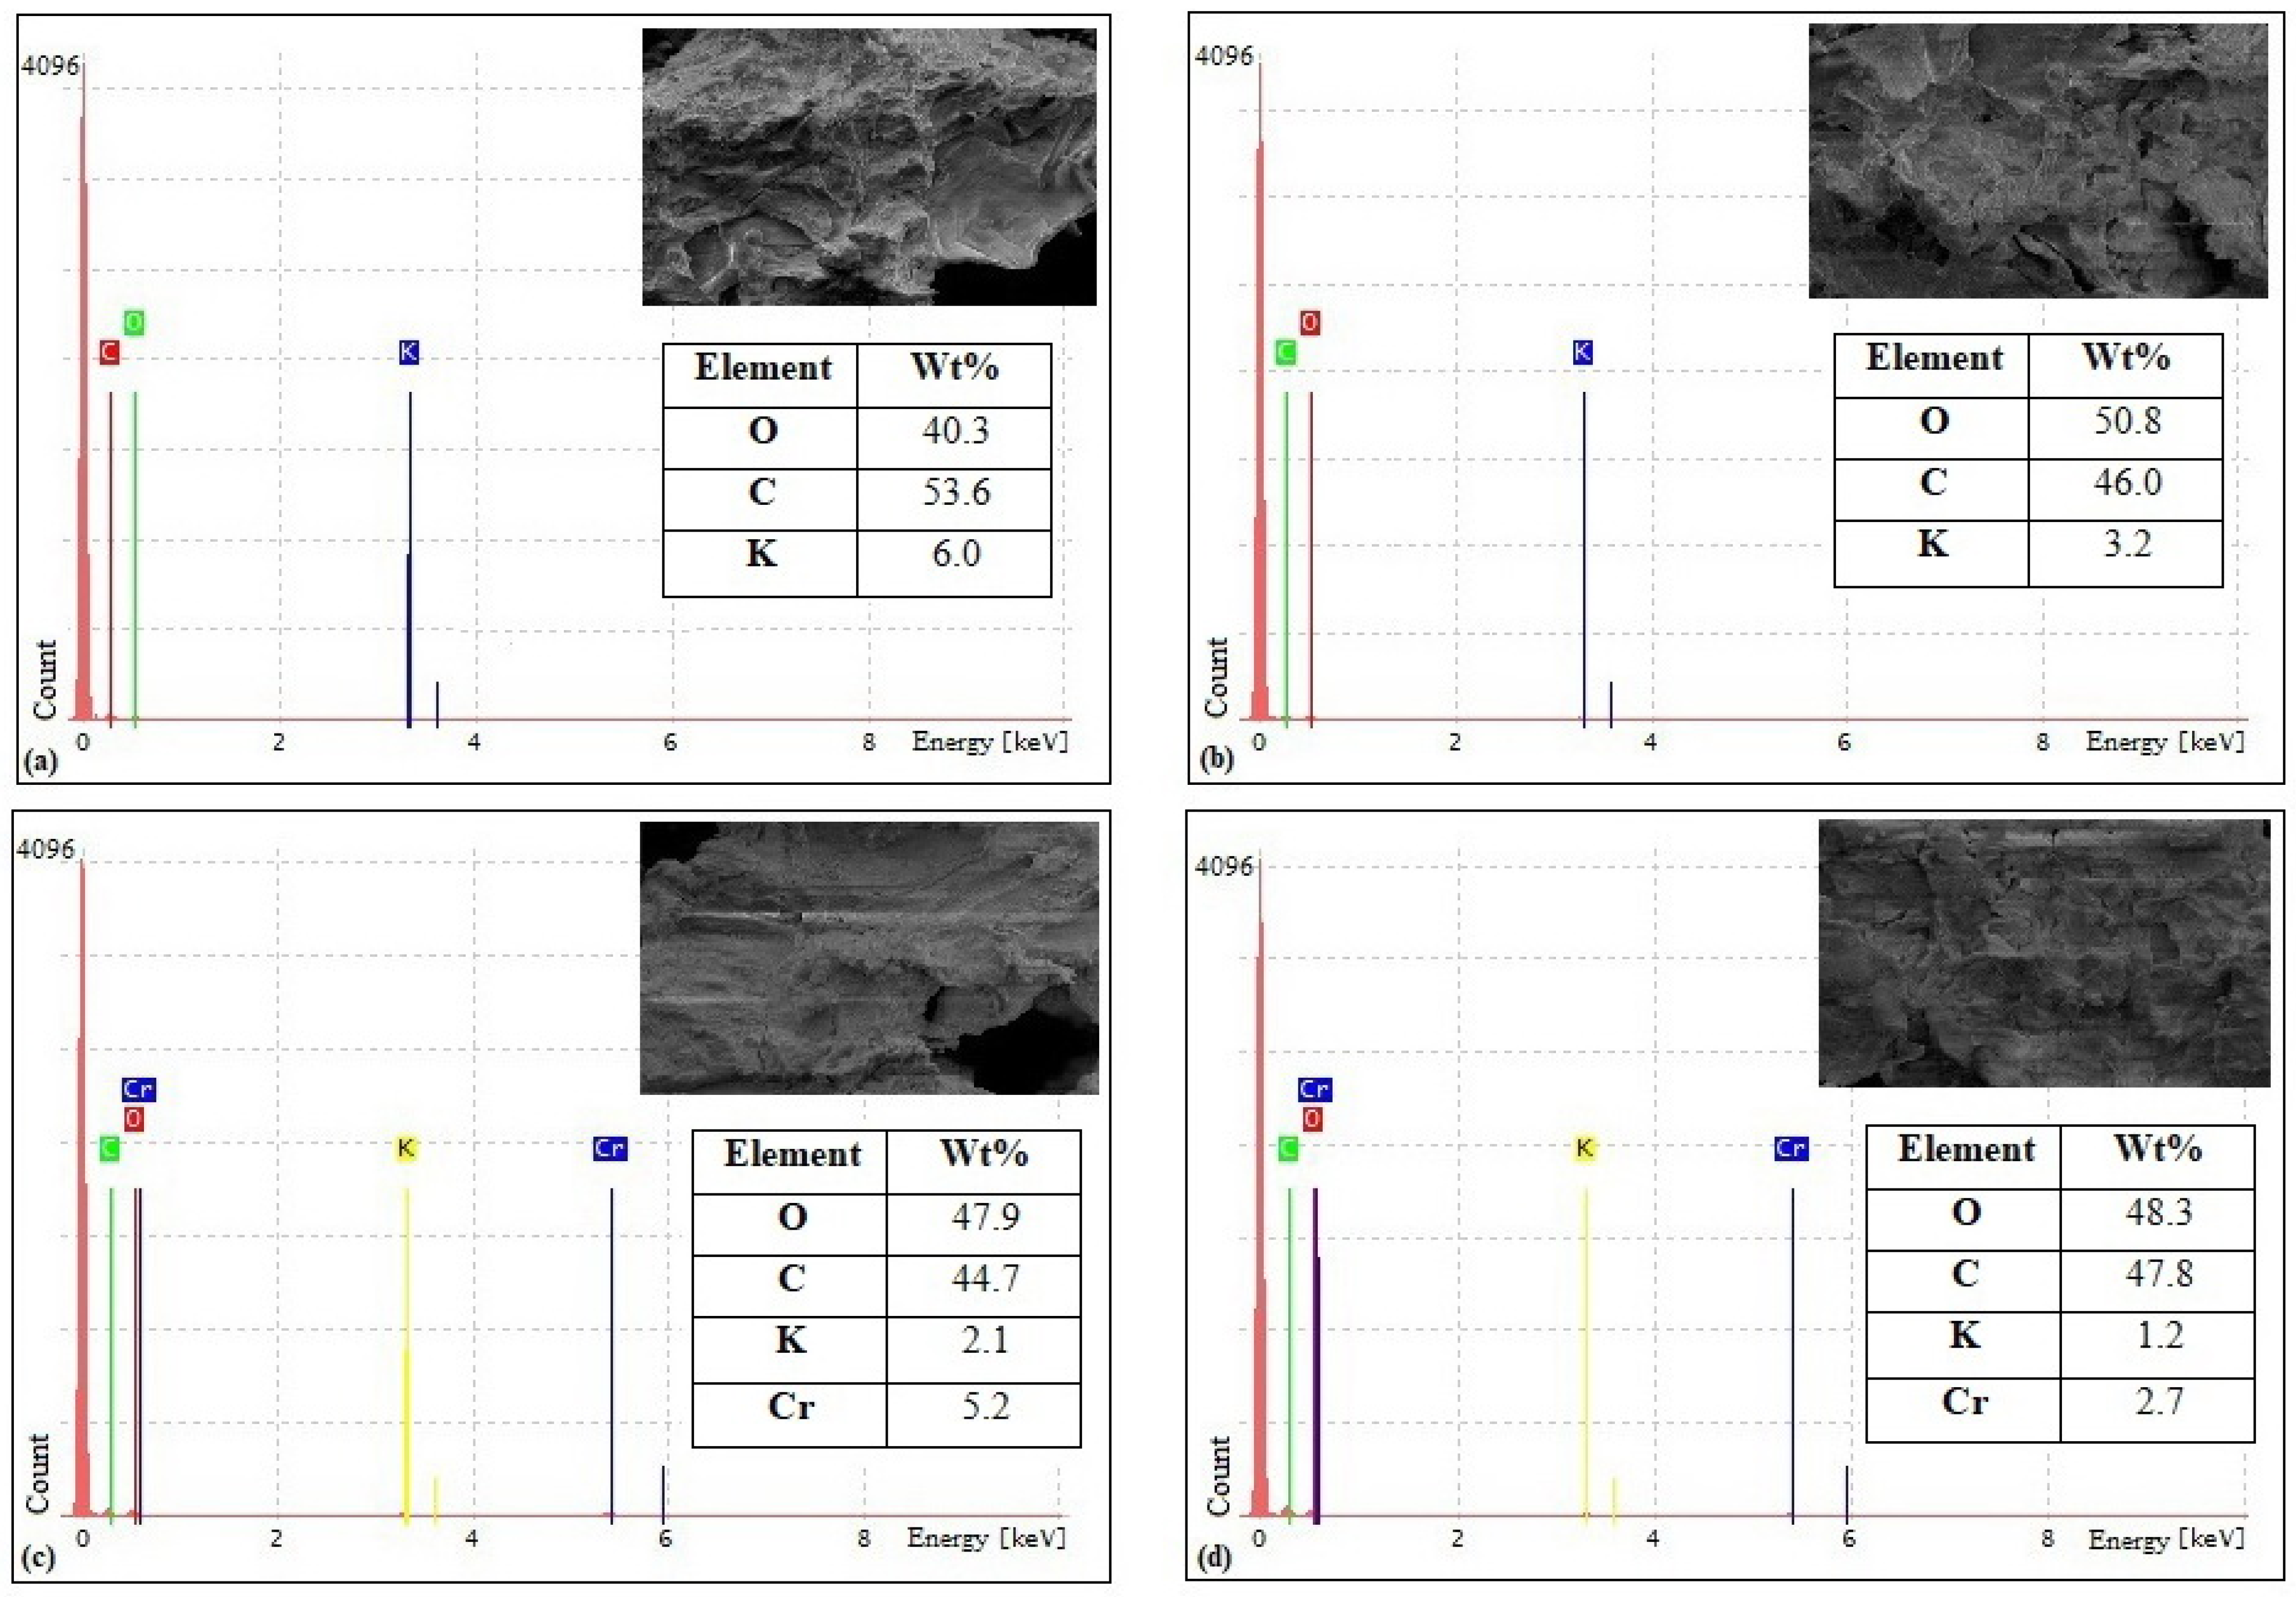
The elemental composition, as determined by EDX analysis, indicates that carbon (C) and oxygen (O) are the main constituents of the biosorbents, with minor traces of potassium (K) (Figure 3a,b). Specifically, carbon accounts for 53.6% and 46.0% of the composition, while oxygen makes up 40.3% and 50.8% for RHP and YHP, respectively. Figure 3c,d demonstrates the presence of chromium peaks in both biosorbents after adsorption.
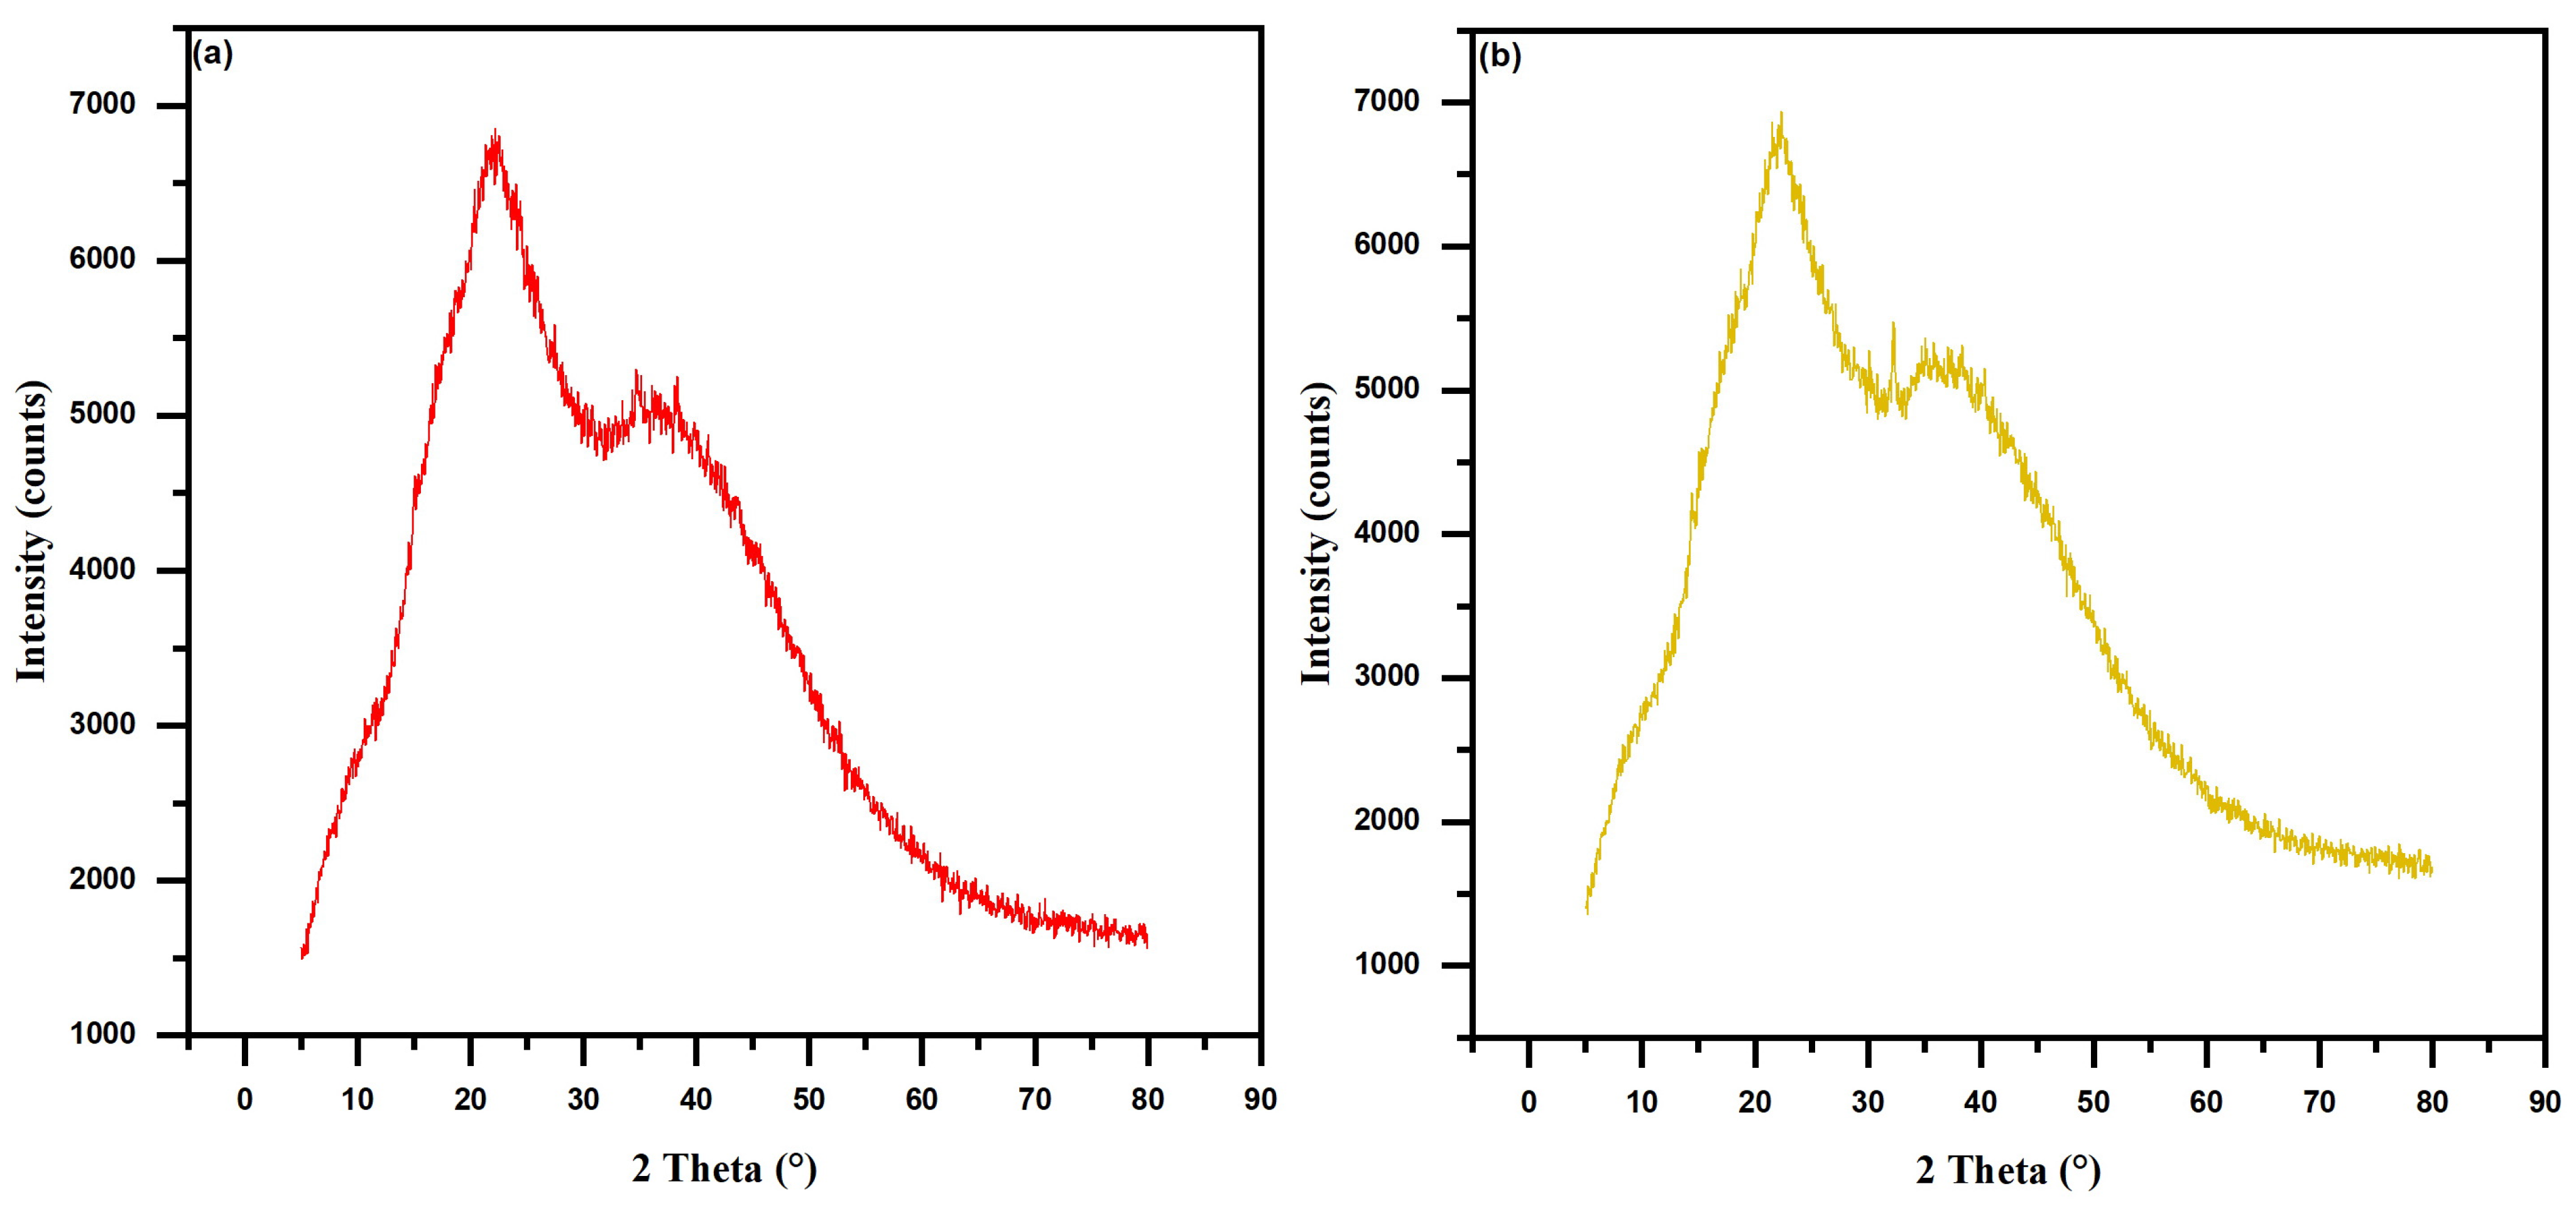
XRD was employed to examine the crystalline structures of RHP and YHP. Figure 4 demonstrates that no specific pattern associated with crystalline phases was detected. Instead, a wide band is observed within the 2 theta range of (5–30°) for both biosorbents.
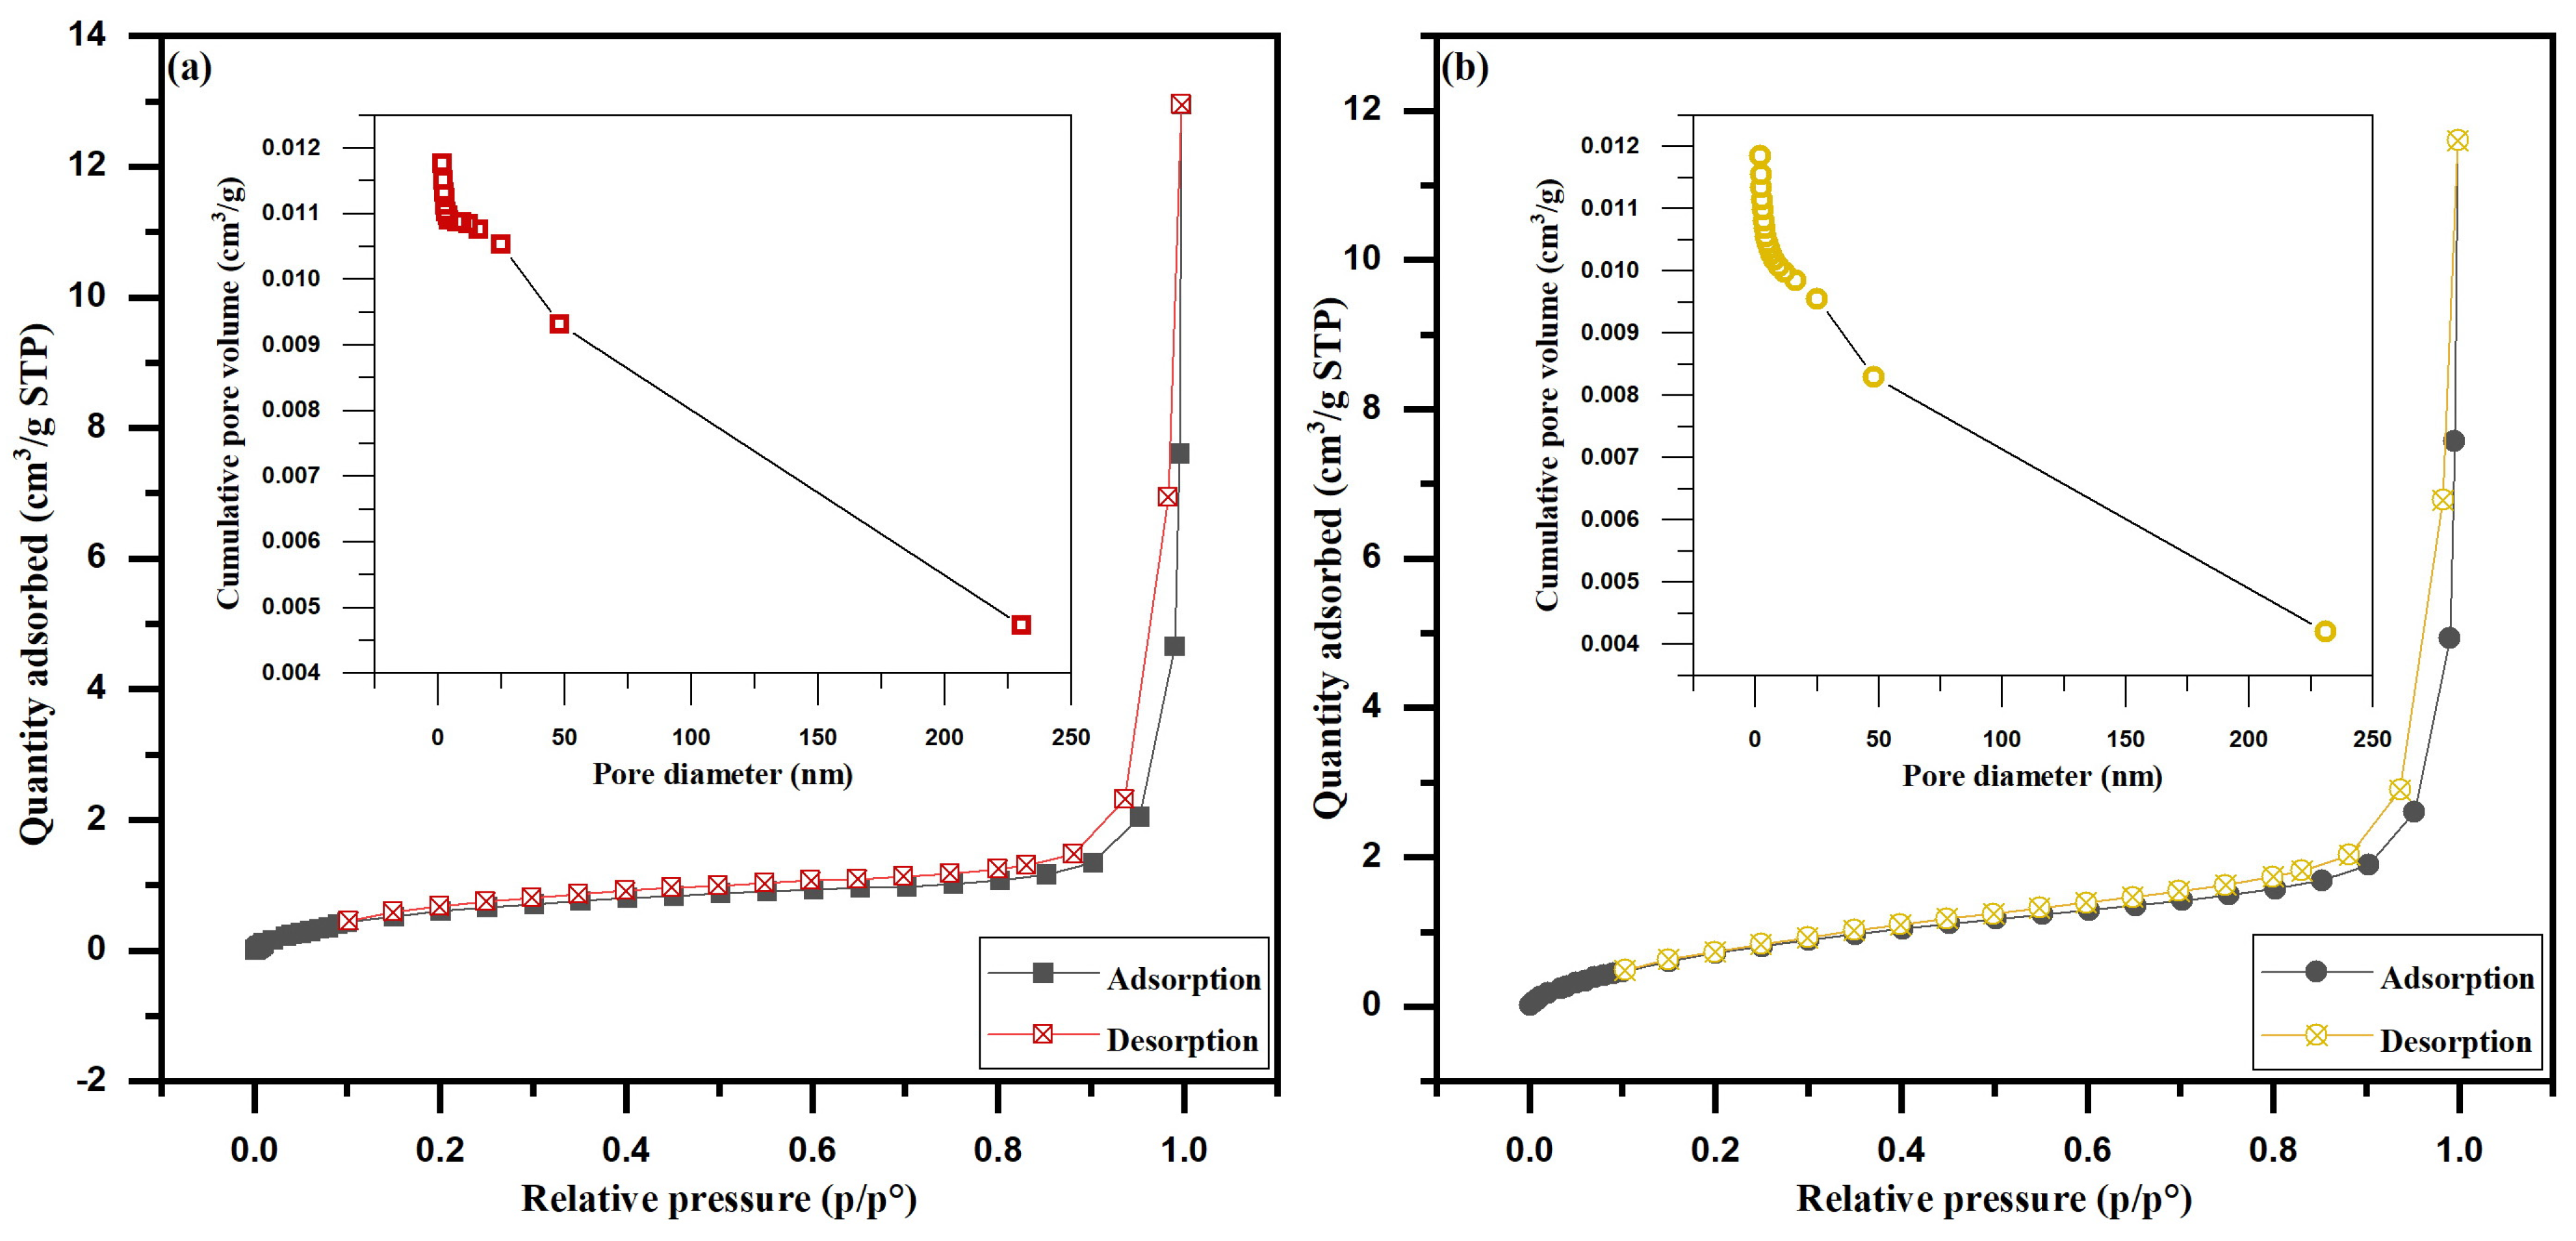
Figure 5 represents the N2 adsorption-desorption isotherm and the pore distribution of RHP and YHP. The textural characteristics of biosorbents are presented in Table 1. The BET surface area (SBET) was 2.6844 and 3.3244 m2/g for RHP and YHP, correspondingly. Their pore volumes were 0.003114 and 0.003987 cm3/g, with an average diameter of 21.1781 and 14.5149 nm, in the given order.
The point of zero charge (pHpzc), surface functional group concentration, and polyphenolic content of the husk aqueous extracts determined in our previous study are shown in Table 2 [37].

3.2. Quencher-Free Radical Scavenging Activity

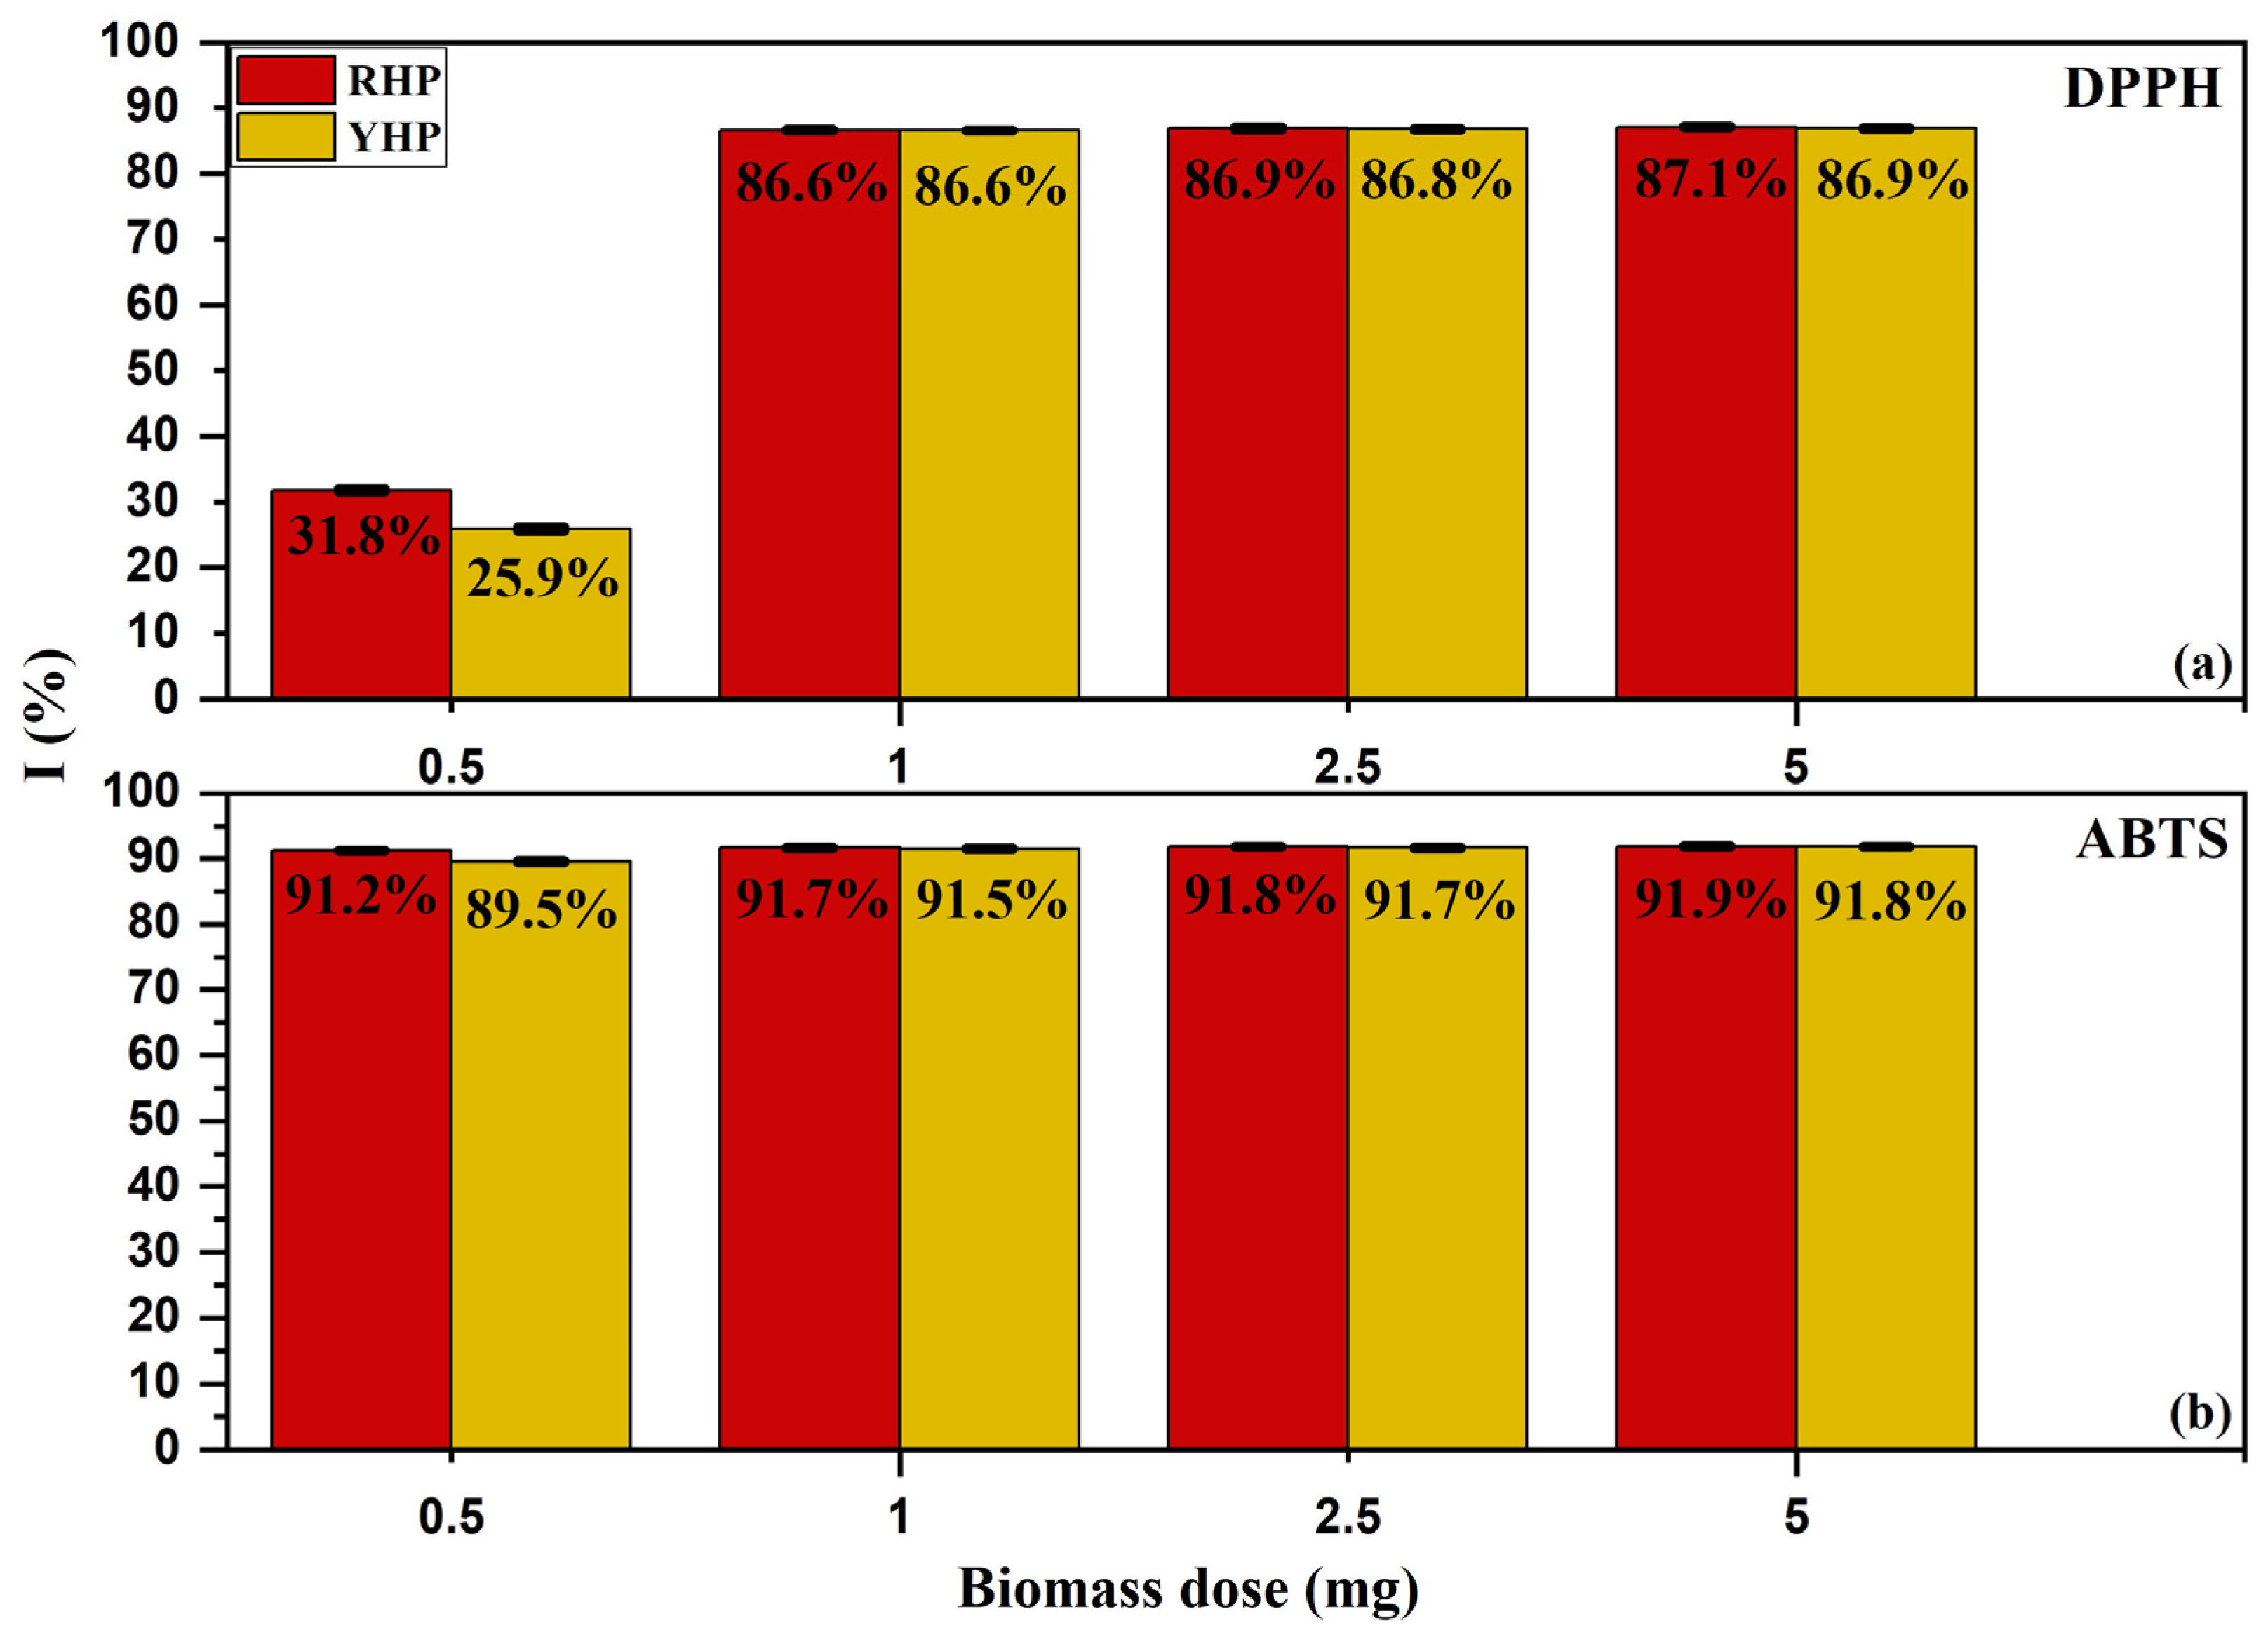
The results showed that both biomasses had a radical inhibition activity higher than 50% at all the doses used (0.5, 1, 2.5, and 5 mg); however, the RHP values were slightly higher than the YHP ones. The DPPH results presented in (Figure 6a) showed an inhibition of 38.1% and 25.9% at a dose of 0.5 mg of the RHP and YHP, correspondingly. After that, the radical inhibition percentage escalated to 86.6% at the 1 mg dose for both biomasses. At a high dose of 5 mg, the inhibition reached 87.1% and 86.9% for RHP and YHP, in that order. Similar results were found for the ABTS assay presented in (Figure 6b), with a radical inhibition percentage of 91.2% and 89.5% at a low dose of 0.5 mg for RHP and YHP, sequentially. Afterward, the inhibition activity increased above 90% for all doses to reach 91.9% and 91.8% at a dose of 5 mg for the red and yellow husk powders, in succession.

3.3. Biosorption Studies

3.3.1. pH Effect

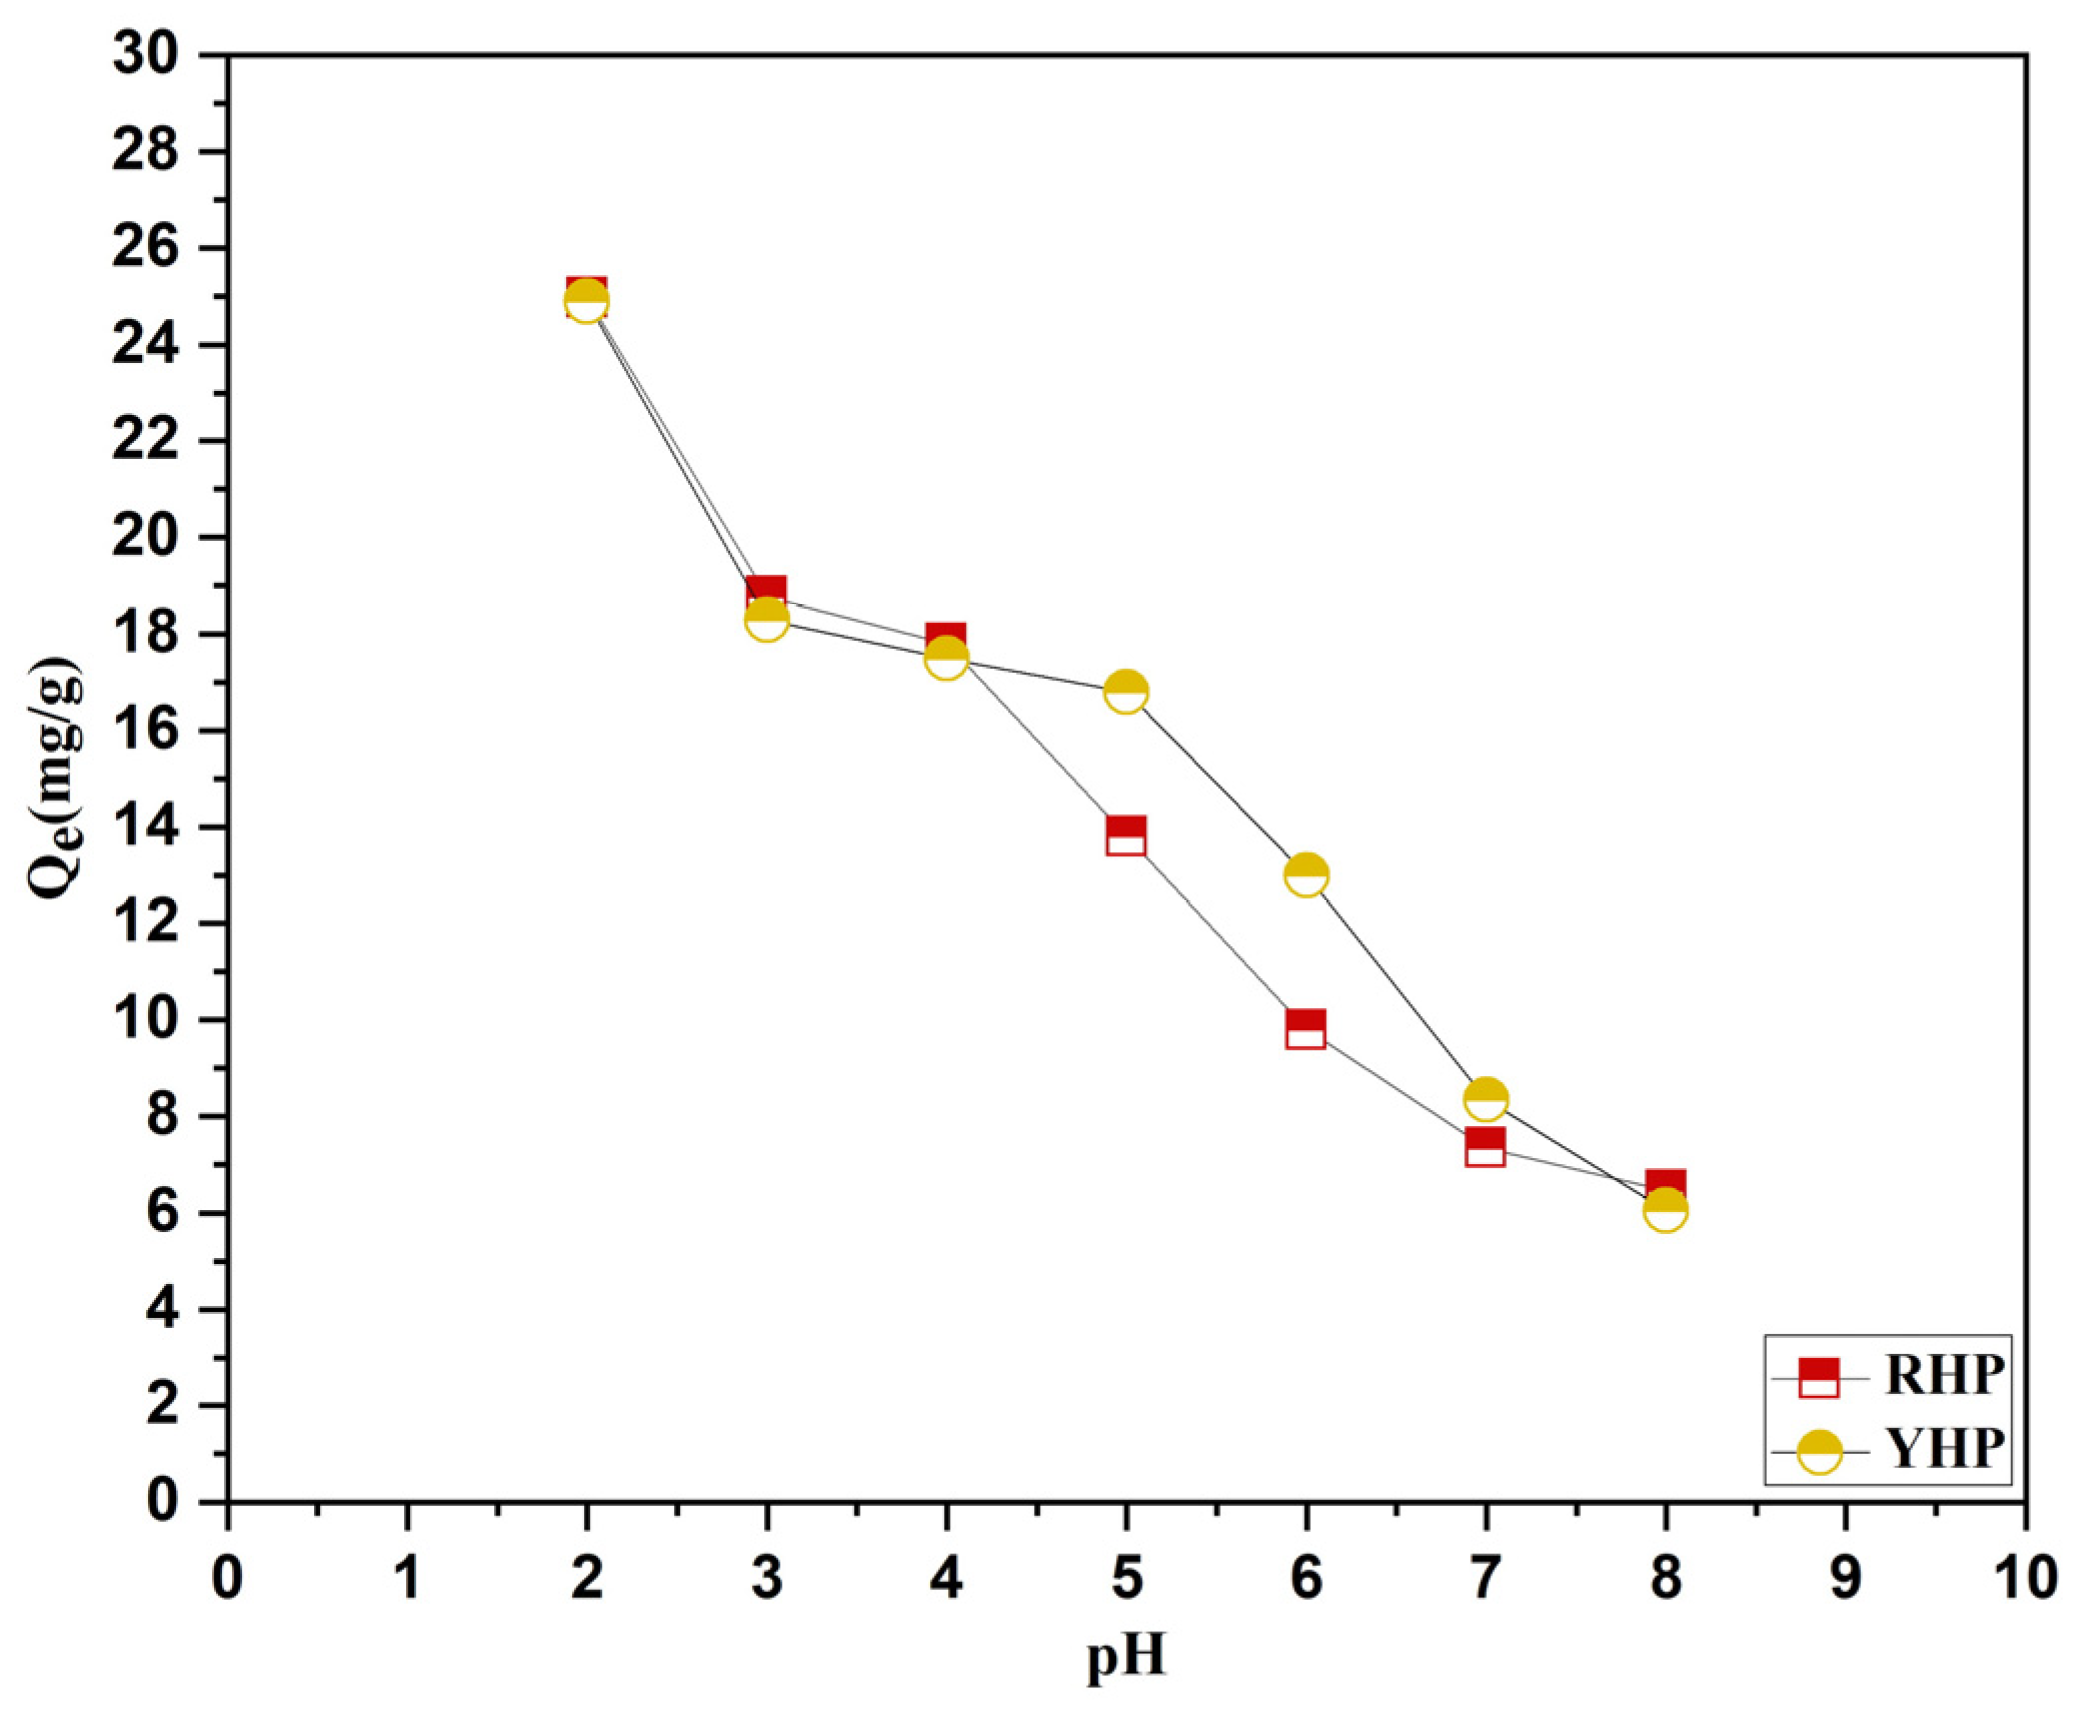
Adsorption of Cr(VI) was studied in the pH range of 2 to 8, and the effect of pH on RHP and YHP adsorbents is shown in Figure 7. The results showed that the adsorption capacity of the adsorbents decreased with increasing pH. In fact, the adsorption capacity was the highest at pH (2) with a Qe of 24.98 and 24.90 mg/g for the RHP and YHP, respectively. Furthermore, it reduced to reach a Qe of 6.46 and 6.04 mg/g at high pH value (8) for the RHP and YHP adsorbents, successively.

3.3.2. Biosorbent Dose and Solid/Liquid Ratio Effect

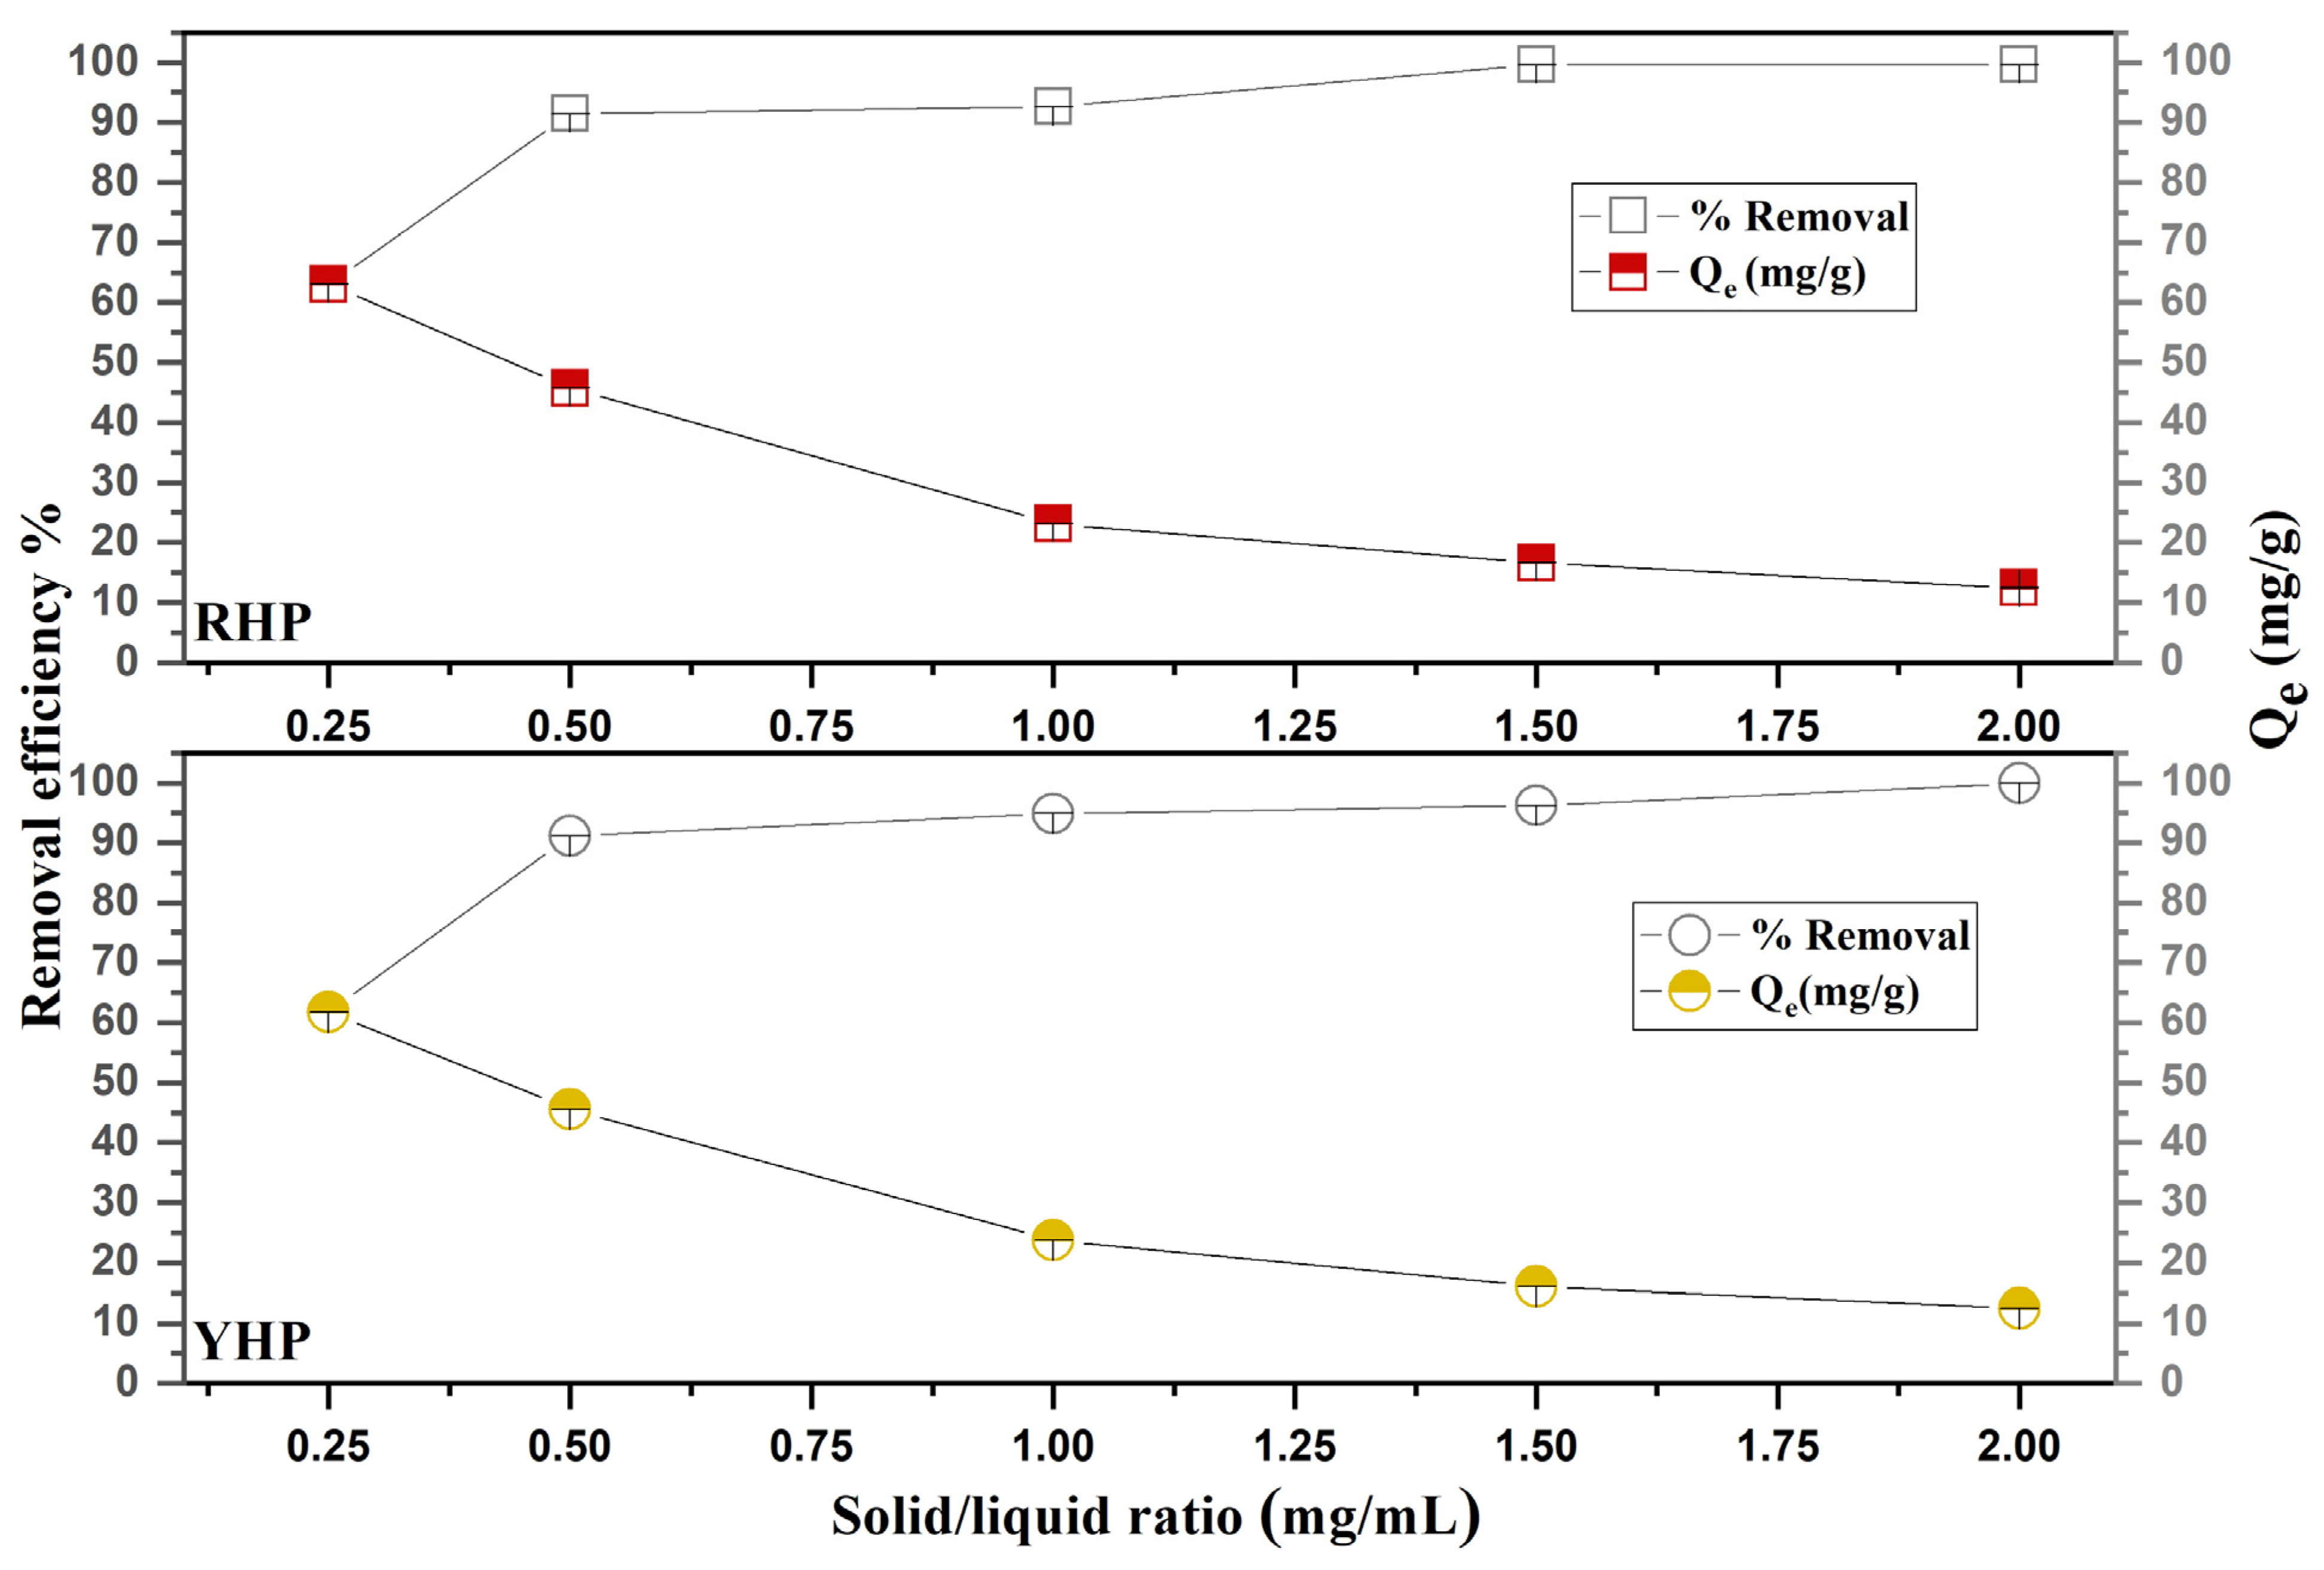
The effect of the biosorbent dose and solid/liquid ratio on the adsorption process was established using different RHP and YHP doses, ranging between 0.25 and 2 mg/mL. On the one hand, the results revealed that increasing the biosorbent dosage and S/L ratio increases the removal percentage of Cr(VI) ions (Figure 8). In fact, at a low S/L ratio of 0.25 mg/mL, the removal rate of Cr(VI) ions was 63.06% for RHP and 61.77% for YHP. When the S/L ratio reached only 0.5 mg/mL, the elimination rate of Cr(VI) ions increased to 91.45% and 91.16% for RHP and YHP, respectively. At a high S/L ratio of 2 mg/mL, this rate reached 99.60% and 99.90% for both red and yellow biomasses, respectively. On the other hand, the adsorption capacity of both biosorbents was shown to be oppositely correlated to the biosorbent dose and S/L ratio, as presented in Figure 8. In fact, it decreased from 63.06 and 61.77 mg/g at 0.25 mg/mL to 12.45 and 12.48 mg/g at 2 mg/mL for the RHP and YHP, consecutively.

3.4. Isotherms Modeling

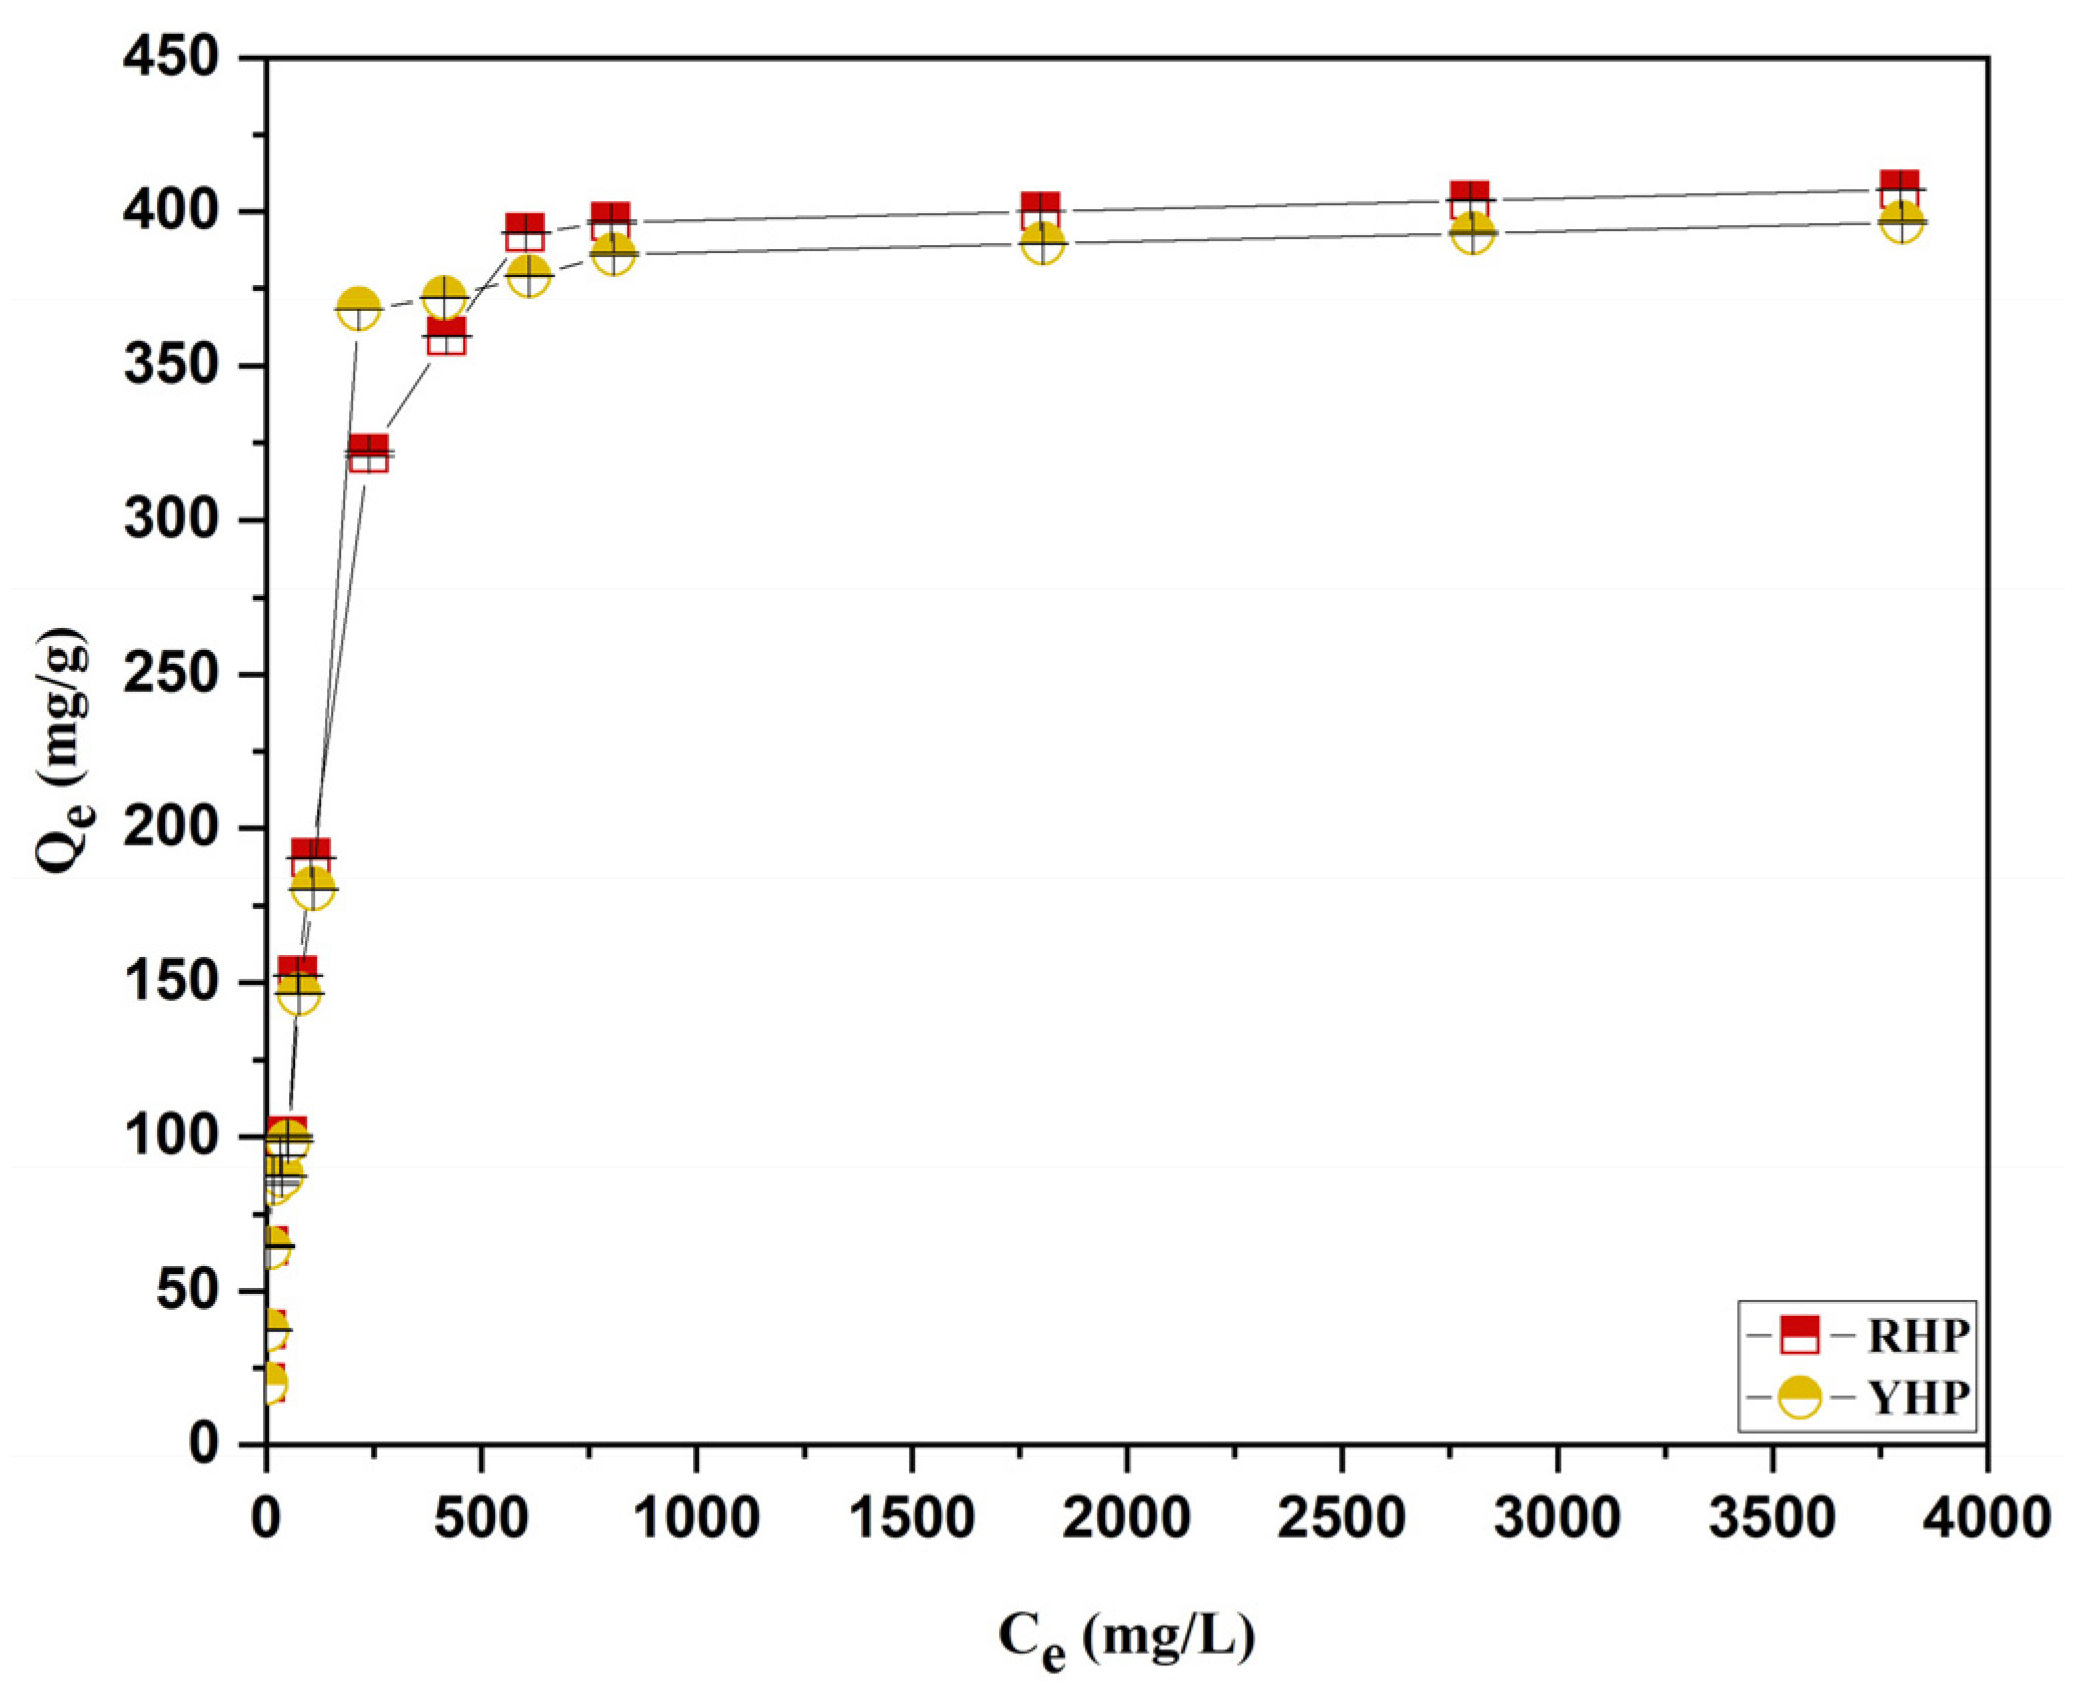
The influence of the initial Cr(VI) ion concentration on the adsorption was carried out using different concentrations between 10 and 4000 mg/L. The results presented in Figure 9 show that the initial metal concentration is proportional to the Cr(VI) uptake by both biosorbents. In fact, the adsorption capacity increased by increasing chromium concentration and started to stabilize around Ce of (414.03–420.17 mg/L) with a Qe of 359.64 and 371.92 mg/g for RHP and YHP biosorbents, respectively. After that, the adsorption capacity reached a plateau, and any increase in the metal concentration had no significant effect on the adsorption capacity for both RHP and YHP.
The Langmuir, Freundlich, and D-R models were utilized in this work to match the data from the adsorption equilibrium. The estimated isotherm parameters are displayed in Table 3. As for the Langmuir model (Figure 10a,b), the maximum theoretical adsorption capacity was comparable for both biosorbents, with a Qmax of 413.22 and 403.22 mg/g for the RHP and YHP, respectively. This similarity was also exhibited in the experimental adsorption capacity of the biosorbents, as they both had approximate Qm values of 407.01 and 396.49 mg/g for RHP and YHP, accordingly. The coefficient of regression was also similar for both RHP (R2 = 0.99889) and YHP (R2 = 0.9985) biosorbents, and the separation factor RL was in the range of (0.014–0.861) for the two of them.
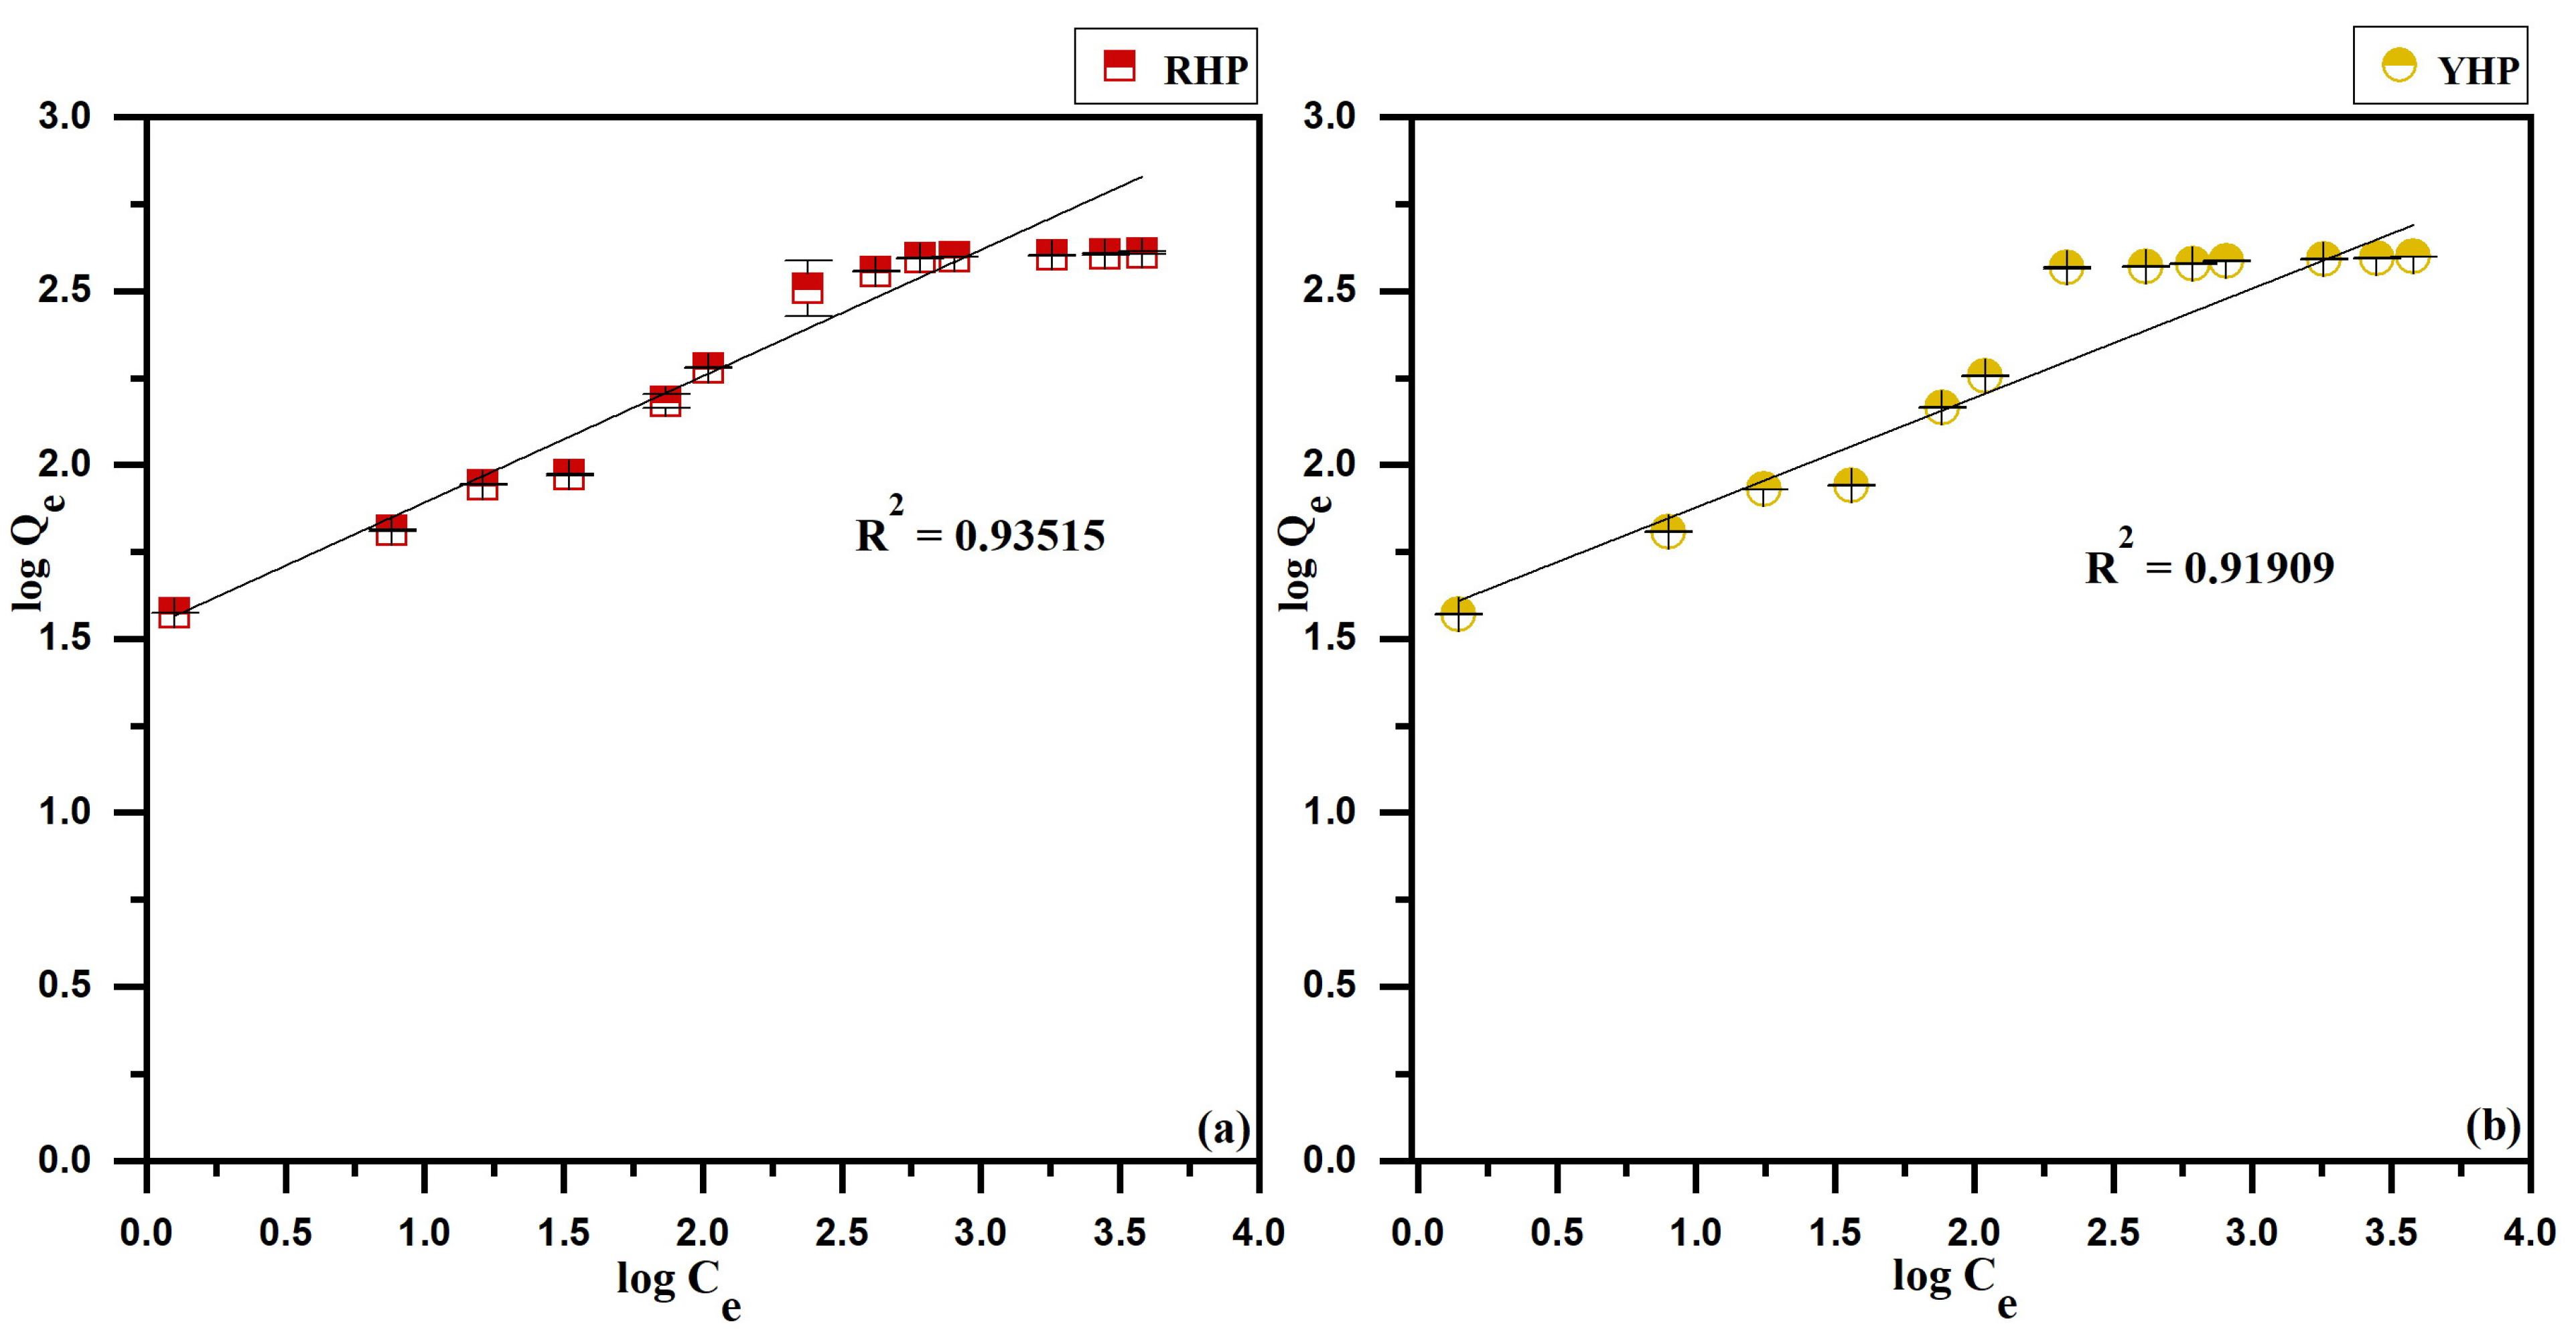
As for the Freundlich model (Figure 11a,b), the regression coefficient was R2 = 0.93515 and R2 = 0.91909 for the RHP and YHP, respectively. The reciprocal form of the adsorption intensity constant 1/nf was 0.3629 and 0.3659 for the red and yellow biosorbents, respectively.
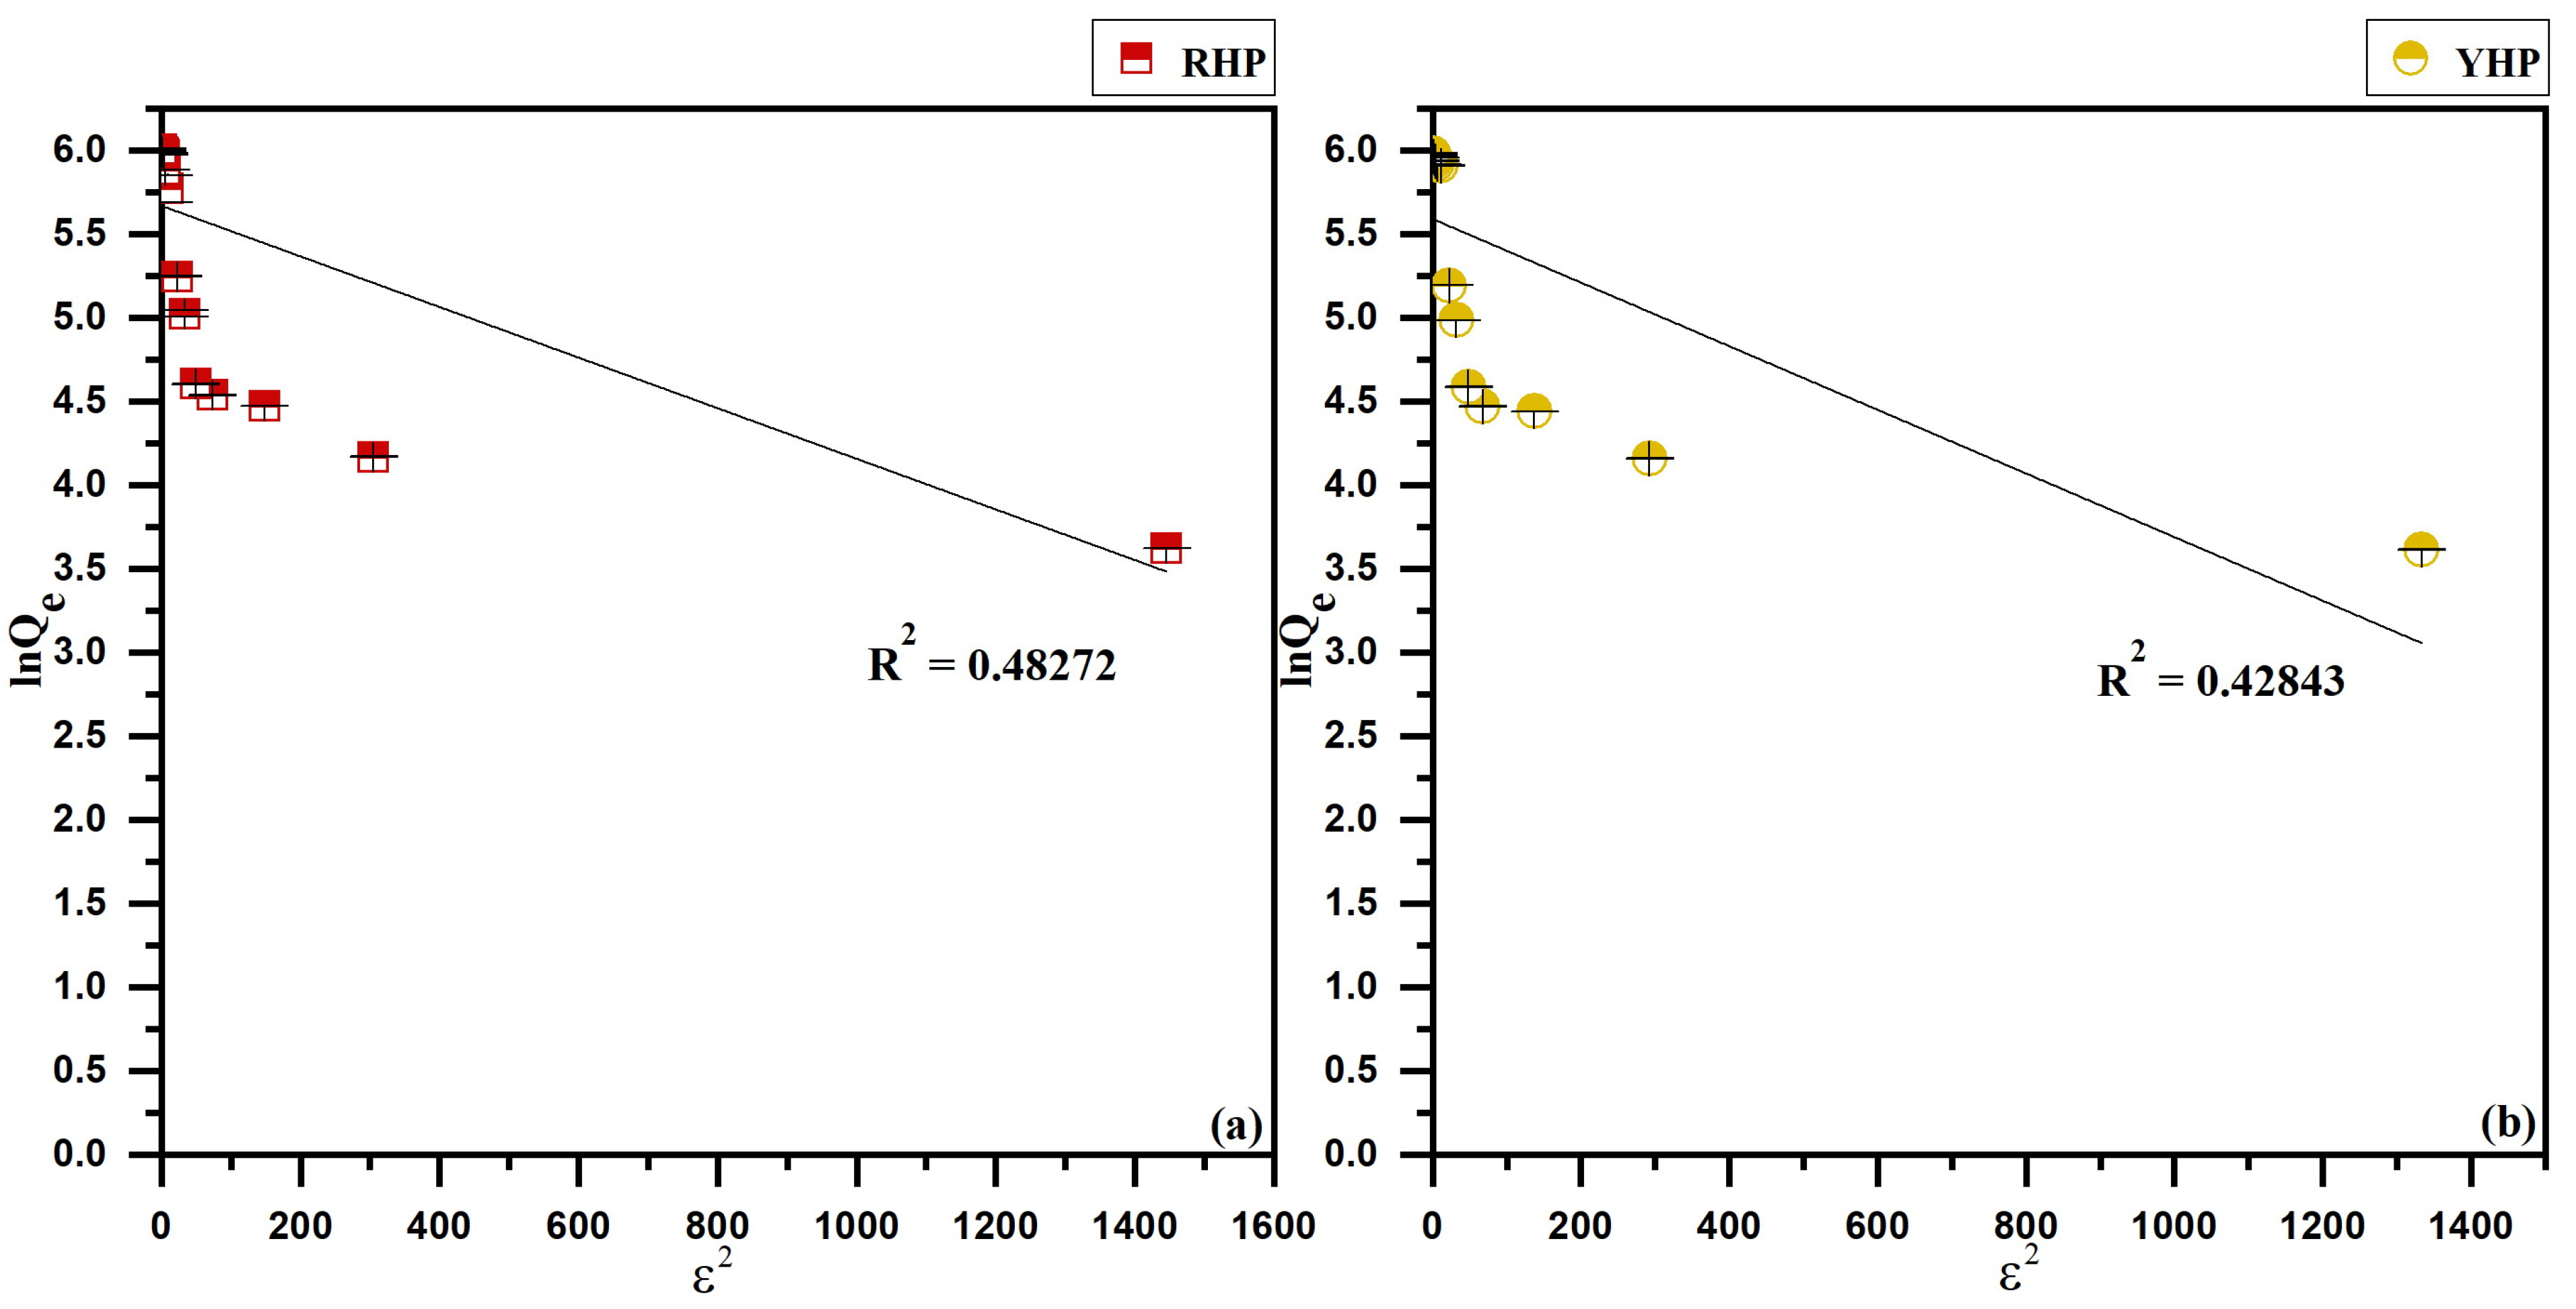
The D-R model (Figure 12a,b) showed a correlation coefficient of R2 = 0.48272 and R2 = 0.42843 for RHP and YHP, respectively. The Qmax was 235.28 and 235.28 mg/g for the red and yellow sorbents, respectively. The mean adsorption energy of the D-R isotherm was E = 18.25 kJ/mol and E = 17.51 kJ/mol, for RHP and YHP, correspondingly.

3.5. Kinetics Modeling

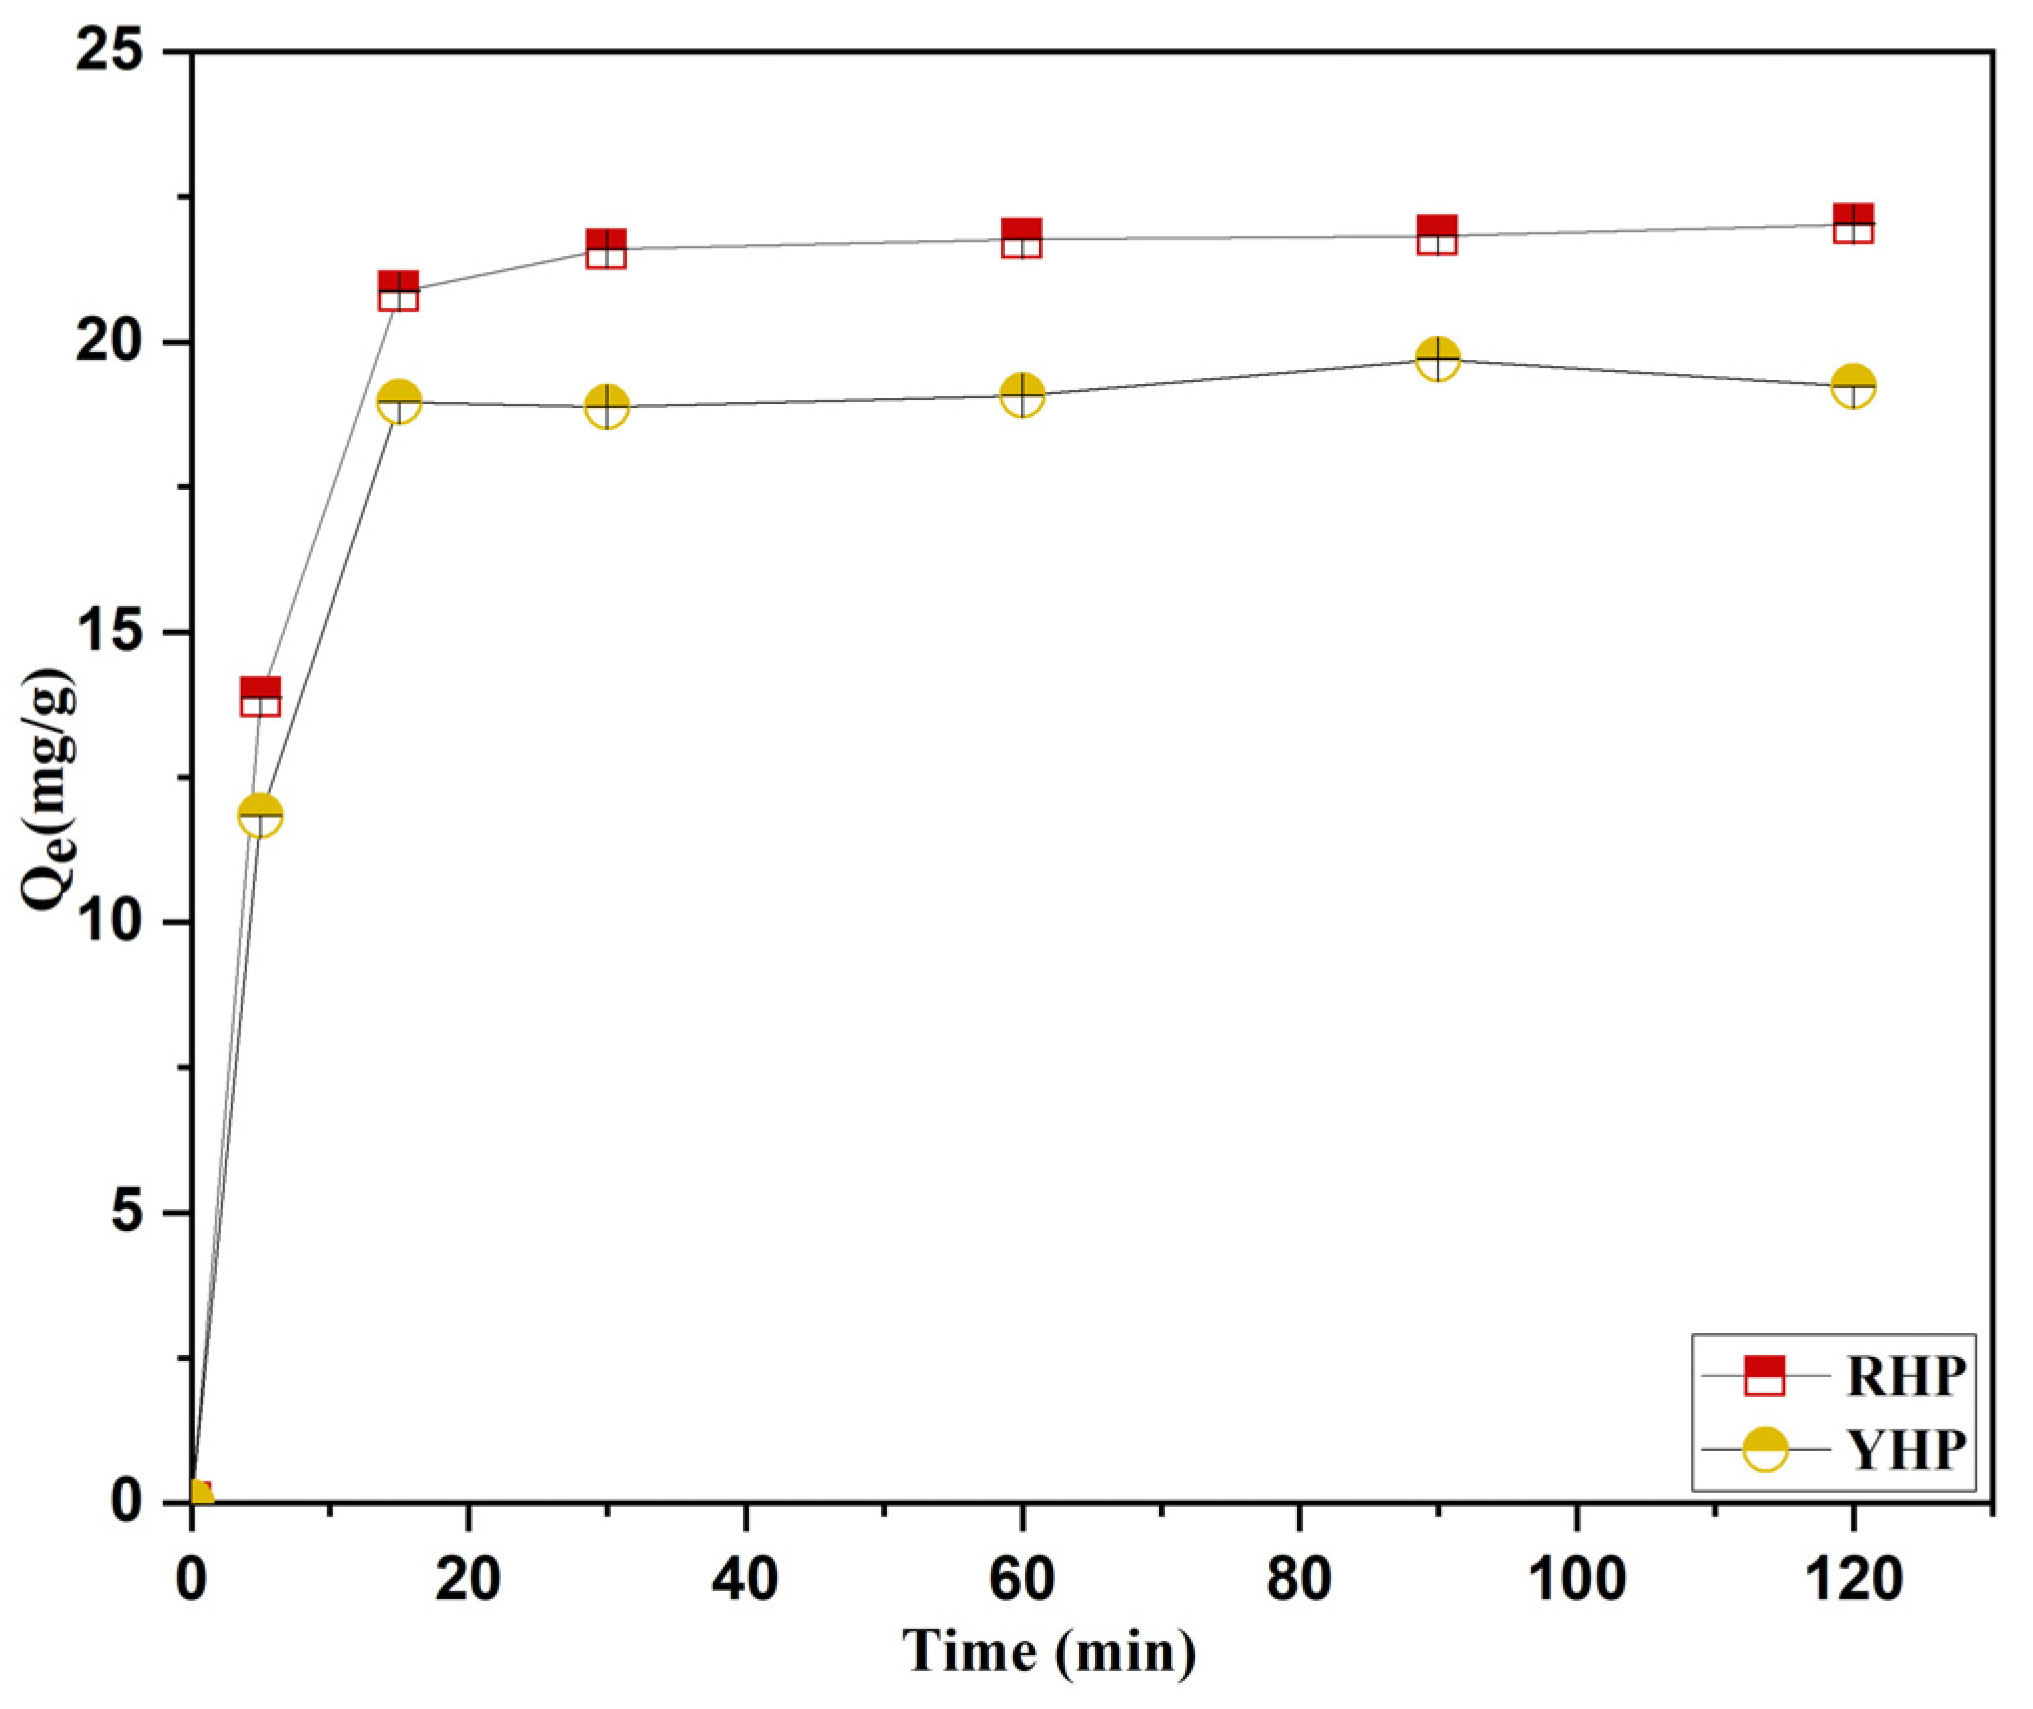
The effect of contact time on the Cr(VI) uptake was carried out by varying contact time from 0 to 120 min. The results presented in Figure 13 show that the Cr(VI) adsorption capacity escalated rapidly for the first fifteen minutes. After that, it increased slowly until reaching equilibrium within 60 min, with a Qe of 21.76 and 19.07 mg/g for RHP and YHP, respectively. Any additional increase in contact time had no notable influence on the adsorption capacity of both RHP and YHP biosorbents.
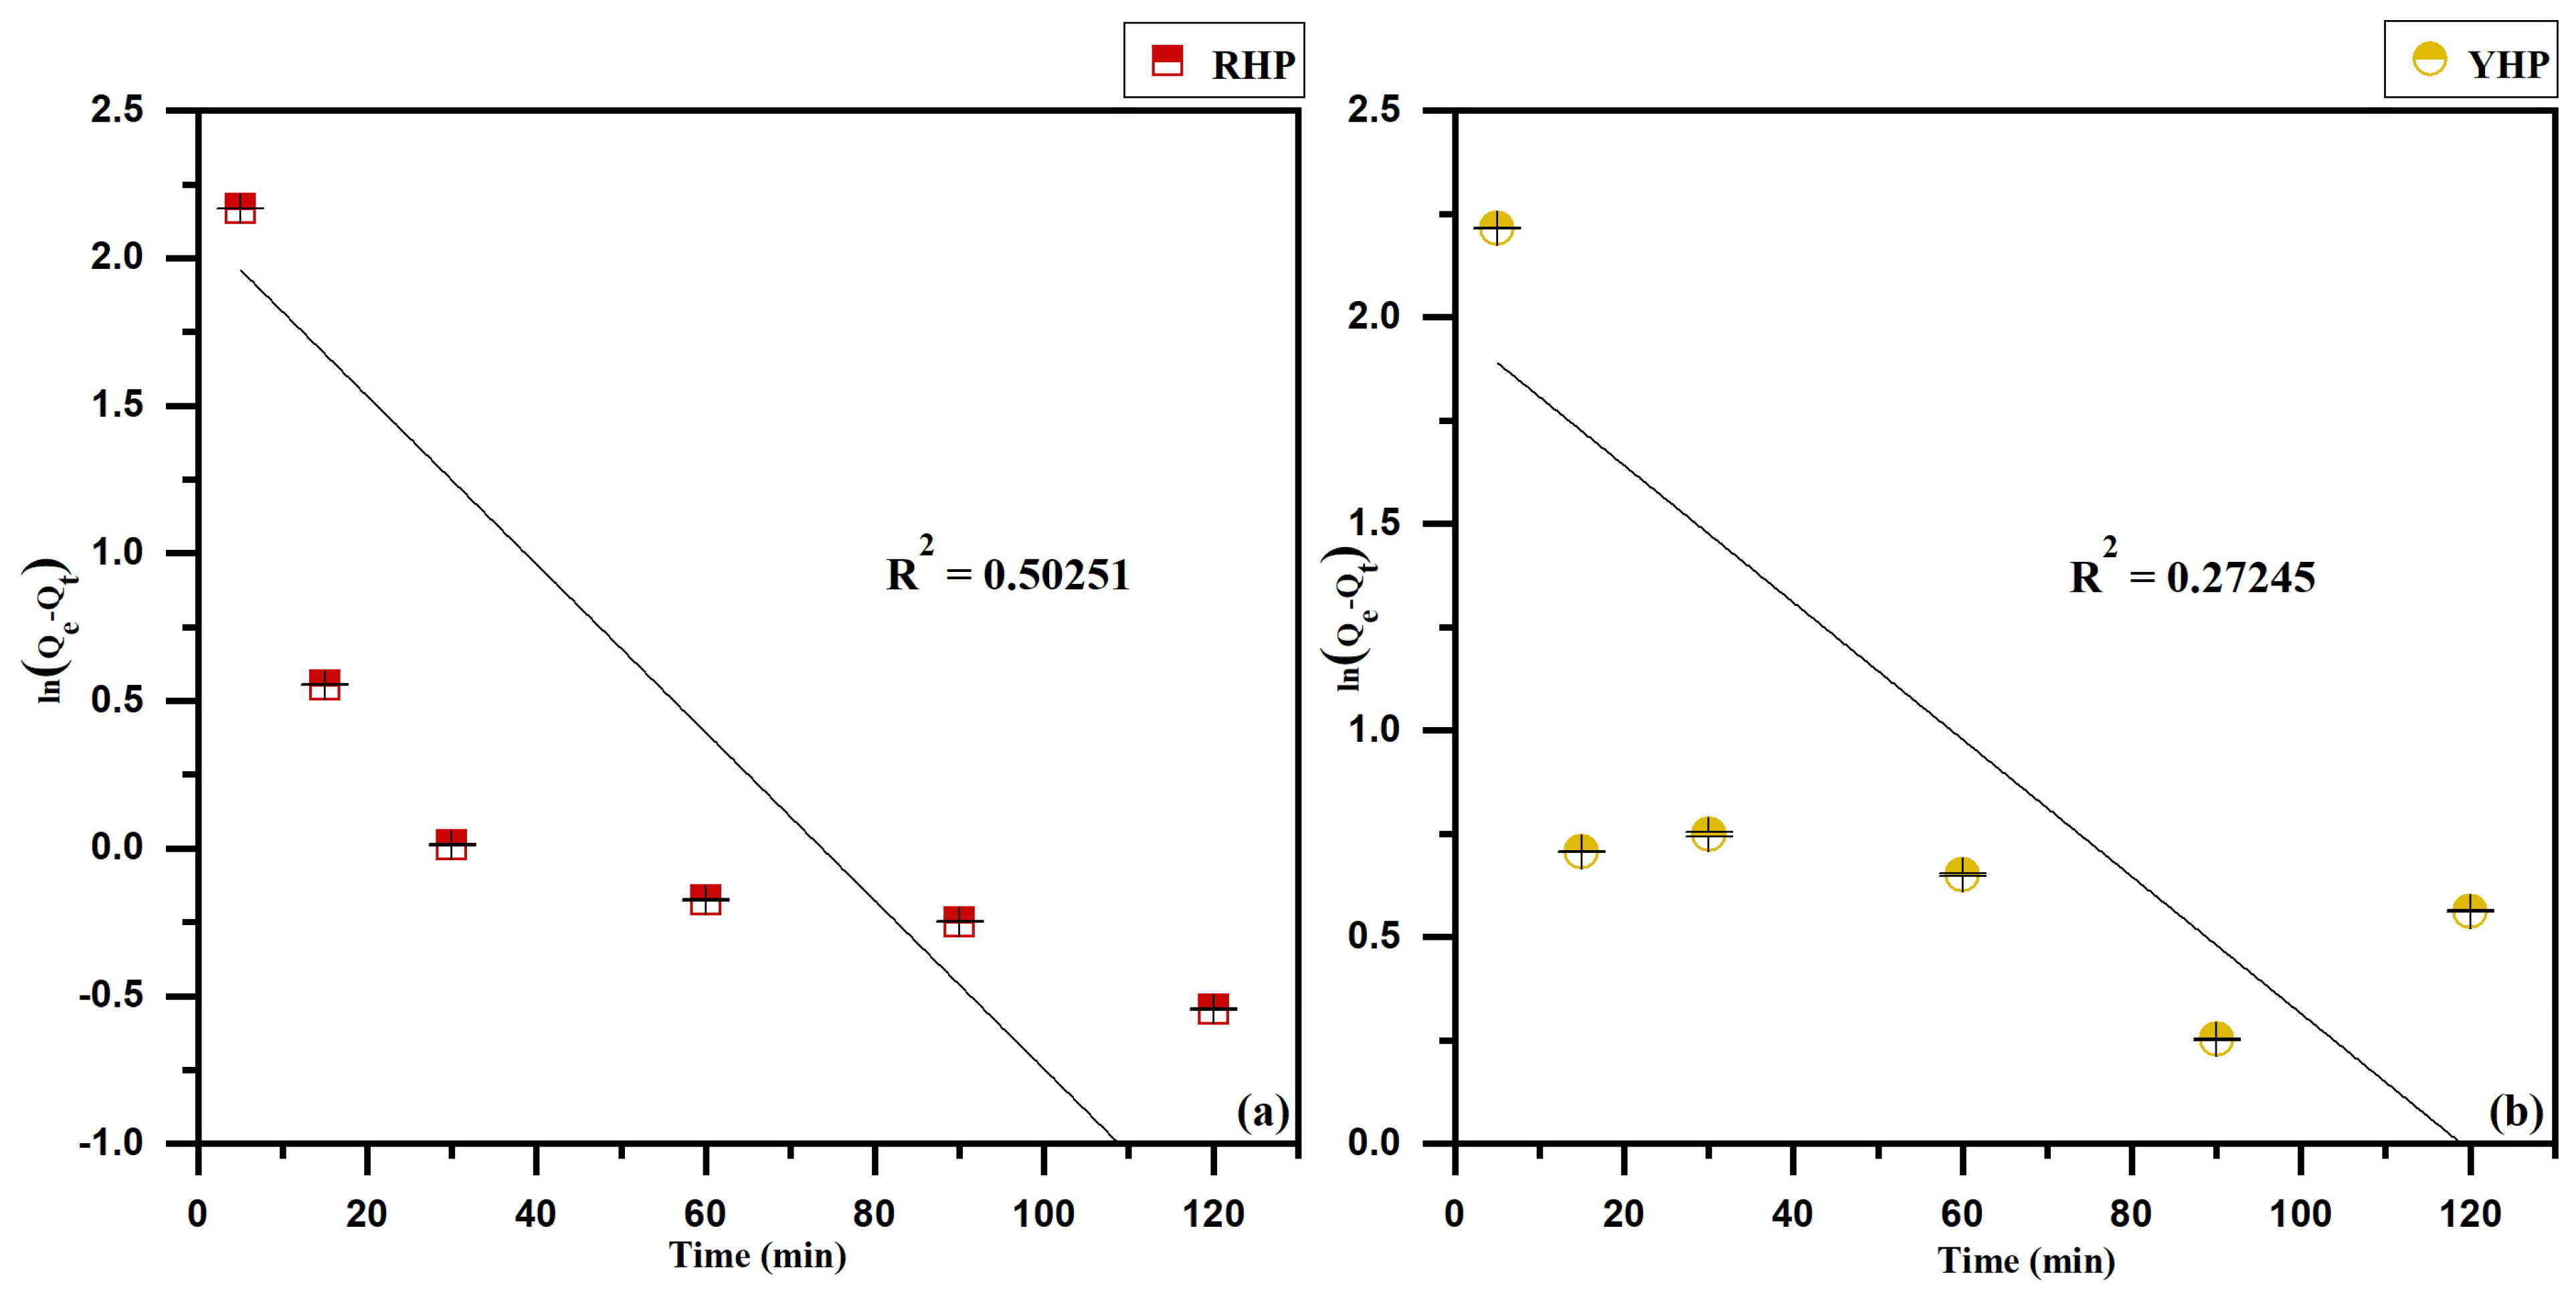
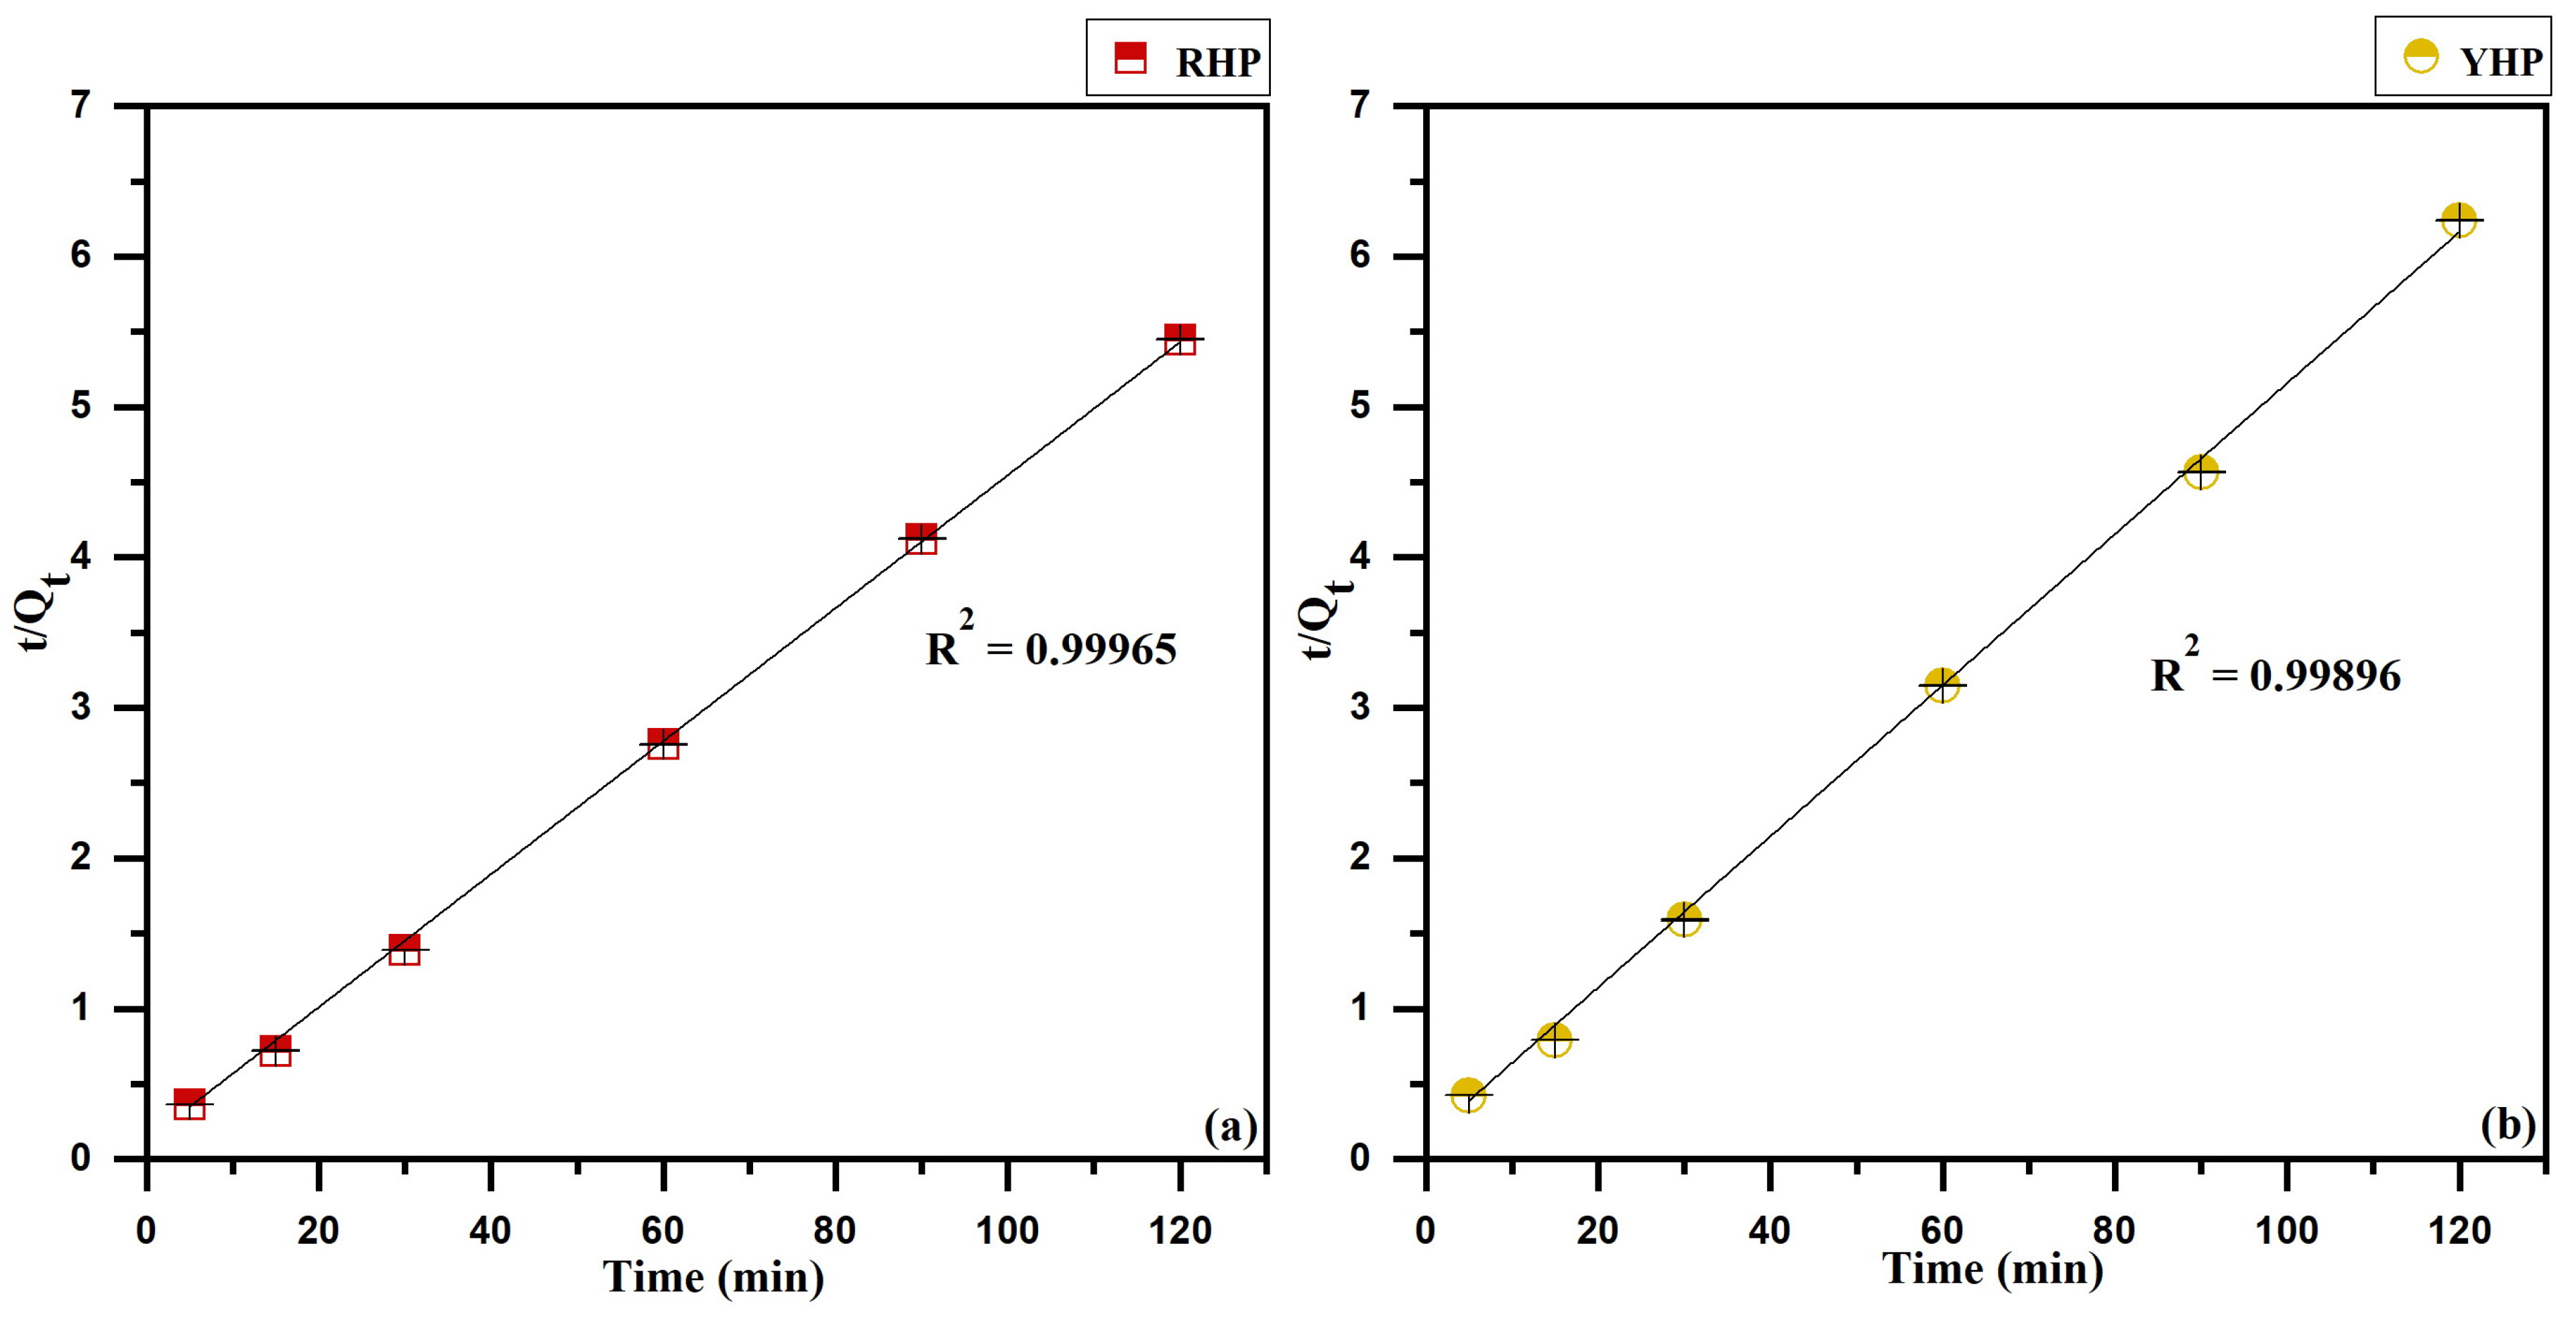
The acquired kinetic results were analyzed using pseudo-first-order, pseudo-second-order and Elovich models. The order of regression coefficient values of the different models was: pseudo-second order > Elovich > pseudo-first-order. In fact, the correlation coefficient was R2 = 0.50251 and R2 = 0.27245 for the pseudo-first-order model (Figure 14), and R2 = 0.6443 and R2 = 0.58122 for the Elovich one (Figure 15), for the RHP and YHP biosorbents, respectively.
However, the pseudo-second order model (Figure 16) exhibited the highest regression coefficients, R2 = 0.99965 and R2 = 0.99896 for RHP and YHP, respectively. Moreover, the calculated adsorption capacity Qe of the RHP was closer to the experimental adsorption capacity (Qe = 22.6 mg/g) in the pseudo-second-order model (Qe = 22.36 mg/g) than the pseudo-first-order one (Qe = 3.31 mg/g). The same goes for the YHP that had an experimental Qe of 20.99 mg/g, which is much closer to the calculated Qe in the pseudo-second-order (Qe = 19.71 mg/g) than in the pseudo-first-order one (Qe = 3.98). The kinetic parameters estimated from the kinetic models linear plots are shown in Table 4.

4. Discussion

4.1. Biosorbents Characterization

The FTIR spectra revealed that the stretching of hydroxyl bonds O-H indicates the presence of phenolic compounds, carboxylic acid, polysaccharides, and presumably traces of water. The aliphatic groups C-H refer to the presence of alkanes. The carbonyl groups C=O can be due to the presence of cellulose in the biomass husk [54]. These findings match the results of our previous study on the pomegranate husk, which was shown to be rich in carboxylic, lactonic, and phenolic groups (Table 2), as well as the high polyphenolic content of the husks aqueous extracts with 102.9 ± 0.9 and 85.9 ± 1.3 (mg gallic acid equivalent/per gram of dry weight) for the red and yellow varieties, correspondingly [37]. The changes in the spectra, including wavenumber shifting and peaks disappearing after adsorption, suggest the possible active involvement of carbonyl, hydroxyl, carboxyl, and amino groups that define both biosorbents in the adsorption phenomena of Cr(VI). These findings indicate the possible high adsorption potential of both biomasses through their richness in active functional groups susceptible to interacting with the chromium ions in which electrons are shared or exchanged.
The vacancies and roughness of the RHP and YHP before adsorption shown in SEM analysis demonstrate the ability of adsorbents to uptake the Cr(VI) ions. Nevertheless, the changes in morphology and the lessening of both adsorbent surfaces harshness after adsorption can be due to the obstruction of cavities by the Cr(VI) particles. Previous studies conducted on pomegranate peel powder reported a rough and uneven texture [55,56]. The harsh and hollow texture of the RHP and YHP control samples showed that the solvent used in the studies (deionized water at pH 2) had no affect on the biosorbents morphology and that the softening of the surface roughness was only due to the metal binding and filling the biosorbent cavities.
The high levels of C and O in both biosorbents shown by EDX are attributed to their cellulose-rich nature [57] and abundance in polyphenolic compounds, as previously determined. Moreover, the appearance of the chromium peaks substantiates its successful adsorption onto both biosorbents. The obtained XRD results indicate an amorphous structure of both biosorbents, which aligns well with the literature [58,59]. This amorphous character is commonly described in lignocellulosic biomasses [60].
The textural characteristics obtained by BET analysis suggest that the biosorbents can be considered mesoporous materials with a combination between type II and type IV profiles, according to the classification prescribed by the International Union of Pure and Applied Chemistry (IUPAC) [61]. This classification categorizes pores based on their diameter: micropores < 2 nm, mesopores (2–50 nm), and macropores (>50 nm). Both RHP and YHP exhibited small SBET, which is in accordance with previous studies conducted on pomegranate peels [62,63,64]. Other cellulosic and linocellulosic biomasses also showed small SBET [65]. However, the carbonization of pomegranate peels seems to increase the surface area [66]. Given the small SBET obtained by both biosorbents, their high adsorption capacity is mainly due to the abundance of surface functional groups and the chemical interaction between the adsorbate and the adsorbent surface sites.

4.2. Quencher-Free Radical Scavenging Activity

The antiradical activity is estimated by the power of the husk powders to inhibit and reduce DPPH and ABTS free radicals. Both RHP and YHP biomasses exhibited strong antiradical activity I > 80% at low doses of the husk powders. This can be explained by the richness of these biomasses with active functional groups shown by the FTIR analysis (hydroxyl, carbonyl, and amino groups), as well as the significant amount of polyphenols [37]. These functional groups and polyphenols are capable of donating electrons and neutralizing free radicals. As a result, oxidative chain reactions are terminated. [67,68]. Previous studies reported the strong antiradical activity of pomegranate husk extracts [69,70]. These findings presented the husk powders of both varieties in their native states as powerful antioxidants against free radicals, hence their possible use in preventing and eliminating oxidative stress and its harmful effects that can occur from direct or indirect hexavalent chromium exposure [9,71] through their consumption asraw husk powder.

4.3. Biosorption Optimization

4.3.1. pH Effect

The pH of the working solution is a critical factor in the adsorption phenomenon, which determines the performance of the adsorption process, the outward chemistry of the adsorbent, and the behavior of the metallic ion [72]. In acidic pH values, Cr(VI) is present as hydrogen chromate (HCrO4) and dichromate (Cr2O72−) ions, whereas HCrO4 is the predominant form in the aqueous solution; as the pH raises (pH > 6.5), the Cr(VI) is found as chromate (CrO42−) ions [73]. The elevated adsorption capacity of adsorbents toward Cr(VI) ions at pH (2) can be explained by the fact that at low pH values, more hydrogen cations (H+) are present in the medium, which makes the biosorbent active sites positively charged, thus interacting with HCrO4 and Cr2O72− anions [74]. However, as the pH of the solution increases, the biosorbent’s surface becomes negatively charged due to fewer H+ ions and more hydroxide ions (OH) in the medium, which repel the Cr2O72− anions from the surface of the biomasses, thereby affecting their adsorption capacity [75]. Moreover, the pHpzc was 5.11 and 4.55 for the RHP and YHP, respectively [33]. At pH (2), the surface of the biosorbents is negatively charged since pH (2) is below the pHpzc of both RHP and YHP adsorbents, which favors the adsorption of Cr(VI) anions onto both biosorbents. All things considered, pH (2) was chosen as the optimal pH for this study. These results are in conformity with the ones conducted on modified activated carbon [76] and Moringa stenopetala seed [77].

4.3.2. Biosorbent Dose and Solid/Liquid Ratio Effect

The biosorbent dosage is an important criterion in removing metal ions from aqueous solutions since it determines the capacity of any adsorbent and helps optimize the adsorption process [78]. The increase in removal efficiency can be attributed to the presence of more adsorption sites on the biosorbent surface as the amount of biomass and S/L ratio increase [79]. Furthermore, increasing the dosage of biosorbents, thus the S/L ratio, leads to the agglomeration and coinciding of the adsorption sites, hence their unsaturation and the reduction in the adsorption capacity Qe [80,81]. In view of these findings and since the removal rate of Cr(VI) ions was high at 91.45% and 91.16% at a S/L ratio of 0.5 mg/mL for both RHP and YHP sorbents, this ratio was sequentially used in the subsequent adsorption isotherm modeling studies.

4.4. Biosorption Isotherms

The metal concentration is a major factor controlling the adsorption procedure [82]. The obtained results can reflect the fact that at a low metal concentration, the Cr(VI) ions are adsorbed to a restricted number of sites since the number of adsorption sites available is greater than the number of metallic particles [83]. However, the increase in Cr(VI) ions concentration causes more adsorption sites to be filled, which increases the adsorption capacity of both RHP and YHP biosorbents until the saturation of the adsorption sites, making the adsorption capacity reach a state of stabilization (Figure 9) [84].
Adsorption isotherm modeling is important to understand the nature of interaction between the adsorbent and the adsorbate [85]. The obtained results indicate that the Langmuir model is in conformity with our experimental data, and it describes the adsorption of Cr(VI) ions onto the biosorbents better than the Freundlich model. The value of Freundlich constant 1/nf was in the range of (1 > 1/nf > 0), indicating a favorable adsorption of Cr(VI) ions onto both biosorbents. However, the coefficient of regression R2 of the Langmuir model is closer to 1 than the R2 of the Freundlich model for both biosorbents.
In addition, the calculated (theoretical) maximum adsorption capacity Qmax of Langmuir was similar and accordant to the experimental one Qm for both biosorbents. Furthermore, the separation factor RL values ranged between (0–1), suggestinga favorable adsorption of the Cr(VI) ions onto RHP and YHP. Moreover, the D-R isotherm exhibited mediocre linearity of Cr(VI) adsorption onto both adsorbents since the coefficient of regression was far from 1. Furthermore, the mean energy E found was greater than 16 kJ/mol, implying that chemical adsorption was the primary adsorption method.
These findings suggest that the adsorption of Cr(VI) ions on both biosorbents follows the Langmuir model, hence monolayer adsorption. Our results are in conformity with other studies on hexavalent chromium adsorption by pomegranate peel powder, which reported that the Langmuir model is more suitable than the Freundlich one [86,87,88]. The maximum adsorption capacity of RHP and YHP was close to the one conducted earlier on Cr(VI) adsorption onto pomegranate peels, with a Qmax ranging between 348.6 and 400 mg/g [64]. The Qmax of the RHP and YHP biosorbents in our study and the different natural and synthetic adsorbents used for the adsorption of Cr(VI) ions from aqueous solutions described in the literature are summarized in Table 5. These studies demonstrate the power and efficiency of RHP and YHP biosorbents for Cr(VI) removal, in comparison to other natural and synthetic adsorbents since they exhibited higher adsorption capacities than the other biomasses.

4.5. Biosorption Kinetics

Kinetic models are utilized to explore the time effects on the adsorption process and to comprehend the diffusion properties of metallic ions from liquid to solid [106]. Contact time is a critical factor in the adsorption procedure since it allows the Cr(VI) ions to diffuse and adhere to the biosorbents [107]. The rapid elevation in adsorption capacity from 0 to 15 min can be explained by the availability of more active sites at the start of the adsorption process [106]. However, as the contact time increases, the active sites are more occupied with the Cr(VI) ions, which makes the adsorption capacity less effective [108], making it hit the plateau any time after 60 min, whereby 60 min is the optimal contact time for Cr(VI) adsorption, since it was sufficient to obtain a maximum adsorption capacity for both biosorbents.
Regarding the similarity between the experimental adsorption capacity and the calculated one Qe found in the pseudo-second-order model for both RHP and YHP biosorbents, as well as considering that the value of the coefficient of regression R2 is the highest and the closest to unit (1) in the pseudo-second order model compared with the Elovich and the pseudo-first-order ones, it can be concluded that the adsorption kinetics of Cr(VI) ions onto the studied biosorbents follow the pseudo-second order model with chemisorption including covalent bonds or ionic bonds via which electrons are shared or exchanged between sorbate molecules and sorbent surface functional groups. These results are in agreement with the ones reported in the literature, which found the pseudo-second order to be the most suitable model for describing the adsorption of hexavalent chromium onto pomegranate peels [13,89,91,109].

5. Conclusions

The findings of this study are part of a universal effort to combat the harmful impacts of hexavalent chromium on the environment and its influence on human health. In this context, the antiradical effects of the native husk powders of the two Algerian pomegranate varieties against free radicals were established, along with the evaluation of their adsorption behavior towards Cr(VI) ions in aqueous solutions. Both RHP and YHP adsorbents exhibited similar results. The SEM and FTIR analyses indicated that the surface of both biomasses was rough and hollow, with the presence of various types of functional groups. The elemental analysis revealed the high levels of O and C in the husks. BET and XRD indicated that both biosorbents are mesoporous with an amorphous structure. The antiradical activity results demonstrated that both RHP and YHP biomasses had a strong free radical inhibition effect with an I higher than 80% at a biomass dose of 5 mg. The adsorption isotherm modeling studies showed that the Langmuir model is the better fit for both RHP and YHP biosorbents under optimum conditions: pH (2), S/L ratio of 0.5 mg/mL, 60 min of contact time, and ambient temperature, with a Qmax of 413.22 and 403.22 mg/g for the red and yellow husk powders, respectively. The kinetics studies revealed that the experimental findings follow the pseudo-second order, with coefficients of correlation of R2 = 0.99965 for RHP and R2 = 0.99896 for YHP. In conclusion, pomegranate husk as a green waste represents a versatile tool: a powerful antioxidant against free radicals, thus protecting the organism from oxidative stress and its related adverse effects in its innate state without any extraction or modifications, and an effective, natural, and low-cost adsorbent for Cr(VI) ions removal from polluted effluent, thus preserving the environment from its hazardous outcomes while having no negative effects on it due to its vegan-organic nature.

Author Contributions

Conceptualization, L.A. and N.B.; methodology, L.A. and N.B.; software, L.A.; validation, L.A. and N.B.; formal analysis, L.A.; investigation, L.A. and N.B; resources, N.B.; data curation, L.A.; writing—original draft preparation, L.A.; writing—review and editing, N.B.; visualization, L.A.; supervision, N.B.; project administration, N.B.; funding acquisition, L.A. and N.B. All authors have read and agreed to the published version of the manuscript.

Funding

This research received no external funding.

Data Availability Statement

The corresponding author is able to provide the data supporting the findings of this study upon receiving a request.

Acknowledgments

The authors gratefully acknowledge the Ferhat Abbas Setif 1 University for the financial support and the Biochemistry Department of the University, for the laboratory services.

Conflicts of Interest

The authors declare no conflict of interest.

References

  1. Mitra, S.; Chakraborty, A.J.; Tareq, A.M.; Emran, T.B.; Nainu, F.; Khusro, A.; Idris, A.M.; Khandaker, M.U.; Osman, H.; Alhumaydhi, F.A.; et al. Impact of Heavy Metals on the Environment and Human Health: Novel Therapeutic Insights to Counter the Toxicity. J. King Saud Univ. Sci. 2022, 34, 101865. [Google Scholar] [CrossRef]
  2. Zhou, H.; Ouyang, T.; Guo, Y.; Peng, S.; He, C.; Zhu, Z. Assessment of Soil Heavy Metal Pollution and Its Ecological Risk for City Parks, Vicinity of a Landfill, and an Industrial Area within Guangzhou, South China. Appl. Sci. 2022, 12, 9345. [Google Scholar] [CrossRef]
  3. Pavesi, T.; Moreira, J.C. Mechanisms and Individuality in Chromium Toxicity in Humans. J. Appl. Toxicol. 2020, 40, 1183–1197. [Google Scholar] [CrossRef] [PubMed]
  4. Yan, G.; Gao, Y.; Xue, K.; Qi, Y.; Fan, Y.; Tian, X.; Wang, J.; Zhao, R.; Zhang, P.; Liu, Y.; et al. Toxicity Mechanisms and Re-mediation Strategies for Chromium Exposure in the Environment. Front. Environ. Sci. 2023, 11, 1131204. [Google Scholar] [CrossRef]
  5. Shammout, M.; Shatanawi, M.; Awwad, A. Fate and Management of Pollution of Hexavalent Chromium Cr(VI) and Heavy Metals in the Zarqa River Basin in Jordan. J. Ecol. Eng. 2022, 23, 108–115. [Google Scholar] [CrossRef]
  6. Georgaki, M.N.; Charalambous, M. Toxic Chromium in Water and the Effects on the Human Body: A Systematic Review. J. Water Health 2023, 21, 205–223. [Google Scholar] [CrossRef]
  7. Shin, D.Y.; Lee, S.M.; Jang, Y.; Lee, J.; Lee, C.M.; Cho, E.-M.; Seo, Y.R. Adverse Human Health Effects of Chromium by Exposure Route: A Comprehensive Review Based on Toxicogenomic Approach. Int. J. Mol. Sci. 2023, 24, 3410. [Google Scholar] [CrossRef]
  8. Genchi, G.; Lauria, G.; Catalano, A.; Carocci, A.; Sinicropi, M.S. The Double Face of Metals: The Intriguing Case of Chromium. Appl. Sci. 2021, 11, 638. [Google Scholar] [CrossRef]
  9. Singh, V.; Singh, N.; Verma, M.; Kamal, R.; Tiwari, R.; Sanjay Chivate, M.; Rai, S.N.; Kumar, A.; Singh, A.; Singh, M.P.; et al. Hexavalent-Chromium-Induced Oxidative Stress and the Protective Role of Antioxidants against Cellular Toxicity. Antioxidants 2022, 11, 2375. [Google Scholar] [CrossRef]
  10. Husain, N.; Mahmood, R. Hexavalent Chromium Induces Reactive Oxygen Species and Impairs the Antioxidant Power of Human Erythrocytes and Lymphocytes: Decreased Metal Reducing and Free Radical Quenching Ability of the Cells. Toxicol. Ind. Health 2017, 33, 623–635. [Google Scholar] [CrossRef]
  11. Georgaki, M.-N.; Charalambous, M.; Kazakis, N.; Talias, M.A.; Georgakis, C.; Papamitsou, T.; Mytiglaki, C. Chromium in Water and Carcinogenic Human Health Risk. Environments 2023, 10, 33. [Google Scholar] [CrossRef]
  12. Chen, Y.; Yang, J.; Abbas, A. Enhanced Chromium (VI) Adsorption onto Waste Pomegranate-Peel-Derived Biochar for Wastewater Treatment: Performance and Mechanism. Toxics 2023, 11, 440. [Google Scholar] [CrossRef] [PubMed]
  13. Environmental Protection Agency (USEPA). National Recommended Water Quality Criteria (4304T); Office of Water, Office of Science and Technology: Washington, DC, USA, 2009. [Google Scholar]
  14. Environmental Protection Agency (USEPA). Edition of the Drinking Water Standards and Health Advisories; Agency, Office of Water: Washington, DC, USA, 2012. [Google Scholar]
  15. Peng, X.; Liu, S.; Luo, Z.; Yu, X.; Liang, W. Selective Removal of Hexavalent Chromium by Novel Nitrogen and Sulfur Containing Cellulose Composite: Role of Counter Anions. Materials 2023, 16, 184. [Google Scholar] [CrossRef] [PubMed]
  16. Kabdaşlı, I.; Tünay, O. Hexavalent Chromium Removal from Water and Wastewaters by Electrochemical Processes: Review. Molecules 2023, 28, 2411. [Google Scholar] [CrossRef] [PubMed]
  17. Michael Smarte Anekwe, I.; Adedeji, J.; OkiemuteAkpasi, S.; Lewis Kiambi, S. Available Technologies for Wastewater Treatment. In Wastewater Treatment; Ince, M., Kaplan Ince, O., Eds.; IntechOpen: London, UK, 2022; ISBN 978-1-80355-846-2. [Google Scholar] [CrossRef]
  18. Qasem, N.A.A.; Mohammed, R.H.; Lawal, D.U. Removal of Heavy Metal Ions from Wastewater: A Comprehensive and Critical Review. NPJ Clean Water 2021, 4, 36. [Google Scholar] [CrossRef]
  19. Antoniadou, M.; Arfanis, M.K.; Ibrahim, I.; Falaras, P. Bifunctional g-C3N4/WO3 Thin Films for Photocatalytic Water Purification. Water 2019, 11, 2439. [Google Scholar] [CrossRef] [Green Version]
  20. Ibrahim, I.; Belessiotis, G.V.; Arfanis, M.K.; Athanasekou, C.; Philippopoulos, A.I.; Mitsopoulou, C.A.; Romanos, G.E.; Falaras, P. Surfactant Effects on the Synthesis of Redox Bifunctional V2O5 Photocatalysts. Materials 2020, 13, 4665. [Google Scholar] [CrossRef]
  21. Alhalili, Z. Metal Oxides Nanoparticles: General Structural Description, Chemical, Physical, and Biological Synthesis Methods, Role in Pesticides and Heavy Metal Removal through Wastewater Treatment. Molecules 2023, 28, 3086. [Google Scholar] [CrossRef]
  22. Benettayeb, A.; Seihoub, F.Z.; Pal, P.; Ghosh, S.; Usman, M.; Chia, C.H.; Usman, M.; Sillanpää, M. Chitosan Nanoparticles as Potential Nano-Sorbent for Removal of Toxic Environmental Pollutants. Nanomaterials 2023, 13, 447. [Google Scholar] [CrossRef]
  23. Ali, K.; Javaid, M.U.; Ali, Z.; Zaghum, M.J. Biomass-Derived Adsorbents for Dye and Heavy Metal Removal from Wastewater. Adsorp. Sci. Technol. 2021, 2021, 9357509. [Google Scholar] [CrossRef]
  24. Nguyen, D.T.C.; Tran, T.V.; Kumar, P.S.; Din, A.T.M.; Jalil, A.A.; Vo, D.-V.N. Invasive Plants as Biosorbents for Environmental Remediation: A Review. Environ. Chem. Lett. 2022, 20, 1421–1451. [Google Scholar] [CrossRef]
  25. Karić, N.; Maia, A.S.; Teodorović, A.; Atanasova, N.; Langergraber, G.; Crini, G.; Ribeiro, A.R.L.; Đolić, M. Bio-Waste Valorisation: Agricultural Wastes as Biosorbents for Removal of (in)Organic Pollutants in Wastewater Treatment. Chem. Eng. J. Adv. 2022, 9, 100239. [Google Scholar] [CrossRef]
  26. Muhammad, S.; Abdul Khalil, H.P.S.; Abd Hamid, S.; Albadn, Y.M.; Suriani, A.B.; Kamaruzzaman, S.; Mohamed, A.; Allaq, A.A.; Yahya, E.B. Insights into Agricultural-Waste-Based Nano-Activated Carbon Fabrication and Modifications for Wastewater Treatment Application. Agriculture 2022, 12, 1737. [Google Scholar] [CrossRef]
  27. Lakshmana Naik, R.; Rupas Kumar, M.; Bala Narsaiah, T. Removal of Heavy Metals (Cu & Ni) from Wastewater Using Rice Husk and Orange Peel as Adsorbents. Mater. Today Proced. 2023, 72, 92–98. [Google Scholar] [CrossRef]
  28. Guevara-Bernal, D.F.; Cáceres Ortíz, M.Y.C.; Gutiérrez Cifuentes, J.A.; Bastos-Arrieta, J.; Palet, C.; Candela, A.M. Coffee Husk and Lignin Revalorization: Modification with Ag Nanoparticles for Heavy Metals Removal and Antifungal Assays. Water 2022, 14, 1796. [Google Scholar] [CrossRef]
  29. Gryko, K.; Kalinowska, M.; Swiderski, G. The Use of Apple Pomace in Removing Heavy Metals from Water and Sewage. Environ. Sci. Proc. 2021, 9, 24. [Google Scholar] [CrossRef]
  30. Khan, M.N.; Ullah, H.; Naeem, S.; Uddin, J.; Hamid, Y.; Ahmad, W.; Ding, J. Remediation of Emerging Heavy Metals from Water Using Natural Adsorbent: Adsorption Performance and Mechanistic Insights. Sustainability 2021, 13, 8817. [Google Scholar] [CrossRef]
  31. Jeyaseelan, C.; Gupta, A. Green Tea Leaves as a Natural Adsorbent for the Removal of Cr(VI) from Aqueous Solutions. Air Soil Water Res. 2016, 9, 13–19. [Google Scholar] [CrossRef] [Green Version]
  32. Ain, H.B.U.; Tufail, T.; Bashir, S.; Ijaz, N.; Hussain, M.; Ikram, A.; Farooq, M.A.; Saewan, S.A. Nutritional Importance and Industrial Uses of Pomegranate Peel: A Critical Review. Food Sci. Nutr. 2023, 11, 2589–2598. [Google Scholar] [CrossRef] [PubMed]
  33. Bertolo, M.R.V.; Martins, V.C.A.; Plepis, A.M.G.; Bogusz, S. Utilization of Pomegranate Peel Waste: Natural Deep Eutectic Solvents as a Green Strategy to Recover Valuable Phenolic Compounds. J. Clean. Prod. 2021, 327, 129471. [Google Scholar] [CrossRef]
  34. Mo, Y.; Ma, J.; Gao, W.; Zhang, L.; Li, J.; Li, J.; Zang, J. Pomegranate Peel as a Source of Bioactive Compounds: A Mini Review on Their Physiological Functions. Front. Nutr. 2022, 9, 887113. [Google Scholar] [CrossRef] [PubMed]
  35. Smaoui, S.; Hlima, H.B.; Mtibaa, A.C.; Fourati, M.; Sellem, I.; Elhadef, K.; Ennouri, K.; Mellouli, L. Pomegranate Peel as Phenolic Compounds Source: Advanced Analytical Strategies and Practical Use in Meat Products. Meat Sci. 2019, 158, 107914. [Google Scholar] [CrossRef] [PubMed]
  36. El-Hadary, A.E.; Taha, M. Pomegranate Peel Methanolic-extract Improves the Shelf-life of Edible-oils under Accelerated Oxidation Conditions. Food Sci.Nutr. 2020, 8, 1798–1811. [Google Scholar] [CrossRef] [PubMed]
  37. Abed, L.; Belattar, N. Polyphenols Content, Chelating Propertiesand Adsorption Isotherms and Kinetics of Redand Yellow Pomegranate Peels (Punica Granatum L.) Towards Lead (II). Pol. J. Environ. Stud. 2022, 31, 5765–5779. [Google Scholar] [CrossRef]
  38. Lace, A.; Ryan, D.; Bowkett, M.; Cleary, J. Chromium Monitoring in Water by Colorimetry Using Optimised 1,5-Diphenylcarbazide Method. Int. J. Environ. Res. Public Health 2019, 16, 1803. [Google Scholar] [CrossRef] [Green Version]
  39. Ferslew, K.E.; Nicolaides, A.N.; Robert, T.A. Determination of Chromate Adulteration of Human Urine by Automated Colorimetric and Capillary Ion Electrophoretic Analyses. J. Anal. Toxicol. 2003, 27, 36–39. [Google Scholar] [CrossRef] [Green Version]
  40. Gökmen, V.; Serpen, A.; Fogliano, V. Direct Measurement of the Total Antioxidant Capacity of Foods: The ‘QUENCHER’ Approach. Trends Food Sci. Technol. 2009, 20, 278–288. [Google Scholar] [CrossRef]
  41. Condezo-Hoyos, L.; Abderrahim, F.; Arriba, S.M.; Carmen González, M. A Novel, Micro, Rapid and Direct Assay to Assess Total Antioxidant Capacity of Solid Foods. Talanta 2015, 138, 108–116. [Google Scholar] [CrossRef]
  42. Blois, M. Antioxidant Determinations by the Use of a Stable Free Radical. Nature 1958, 181, 1199–1200. [Google Scholar] [CrossRef]
  43. Re, R.; Pellegrini, N.; Proteggente, A.; Pannala, A.; Yang, M.; Rice-Evans, C. Antioxidant Activity Applying an Improved ABTS Radical Cation Decolorization Assay. Free Radic. Biol. Med. 1999, 26, 1231–1237. [Google Scholar] [CrossRef]
  44. Langmuir, I. The Adsorption of Gases on Plane Surfaces of Glass, Mica and Platinum. J. Am. Chem. Soc. 1918, 40, 1361–1403. [Google Scholar] [CrossRef] [Green Version]
  45. Freundlich, H. Über die Struktur der Kolloidteilchen und über den Aufbau von Solen und Gelen. Berichte Dtsch. Chem. Ges. A/B 1928, 61, 2219–2233. [Google Scholar] [CrossRef]
  46. Dubinin, M.M. The Potential Theory of Adsorption of Gases and Vapors for Adsorbents with Energetically Nonuniform Surfaces. Chem. Rev. 1960, 60, 235–241. [Google Scholar] [CrossRef]
  47. Weber, T.W.; Chakravorti, R.K. Pore and Solid Diffusion Models for Fixed-Bed Adsorbers. AIChE J. 1974, 20, 228–238. [Google Scholar] [CrossRef]
  48. Abin-Bazaine, A.; Campos Trujillo, A.; Olmos-Marquez, M. Adsorption Isotherms: Enlightenment of the Phenomenon of Adsorption. In Wastewater Treatment; Ince, M., Kaplan Ince, O., Eds.; IntechOpen: London, UK, 2022; ISBN 978-1-80355-846-2. [Google Scholar] [CrossRef]
  49. Lagergren, S. Zur Theorie der Sogenannten Adsorption GelösterStoffe. K. Sven. Vetensk. Handl. 1898, 24, 1–39. [Google Scholar]
  50. Ho, Y.S.; McKay, G. Pseudo-Second Order Model for Sorption Processes. Process Biochem. 1999, 34, 451–465. [Google Scholar] [CrossRef]
  51. Low, M.J.D. Kinetics of Chemisorption of Gases on Solids. Chem. Rev. 1960, 60, 267–312. [Google Scholar] [CrossRef]
  52. Chien, S.H.; Clayton, W.R. Application of Elovich Equation to the Kinetics of Phosphate Release and Sorption in Soils. Soil Sci. Soc. Am. J. 1980, 44, 265–268. [Google Scholar] [CrossRef]
  53. Cordova Estrada, A.K.; Cordova Lozano, F.; Lara Díaz, R.A. Thermodynamics and Kinetic Studies for the Adsorption Process of Methyl Orange by Magnetic Activated Carbons. Air Soil Water Res. 2021, 14, 11786221211013336. [Google Scholar] [CrossRef]
  54. Larkin, P.J. General Outline for IR and Raman Spectral Interpretation. In Infrared and Raman Spectroscopy; Elsevier: Amsterdam, The Netherlands, 2018; pp. 135–151. ISBN 978-0-12-804162-8. [Google Scholar] [CrossRef]
  55. Mekhamer, W.; Al-Tamimi, S. Removal of Ciprofloxacin from Simulated Wastewater by Pomegranate Peels. Environ. Sci.Pollut. Res. 2019, 26, 2297–2304. [Google Scholar] [CrossRef] [PubMed]
  56. Saadi, W.; Rodríguez-Sánchez, S.; Ruiz, B.; Najar-Souissi, S.; Ouederni, A.; Fuente, E. From Pomegranate Peels Waste to One-Step Alkaline Carbonate Activated Carbons. Prospect as Sustainable Adsorbent for the Renewable Energy Production. J. Environ. Chem. Eng. 2022, 10, 107010. [Google Scholar] [CrossRef]
  57. M Khairy, G.; Hesham, A.M.; Jahin, H.E.S.; El-Korashy, S.A.; Mahmoud Awad, Y. Green Synthesis of a Novel Eco-Friendly Hydrochar from Pomegranate Peels Loaded with Iron Nanoparticles for the Removal of Copper Ions and Methylene Blue from Aqueous Solutions. J. Mol. Liq. 2022, 368, 120722. [Google Scholar] [CrossRef]
  58. Jawad, A.H.; Sauodi, M.; Mastuli, M.S.; Aouda, M.; Radzun, K. Pomegranate peels collected from fresh juice shop as a renewable precursor for high surface area activated carbon with potential application for methylene blue adsorption. Desalin. Water Treat. 2018, 124, 287–296. [Google Scholar] [CrossRef] [Green Version]
  59. Abbach, W.; Laghlimi, C.; Isaad, J. Simultaneous adsorption of cationic and anionic dyes by raw pomegranate peel: Modelling of equilibrium, kinetical and thermodynamical studies. Mor. J. Chem. 2023, 11, 832–853. [Google Scholar] [CrossRef]
  60. Ahmed, E.; Zeitoun, A.; Hamad, G.; Zeitoun, M.A.M.; Taha, A.; Korma, S.A.; Esatbeyoglu, T. Lignocellulosic Biomasses from Agricultural Wastes Improved the Quality and Physicochemical Properties of Frying Oils. Foods 2022, 11, 3149. [Google Scholar] [CrossRef]
  61. Sing, K.S.W. Reporting physisorption data for gas/solid systems with special reference to the determination of surface area and porosity (Recommendations 1984). Pure Appl. Chem. 1985, 57, 603–619. [Google Scholar] [CrossRef]
  62. Jawad, A.H.; Waheeb, A.S.; Abd Rashid, R.; Nawawi, W.I.; Yousif, E. Equilibrium isotherms, kinetics, and thermodynamics studies of methylene blue adsorption on pomegranate (Punica granatum) peels as a natural low-cost biosorbent. Desalin. Water Treat. 2018, 105, 322–331. [Google Scholar] [CrossRef] [Green Version]
  63. Akkari, I.; Graba, Z.; Bezzi, N.; Merzeg, F.A.; Bait, N.; Ferhati, A. Raw pomegranate peel as promise efficient biosorbent for the removal of Basic Red 46 dye: Equilibrium, kinetic, and thermodynamic studies. Biomass Conv. Bioref. 2023, 13, 8047–8060. [Google Scholar] [CrossRef]
  64. Salam, F.A.; Narayanan, A. Biosorption—A Case Study of Hexavalent Chromium Removal with Raw Pomegranate Peel. Desalin. Water Treat. 2019, 156, 278–291. [Google Scholar] [CrossRef] [Green Version]
  65. Cruz-Lopes, L.; Macena, M.; Esteves, B.; Santos-Vieira, I. Lignocellulosic Materials Used as Biosorbents for the Capture of Nickel (II) in Aqueous Solution. Appl. Sci. 2022, 12, 933. [Google Scholar] [CrossRef]
  66. Esmaeili Bidhendi, M.; Poursorkh, Z.; Sereshti, H.; Rashidi Nodeh, H.; Rezania, S.; Afzal Kamboh, M. Nano-Size Biomass Derived from Pomegranate Peel for Enhanced Removal of Cefixime Antibiotic from Aqueous Media: Kinetic, Equilibrium and Thermodynamic Study. Int. J. Environ. Res. Public Health 2020, 17, 4223. [Google Scholar] [CrossRef]
  67. Chen, J.; Yang, J.; Ma, L.; Li, J.; Shahzad, N.; Kim, C.K. Structure-Antioxidant Activity Relationship of Methoxy, Phenolic Hydroxyl, and Carboxylic Acid Groups of Phenolic Acids. Sci. Rep. 2020, 10, 2611. [Google Scholar] [CrossRef] [PubMed] [Green Version]
  68. Platzer, M.; Kiese, S.; Tybussek, T.; Herfellner, T.; Schneider, F.; Schweiggert-Weisz, U.; Eisner, P. Radical Scavenging Mechanisms of Phenolic Compounds: A Quantitative Structure-Property Relationship (QSPR) Study. Front. Nutr. 2022, 9, 882458. [Google Scholar] [CrossRef]
  69. Cruz-Valenzuela, M.R.; Ayala-Soto, R.E.; Ayala-Zavala, J.F.; Espinoza-Silva, B.A.; González-Aguilar, G.A.; Martín-Belloso, O.; Soliva-Fortuny, R.; Nazzaro, F.; Fratianni, F.; Tapia-Rodríguez, M.R.; et al. Pomegranate (Punica granatum L.) Peel Extracts as Antimicrobial and Antioxidant Additives Used in Alfalfa Sprouts. Foods 2022, 11, 2588. [Google Scholar] [CrossRef]
  70. Gullón, P.; Astray, G.; Gullón, B.; Tomasevic, I.; Lorenzo, J.M. Pomegranate Peel as Suitable Source of High-Added Value Bioactives: Tailored Functionalized Meat Products. Molecules 2020, 25, 2859. [Google Scholar] [CrossRef]
  71. Wakeel, A.; Xu, M.; Gan, Y. Chromium-Induced Reactive Oxygen Species Accumulation by Altering the Enzymatic Antioxidant System and Associated Cytotoxic, Genotoxic, Ultrastructural, and Photosynthetic Changes in Plants. Int. J. Mol. Sci. 2020, 21, 728. [Google Scholar] [CrossRef] [Green Version]
  72. Cruz-Lopes, L.P.; Macena, M.; Esteves, B.; Guiné, R.P.F. Ideal PH for the Adsorption of Metal Ions Cr6+, Ni2+, Pb2+ in Aqueous Solution with Different Adsorbent Materials. Open Agric. 2021, 6, 115–123. [Google Scholar] [CrossRef]
  73. Islam, M.M.; Mohana, A.A.; Rahman, M.A.; Rahman, M.; Naidu, R.; Rahman, M.M. A Comprehensive Review of the Current Progress of Chromium Removal Methods from Aqueous Solution. Toxics 2023, 11, 252. [Google Scholar] [CrossRef] [PubMed]
  74. Guo, X.; Liu, A.; Lu, J.; Niu, X.; Jiang, M.; Ma, Y.; Liu, X.; Li, M. Adsorption Mechanism of Hexavalent Chromium on Biochar: Kinetic, Thermodynamic, and Characterization Studies. ACS Omega 2020, 5, 27323–27331. [Google Scholar] [CrossRef]
  75. Dawodu, F.A.; Akpan, B.M.; Akpomie, K.G. Sequestered Capture and Desorption of Hexavalent Chromium from Solution and Textile Wastewater onto Low Cost Heinsiacrinita Seed Coat Biomass. Appl. Water Sci. 2020, 10, 32. [Google Scholar] [CrossRef] [Green Version]
  76. Puszkarewicz, A.; Kaleta, J. Chromium (VI) Adsorption on Modified Activated Carbons. Appl. Sci. 2019, 9, 3549. [Google Scholar] [CrossRef] [Green Version]
  77. Badessa, T.S.; Wakuma, E.; Yimer, A.M. Bio-Sorption for Effective Removal of Chromium(VI) from Wastewater Using Moringa stenopetala Seed Powder (MSSP) and Banana Peel Powder (BPP). BMC Chem. 2020, 14, 71. [Google Scholar] [CrossRef]
  78. Biswas, S.; Bal, M.; Behera, S.; Sen, T.; Meikap, B. Process Optimization Study of Zn2+ Adsorption on Biochar-Alginate Com-posite Adsorbent by Response Surface Methodology (RSM). Water 2019, 11, 325. [Google Scholar] [CrossRef] [Green Version]
  79. Elkhaleefa, A.; Ali, I.H.; Brima, E.I.; Shigidi, I.; Elhag, A.B.; Karama, B. Evaluation of the Adsorption Efficiency on the Removal of Lead(II) Ions from Aqueous Solutions Using Azadirachta indica Leaves as an Adsorbent. Processes 2021, 9, 559. [Google Scholar] [CrossRef]
  80. Akhtar, A.; Hanif, M.A.; Rashid, U.; Bhatti, I.A.; Alharthi, F.A.; Kazerooni, E.A. Advanced Treatment of Direct Dye Wastewater Using Novel Composites Produced from Hoshanar and Sunny Grey Waste. Separations 2022, 9, 425. [Google Scholar] [CrossRef]
  81. Al-Najar, J.A.; Al-Humairi, S.T.; Lutfee, T.; Balakrishnan, D.; Veza, I.; Soudagar, M.E.M.; Fattah, I.M.R. Cost-Effective Natural Adsorbents for Remediation of Oil-Contaminated Water. Water 2023, 15, 1186. [Google Scholar] [CrossRef]
  82. Jiang, W.; Hu, Y.; Zhu, Z. Biosorption Characteristic and Cytoprotective Effect of Pb2+, Cu2+ and Cd2+ by a Novel Polysaccharide from Zingiber strioatum. Molecules 2022, 27, 8036. [Google Scholar] [CrossRef]
  83. Mustapha, S.; Shuaib, D.T.; Ndamitso, M.M.; Etsuyankpa, M.B.; Sumaila, A.; Mohammed, U.M.; Nasirudeen, M.B. Adsorption Isotherm, Kinetic and Thermodynamic Studies for the Removal of Pb(II), Cd(II), Zn(II) and Cu(II) Ions from Aqueous Solutions Using Albizia lebbeck Pods. Appl. Water Sci. 2019, 9, 142. [Google Scholar] [CrossRef] [Green Version]
  84. Mnasri-Ghnimi, S.; Frini-Srasra, N. Removal of Heavy Metals from Aqueous Solutions by Adsorption Using Single and Mixed Pillared Clays. Appl. Clay Sci. 2019, 179, 105151. [Google Scholar] [CrossRef]
  85. Al-Ghouti, M.A.; Da’ana, D.A. Guidelines for the Use and Interpretation of Adsorption Isotherm Models: A Review. J. Hazard. Mater. 2020, 393, 122383. [Google Scholar] [CrossRef]
  86. Rafiaee, S.; Samani, M.R.; Toghraie, D. Removal of Hexavalent Chromium from Aqueous Media Using Pomegranate Peels Modified by Polymeric Coatings: Effects of Various Composite Synthesis Parameters. Synth. Met. 2020, 265, 116416. [Google Scholar] [CrossRef]
  87. Giri, R.; Kumari, N.; Behera, M.; Sharma, A.; Kumar, S.; Kumar, N.; Singh, R. Adsorption of Hexavalent Chromium from Aqueous Solution Using Pomegranate Peel as Low-Cost Biosorbent. J. Environ. Sustain. 2021, 4, 401–417. [Google Scholar] [CrossRef]
  88. Boutaleb, Y.; Zerdoum, R.; Bensid, N.; Abumousa, R.A.; Hattab, Z.; Bououdina, M. Adsorption of Cr(VI) by Mesoporous Pomegranate Peel Biowaste from Synthetic Wastewater under Dynamic Mode. Water 2022, 14, 3885. [Google Scholar] [CrossRef]
  89. Khalil, U.; Shakoor, M.B.; Ali, S.; Rizwan, M.; Alyemeni, M.N.; Wijaya, L. Adsorption-Reduction Performance of Tea Waste and Rice Husk Biochars for Cr(VI) Elimination from Wastewater. J. Saudi Chem. Soc. 2020, 24, 799–810. [Google Scholar] [CrossRef]
  90. Nithya, K.; Sathish, A.; Kumar, P.S. Packed Bed Column Optimization and Modeling Studies for Removal of Chromium Ions Using Chemically Modified Lantana camara Adsorbent. J. Water Process. Eng. 2020, 33, 101069. [Google Scholar] [CrossRef]
  91. Enniya, I.; Rghioui, L.; Jourani, A. Adsorption of hexavalent chromium in aqueous solution on activated carbon prepared from apple peels. Sustain. Chem. Pharm. 2018, 7, 9–16. [Google Scholar] [CrossRef]
  92. Yarkandi, N.H. Kinetic and Isotherm of Toxic Hexavelant Chromium Adsorption onto Natural Adsorbent. Int. J. Curr. Microbiol. Appl. Sci. 2014, 3, 1–15. [Google Scholar]
  93. Bayuo, J.; Pelig-Ba, K.B.; Abukari, M.A. Adsorptive Removal of Chromium(VI) from Aqueous Solution unto Groundnut Shell. Appl. Water Sci. 2019, 9, 107. [Google Scholar] [CrossRef] [Green Version]
  94. Mitra, T.; Bar, N.; Das, S.K. Rice Husk: Green Adsorbent for Pb(II) and Cr(VI) Removal from Aqueous Solution–Column Study and GA–NN Modeling. SN Appl. Sci. 2019, 1, 486. [Google Scholar] [CrossRef] [Green Version]
  95. El-Baz, A.A.; Hendy, I.; Dohdoh, A.M.; Srour, M.I. Adsorption of High Chromium Concentrations from Industrial Wastewater Using Different Agricultural Residuals. J. Environ. Treat. Tech. 2020, 9, 122–138. [Google Scholar] [CrossRef]
  96. Garg, R.; Garg, R.; Sillanpää, M.; Alimuddin; Khan, M.A.; Mubarak, N.M.; Tan, Y.H. Rapid Adsorptive Removal of Chromium from Wastewater Using Walnut-Derived Biosorbents. Sci. Rep. 2023, 13, 6859. [Google Scholar] [CrossRef] [PubMed]
  97. Pertile, E.; Dvorský, T.; Václavík, V.; Heviánková, S. Use of Different Types of Biosorbents to Remove Cr(VI) from Aqueous Solution. Life 2021, 11, 240. [Google Scholar] [CrossRef]
  98. Babu, J.D.; Sumalatha, B.; Narayana, V.A.; Pulipati, K.; Rao, R.A. Simultaneous Biosorption of Chromium (III) and Chromium (VI): Application of Multiple Response Optimizations. J. Agric. Sci. Technol. 2019, 22, 556230. [Google Scholar]
  99. Castañeda-Figueredo, J.S.; Torralba-Dotor, A.I.; Pérez-Rodríguez, C.C.; Moreno-Bedoya, A.M.; Mosquera-Vivas, C.S. Removal of Lead and Chromium from Solution by Organic Peels: Effect of Particle Size and Bio-Adsorbent. Heliyon 2022, 8, e10275. [Google Scholar] [CrossRef] [PubMed]
  100. Putz, A.-M.; Ciopec, M.; Negrea, A.; Grad, O.; Ianăşi, C.; Ivankov, O.I.; Milanović, M.; Stijepović, I.; Almásy, L. Comparison of Structure and Adsorption Properties of Mesoporous Silica Functionalized with Aminopropyl Groups by the Co-Condensation and the Post Grafting Methods. Materials 2021, 14, 628. [Google Scholar] [CrossRef] [PubMed]
  101. Allwin Mabes Raj, A.F.P.; Bauman, M.; Lakić, M.; Dimitrušev, N.; Lobnik, A.; Košak, A. Removal of Pb2+, CrT, and Hg2+ Ions from Aqueous Solutions Using Amino-Functionalized Magnetic Nanoparticles. Int. J. Mol. Sci. 2022, 23, 16186. [Google Scholar] [CrossRef]
  102. Hu, H.; Zhao, D.; Wu, C.; Xie, R. Sulfidized Nanoscale Zerovalent Iron Supported by Oyster Powder for Efficient Removal of Cr (VI): Characterization, Performance, and Mechanisms. Materials 2022, 15, 3898. [Google Scholar] [CrossRef]
  103. De Borja Ojembarrena, F.; Sammaraie, H.; Campano, C.; Blanco, A.; Merayo, N.; Negro, C. Hexavalent Chromium Removal from Industrial Wastewater by Adsorption and Reduction onto Cationic Cellulose Nanocrystals. Nanomaterials 2022, 12, 4172. [Google Scholar] [CrossRef]
  104. Ali, A.; Alharthi, S.; Al-Shaalan, N.H.; Naz, A.; Fan, H.-J.S. Efficient Removal of Hexavalent Chromium (Cr(VI)) from Wastewater Using Amide-Modified Biochar. Molecules 2023, 28, 5146. [Google Scholar] [CrossRef]
  105. Angaru, G.K.R.; Lingamdinne, L.P.; Koduru, J.R.; Chang, Y.-Y. N-Cetyltrimethylammonium Bromide-Modified Zeolite Na-A from Waste Fly Ash for Hexavalent Chromium Removal from Industrial Effluent. J. Compos. Sci. 2022, 6, 256. [Google Scholar] [CrossRef]
  106. Li, J.; Dong, X.; Liu, X.; Xu, X.; Duan, W.; Park, J.; Gao, L.; Lu, Y. Comparative Study on the Adsorption Characteristics of Heavy Metal Ions by Activated Carbon and Selected Natural Adsorbents. Sustainability 2022, 14, 15579. [Google Scholar] [CrossRef]
  107. Tee, G.T.; Gok, X.Y.; Yong, W.F. Adsorption of Pollutants in Wastewater via Biosorbents, Nanoparticles and Magnetic Bio-sorbents: A Review. Environ. Res. 2022, 212, 113248. [Google Scholar] [CrossRef]
  108. Fernández Pérez, B.; Ayala Espina, J.; Fernández González, M.D.L.Á. Adsorption of Heavy Metals Ions from Mining Metallurgical Tailings Leachate Using a Shell-Based Adsorbent: Characterization, Kinetics and Isotherm Studies. Materials 2022, 15, 5315. [Google Scholar] [CrossRef] [PubMed]
  109. Rao, R.A.K.; Rehman, F. Adsorption of Heavy Metal Ions on Pomegranate (Punica granatum) Peel: Removal and Recovery of Cr(VI) Ions from a Multi-Metal Ion System. Adsorp. Sci. Technol. 2010, 28, 195–211. [Google Scholar] [CrossRef]
Figure 1. Fourier-transform infrared spectroscopy (FTIR) spectra of the red husk powder (RHP) (a), and the yellow husk powder (YHP) (b) before and after adsorption.
Water 15 02869 g001
Figure 2. Scanning electron microscopy (SEM) photographs of RHP before adsorption (a), RHP after adsorption (b), RHP control (c), YHP before adsorption (d), YHP after adsorption (e), and YHP control (2000×) (f).
Water 15 02869 g002
Figure 3. Energy dispersive X-ray spectroscopy (EDX) spectra and elemental composition of RHP before adsorption (a), YHP before adsorption (b), RHP after adsorption (c), and YHP after adsorption (d).
Water 15 02869 g003
Figure 4. X-ray diffraction (XRD) patterns of RHP (a) and YHP (b).
Water 15 02869 g004
Figure 5. N2 adsorption-desorption isotherms and pore distribution of RHP (a) and YHP (b).
Water 15 02869 g005
Figure 6. Radical inhibition percentage (I) of RHP and YHP against 2,2-diphenyl-1-picrylhydrazyl (DPPH) radical (a), and against 2,2′-azinobis-3-ethylbenzothiazoline-6-sulfonic acid (ABTS) radical (b).
Water 15 02869 g006
Figure 7. pH effect on the adsorption of Cr(VI) ions onto RHP and YHP. Conditions: Initial Cr(VI) concentration (25 mg/L), RHP and YHP dosage (0.01 g), solid/liquid ratio (S/L) (1 mg/mL), pH (2–8), and contact time (60 min).
Water 15 02869 g007
Figure 8. Biosorbent dose and solid/liquid ratio effect on the adsorption of Cr(VI) ions onto RHP and YHP. Conditions: Initial Cr(VI) concentration (25 mg/L), RHP and YHP dosage (0.0025–0.02 g), S/L ratio (0.25–2 mg/mL), pH (5.5), and contact time (60 min).
Water 15 02869 g008
Figure 9. Initial metal concentration effect on the adsorption of Cr(VI) ions onto RHP and YHP. Conditions: Initial Cr(VI) concentration (10 to 4000 mg/L), RHP and YHP dosage (0.005 g), S/L ratio (0.5 mg/mL), pH (2), and contact time (60 min).
Water 15 02869 g009
Figure 10. Linear plots of Langmuir isotherm for Cr(VI) ions adsorption onto RHP (a), and YHP (b). Conditions: Initial Cr(VI) concentration (10 to 4000 mg/L), RHP and YHP dosage (0.005 g), S/L ratio (0.5 mg/mL), pH (2), and contact time (60 min).
Water 15 02869 g010
Figure 11. Linear plots of Freundlich isotherm for Cr(VI) ions adsorption onto RHP (a), and YHP (b). Conditions: Initial Cr(VI) concentration (10 to 4000 mg/L), RHP and YHP dosage (0.005 g), S/L ratio (0.5 mg/mL), pH (2), and contact time (60 min).
Water 15 02869 g011
Figure 12. Linear plots of D–R isotherm for Cr(VI) ions adsorption onto RHP (a), and YHP (b). Conditions: Initial Cr(VI) concentration (10 to 4000 mg/L), RHP and YHP dosage (0.005 g), S/L ratio (0.5 mg/mL), pH (2), and contact time (60 min).
Water 15 02869 g012
Figure 13. Contact time effect on the adsorption of Cr(VI) ions onto RHP and YHP. Conditions: Initial Cr(VI) concentration (25 mg/L), RHP and YHP dosage (0.01 g), S/L ratio (1 mg/mL), pH (5.5), and contact time (5–120 min).
Water 15 02869 g013
Figure 14. Kinetic linear plots of the pseudo-first order model for Cr(VI) ions adsorption onto RHP (a), and YHP (b). Conditions: Initial Cr(VI) concentration (25 mg/L), RHP and YHP dosage (0.01 g), S/L ratio (1 mg/mL), pH (5.5), and contact time (5–120 min).
Water 15 02869 g014
Figure 15. Kinetic linear plots of the Elovich model for Cr(VI) ions adsorption onto RHP (a), and YHP (b). Conditions: Initial Cr(VI) concentration (25 mg/L), RHP and YHP dosage (0.01 g), S/L ratio (1 mg/mL), pH (5.5), and contact time (5–120 min).
Water 15 02869 g015
Figure 16. Kinetic linear plots of the pseudo-second order model for Cr(VI) ions adsorption onto RHP (a), and YHP (b). Conditions: Initial Cr(VI) concentration (25 mg/L), RHP and YHP dosage (0.01 g), S/L ratio (1 mg/mL), pH (5.5), and contact time (5–120 min).
Water 15 02869 g016
Table 1. Surface properties of RHP and YHP.
ParameterRHPYHP
SBET (m2/g)2.68443.3244
Pore volume (cm3/g)0.0031140.003987
Average pore diameter (nm)21.178114.5149
Table 2. Point of zero charge pHpzc, acidic surface functional groups concentration and the polyphenolic content of RHP and YHP.
MaterialpHpzcAcidic Surface Functional Groups (mmol/g)Polyphenolic Content
(mg Gallic Acid Equivalent/g of Dry Weight)
RHP5.1118.5102 ± 0.9
YHP4.551685.9 ± 1.3
Table 3. Parameters of Langmuir, Freundlich, and Dubinin-Radushkevich (D-R) isotherm models of Cr(VI) ions adsorption onto RHP and YHP.
BiosorbentLangmuirFreundlichD-R
Qm
Experimental
(mg/g)
Qmax
Theoretical
(mg/g)
KL
(L/mg)
RLR2KF
(mg/g(L/mg)1/nf)
1/nR2Qmax
Theoretical
(mg/g)
KDR
(mol2/kJ2)
R2
RHP407.01413.220.0160(0.015

0.861)
0.998894.40670.36290.93515235.280.00150.48272
YHP396.49403.220.0165(0.014

0.858)
0.99854.33980.36590.91909232.520.00160.42843
Table 4. Parameters of Pseudo-first order, Pseudo-second order, and Elovich kinetic models of Cr(VI) ions adsorption onto RHP and YHP.
BiosorbentPseudo-First OrderPseudo-Second OrderElovich
Qe
Experimental
(mg/g)
Qe
Calculated
(mg/g)
K1
(min−1)
R2Qe
Experimental
(mg/g)
Qe
Calculated
(mg/g)
K2
(g/mg/min)
R2α
(mg/g/min)
β
(g/mg)
R2
RHP22.603.310.016970.5025122.6022.360.024640.99965573.380.445800.6443
YHP20.993.980.009870.2724520.9919.710.029480.99896396.010.489420.58122
Table 5. Comparison of the adsorption capacities of RHP, YHP, and different natural and synthetic adsorbents towards Cr(VI) ions.
BiosorbentsQmax
(mg/g)
S/L RatioRange of
Initial
Concentrations (mg/L)
pHTemperature (°C)References
Pomegranate husk403.22–413.220.5 mg/mL10–4000225Current study
Tea waste biochar 38.620.6 mg/mL10–2505.220 ± 2 [89]
Modified Lantana camara362.8Fixed bed column experiment100–3001.5Not mentioned[90]
(bed height 4 cm)
Apple peel36.011 mg/mL10–50228 [91]
Egg shell 299.4103 mg/150 mL1–100325[92]
Groundnut shell3.7922 mg/mL15–100841.5[93]
Rice husk11.39Fixed bed column experiment10–30525  ±  2[94]
(bed height 50 cm)
Banana waste 105.8425 mg/mL400–1000330[95]
Walnut shell 64.821 mg/mL20–120225[96]
Peach stones25.520 mg/mL100–10001.125 ± 2[97]
Gelidilla acerosa (Micro algea) 270.270.5 mg/mL20–1002.81Ambient temperature[98]
Passion fruit3.310 mg/mL5–500622[99]
Aminopropyl functionalized mesoporous silica by co-condensation93.64 mg/mL25–10003.525[100]
Amino functionalized magnetic nanoparticles90.42.25 mg/mL2007Room temperature[101]
Sulfidized nanoscale zerovalent iron supported by oyster shell164.70.1 mg/mL0–103.525[102]
Cationic cellulose nanocrystals440.1 mg/mL0.1–703Room temperature[103]
Amide-modified biochar229.882 mg/mL100–500225[104]
N-cetyltrimethylammonium bromide (CTAB)-modified fly ash-based zeolite Na-A108.760.5 mg/mL10–300325[105]
Disclaimer/Publisher’s Note: The statements, opinions and data contained in all publications are solely those of the individual author(s) and contributor(s) and not of MDPI and/or the editor(s). MDPI and/or the editor(s) disclaim responsibility for any injury to people or property resulting from any ideas, methods, instructions or products referred to in the content.