Article

Simulation of Water Quality in a River Network with Time-Varying Lateral Inflows and Pollutants

1
Ocean College, Zhejiang University, Hangzhou 310058, China
2
Power China Huadong Engineering Corporation Limited, Hangzhou 311122, China
*
Author to whom correspondence should be addressed.
Water 2023, 15(16), 2861; https://doi.org/10.3390/w15162861
Submission received: 4 June 2023 / Revised: 15 July 2023 / Accepted: 25 July 2023 / Published: 8 August 2023

Abstract

:
Non-point source pollution inflow is one of the main causes of water quality decline in urban river networks. In this paper, aiming at the problem of non-point source pollutant transport in river network, the lateral outflow term in the Saint-Venant equation is improved from the previous constant to the time-varying flow process, and a mathematical model considering the time-varying source and sink term is established. Based on the initial rainfall intensity, surface confluence and non-point source pollutant concentration, a method for calculating the time-varying lateral pollutant input of nodes and tributaries with linear increase and exponential decay in the initial rainfall period is proposed. Based on the principle of proximity, the watershed is divided into districts. According to the principle of elevation, the non-point source pollutants are allocated to the calculation nodes of adjacent rivers in a certain proportion and incorporated into the model calculation so as to improve the mathematical model of river network water quality and apply it to the simulation of river network water quality in Maozhou River Basin. Verified by the measured data, the NSE values of the improved model are 0.805 and 0.851, respectively, indicating that the model has reliable hydrodynamic and water quality simulation accuracy, indicating that the model can be applied to the calculation of non-point source pollutants in the basin. Based on the improved model, the variation of COD concentration in the Maozhou River of Shenzhen before and after optimized water replenishment was calculated, and the time variation and spatial distribution law of the sudden drop of water quality in the river network caused by the inflow of non-point source pollution in the initial rainfall runoff and the rapid recovery after optimized water replenishment were revealed.

1. Introduction

The water quality of river networks is mainly influenced by upstream water quality, point source pollution along riverbanks, and non-point source pollution from surrounding areas. Concentrations of persistent contaminants were related to sources of urban pollution [1,2,3]. Although point source pollution has been gradually controlled in recent years, non-point source pollution has increasingly affected water quality [4]. Relevant Statistical studies of Bouwman have shown that non-point source pollution has become one of the main factors contributing to environmental pollution in the United States, with approximately 60% of water pollution originating from this type of contamination [5]. Non-point source pollution is also considered the primary source of pollution in China. For example, non-point source pollution contributes to over 80% of nitrogen and total phosphorus loading in the Taihu Lake Basin [6,7]. Studies have shown that the occurrence and migration of non-point source pollution is an important eco-hydrological process. Land use and vegetation cover indirectly affect the migration and transformation of pollutants by affecting the hydrodynamic and sediment migration processes, thus affecting the water quality [8,9,10]. River sewage sludge contains a large amount of microplastics, and biological pollution can change the fluid dynamics and size of microplastics. Cook, S et al. [11] suggest that Rhodamine can be released into the natural environment with the potential to mimic microplastic movement in the water column. The behavior of neutral buoyancy microplastic particles is similar to that of solute and follows the theoretical dispersion theory of uniform open channel flow, which can be released in the river to simulate the movement of microplastics. Goodarzi, D et al. [12] simulated the effect of particle size distribution discretization on the deposition and propagation of sediments in the channel. The results show that increasing the height of the obstacle will reduce the dense flow velocity and sediment transport in the narrow channel. Rectangular obstacles have a more obvious effect on blocking the flow of turbidity current, resulting in an increase in sediment deposition and reducing the impact of turbidity current. Tong Xiaoxia et al. conducted an in-depth analysis of the response relationship between surface water quality and vegetation coverage in Shenzhen through the evaluation of Nemero’s comprehensive pollution index. The results showed that when the vegetation coverage rate reached 30%, the surface water quality would be significantly improved [13]. Longitudinal dispersion coefficient (Dx) influences the transport and fate of pollutants in streams; Ghiasi, B et al. suggests that river water quality assessments and environmental management studies should consider the impacts of uncertainty associated with the Dx estimation on the pollutant concentrations [14]. Although numerous studies have investigated point source and agricultural non-point source pollution diffusion domestically and internationally [15,16], there has been only limited analysis of the impact of urban non-point source pollution on river network water quality [17,18,19].
The Maozhou River in the western part of Shenzhen is part of the Pearl River Delta River network. The Maozhou is one of the most heavily polluted rivers in Shenzhen and the Pearl River Delta region. Systematic management and substantial reductions in the discharge of sewage into the river during the dry season have led to significant improvements in water quality in the watershed in recent years, as well as relatively stable water quality during the dry season. However, because of dense urban construction and the predominance of urban and industrial areas in the Maozhou River Basin [20], non-point source pollution now poses a prominent risk to the watershed. Of this non-point pollution, Chemical Oxygen Demand (COD) accounts for 19% of the total pollutant load, indicating a high non-point source pollution load. Additionally, unfavorable tidal dynamics at the river mouth and high pollution risks after rainfall persist. During the rainy season, non-point source pollution originating from densely populated urban areas poses a significant challenge to upholding water quality standards. Hydrodynamic and water quality-related simulation studies of the Pearl River Delta river network conducted to improve river network water quality have shown that this issue can be solved via water diversion and flow augmentation [21,22], as well as optimization of gate and pump scheduling strategies [23].
Non-point source pollution has a greater impact on river network water quality than point source pollution [24]. However, quantification of non-point source pollution load presents challenges because of the inherent uncertainty associated with rainfall–runoff events [25]. Specifically, urban non-point source pollution exhibits considerable spatial and temporal variations during the rainy season, giving rise to elevated levels of uncertainty and posing a grave risk to meeting water quality standards in urban areas [26,27,28]. Previous investigations into non-point source pollution conducted at the watershed [29,30], urban [31,32,33], and regional [34,35] levels have all underscored the significant threat posed by non-point source pollution to achieving water quality standards in river networks. Notably, during the initial runoff of rainfall events, non-point source pollution can account for 70% of the overall pollutant load [36,37], resulting in substantial impacts on pollution loading in river networks and exacerbating the challenges associated with water quality assessments.
Furthermore, many models simplify complex river networks by considering only the main river channels without small tributaries during the calculation of water quality. Some models also set the boundary lateral parameters at the mouths of tributaries as fixed values [38,39] and simplify the estimation of non-point source pollution loading [40,41]. However, these approaches rely on subjective judgments and lack the ability to accurately determine the sideways inputs of non-point source pollution to river network watersheds. During rainfall, the runoff and confluence of the basin carry non-point source pollutants into the adjacent river channel, forming lateral inflow and pollutant input, which change with the change of rainfall intensity and runoff, so the lateral boundary parameters should not be constant.
In this study, we addressed the issue of non-point source pollution transportation in river networks by developing a mathematical model that considers the temporal changes in pollutant sources and sinks. Moreover, we propose a new method for calculating the sideways concentration of non-point source pollutants. By dividing the watershed’s non-point source pollutant concentration into sub-regions, we assign the pollutants to neighboring river nodes and incorporate them into the model calculations, thus enhancing the mathematical model for water quality in river networks. MIKE 11 is used for hydrodynamic and water quality simulation. The hydrodynamic model of MIKE 11 software uses an implicit finite difference scheme to simulate the movement of unstable rivers. Building on this, we conduct numerical simulations of the water quality of the Maozhou River system in the Bao’an District, Shenzhen and analyze the patterns of water quality recovery in the Maozhou River’s tributaries following rainfall events.

2. River Network Hydrodynamic Model

2.1. Improvements to the Control Equation

Runoff generated by rainfall varies with rainfall intensity, and non-point source pollutants enter adjacent river channels in the runoff. This causes lateral inflow qi and pollutant input qiCi to the river network, both of which change with rainfall intensity and runoff. Therefore, the lateral boundary parameters in the hydrodynamic water quality model for a river network are not constant; that is, lateral runoff qi(t) and pollutant input qi(t)Ci(t) are time-varying processes. This means that the control equations for the river network model can be improved by the time-varying processes of lateral inflow and pollutant inputs as follows:
A t + Q x = q i ( t )
Q t + ( α Q 2 / A ) x + g A Z x + g n 2 | Q | Q A R 4 / 3 = 0
A C t + Q C x = λ q i ( t ) C i ( t )
where qi(t) is the time-varying lateral inflow, Ci(t) is the time-varying lateral inflow pollutant concentration, C is the pollutant concentration in the river network, λ is the pollutant degradation coefficient, R is the hydraulic radius, n is the Manning coefficient, and the other symbols are the same as before.

2.2. Time-Varying Process Associated with Lateral Inflow

The lateral inflow of a river network is related to the rainfall intensity, the runoff coefficient, the area of the blocks around the computing node, and the confluence ratio of the block runoff. The rainfall intensity is the observation value obtained from a local weather station, and the runoff coefficient is based on the underlying surface of the block. The confluence ratio of the four blocks around the river network computing node is determined using the ground elevation and proximity principle. Thus, the time-varying process for node lateral inflow can be expressed as follows:
q m ( t ) = 1 3.6 j = 1 4 β m j A m j α m P m ( t )
where qm(t) is the lateral inflow per unit time and unit width at the node (m3/sm), Pm(t) is the rainfall intensity of the block around the mth node (mm/h), Amj is the area of the jth block around the mth node (km2), αm is the runoff coefficient of the block around the mth node, βm is the proportion of the runoff into the mth node in the jth block, that is, the runoff distribution coefficient, and the constant 3.6 is the conversion coefficient of the parameter unit.
If Equation (4) is used to calculate the runoff qim(t) of the mth node into the ith tributary, then the inflow of the ith tributary should be equal to the sum of all the nodes into the tributary, so the time-varying process qi(t) for the lateral inflow of the ith tributary in Equation (1) can be calculated according to the following formula:
q i ( t ) = m = 1 M i q i m ( t )
where Mi is the number of computing nodes associated with the ith tributary.

2.3. Calculation Method for Lateral Pollutant Concentration

The concentration of pollutants in the lateral inflow of the river network is related to that of pollutants in the ground confluence of the adjacent blocks, which is related to the initial rainfall intensity, the pollutant load of the underlying surface, and the underlying surface type. In this study, the rainfall intensity was the observation value obtained from a local weather station, and the runoff coefficient was determined based on the underlying surface of the block. The confluence ratio of the four blocks around the river network computing node was determined using the distance and ground elevation.
If cmj(t) is the pollutant concentration of the jth block of the mth node, then the total amount of pollutants entering the mth node is as follows:
q m ( t ) c m ( t ) = j = 1 4 P m ( t ) α m A m j β m j c m j ( t )
The pollutant concentration during the initial rain period can be determined according to the locally measured data or can be calculated using the linear law for the maximum concentration of the initial rain as follows:
C m j ( t ) = C m j ( P 10 ) t t 0 , ( t t 0 )
The concentration of inflow pollutants after the 10 mm initial rain event attenuates exponentially, and the calculation formula is as follows:
C m j ( t ) = C m j ( P 10 ) e μ P ( t ) ( t t 0 ) / 0 T r P ( t ) d t , t > t 0
where μ is a dimensionless coefficient that is based on the observation data for rainfall intensity and the pollutant concentration.
The concentration of inflow pollutants at the mth node is as follows:
C m ( t ) = j = 1 4 A m j β m j c m j ( t ) / j = 1 4 A m j β m j
If the total amount of inflow pollutants at the mth node of the ith tributary is qim(t)cim(t), which can be calculated according to Equation (6), then the lateral pollutant input of the ith tributary should be equal to the sum of the pollutant input of all the nodes into the tributary, that is, qi(t)Ci(t) in Equation (3) can be calculated using the following equation:
q i ( t ) C i ( t ) = m = 1 M i q i m ( t ) c i m ( t )
where qi(t) is the time-varying lateral inflow of the ith tributary, Ci(t) is the time-varying pollutant concentration in the lateral inflow of the ith tributary, and qi(t)Ci(t) is the time-varying lateral pollutant input into the ith tributary, which includes regional non-point source and point source pollution inputs at the outfall. For the Maozhou River Basin, the time-varying lateral pollutant input qi(t)Ci(t) is mainly a regional non-point source pollutant input. The term qim(t) indicates the time-varying lateral inflow at the mth node of the ith tributary, and Cim(t) indicates the time-varying pollutant concentration of the lateral inflow at the mth node of the ith tributary.

3. Case Study

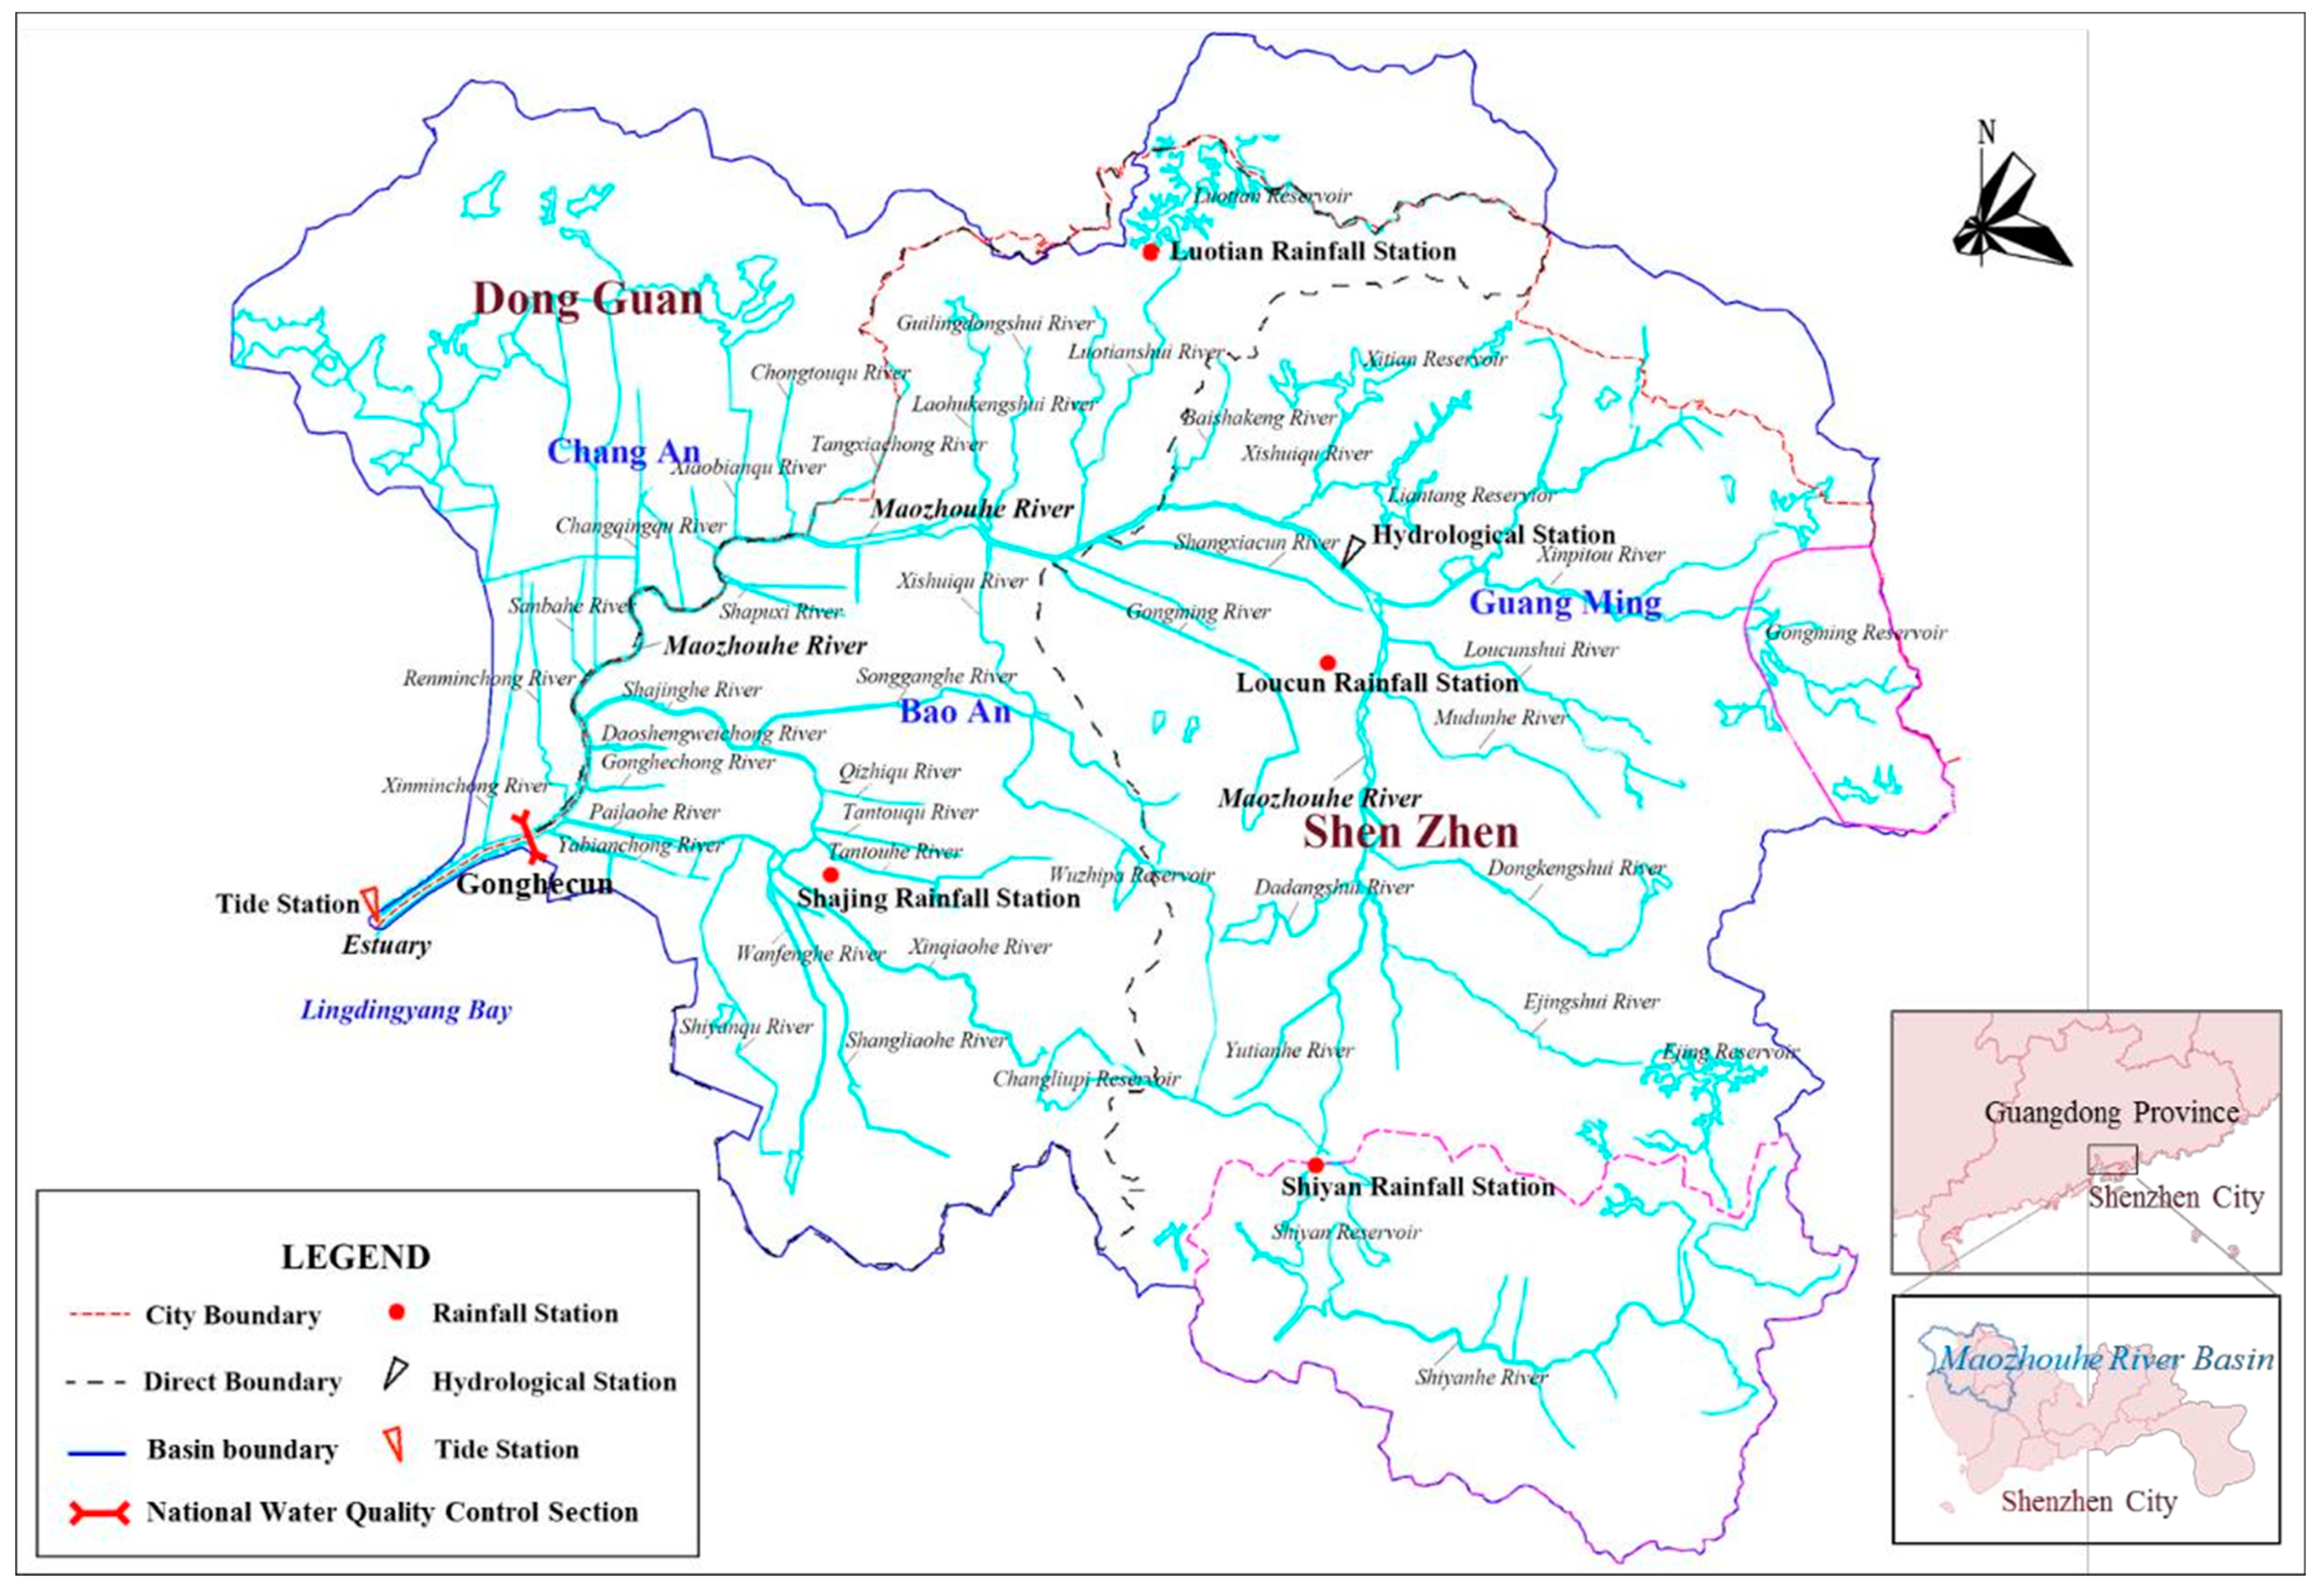
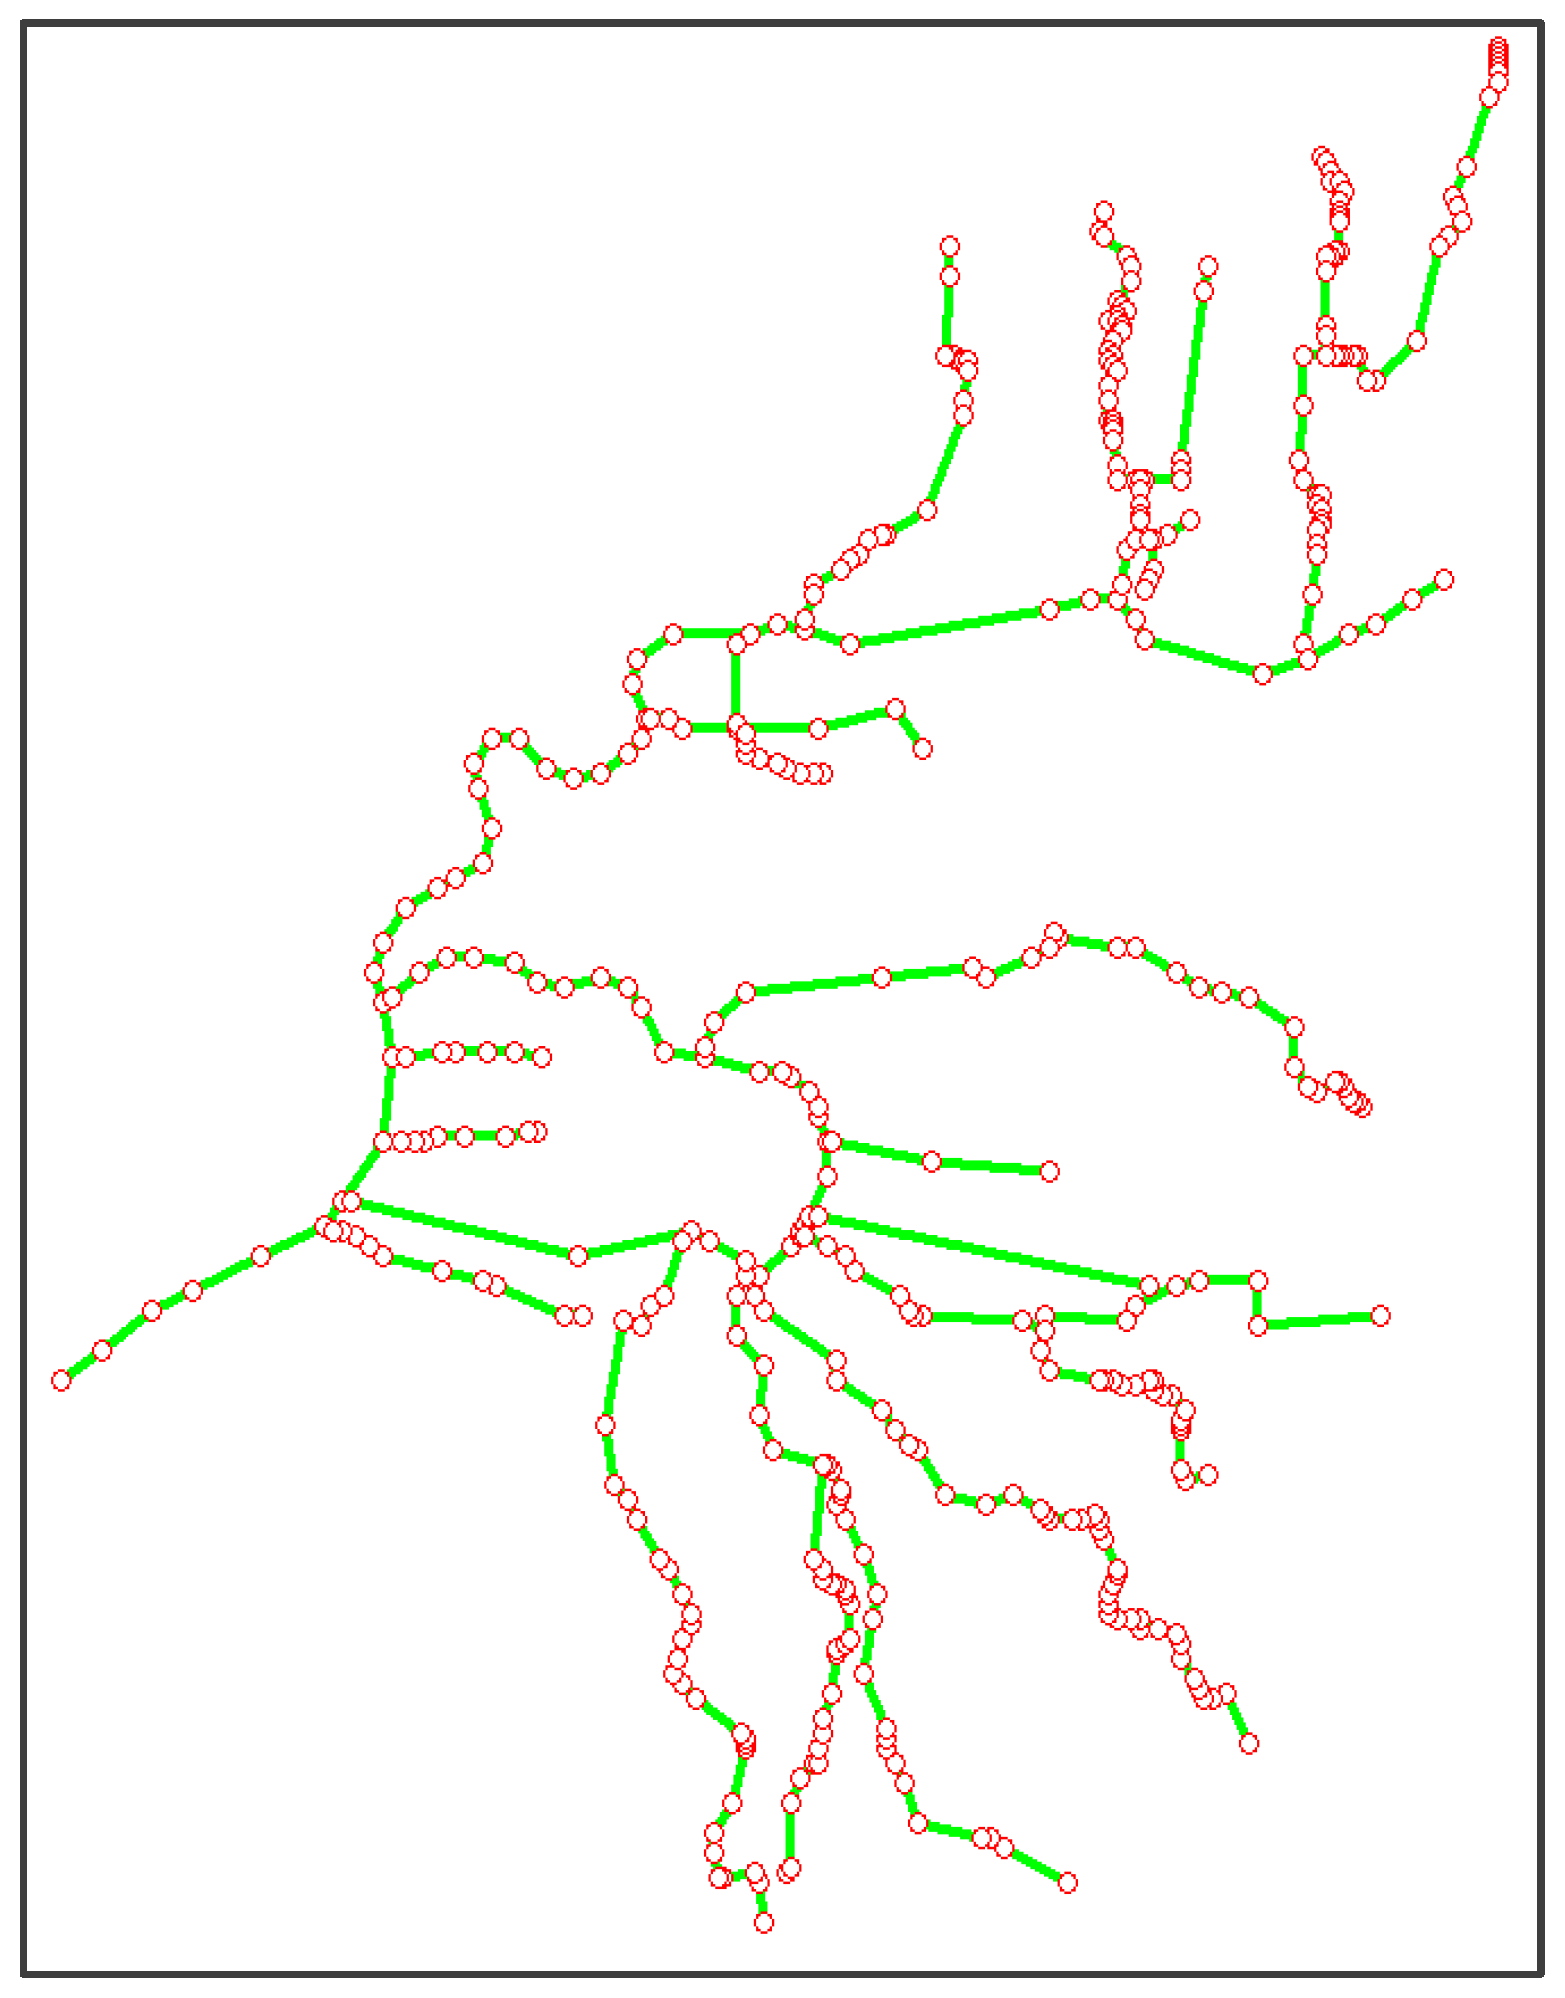
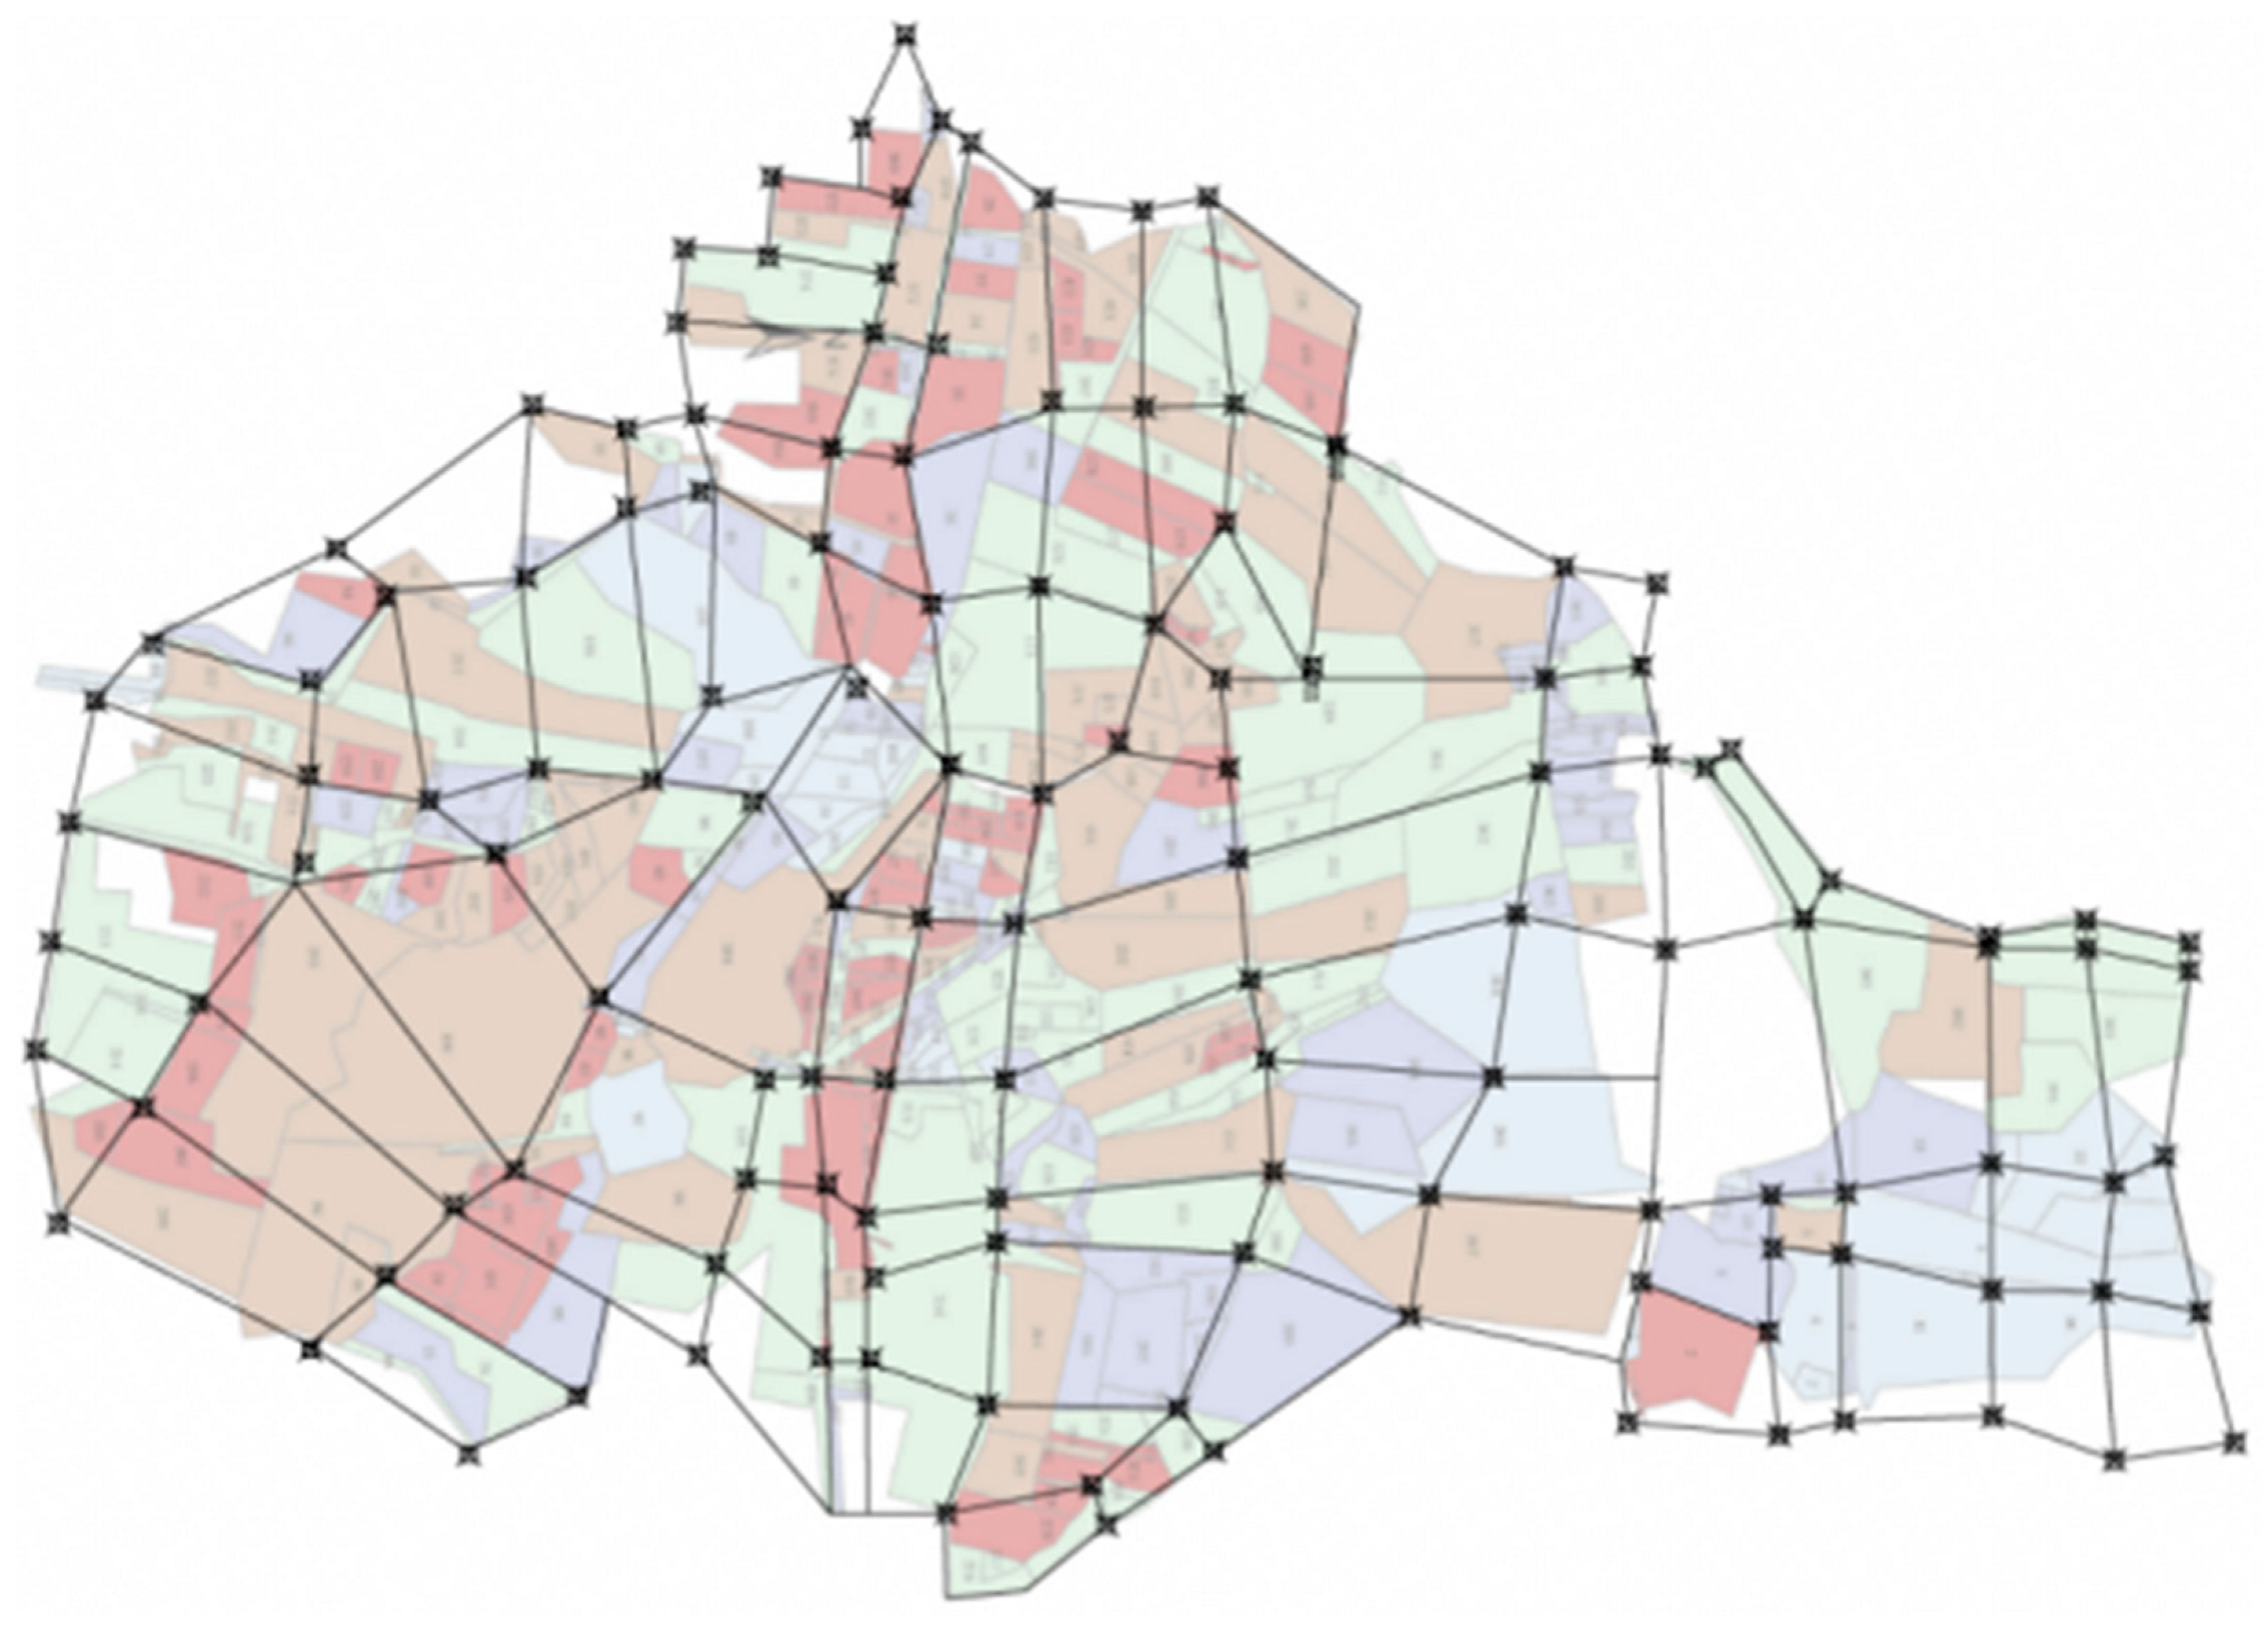
3.1. Mainstream and Tributaries of the Maozhou River

The Maozhou River, with a total length of 96.56 km for its mainstream section and tributaries, flows through Bao’an District and Guangming New District of Shenzhen City and Chang’an Town in Dongguan City, China. It belongs to the river network area of the Pearl River Delta and is the longest river in Shenzhen. The total area of the basin is 388 km2, of which 112.65 km2 is under the jurisdiction of Bao’an. The water system diagram is shown in Figure 1. Bao’an District is densely built-up with a relatively high proportion of industrial land. In addition to scarce background water sources, the river water pollutants seriously exceed the national standard and do not meet surface water class V, which means that the water ecological environment urgently needs to be improved. The water quality of the river network has recently been significantly improved by introducing reclaimed water from the Sewage Treatment Plant in Bao’an District to supplement the main water source. However, the non-point source pollution in the highly built-up area during the rainy season means that it is difficult to continuously and stably comply with the water quality standards.

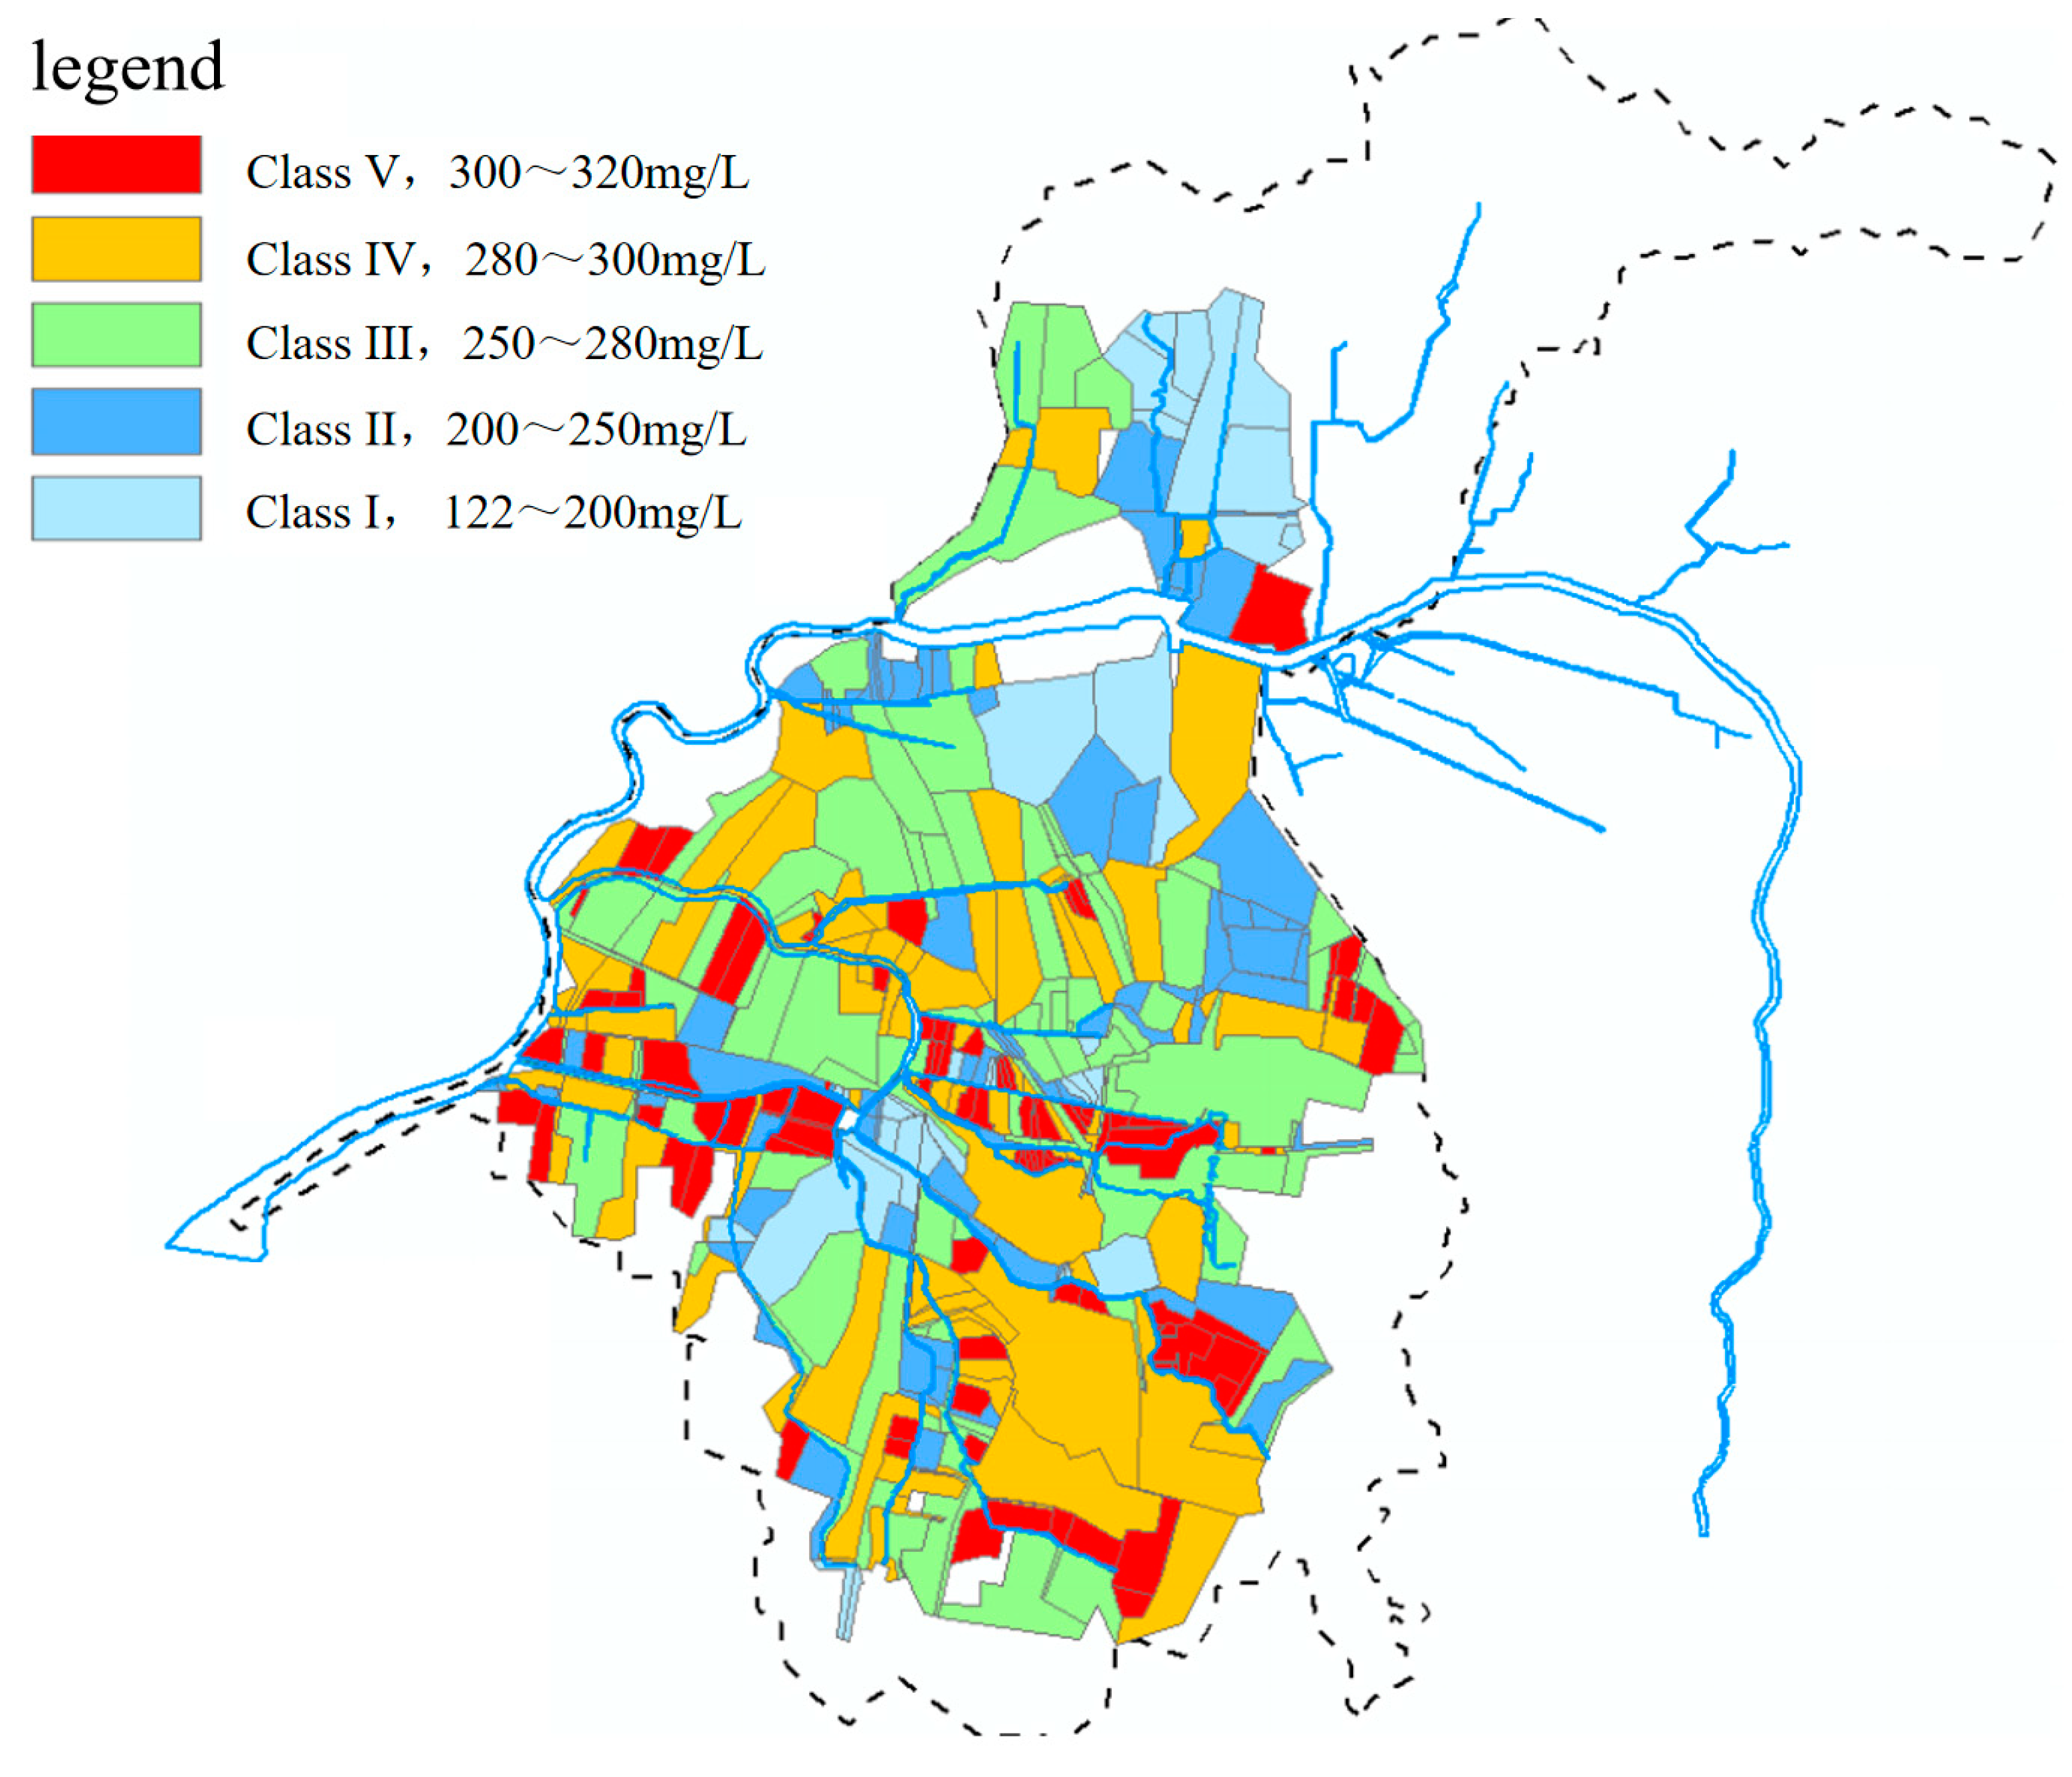
3.2. Determination of Regional Non-Point Source Chemical Oxygen Demand (COD) Load

The underlying surface types in the Maozhou River Basin are shown in Figure 2. The Technical Route and Guide for Non-point Source Pollution Management of Shenzhen (Trial) classifies the regional non-point source pollution sources according to the characteristics of the pollutants and the quality of the initial rainwater runoff.
Based on the measured value of the mean COD concentration after the 10 mm initial rain event over the different blocks, class A plots were given a value of 120 mg/L, class B plots 220 mg/L, and classes C and D plots 320 mg/L. The underlying surface types for Category A, B, C, and D parcels are shown in Table 1.
The spatial analysis function in Arc GIS was used to obtain the COD pollution load for each region under the effect of a 10 mm initial rain event in the Maozhou River Basin. The non-point source pollution in the Maozhou River Basin was divided into grades I to V, which corresponded to pollution concentration ranges of 122–200 mg/L for grade I, 200–250 mg/L for grade II, 250–280 mg/L for grade III, 280–300 mg/L for grade IV, and 300–320 mg/L for grade V. The regional surface source COD loads are shown in Figure 3.

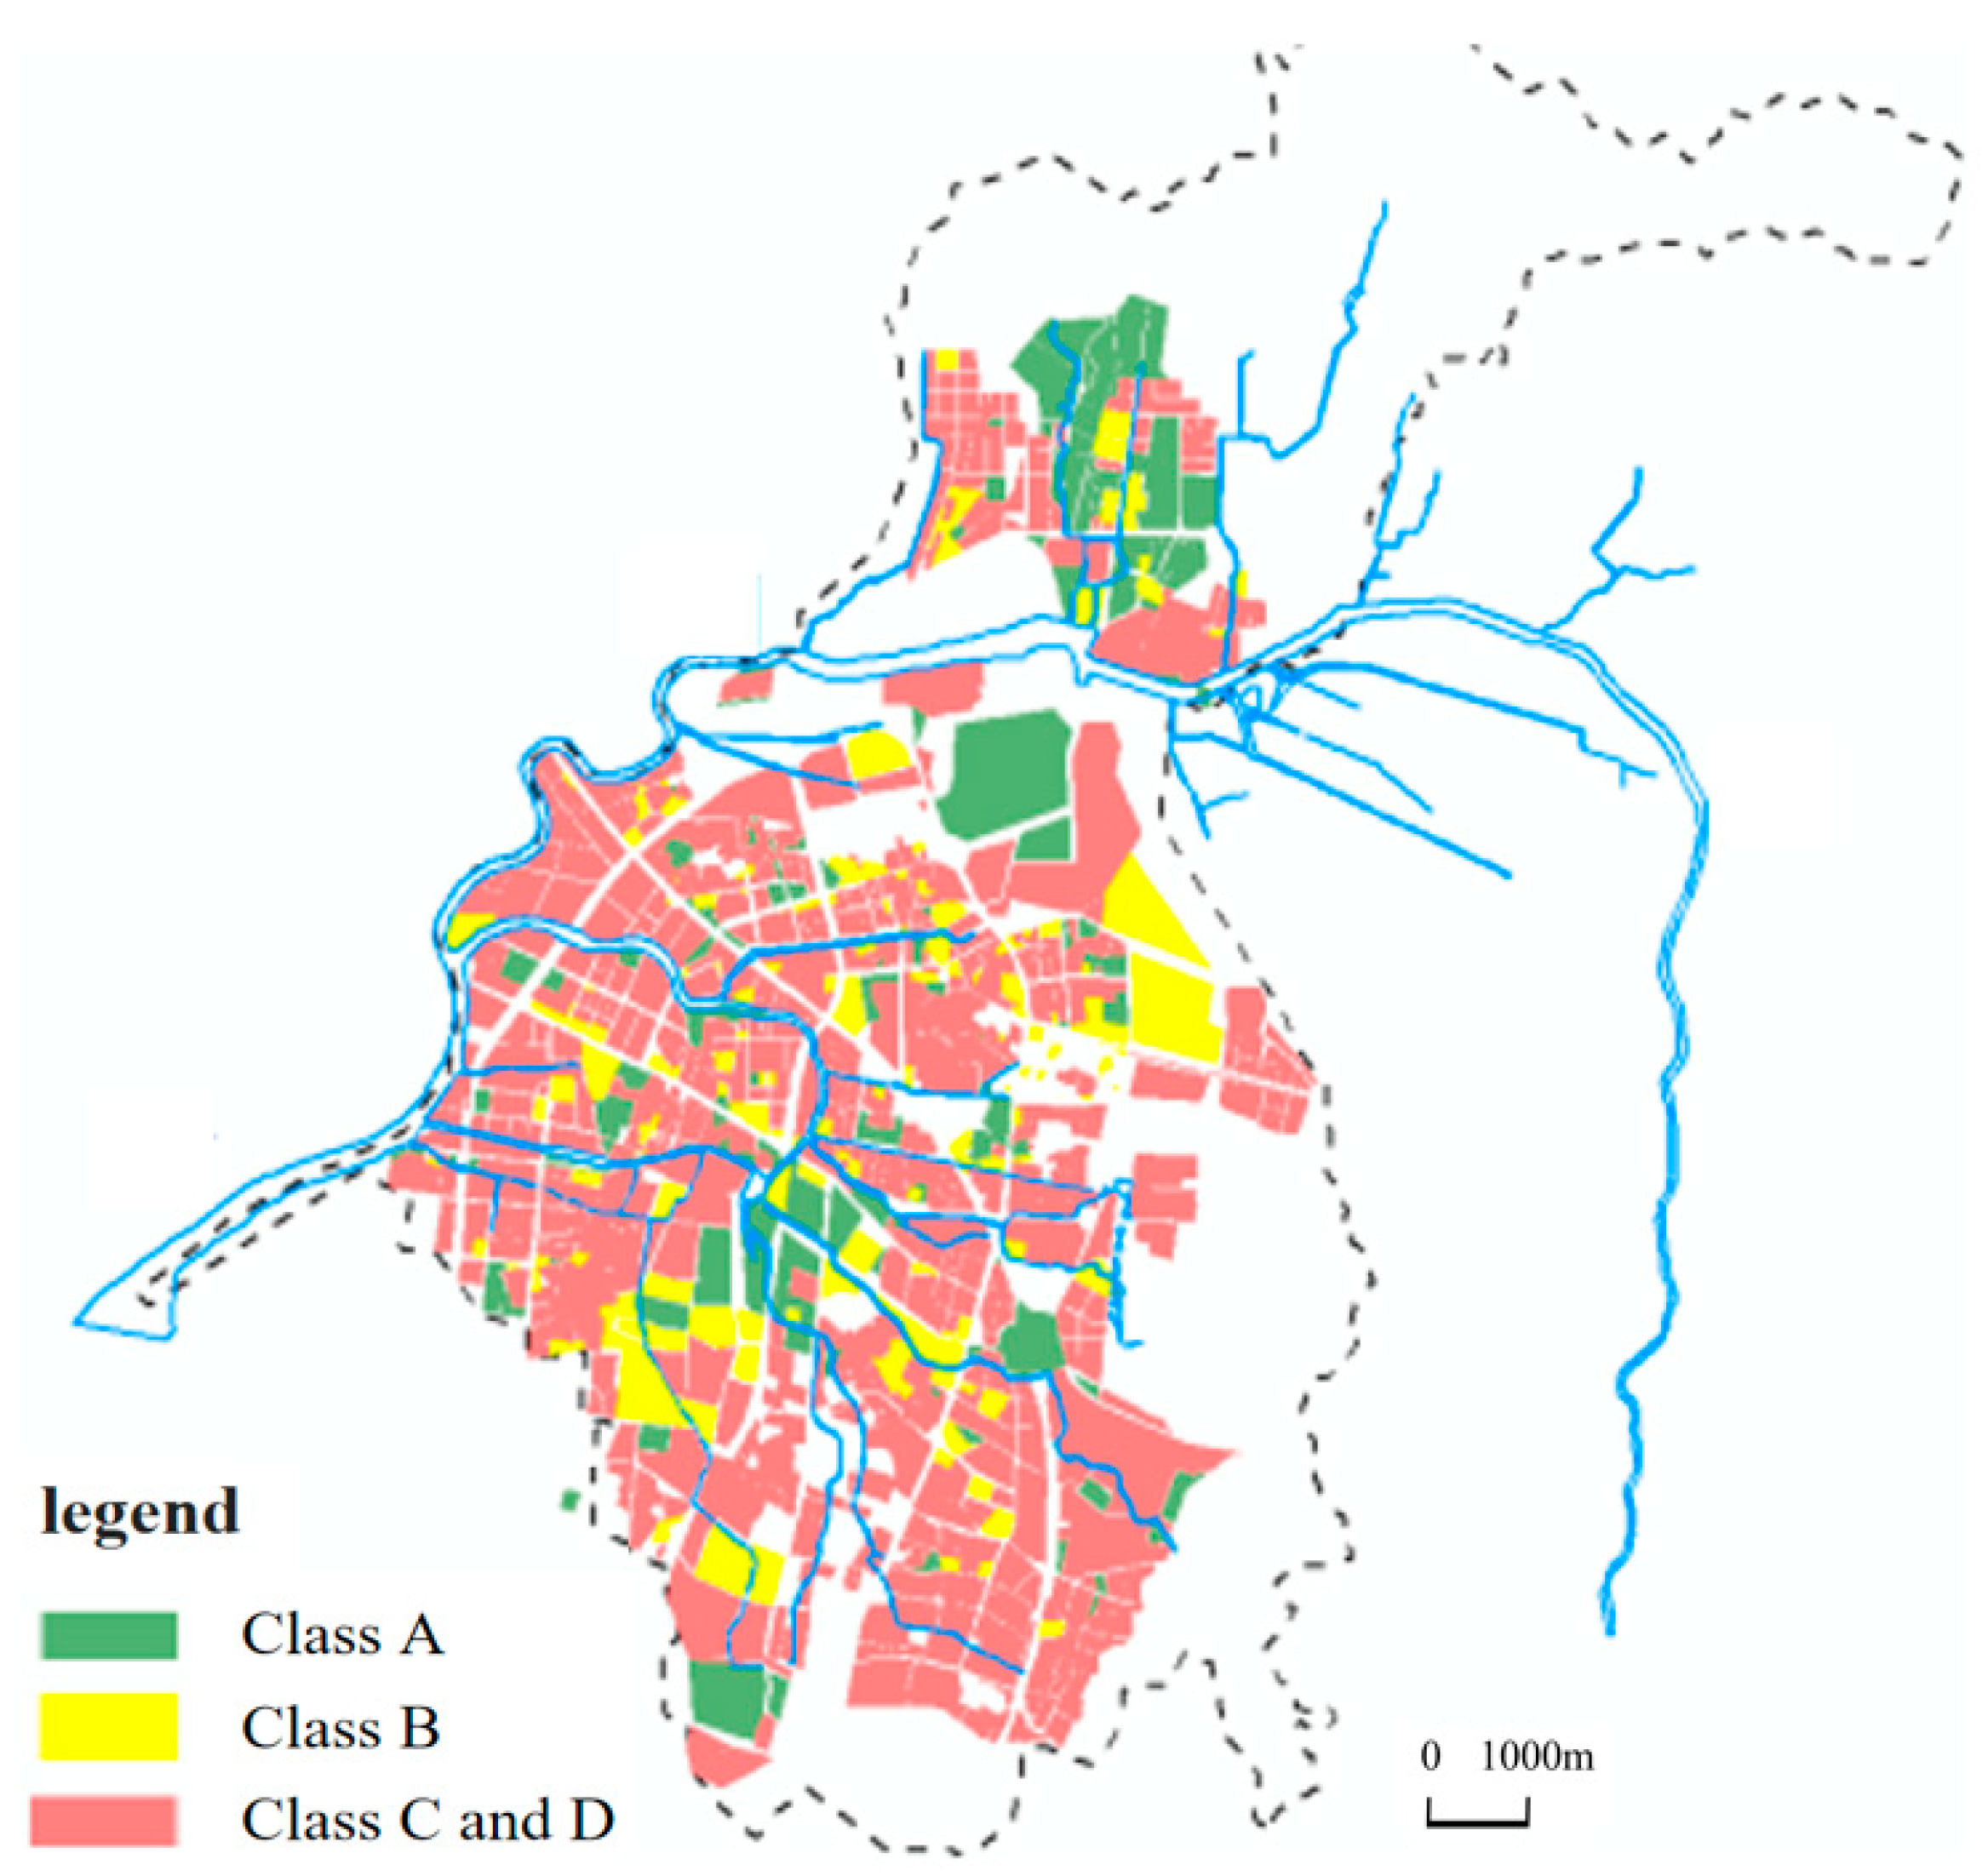
3.3. Regional Divisions and Node Pollutant Distribution

The river network was generalized into 25 rivers and 452 nodes based on the water system diagram. The generalized river network is shown in Figure 4. The coordinate node data were extracted from the generalized river network diagram and integrated into the ArcGIS software to obtain the regional computing node distribution, as shown in Figure 5.
The distribution method for distributing regional non-point source pollution was based on ArcGIS spatial analysis technology and the cluster analysis method. The non-point source pollutants in the different blocks were allocated to each computing node as the pollutant boundary conditions of the MIKE11 model. The river network computing nodes were selected based on the proximity principle and were used to divide the basin into several blocks. Each block was connected by several nodes. The pollutants and flow from each block only flowed into the adjacent river network computing nodes. The node selections and block divisions are shown in Figure 6. The Maozhou River Basin Bao’an Area was divided into 105 blocks, and 117 computing nodes were selected. The average side length of a divided block was not more than 1 km; that is, the pollutants at a certain location did not flow into areas that were beyond 1 km, which was in line with the actual situation.
The pollutant concentration and flow for each block were allocated to the boundary nodes in a certain calculated proportion based on the ground elevation. Each node was connected to a number of blocks, and the assigned pollutant concentration was a linear combination of the pollutant concentrations assigned to the node by the blocks adjacent to the node. The overall flow was the sum of the flows of the adjacent blocks at the node. The node runoff allocation coefficient βi was allowed to have different values for different watershed ground slopes, provided that it is satisfied.
i = 1 4 β i = 1

4. Results and Discussion

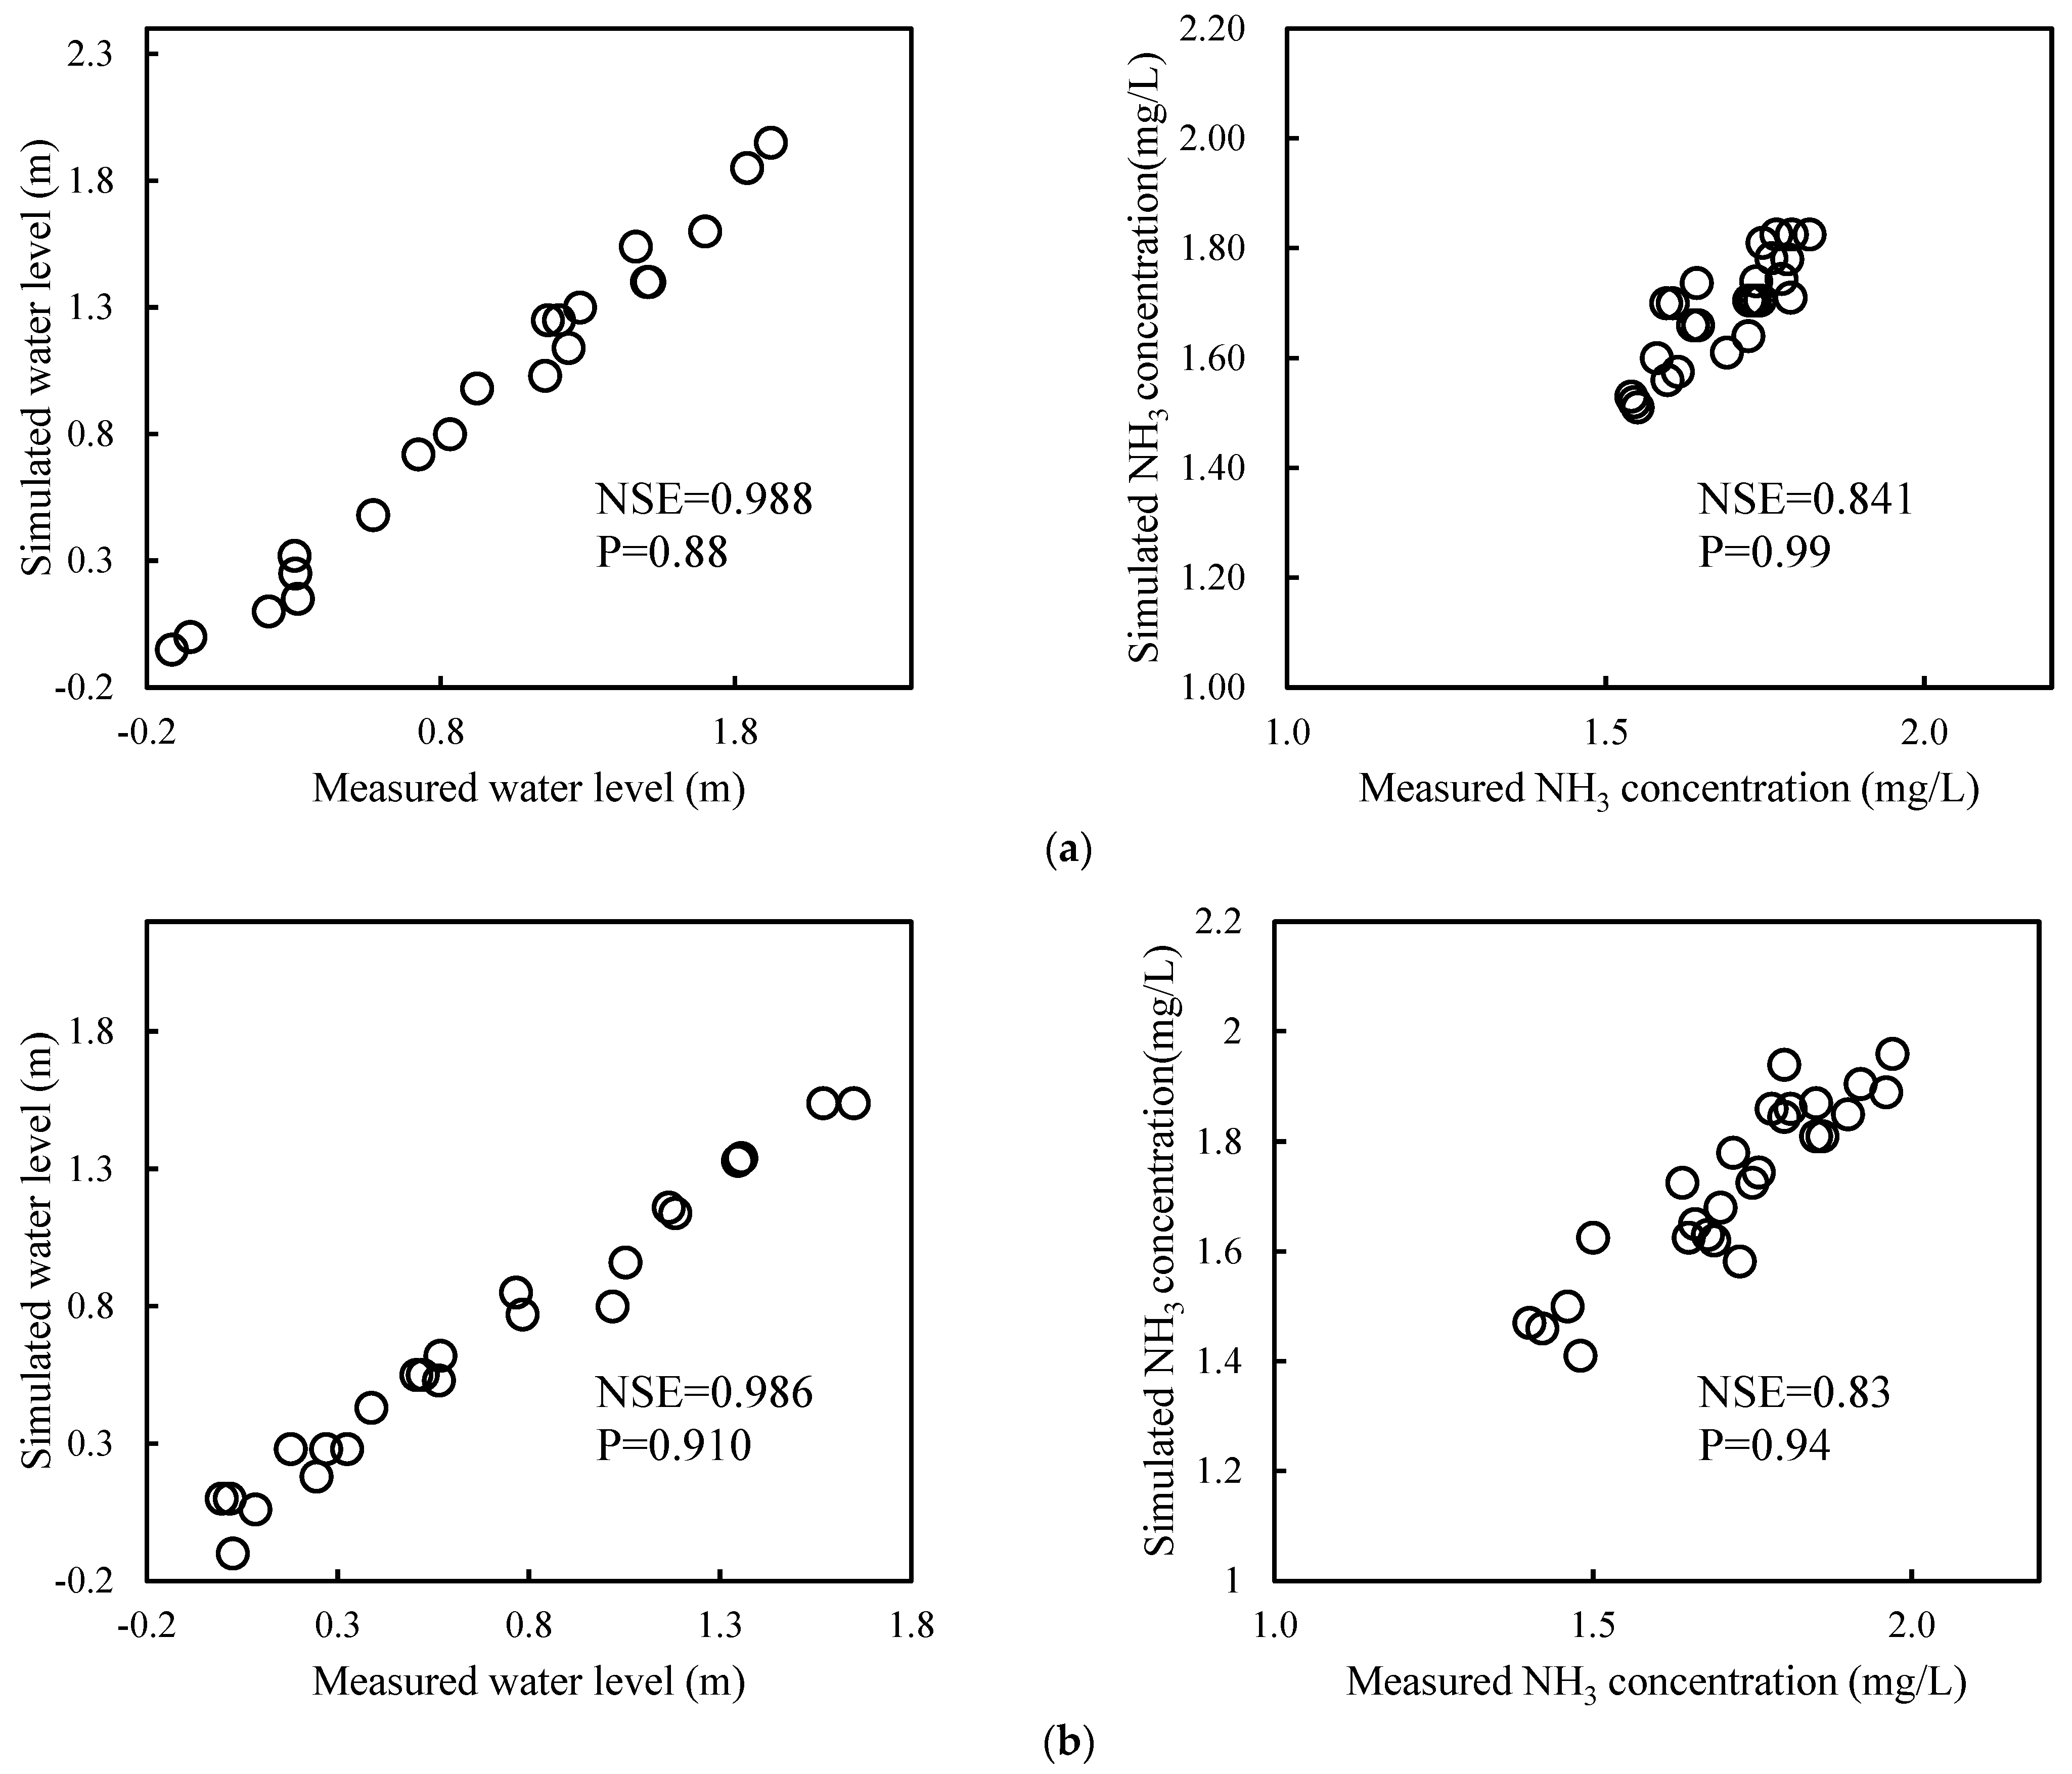
4.1. Parameter Calibration of the River Network Hydrodynamic Water Quality Model

The measured hydrodynamic and water quality synchronous monitoring data for the Gonghe Village section from 21 to 22 March 2019 were selected for model calibration. The Nash–Sutcliffe efficiency coefficient (NSE) was used to evaluate the calibration accuracy of the model, which was calculated using Equation (12):
N S E = 1 t = 1 T ( Q O t Q m t ) 2 t = 1 T ( Q O t Q O ¯ ) 2
where QOt is the measured value at time t, Qmt is the simulated value at time t, Q O ¯ is the average of the observed values.
The riverbed roughness was 0.03, and the diffusion coefficient was 10 m2/s. The results of the model calibration are shown in Figure 7. In the Gonghe Village, The NSE values for water level and ammonia nitrogen concentration section were 0.988 and 0.841, and P were 0.88 and 0.99, respectively, indicating that the model could accurately simulate river hydrodynamics and water quality.

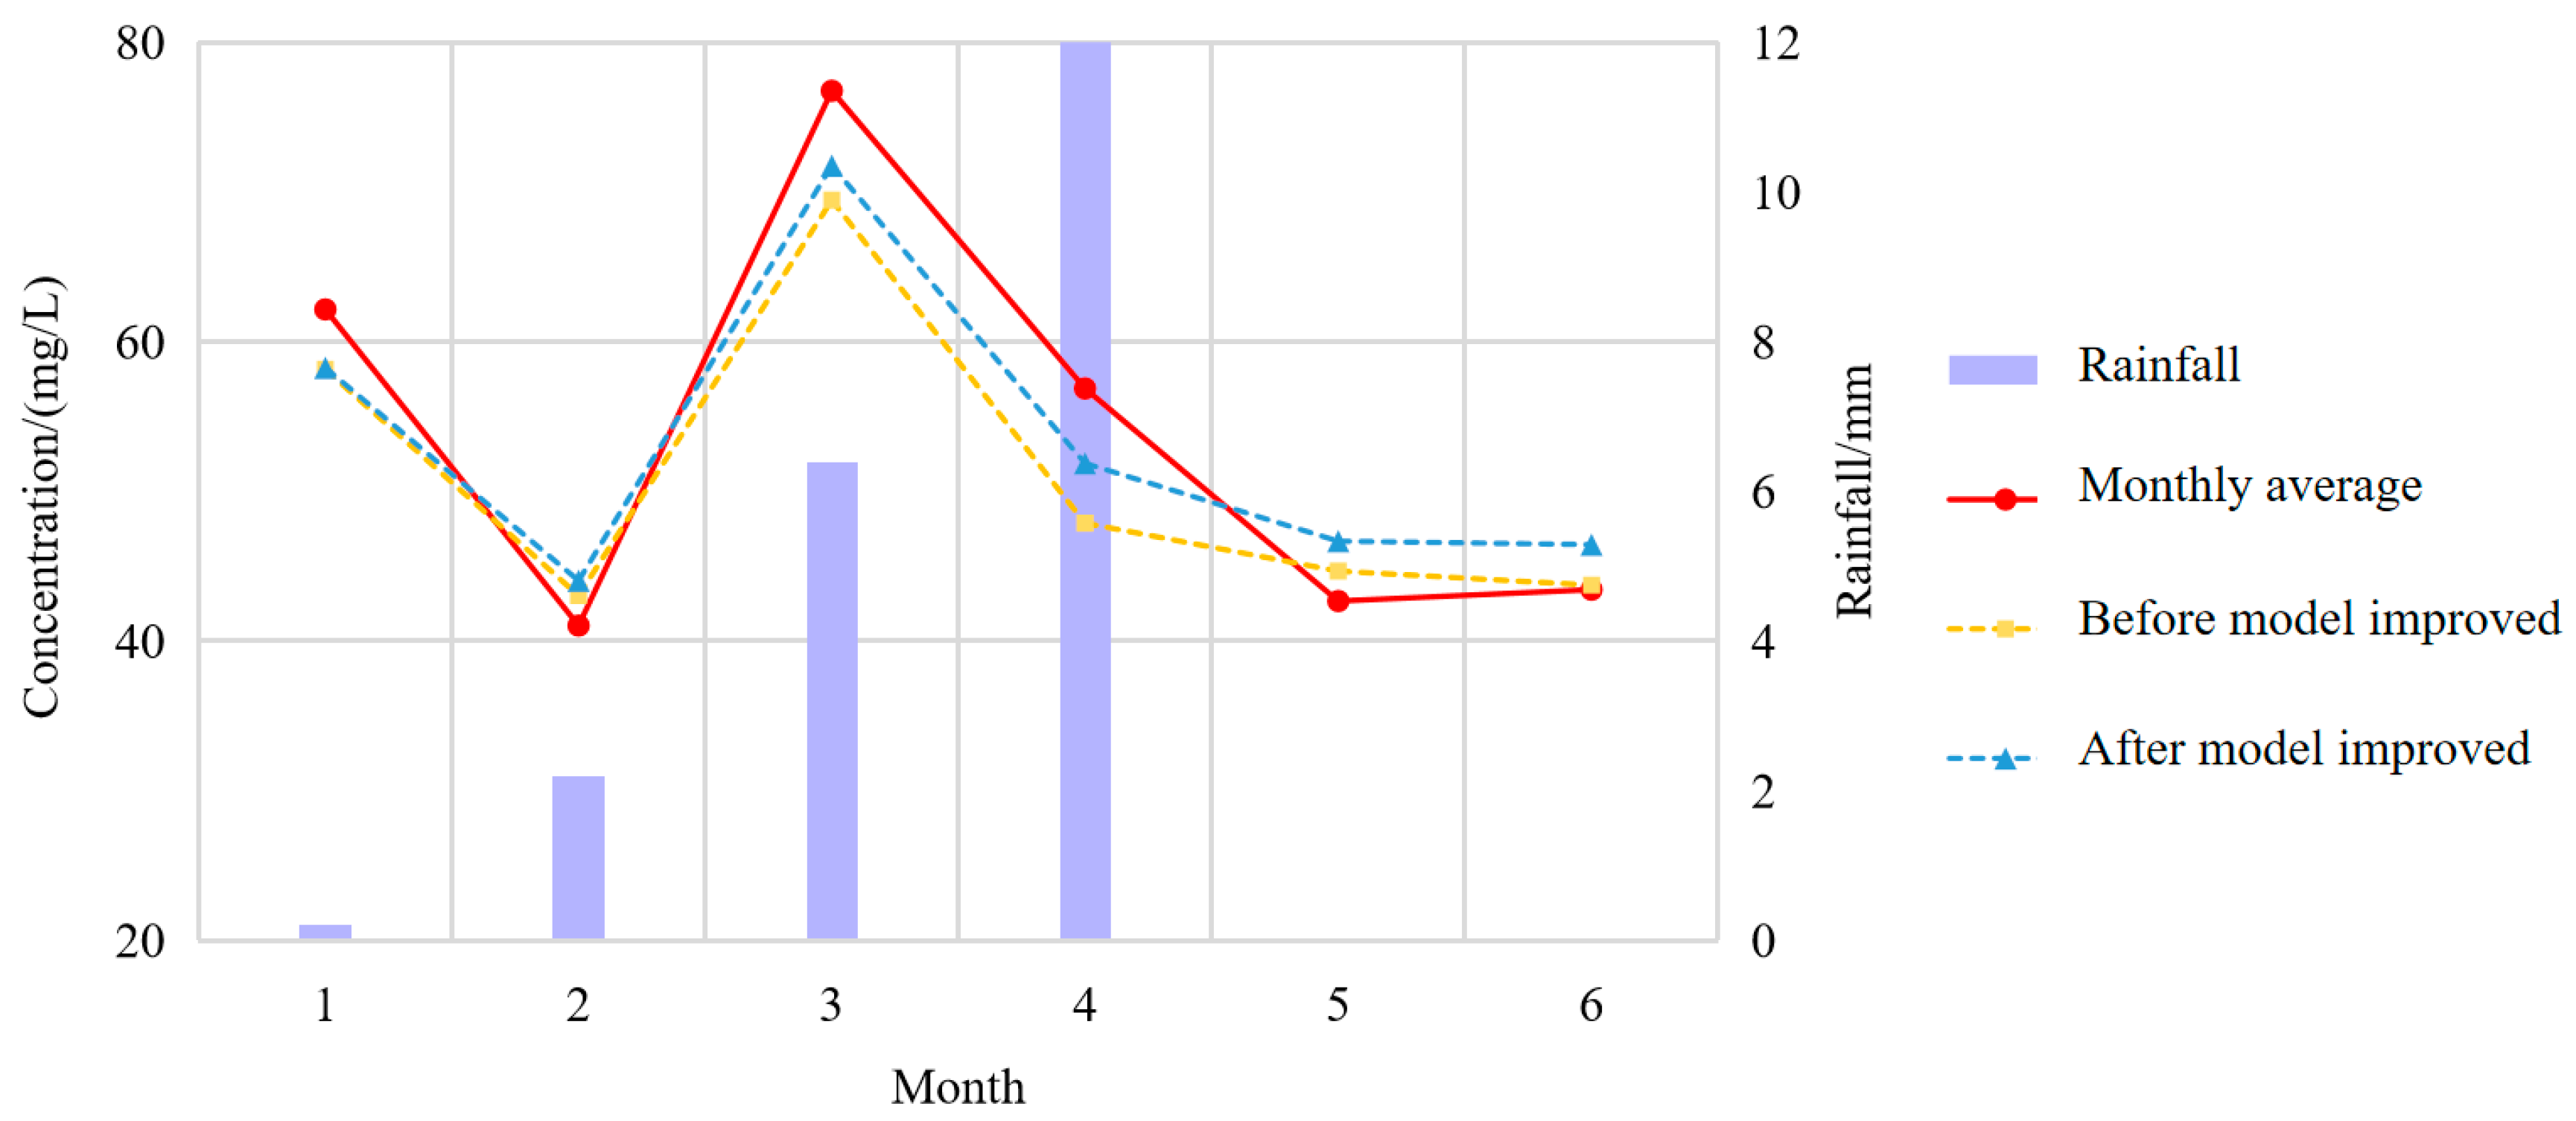
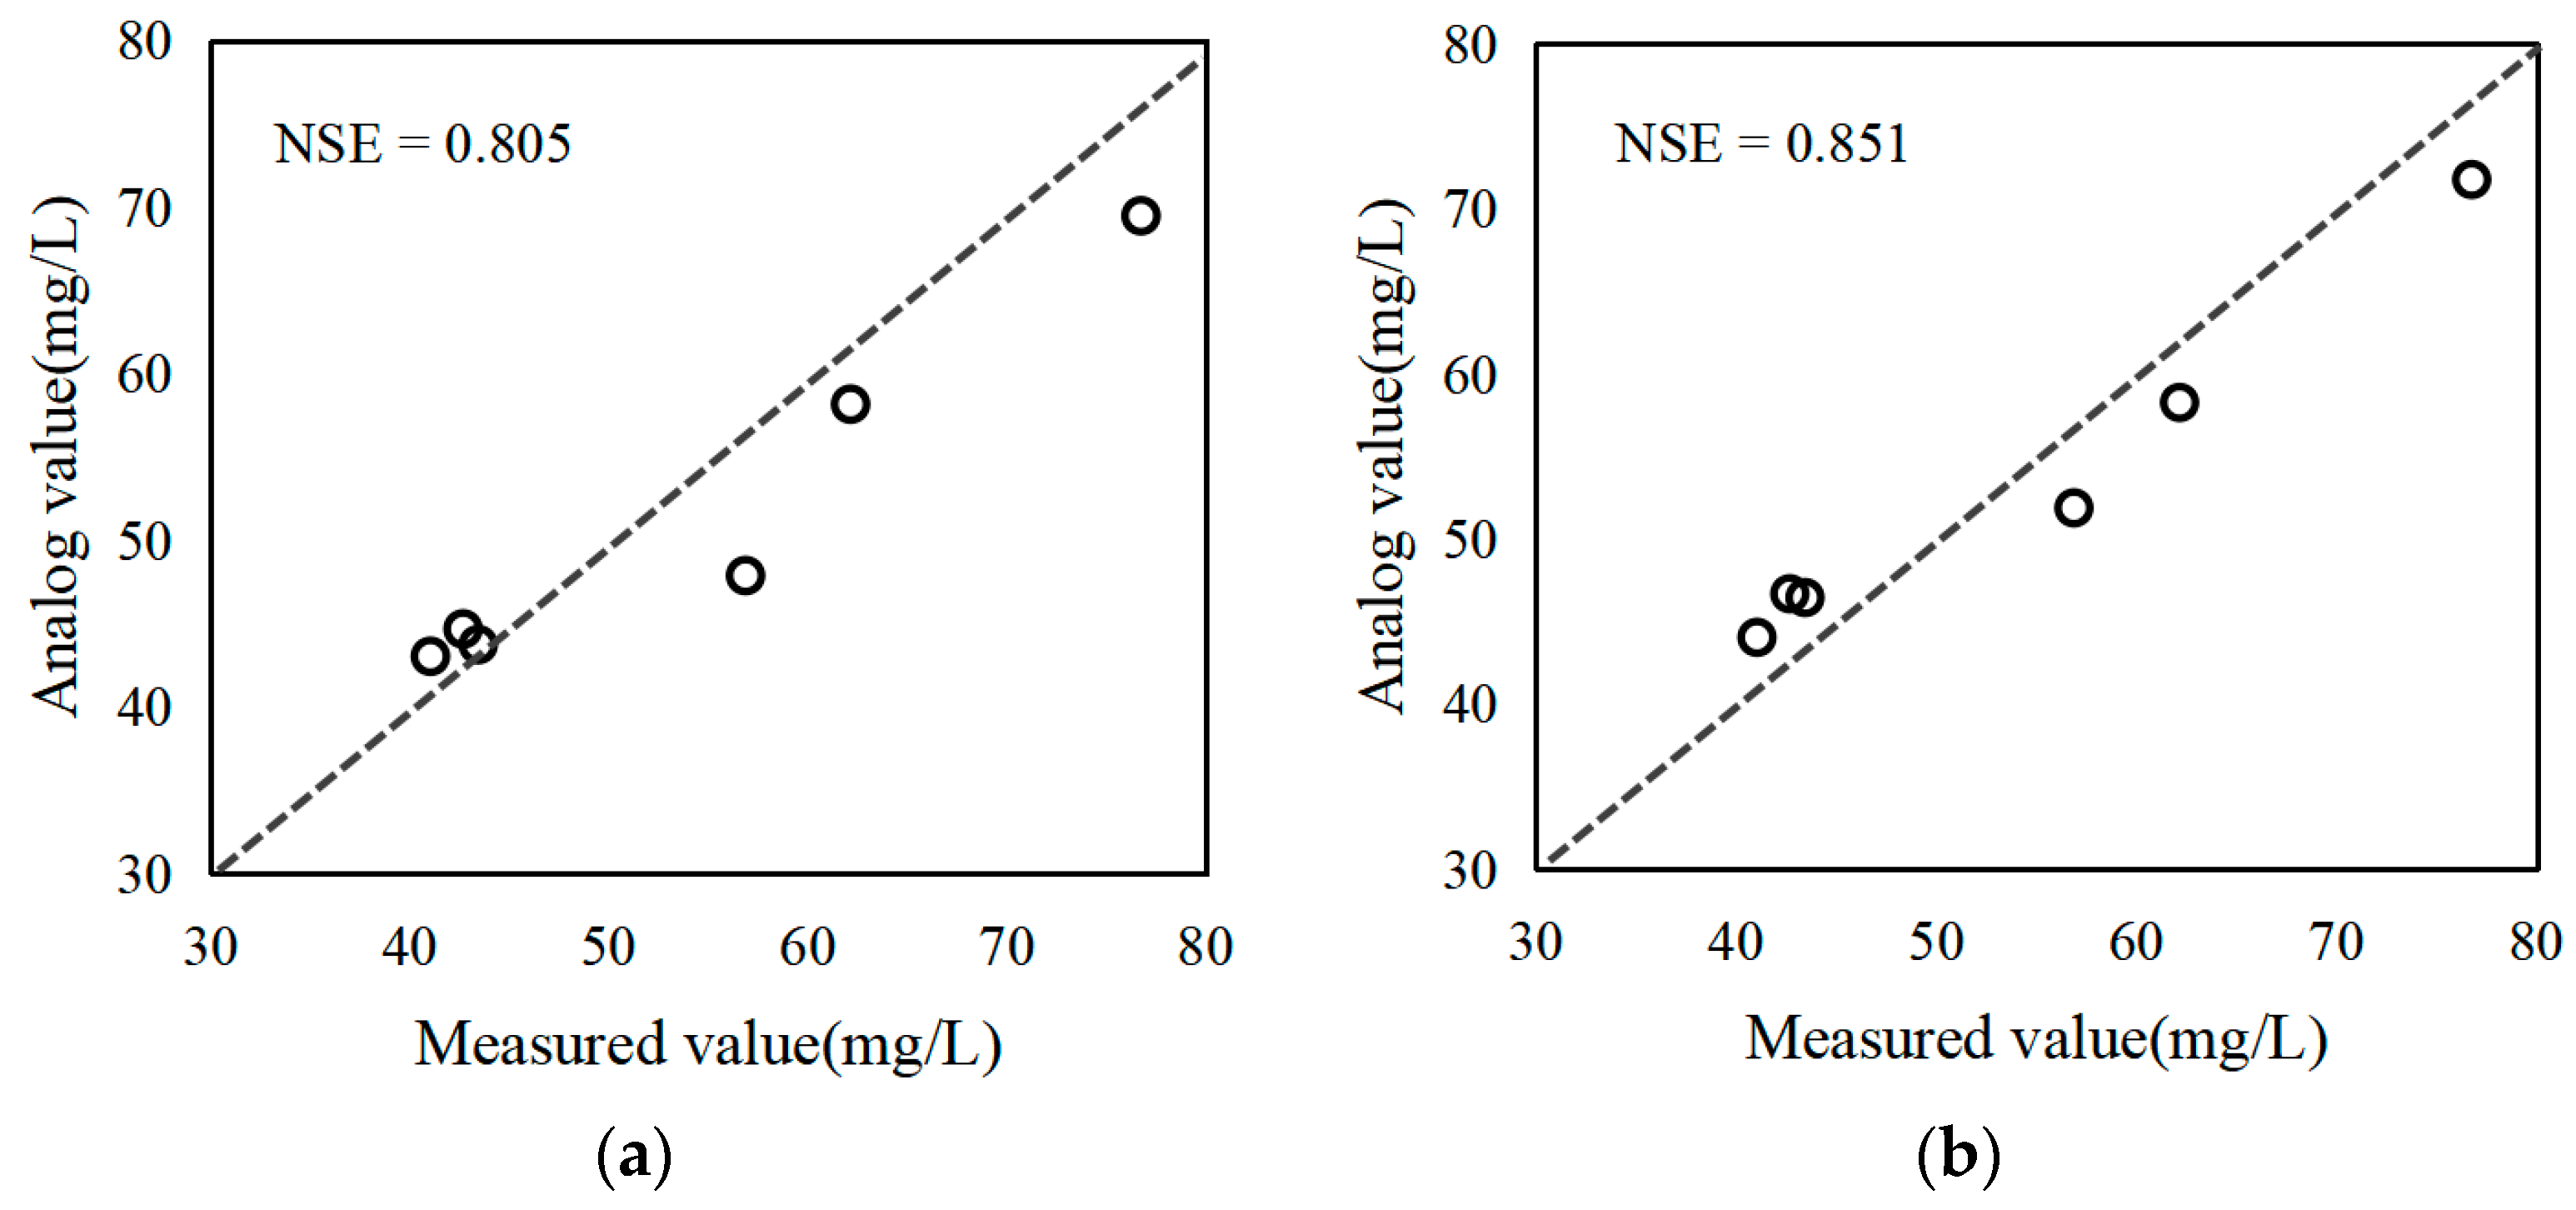
4.2. Comparative Analysis of the Improved Model

The water quality monitoring section in the area was comprehensively studied to test the effectiveness of the improved hydrodynamic water quality mathematical model of the river network. Gonghe Village was the water quality monitoring and control section, and the period from January to June 2020 was the model verification period. The changes in COD concentration were simulated using the model before and after improvement, and the results were compared with the monthly mean values for measured COD concentration from January to June. The NSE was used to evaluate simulation accuracy.
There are three reservoirs in Tiegang, Luotian and Shiyan, with volumes of 9950, 2845 and 31.99 million cubic meters, respectively. The measured and simulated monthly means for COD concentration in the Gonghe Village section before and after model improvement are shown in Figure 7, and the model verification results are shown in Figure 8. Figure 9 show the monthly mean COD concentration test results for the Gonghe Village section during the verification period, and the NSE values for the two were 0.805 and 0.851 before and after model improvement, respectively. Notably, the improved hydrodynamic water quality mathematical model of the river network could reliably simulate water quality and could accurately reflect the hydrodynamic and water pollution characteristics of the basin. Moreover, the simulation results were more reliable after improvement. The simulation accuracy of the model was improved compared to that before improvement because the improved model included time-varying lateral inflows and non-point source pollutant inputs during rainfall.

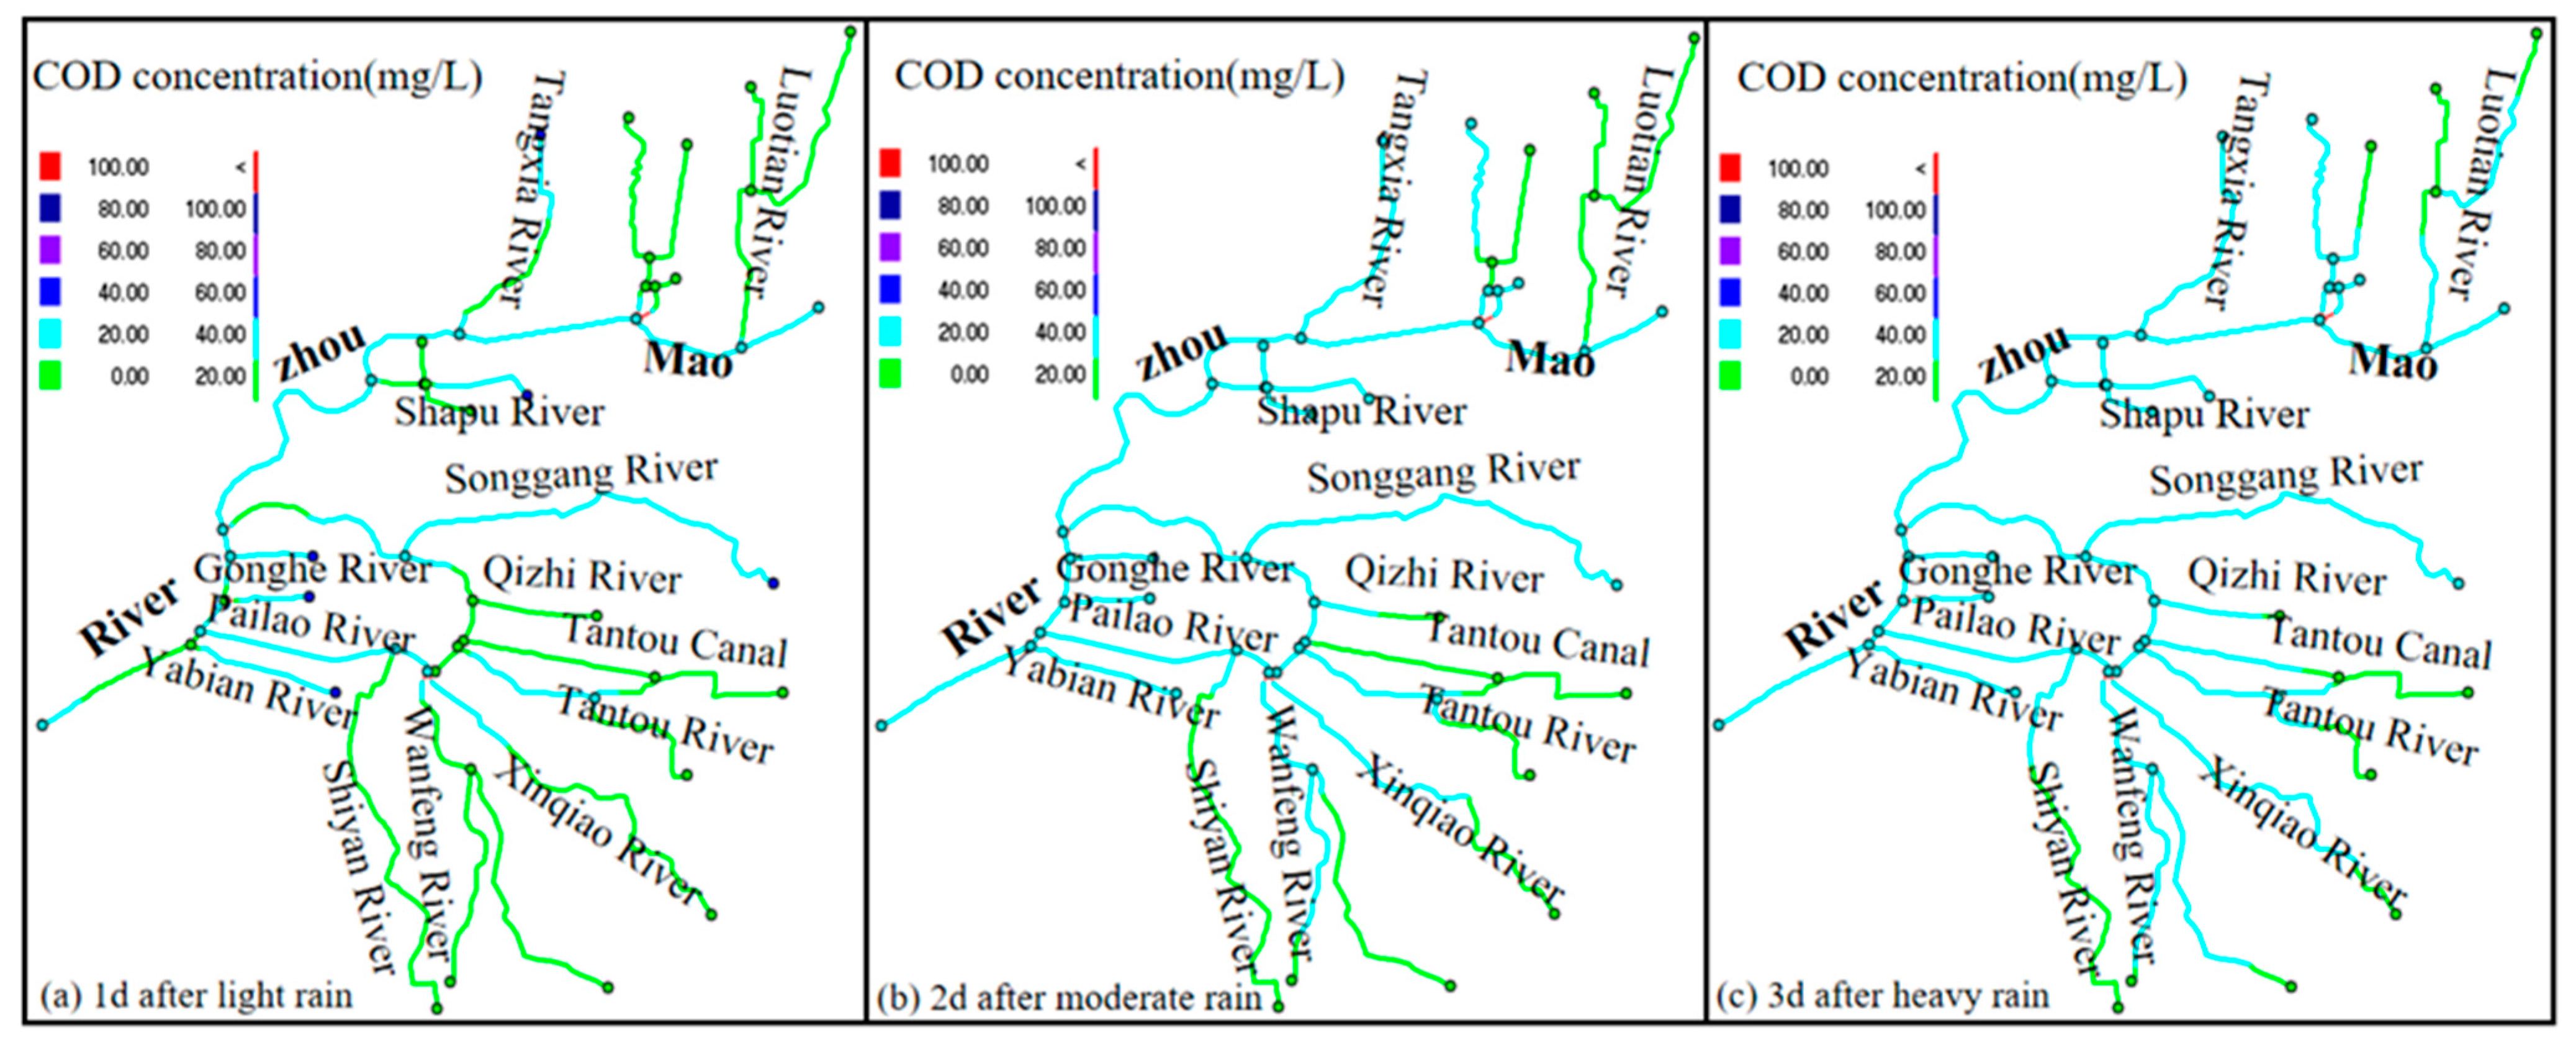
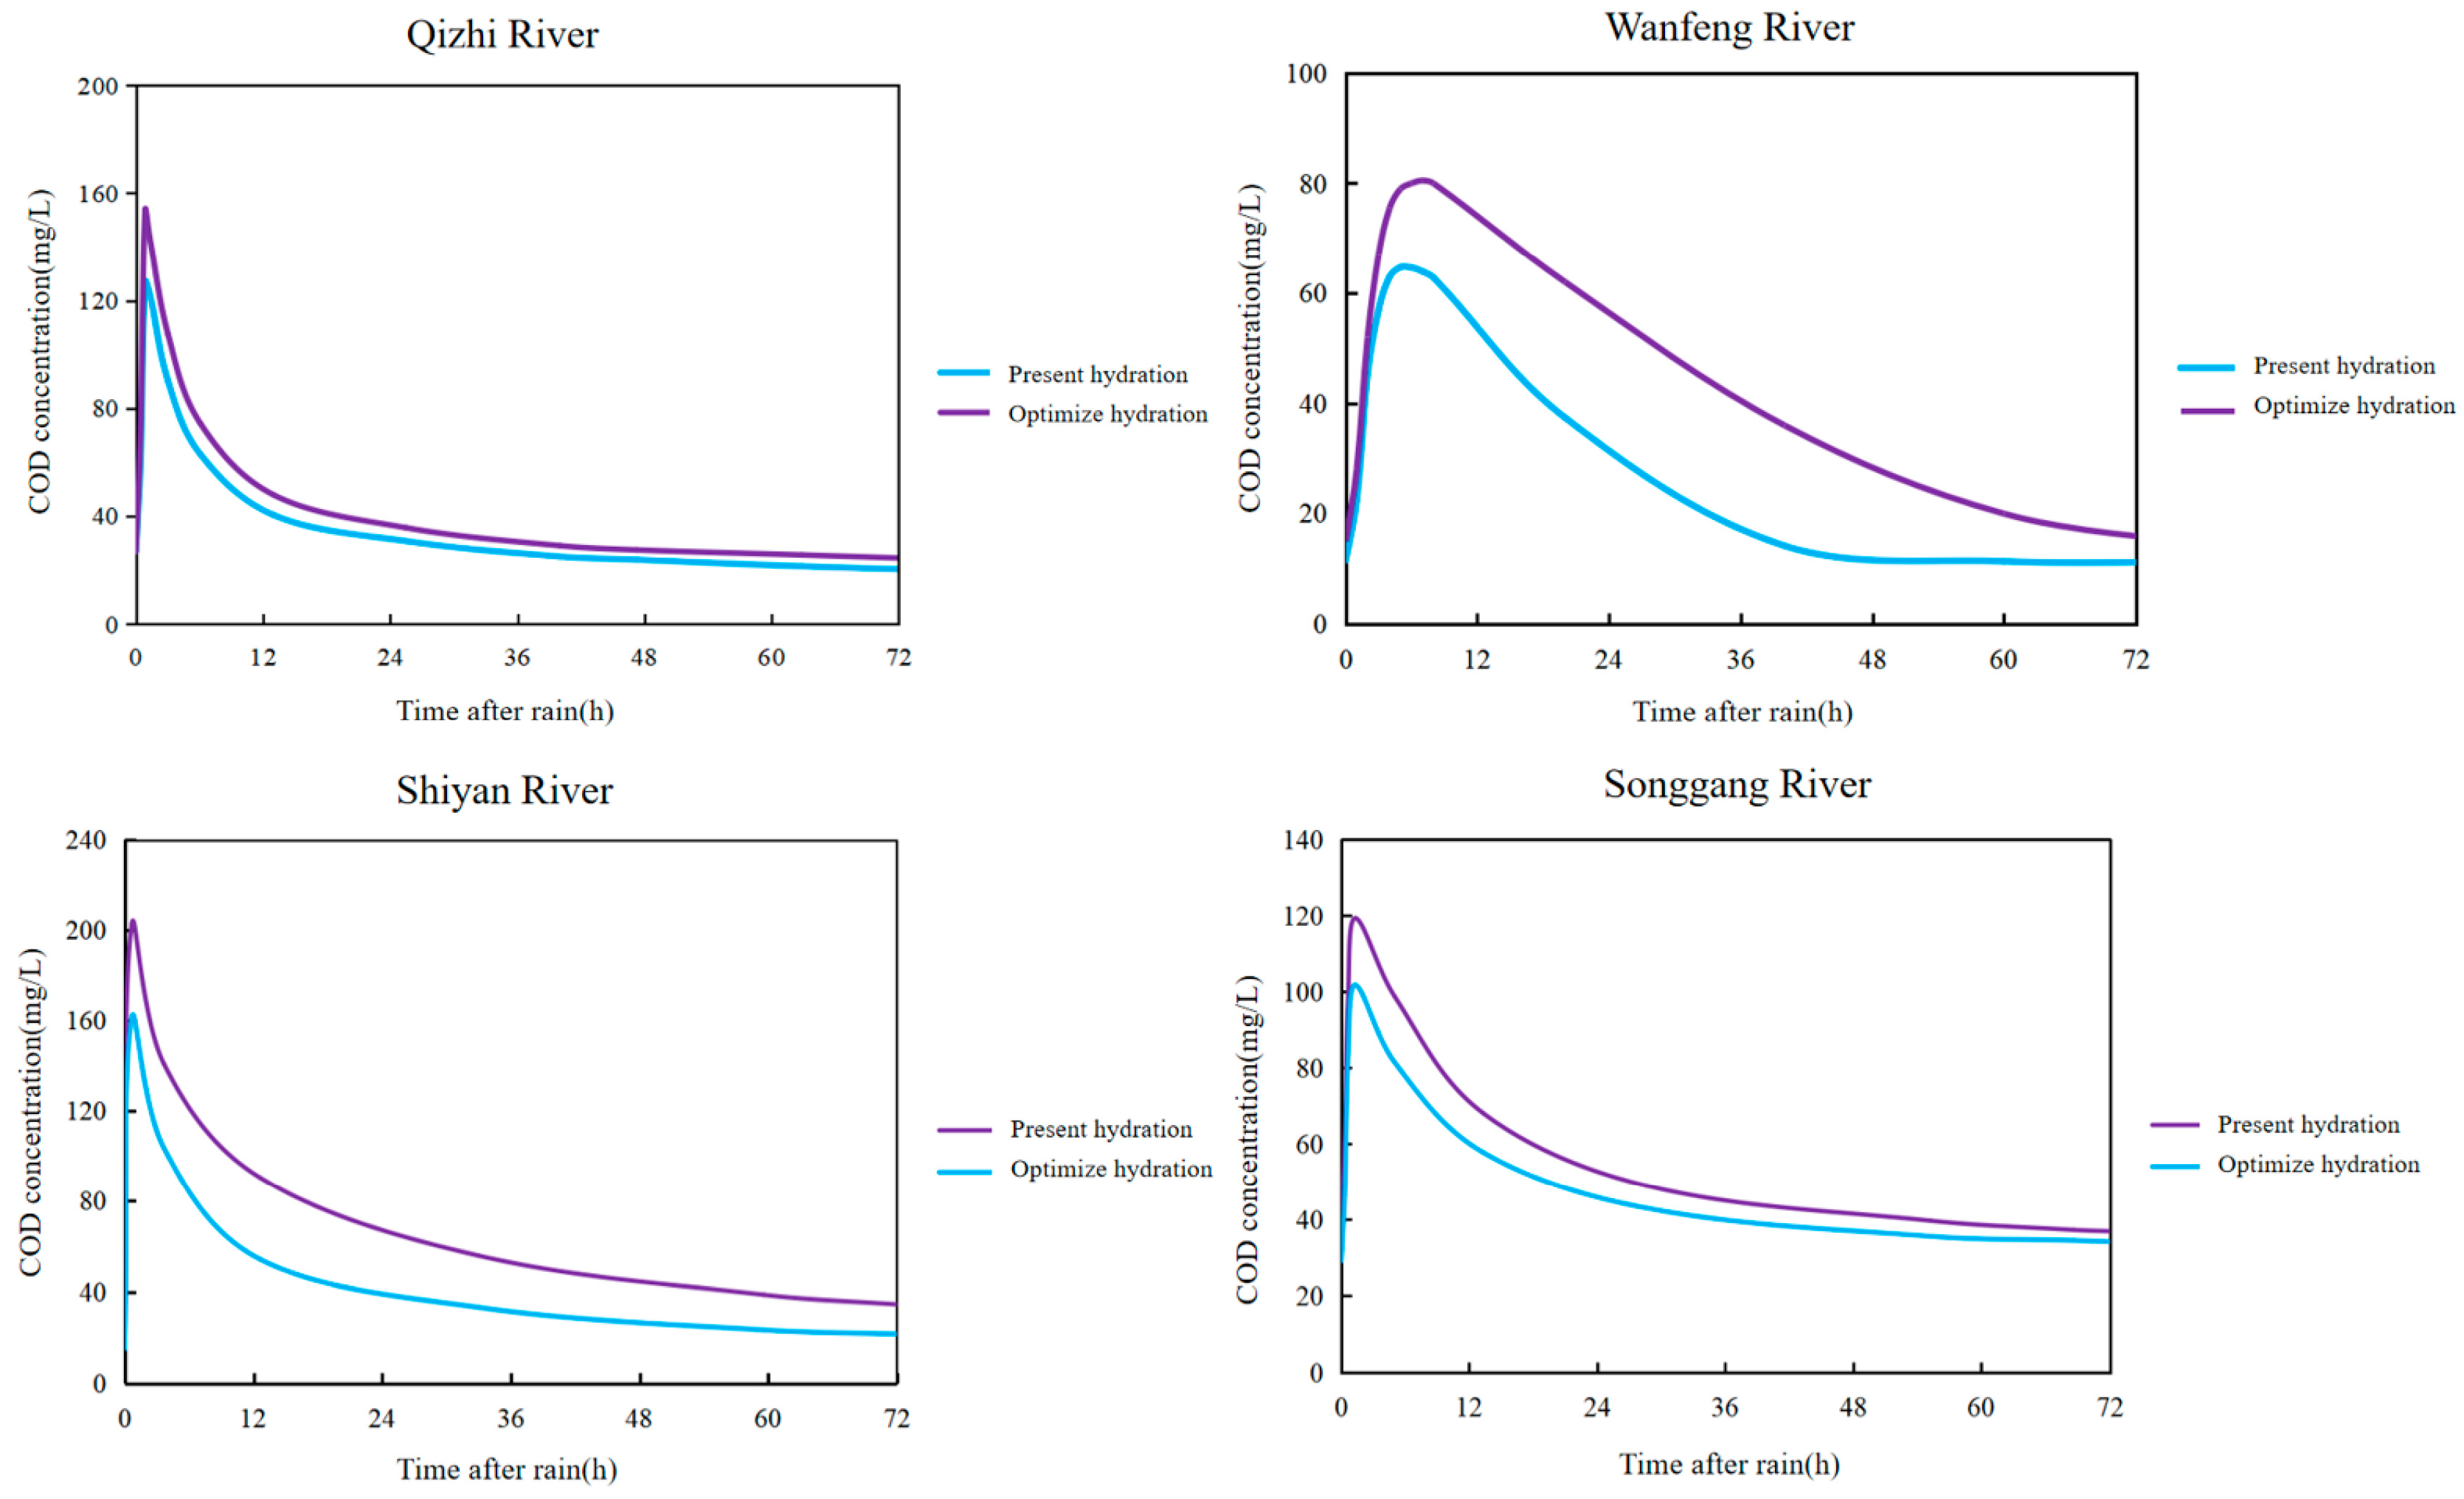
4.3. Analysis of the River Water Quality Change Law after Rain and Ecological Water Supplements Were Optimized

In response to water quality deterioration in the Maozhou River basin, a water supplement scheme, whereby water bodies were supplemented with treated water from the Sewage Treatment Plant, was adopted, but the scheduling strategy for river water quality recovery after rain needed to be further improved. The current water supplement scheme working conditions, which are daily rainfall of 8.8 mm (light rain), 17.6 mm (moderate rain), and 43.4 mm (heavy rain), were selected as typical rainfall events for the river network water environment simulation to investigate the river water quality change process before and after rainfall. The COD reduction and dissipation after rain in the mainstream section and in the tributaries were analyzed, and the variation law for water quality recovery after rain in the Maozhou River Basin was determined. The distribution of the COD concentrations during and after rainfall in the mainstream section and tributaries of the Maozhou River are shown in Figure 10.
In order to shorten the water quality recovery time of the river channel after rain, the water supplement scheme at the Gonghe Village stage was optimized by adjusting the river water supplement site and water supplement volume. These adjustments were based on the constant total water supply principle and the water quality simulation results for the river network. The water quality recovery time after the water supplement scheme and rain are illustrated in Table 2. For example, under moderate rainfall conditions, the water quality recovery rate for the basin after rainfall was significantly accelerated under the optimized water supplement scheme because the time needed for water quality in the Qizhi Canal, Wanfeng River, Songgang River, and Shiyan Canal to recover to class V and above after rain was significantly shortened to within 2 days. The large water supplement amounts meant that a reduction in the water supplement had little effect on the attenuation and dissipation of the COD concentration in the Shajiang and Shangliao Rivers after rain.
The distribution of the COD concentration in water after rain is shown in Figure 11. The simulation results showed that after optimization of the water supplement scheme, the water quality in the mainstream section and all tributaries recovered to class V within 1 day after light rain, 2 days after moderate rain, and 3 days after heavy rain. Compared to the results in Figure 10, the COD concentrations in the river network after water supplement optimization were reduced to varying degrees at the same post-rainfall recovery moments, indicating that the optimized water supplement scheme shortened the water quality recovery time and improved water quality stability in the basin.
Typical river sections of the basin were selected to compare water quality recovery after rain before and after water supplement scheme optimization. The change process for COD concentration in the Qizhi Canal, Wanfeng River, Shiyan Canal, and Songgang River after water quality recovery before and after the water supplement scheme had been optimized under moderate rain conditions is shown in Figure 12. According to Figure 12, the peak COD concentrations in the four tributaries were significantly reduced after water supplement scheme optimization, and the time taken for the water quality to recover to Class V was significantly shortened.

5. Conclusions

The results from this study were used to create a new calculation formula for the time-varying lateral inflows from the nodes and tributaries. It took into account factors such as rainfall intensity, the runoff coefficient, the block area around the computing node, and the runoff confluence ratio. In addition, a calculation formula for the time-varying lateral pollutant concentration at the nodes and in the river tributaries was also established, and it took into account the pollutant concentration in the surface confluence, initial rainfall intensity, underlying surface type, and pollutant load. The control equation for the river network model was also improved based on the time-varying processes of lateral inflow and pollutant inputs, and a new hydrodynamic-water quality model of the river network was developed. The water quality of the Maozhou River system with and without the time-varying lateral inflow and pollution inputs was numerically simulated. The improved river network hydrodynamic-water quality model was more accurate than the previous model when compared to the measured data.
For the case study data used in this study, the improved model was used to simulate water quality in the Shenzhen River network within the Maozhou River Basin before and after rainfall. The results showed (1) that the inflow of non-point source pollutants during rainfall had a significant impact on water quality and that the water quality of the river deteriorated under heavy rain. The COD concentration was generally high in the river sections with densely-constructed areas and where peak COD concentrations exceeded 100 mg/L, such as some sections of the Shiyan Canal, Tamtou River, Tamtou Canal, and Songgang River. (2) When the total water volume remains constant, the optimized water supplement scheduling strategy could accelerate water quality recovery in the river network after rain. (3) Water quality recovery times in typical river sections after moderate rain could be significantly shortened to within 2 days.
Due to the lack of data on the concentration of nitrogen, phosphorus and other pollutants, this paper has not verified the diffusion effectiveness of the model for the above nitrogen, phosphorus and other pollutants. The model equation involves that the parameters are universal for different pollutants, so it is speculated that the model is also effective for pollutant diffusion simulation. In the future, the measured data of nitrogen and phosphorus will be further collected to improve the model verification.

Author Contributions

Conceptualization, Z.S.; Methodology, K.C.; Investigation, K.C.; Writing—original draft, K.C. and J.L.; Writing—review & editing, W.G. and J.G. All authors have read and agreed to the published version of the manuscript.

Funding

This research was funded by Major Project for Science and Technology of Zhejiang Province grant number No.2023C03119.

Data Availability Statement

The data presented in this study are available in the insert article.

Conflicts of Interest

The authors declare no conflict of interest.

References

  1. Windsor, F.M.; Pereira, M.G.; Tyler, C.R.; Ormerod, S.J. Persistent contaminants as potential constraints on the recovery of urban river food webs from gross pollution. Water Res. 2019, 163, 114858. [Google Scholar] [CrossRef]
  2. Heeb, F.; Singer, H.; Pernet-Coudrier, B.; Qi, W.; Liu, H.; Longrée, P.; Müller, B.; Berg, M. Organic micropollutants in rivers downstream of the megacity Beijing: Sources and mass fluxes in a large-scale wastewater irrigation system. Environ. Sci. Technol. 2012, 46, 8680–8688. [Google Scholar] [PubMed] [Green Version]
  3. Bester, K.; Scholes, L.; Wahlberg, C.; McArdell, C.S. Sources and mass flows of xenobiotics in urban water cycles—An overview on current knowledge and data gaps. Water Air Soil Pollut. 2008, 8, 407–423. [Google Scholar] [CrossRef]
  4. Bouwman, L.; Goldewijk, K.K.; Van Der Hoek, K.W.; Beusen, A.H.W.; Van Vuuren, D.P.; Willems, J.; Rufino, M.C.; Stehfest, E. Exploring global changes in nitrogen and phosphorus cycles in agriculture induced by livestock production over the 1900–2050 period. Proc. Natl. Acad. Sci. USA 2013, 110, 20882–20887. [Google Scholar]
  5. Lin, Q.; Zhang, K.; Liu, E.; Sabatier, P.; Arnaud, F.; Shen, J. Deciphering centurial anthropogenic pollution processes in large lakes dominated by socio-economic impacts. Anthropocene 2020, 32, 100269. [Google Scholar]
  6. Tong, S.L.; Cui, C.F.; Bai, Y.L.; Sun, Y.; Zheng, X.H. Long-term remote monitoring the effects of rainfall and agricultural non-point sources pollution on the surface waters quality in lake Taihu. J. Mar. Sci. Technol.-Taiwan 2018, 26, 251–257. [Google Scholar]
  7. Xu, B.; Niu, Y.; Zhang, Y.; Chen, Z.; Zhang, L. China’s agricultural non-point source pollution and green growth: Interaction and spatial spillover. Environ. Sci. Pollut. Res. 2022, 29, 60278–60288. [Google Scholar]
  8. Billmire, M.; Koziol, B.W. Landscape and flow path-based nutrient loading metrics for evaluation of in-stream water quality in Saginaw Bay, Michigan. J. Great Lakes Res. 2018, 44, 1068–1080. [Google Scholar]
  9. Stride, B.; Abolfathi, S.; Odara MG, N.; Bending, G.D.; Pearson, J. Modeling microplastic and solute transport in vegetated flows. Water Resour. Res. 2023, 59, e2023WR034653. [Google Scholar] [CrossRef]
  10. Srinivas, R.; Singh, A.P.; Dhadse, K.; Garg, C. An evidence based integrated watershed modelling system to assess the impact of non-point source pollution in the riverine ecosystem. J. Clean. Prod. 2020, 246, 118963. [Google Scholar]
  11. Cook, S.; Chan, H.-L.; Abolfathi, S.; Bending, G.D.; Schäfer, H.; Pearson, J.M. Longitudinal dispersion of microplastics in aquatic flows using fluorometric techniques. Water Res. 2020, 170, 115337. [Google Scholar] [CrossRef]
  12. Goodarzi, D.; Sookhak Lari, K.; Khavasi, E.; Abolfathi, S. Large eddy simulation of turbidity currents in a narrow channel with different obstacle configurations. Sci. Rep. 2020, 10, 12814. [Google Scholar] [CrossRef]
  13. Tong, X.X.; Wang, J.L.; Pu, J.; Zhang, W.J.; Huang, J.Q.; Xu, W.S.; Wang, Z.G. Response of Surface Water Quality to Vegetation Cover in Shenzhen City. J. Yangtze River Sci. Res. Inst. 2022, 39, 55. [Google Scholar]
  14. Ghiasi, B.; Noori, R.; Sheikhian, H.; Zeynolabedin, A.; Sun, Y.; Jun, C.; Hamouda, M.; Bateni, S.M. Uncertainty quantification of granular computing-neural network model for prediction of pollutant longitudinal dispersion coefficient in aquatic streams. Sci. Rep. 2022, 12, 4610. [Google Scholar] [CrossRef] [PubMed]
  15. Xu, L.; Jiang, J.; Lu, M.; Du, J. Spatial-temporal evolution characteristics of agricultural intensive management and its influence on agricultural non-point source pollution in China. Sustainability 2023, 15, 371. [Google Scholar] [CrossRef]
  16. Guan, F.; Ma, Y.H.; Zhang, D.H.; Zheng, T.; Wang, J. Agricultural non-point source pollution loads: Spatial distribution and risk assessment. Chin. Agric. Sci. Bull. 2017, 33, 61–66. [Google Scholar]
  17. Wang, J.; Chen, G.; Zou, G.; Song, X.; Liu, F. Comparative on plant stoichiometry response to agricultural non-point source pollution in different types of ecological ditches. Environ. Sci. Pollut. Res. 2019, 26, 647–658. [Google Scholar] [CrossRef] [PubMed]
  18. Lou, H.Z.; Wu, X.J.; Hao, F.H.; Yang, S.; Zhang, X. Research progress of non-point source pollution in China over the past 30 years and discussion of the future direction development. J. Environ. Sci. 2020, 40, 1535–1549. [Google Scholar]
  19. Zhang, F.S.; Shang, M.Z.; Zhao, P.X.; Cheng, K.Y.; Tang, Y.D.; Wei, J. Spatial analysis and simulation study of rainfall runoff pollution for a tidal river network. Environ. Sci. China 2021, 41, 1834–1841. [Google Scholar]
  20. Lou, S.H.; Lyu, Q.W.; Ren, K.J. Study on the selection and reconstruction of urban drainage system in high density construction area from the course of water control in Shenzhen. Water Supply Drain. China 2018, 34, 18–21. [Google Scholar]
  21. He, X.C.; Huang, F.F.; Ru, X.W.; Wan, D.H.; Zheng, J.L.; Wu, Q.; Zhang, L. Research on water resource control strategy and technology in typical river network area of Pearl River Delta. J. North China Univ. Water Resour. Electr. Power 2016, 37, 55–60. [Google Scholar]
  22. Jiang, T.; Zhu, S.L.; Zhang, Q.; Chen, X.H. Numerical simulation of water environment effect of tidal river network gate pump joint dispatch. J. Hydraul. Eng. 2011, 42, 388–395. [Google Scholar]
  23. Shou, C.G.; Du, H.S.; Liu, X.P. Research progress of source and mechanism of agricultural non-point source pollution in China. Appl. Ecol. Environ. Res. 2019, 17, 10611–10621. [Google Scholar] [CrossRef]
  24. Xu, S.M. Study on the Impact of Rainfall Runoff on Water Quality in the Main Stream of Haihe River in Tianjin; Tianjin University: Tianjin, China, 2018. [Google Scholar]
  25. Geng, R.Z.; Liang, X.J.; Yin, P.H.; Wang, M.; Zhou, L.L. A review: Multi-objective collaborative optimization of best management practices for non-point sources pollution control. Acta Ecol. Sin. 2019, 39, 2667–2675. [Google Scholar]
  26. Zhu, W.B.; Wang, J.; Xue, F.; Chen, S. From Sponge Cities to Multi-Dimensional Sponge Systems to Solve Urban Water Problems; Jiangsu Phoenix Science Press: Nanjing, China, 2018; Volume 37. [Google Scholar]
  27. Charters, F.; Cochrane, T.A.; O’Sullivan, A.D. Predicting event-based sediment and heavy metal loads in untreated urban run off from impermeable surfaces. Water 2020, 2, 969. [Google Scholar] [CrossRef] [Green Version]
  28. Li, Q.; Yang, Z.; Yue, Y.; Zhong, H.; Li, D. Variation of total phosphorus concentration and loads in the upper Yangtze River and contribution of non-point sources. Water Supply 2021, 21, 1687–1700. [Google Scholar] [CrossRef]
  29. Zubaidah, I.; Karnaningroem, N.; Slamet, A. The Self-Purification Ability in The Rivers of Banjarmasin, Indonesia. J. Ecol. Eng. 2019, 20, 177–182. [Google Scholar] [CrossRef]
  30. Majed, N.; Islam, M.A. Contaminant Discharge from Outfalls and Subsequent Aquatic Ecological Risks in the River Systems in Dhaka City: Extent of Waste Load Contribution in Pollution. Front. Public Health 2022, 10, 880399. [Google Scholar] [CrossRef]
  31. Zhang, M.; Chen, X.; Yang, S.; Song, Z.; Wang, Y.; Yu, Q. Basin-scale pollution loads analyzed based on coupled empirical models and numerical models. Int. J. Environ. Res. Public Health 2021, 18, 12481. [Google Scholar] [CrossRef]
  32. Li, C.; Zheng, X.; Zhao, F.; Wang, X.; Cai, Y.; Zhang, N. Effects of urban non-point source pollution from Baoding city on Baiyangdian lake, China. Water 2017, 9, 249. [Google Scholar] [CrossRef]
  33. Zhang, J. Discussion on non-point source pollution and control in water source areas. In Study of Ecological Engineering of Human Settlements; Springer: Singapore, 2020; pp. 197–211. [Google Scholar]
  34. Wang, H.; He, P.; Shen, C.; Wu, Z. Effect of irrigation amount and fertilization on agriculture non-point source pollution in the paddy field. Environ. Sci. Pollut. Res. 2019, 26, 10363–10373. [Google Scholar] [CrossRef] [PubMed]
  35. Qiu, S.; Yin, H.; Deng, J.; Li, M. Cost-effectiveness analysis of green-gray stormwater control measures for non-point source pollution. Int. J. Environ. Res. Public Health 2020, 17, 998. [Google Scholar] [CrossRef] [PubMed] [Green Version]
  36. Zhang, F.S.; Wei, J.; Tang, Y.D.; Cao, M.Y. Application of watershed water environmental model in the systematic management of Maozhou River basin. China Water Wastewater 2021, 37, 100–106. [Google Scholar]
  37. Sun, Z.L.; Chen, Y.M.; Xia, S.S.; Wu, K. Calculation of water transport capacity of river networks based on mixed models. J. Hohai Univ. 2010, 38, 144–148. [Google Scholar]
  38. Sun, Z.L.; Yang, E.S.; Zeng, T.L.; Zhu, L.L. Nonuniform sediment transport with lateral output in river networks. J. Hydraul. Eng. 2016, 47, 72–76, 84. [Google Scholar]
  39. Chen, X.; He, G.; Liu, X.; Li, B.; Peng, W.; Dong, F.; Huang, A.; Wang, W.; Lian, Q. Sub-watershed parameter transplantation method for non-point source pollution estimation in complex underlying surface environment. Land 2021, 10, 1387. [Google Scholar] [CrossRef]
  40. Yang, L.; Zhang, M.; Wei, J.; Qi, J. Pollution load estimation and control countermeasures of Zhangze reservoir. Front. Environ. Sci. 2022, 10, 874124. [Google Scholar] [CrossRef]
  41. Xin, X.K.; Yin, W.; Li, K.F. Estimation of non-point source pollution loads with flux method in Danjiangkou Reservoir area, China. Water Sci. Eng. 2017, 10, 134–142. [Google Scholar] [CrossRef]
Figure 1. Water system diagram of the Maozhou River Basin.
Water 15 02861 g001
Figure 2. Land use and development of the study area.
Water 15 02861 g002
Figure 3. Regional non-point source COD load.
Water 15 02861 g003
Figure 4. Generalized river network diagram.
Water 15 02861 g004
Figure 5. Regional computing node distribution.
Water 15 02861 g005
Figure 6. Computing node selection and block division.
Water 15 02861 g006
Figure 7. Calibration of the Model with the data. (a) Gonghe Village; (b) Yangchong River Bridge.
Water 15 02861 g007
Figure 8. Measured and simulated monthly mean COD concentrations in the Gonghe Village section.
Water 15 02861 g008
Figure 9. Verification results before (a) and after model improvement (b).
Water 15 02861 g009
Figure 10. COD concentrations during and after rainfall in the mainstream section and tributaries of the Maozhou River.
Water 15 02861 g010
Figure 11. COD concentration after rainfall in the mainstream section and tributaries of the Maozhou River after water supplement optimization.
Water 15 02861 g011
Figure 12. COD concentration changes in a typical river section following rain and before and after optimization of the water supplement scheme.
Water 15 02861 g012
Table 1. Underlay surface type.
BlockUnderlay Surface Type
ANon-urban construction land, park green space
BHigh-end residential areas, public buildings, science and technology parks
COrdinary commercial areas, ordinary residential areas, well-managed factories or industrial areas, municipal roads
DFarmers’ markets, garbage transfer stations (houses), food streets, urban villages, village-run industrial zones
Table 2. Optimized water supplement scheme.
Rivers/CanalsWater Supplement Volume (10,000 m3/d)Water Quality Recovery Days after Moderate RainRemarks
Current StatusOptimizationCurrent StatusOptimization
Qizhi Canal221.250.75The water supplement site is moved upstream
Wanfeng R.2.42.41.750.8The water supplement site is moved upstream
Shajing R.6.560.91Adjust water supplement volume
Shangliao R.10.69.10.750.9Adjust water supplement volume
Songgang R.012.71.5Add water supplement sites
Shiyan Canal012.51.2Add water supplement sites
Disclaimer/Publisher’s Note: The statements, opinions and data contained in all publications are solely those of the individual author(s) and contributor(s) and not of MDPI and/or the editor(s). MDPI and/or the editor(s) disclaim responsibility for any injury to people or property resulting from any ideas, methods, instructions or products referred to in the content.

