Article

Innovative Urban Blue Space Design in a Changing Climate: Transition Models in the Baltic Sea Region

Department of Urban Architecture and Waterscapes, Faculty of Architecture, Gdańsk University of Technology, 80-233 Gdansk, Poland
*
Author to whom correspondence should be addressed.
Water 2023, 15(15), 2826; https://doi.org/10.3390/w15152826
Submission received: 3 July 2023 / Revised: 31 July 2023 / Accepted: 2 August 2023 / Published: 4 August 2023

Abstract

:
Waterfront areas in cities are subject to constant changes. The desire to integrate the transformed waterside areas with the urban fabric involves shaping high-quality public spaces related to water, which are often referred to as urban blue spaces (UBS). The aim of the research was to examine the transformation processes of urban waterfront areas in the Baltic Sea Region and identify emerging transition models and types of blue public spaces. The methodological framework of this study is based on qualitative analysis of urban form with respect to coastal and riverine waters. An introductory analysis of 50 cases of transformations was conducted, and 12 were selected for further investigation: Tallinn, Pärnu (Estonia), Copenhagen, Køge, Aarhus (Denmark), Helsinki, Turku (Finland), Stockholm, Malmö, Luleå, Sundsvall, and Ystad (Sweden). As the outcome of the study, the authors indicate that the existing hard land–water interfaces were transformed into soft transition zones where new types of blue public spaces were created with different relationships to water. Synergies were identified between public space design, flood protection measures, and climate adaptation schemes. Finally, the findings highlight the need to verify the existing planning regulations and make them more flexible and effective in guiding the sustainable waterfront design processes.

1. Introduction

The last few decades have seen dynamic urban transformations in waterfront areas; many of them, converted from industrial and port functions, are reconnected with the urban structure [1,2,3,4]. Waterfront regeneration interventions and redevelopments are complex processes that are directed towards many objectives, including spatial, economic, and ecological factors. They address issues related to sustainability and regional cultural diversity and tightly correspond with Sustainable Development Goals [5,6,7]. One of the main objectives of sustainable waterfront regeneration is focused on developing high-quality public spaces related to water, which are often referred to as urban blue spaces (UBS) [8,9]. Urban blue spaces, comprising different waterbodies and coastal areas, play a vital role in enhancing the quality of urban territories and contribute to the well-being of inhabitants [10,11].
The interest in the role of public spaces related to water arose with the large-scale transformations conducted in many places worldwide, which intensified during the last few decades of the twentieth century as a consequence of the withdrawal of port and shipyard industries from city centres [12,13,14,15]. Numerous guiding and advisory documents were issued to inform and monitor these transition processes. The 10 Principles for Sustainable Development of Urban Waterfront Areas issued by Citta d’Acqua in Venice defines a general framework for the management and planning of the urban waterfront with a focus on the potential of land–water interfaces to become centres of public and cultural life [7]. Acknowledging that water is an important part of the urban landscape, it identified prerequisites for waterfront public space design, specifying that waterfronts “should be conceived as an integral part of the existing city and contribute to its vitality”, “should celebrate water by offering a diversity of cultural, commercial and housing uses”, “should be both physically and visually accessible for locals and tourists of all ages and income”, and “constructed in high quality” [16]. These principles remain a relevant point of reference since they offer a framework to evaluate the urban transformation of waterfront public spaces [17].
With changing climate, rising sea levels, and increasing threats of urban flooding, the existing strategies for shaping high-quality public spaces ought to be reassessed [17]. As global climate models show [18,19], many coastal cities are susceptible to flooding as an effect of changes in sea levels, storm surges, and the increasing intensity of urban flash floods. Extreme precipitation, which is likely to be more frequent, should induce a re-evaluation of stormwater and rainwater management concepts. The traditional approach of avoiding water is replaced by the strategy to incorporate water within the city, and both water management and flood adaptation measures are supposed to be embedded in well-designed public spaces [20,21]. Numerous concepts were developed for increasing flood adaptation capacities of public spaces, such as Sponge City [22,23,24], Sustainable Urban Drainage Systems (SUDS) [25,26], or Water-Sensitive Urban Design (WSUD) [27,28]. Water became considered a vital component of public places and reappears in diversified elements of urban blue–green infrastructure, recreated wetlands, reservoirs, and rain gardens [29,30].
The tendency toward increasing the presence of water in public spaces also concerns riverine and coastal zones, where transformation processes occur. Along with the introduction of protecting breakwaters, rising embankments, and the application of other flood protection measures [31,32], there is a visible urge to extend public spaces towards the water. In many experimental projects, public spaces are designed to embrace fragments of water areas by jetties or piers and even enter the water through vast land extensions and floating structures [33,34]. The strategy of avoiding the risk is replaced by the strategy of managing the risk, according to developed scenarios [20,35,36]. Public space design promotes this shift in the paradigm. Experimental projects for ocean coastlines, such as the New York project, Palisade Bay, expand the graphic vocabulary of space typologies that may unfold on the boundary between land and water [37]. Dal Cin et al. notice that waterfront planning shall become “planning for a sea level rise” [17], however, the transition from idea to constructed reality is complex, and still more data are needed to analyse, understand, and guide the processes.
Available models of waterfront public spaces highlight their different morphological characteristics in relation to the waterbody, dividing them into ones located near the shoreline (e.g., streets and squares open to water), as well as in (e.g., amphibious, wet-proof, and dry-proof architecture) and on water (e.g., floating architecture) [17,38]. At the same time, there is a visible urge in research investigations and design projects toward rethinking the current threshold of water, land, and city [17,39,40]. This threshold may become porous, broad, and ‘fingered’ [37]. In response to this problem, the aim of this paper is to investigate the transition models of the blue public space design on the background of the proposed modifications of the existing land–water interface, taking cities in the Baltic Sea Region as a case study. The authors inquire into the main morphological types of urban blue space in their relation to water and the context of climate change threats. The findings indicate the need for changes in planning regulations for the land–water interface.

Transformations of the Land–Water Boundary

The boundary between the land and water in cities has always been an object of dynamic changes. Part of the transformations are natural evolutionary processes that are observed at different temporal and spatial scales. They are the effects of sediment supply and erosion ratios, which are susceptible to the geomorphic conditions of the coastal line, sea level oscillations, and human interventions [41].
For centuries, coastal and riverine lines have also been purposely modified to meet military, economic, or industrial purposes and to make room for urban growth. What is perceived today in many cities as a clear line dividing land and water is an effect of filling wetlands, building embankments, and widening or narrowing the riverbeds. The Industrial era did not stop the anthropogenic waterfront transformations; on the contrary, it increased their pace by adjusting the quays to economic and logistic purposes but, at the same time, removed water from urban form and urban experience. For almost the whole nineteenth and twentieth centuries, water disappeared from the focus of urban studies—covered and hidden marked the specific era of ‘clean urbanism’ [42]. After almost one century of neglect, water has reappeared as a core of urban design. In the processes of urban expansion to these former industrial areas, the waterfront territories have become a key city–water interface [43].
The growing interest in waterfront areas cannot be discussed without a context of climate change consequences. The scenarios are alarming. Over the last one hundred years, global temperatures have risen about 1 °C, causing sea level rise to accelerate rapidly. In effect, in the twentieth century, the global mean sea level rose 11–16 cm [44]. In the twenty-first century, even with immediate and sharp cuts to carbon emissions, the average sea level is estimated to rise another 0.5 m and may exceed even 2 m under higher emission scenarios [45]. Globally, the number of flooding events has continuously increased during the last century [46]; they affect whole regions but are especially experienced in urban areas [47,48]. Additionally, unprecedented sudden weather events increase the threat of severe storm surges, which pose a risk to many coastal cities and populations [49].
Despite mounting threats, investigations on coastal development, based on different concepts and methods of modelling, reveal that the coastal exposure to the consequences of sea level rise is increasing. Wolff et al., delving into urban development and urban expansion tendencies in the Mediterranean urban regions in relation to coastal flood impact [38], found that the urban spread in the floodplain has increased in all investigated regions, leading to a significant increase in coastal exposure to floods [50]. These two prevailing contradictory forces: the surge to extend human settlements toward flood-prone areas and the increasing threats of rising sea levels and heavy storms, can be observed not only on a regional scale but also on the urban scale of waterfronts. The question arises whether we should prioritize constructing stronger barriers to prevent water intrusion or should rather seek a means of resolving conditions for coexistence with water. Experimental design approaches and research studies indicate the advantages of transforming the hard boundary into “a smooth transition, a comingling rather than a battle zone” [51,52].
Innovative blue public spaces are an important element of this transition territory that should be investigated in terms of their relation to waterbodies and discussed against planning policies and strategies. Blue public spaces have gained particular interest as cities worldwide face increasing challenges from rapid urbanization and the impacts of climate change. From an environmental perspective, they play a crucial role in supporting ecological balance and biodiversity [53,54]. They also contribute to the aesthetic appeal of cities, enhancing urban landscapes with natural elements [55], offering numerous recreational opportunities, promoting physical activity, and fostering community engagement and human well-being [56,57]. Drawing from various disciplines, such as urban planning, environmental science, public health, and psychology, a comprehensive understanding of the causes and importance of blue public spaces emerges, highlighting their key role in promoting resilient and harmonious urban communities.

2. Materials and Methods

2.1. Methodological Framework

The methodological and conceptual framework of this study is based on qualitative analysis of urban form with respect to coastal and riverine waters [17,58,59]. To ensure a comprehensive investigation of the complex interdependencies between urban morphology and waterbodies, the data were gathered from several sources:
  • Geographic Information System (GIS) maps and geoportals enabled the exploration of complex spatial relationships and patterns due to integrated data from various sources associated with specific geographic locations. Online geoportals (referred to as geographic data portals or geospatial data portals) were accessed to obtain spatial data and visualize the study areas;
  • CAD mapper—this online platform offered access to a wide range of geographic and architectural data in Computer-Aided Design (CAD) format. It was used to generate maps, which were then imported into the AUTODESK AutoCAD 2022 program to create research cartographic materials;
  • Planning strategies documents for cities published on municipal web pages were explored to gather information on the characteristics of transformation processes and their guiding objectives;
  • Architectural and urban design projects and their briefs obtained from the architectural studios’ databases were accessed to collect materials related to the transformation of the study areas;
  • Strategic planning documents published by Vision and Strategies Around the Baltic Sea (VASAB) and Baltic Marine Environment Protection Commission (HELCOM) were analysed to gather data relevant to the study [60,61,62];
  • Scientific articles related to urban form, waterfront public space transformations, and climate adaptation measures were reviewed to provide the theoretical framework.
The survey commenced with the introductory analysis of 50 case studies of waterfront public space transformations in the region of the Baltic Sea selected from the countries involved in cooperation within the VASAB framework [60,61]. At this stage, strategic planning documents for particular cities, as well VASAB documents and recommendations, were investigated and juxtaposed with architectural and urban design projects for particular locations. The projects were developed by individual design studios as proposals for competitions launched by municipal or regional planning agencies.
In the following stage, 12 case studies were selected for further investigation (see Table 1). The selection criteria were based on maintaining:
  • Different sizes of the cities;
  • Different locations in the city structure;
  • Different types of waterbodies and shorelines;
  • Different climate conditions.
In the selective group of cities, the objective was to include cities with diversified populations and growth potential, varied exposure to waterbodies, maintain geographical balance, and include cities located in different climate zones. The choice of Tallinn, Pärnu, Copenhagen, Køge, Aarhus, Helsinki, Turku, Stockholm, Malmö, Luleå, Sundsvall, and Ystad for research on the transformation of land–water interfaces in coastal areas can be justified based on the following key factors and considerations:
  • Geographic and Climatic Diversity: The selected cities cover a wide geographic range, spanning across the Baltic Sea Region. They are located by different types of waterbodies, including gulfs, bays, open Baltic Sea coastlines, straits, and rivers [64]. Each city’s surroundings offer diverse coastal ecosystems, such as estuaries, wetlands, sandy beaches, and rocky shores. This diversity allows for studying land–water interfaces in various coastal and urban environments, each with unique characteristics and challenges.
  • Different Governance Systems: The selected cities are located in four different countries, each with its own governance systems and policies regarding urban and coastal management, as well as land–water interfaces [65,66,67]. Comparative research among these cities can reveal effective strategies and best practices for urban coastal resilience and sustainability. Moreover, the inclusion of cities from different countries fosters opportunities for transboundary collaboration on urban waterfronts. This can lead to joint initiatives, data sharing, and collaborative efforts in addressing shared coastal and urban challenges.
  • Urbanization and Human Impact: Several of the cities are major urban centres and industrial hubs, leading to significant human impact on the coastal areas, while others are smaller cities and towns. Studying the transformation of land–water interfaces in all these cases is crucial for understanding the interaction between human activities and waterfronts.
  • Coastal Vulnerability: Many of these cities are located along coastlines that are vulnerable to environmental changes, including sea level rise, erosion, and extreme weather events [68,69,70]. Investigating the morphology of newly created blue public spaces provides valuable insights into possible paths for waterfront transformation and may contribute to informing future sustainable management practices in the Baltic Sea Region and beyond.
  • Different Coastal Infrastructure: The selected cities have varying degrees of coastal infrastructure development that result from the former land use patterns.
Maps were the primary materials used to visualize spatial relationships and geographic data. The CAD mapper application site was used to generate maps, which were then opened in the AUTODESK AutoCAD 2022 program and transformed from *.dxf to *.dwg format to create research cartographic materials. These vector data were used as a base for the creation of plans for the case study areas. It enabled layering the analysed maps while maintaining their equal scale.
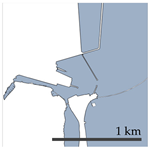
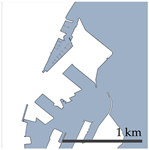
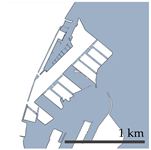
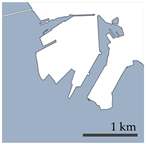
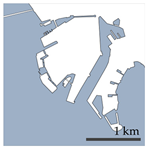
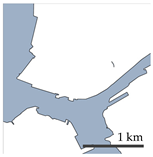
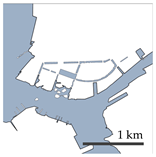
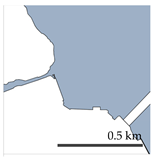
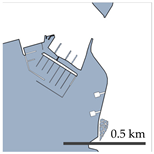
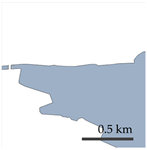
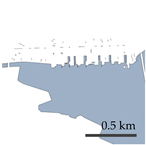
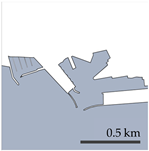
Using maps in the AUTODESK AutoCAD 2022 program allowed for the separation of the coastline layer, which revealed the position of the existing land–water boundary. This layer became the reference for collecting subsequent data and studying the transformation of the coastal zone. In the next stage of the research, for each location, a raster drawing of the proposed or ongoing transformations was confronted with the existing contour of the coastline and adjusted in scale. On a separate layer within the AutoCAD program, the contours of the new shape of the land–water boundary were outlined with a polyline. This made it possible to precisely determine the scope of changes in the analysed waterfront area and to present the state before and after the transformation.
In the next stage of the work, comparative analyses were conducted to examine the urban form on the land–water interface before the transformation processes, as well as the proposed form in architectural and urban winning projects. Finally, the morphology of the new urban blue spaces was investigated based on the research on the layout and configuration of urban form and space [71,72,73,74,75] and discussed with respect to relation to waterbodies and climate adaptation measures [17,20]. A detailed flowchart for the stages of data collection, analysis, and interpretation for the city of Aarhus is presented in Figure 1.

2.2. Study Area

2.2.1. Study Case Setting and Background

For the study area, given the context of expected changes concerning climate and their severe impacts on coastal zones, the Baltic Sea Region (BSR) has been selected. A number of conducted studies provide data that indicate the need to focus particular attention on land–water interface zones [76]. The selected area located in northern Europe is geographically and culturally diverse [77,78,79]. To justify the choice of the Baltic Sea Region for research on the transformation of land–water interfaces in urban coastal areas, it is worthwhile to highlight several key factors and characteristics that make this region particularly relevant and significant for such research. Most importantly, the Baltic Sea Region comprises multiple countries with diverse socioeconomic and governance systems, resulting in a range of urban policies and coastal management approaches. It represents a diverse range of coastal ecosystems. The region is witnessing substantial urbanization and economic development along its coastline, which brings along challenges of land-use change. Comparative studies across diverse strategies can offer valuable lessons on their effectiveness, enabling the identification of best practices. As such, the Baltic Sea Region offers valuable insights into global coastal challenges. Many of the issues faced in this region, such as sea level rise, coastal erosion, and urban pressure, are prevalent in coastal areas worldwide. Thus, research on land–water interfaces in the Baltic Sea Region can contribute to broader knowledge and inform policy and management decisions beyond the local scale [80].
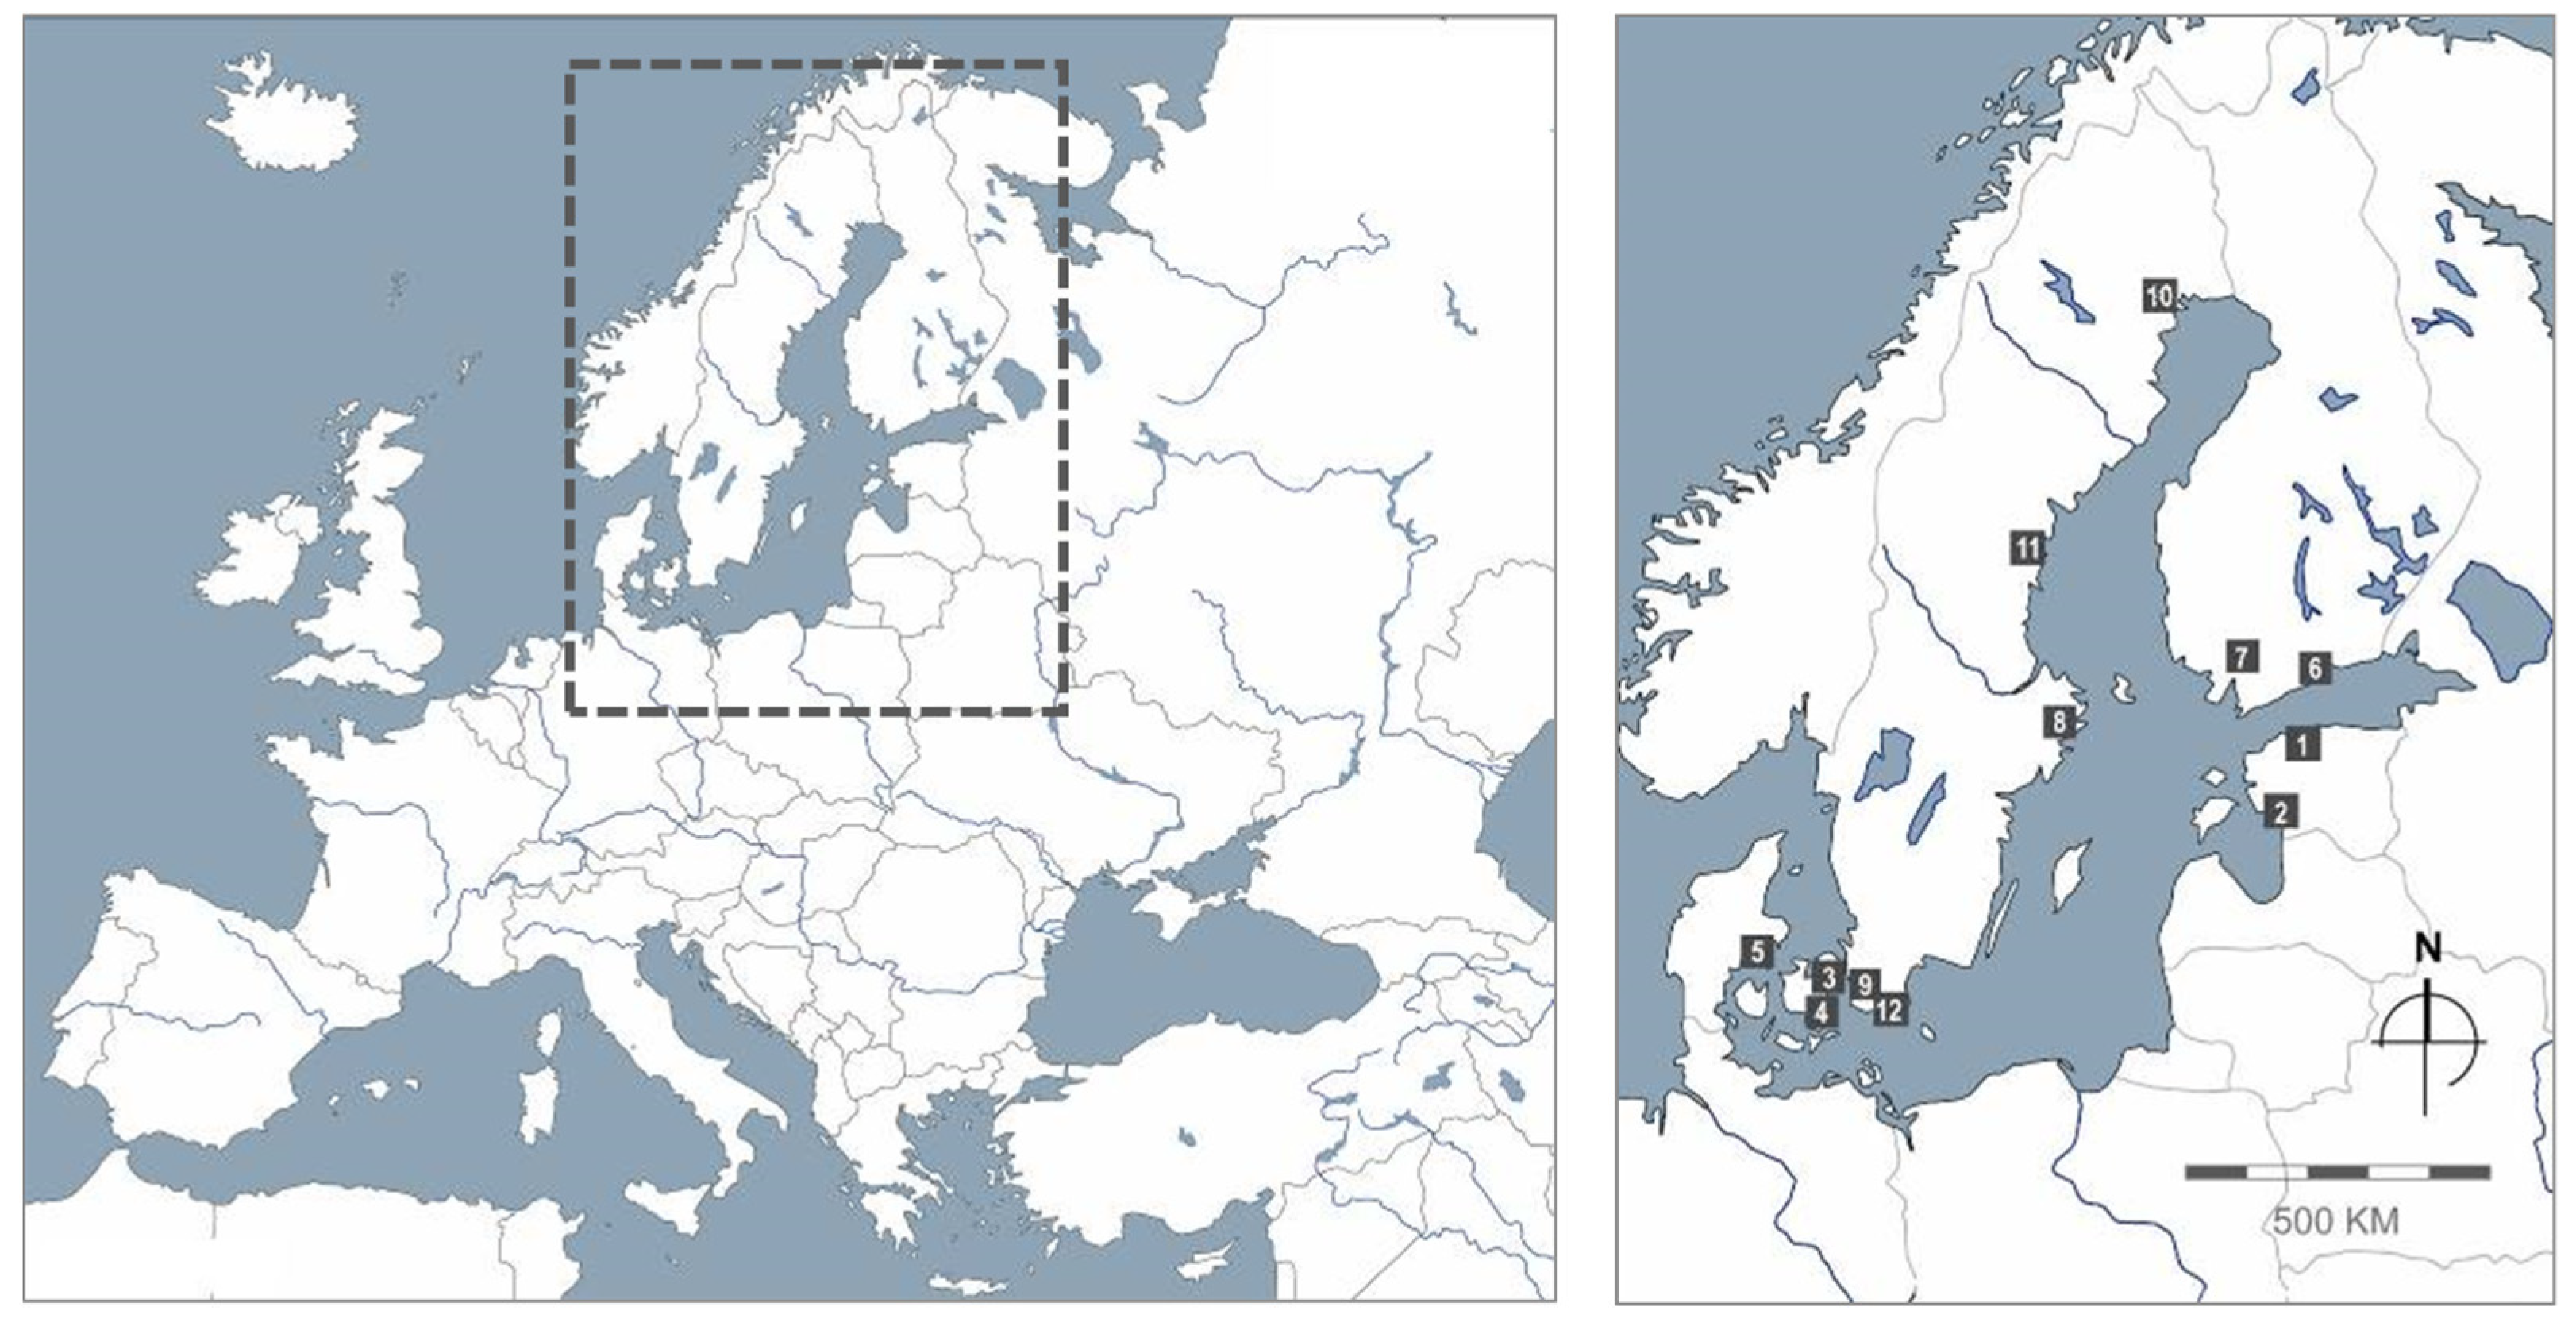
Considering the main catchment areas of the Baltic Sea, it encompasses countries such as Sweden, Finland, Denmark, Germany, Poland, Lithuania, Latvia, and Estonia, as well as parts of Norway, Russia, Belarus, the Czech Republic, Slovakia, and Ukraine. The study area is presented in Figure 2.

2.2.2. Characteristics of the Baltic Sea Region

The Baltic Sea, situated in northern Europe, is a shallow and semi-enclosed body of water characterized by limited exchange with the World Ocean and relatively small tidal amplitudes [81]. Its climate is notably changeable due to its transitional location between maritime and continental climates, and because of the influence of both the North Atlantic and Arctic regions. The river discharges from its extensive catchment area create a distinct salinity gradient in the sea surface [46]. Spanning an area approximately four times the surface area of the Baltic Sea, the Baltic Sea catchment area covers nearly 20% of the European continent. It stretches from the densely populated, temperate south to the subarctic wilderness in the north, providing a home for approximately 85 million people across 14 countries [82].
Over the past few decades, there have been significant changes in the environmental conditions of the Baltic Sea. For example, the Baltic Sea has experienced more rapid warming compared to other coastal seas since 1980 [82,83]. This warming has resulted in a decrease in sea ice and snow cover during the winter months.
The existing knowledge about natural hazards and extreme events in the Baltic Sea Region over the past 200 years, including instrumental data and future projections, has been summarized in a research study published in 2022 [84]. These events encompass, among other data, windstorms, extreme waves, variations in sea levels (both high and low), extremely mild and extremely severe seasons, marine heat waves, droughts, sea-ice ridging, heavy precipitation events, and river floods. Regarding the impacts of climate change, it is expected that terrestrial and marine heat waves, extremely mild sea-ice winters, heavy precipitation, and high-flow events will increase. Conversely, cold seasons, severe sea-ice winters, and sea-ice ridging are projected to decrease due to rising atmospheric temperatures. Changes in relative sea level extremes will depend on various factors, including the rising global mean sea level. Additionally, projections suggest an increase in drought occurrences in the southern and central parts of the Baltic Sea Region, particularly during the summer season.
Also relevant to the conducted research are studies concerning sea level dynamics and coastal erosion regarding various processes that influence mean and extreme sea level changes, coastal erosion, sedimentation, and their impacts on coastline alterations and coastal management [85]. More importantly, between 1886 and 2020, the mean absolute sea level in the Baltic Sea increased by approximately 25 cm, or an average of 2 mm per year. In the northern regions, land uplift still outpaces the rise in absolute sea level, while in the south, the opposite is true, which may lead to coastal erosion and inundation changes.
The current acceleration of sea level rise is minimal and can only be detected by averaging observations from different tide gauge locations. Future sea level rise in the Baltic Sea is expected to continue accelerating, although likely at a slightly slower pace than global mean sea level rise. Regarding sediment transports, the presence of mobile sediments renders the southern and eastern Baltic Sea coasts vulnerable to wind–wave-induced transport, particularly during storms. With global sea level rise, sediment transports in these coastal areas are anticipated to increase in the future, exhibiting substantial spatial variability depending on the angles at which wind waves approach the coast.
When characterising the Baltic Sea Region, it is worth noting the issues concerning the impact of environmental changes on the Baltic Sea ecosystem. The effects of these changes are being examined in the context of direct and indirect effects on species, communities, and ecosystem functioning [86]. The resulting consequences for species interactions, trophic dynamics, and overall ecosystem functioning are expected to be significant. In particular, there has been an extension of the phytoplankton growing season, an earlier onset of the spring bloom, and a delayed autumn bloom. However, the influence of temperature or salinity on cyanobacteria abundance varies among different species, and a definitive causal relationship has yet to be established.
An important comprehensive study on climate change in the Baltic Sea Region was performed in recent years and published in 2022 [87,88]. In this study, based on the analysis of all Baltic Earth Assessment Reports (BEARs) and over 800 scientific articles, the current knowledge on past, present, and projected future climate change in the Baltic Sea Region is summarized. The study focuses on various components of the Earth’s system, including the atmosphere, land surface, cryosphere, ocean and sediments, and terrestrial and marine biospheres. Essentially, observed changes in air temperature, sea ice, snow cover, and sea level have shown an acceleration compared to previous assessments. However, the large natural variability poses challenges in detecting and projecting climate changes in the region. The study also emphasizes the importance of researching changing extremes, recognizing that their impact may be more significant than that of changing means.
The Baltic Sea Region is indeed of significant importance when it comes to expected changes in climate and their severe impacts on coastal areas. The region faces unique challenges and vulnerabilities due to its geographical characteristics and the interconnectedness of its ecosystems [89].

2.2.3. Description of the Research Outline

The Baltic Sea Region is characterized by its extensive coastline along the Baltic Sea, which provides a unique situation for examining the way urban blue spaces (UBS) are designed. A particular feature of the region is the presence of a number of islands, fjords, and peninsulas stretching along the Baltic Sea coastlines. There are also different types of bodies of water and different types of water edges, each with its own unique characteristics. Furthermore, both natural and artificial structures are present. It can be noticed that the Baltic Sea Region’s water edges are shaped by a combination of natural and human-made factors and provide a range of functions and benefits to both humans and the environment [88].
Natural shorelines are formed by the action of waves, currents, and tides on the land. These water edges are characterized by their irregular shape and can be rocky, sandy, or muddy.
Types of water edges in the Baltic Sea Region include:
  • Rocky shores characterized by rugged, rocky terrain with steep cliffs or rocky beaches are present along the northern coast of the Baltic Sea in countries such as Finland, Estonia, and Sweden—for example, the granite cliffs of the Höga Kusten in Sweden, which rise over 300 m above the sea;
  • Sandy beaches characterized by wide stretches of sand and dunes are common along the coasts of Sweden, Poland, and Denmark, such as the white sand beaches of the island of Bornholm;
  • Mudflats characterized by soft, muddy terrain and shallow water depths are common in the southern part of the Baltic Sea in countries such as Poland and Germany, such as the Wattenmeer along the German coast;
  • Salt marshes characterized by low-lying, marshy terrain and the presence of salt-tolerant vegetation are present in the northern part of the Baltic Sea in countries such as Sweden and Finland, such as the Kvarken Archipelago (Kvarken skärgård);
  • Estuaries characterized by the dynamic flow of freshwater and saltwater as rivers meet the sea, which are common in the Gulf of Bothnia and in the Gulf of Finland, such as the River Kymi (Kymijoki) estuary in Finland—which is a Ramsar wetland site;
  • Archipelagos characterized by clusters of small islands and rocky outcrops are common throughout the Baltic Sea Region, including Sweden, Finland, and Estonia, such as the Åland Islands in Finland, which include over 6000 islands and islets.
There are also many created shorelines that take various forms, including seawalls, breakwaters, and jetties. These water edges are often straight and uniform in shape and are designed to protect the land from erosion and flooding [90,91].
It is worth noting that built shorelines designed to provide different functions can be used as industrial, recreational, or nature-oriented coastal zones. Industrialized shorelines found in areas with industrial activity have water edges often characterized by their artificial structures, such as quays, docks, and cranes. In urban areas, there is a growing trend of replacing industrial waterfronts with public spaces and structures dedicated to recreation and the promotion of biodiversity.
Recreational water edges are often characterized by their boardwalks, which sometimes include sandy beaches, and amenities where people have the possibility to rest, swim, and participate in water sports. The strengthening of recreational functions is also enhanced by the quaysides, which are often characterized by their natural vegetation, and are where ecological water edges have been restored or created to provide habitats for native flora and fauna [92].
When conducting research on designing urban blue spaces in the Baltic Sea Region, several factors should be involved. Considering the context described, the research presented in this article is focused on the analysis of urban waterside areas of different sizes and considers the conversions taking place at the interface between land and water.

3. Results

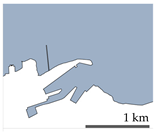
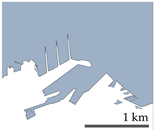
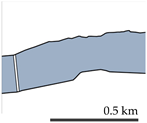
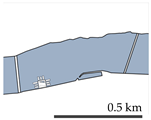
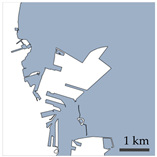
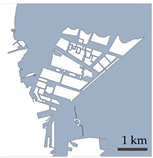
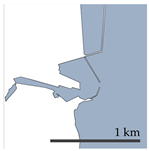
The qualitative analysis of urban form before and after transformation processes revealed that in all cases, the boundary between land and water was modified. The character and areal extent of interference with the land–water boundary have been identified. The extent of these interventions is shown in Table 2. The studies carried out have shown that modifications enabled the formation of new kinds of blue public spaces with diversified relations to water, such as water squares, promenades, floating terraces, canal streets, floating squares surrounded by floating buildings, artificial islands, or waterfront parks and wetlands. The results of the survey are presented in Table 3. An analogy with land-based public spaces was used [75].
In all the cases, the transition resulted in breaking an unambiguous line separating land and water and the introduction of different kinds of reliefs that allow for the permeability of water into the land. The reliefs took the forms of canals that cut into the land, organically shaped watercourses, wetlands, bays, water squares, and leisure pools. On the other hand, in most cases, public spaces exceed the existing line dividing land and water and extend into waterbodies in the forms of new landfills, piers, parks, interconnected islands, floating terraces, floating decks, and buildings. The transition from the large-scale hard line of the industrial quay to the finely meshed grids of public blue spaces is the most characteristic feature of all the waterfront transition models. New forms of public blue spaces improve the connectivity and permeability of the waterfront zones and promote ease of movement. In most cases, pedestrian paths link the public spaces with different expositions to water and lead to attraction nodes (Table 3).
Diversified flood protection measures and adaptation to climate change schemes have been adopted in all the analysed projects, and, generally, the coastal defence was given a priority over the formation of a new land area with a complex layout of public spaces. These strategies, though, did not erase the presence of water in urban spaces—on the contrary. The strategy of elevating the level of the quays and reinforcing embankments with stone constructions or earth mounds was translated into a detailed design, ensuring that users have access to the water. Different kinds of barrier parks, islands, piers, and breakwaters reducing the impact of storm surges are part of the projects. For example, in the case of Copenhagen and Koge, immense barrier islands were created that can be periodically flooded. In Turku, Sundsvall, or Stockholm, artificial detention basins contribute to softening the land–water interface. From the hard engineering structures, there is a visible shift toward more soft approaches.
Additionally, many coast defensive solutions are syncretic in their characteristics, that is, serving not only flood protection purposes but also social and landscape enhancement goals. In Koge, for instance, to protect the costs, the newly designed raised stone embankment was replenished with sand, which contributed to the development of a new kind of urban beach. The shore protection also involved greening the area, which not only resulted in stabilising the shoreline and protecting against erosion and flooding but also made walking along the waterline more attractive [93]. In Tallinn, the wide breakwater also serves as an access route to the ferry terminal and a green landmark promenade with architectural dominance as an additional attractor. All this allows for indicating synergies between public space development and climate adaptation measures.
In all of the cases, as a part of strategies to adapt to climate change defined by VASAB planning documents, the coastline transition was integrated with rainwater management goals. Detailed regulations were developed by individual urban or regional planning agencies as a response to the expansion of impermeable surfaces and the accompanying difficulties associated with increased precipitation, rising sea levels, and intensification of storm surges. For instance, the city of Helsinki adopted an Integrated Storm Water Management Program in 2018 [94]. In effect, in all the analysed case studies, the surface of existing post-industrial quays was softened by the rainwater harvesting systems consisting of reservoirs, retention parks, and marshlands, as well as diversified forms of urban greenery, which also became an important formative agent in the urban composition. The rainwater capacity of urban greenery was also used and discussed concerning various ecosystem services, such as biodiversity, enhancement of the ecological qualities of place, experiential values, and social benefits related to the visual contact with the blue–green infrastructure.
Research findings indicate that the transition from the hard lines and surfaces of embankments into a more complex array of blue public spaces concerns towns and cities of different sizes and various demographic and population trends. For example, Ystad, Sundsvall, Lulea, or Parnu are small- and medium-sized towns with minimal population growth (e.g., Ystad: 1.4% in 2015–2020; Sundsvall: 0.42% in 2015–2020; Lulea: 0.55% in 2015–2020, Parnu: 0.55% in 2011–2021). This means that the urge toward developing on the water cannot be solely explained by urban pressure but is also related to the pursuit of integrating water into an urban experience. A good example is the floating square in Parnu surrounded by floating exhibition pavilions, which enhance the unique atmosphere of a small-scale Town of Art [95]. Similarly, the transition from the hard edge of the industrial quay to the finely meshed network of interconnected blue public spaces can be observed in towns and cities located in different climatic zones. Given the seasonal changes, during the winter, the cycle lanes along the waterfront promenade in Tallinn can be repurposed as cross-country skiing lanes, providing users with an additional way to enjoy the area [96]. Even in the subarctic climate of Lulea, the project provides accessible, attractive places and pathways for meetings and activities throughout the year.

4. Discussion

In all the investigated cases, the results indicate the transition from a hard line of embankments to the fluid zone, a form of continuum that unfolds on the blurred boundaries between the water and the land (Figure 3). This transition buffering zone may be of different widths and capacities, depending on the local urban, economic, geographical, and coastal conditions. This continuum can be perceived not only in terms of a static plan of new waterfront development but also through the dynamic alternatives of how public space relates to different levels of water. For instance, when lower embankments are flooded, the elevated ones may still be used as pedestrian paths leading to floating terraces and buildings. Water is allowed to permeate in a controlled manner onto amphibious territories, such as wetlands or barrier parks.
This shift from the hard line of the quay into a capacious transition zone brings about new design challenges. Firstly, it highlights the need to involve an interdisciplinary perspective in waterfront transformation processes. Waterfronts are not only urban extensions but also sensitive environments [97,98]. For instance, as natural marshes are disappearing due to climate change-induced coast erosion and human activities, newly created marshlands, as components of waterfront transition projects, may restore the ecological functions of shorelines and also contribute to their stabilisation [99]. Such restoration processes, however, would require engineers and ecologists to work together to recreate and construct processes observed in nature, such as sediment accretion [100]. Specialised knowledge of biology and ecophysiography allows for understanding the complex food web and facilitates the development of scenarios for temporal inundations of coastal and estuarine habitats [37]. Green infrastructure implemented in a transition zone between the land and water not only provides different ecosystem services but also highly impacts the urban ventilation quality [101,102]. Even hard flood protection devices designed to mitigate wave energy, considered two decades ago as purely engineering structures, take form today as interconnected islands or arrays of onshore or offshore piers that also serve social and ecological functions [103].
The specific challenges that climate change poses to the urban planning process of waterfront public spaces also relate to their immediate links with marine environments and marine spatial planning. Future research studies on urban waterfronts should relate to this issue. With increasing anthropogenic pressure on coastlines, it is necessary to develop tools for identifying priority marine areas that demand protection and conservation and for integrating this knowledge into urban waterfront development procedures [104]. Addressing this issue, Adams et al. explore the critical interface between regional governance systems, natural resource management, and spatial planning for climate adaptation, and propose recommendations for governance and institutional reform to improve spatial planning for climate change [105].
Noticeably, the transition from the hard line of an industrial quay to the continuum that has unfolded on the land–water boundary brings about design solutions that could be perceived as environmentally sensitive and even organic in form. Looking at the array of islands designed for the Turku waterfront, it is worthwhile to notice that in natural conditions, barrier islands are important geomorphic features for about 10% of the world’s coastlines [106]. Developing effective and landscape-enhancing flood protection solutions require the collection of different kinds of environmental data and the use of innovative hydrodynamic modelling tools and techniques that examine their response to storm waves and tidal surges [37,107]. Such a technology-based approach to creating and recreating rich waterfront environments has been highly supported in recent years by the European Green Deal initiative, which aims to restore natural ecosystems and preserve biodiversity [108,109].
Waterfront transformations contribute to Sustainable Development Goals. Creating high-quality blue spaces contributes particularly to goal 11 (sustainable cities and communities), but also 3 (good health and well-being), 5 (gender equality), 6 (clean water and sanitation), and 13 (climate action) [9,10]. The successful sustainable waterfront transformations could be observed in other Baltic Sea Region cities, such as Klaipėda, Kalmar, Rostock, Riga, Liepāja, Kotka, Vaasa, Tampere, and many others. A good example is Gothenburg, located on the west coast of Sweden, where significant waterfront redevelopment, particularly around the Göta älv River, has taken place. The transformation includes the creation of parks, walking and biking paths, and mixed-use developments, promoting a more sustainable and interconnected urban landscape. The city of Umeå, situated on the Ume River in northern Sweden, has been actively transforming its waterfront to promote sustainability and resilience. The city has focused on green infrastructure, mixed-use developments, and public art installations, creating vibrant and environmentally conscious public spaces. The transformation of waterfront areas can bring significant socioeconomic benefits to cities, thereby creating attractive public spaces, fostering tourism, encouraging investment in real estate, and promoting local businesses contribute to the overall economic vitality. Moreover, successful transformations often involve extensive community engagement and collaboration between stakeholders, including residents, businesses, and local authorities.
The research on the links between the quality of urban life and the environmental quality of urban blue spaces gained interest in recent years, which resulted in the emergence of a relatively new concept of blue health [110]. It has become clear that in the context of climate change, attractive public spaces created on the land–water boundary are a valuable extension of cities. They are less vulnerable to the Urban Heat Island effect and can improve the overall thermal conditions, particularly in compact cities [111,112]. The present literature on blue spaces provides evidence for the wide range of advantages they offer, such as promoting better physical and mental health, as well as overall well-being. In addition to the direct health benefits associated with exposure to blue spaces, researchers have pinpointed various mechanisms through which these environments can positively influence health. These mechanisms include fostering physical activity, enhancing social connectivity and interaction, and reducing stress and harmful environmental exposure [113,114]. One of the key factors in developing schemes for urban blue spaces implementation is understanding interconnected factors influencing their usage [115]. However, there is a significant need to create comprehensive adaptive design expertise that combines existing health evidence and translates it into practical implementation within the design of healthy blue spaces [11].
The findings of this study highlight the need to verify the existing planning regulations, which is a critical issue, given that many waterside urban areas in European cities are subject to future transformations. While competition briefs usually call for innovation and allow for experimentation, everyday urban planning procedures are not yet fully adjusted to the possibility of extending the waterfront transformation zone into water areas. In some Baltic countries, the waterfront renewal territory is still limited by the hard line of the existing embankment. A good example is Polish land use regulations that strictly relate to the land territory and rely on traditional spatial planning instruments that appear insufficient to guide the design of waterfront public spaces that are resilient to climate change [116]. Consequently, even ecophysiographic studies—one of the decision-informing forms of documentation prepared for spatial development plans and characterising individual natural elements and their interrelations in the area covered by the plan or study—only refer to the land areas. Designing on the water is a separate issue, and according to the Water Directive, it can only be implemented for internal waters or marine areas. Both of these domains have a hard demarcation line—which is along the existing land–water edge. In effect, even in the iconic post-shipyard areas in Gdańsk, the line of industrial embankment remains unchanged despite the large scale of the conversion project [117,118].
To overcome this problem, instead of the line dividing the land and water, the transition zone shall that be indicated connects and renegotiates the two environments. Dal Cin et al. indicate the need for decoding the two systems—the natural that refers to the water and the artificial—for the development of urban-built forms on the waterfront [17]. The provided study contributes to this process of decoding, indicating that the two systems overlap, and calling for new flexible planning instruments.

5. Conclusions

The research conducted in this study examined the transition models of blue public space design in cities located in the Baltic Sea Region, focusing on their morphological characteristics and their response to climate change threats. The analysis of the 12 case studies revealed important insights into the transformation of the land–water interface, the formation of diverse blue public spaces, and the integration of flood protection measures and climate adaptation strategies.
The first key finding of this study is that in all the investigated cases, the initial boundary between land and water has been modified. Existing hard land–water interfaces were transformed into specific soft transition zones, where new types of blue public spaces were created with different relationships to water, such as water squares, promenades, floating terraces, canal streets, artificial islands, and waterfront parks. The introduction of reliefs and the permeability of water into the land through canals, organically shaped watercourses, wetlands, and bays contributed to the development of the diversified, dynamic, and interconnected urban environment. The layout of public paths is both regular and irregular in the proposed projects [73], but its finely meshed grid offers pedestrians many different ways to circulate from place to place [71] by the water, on the water, and through periodically flooded buffering parks, islands, and promenades.
Secondly, the study revealed that the integration of flood protection and climate adaptation schemes was a common feature in all the analysed projects. Coastal defence measures, such as raised stone embankments, earth mounds, and breakwaters, were designed not only for flood protection but also to serve social and landscape enhancement goals. Synergies were identified between public space development and rainwater management solutions.
As the third main finding, the research indicates that the transition from the rigid edge of the quay to a more spacious transition zone where new public spaces are created presents novel design challenges. It highlights the need to involve an interdisciplinary perspective in waterfront transformation processes. Waterfronts are valuable urban extensions but also sensitive ecosystems and dynamic hydrological environments, which indicates the demand to integrate all these aspects into the studies. Finally, the findings of this study highlight the need to verify the existing planning regulations and make them more flexible and effective in guiding the waterfront design processes and negotiating between regional governance systems, natural resource management, and urban planning.
In conclusion, the research presented in this paper highlights the importance of blue public spaces in waterfront regeneration and their role in enhancing the quality of urban environments. The transition models identified in the Baltic Sea Region demonstrate the potential for creating sustainable, resilient, and socially vibrant spaces. The findings emphasize the need for flexible planning regulations, the integration of flood protection measures, and the consideration of climate change adaptation strategies in the design and development of blue public spaces. By embracing these principles, cities can create inclusive, accessible, and visually engaging environments that promote the well-being of their inhabitants and contribute to the overall sustainable development goals. The knowledge gained from the presented research can be applied to improve coastal management strategies not only in the Baltic Sea Region but also in other coastal areas worldwidefacing similar challenges worldwide.

Author Contributions

Conceptualization, I.M.B. and L.N.; methodology, I.M.B. and L.N.; software, I.M.B.; resources, I.M.B. and L.N.; data curation, I.M.B. and L.N.; writing—original draft preparation, I.M.B. and L.N.; writing—review and editing, I.M.B. and L.N.; visualization, I.M.B. and L.N.; funding acquisition, L.N. All authors have read and agreed to the published version of the manuscript.

Funding

This research was funded by the European Union’s Horizon 2020 research and innovation programme under the Maria Skłodowska-Curie grant agreement No. 823901 SOS Climate Waterfront—Linking Research and Innovation on Waterfront through Technology for Excellence of Resilience to Face Climate Change.

Data Availability Statement

The data presented in this study are available on request from the corresponding author.

Conflicts of Interest

The authors declare no conflict of interest.

References

  1. Alemany, J.; Bruttomesso, R. (Eds.) The Port City of the XXIst Century; RETE: Venice, Italy, 2011. [Google Scholar]
  2. Braae, E.; Diedrich, L. Site specificity in contemporary large-scale harbour transformation projects. J. Landsc. Archit. 2012, 7, 20–33. [Google Scholar] [CrossRef] [Green Version]
  3. Lorens, P. Urban waterfront regeneration: Origins of the issue. In New Faces of Harbor Cities; Cambridge Scholars Publishing: Newcastle upon Tyne, UK, 2014. [Google Scholar]
  4. Hein, C.; Schubert, D. Resilience and Path Dependence: A Comparative Study of the Port Cities of London, Hamburg, and Philadelphia. J. Urban Hist. 2021, 47, 389–419. [Google Scholar] [CrossRef]
  5. Porfyriou, H.; Sepe, M. Waterfronts Revisited: European Ports in a Historic and Global Perspective; Routledge: New York, NY, USA, 2017. [Google Scholar]
  6. United Nations. The Sustainable Development Goals Report 2019; UN: New York, NY, USA, 2019. [Google Scholar]
  7. 10 Principles for Sustainable Development of Urban Waterfront Areas. Cities on Water in Collaboration Wasserstadt GmbH, Berlin. In Proceedings of the International Seminars: Global Conference on the Urban Future (URBAN 21), EXPO 2000 World Exhibition, Berlin, Germany, 1 June–31 October 2000. [Google Scholar]
  8. Bell, S.; Fleming, L.E.; Grellier, J.; Kuhlmann, F.; Nieuwenhuijsen, M.J.; White, M.P. Urban Blue Spaces: Planning and Design for Water, Health and Well-Being, 1st ed.; Routledge: London, UK, 2021. [Google Scholar]
  9. Wilczyńska, A.; Niin, G.; Vassiljev, P.; Myszka, I.; Bell, S. Perceptions and Patterns of Use of Blue Spaces in Selected European Cities: Tartu, Tallinn, Barcelona, Warsaw and Plymouth. Sustainability 2023, 15, 7392. [Google Scholar] [CrossRef]
  10. Ptak-Wojciechowska, A.; Januchta-Szostak, A.; Gawlak, A.; Matuszewska, M. The Importance of Water and Climate-Related Aspects in the Quality of Urban Life Assessment. Sustainability 2021, 13, 6573. [Google Scholar] [CrossRef]
  11. Zhang, H.; Nijhuis, S.; Newton, C. Freshwater blue space design and human health: A comprehensive research mapping based on scientometric analysis. Environ. Impact Assess. Rev. 2022, 97, 106859. [Google Scholar] [CrossRef]
  12. Hein, C. Port cities and urban wealth: Between global networks and local transformations. Int. J. Glob. Environ. Issues 2014, 13, 339–361. [Google Scholar] [CrossRef]
  13. Schubert, D. Ports and Urban Waterfronts. In The Routledge Handbook of Planning History; Hein, C., Ed.; Routledge: New York, NY, USA, 2018; pp. 338–349. [Google Scholar]
  14. Hein, C.; van Mil, Y. Towards a comparative spatial analysis for port city regions based on historical geospatial mapping. PORTUSplus 2019, 8, 2–18. [Google Scholar]
  15. Krośnicka, K.A.; Lorens, P.; Michałowska, E. Port cities within port regions: Shaping complex urban environments in Gdansk Bay, Poland. Urban Plan. 2021, 6, 27–42. [Google Scholar] [CrossRef]
  16. Giovinazzi, O.; Moretti, M. Port Cities and Urban Waterfront: Transformations and Opportunities. TeMALab J. Mobil. Land Use Environ. 2010, 3, 57–64. [Google Scholar]
  17. Cin, F.D.; Hooimeijer, F.; Silva, M.M. Planning the Urban Waterfront Transformation, from Infrastructures to Public Space Design in a Sea-Level Rise Scenario: The European Union Prize for Contemporary Architecture Case. Water 2021, 13, 218. [Google Scholar] [CrossRef]
  18. Climate Central. Researching and Communicating Climate Change Impacts and Solutions. Available online: https://www.climatecentral.org/ (accessed on 12 July 2022).
  19. MIT Climate Models. Available online: https://climate.mit.edu/explainers/climate-models (accessed on 25 July 2022).
  20. Matos Silva, M.; Costa, J.P. Flood Adaptation Measures Applicable in the Design of Urban Public Spaces: Proposal for a Conceptual Framework. Water 2016, 8, 284. [Google Scholar] [CrossRef] [Green Version]
  21. Hurlimann, A.; Wilson, E. Sustainable Urban Water Management under a Changing Climate: The Role of Spatial Planning. Water 2018, 10, 546. [Google Scholar] [CrossRef] [Green Version]
  22. Liu, J.; Fan, B. What Contributes to Local-Level Institutional Adaptation under Climate Change? A Configurational Approach Based on Evidence from China’s Sponge City Program. J. Environ. Manag. 2023, 342, 118292. [Google Scholar] [CrossRef] [PubMed]
  23. Dong, X.; Ye, Y.; Yang, R.; Li, X. Planning for green infrastructure based on integration of multi-driving factors: A case study in pilot site of sponge city. Sustain. Cities Soc. 2023, 93, 104549. [Google Scholar] [CrossRef]
  24. Zhai, J.; Ren, J.; Xi, M.; Tang, X.; Zhang, Y. Multiscale watershed landscape infrastructure: Integrated system design for sponge city development. Urban For. Urban Green. 2021, 60, 127060. [Google Scholar] [CrossRef]
  25. Ferrans, P.; Torres, M.N.; Temprano, J.; Sánchez, J.P.R. Sustainable Urban Drainage System (SUDS) modeling supporting decision-making: A systematic quantitative review. Sci. Total Environ. 2021, 806, 150447. [Google Scholar] [CrossRef]
  26. Ferrans, P.; Reyes-Silva, J.D.; Krebs, P.; Temprano, J. Flood Management with SUDS: A Simulation–Optimization Framework. Water 2023, 15, 426. [Google Scholar] [CrossRef]
  27. Fletcher, T.D.; Shuster, W.; Hunt, W.F.; Ashley, R.; Butler, D.; Arthur, S.; Trowsdale, S.; Barraud, S.; Semadeni-Davies, A.; Bertrand-Krajewski, J.L.; et al. SUDS, LID, BMPs, WSUD and more—The evolution and application of terminology surrounding urban drainage. Urban Water J. 2015, 12, 525–542. [Google Scholar] [CrossRef]
  28. Nesbitt, L.; Meitner, M.J.; Sheppard, S.R.; Girling, C. The dimensions of urban green equity: A framework for analysis. Urban For. Urban Green. 2018, 34, 240–248. [Google Scholar] [CrossRef]
  29. Nesbitt, L.; Meitner, M.J.; Girling, C.; Sheppard, S.R.; Lu, Y. Who has access to urban vegetation? A spatial analysis of distributional green equity in 10 US cities. Landsc. Urban Plan. 2019, 181, 51–79. [Google Scholar] [CrossRef]
  30. Kabisch, N.; Frantzeskaki, N.; Hansen, R. Principles for urban nature-based solutions. Ambio 2022, 51, 1388–1401. [Google Scholar] [CrossRef] [PubMed]
  31. Matos Silva, M.; Costa, J.P. Urban flood adaptation through public space retrofits: The case of Lisbon (Portugal). Sustainability 2017, 9, 816. [Google Scholar] [CrossRef] [Green Version]
  32. Matos Silva, M.; Costa, J.P. Urban Floods and Climate Change Adaptation: The Potential of Public Space Design When Accommodating Natural Processes. Water 2018, 10, 180. [Google Scholar] [CrossRef] [Green Version]
  33. Burda, I.; Nyka, L. Providing Public Space Continuities in Post-Industrial Areas through Remodelling Land/Water Connections. IOP Conf. Ser. Mater. Sci. Eng. 2017, 245, 082037. [Google Scholar] [CrossRef]
  34. Piątek, Ł.; Wojnowska-Heciak, M. Multicase Study Comparison of Different Types of Flood-Resilient Buildings (Elevated, Amphibious, and Floating) at the Vistula River in Warsaw, Poland. Sustainability 2020, 12, 9725. [Google Scholar] [CrossRef]
  35. Dubinina, A.; Wawrzyńska, A.; Krośnicka, K. Permeability of Waterfronts—Contemporary Approach in Designing Urban Blue Spaces. Sustainability 2022, 14, 9357. [Google Scholar] [CrossRef]
  36. Nyka, L.; Burda, I. Scenario-planning solutions for waterfront flood-prone areas. Glob. J. Eng. Educ. 2020, 22, 149–154. [Google Scholar]
  37. On the Water: Palisade Bay; The Museum of Modern Art MoMA: New York, NY, USA; Princeton University School of Architecture: Princeton, NJ, USA, 2010.
  38. BACA. ‘The LifE Report’ by IHS, BRE Press along with a Condensed Illustrated ‘LifE Handbook’; The Life Report; de Bre and Baca Architects: London, UK, 2009. [Google Scholar]
  39. Olthuis, K.; Keuning, D. Float! Building on Water to Combat Urban Congestion and Climate Change; Frame Publishers: Amsterdam, The Netherlands, 2010. [Google Scholar]
  40. Loes Nillesen, A.; Singelenberg, J. Amphibious Housing in the Netherlands; NAi Publishers: Rotterdam, The Netherlands, 2011. [Google Scholar]
  41. Molinaroli, E.; Peschiutta, M.; Rizzetto, F. Long-Term Evolution of an Urban Barrier Island: The Case of Venice Lido (Northern Adriatic Sea, Italy). Water 2023, 15, 1927. [Google Scholar] [CrossRef]
  42. Shannon, K.; De Meulder, B.; d’Auria, V.; Gosseye, J. (Eds.) Water Urbanisms; SUN: Amsterdam, The Netherlands, 2008. [Google Scholar]
  43. Ghermandi, A.; Nunes, P.A. A global map of coastal recreation values: Results from a spatially explicit meta-analysis. Ecol. Econ. 2013, 86, 1–15. [Google Scholar] [CrossRef]
  44. Dangendorf, S.; Marcos, M.; Wöppelmann, G.; Conrad, C.P.; Frederikse, T.; Riva, R. Reassessment of 20th-century global mean sea level rise. Proc. Natl. Acad. Sci. USA 2017, 114, 5946–5951. [Google Scholar] [CrossRef]
  45. Kulp, S.A.; Strauss, B.H. New elevation data triple estimates of global vulnerability to sea-level rise and coastal flooding. Nat. Commun. 2019, 10, 4844. [Google Scholar] [CrossRef] [Green Version]
  46. Restemeyer, B.; Woltjer, J.; van den Brink, M. A strategy-based framework for assessing the flood resilience of cities—A Hamburg case study. Plan. Theory Pract. 2015, 16, 45–62. [Google Scholar] [CrossRef]
  47. White, P.; Pelling, M.; Sen, K.; Seddon, D.; Russell, S.; Few, R. Disaster Risk Reduction: A Development Concern. A Scoping Study on Links between Disaster Risk Reduction, Poverty and Development; Department for International Development: London, UK, 2005. [Google Scholar]
  48. Kabisch, N.; Frantzeskaki, N.; Pauleit, S.; Naumann, S.; Davis, M.; Artmann, M.; Haase, D.; Knapp, S.; Korn, H.; Stadler, J.; et al. Nature-Based Solutions to Climate Change Mitigation and Adaptation in Urban Areas: Perspectives on Indicators, Knowledge gaps, Barriers, and Opportunities for Action. Ecol. Soc. 2016, 21, 39. Available online: http://www.jstor.org/stable/26270403 (accessed on 10 October 2022). [CrossRef] [Green Version]
  49. Collins, M.; Sutherland, M.; Bouwer, L.; Cheong, S.-M.; Frölicher, T.; Des Combes, H.J.; Roxy, M.K.; Losada, I.; McInnes, K.; Ratter, B.; et al. Chapter 6: Extremes, Abrupt Changes and Managing Risks. ipcc SROCC 2019, 589–655. [Google Scholar] [CrossRef]
  50. Wolff, C.; Nikoletopoulos, T.; Hinkel, J.; Vafeidis, A.T. Future urban development exacerbates coastal exposure in the Mediterranean. Sci. Rep. 2020, 10, 14420. [Google Scholar] [CrossRef] [PubMed]
  51. Oppenheimer, M. Preface. In On the Water: Palisade Bay; Nordenson, G., Seavitt, C., Yarinsky, A., Eds.; The Museum of Modern Art: New York, NY, USA, 2010; p. 11. [Google Scholar]
  52. Cooper, M.P.; Beevers, M.D.; Oppenheimer, M. The Potential Impacts of Sea Level Rise on the Coastal Region of New Jersey, USA. Clim. Chang. 2008, 90, 475–492. [Google Scholar] [CrossRef]
  53. Falkenmark, M.; Mikulski, Z. The Key Role of Water in the Landscape System: Conceptualization to Address Growing Human Landscape Pressures. Geo J. 1994, 33, 355–363. Available online: http://www.jstor.org/stable/41146234 (accessed on 7 September 2021). [CrossRef]
  54. Wang, J.; Soininen, J.; Heino, J. Ecological indicators for aquatic biodiversity, ecosystem functions, human activities and climate change. Ecol. Indic. 2021, 132, 108250. [Google Scholar] [CrossRef]
  55. Arnberger, A.; Eder, R.; Preisel, H. Assessing Visitors’ Understanding of River National Park Functions and Landscapes. Water 2023, 15, 461. [Google Scholar] [CrossRef]
  56. Völker, S.; Matros, J.; Claßen, T. Determining Urban Open Spaces for Health-Related Appropriations: A Qualitative Analysis on the Significance of Blue Space. Environ. Earth Sci. 2016, 75, 1067. [Google Scholar] [CrossRef]
  57. Keniger, L.E.; Gaston, K.J.; Irvine, K.N.; Fuller, R.A. What are the benefits of interacting with nature? Int. J. Environ. Res. Public Health 2013, 10, 913–935. [Google Scholar] [CrossRef] [Green Version]
  58. Mobaraki, A.; Oktay Vehbi, B. A Conceptual Model for Assessing the Relationship between Urban Morphology and Sustainable Urban Form. Sustainability 2022, 14, 2884. [Google Scholar] [CrossRef]
  59. Leccis, F. Urban Regeneration and Touristification in the Sardinian Capital City of Cagliari, Italy. Sustainability 2023, 15, 4061. [Google Scholar] [CrossRef]
  60. Piwowarczyk, J.; Gee, K.; Gilek, M.; Hassler, B.; Luttmann, A.; Maack, L.; Matczak, M.; Morf, A.; Saunders, F.; Stalmokaitė, I.; et al. Insights into integration challenges in the Baltic Sea Region marine spatial planning: Implications for the HELCOM-VASAB principles. Ocean Coast. Manag. 2019, 175, 98–109. [Google Scholar] [CrossRef]
  61. VASAB. Vision for the Territorial Development of the Baltic Sea Region in 2040, V.A.S.A.B. Visions and Strategies around the Baltic Sea. Available online: https://vasab.org/vision2040/ (accessed on 30 July 2022).
  62. HELCOM. Baltic Marine Environment Protection Commission. Available online: https://helcom.fi/ (accessed on 30 July 2022).
  63. Eurostat, ec. europa.eu/Eurostat/Web/Main/Data/Database. Available online: https://www.citypopulation.de (accessed on 10 May 2023).
  64. Wolski, T.; Wiśniewski, B. Geographical diversity in the occurrence of extreme sea levels on the coasts of the Baltic Sea. J. Sea Res. 2020, 159, 101890. [Google Scholar] [CrossRef]
  65. Kern, K. Governance for Sustainable Development in the Baltic Sea Region. J. Balt. Stud. 2011, 42, 21–35. Available online: https://www.jstor.org/stable/43213001. (accessed on 31 July 2023). [CrossRef]
  66. Grönholm, S. A tangled web: Baltic Sea Region governance through networks. Mar. Policy 2018, 98, 201–210. [Google Scholar] [CrossRef]
  67. Multi-Level Governance in MSP throughout the Baltic Sea Region. Available online: https://maritime-spatial-planning.ec.europa.eu/projects/multi-level-governance-msp-throughout-baltic-sea-region (accessed on 30 July 2022).
  68. Klein, R.T.; Nicholls, R.J. Assessment of coastal vulnerability to climate change. Ambio 1999, 28, 182–187. [Google Scholar]
  69. Sterr, H. Assessment of Vulnerability and Adaptation to Sea-Level Rise for the Coastal Zone of Germany. J. Coast. Res. 2008, 242, 380–393. [Google Scholar] [CrossRef] [Green Version]
  70. Šakurova, I.; Kondrat, V.; Baltranaitė, E.; Vasiliauskienė, E.; Kelpšaitė-Rimkienė, L. Assessment of Coastal Morphology on the South-Eastern Baltic Sea Coast: The Case of Lithuania. Water 2023, 15, 79. [Google Scholar] [CrossRef]
  71. Carmona, M.; Heath, T.; Tiesdell, S.; Oc, T. Public Places Urban Spaces. The Dimensions of Urban Design; Elsevier Architectural Press: Oxford 2003.
  72. Oliveira, V. Urban Morphology: An Introduction to the Study of the Physical From of Cities; Springer International Publishing: Cham, Switzerland, 2016. [Google Scholar]
  73. Zhou, Q.; Bao, J.; Liu, H. Mapping Urban Forms Worldwide: An Analysis of 8910 Street Networks and 25 Indicators. ISPRS Int. J. Geo-Inf. 2022, 11, 370. [Google Scholar] [CrossRef]
  74. Borucka, J. Building culture written into the landscape—How to read spatial tradition. In Structures and Architecture Beyond Their Limits; Paulo, J., da Sousa, C., Eds.; CRC Press: Boca Raton, FL, USA; London, UK; New York, NY, USA, 2016; pp. 459–466. [Google Scholar]
  75. Nochian, A.; Mohd Tahir, O.; Maulan, S.; Rakhshandehroo, M. A Comprehensive Public Open Space Categorization Using Classification System for Sustainable Development of Public Open Spaces. Int. J. Sustain. Trop. Des. Res. Pract. 2015, 8, 29–40. [Google Scholar]
  76. Weisse, R.; Dailidienė, I.; Hünicke, B.; Kahma, K.; Madsen, K.; Omstedt, A.; Parnell, K.; Schöne, T.; Soomere, T.; Zhang, W.; et al. Sea level dynamics and coastal erosion in the Baltic Sea region. Earth Syst. Dyn. 2021, 12, 871–898. [Google Scholar] [CrossRef]
  77. Strandmark, A.; Bring, A.; Cousins, S.A.; Destouni, G.; Kautsky, H.; Kolb, G.S.; de la Torre-Castro, M.; Hambäck, P.A. Climate change effects on the Baltic Sea borderland between land and sea. Ambio 2015, 44, 28–38. [Google Scholar] [CrossRef] [Green Version]
  78. Johansson, M.M.; Kahma, K.K.; Boman, H. An improved estimate for the long-term mean sea level on the Finnish coast. Geophysica 2003, 39, 51–73. [Google Scholar]
  79. Madsen, K.S.; Murawski, J.; Blokhina, M.; Su, J. Sea Level Change: Mapping Danish Municipality Needs for Climate Information. Front. Earth Sci. 2019, 7, 113. [Google Scholar] [CrossRef]
  80. Reusch, T.B.; Dierking, J.; Andersson, H.C.; Bonsdorff, E.; Carstensen, J.; Casini, M.; Czajkowski, M.; Hasler, B.; Hinsby, K.; Hyytiäinen, K.; et al. The Baltic Sea as a time machine for the future coastal ocean. Sci. Adv. 2018, 4, 8195. [Google Scholar] [CrossRef] [Green Version]
  81. Leppäranta, M.; Myrberg, K. Physical Oceanography of the Baltic Sea; Praxis Publishing Ltd: Chichester, UK, 2009. [Google Scholar]
  82. Meier, H.E.M.; Reckermann, M.; Langner, J.; Smith, B.; Didenkulova, I. Overview: The Baltic Earth Assessment Reports (BEAR). Earth Syst. Dyn. 2023, 14, 519–531. Available online: https://esd.copernicus.org/articles/14/519/2023/ (accessed on 10 May 2023).
  83. State of the Baltic Sea Report—Second HELCOM Holistic Assessment 2011–2016. Available online: http://stateofthebalticsea.helcom.fi/ (accessed on 7 June 2021).
  84. Rutgersson, A.; Kjellström, E.; Haapala, J.; Stendel, M.; Danilovich, I.; Drews, M.; Jylhä, K.; Kujala, P.; Larsén, X.G.; Halsnæs, K.; et al. Natural hazards and extreme events in the Baltic Sea region. Earth Syst. Dyn. 2022, 13, 251–301. [Google Scholar] [CrossRef]
  85. Nordman, M.; Peltola, A.; Bilker-Koivula, M.; Lahtinen, S. Past and Future Sea Level Changes and Land Uplift in the Baltic Sea Seen by Geodetic Observations. In Beyond 100: The Next Century in Geodesy; Freymueller, J.T., Sánchez, L., Eds.; International Association of Geodesy Symposia, Volume 152; Springer: Cham, Switzerland, 2020; p. 124. [Google Scholar] [CrossRef]
  86. Viitasalo, M.; Bonsdorff, E. Global climate change and the Baltic Sea ecosystem: Direct and indirect effects on species, com-munities and ecosystem functioning. Earth Syst. Dyn. 2022, 13, 711–747. [Google Scholar] [CrossRef]
  87. Meier, H.M.; Kniebusch, M.; Dieterich, C.; Gröger, M.; Zorita, E.; Elmgren, R.; Myrberg, K.; Ahola, M.P.; Bartosova, A.; Bonsdorff, E.; et al. Climate change in the Baltic Sea region: A summary. Earth Syst. Dyn. 2022, 13, 457–593. [Google Scholar] [CrossRef]
  88. Reckermann, M.; Omstedt, A.; Soomere, T.; Aigars, J.; Akhtar, N.; Bełdowska, M.; Bełdowski, J.; Cronin, T.; Czub, M.; Eero, M.; et al. Human impacts and their interactions in the Baltic Sea region. Earth Syst. Dyn. 2022, 13, 1–80. [Google Scholar] [CrossRef]
  89. Available online: https://helcom.fi/wp-content/uploads/2021/09/Baltic-Sea-Climate-Change-Fact-Sheet-2021.pdf (accessed on 10 May 2023).
  90. Rosendahl Appelquist, L.; Balstrøm, T.; Halsnæs, K. Main Manual-Coastal Hazard Wheel; United Nations Environment Programme & Lars Rosendahl Appelquist. 2016. Available online: https://www.coastalhazardwheel.org/ (accessed on 30 June 2023).
  91. Burda, I.; Nyka, L.; Borodziuk, A. Reshaping of Coastlines as the Beginning of Ur-ban Structures Changes in North Poland. IOP Conf. Ser. Mater. Sci. Eng. 2017, 245, 062038. [Google Scholar] [CrossRef] [Green Version]
  92. Alikhani, S.; Nummi, P.; Ojala, A. Urban Wetlands: A Review on Ecological and Cultural Values. Water 2021, 13, 3301. [Google Scholar] [CrossRef]
  93. Van Well, L.; Isayeva, A.; Axel Olsson, P.; Hollander, J. Public perceptions of cultural ecosystem services provided by beach nourishment and eelgrass restoration in southern Sweden. Nord. J. Bot. 2023, 2023, e03654. [Google Scholar] [CrossRef]
  94. Storm Water Management in the City of Helsinki. Platform BSR Water. Available online: https://www.bsrwater.eu/ (accessed on 10 May 2023).
  95. Pärnu Calls on Residents to Contribute to City’s Future Strategy. Available online: https://www.themayor.eu/en/a/view/p-rnu-calls-on-residents-to-contribute-to-city-s-future-strategy-2950 (accessed on 10 May 2023).
  96. StreamCity Vision Masterplan 2030. Zaha Hadid Architects. Available online: https://www.ts.ee/wp-content/uploads/2020/01/Tallinn-Masterplan_2030_Report_ENG_.pdf (accessed on 1 April 2023).
  97. Marcus, A.; Ikeda, M.; Jones, I.; Metcalf, T. Buoyant ecologies float lab: Optimized upside-down benthos for sea level rise adaptation. In Proceedings of the 38th Annual Conference of the Association for Computer Aided Design in Architecture (ACADIA), Mexico City, Mexico, 18–20 October 2018; pp. 414–423. [Google Scholar] [CrossRef]
  98. Di Giacomo, T.V.; Di Giacomo, P.F. Repository of Technical Documents for a Sustainable Management of Marine and Coastal Environments: The New Portal www.coastalmapping.eu. In Recent Advances in Environmental Science from the Euro-Mediterranean and Surrounding Regions (2nd Edition). EMCEI 2019. Environmental Science and Engineering; Ksibi, M., Ghorbal, A., Chakraborty, S., Chaminé, H.I., Barbieri, M., Guerriero, G., Hentati, O., Negm, A., Lehmann, A., Römbke, J., et al., Eds.; Springer: Cham, Switzerland, 2021; pp. 2161–2165. [Google Scholar] [CrossRef]
  99. Mitchell, M.; Bilkovic, D.M. Embracing dynamic design for climate-resilient living shorelines. J Appl Ecol. 2019, 56, 1099–1105. [Google Scholar] [CrossRef] [Green Version]
  100. Bilkovic, D.M.; Mitchell, M.M. Designing living shoreline salt marsh ecosystems to promote coastal resilience. In Living Shorelines: The Science and Management of Nature-Based Coastal Protection; Bilkovic, D.M., Mitchell, M.M., La Peyre, M.K., Toft, J.D., Eds.; CRC Press: Boca Raton, FL, USA, 2017; pp. 293–316. [Google Scholar] [CrossRef]
  101. Badach, J.; Szczepański, J.; Bonenberg, W.; Gębicki, J.; Nyka, L. Developing the Urban Blue-Green Infrastructure as a Tool for Urban Air Quality Management. Sustainability 2022, 14, 9688. [Google Scholar] [CrossRef]
  102. Andersson, E.; Langemeyer, J.; Borgström, S.; McPhearson, T.; Haase, D.; Kronenberg, J.; Barton, D.N.; Davis, M.; Naumann, S.; Röschel, L.; et al. Enabling Green and Blue Infrastructure to Improve Contributions to Human Well-Being and Equity in Urban Systems. BioScience 2019, 69, 566–574. Available online: https://www.ncbi.nlm.nih.gov/pmc/articles/PMC6622445/ (accessed on 2 May 2022). [CrossRef]
  103. van Herk, S.; Zevenbergen, C.; Rijke, J.; Ashley, R. Collaborative research. J. Flood Risk Manag. 2011, 4, 306–317. [Google Scholar] [CrossRef]
  104. Patrizzi, N.S.; Dobrovolski, R. Integrating climate change and human impacts into marine spatial planning: A case study of threatened starfish species in Brazil. Ocean. Coast. Manag. 2018, 161, 177–188. [Google Scholar] [CrossRef] [Green Version]
  105. Adams, V.M.; Álvarez-Romero, J.G.; Capon, S.J.; Crowley, G.M.; Dale, A.P.; Kennard, M.J.; Douglas, M.M.; Pressey, R.L. Making time for space: The critical role of spatial planning in adapting natural resource management to climate change. Environ. Sci. Policy 2017, 74, 57–67. [Google Scholar] [CrossRef]
  106. Bamunawala, J.; van der Spek, A.; Dastgheib, A.; Murray, A.B.; Ranasinghe, R. An Integrated, Probabilistic Modeling Approach to Assess the Evolution of Barrier-Island Systems over the Twenty-First Century. Front. Mar. Sci. 2021, 8, 755699. [Google Scholar] [CrossRef]
  107. Deng, J.; Woodroffe, C.D.; Rogers, K.; Harff, J. Morphogenetic modelling of coastal and estuarine evolution. Earth Sci. Rev. 2017, 171, 254–271. [Google Scholar] [CrossRef] [Green Version]
  108. A European Green Deal. Striving to Be the First Climate-Neutral Continent. Available online: https://commission.europa.eu/strategy-and-policy/priorities-2019-2024/european-green-deal_en (accessed on 1 April 2023).
  109. Starzyk, A.; Marchwiński, J.; Maciejewska, E.; Bujak, P.; Rybak-Niedziółka, K.; Grochulska-Salak, M.; Skutnik, Z. Resilience in Urban and Architectural Design—The Issue of Sustainable Development for Areas Associated with an Embankment. Sustainability 2023, 15, 9064. [Google Scholar] [CrossRef]
  110. Bergou, N.; Hammoud, R.; Smythe, M.; Gibbons, J.; Davidson, N.; Tognin, S.; Reeves, G.; Shepherd, J.; Mechelli, A. The mental health benefits of visiting canals and rivers: An ecological momentary assessment study. PLoS ONE 2022, 17, e0271306. [Google Scholar] [CrossRef] [PubMed]
  111. Cao, B.; Chen, Q.; Du, M.; Cheng, Q.; Li, Y.; Liu, R. Simulation Analysis of the Cooling Effect of Urban Water Bodies on the Local Thermal Environment. Water 2022, 14, 3091. [Google Scholar] [CrossRef]
  112. Yiannakou, A.; Salata, K.-D. Adaptation to Climate Change through Spatial Planning in Compact Urban Areas: A Case Study in the City of Thessaloniki. Sustainability 2017, 9, 271. [Google Scholar] [CrossRef] [Green Version]
  113. Georgiou, M.; Morison, G.; Smith, N.; Tieges, Z.; Chastin, S. Mechanisms of impact of blue spaces on human health: A systematic literature review and meta-analysis. Int. J. Environ. Res. Public Health 2021, 18, 2486. [Google Scholar] [CrossRef]
  114. Smith, N.; Georgiou, M.; King, A.C.; Tieges, Z.; Webb, S.; Chastin, S. Urban blue spaces and human health: A systematic review and meta-analysis of quantitative studies. Cities 2021, 119, 103413. [Google Scholar] [CrossRef]
  115. Smith, N.; Georgiou, M.; King, A.C.; Tieges, Z.; Chastin, S. Factors influencing usage of urban blue spaces: A systems-based approach to identify leverage points. Health Place 2022, 73, 102735. [Google Scholar] [CrossRef]
  116. Nowak, M.J.; Monteiro, R.; Olcina-Cantos, J.; Vagiona, D.G. Spatial Planning Response to the Challenges of Climate Change Adaptation: An Analysis of Selected Instruments and Good Practices in Europe. Sustainability 2023, 15, 10431. [Google Scholar] [CrossRef]
  117. Matusik, A.; Racoń-Leja, K.; Gyurkovich, M.; Dudzic-Gyurkovich, K. Hydrourban spatial development model for a resilient inner-city. The example of Gdańsk. ACE Archit. City Environ. 2020, 15, 1–21. [Google Scholar] [CrossRef]
  118. Breś, J.; Krośnicka, K.A. Evolution of Edges and Porosity of Urban Blue Spaces: A Case Study of Gdańsk. Urban Plan. 2021, 6, 90–104. Available online: https://www.cogitatiopress.com/urbanplanning/article/view/4108/4108 (accessed on 1 April 2023). [CrossRef]
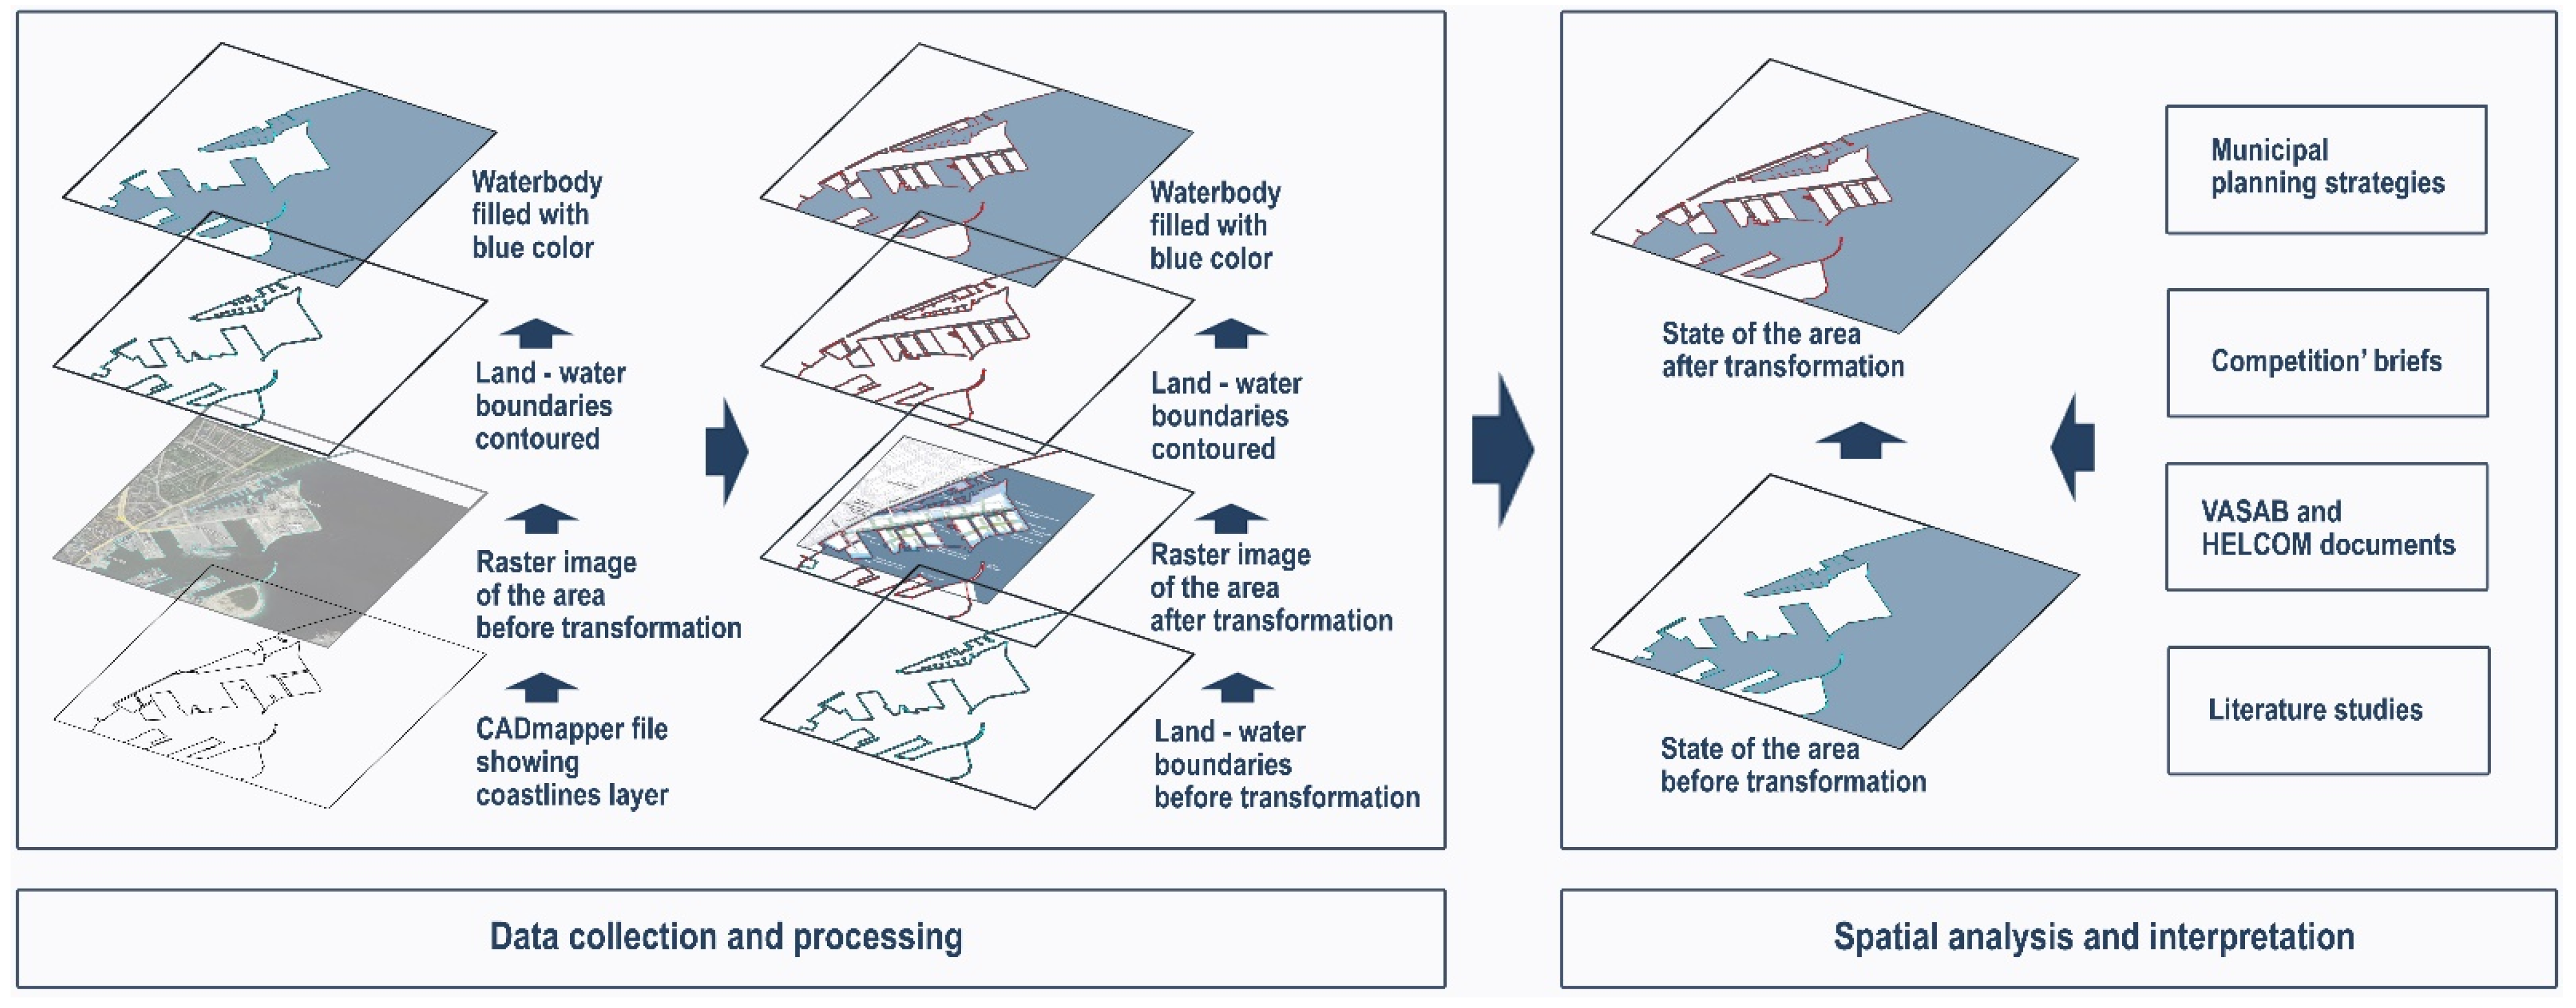
Figure 1. Flowchart of stages of data collection, spatial comparative studies, and interpretation.
Water 15 02826 g001
Figure 2. Scheme of the analysed cases’ locations in the Baltic Sea Region: the numbers in the figure correspond to the case numbers described in tables.
Water 15 02826 g002
Figure 3. Scheme of Transition Approach Idea for Urban Blue Spaces.
Water 15 02826 g003
Table 1. Main characteristics of case study cities.
Case No.CityLocationWaterbodyPopulation 1Population Density
(Population/km2)
Climate ZoneAverage Lowest and Highest Temperatures (in Winter and Summer)Annual Rainfall ApproximatelyTotal Area 1
(km2)
Transformation Area in Relation to the Total City Area (% of City Area) 2
1.TallinnEstoniaGulf of Finland439,6323.750humid continental−5–20 °C600–700 mm117.20.46
2.PärnuEstoniaPärnu River40,2281.214humid continental−6–22 °C600–700 mm33.10.13 (1.36)
3.CopenhagenDenmarkØresund Strait653,6647.407oceanic0–22 °C600–700 mm88.254.08
4.KøgeDenmarkKøge Bay38,3042.063temperate oceanic0–22 °C600–700 mm18.571.72
5.AarhusDenmarkAarhus Bay285,2732.900temperate oceanic0–22 °C700–800 mm98.41.12
6.HelsinkiFinlandGulf of Finland664,0283.099humid continental−5–to 20 °C600–700 mm2141.1
7.TurkuFinlandAura River283,305992.7humid continental−5–21 °C700–800 mm2850.12
8.StockholmSwedenLakes-Mälaren, Saltsjön; Canals; Straits-Lilla Värtan984,7485.260humid continental & oceanic−3–22 °C550–650 mm187.20.1 (1.26)
9.MalmöSwedenÖresund Strait357,3772.277oceanic0–22 °C600–700 mm156.91.19
10.LuleåSwedenGulf of Bothnia49,1231.727subarctic which borders on a humid continental−10–20 °C500–600 mm28.452.11
11.SundsvallSwedenGulf of Bothnia58,8131.419subarctic and humid continental−7–20 °C600–700 mm41.441
12.YstadSwedenBaltic Sea20,1951.838temperate oceanic0–20 °C600–700 mm11.02.73
1 Data: Eurostat [63], ec.europa.eu/eurostat/web/main/data/database; www.citypopulation.de (accessed on 10 May 2023). 2 According to the database described in Table 2.
Table 2. Main characteristics of case study sites.
Case No.Transformation
Site
Area
of the Site
Site Plan Before TransformationTransformation ResultsCase Data:
  • Author of the Project;
  • Transformation Timeline;
  • Transition Idea;
  • Shoreline Extension Solutions.
1.Tallin,
Old City Harbour
54 haWater 15 02826 i001Water 15 02826 i002
  • Zaha Hadid Architects;
  • 2016–2030+;
  • Long-term development plan that aims to create a vibrant, resilient, and sustainable waterfront;
  • The landfill with diversified line of the land–water boundary that enabled the formation of geometrically shaped bays/pools connected with marine waters, cut into the new land line, which can function as water squares; in addition, several rainwater catchment basins have been formed.
2.Pärnu,
Baltic Sea Art Park
4.2 (45)Water 15 02826 i003Water 15 02826 i004
  • WXCA;
  • 2013–ongoing;
  • Sustainable and climate-responsive solutions on the edge of the Pärnu River linking the city and the river;
  • Floating square as a public square on water with nine floating buildings linked with this square; new basin cut into the land.
3.Copenhagen, Nordhavn360Water 15 02826 i005Water 15 02826 i006
  • Cobe;
  • 2008–ongoing; under construction;
  • A resilient city; the blue city—surrounded and intersected by water;
  • Huge new land area in the form of interconnected new piers, islands, peninsulas, and water fields where floating objects can be located.
4.Køge,
Køge Coast
32Water 15 02826 i007Water 15 02826 i008
  • Vandkunsten; Køge Municipality;
  • 2010–2040; ongoing;
  • “Life before the city—a city for life”—activity should be promoted in the area even before the building works are started;
  • Formation of a barrier park resulted in the creation of the organically shaped water basin connected with marine waters through a narrowing; barrier park pathways and then floating decks lead to the floating pavilion.
5.Aarhus,
Aarhus Ø
110Water 15 02826 i009Water 15 02826 i010
  • Bjarke Ingels Group, GEHL Architects, CASA, MOE;
  • 1997–ongoing;
  • Sustainable and vibrant waterfront district;
  • The land–water boundary alteration: new canals cut into the land. This has led to the narrowing of the monolithic quay and changing large parts of it into a matrix of interconnected islands. Well-connected urban environment with streets along the lines of canals; meandering shape of the promenade; floating terrace structure with swimming pools.
6.Helsinki,
Ruoholahti, Länsisatama, Jätkäsaari
236Water 15 02826 i011Water 15 02826 i012
  • City of Helsinki; ALA Architects;
  • 2009–2025;
  • Interconnected, dynamic, and sustainable waterfront district;
  • Cutting the monolithic quay with new water lines and softening the water edges; public spaces by new canals, water squares, new island interconnected with the quay; new barrier island.
7.Turku,
Linnanniemi
35Water 15 02826 i013Water 15 02826 i014
  • Didorenko Evgeny;
  • Ongoing international competition;
  • “ARCHIPELAGO-GO-GROW”—A landscape led approach to placemaking;
  • Integrated system of rainwater collecting reservoirs and new organically shaped watercourses that cut into the existing quay. A group of mutually interconnected organically shaped floating islands that can be moved according to needs and planned events. They are equipped with saunas, some of them eco-urban farming, (public spaces: set of interconnected floating islands on a water bay, spaces along canals, organic wetlands, water square).
8.Stockholm,
Kolkajen-Ropsten, northern part of Stockholm Royal Seaport
18 (236)Water 15 02826 i015Water 15 02826 i016
  • ADEPT + Mandaworks;
  • 2015–ongoing;
  • New district that redefines Stockholm’s relationship to the water;
  • New landfill; organically shaped watercourse that cuts into the land with floating platform; a set of floating houses flanking the water boulevard; two elongated water basins as a core of new urban structure.
9.Malmö,
Västra Hamnen
187Water 15 02826 i017Water 15 02826 i018
  • Main architect and planner of the development project—Klas Tham; Turning Torso Santiago Caltrava;
  • 1997–2031; ongoing;
  • Sustainable and vibrant waterfront district;
  • Huge landfill with new canals that become new core of urban public spaces; embankment with elevated earth mound to protect the area from sudden storm surges.
10.Luleå,
Södra Hamnleden
60Water 15 02826 i019Water 15 02826 i020
  • MAF Arkitektkontor + Tengbom; Luleå kommun;
  • 2011–ongoing;
  • Promoting Urban Sustainability in the Arctic-Harbour City Living on the Edge;
  • Middle scale landfill with canals cutting into the quays; waterfront boulevard connected to the floating pier; newly shaped water basin with floating terraces.
11.Sundsvall,
Norra Kajen
41.5Water 15 02826 i021Water 15 02826 i022
  • White Arkitekter;
  • 2009–ongoing;
  • A natural continuation of Sundsvall’s stone city;
  • Breaking the unambiguity of the land–water demarcation line by introducing a series of water fields and canals cut into the land; introducing pedestrian links across the canals with floating architecture; integrating land–water line modifications composition with the stormwater retention project; solutions prepared for the landfall which is about 7–8 mm per year; in the planning, the starting point was at least 0.5 metres above the current high water level.
12.Ystad,
Ystad Hamn
30Water 15 02826 i023Water 15 02826 i024
  • Nyréns arkitektkontor; Sweco; Fernando Camino; Ystads kommun;
  • 2016–ongoing;
  • SYMBIOSIS—“The City and the sea as two living organisms”;
  • The diversification of the land–water line with new water pools that cut the existing quay; introduction of floating terrace on newly created water square and geometrically arranged islands; strengthening the embankment; elevating the transformation site with area located outside the plan area.
Table 3. Results of case study sites analyses. Morphology of UBS and flood protection measures.
Case No.Site Plan Details of UBSTransformation Results
Forms of UBSFlood Protection Measures
1.Water 15 02826 i025
  • Water squares;
  • Leisure pools;
  • Landmark promenade.
  • Pedestrian elevated promenade;
  • Barrier park.
2.Water 15 02826 i026
  • Floating square moored to the riverbank;
  • Water square;
  • Floating buildings;
  • Flood-resistant floating square;
  • Quay strengthening.
3.Water 15 02826 i027
  • Water squares;
  • Floating buildings;
  • Pedestrian walkways on the water edge;
  • Waterfront parks.
  • Flood barriers: barrier park;
  • Flexible solutions for water edges;
  • Extension of the water edges.
4.Water 15 02826 i028
  • Boulevard on the water edge;
  • Floating building;
  • Waterfront park;
  • Breakwaters easily accessible to all.
  • Barrier recreational area;
  • Breakwaters.
5.Water 15 02826 i029
  • Water street;
  • Pedestrian walkways on the water edge;
  • Leisure pools;
  • Public spaces: canal streets, bridges, floating public space.
  • Elevated embankments;
  • Floating public space.
6.Water 15 02826 i030
  • Water square;
  • Water street;
  • Artificial island;
  • Extension of resilient public spaces on the water edges.
  • Quay extension;
  • Existing quay strengthening;
  • New canals integrated with storm water management.
7.Water 15 02826 i031
  • Water streets;
  • Water square;
  • Artificial floating islands.
  • Floating public space;
  • Barrier park.
8.Water 15 02826 i032
  • Water street;
  • Floating square;
  • Floating buildings;
  • Jetties.
  • Floating structures;
  • Permeable materials;
  • Stormwater management solutions.
9.Water 15 02826 i033
  • Water street;
  • New, extended form of reinforced quay.
  • Embankment with elevated earth mound;
  • Stormwater management solutions.
10.Water 15 02826 i034
  • Water street;
  • Floating piers;
  • Breakwaters integrated with public space network.
  • Quay extension;
  • Breakwaters and floating piers;
  • Stormwater management solutions.
11.Water 15 02826 i035
  • Water square;
  • Floating public space.
  • Floating structures and public space;
  • Stormwater management solutions.
12.Water 15 02826 i036
  • Water street;
  • Floating buildings;
  • Water square with accentuated islands.
  • Reinforcement of the quayside;
  • Elevated embankments and development area;
  • Floating structures.
Disclaimer/Publisher’s Note: The statements, opinions and data contained in all publications are solely those of the individual author(s) and contributor(s) and not of MDPI and/or the editor(s). MDPI and/or the editor(s) disclaim responsibility for any injury to people or property resulting from any ideas, methods, instructions or products referred to in the content.