
A Review on Chlorination of Harvested Rainwater


Abstract
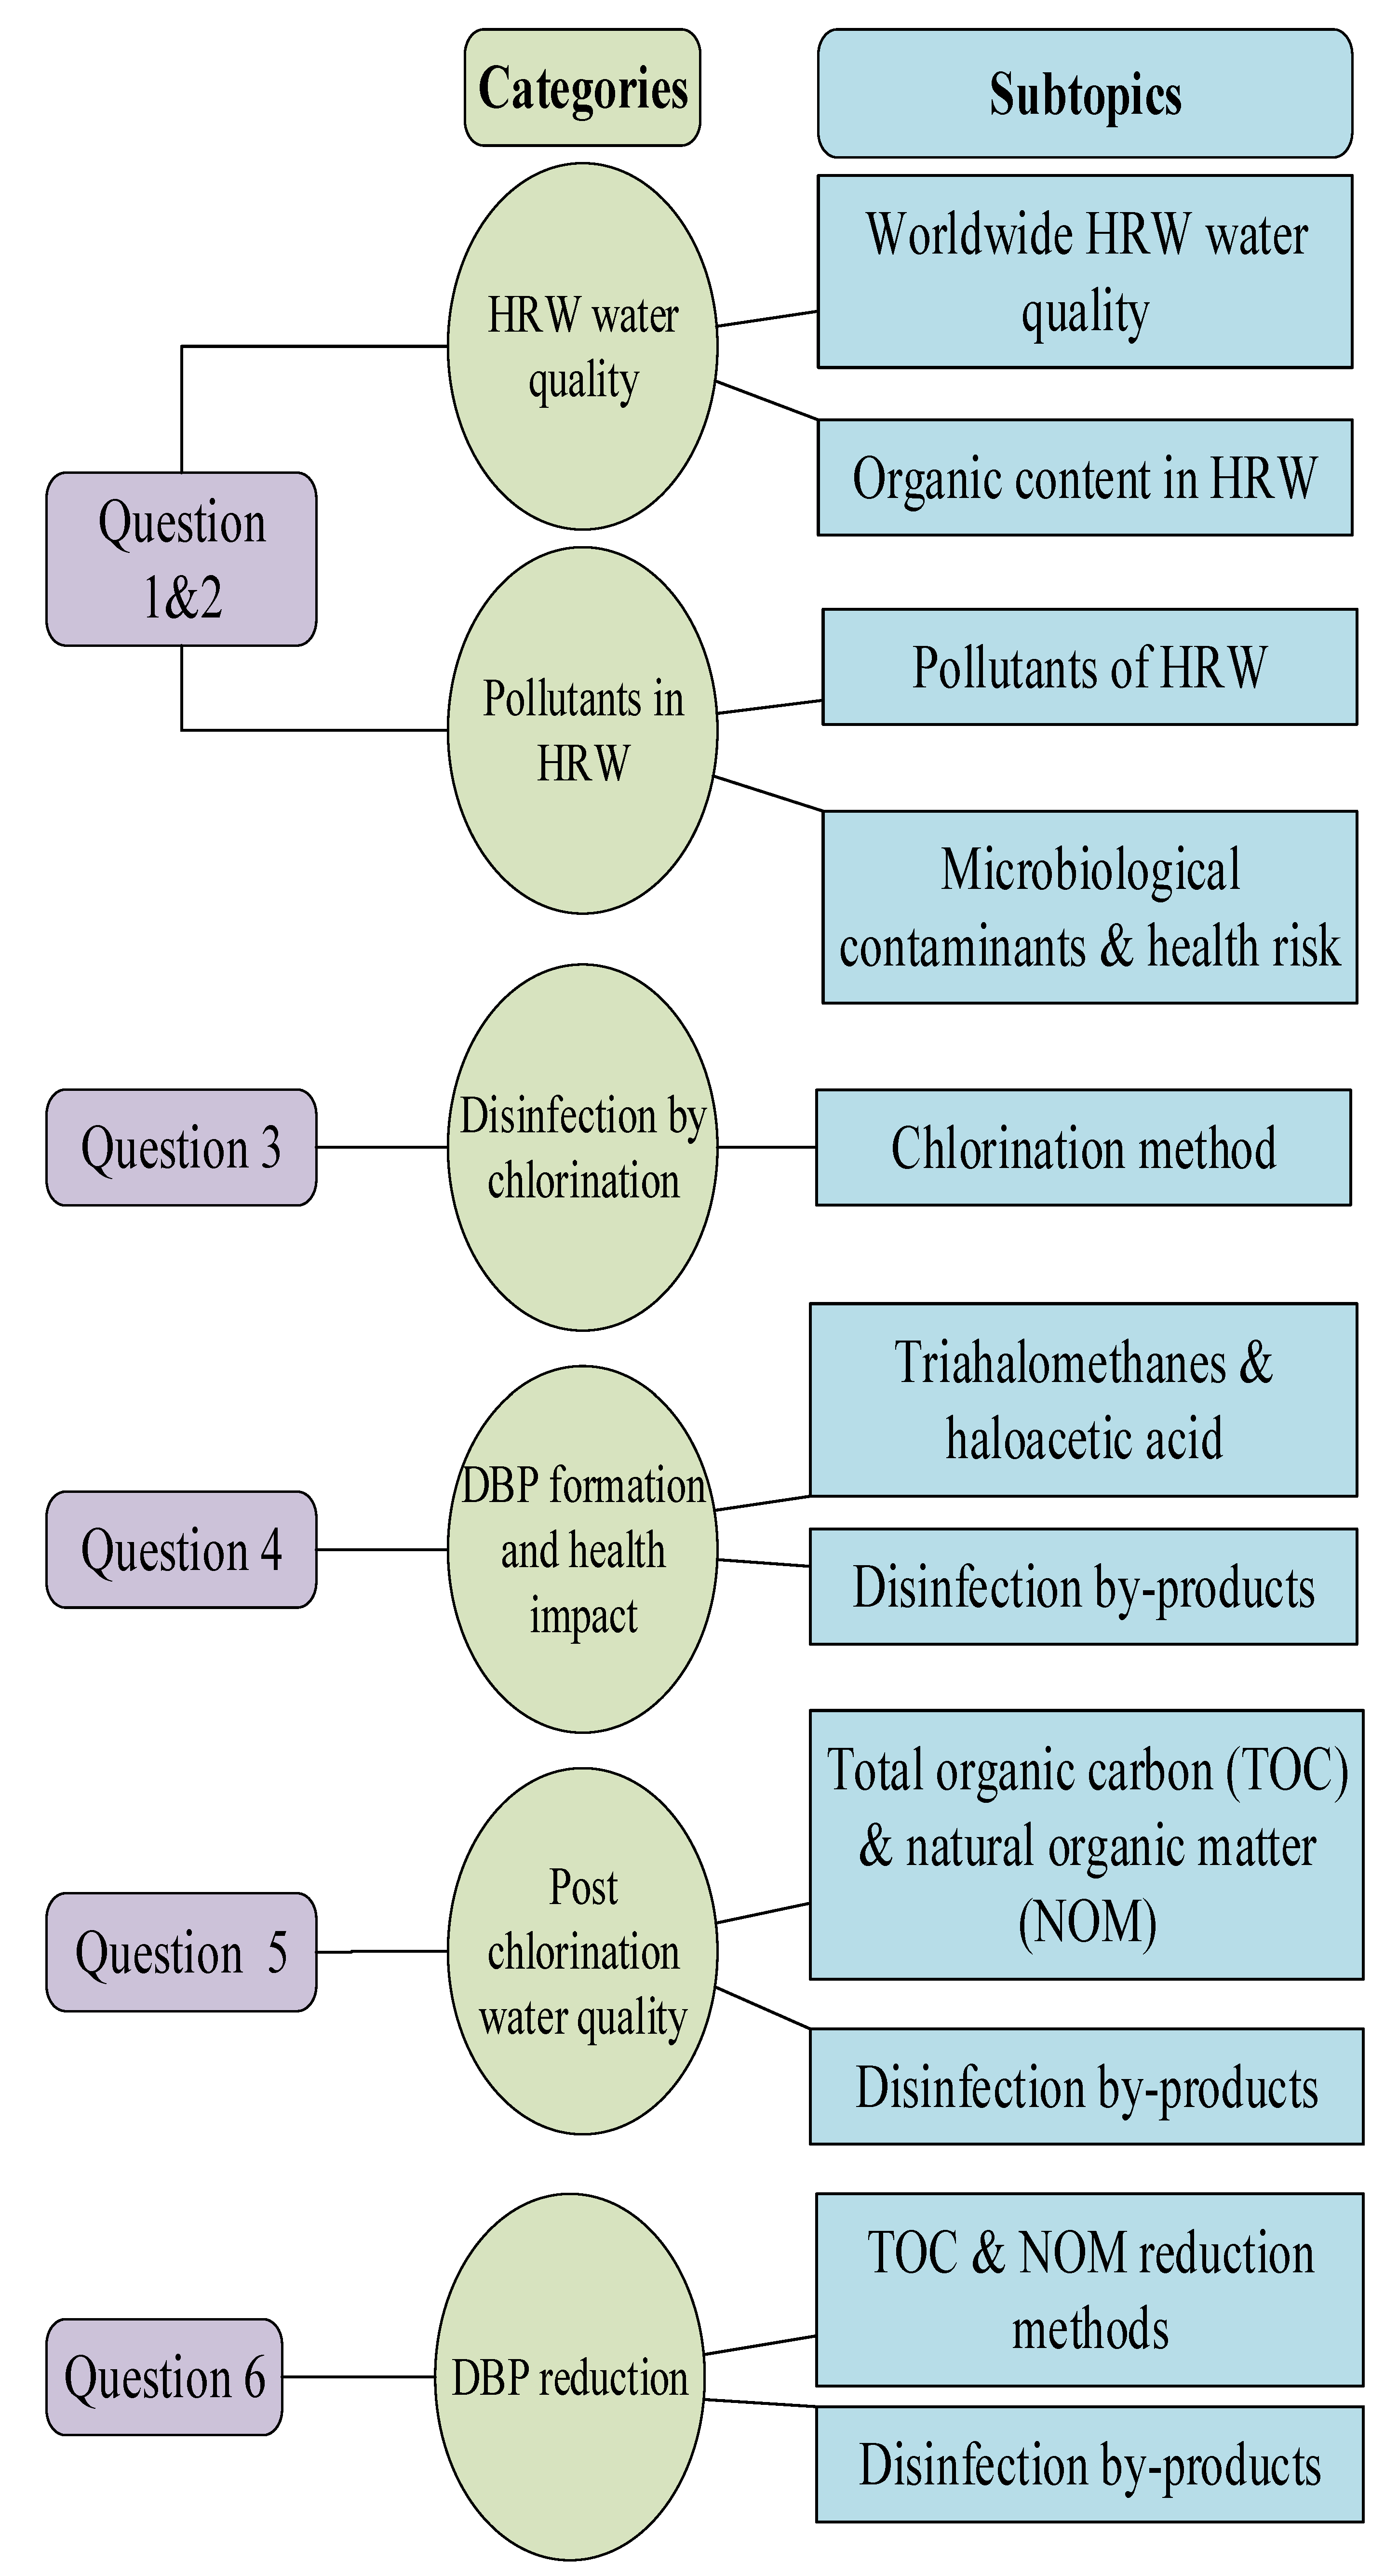
:1. Introduction
- Common organic pollutants in HRW;
- DBPs formation in chlorinated water;
- Health impacts of consuming water with DBPs and
- Possible ways of minimising formation of DBPs in HRW.
2. Methodology
- Why does HRW need disinfection for drinking?
- Can hypochlorite solution be considered for disinfecting HRW, and if so, what are its limitations?
- How can DBPs be reduced after chlorination?
- What is the possibility of formation of DBPs in HRW and what are the health repercussions if HRW is disinfected by hypochlorite solution?
- What are the acceptable limits of the DBPs found in the HRW as per drinking water guidelines?
- How can DBPs be reduced in HRW?
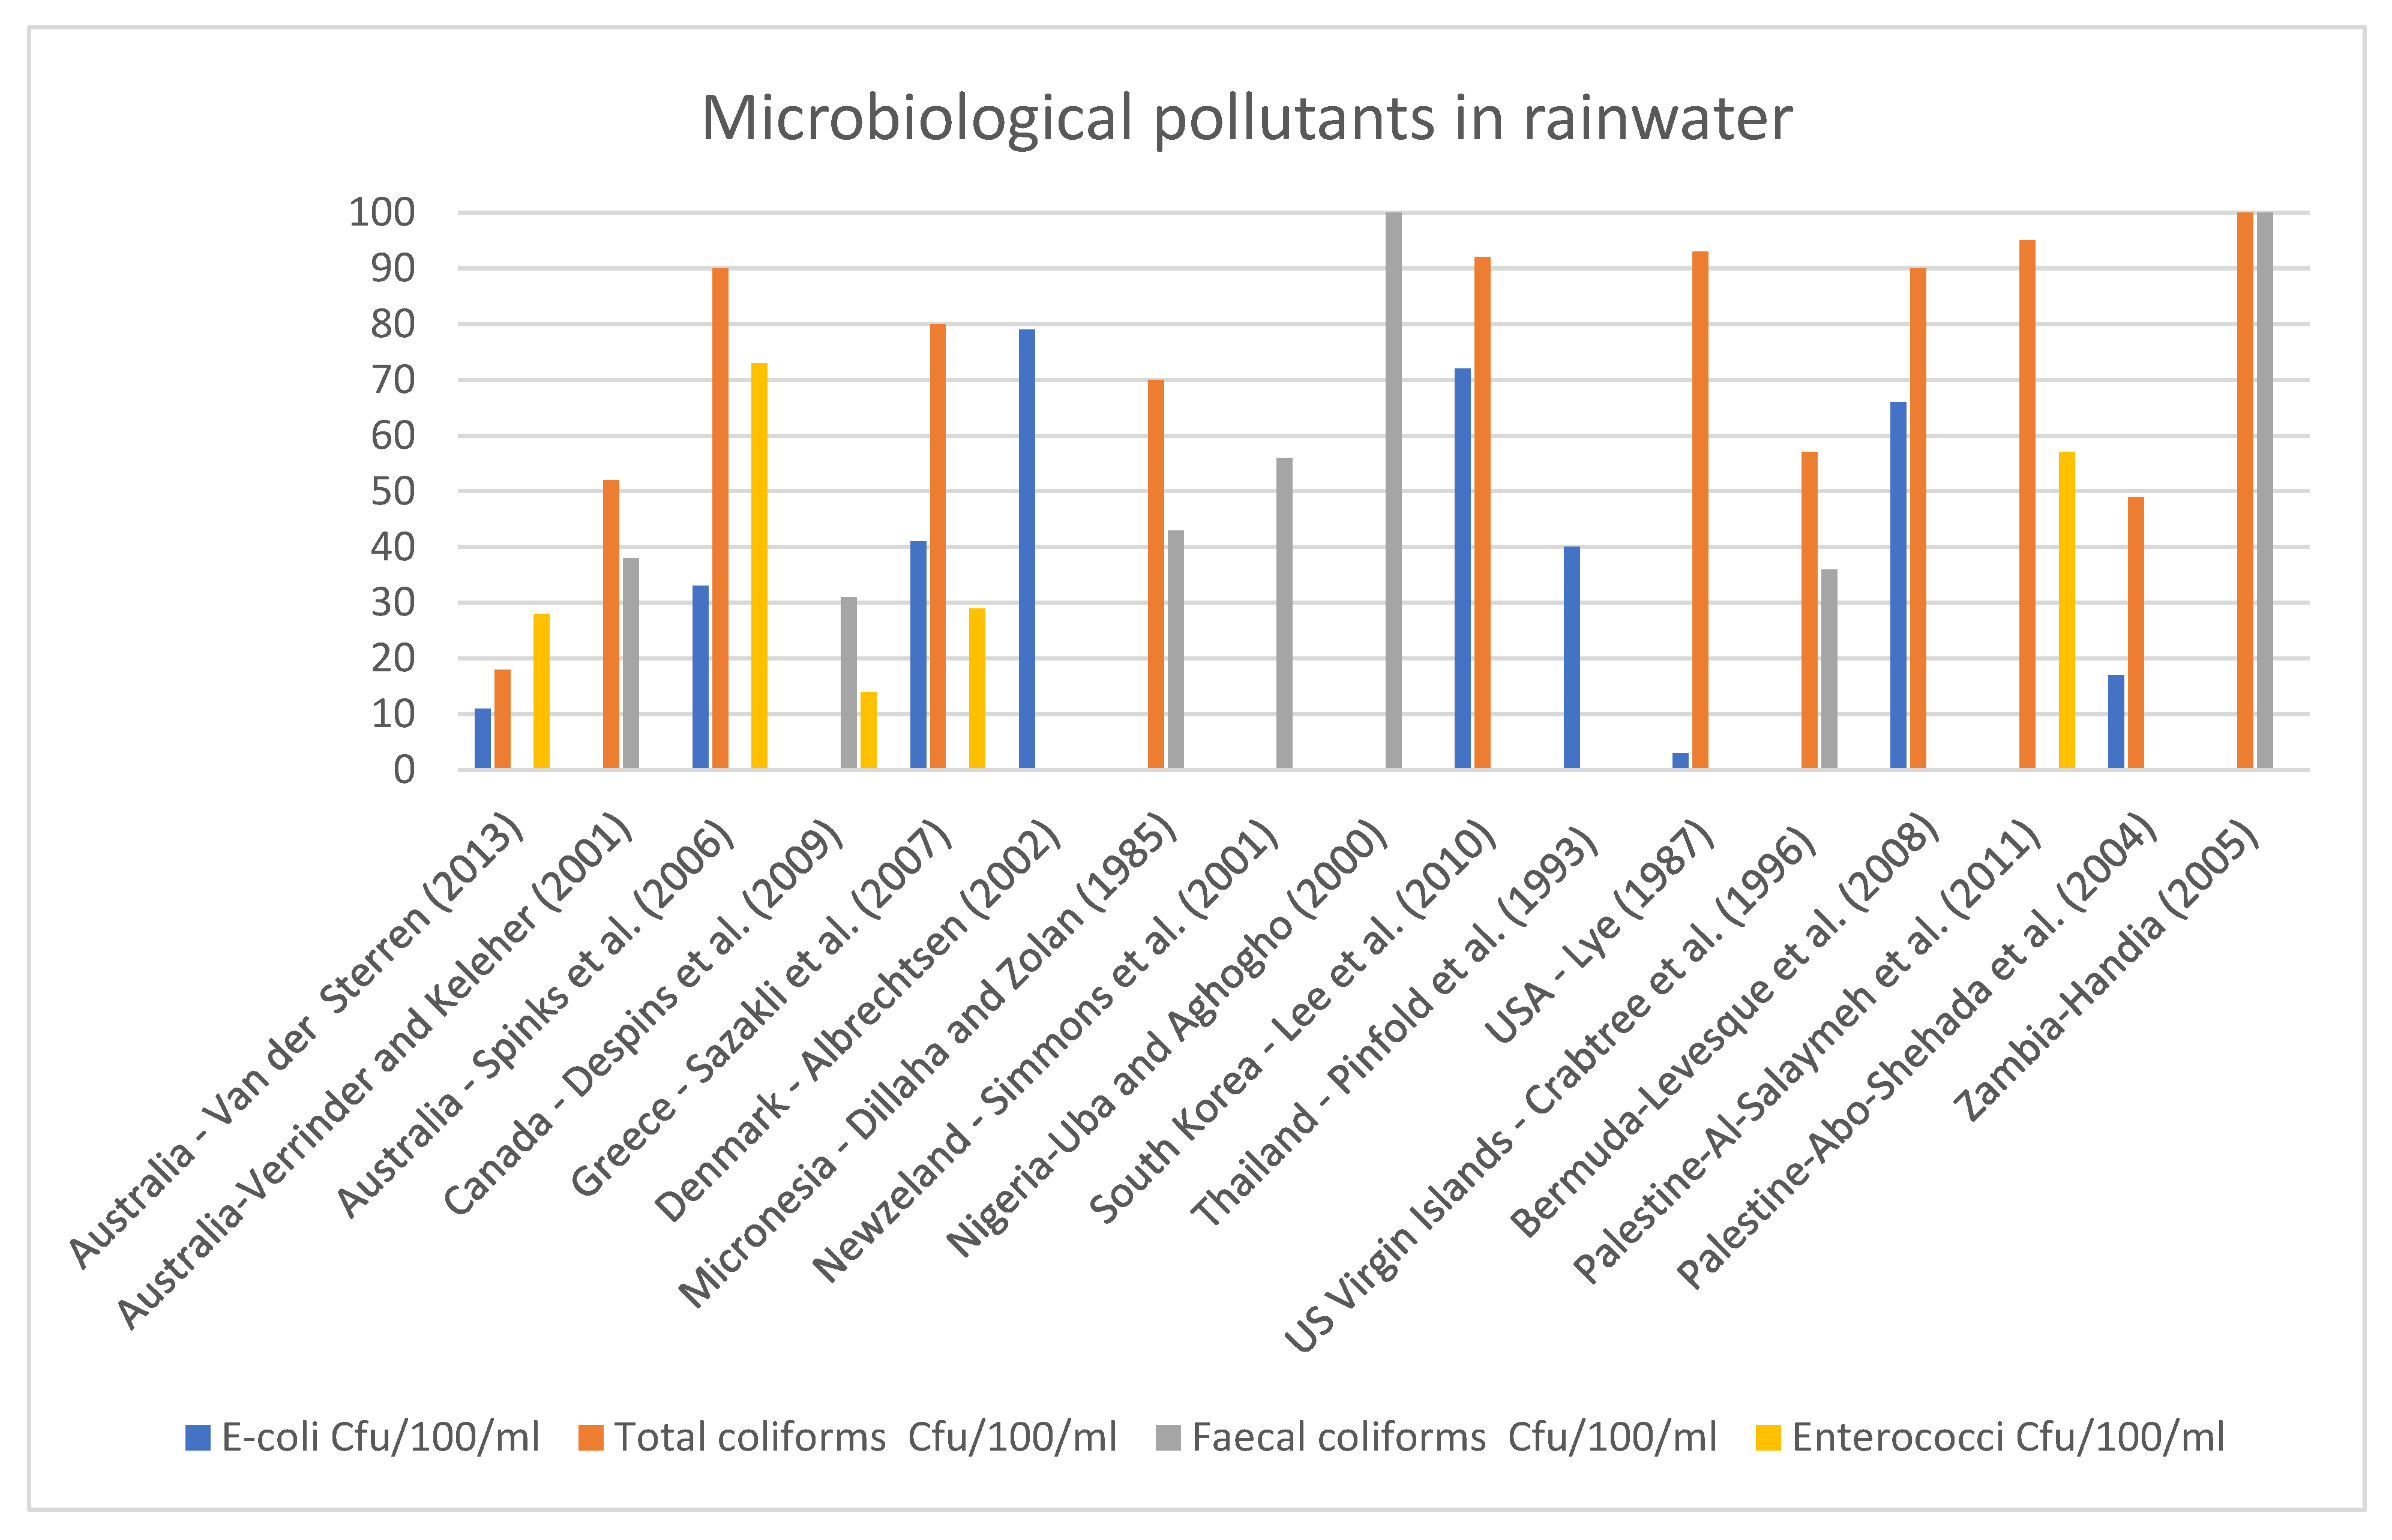
3. Water Quality of Harvested Rainwater (HRW): Secondary Data Analysis of Microbiological Contaminants
4. Opportunities for Hypochlorite Solution to Disinfect HRW
5. Chlorination for Disinfection
6. Impurities Impacting Chlorination
7. Water Quality Meta-Analysis after Chlorination
8. Disinfection Byproduct and Health Concerns
9. DBP Reduction by Pretreatment before Chlorination of Water
9.1. Coagulation
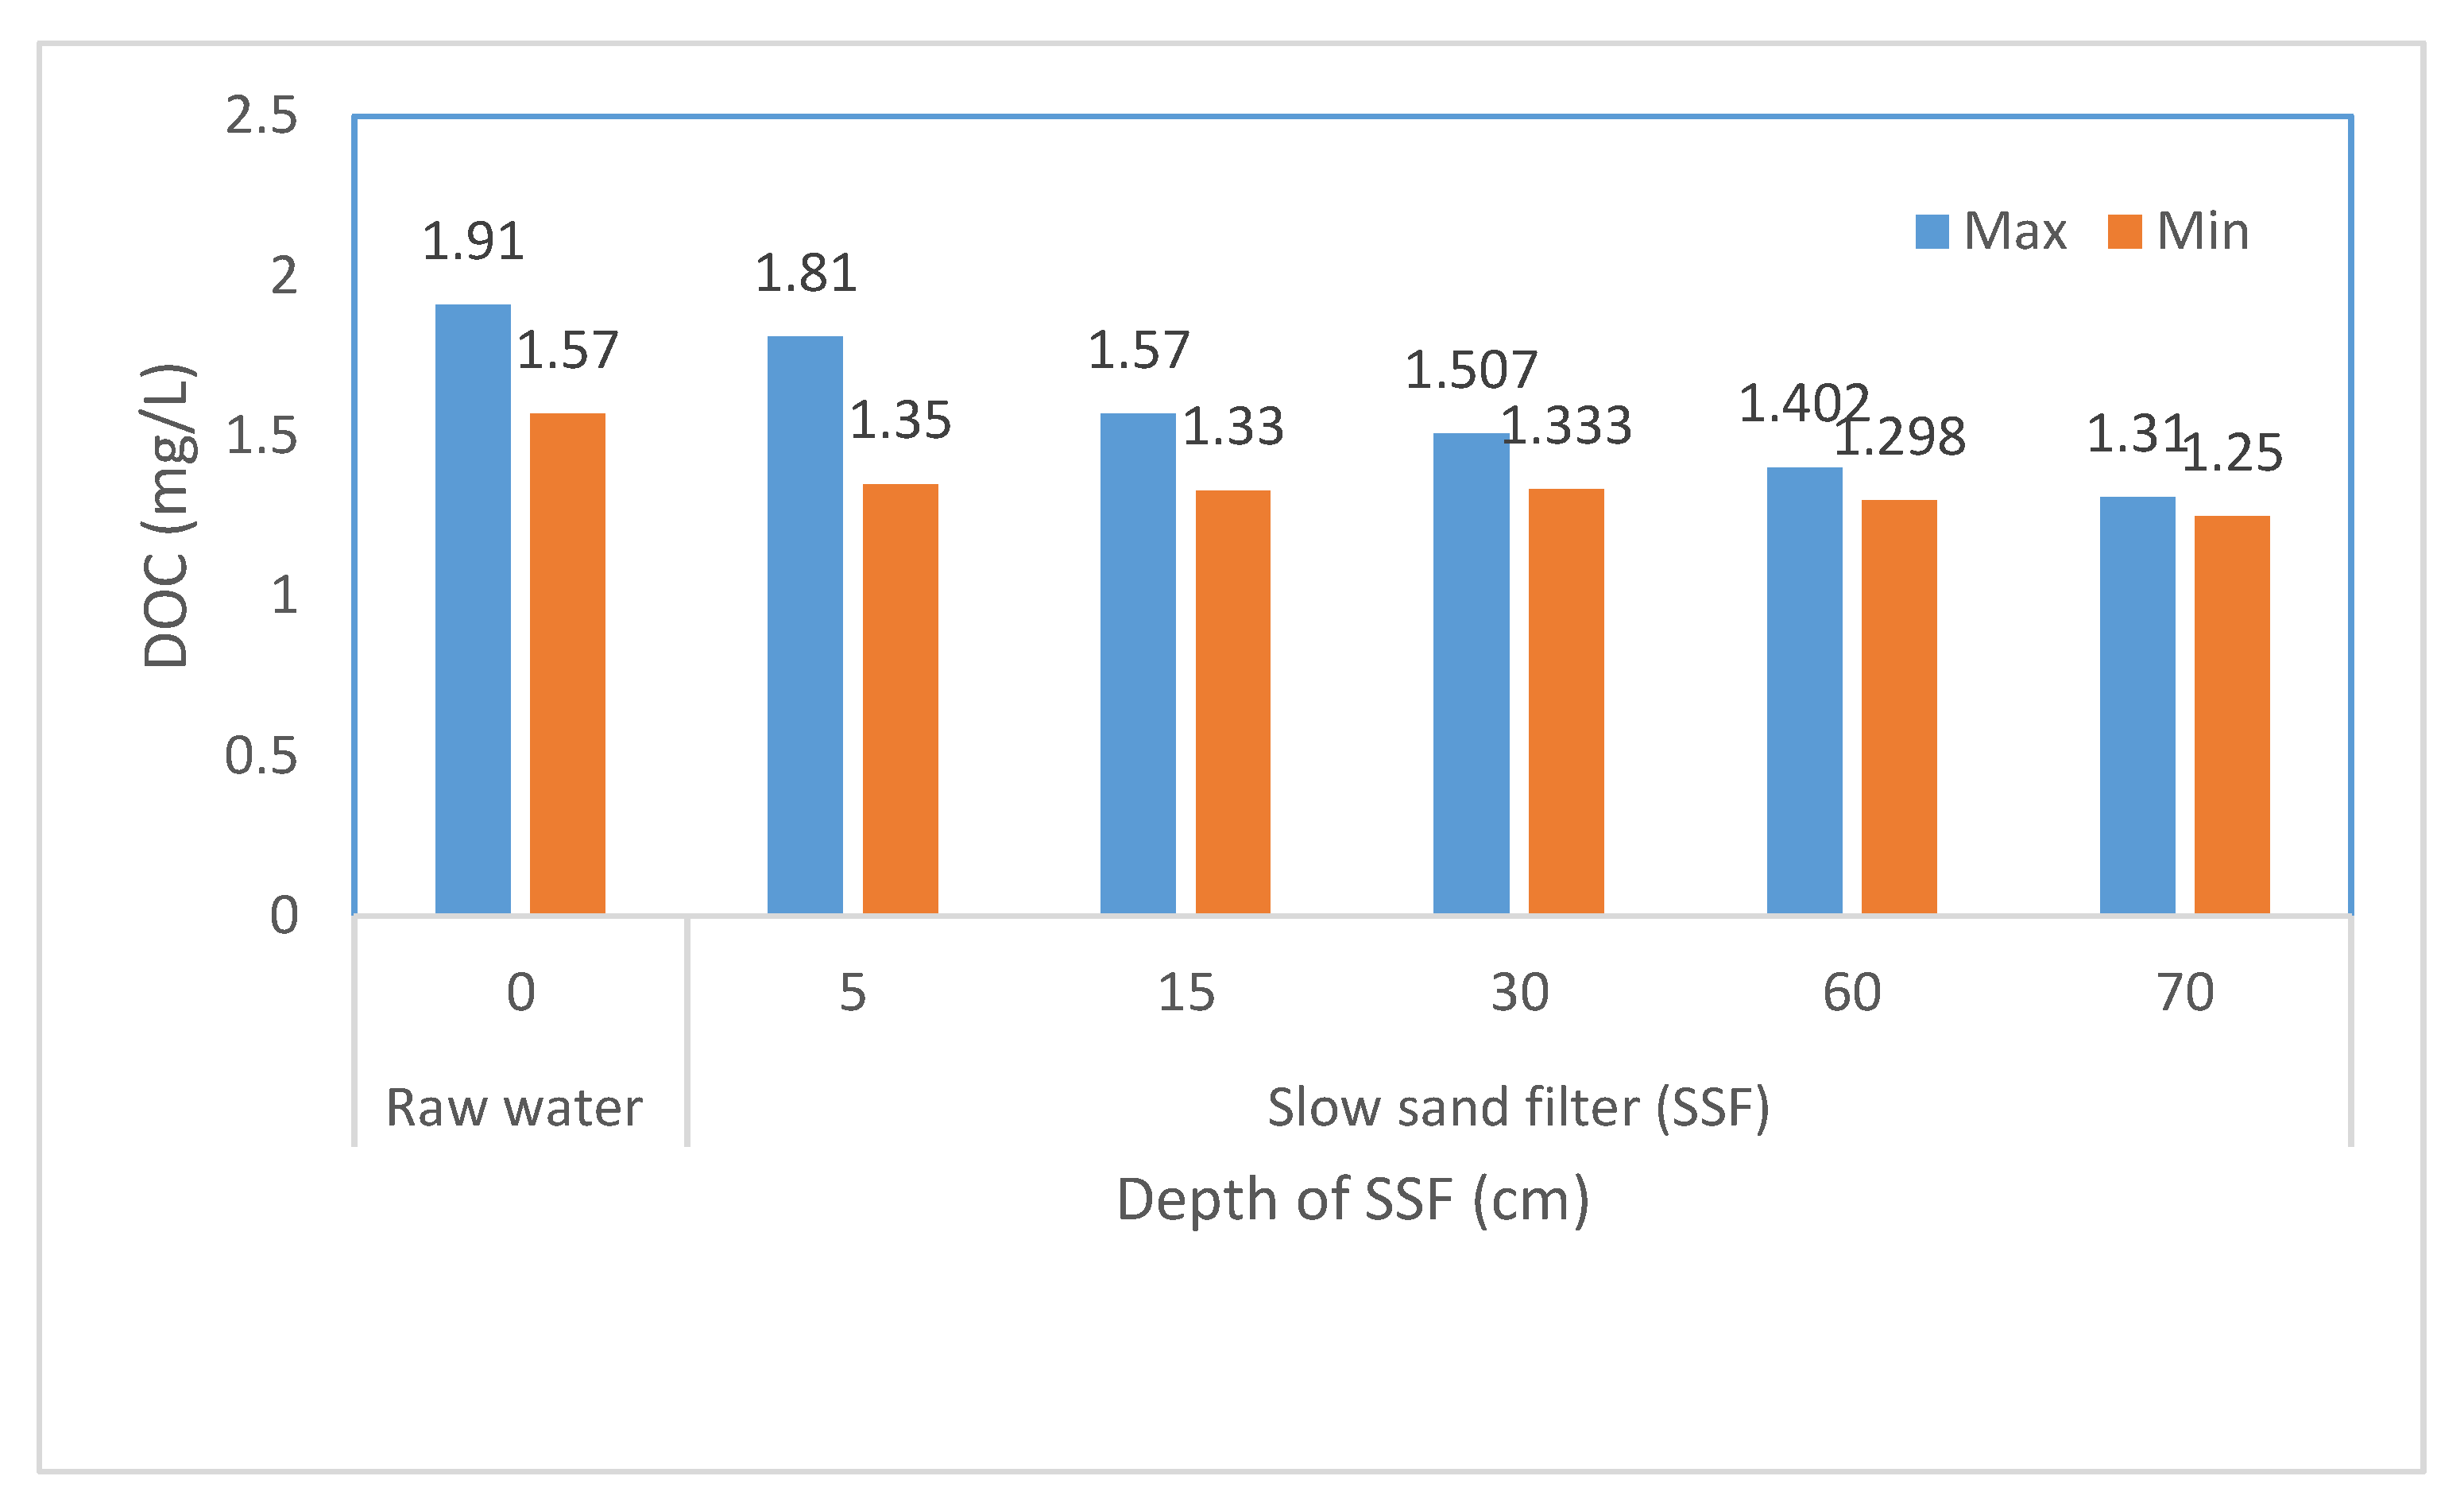
9.2. Filtration
10. Suitability of HRW Treatment on a Small Scale
11. Discussion
11.1. Challenges with HRW Disinfection and How Hypochlorite Can Resolve It
- Mains water is available to a large number of consumers who live in cities and they have little concern to treat HRW.
- As many HRW consumers are from impoverished areas, the treatment is not affordable to them.
- People suffering from water scarcity and contamination accept untreated HRW as they may not have any other options.
- Some consumers put taste priority over health impacts caused by germs. In addition, some people have little awareness and education about water contaminants and their health impacts.
- The poor investment return.
- Lack of data on organic content in HRW to develop design criteria.
11.2. Potential Challenges with HRW Disinfection by Hypochlorite and Possible Solution
11.3. Analysis of DBPs Formation in HRW by Comparison with Other Raw Water and WHO-Acceptable Limits
11.4. DBP Reduction through Pre-Treatment
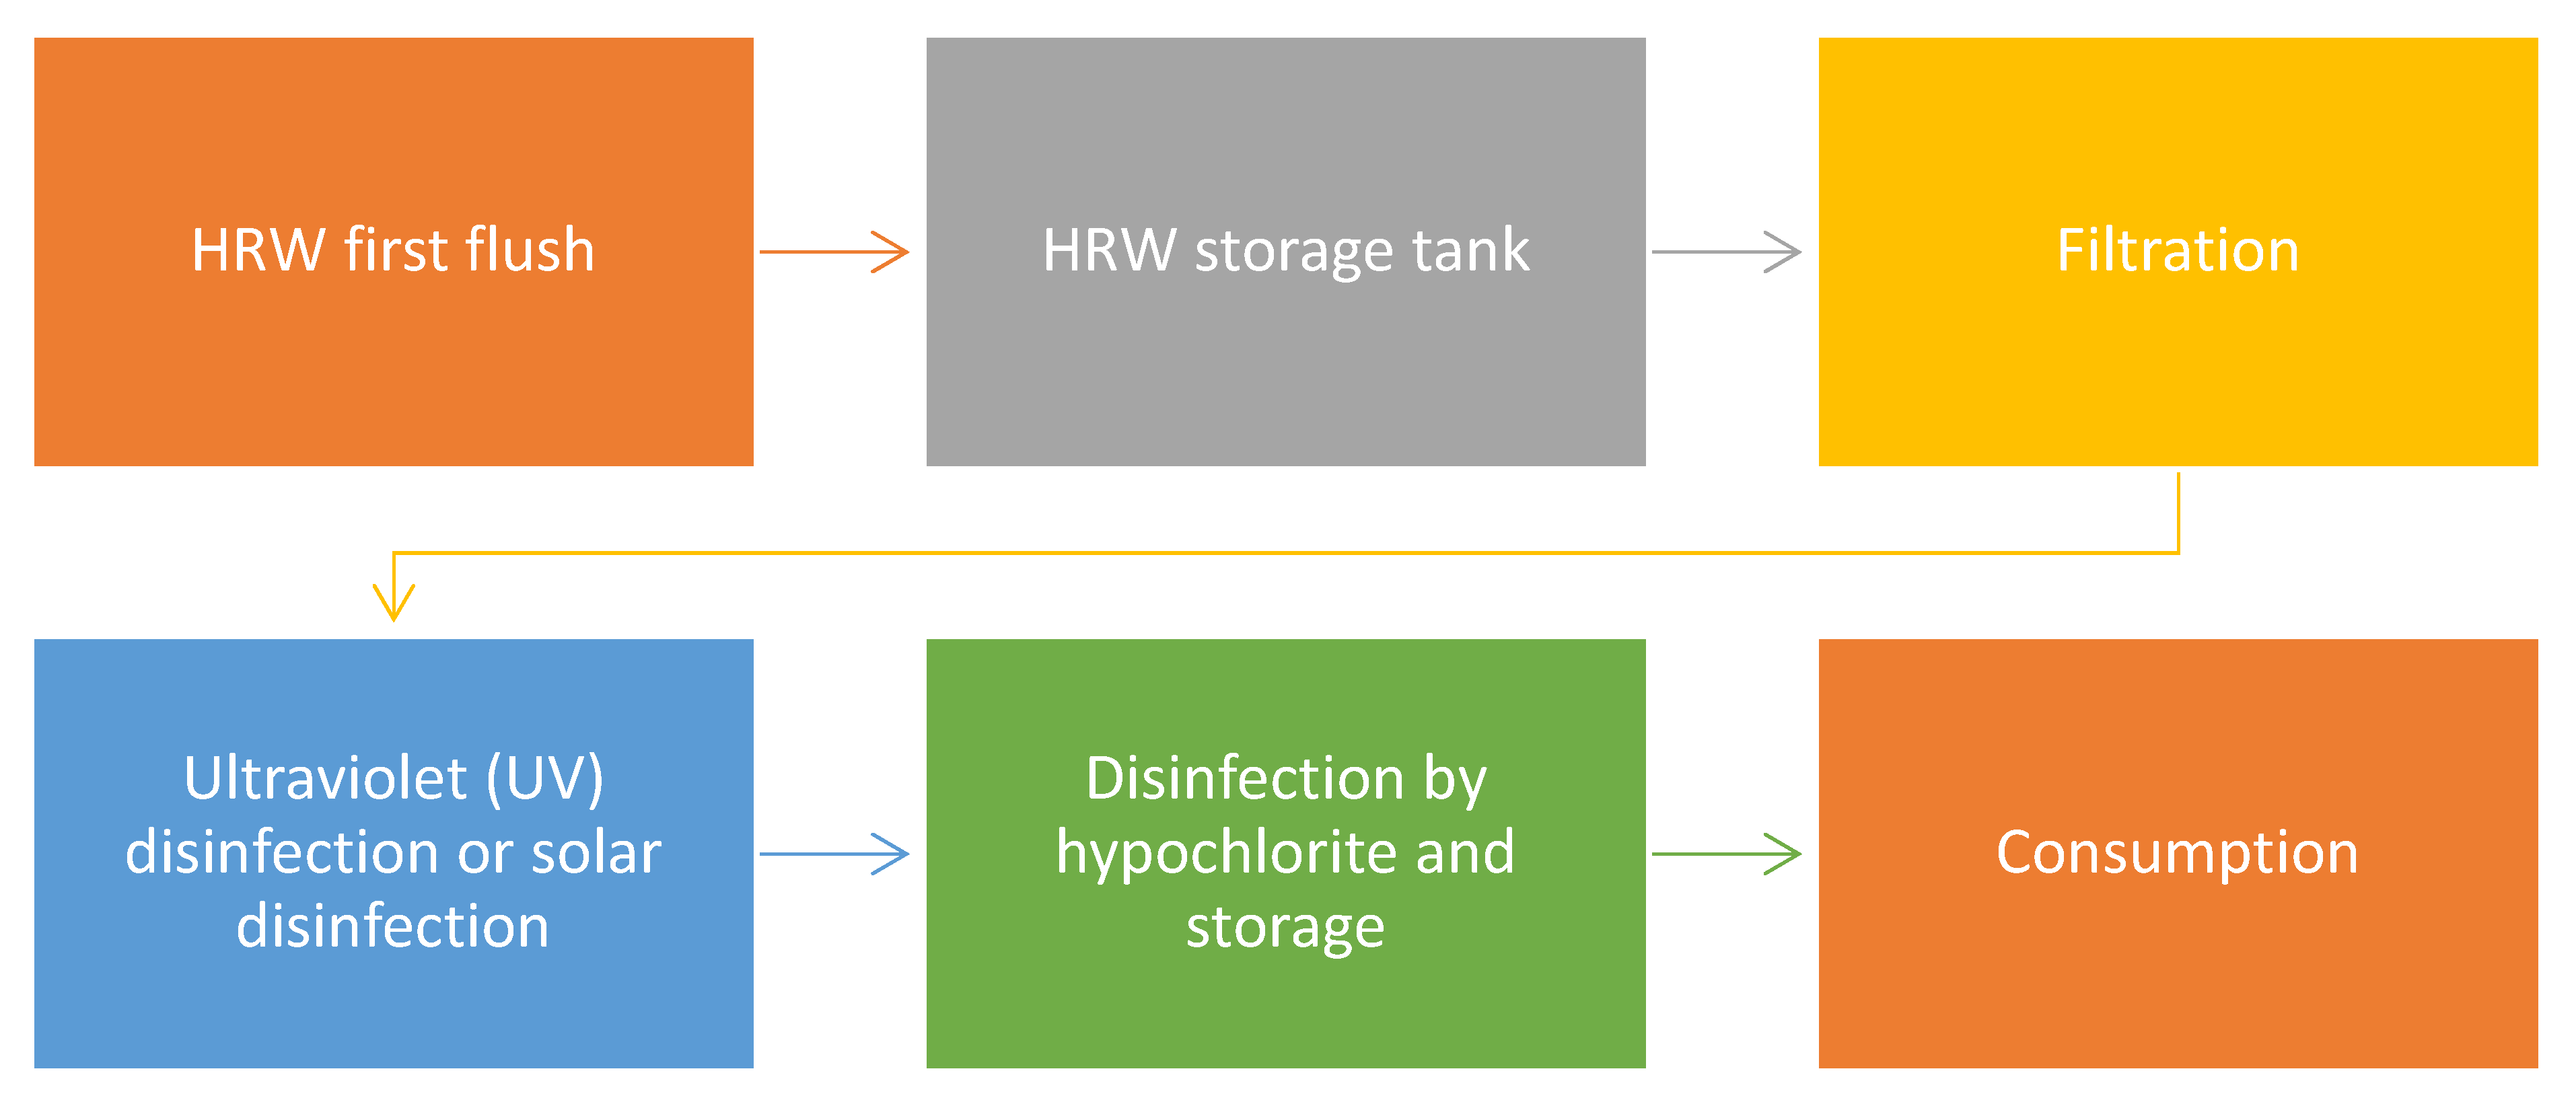
- Storing sodium hypochlorite and mixing it safely before dosing;
- Reduction of odour and improving taste and
- Removing Cryptosporidium parvum oocysts and Giardia lamblia cysts.
12. Further Research Opportunities
12.1. Insufficient Data on TOC from HRW
12.2. Develop an Independent Sustainable Automated Treatment Method
12.3. Insufficient Data on Chlorine DBPs in HRW
12.4. Outlining a Good HRW Treatment Strategy
13. Conclusions
Author Contributions
Funding
Data Availability Statement
Conflicts of Interest
References
- Wang, Q.; Yang, Z. Industrial water pollution, water environment treatment, and health risks in China. Environ. Pollut. 2016, 218, 358–365. [Google Scholar] [CrossRef] [PubMed]
- UNEP. A Snapshot of the World’s Water Quality: Towards a Global Assessment; United Nations Environment Programme: Nairobi, Kenya, 2016. [Google Scholar]
- Miao, Y.; Fan, C.; Guo, J. China’s water environmental problems and improvement measures. Environ. Resour. Econ. 2012, 3, 43–44. [Google Scholar]
- Ahmed, G.; Anawar, H.; Takuwa, D.; Chibua, I.; Singh, G.; Sichilongo, K. Environmental assessment of fate, transport and persistent behavior of dichlorodiphenyltrichloroethanes and hexachlorocyclohexanes in land and water ecosystems. Int. J. Environ. Sci. Technol. 2015, 12, 2741–2756. [Google Scholar] [CrossRef] [Green Version]
- Haritash, A.; Kaushik, C.P.; Kaushik, A.; Kansal, A.; Yadav, A.K. Suitability assessment of groundwater for drinking, irrigation and industrial use in some North Indian villages. Environ. Monit. Assess. 2008, 145, 397–406. [Google Scholar] [CrossRef]
- Schipper, P.; Vissers, M.; van der Linden, A.A. Pesticides in groundwater and drinking water wells: Overview of the situation in the Netherlands. Water Sci. Technol. 2008, 57, 1277–1286. [Google Scholar] [CrossRef]
- Lu, Y.; Song, S.; Wang, R.; Liu, Z.; Meng, J.; Sweetman, A.J.; Jenkins, A.; Ferrier, R.C.; Li, H.; Luo, W. Impacts of soil and water pollution on food safety and health risks in China. Environ. Int. 2015, 77, 5–15. [Google Scholar] [CrossRef] [Green Version]
- Lin, N.-F.; Tang, J.; Ismael, H.S.M. Study on environmental etiology of high incidence areas of liver cancer in China. World J. Gastroenterol. 2000, 6, 572. [Google Scholar]
- Ebenstein, A. The consequences of industrialization: Evidence from water pollution and digestive cancers in China. Rev. Econ. Stat. 2012, 94, 186–201. [Google Scholar] [CrossRef] [Green Version]
- Rainbow, J.; Sedlackova, E.; Jiang, S.; Maxted, G.; Moschou, D.; Richtera, L.; Estrela, P. Integrated electrochemical biosensors for detection of waterborne pathogens in low-resource settings. Biosensors 2020, 10, 36. [Google Scholar] [CrossRef] [PubMed] [Green Version]
- World Bank. Pakistan Strategic country Environmental Assessment; Main Report. Report 2006. Available online: https://elibrary.worldbank.org/doi/abs/10.1596/33928 (accessed on 17 July 2023).
- Cutler, D.; Miller, G. The role of public health improvements in health advances: The twentieth-century United States. Demography 2005, 42, 1–22. [Google Scholar] [CrossRef]
- Jalan, J.; Ravallion, M. Does piped water improve child health for poor families in rural India? J. Econom. 2003, 112, 153–173. [Google Scholar] [CrossRef] [Green Version]
- Jayaswal, K.; Sahu, V.; Gurjar, B. Water pollution, human health and remediation. In Water Remediation; Springer: Berlin/Heidelberg, Germany, 2018; pp. 11–27. [Google Scholar]
- Nasser Fava, N.d.M.; Terin, U.C.; Freitas, B.L.S.; Sabogal-Paz, L.P.; Fernandez-Ibañez, P.; Anthony Byrne, J. Household slow sand filters in continuous and intermittent flows and their efficiency in microorganism’s removal from river water. Environ. Technol. 2022, 43, 1583–1592. [Google Scholar] [PubMed]
- Alim, M.A.; Rahman, A.; Tao, Z.; Samali, B.; Khan, M.M.; Shirin, S. Suitability of roof harvested rainwater for potential potable water production: A scoping review. J. Clean. Prod. 2020, 248, 119226. [Google Scholar] [CrossRef]
- Campisano, A.; Butler, D.; Ward, S.; Burns, M.J.; Friedler, E.; DeBusk, K.; Fisher-Jeffes, L.N.; Ghisi, E.; Rahman, A.; Furumai, H. Urban rainwater harvesting systems: Research, implementation and future perspectives. Water Res. 2017, 115, 195–209. [Google Scholar] [CrossRef] [PubMed]
- Cook, S.; Sharma, A.; Chong, M. Performance analysis of a communal residential rainwater system for potable supply: A case study in Brisbane, Australia. Water Resour. Manag. 2013, 27, 4865–4876. [Google Scholar] [CrossRef]
- Gurung, T.R.; Sharma, A. Communal rainwater tank systems design and economies of scale. J. Clean. Prod. 2014, 67, 26–36. [Google Scholar] [CrossRef] [Green Version]
- Chubaka, C.E.; Ross, K.E.; Edwards, J.W. Rainwater for drinking water: A study of household attitudes. WIT Trans. Ecol. Environ. 2017, 216, 299–311. [Google Scholar]
- World Health Organization, Division of Operational Support in Environmental, Health. Guidelines for Drinking-Water Quality. Vol. 2, Health Criteria and Other Supporting Information: Addendum; World Health Organization: Geneva, Switzerland, 1998. [Google Scholar]
- Latif, S.; Alim, M.A.; Rahman, A. Disinfection methods for domestic rainwater harvesting systems: A scoping review. J. Water Process Eng. 2022, 46, 102542. [Google Scholar] [CrossRef]
- Ahmed, W.; Hodgers, L.; Sidhu, J.P.; Toze, S. Fecal indicators and zoonotic pathogens in household drinking water taps fed from rainwater tanks in Southeast Queensland, Australia. Appl. Environ. Microbiol. 2012, 78, 219–226. [Google Scholar] [CrossRef] [Green Version]
- Thomas, R.B.; Kirisits, M.J.; Lye, D.J.; Kinney, K.A. Rainwater harvesting in the United States: A survey of common system practices. J. Clean. Prod. 2014, 75, 166–173. [Google Scholar] [CrossRef]
- Morrow, A.C.; Dunstan, R.H.; Coombes, P.J. Elemental composition at different points of the rainwater harvesting system. Sci. Total Environ. 2010, 408, 4542–4548. [Google Scholar] [CrossRef] [PubMed]
- Zdeb, M.; Papciak, D.; Zamorska, J. An assessment of the quality and use of rainwater as the basis for sustainable water management in suburban areas. E3S Web Conf. 2018, 45, 00111. [Google Scholar] [CrossRef] [Green Version]
- Brown, J.; Sobsey, M.D. Microbiological effectiveness of locally produced ceramic filters for drinking water treatment in Cambodia. J. Water Health 2010, 8, 1–10. [Google Scholar] [CrossRef] [PubMed] [Green Version]
- Lantagne, D.S.; Quick, R.; Mintz, E.D. Household water treatment and safe: Storage options in developing countries. Navig 2006, 99, 17–38. [Google Scholar]
- Burch, J.D.; Thomas, K.E. Water disinfection for developing countries and potential for solar thermal pasteurization. Sol. Energy 1998, 64, 87–97. [Google Scholar] [CrossRef]
- Van Halem, D.; Van der Laan, H.; Heijman, S.; Van Dijk, J.; Amy, G. Assessing the sustainability of the silver-impregnated ceramic pot filter for low-cost household drinking water treatment. Phys. Chem. Earth Parts A/B/C 2009, 34, 36–42. [Google Scholar] [CrossRef]
- McAllister, S. Analysis and Comparison of Sustainable Water Filters; Department of Mechanical Engineering, Uiversity of Wisconsin: Madison, WI, USA, 2005. [Google Scholar]
- Lantagne, D.; Yates, T. Household water treatment and cholera control. J. Infect. Dis. 2018, 218 (Suppl. S3), S147–S153. [Google Scholar] [CrossRef] [Green Version]
- Senevirathna, S.; Ramzan, S.; Morgan, J. A sustainable and fully automated process to treat stored rainwater to meet drinking water quality guidelines. Process Saf. Environ. Prot. 2019, 130, 190–196. [Google Scholar] [CrossRef]
- Pickering, A.J.; Crider, Y.; Amin, N.; Bauza, V.; Unicomb, L.; Davis, J.; Luby, S.P. Differences in field effectiveness and adoption between a novel automated chlorination system and household manual chlorination of drinking water in Dhaka, Bangladesh: A randomized controlled trial. PLoS ONE 2015, 10, e0118397. [Google Scholar] [CrossRef] [Green Version]
- Ali, S.I.; MacDonald, M.; Jincy, J.; Sampath, K.A.; Vinothini, G.; Philip, L.; Hall, K.; Aronson, K. Efficacy of an appropriate point-of-use water treatment intervention for low-income communities in India utilizing Moringa oleifera, sari-cloth filtration and solar UV disinfection. J. Water Sanit. Hyg. Dev. 2011, 1, 112–123. [Google Scholar] [CrossRef]
- Villanueva, C.M.; Cordier, S.; Font-Ribera, L.; Salas, L.A.; Levallois, P. Overview of disinfection by-products and associated health effects. Curr. Environ. Health Rep. 2015, 2, 107–115. [Google Scholar] [CrossRef] [PubMed] [Green Version]
- Keithley, S.E.; Fakhreddine, S.; Kinney, K.A.; Kirisits, M.J. Effect of treatment on the quality of harvested rainwater for residential systems. J. Am. Water Work. Assoc. 2018, 110, E1–E11. [Google Scholar] [CrossRef]
- Mazhar, M.A.; Khan, N.A.; Ahmed, S.; Khan, A.H.; Hussain, A.; Changani, F.; Yousefi, M.; Ahmadi, S.; Vambol, V. Chlorination disinfection by-products in municipal drinking water—A review. J. Clean. Prod. 2020, 273, 123159. [Google Scholar] [CrossRef]
- De Kwaadsteniet, M.; Dobrowsky, P.; Van Deventer, A.; Khan, W.; Cloete, T. Domestic rainwater harvesting: Microbial and chemical water quality and point-of-use treatment systems. Water Air Soil Pollut. 2013, 224, 1–19. [Google Scholar] [CrossRef]
- Van der Sterren, M.; Rahman, A.; Dennis, G.R. Quality and quantity monitoring of five rainwater tanks in Western Sydney, Australia. J. Environ. Eng. 2013, 139, 332–340. [Google Scholar] [CrossRef]
- Verrinder, G.; Keleher, H. Domestic drinking water in rural areas: Are water tanks on farms a health hazard? Environ. Health 2001, 1, 51–56. [Google Scholar]
- Spinks, A.T.; Dunstan, R.H.; Harrison, T.; Coombes, P.; Kuczera, G. Thermal inactivation of water-borne pathogenic and indicator bacteria at sub-boiling temperatures. Water Res. 2006, 40, 1326–1332. [Google Scholar] [CrossRef]
- Despins, C.; Farahbakhsh, K.; Leidl, C. Assessment of rainwater quality from rainwater harvesting systems in Ontario, Canada. J. Water Supply Res. Technol. AQUA 2009, 58, 117–134. [Google Scholar] [CrossRef] [Green Version]
- Sazakli, E.; Alexopoulos, A.; Leotsinidis, M. Rainwater harvesting, quality assessment and utilization in Kefalonia Island, Greece. Water Res. 2007, 41, 2039–2047. [Google Scholar] [CrossRef]
- Albrechtsen, H.J. Microbiological investigations of rainwater and graywater collected for toilet flushing. Water Sci. Technol. 2002, 46, 311–316. [Google Scholar] [CrossRef] [Green Version]
- Dillaha III, T.A.; Zolan, W.J. Rainwater catchment water quality in Micronesia. Water Res. 1985, 19, 741–746. [Google Scholar] [CrossRef]
- Simmons, G.; Hope, V.; Lewis, G.; Whitmore, J.; Gao, W. Contamination of potable roof-collected rainwater in Auckland, New Zealand. Water Res. 2001, 35, 1518–1524. [Google Scholar] [CrossRef]
- Uba, B.N.; Aghogho, O. Rainwater quality from different roof catchments in the Port Harcourt district, Rivers State, Nigeria. J. Water Supply Res. Technol.—Aqua 2000, 49, 281–288. [Google Scholar] [CrossRef]
- Lee, J.Y.; Yang, J.-S.; Han, M.; Choi, J. Comparison of the microbiological and chemical characterization of harvested rainwater and reservoir water as alternative water resources. Sci. Total Environ. 2010, 408, 896–905. [Google Scholar] [CrossRef] [PubMed]
- Pinfold, J.V.; Horan, N.J.; Wirojanagud, W.; Mara, D. The bacteriological quality of rainjar water in rural northeast Thailand. Water Res. 1993, 27, 297–302. [Google Scholar] [CrossRef]
- Lye, D.J. Bacterial Levels In Cistern Water Systems Of Northern Kentucky 1. JAWRA J. Am. Water Resour. Assoc. 1987, 23, 1063–1068. [Google Scholar] [CrossRef]
- Crabtree, K.D.; Ruskin, R.H.; Shaw, S.B.; Rose, J.B. The detection of Cryptosporidium oocysts and Giardia cysts in cistern water in the US Virgin Islands. Water Res. 1996, 30, 208–216. [Google Scholar] [CrossRef]
- Lévesque, B.; Pereg, D.; Watkinson, E.; Maguire, J.S.; Bissonnette, L.; Gingras, S.; Rouja, P.; Bergeron, M.G.; Dewailly, E. Assessment of microbiological quality of drinking water from household tanks in Bermuda. Can. J. Microbiol. 2008, 54, 495–500. [Google Scholar] [CrossRef]
- Al-Salaymeh, A.; Al-Khatib, I.A.; Arafat, H.A. Towards sustainable water quality: Management of rainwater harvesting cisterns in Southern Palestine. Water Resour. Manag. 2011, 25, 1721–1736. [Google Scholar] [CrossRef]
- Abo-Shehada, M.N.; Hindyia, M.; Saiah, A. Prevalence of Cryptosporidium parvum in private drinking water cisterns in Bani-Kenanah district, northern Jordan. Int. J. Environ. Health Res. 2004, 14, 351–358. [Google Scholar] [CrossRef]
- Handia, L.; Tembo, J.M.; Mwiindwa, C. Potential of rainwater harvesting in urban Zambia. Phys. Chem. Earth Parts A/B/C 2003, 28, 893–896. [Google Scholar] [CrossRef]
- World Health Organization (WHO). Guidelines for Drinking-Water Quality: First Addendum to the Fourth Edition; World Health Organization: Geneva, Switzerland, 2017. [Google Scholar]
- Clasen, T.F.; Thao, D.H.; Boisson, S.; Shipin, O. Microbiological effectiveness and cost of boiling to disinfect drinking water in rural Vietnam. Environ. Sci. Technol. 2008, 42, 4255–4260. [Google Scholar] [CrossRef] [PubMed]
- Clasen, T.F.; Alexander, K.T.; Sinclair, D.; Boisson, S.; Peletz, R.; Chang, H.H.; Majorin, F.; Cairncross, S. Interventions to improve water quality for preventing diarrhoea. Cochrane Database Syst. Rev. 2015, 10. [Google Scholar] [CrossRef] [Green Version]
- Young, L.; Peel, R.; O’Sullivan, B.; Reeve, C. Building general practice training capacity in rural and remote Australia with underserved primary care services: A qualitative investigation. BMC Health Serv. Res. 2019, 19, 338. [Google Scholar] [CrossRef] [Green Version]
- Lawal, O.; Anyiam, F.E. Modelling geographic accessibility to primary health care facilities: Combining open data and geospatial analysis. Geo-Spat. Inf. Sci. 2019, 22, 174–184. [Google Scholar] [CrossRef] [Green Version]
- Fewtrell, L.; Kaufmann, R.B.; Kay, D.; Enanoria, W.; Haller, L.; Colford Jr, J.M. Water, sanitation, and hygiene interventions to reduce diarrhoea in less developed countries: A systematic review and meta-analysis. Lancet Infect. Dis. 2005, 5, 42–52. [Google Scholar] [CrossRef] [PubMed]
- Mintz, E.; Bartram, J.; Lochery, P.; Wegelin, M. Not just a drop in the bucket: Expanding access to point-of-use water treatment systems. Am. J. Public Health 2001, 91, 1565–1570. [Google Scholar] [CrossRef]
- Sobsey, M.D.; Water, S.; World Health Organization. Managing Water in the Home: Accelerated Health Gains from Improved Water Supply; World Health Organization: Geneva, Switzerland, 2002. [Google Scholar]
- Zlatanović, L.; van der Hoek, J.P.; Vreeburg, J. An experimental study on the influence of water stagnation and temperature change on water quality in a full-scale domestic drinking water system. Water Res. 2017, 123, 761–772. [Google Scholar] [CrossRef]
- Sobsey, M.D. Inactivation of health-related microorganisms in water by disinfection processes. Water Sci. Technol. 1989, 21, 179–195. [Google Scholar] [CrossRef]
- Alekal, P.; Baffrey, R.; Franz, A.; Loux, B.; Pihulic, M.; Robinson, B.; Young, S.; Murcott, S. Decentralized Household Water Treatment and Sanitation Systems; Massachusetts Institute of Technology: Cambridge, MA, USA, 2005; p. 38. [Google Scholar]
- Andreoli, F.; Sabogal-Paz, L. Household slow sand filter to treat groundwater with microbiological risks in rural communities. Water Res. 2020, 186, 116352. [Google Scholar] [CrossRef]
- Metcalf Eddy, I. Wastewater Engineering: Treatment and Reuse, 4th ed.; Tchobanoglous, G., Franklin, L., Burton, H., David, S., Eds.; McGraw-Hill: Boston, MA, USA, 2003. [Google Scholar]
- Wei-Ling, C.; Jensen, J.N. Effect of chlorine demand on the ammonia breakpoint curve: Model development, validation with nitrite, and application to municipal wastewater. Water Environ. Res. 2001, 73, 721–731. [Google Scholar]
- Amy, G.; Bull, R.; Craun, G.F.; Pegram, R.; Siddiqui, M.; World Health Organization. Disinfectants and Disinfectant By-Products; World Health Organization: Geneva, Switzerland, 2000. [Google Scholar]
- Alim, M.A.a.; Ashraf, A.A.; Rahman, A.; Tao, Z.; Roy, R.; Khan, M.M.; Shirin, S. Experimental investigation of an integrated rainwater harvesting unit for drinking water production at the household level. J. Water Process Eng. 2021, 44, 102318. [Google Scholar] [CrossRef]
- WHO. Guidelines for Drinking-Water Quality, 2nd ed.; Surveillance and Control of Community Supplies; WHO: Geneva, Switzerland, 1997; Volume 3. [Google Scholar]
- Zhu, K.; Zhang, L.; Hart, W.; Liu, M.; Chen, H. Quality issues in harvested rainwater in arid and semi-arid Loess Plateau of northern China. J. Arid. Environ. 2004, 57, 487–505. [Google Scholar] [CrossRef]
- Radaideh, J.; Al-Zboon, K.; Al-Harahsheh, A.; Al-Adamat, R. Quality assessment of harvested rainwater for domestic uses. Jordan J. Earth Environ. Sci. 2009, 2, 26–31. [Google Scholar]
- Zhang, H.; Zhang, Y.; Shi, Q.; Hu, J.; Chu, M.; Yu, J.; Yang, M. Study on transformation of natural organic matter in source water during chlorination and its chlorinated products using ultrahigh resolution mass spectrometry. Environ. Sci. Technol. 2012, 46, 4396–4402. [Google Scholar] [CrossRef]
- Bond, T.; Roma, E.; Foxon, K.; Templeton, M.; Buckley, C. Ancient water and sanitation systems—Applicability for the contemporary urban developing world. Water Sci. Technol. 2013, 67, 935–941. [Google Scholar] [CrossRef]
- Stefán, D.; Erdélyi, N.; Izsák, B.; Zaray, G.; Vargha, M. Formation of chlorination by-products in drinking water treatment plants using breakpoint chlorination. Microchem. J. 2019, 149, 104008. [Google Scholar] [CrossRef]
- Huang, X.-F.; Li, X.; He, L.-Y.; Feng, N.; Hu, M.; Niu, Y.-W.; Zeng, L.-W. 5-Year study of rainwater chemistry in a coastal mega-city in South China. Atmos. Res. 2010, 97, 185–193. [Google Scholar] [CrossRef]
- Mattos, K.; King, E.; Lucas, C.; Snyder, E.H.; Dotson, A.; Linden, K. Rainwater catchments in rural Alaska have the potential to produce high-quality water and high quantities of water for household use. J. Water Health 2019, 17, 788–800. [Google Scholar] [CrossRef] [Green Version]
- Naddeo, V.; Scannapieco, D.; Belgiorno, V. Enhanced drinking water supply through harvested rainwater treatment. J. Hydrol. 2013, 498, 287–291. [Google Scholar] [CrossRef]
- Masood, S.; Saied, S.; Siddique, A.; Mohiuddin, S.; Hussain, M.; Khan, M.; Khwaja, H. Influence of urban–coastal activities on organic acids and major ion chemistry of wet precipitation at a metropolis in Pakistan. Arab. J. Geosci. 2018, 11, 802. [Google Scholar] [CrossRef]
- Bellar, T.A.; Lichtenberg, J.J.; Kroner, R.C. The occurrence of organohalides in chlorinated drinking waters. J. Am. Water Work. Assoc. 1974, 66, 703–706. [Google Scholar] [CrossRef]
- Rook, J. Formation of haloform during chlorination of natural water. Water Treat. Exam. 1972, 21, 259. [Google Scholar]
- Jalil, M.F.A.; Kamarudzaman, A.N.; Hamidin, N.; Gunny, A.A.N. Study of the potential health effects of disinfection by-products (trihalomethanes) in drinking water: A review. AIP Conf. Proc. 2019, 2157, 020019. [Google Scholar]
- Mishaqa, E.-S.I.; Radwan, E.K.; Ibrahim, M.; Hegazy, T.A.; Ibrahim, M.S. Multi-exposure human health risks assessment of trihalomethanes in drinking water of Egypt. Environ. Res. 2022, 207, 112643. [Google Scholar] [CrossRef] [PubMed]
- Li, X.-F.; Mitch, W.A. Drinking water disinfection byproducts (DBPs) and human health effects: Multidisciplinary challenges and opportunities. Environ. Sci. Technol. 2018, 52, 1681–1689. [Google Scholar] [CrossRef]
- USEPA. Edition of the Drinking Water Standards and Health Advisories Tables; Drinking Water Standards and Health Advisories; United States Environmental Protection Authority: Washington, DC, USA, 2018. [Google Scholar]
- Water, England and Wales. The Water Supply (Water Quality) Regulations 2016; legislation.gov.uk. Available online: https://www.legislation.gov.uk/uksi/2016/614/made (accessed on 17 July 2023).
- Directive (Eu) 2020/2184 of the European Parliament and of The Council. Directive (EU) 2020/2184 of the European parliament and of the council of 16 December 2020 on the quality of water intended for human consumption. Off. J. Eur. Union 2020, 435, 1–62. [Google Scholar]
- South African Water Quality Guidelines; Domestic Water Use Second Edition; Department of Water Affairs & Forestry: Pretoria, South Africa, 1996; Volume 1.
- Drinking Water Quality Standards in Japan; Ministry of Health, Labour and Welfare: Tokyo, Japan, 2015.
- Ministry of Environmental Protection of China. Report on the State of Environment in China; Ministry of Environmental Protection of China: Beijing, China, 2015. [Google Scholar]
- Guidelines, Australian Drinking Water. The Australian Drinking Water Guidelines Provide Guidance to Water Regulators and Suppliers on Monitoring and Managing Drinking Water Quality. Available online: https://www.nhmrc.gov.au/about-us/publications/australian-drinking-water-guidelines#block-views-block-file-attachments-content-block-1 (accessed on 1 September 2022).
- Drinking-Water Standards for New Zealand 2005. Available online: https://www.moh.govt.nz/notebook/nbbooks.nsf/0/B9917ABBB22BE387CC2583B2007928FE/$file/dwsnz-2005-revised-mar2019.pdf (accessed on 1 September 2022).
- Standards, Bureau of Indian. Indian Standard Drinking Water-Specification. Available online: http://cgwb.gov.in/documents/wq-standards.pdf (accessed on 1 September 2022).
- World Health Organization. Guidelines for Drinking-Water Quality: Incorporating the First and Second Addenda; World Health Organization: Geneva, Switzerland, 2022. [Google Scholar]
- Uyak, V.; Toroz, I. Disinfection by-product precursors reduction by various coagulation techniques in Istanbul water supplies. J. Hazard. Mater. 2007, 141, 320–328. [Google Scholar] [CrossRef]
- Keogh, M.; Elmusharaf, K.; Borde, P.; McGuigan, K. Evaluation of the natural coagulant Moringa oleifera as a pretreatment for SODIS in contaminated turbid water. Sol. Energy 2017, 158, 448–454. [Google Scholar] [CrossRef]
- Zeng, J.; Chen, S.; Wan, K.; Li, J.; Hu, D.; Zhang, S.; Yu, X. Study of biological up-flow roughing filters designed for drinking water pretreatment in rural areas: Using ceramic media as filter material. Environ. Technol. 2018, 41, 1256–1265. [Google Scholar] [CrossRef]
- Stoddart, A.K.; Gagnon, G.A. Full-scale prechlorine removal: Impact on filter performance and water quality. J. Am. Water Work. Assoc. 2015, 107, E638–E647. [Google Scholar] [CrossRef]
- Randtke, S.J. Organic contaminant removal by coagulation and related process combinations. J. Am. Water Work. Assoc. 1988, 80, 40–56. [Google Scholar] [CrossRef]
- Volk, C.; Bell, K.; Ibrahim, E.; Verges, D.; Amy, G.; LeChevallier, M. Impact of enhanced and optimized coagulation on removal of organic matter and its biodegradable fraction in drinking water. Water Res. 2000, 34, 3247–3257. [Google Scholar] [CrossRef]
- Gholikandi, G.B.; Dehghanifard, E.; Sepehr, M.N.; Torabian, A.; Moalej, S.; Dehnavi, A.; Yari, A.; Asgari, A. Performance evaluation of different filter media in turbidity removal from water by application of modified qualitative indices. Iran. J. Public Health 2012, 41, 87. [Google Scholar]
- Jun, H.-B.; Lee, Y.-J.; Shin, S.-S. Removal of particulates, natural organic matters, and microorganisms in a surface amended slow sand filter. Water Sci. Technol. Water Supply 2002, 2, 387–394. [Google Scholar] [CrossRef]
- Huq, A.; Yunus, M.; Sohel, S.S.; Bhuiya, A.; Emch, M.; Luby, S.P.; Russek-Cohen, E.; Nair, G.B.; Sack, R.B.; Colwell, R.R. Simple sari cloth filtration of water is sustainable and continues to protect villagers from cholera in Matlab, Bangladesh. mBio 2010, 1, e00034-10. [Google Scholar] [CrossRef] [Green Version]
- Colwell, R.R.; Huq, A.; Islam, M.S.; Aziz, K.; Yunus, M.; Khan, N.H.; Mahmud, A.; Sack, R.B.; Nair, G.B.; Chakraborty, J. Reduction of cholera in Bangladeshi villages by simple filtration. Proc. Natl. Acad. Sci. USA 2003, 100, 1051–1055. [Google Scholar] [CrossRef]
- Huck, P.M.; Peldszus, S.; Haberkamp, J.; Jekel, M. Assessing the performance of biological filtration as pretreatment to low pressure membranes for drinking water. Environ. Sci. Technol. 2009, 43, 3878–3884. [Google Scholar] [CrossRef]
- Gibert, O.; Lefèvre, B.; Fernández, M.; Bernat, X.; Paraira, M.; Pons, M. Fractionation and removal of dissolved organic carbon in a full-scale granular activated carbon filter used for drinking water production. Water Res. 2013, 47, 2821–2829. [Google Scholar] [CrossRef]
- Van der Aa, L.; Kolpa, R.; Rietveld, L.v.; Van Dijk, J. Improved removal of pesticides in biological granular activated carbon filters by pre-oxidation of natural organic matter. J. Water Supply Res. Technol. AQUA 2012, 61, 153–163. [Google Scholar] [CrossRef]
- Gómez, Y.D.; Teixeira, L.G. Residential rainwater harvesting: Effects of incentive policies and water consumption over economic feasibility. Resour. Conserv. Recycl. 2017, 127, 56–67. [Google Scholar] [CrossRef]
- Hofman-Caris, R.; Bertelkamp, C.; de Waal, L.; van den Brand, T.; Hofman, J.; van der Aa, R.; van der Hoek, J.P. Rainwater harvesting for drinking water production: A sustainable and cost-effective solution in the Netherlands? Water 2019, 11, 511. [Google Scholar] [CrossRef] [Green Version]
- Smeets, P.; Medema, G.; Van Dijk, J. The Dutch secret: How to provide safe drinking water without chlorine in the Netherlands. Drink. Water Eng. Sci. 2009, 2, 1–14. [Google Scholar] [CrossRef] [Green Version]
- Neto, R.F.M.; Calijuri, M.L.; de Castro Carvalho, I.; da Fonseca Santiago, A. Rainwater treatment in airports using slow sand filtration followed by chlorination: Efficiency and costs. Resour. Conserv. Recycl. 2012, 65, 124–129. [Google Scholar] [CrossRef]
- Jamal, A.S.I.M.; Tarek, Y.A.; Siddique, M.A.B.; Shaikh, M.A.A.; Debnath, S.C.; Uddin, M.R.; Ahmed, S.; Akbor, M.A.; Al-Mansur, M.A.; Islam, A.R.M.T. Development of a fabricated first-flush rainwater harvested technology to meet up the freshwater scarcity in a south asian megacity, dhaka, Bangladesh. Heliyon 2023, 9, e13027. [Google Scholar] [CrossRef]
- Mendez, C.B.; Afshar, B.R.; Kinney, K.; Barrett, M.E.; Kirisits, M.J. Effect of Roof Material on Water Quality for Rainwater Harvesting Systems; Texas Water Development Board: Austin, TX, USA, 2010. [Google Scholar]
- Abbasi, T.; Abbasi, S. Sources of pollution in rooftop rainwater harvesting systems and their control. Crit. Rev. Environ. Sci. Technol. 2011, 41, 2097–2167. [Google Scholar] [CrossRef]
- Water, Canadian Drinking. Guidelines for Canadian Drinking Water Quality. Available online: https://www.canada.ca/en/health-canada/services/environmental-workplace-health/water-quality/drinking-water/canadian-drinking-water-guidelines.html (accessed on 1 September 2022).


| Treatment Method | Can Remove Virus | Can Remove Bacteria | Can Remove Protozoa | Does the Treatment Method Has a Residual Effect | Cost of Treatment | Disinfection by Product Production | Reference |
|---|---|---|---|---|---|---|---|
| Disinfection by Chlorination | Yes—Medium | Yes—high | Yes—Low | Yes | US $0.09–0.37 per bottle of chlorine solution | Yes | [28] |
| Filtration by bio-sand | Not known | Yes—Medium to High | Yes—High | No | - | No | [28] |
| Filtration by ceramic | Not known | Yes—High | Yes—High | No | Water cost US $0.3–0.5 Filter cost US $2.5–4 | No | [29,30] |
| Filtration and chlorination | Yes—Medium | Yes—High | Yes—High | Yes | US $0.09–0.37 per bottle of chlorine solution | Yes—Medium | [28] |
| Disinfection by solar | Yes—High | Yes—High | Yes—High | No | US $0, bottle cost not included | No | [28] |
| Flocculation and chlorination | Yes—High | Yes—High | Yes—High | Yes | US $0.07 | Yes | [31] |
| Aeration + filtration + carbon filtration + ultra violet disinfection | Yes—High | Yes—High | Yes—High | Yes | AUD 4.59/m3 | No | [32] |
| Country | NH3 (mg/L) | NO2 (mg/L) | NO3 (mg/L) | Reference |
|---|---|---|---|---|
| Australia | 0.35 ± 0.01 | 0.006 ± 0.001 | 0.196 ± 0.02 | [72] |
| China | 0.01 | [74] | ||
| Jordan | 0.06 | 1.56 | [75] | |
| South Korea | 0.02 | 2.2 | [49] | |
| Palestine | 1.4 | 4.2 | [54] |
| Parameter | Before Filtration | After Filtration | Contamination Reduction | TAP Water | Australian Standard |
|---|---|---|---|---|---|
| NH3 | 0.35 | 0.332 | 1.80% | 0.013 | 0.2 |
| NO2 | 0.006 | 0 | 0.60% | 0 | 3 |
| NO3 | 0.196 | 0.151 | 4.50% | 0.026 | 50 |
| TOC | 0.8874 | 0.667 | 22.00% | 0 |
| THMs | HANs | HNMs |
|---|---|---|
| Chloroform Dibromochloromethane (DBCM) Bromodichloromethane (BDCM) Bromoform | Monochloroacetic (MCAA), Monobromoacetic (MBAA), Dichloroacetic (DCAA), Trichloroacetic (TCAA), Bromochloroacetic (BCAA), Dibromoacetic (DBAA), Bromodichloroacetic (BDCAA), Dibromochloroacetic (DBCAA), Tribromoacetic acid (TBAA). | Trichloroacetonitrile (TCAN), Dichloroacetonitirile (DCAN), Bromochloroacetonitrile (BCAN), Bichloroacetonitirile (DBAN). |
| Physical and Chemical Properties | pH | Temp | Raw Water mg/L | |||||||||||
|---|---|---|---|---|---|---|---|---|---|---|---|---|---|---|
| Br−mg/L | TOC. mg/L | Bromate mg/L | NH4+ mg/L | NaOCL mg/L | CL2 gas mg/L | |||||||||
| Maximum | 8.1 | 54.2 | 0.34 | 11 | 0.34 | 4.5 | 33 | 24 | ||||||
| Minimum | 7.5 | 13.1 | 0.07 | 1.9 | 0.01 | 0.76 | 19 | 16 | ||||||
| DBP mg/L | ||||||||||||||
| Physical and Chemical Properties | THMs µg/L | HAAs µg/L | HANs µg/L | Chlorite ion, mg/L | Chlorate ion, mg/L | Free chlorine, mg/L | Combine chlorine, mg/L | |||||||
| Maximum | 0.14 | 0.13 | 0.02 | <0 | 0.002 | 0.001 | 0.002 | |||||||
| Minimum | 0.01 | 0.01 | <0 | <0 | <0 | 0 | ||||||||
| Parameter | Southern China | Ontario/ Canada | Alaska/ USA | Fisciano SA/Italy | Karachi/ Pakistan | Werrington/ Australia |
|---|---|---|---|---|---|---|
| TOC mg/L | 1.03–4.21 | 1.8–8.5 | 0.53–5.7 | 6.61–5.19 | 12 | 0.89 ± 0.05 |
| Reference | [79] | [43] | [80] | [81] | [82] | [72] |
| CDBP Contaminants | Oral Ingestion | In halation | Dermal Absorption |
|---|---|---|---|
| Chloroform | 37.97 | 6.8 | 55.23 |
| BDCM | 0.78 | 97.86 | 1.36 |
| CDBM | 0.93 | 97.66 | 1.41 |
| Bromoform | 16.6 | 81.46 | 2.14 |
| TTHMs | 2.1 | 68.95 | 27.94 |
| Sources of Water | pH | Electrical Conductivity | Dissolved Oxygen | NH3 | NO2 | NO3 | TOC | Turbidity |
|---|---|---|---|---|---|---|---|---|
| Australian Standard | 6.5–8.5 | 200–800 | 0.2 | 3 | 50 | 5 | ||
| Sydney Water supplied water quality | 6.73 ± 0.2 | 247 ± 2 | 7.5 ± 1 | 0.013 ± 0.01 | 0 ± 0.01 | 0.026 ± 0.02 | 0.23 ± 0.05 | 0 ± 0.5 |
| HRW (after filtration) | 6.59 ± 0.2 | 71 ± 2 | 9 ± 1 | 0.332 ± 0.01 | 0 ± 0.001 | 0.151 ± 0.02 | 0.667 ± 0.05 | 2 ± 0.5 |
| HRW(before filtration) | 6 ± 0.2 | 21.54 ± 2 | 9.5 ± 1 | 0.35 ± 0.01 | 0.006 ± 0.001 | 0.196 ± 0.02 | 0.887 ± 0.05 | 2 ± 0.5 |
Disclaimer/Publisher’s Note: The statements, opinions and data contained in all publications are solely those of the individual author(s) and contributor(s) and not of MDPI and/or the editor(s). MDPI and/or the editor(s) disclaim responsibility for any injury to people or property resulting from any ideas, methods, instructions or products referred to in the content. |
© 2023 by the authors. Licensee MDPI, Basel, Switzerland. This article is an open access article distributed under the terms and conditions of the Creative Commons Attribution (CC BY) license (https://creativecommons.org/licenses/by/4.0/).
Share and Cite
Latif, S.; Alim, M.A.; Rahman, A.; Haque, M.M. A Review on Chlorination of Harvested Rainwater. Water 2023, 15, 2816. https://doi.org/10.3390/w15152816
Latif S, Alim MA, Rahman A, Haque MM. A Review on Chlorination of Harvested Rainwater. Water. 2023; 15(15):2816. https://doi.org/10.3390/w15152816
Chicago/Turabian StyleLatif, Sajeeve, Mohammad A. Alim, Ataur Rahman, and Md Mahmudul Haque. 2023. "A Review on Chlorination of Harvested Rainwater" Water 15, no. 15: 2816. https://doi.org/10.3390/w15152816
APA StyleLatif, S., Alim, M. A., Rahman, A., & Haque, M. M. (2023). A Review on Chlorination of Harvested Rainwater. Water, 15(15), 2816. https://doi.org/10.3390/w15152816