Article

Bioaugmentation Potential Investigation Using a Phenol Affinity Analysis of Three Acinetobacter Strains in a Multi-Carbon-Source Condition

by
Dezső-Róbert Fikó
1,2,
Botond Ráduly
2,
István Máthé
2,
Tamás Felföldi
3,
Szabolcs Lányi
2 and
Szabolcs Szilveszter
2,*
1
Department of Analytical Chemistry and Environmental Engineering, Faculty of Chemical Engineering and Biotechnologies, University Politehnica of Bucharest, Gheorghe Polizu nr. 1–7, 011061 Bucharest, Romania
2
Department of Bioengineering, Faculty of Economics, Socio-Human Sciences and Engineering, Sapientia Hungarian University of Transylvania, Libertății nr. 1, 530100 Miercurea Ciuc, Romania
3
Department of Microbiology, Eötvös Loránd University, Pázmány Péter Stny. 1/C, H-1117 Budapest, Hungary
*
Author to whom correspondence should be addressed.
Water 2023, 15(15), 2815; https://doi.org/10.3390/w15152815
Submission received: 29 May 2023 / Revised: 24 July 2023 / Accepted: 28 July 2023 / Published: 3 August 2023
(This article belongs to the Section Wastewater Treatment and Reuse)

Abstract

:
Bioaugmentation potential and phenol substrate affinity in a multi-carbon-source condition for three Acinetobacter strains (Acinetobacter towneri CFII-87, Acinetobacter johnsonii CFII-99A and Acinetobacter sp. CFII-98) were demonstrated. First, the phenol biodegradation ability of the strains was analyzed in batch experiments with phenol as the sole carbon source. All strains degraded phenol at 100 and 500 mg·L−1 initial concentrations; the maximum specific growth rates were 0.59 and 0.30 d−1 for A. towneri CFII-87, 0.50 and 0.20 d−1 for A. johnsonii CFII-99A, and 0.64 and 0.29 d−1 for A. sp. CFII-98, respectively. For the two tested phenol concentrations, no lag phase was observed for the A. towneri CFII-87 strain, A. sp. CFII-98 presented 4 h and 8 h lag phase, while A. johnsonii CFII-99A presented 3 h and 12 h lag phases. Phenol carbon source dependency of the strains was tested in a multi-carbon-source condition (on phenol-rich synthetic wastewater), both for individual strains and for a consortium prepared as an equal mixture of the three strains. The strains A. towneri CFII-87 and A. sp. CFII-98 and the consortia degraded phenol in 16 h while there was no other significant carbon source consumption during the 48 h trial, as shown by the constant non-phenolic residual chemical oxygen demand (COD) and volatile suspended solids (VSS) concentration after the depletion of phenol. The strain A. johnsonii CFII-99A, however, consumed phenol within 24 h and a further decrease in non-phenolic COD and increase in biomass was also observed upon the depletion of phenol. The highest specific phenol removal rate of 282.11 mg phenol·g VSS∙h−1 was observed in the case of the strain A. towneri CFII-87, followed by A. sp. CFII-98, the consortium and A. johnsonii CFII-99A with 178.84, 146.76 and 141.01 mg phenol·g VSS∙h−1, respectively. Two bacterial strains (A. towneri CFII-87, A. sp. CFII-98) presented a strong affinity to phenol, utilizing it as a primary carbon source, and thus, their use in the bioaugmentation of wastewater bioreactors indicated the viable potential to increase the phenol removal rate of these systems.

1. Introduction

Wastewaters from various industrial processes, such as oil refineries, pulp and paper mills, resins and coke manufacturing plants, and steel and pharmaceutical industries, contain phenol and phenolic compounds (e.g., nitrophenol, alkylphenol, halogenated phenol) [1,2]. Untreated or inadequately treated wastewater containing phenolic compounds causes additional waste management complications due to the low biodegradability and good solubility in water of these compounds [3]. With a solubility in water of 82.8 g/L and a half-life in water of 2–20 days, phenol can persist at a high concentration in aquatic environments [3]. Hence, phenolic effluents can reach long distances from the emission point, contaminating the soil and ground and surface water resources, as well as affecting areas that are not exposed to direct pollution.
The release of phenolic compounds has physical, chemical and biological effects in nature [2,4]. Wastewater discharges containing phenol can cause soil compaction, reduce pore spaces, and limit water infiltration/holding capacity and air circulation. In this way, it can limit root growth, lead to drought stress for plants and inhibit root respiration. This can reduce their yield and cause poor plant health. Phenolic compounds can interfere with plant physiological processes, such as photosynthesis and nutrient uptake. Phenolic compounds can negatively affect soil microbial communities, reducing their diversity and activity. This can affect important soil functions, such as nutrient cycling and organic matter decomposition [4,5].
The toxicity of phenol varies widely with the concentration, exposure duration and species sensitivity. Toxicity to living organisms is normally evaluated by means of the median lethal concentration (LC50). According to the proposal of the Joint Group of Experts on Scientific Aspects of Marine Environmental Protection, LC50 values are divided into seven levels of ecotoxicological hazard, from non-toxic (LC50 > 1000) to extremely toxic (LC50 ≤ 0.01) [6]. Acute toxicity studies showed that the toxicity of phenol to aquatic lifeforms ranges from non-toxic to highly toxic (LC50 < 0.1). Examples of aquatic organisms that tolerate phenol well are mollusks, algae and rotifera; in general, phenol is slightly toxic to moderately toxic to fish and practically non-toxic to highly toxic to crustaceans [7]. Examples of freshwater organisms found to be highly sensitive to phenol exposure are the mrigal carp (Cirrhinus mrigala), with a 96 h LC50 of 1.55 mg⋅L−1 phenol, or the water flea (Ceriodaphnia dubia), which has a 48 h LC50 of 3.1 mg⋅L−1 phenol. Among the seawater organisms, the opossum shrimp (Archaeomysis kokuboi) is one of the most sensitive to phenol exposure (96 h LC50 of 0.26 mg⋅L−1 and 1.49 mg⋅L−1 phenol for the juvenile and adult individuals, respectively) [7]. Sub-lethal toxicity studies show that phenol has an undesirable effect on aquatic organisms at a much lower level. The chronic toxicity of phenol to rainbow trout (O. mykiss) has a 27 d LC50 of 0.07 mg⋅L−1, while for the embryo-larval stage of the leopard frog (Rana pipiens), the 9 d LC50 is 0.04 mg⋅L−1 [8]. Phenol is toxic to humans as well; it is readily absorbed through the skin, causing both local and systemic toxicity. A high phenol concentration can cause irritation, burns and discoloration (skin, eyes, respiratory tract). In severe cases, drowsiness, breathing and heart problems, and lung and kidney damage may occur [9].
Given all the negative effects of phenol, it is necessary to reduce the phenol content of effluents as much as possible. The World Health Organization (WHO) sets the maximum discharge limit to 1 mg·L−1, but national discharge limits are often more severe [10,11]. The different national guidelines for fresh and marine water maximize the phenol concentration in the microgram range; for example, the Canadian water quality guideline for mono- and dihydric phenols for the protection of freshwater life is 4.0 μg⋅L−1 [8].
With the continuous growth of the economy and industrial activity, the chance of the release of phenolic wastewater also increases, and more than ever before, sustainable approaches are needed to protect the environment from phenolic pollutants or to treat contaminated sites. Recently, more emphasis has been placed on environmentally friendly approaches, such as biological degradation processes, to overcome the ever-increasing water scarcity, water pollution problem and the imbalance of the aquatic ecosystem [12,13]. However, biological treatment approaches are not desirable merely because of their inherently environment-friendly nature. Review studies that compared different phenolic wastewater treatment technologies, such as chemical oxidation, adsorption, membrane separation and biological treatment, often suggested that biological treatment is the most cost-effective, practical and versatile approach because living organisms offer efficient degradation of a wide range of pollutants and they can also achieve complete mineralization of phenol [1,13,14,15]. However, wastewater with a high phenol concentration is difficult to treat biologically due to the inhibiting effect of phenol [16,17]. Bioaugmentation of the wastewater bioreactors might be a viable approach to overcome the problem of inhibition. Bioaugmentation consists of the addition of selected strains or mixed cultures to wastewater reactors to improve the rate of degradation of specific compounds and to enhance the removal efficiency [18]. The successful bioaugmentation of bioreactors treating phenolic wastewater supposes bacterial strains with high affinity to phenol, with good phenol degradation capacity and a growth rate high enough to prevent the washout of the supplemented strains from the bioreactors. Phenol can be degraded by both pure microbial cultures and by mixed bacterial consortia [19]. Bacterial consortia may have several advantages over pure cultures, such as greater stability, more complete mineralization and increased metabolic capabilities [20]. It was also reported that reactors bioaugmented with pure cultures often fail to perform as well as pure cultures under laboratory conditions [19].
Many bacteria with phenol-degrading capabilities were detected in wastewater treatment systems, including the genera Acinetobacter, Arthrobacter, Alcaligenes, Castellaniella, Comamonas and Pseudomonas [21,22,23,24,25,26]. The present research evaluated the bioaugmentation potential and phenol affinity of three promising phenol-degrading Acinetobacter strains. The tested strains were isolated from a landfill-leachate-treating bioreactor and were identified using 16S rRNA gene sequencing in a previous study [27]. In this study, batch phenol degradation experiments were conducted at different initial phenol concentrations to determine the maximum growth rate of the selected microorganisms. The phenol affinities of the three individual bacterial strains and their mixture were investigated in multiple carbon source conditions in bioreactors that treated phenol-rich synthetic wastewater. The scope of such an affinity test was to identify microorganisms that preferred phenol over other substrates available in the wastewater. Microorganisms showing high affinity to phenol are promising candidates for bioaugmentation applications. The phenol removal capacities of the three Acinetobacter strains under the test conditions were also determined and compared with the results reported in the literature.

2. Materials and Methods

2.1. Culture Preparation

The investigated bacterial strains were derived from the bacterial collection of the Sapientia Hungarian University of Transylvania, Miercurea Ciuc, Romania. Based on preliminary screening results on phenol conducted in previous research [27], three promising phenol-degrading bacterial strains were chosen in order to examine their phenol degradation ability in single-carbon-source (culture medium) and multi-carbon-source (phenol-rich synthetic wastewater) conditions. The three selected bacterial strains were previously isolated from the activated sludge of a landfill-leachate treating bioreactor and could be identified as Acinetobacter towneri CFII-87 (Gen Bank acc. No.: KY963586; shares 99.84% pairwise sequence similarity of the 16S rRNA gene with the type strain of the species based on an identification performed with EzBioCloud on 6 October 2022, ezbiocloud.net), Acinetobacter johnsonii CFII-99A (Gen Bank acc. No.: MK246143; 99.34% sequence similarity) and Acinetobacter sp. CFII-98 (Gen Bank acc. No.: MK246145; 99.86% sequence similarity with the type strains of both Acinetobacter guillouiae and Acinetobacter bereziniae) [23]. The cryopreserved (−80 °C) (Technical Service Consultants Ltd., Heywood, UK) bacterial strains were thawed and inoculated onto R-2A agar (Sigma-Aldrich, St. Louis, MO, USA) plates. After the formation of bacterial colonies, a single colony was transferred onto a new R-2A agar plate. The cultures were incubated at room temperature for 24 h, then stored at 4 °C and used as stock cultures for further examinations.

2.2. Analytical Methods

The measurements were carried out according to standard methods [28]. The optical density (OD590) of the culture medium was determined using a DR6000 UV-VIS spectrophotometer (Hach, Loveland, CO, USA) at 590 nm. The phenol concentration was measured using a direct photometric method based on rapid condensation with 4-aminoantipyrine (Sigma-Aldrich, St. Louis, MO, USA), followed by oxidation with potassium hexa-cyanoferrate(III) (Sigma-Aldrich, St. Louis, MO, USA) under alkaline conditions. In the presence of phenol, the 4-aminoantipyrine forms a red indophenol dye, whose absorbance was measured at 510 nm. The phenol concentration was determined by comparing the absorbance value with a phenol standard curve (0–10 mg·L−1). All the reagents were of analytical grade. The biomass concentrations of the samples were determined by filtering an aliquot through a glass microfiber filter (Prat Dumas, Couze-St-Front, France), then drying at 105 °C to constant weight and measuring the weight of the solids in the sample. The volatile suspended solid fraction (VSS, mg·L−1) of the biomass was determined after ignition of the dried filters at 550 °C to constant weight. The chemical oxygen demand (COD) was measured using a HI83224 photometer (Hanna Instruments, Woonsocket, RI, USA) with the appropriate COD cuvette kits according to the manufacturer’s instructions.

2.3. Phenol Degradation in Culture Media

From each culture, a 5 mL bacterial cell suspension was prepared with a sterile MP medium, as proposed by Watanabe et al. (1998), and the optical density was adjusted to 0.5 OD590. The composition of the MP medium was as follows: 2.75 g K2HPO4, 2.25 g KH2PO4, 1.0 g (NH4)2SO4, 0.2 g MgCl2 × 6H2O, 0.1 g NaCl, 0.02 g FeCl3 × 6H2O, 0.013 g CaCl2 × 2H2O, 1 L distilled water, pH = 8.0 at 25 °C [29]. The phenol degradation assays were performed at pH = 8.0 since the bioreactor from which the strains were isolated operated at that pH value. In order to prevent the thermal precipitation of the compounds in the medium, we did not autoclave them all together; instead, we made concentrated (1000×) stock solutions of FeCl3, CaCl2 and MgCl2 that were sterilized using a 0.2 µm syringe filter (Whatman, Buckinghamshire, UK) and the required amount was added to the cold broth. Aliquots from the prepared broth were poured into Erlenmeyer flasks, then the sterile phenol was carefully thawed and added rapidly to the medium. Then, 5 mL of the adjusted bacterial suspension was added to 95 mL sterile MP medium containing 100 or 500 mg·L−1 phenol as the sole carbon and energy source. The inoculated Erlenmeyer flasks were incubated on an orbital shaker (GFL, Burgwedel, Germany) at 28 °C and 150 rpm. Samples were taken at different time intervals (every 1 h for 100 mg·L−1 and 4 h for 500 mg·L−1) in order to determine the bacterial growth (OD590) and the phenol concentration. The phenol concentration was measured in triplicate. In the case of both concentrations, non-inoculated flasks were used as controls.

2.4. Inoculum Preparation

The pure cultures were grown separately on R-2A agar, and then the bacterial cultures were inoculated into sterile Erlenmeyer flasks containing 30 mL MP medium and phenol at 100 mg·L−1. The flasks were incubated in a shaker incubator at 150 rpm and 28 °C for 24 h. After 24 h, the contents of the flasks were transferred to a larger flask containing 470 mL sterile MP medium, and then the initial phenol concentration was adjusted to 500 mg·L−1. The flasks containing the inoculated 500 mL MP medium were incubated until the late-exponential growth phase. In the next step, the suspension containing the bacteria was centrifuged (Beckman Coulter, Indianapolis, IN, USA) at 10,000 rpm for 10 min at 4 °C, and the pellet was washed thrice with sterile physiological saline to separate the residual phenol and metabolic products from the biomass. After that, the pellet was resuspended with physiological saline, and a suspension of 0.5 OD590 was created from each bacterial culture. This was centrifuged as described above, and the biomass was resuspended in 25 mL sterile synthetic wastewater and used as an inoculum. In the case of the consortium, we prepared 3 × 0.165 ± 0.007 OD590 suspensions of the strains separately, which were centrifuged together to make a final consortial suspension of 0.5 OD590. The pellet of the consortium was also resuspended in 25 mL sterile synthetic wastewater and used as a consortial inoculum.

2.5. Phenol Degradation in Synthetic Wastewater

Five 1000 mL batch bioreactors were used with a 500 mL working volume to treat the mixture of phenol and synthetic wastewater (Table 1) [30] for 48 h at room temperature (20 ± 2 °C). The synthetic wastewater was prepared to contain 1000 mg·L−1 COD organic matter and an additional 500 mg·L−1 of phenol, resulting in approximately 2200 mg·L−1 total COD. The pH of the synthetic wastewater was also adjusted to 8.0 in this case. The assembled bioreactors, together with the internal equipment and synthetic wastewater, were autoclaved to achieve the sterility of the whole system. The phenol was added to the synthetic wastewater after autoclaving and cooling. During the experiment, the bioreactors were aerated continuously using an air pump (Resun AC-9906, Longgang, Shenzhen, China), which provided a nominal 7 L·min−1 air flow rate through ceramic diffusers. At the inlet and outlet, the air was filtered with a 0.45 µm filter to avoid physical and biological contamination. For proper mixing of the medium, magnetic stirrers were used alongside the aeration (Figure 1).
In the first three bioreactors, the three microbial strains were inoculated separately with an initial optical density of 0.5 OD590 by adding 25 mL inoculum to 475 mL synthetic wastewater. The fourth bioreactor contained the consortium prepared from an equal mixture of the three isolated strains with the same OD590 and volume as in the previous bioreactors. In each case, the phenol was added after autoclaving the bioreactors at 121 °C for 20 min. The stability (volatilization) of phenol in the system was monitored by using a controlled bioreactor containing sterile synthetic wastewater and phenol. The determinations of the phenol, biomass and VSS concentrations were made in triplicates.

3. Results and Discussion

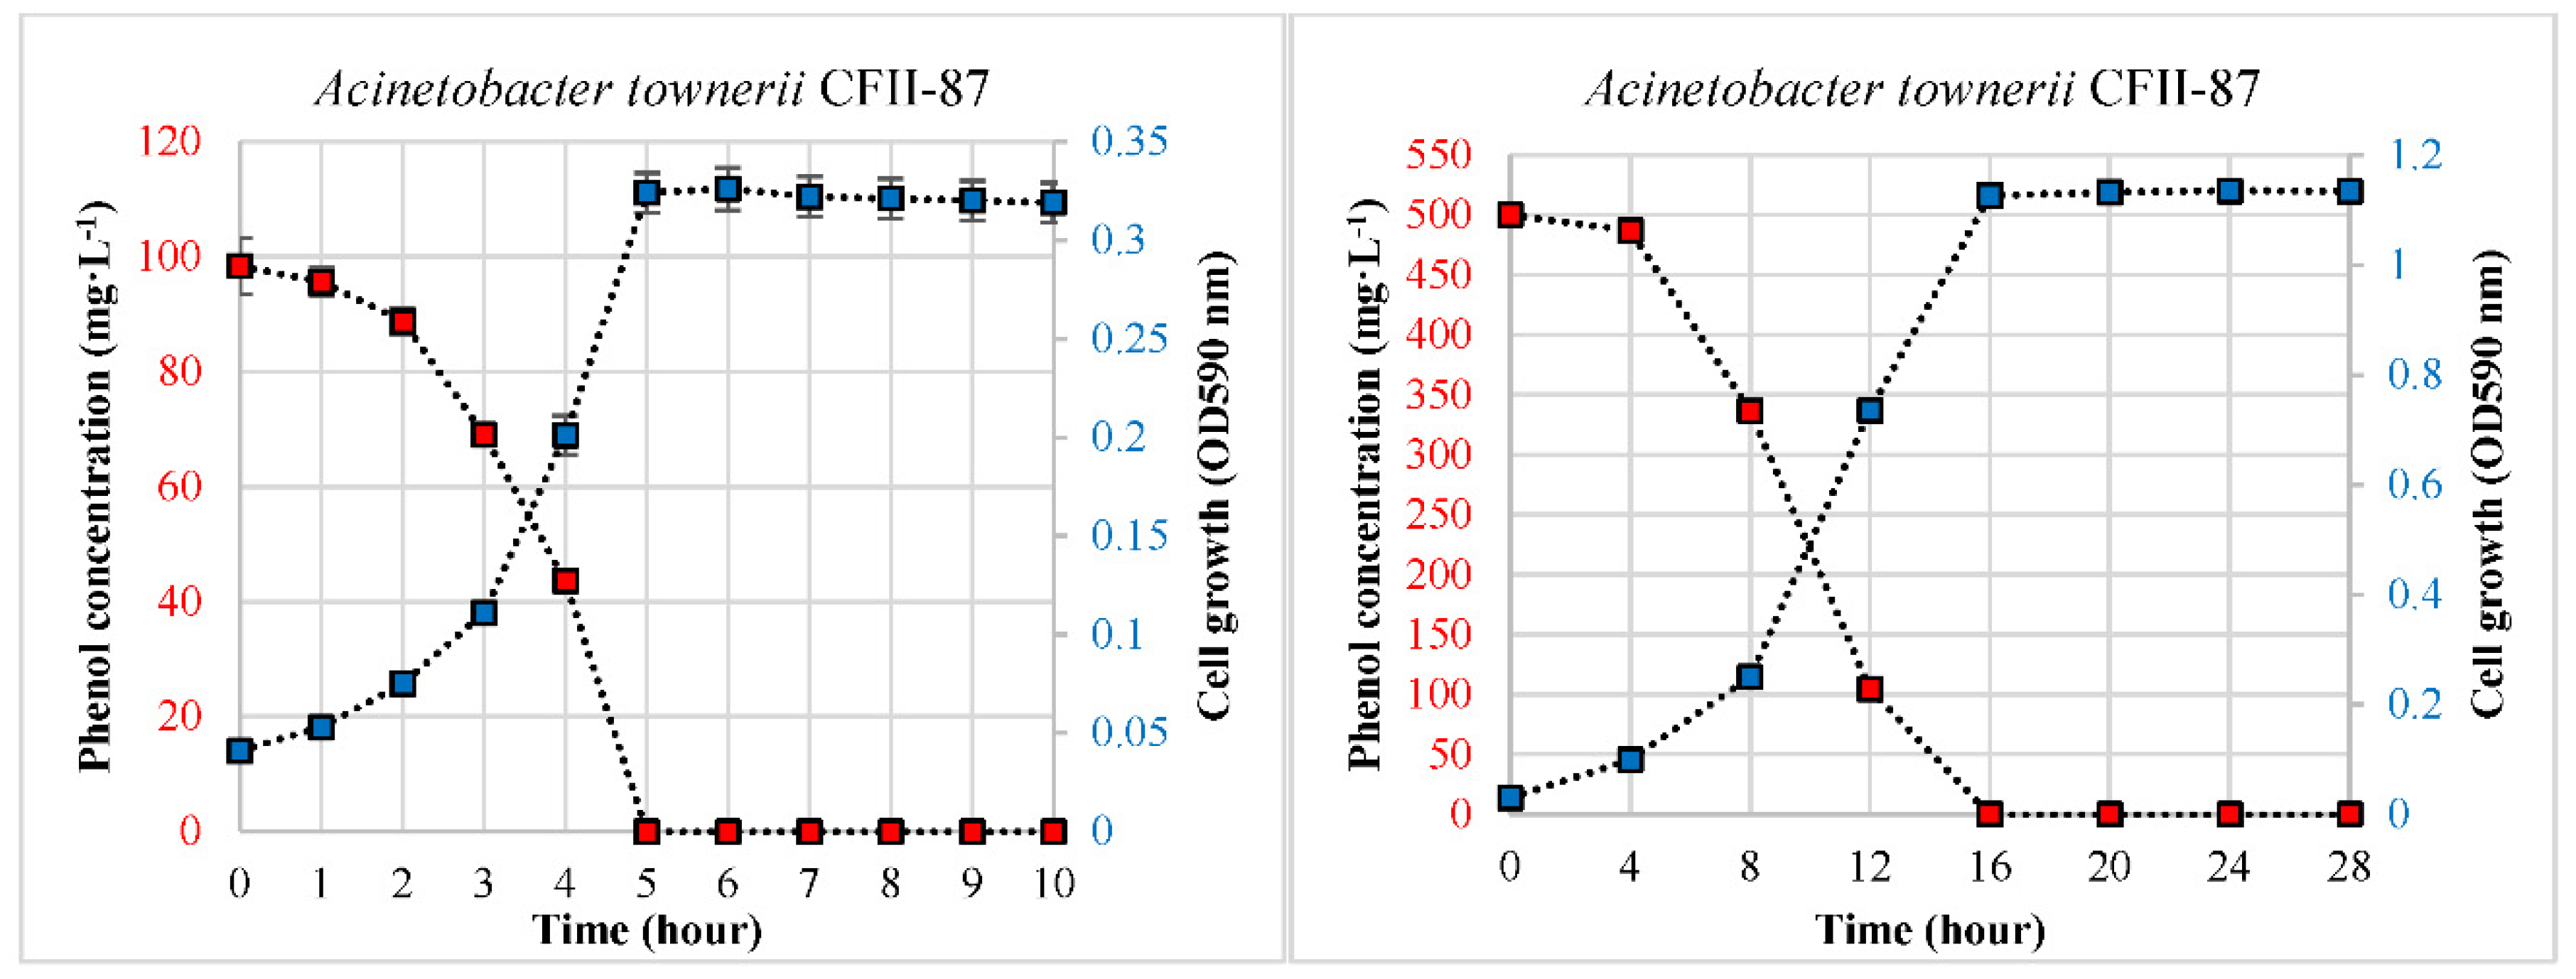
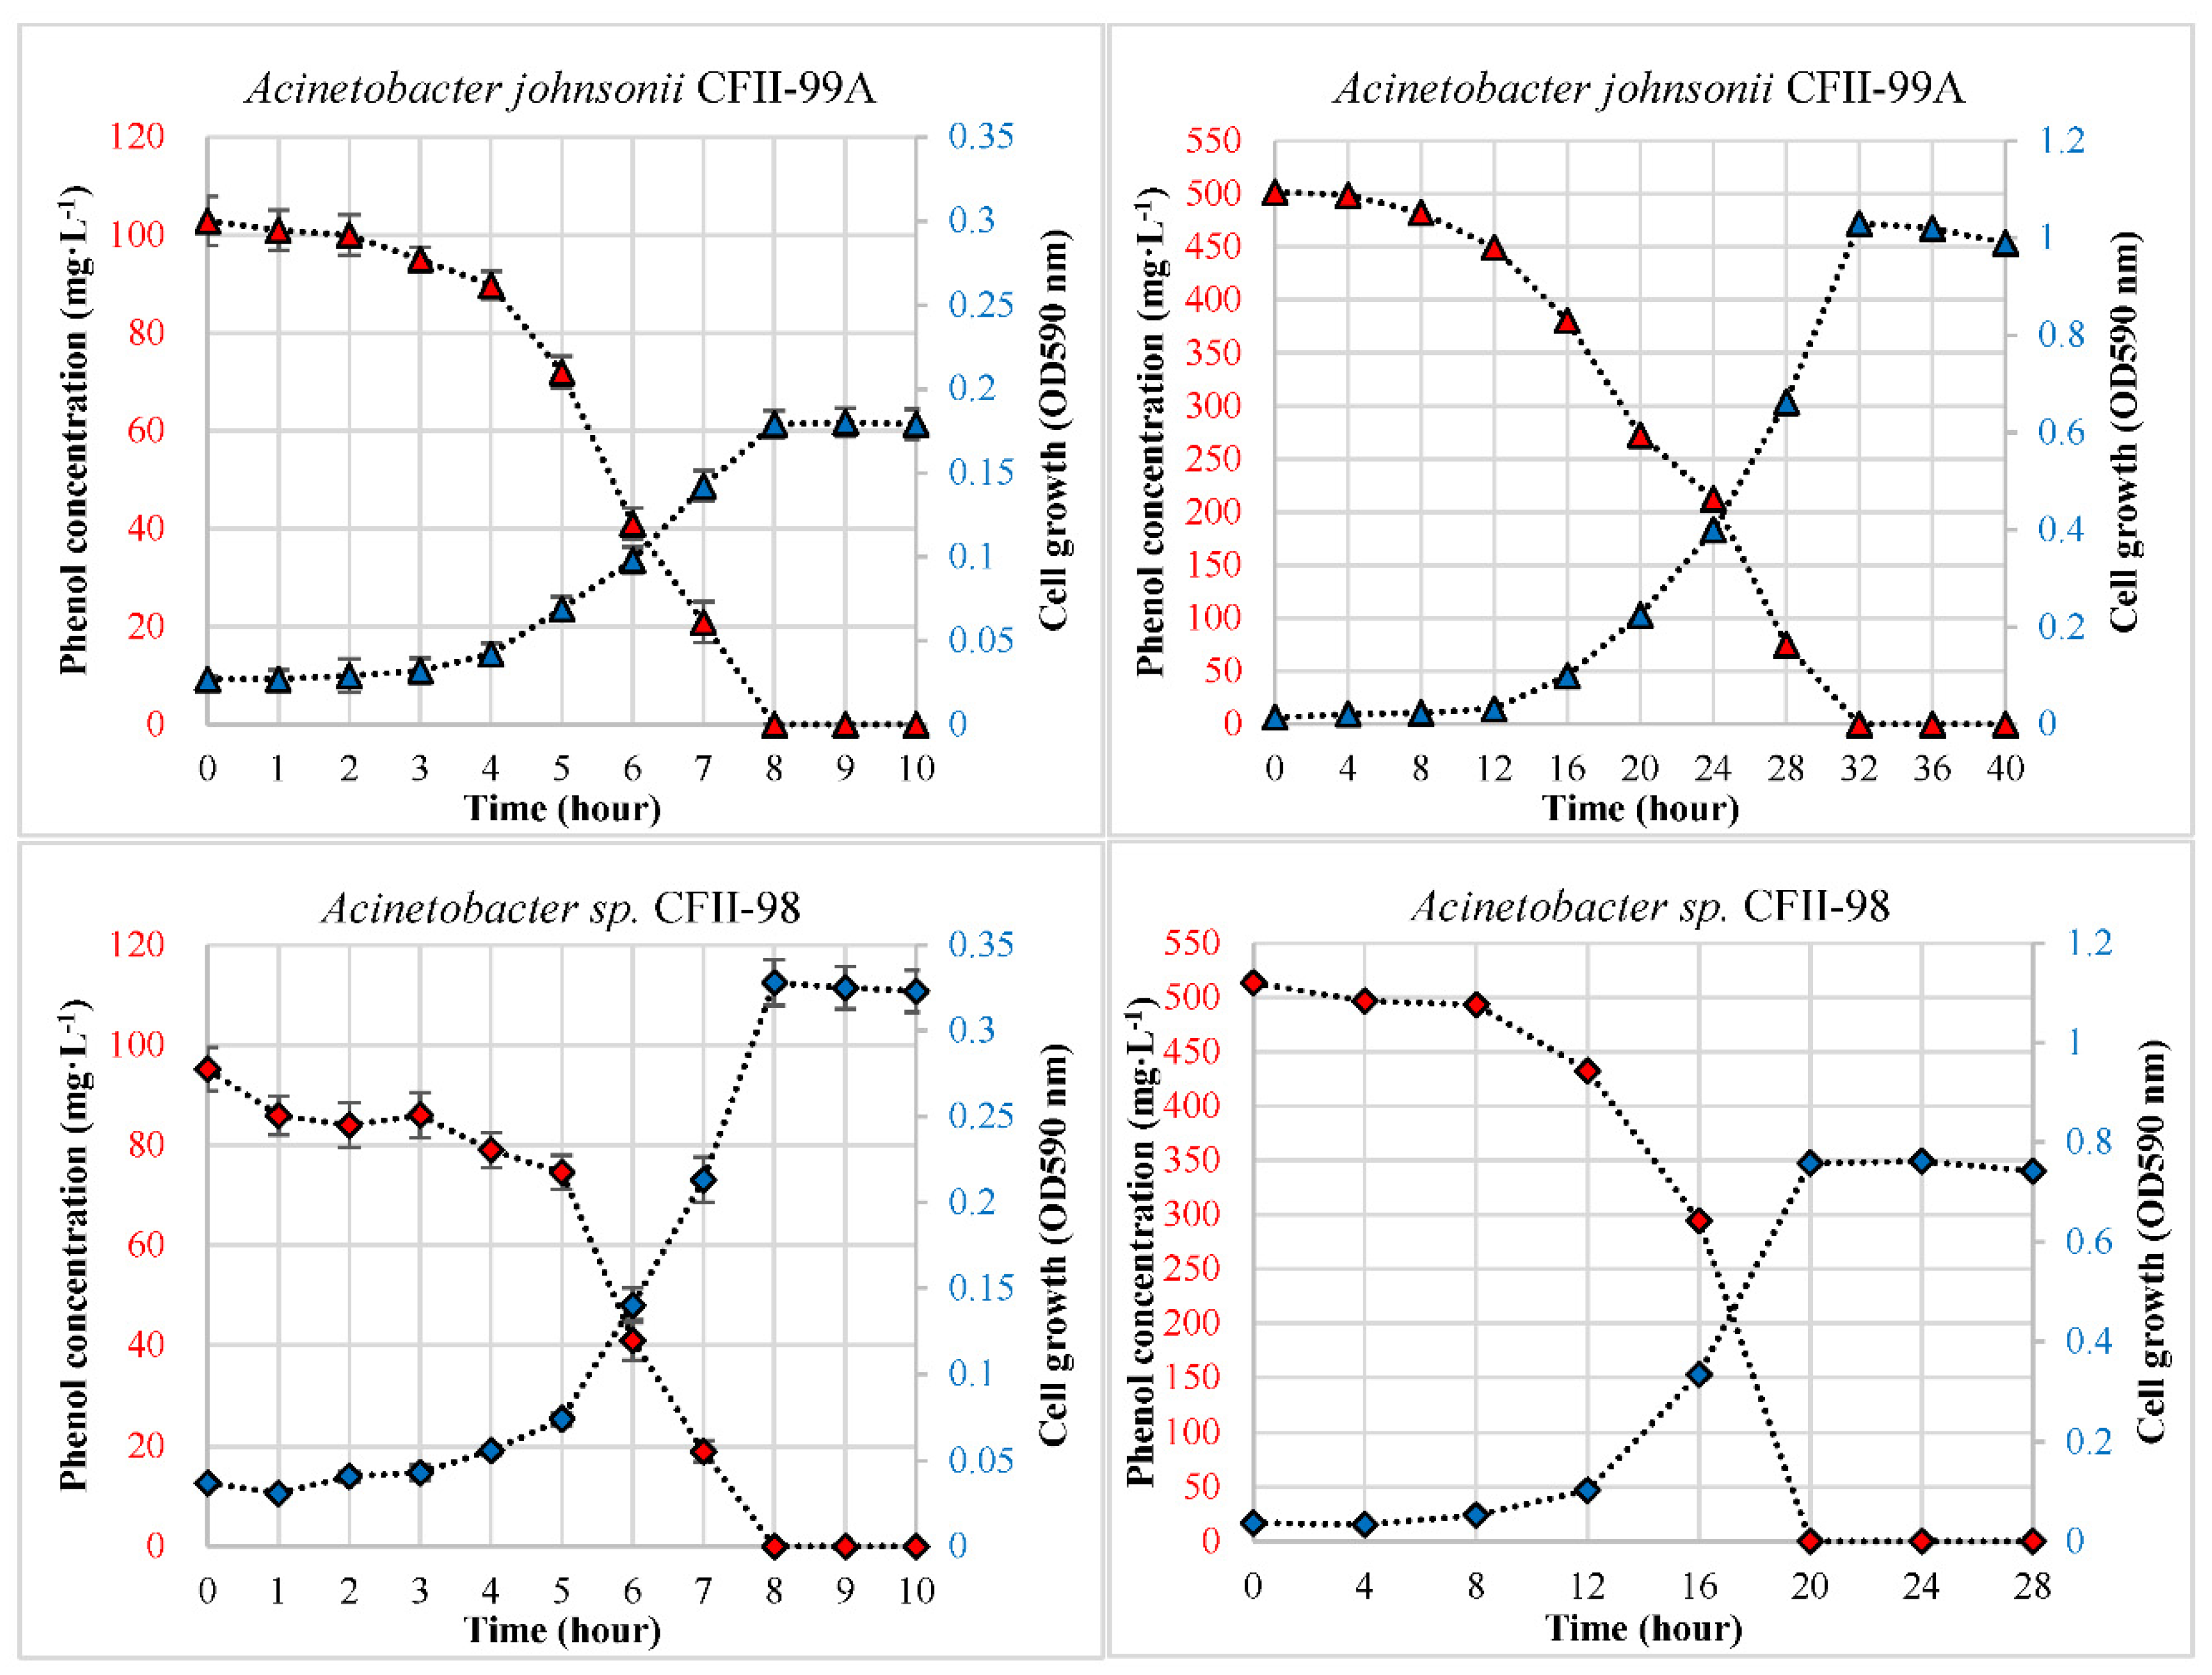
3.1. Phenol Degradation in the Single-Carbon-Source Condition

The evolution of the phenol concentration and cell biomass (as optical density) during the batch phenol degradation experiments in the pure culture at 100 and 500 mg·L−1 initial phenol concentrations are shown in Figure 2. The results indicate that all three tested strains were able to completely degrade phenol at both concentration levels without any strain modification (e.g., genetic engineering) or process optimization. For all three strains, there was a good correlation between the phenol concentration and OD curves: it can be clearly seen that the biomass growth stopped when the substrate was exhausted, as shown by the growth curve reaching a plateau (reaching the stationary phase). The biggest difference between the three strains can be observed in the degradation dynamics: at the 100 mg·L−1 initial phenol concentration, the strain A. towneri CFII-87 assimilated the phenol in only 5 h, while strains A. johnsonii CFII-99A and A. sp. CFII-98 completely degraded the phenol in 8 h. This difference is explained not only by the difference in the phenol degradation rates of the three strains but also by the different lag phases observed. While the strains A. johnsonii CFII-99A and A. sp. CFII-98 showed similar lag phases (3 h and 4 h, respectively), no lag phase was observed in the case of the strain A. towneri CFII-87 (the changes in OD and phenol concentration were already significant in the first hour of the experiment).
At the higher (500 mg·L−1) phenol concentration, the patterns of phenol degradation were more distinct for the three tested strains. Again, the strain A. towneri CFII-87 was the fastest, completely removing the phenol in only 16 h, followed by the strain A. sp. CFII-98 (20 h). The longest time needed to completely degrade phenol was observed for the strain A. johnsonii CFII-99A (32 h), together with the longest lag phase (12 h). The slow dynamics observed in the case of the strain A. johnsonii CFII-99A indicate that this strain was more strongly inhibited by phenol than the other two strains, especially at the higher phenol concentration. On the other hand, the lack of a lag phase in the case of the strain A. towneri CFII-87 was in concordance with previous findings [27] and shows that this Acinetobacter strain was an excellent phenol degrader, requiring no adaptation to phenol, even at relatively high phenol concentrations.
In the case of strain the A. sp. CFII-98, an initial decrease in OD590 was observed after the inoculation (visible at 100 mg·L−1 phenol concentration due to the shorter sampling period). Possibly, this strain was initially shocked by the phenol, even at the lower tested concentration, but after a 1 h adaptation period, it started growing rapidly, presenting the highest growth rate among the three strains tested in this study. No such phenomenon was observed for the other two tested strains.
The observed lag phase and calculated growth rate and phenol degradation rate values of the studied bacterial strains are shown in Table 2. It can be noted that at the 500 mg·L−1 initial phenol concentration, the specific growth rate values were approx. 1.8–2.5 times lower than at 100 mg·L−1. The lowest growth rate values were determined for the strain A. johnsonii CFII-99A in both phenol concentration trials, distinctly remaining behind the other two strains at the higher phenol concentration. The observed lag times were also significantly longer at the 500 mg·L−1 initial phenol concentration, except for the strain A. towneri CFII-87, which presented immediate biomass growth in this case as well.
Direct comparison of the results with data reported in the literature on other phenol-degrader microorganisms is not straightforward because the phenol degradation time is also significantly affected by the temperature and the initial inoculum-to-substrate ratio. Xu et al. (2021) reported that the Acinetobacter lwoffii NL1 strain completely degraded phenol at a 500 mg·L−1 initial concentration within 20 h when the inoculum was added in a 2% v/v proportion, in 16 h when inoculated at a 5% v/v proportion, and in 14 h for inoculum ratios of 8% and above [31]. In the same study, complete phenol degradation was achieved in only 10 h at the optimal incubation temperature of 33 °C and in 20 h at 28 °C, the strain A. lwoffii NL1 was unable to degrade phenol outside the 28–35 °C range. Hence, the results regarding phenol degradation dynamics should also be compared by considering the inoculum-to-substrate ratio and incubation temperature in each case.
Tian et al. (2017) examined the phenol degradation ability of four Pseudomonas strains (PH7, PH8, PH10, PH11) and their mixtures, which were isolated from sediment contaminated by a chemical plant effluent. They observed that the mixed culture degraded more than 99.5% of the 500 mg·L−1 initial phenol within 42 h at 30 °C, while the pure cultures degraded the same phenol concentration slower [32]. Another paper reported that Acinetobacter calcoaceticus PA isolated from phenolic wastewater [33] could remove 91.6% of the initial 800 mg·L−1 phenol in a 48 h experiment at 30 °C and 75% at 25 °C. A similar strain, namely, Acinetobacter sp. PD12, isolated from activated sludge had the capacity to remove 99% of the 500 mg·L−1 initial phenol concentration in 9 h at 30 °C and presented a lag time of 4 h [34], while at 25 °C, the phenol degradation was approx. 10% slower for the same strain. Considering that the results of the present study refer to a relatively low incubation temperature of 28°, one can note that the phenol degradation rates of the studied strains were close to the best values reported in the literature. The optimal degradation parameters of the strains have not been determined yet, and thus, better results may be obtained after the optimization of the phenol biodegradation process (temperature, pH, non-carbonic nutrients, adaptation, etc.).
The specific growth rates observed in the present study were also comparable to what were reported in the literature for other phenol-degrading bacteria. Adav et al. (2007) observed somewhat lower values for Acinetobacter sp. isolated from aerobic granules at a 100 mg·L−1 phenol concentration (µ = 0.29 h−1 and µmax = 0.31 h−1) relative to the values observed in the present study (µ = 0.36–0.46 h−1 and µmax = 0.50–0.64 h−1), while at 500 mg·L−1, they reported growth rate values (µ = 0.16 h−1 and µmax= 0.33 h−1) similar to our findings. Among the three bacterial strains tested in the present study, the strain A. towneri CFII-87 in particular showed very good growth rate values at the 500 mg·L−1 phenol concentration: with µmax = 0.3 h−1, it was found to grow better on phenol than Achromobacter sp. isolated from a hydrocarbon-contaminated medium (µmax = 0.231 h−1 at 405 mg·L−1 phenol), Trichosporon cutaneum R57 strain (µmax = 230 h−1) or the yeast Candida tropicalismax = 270 h−1) [35,36,37,38].

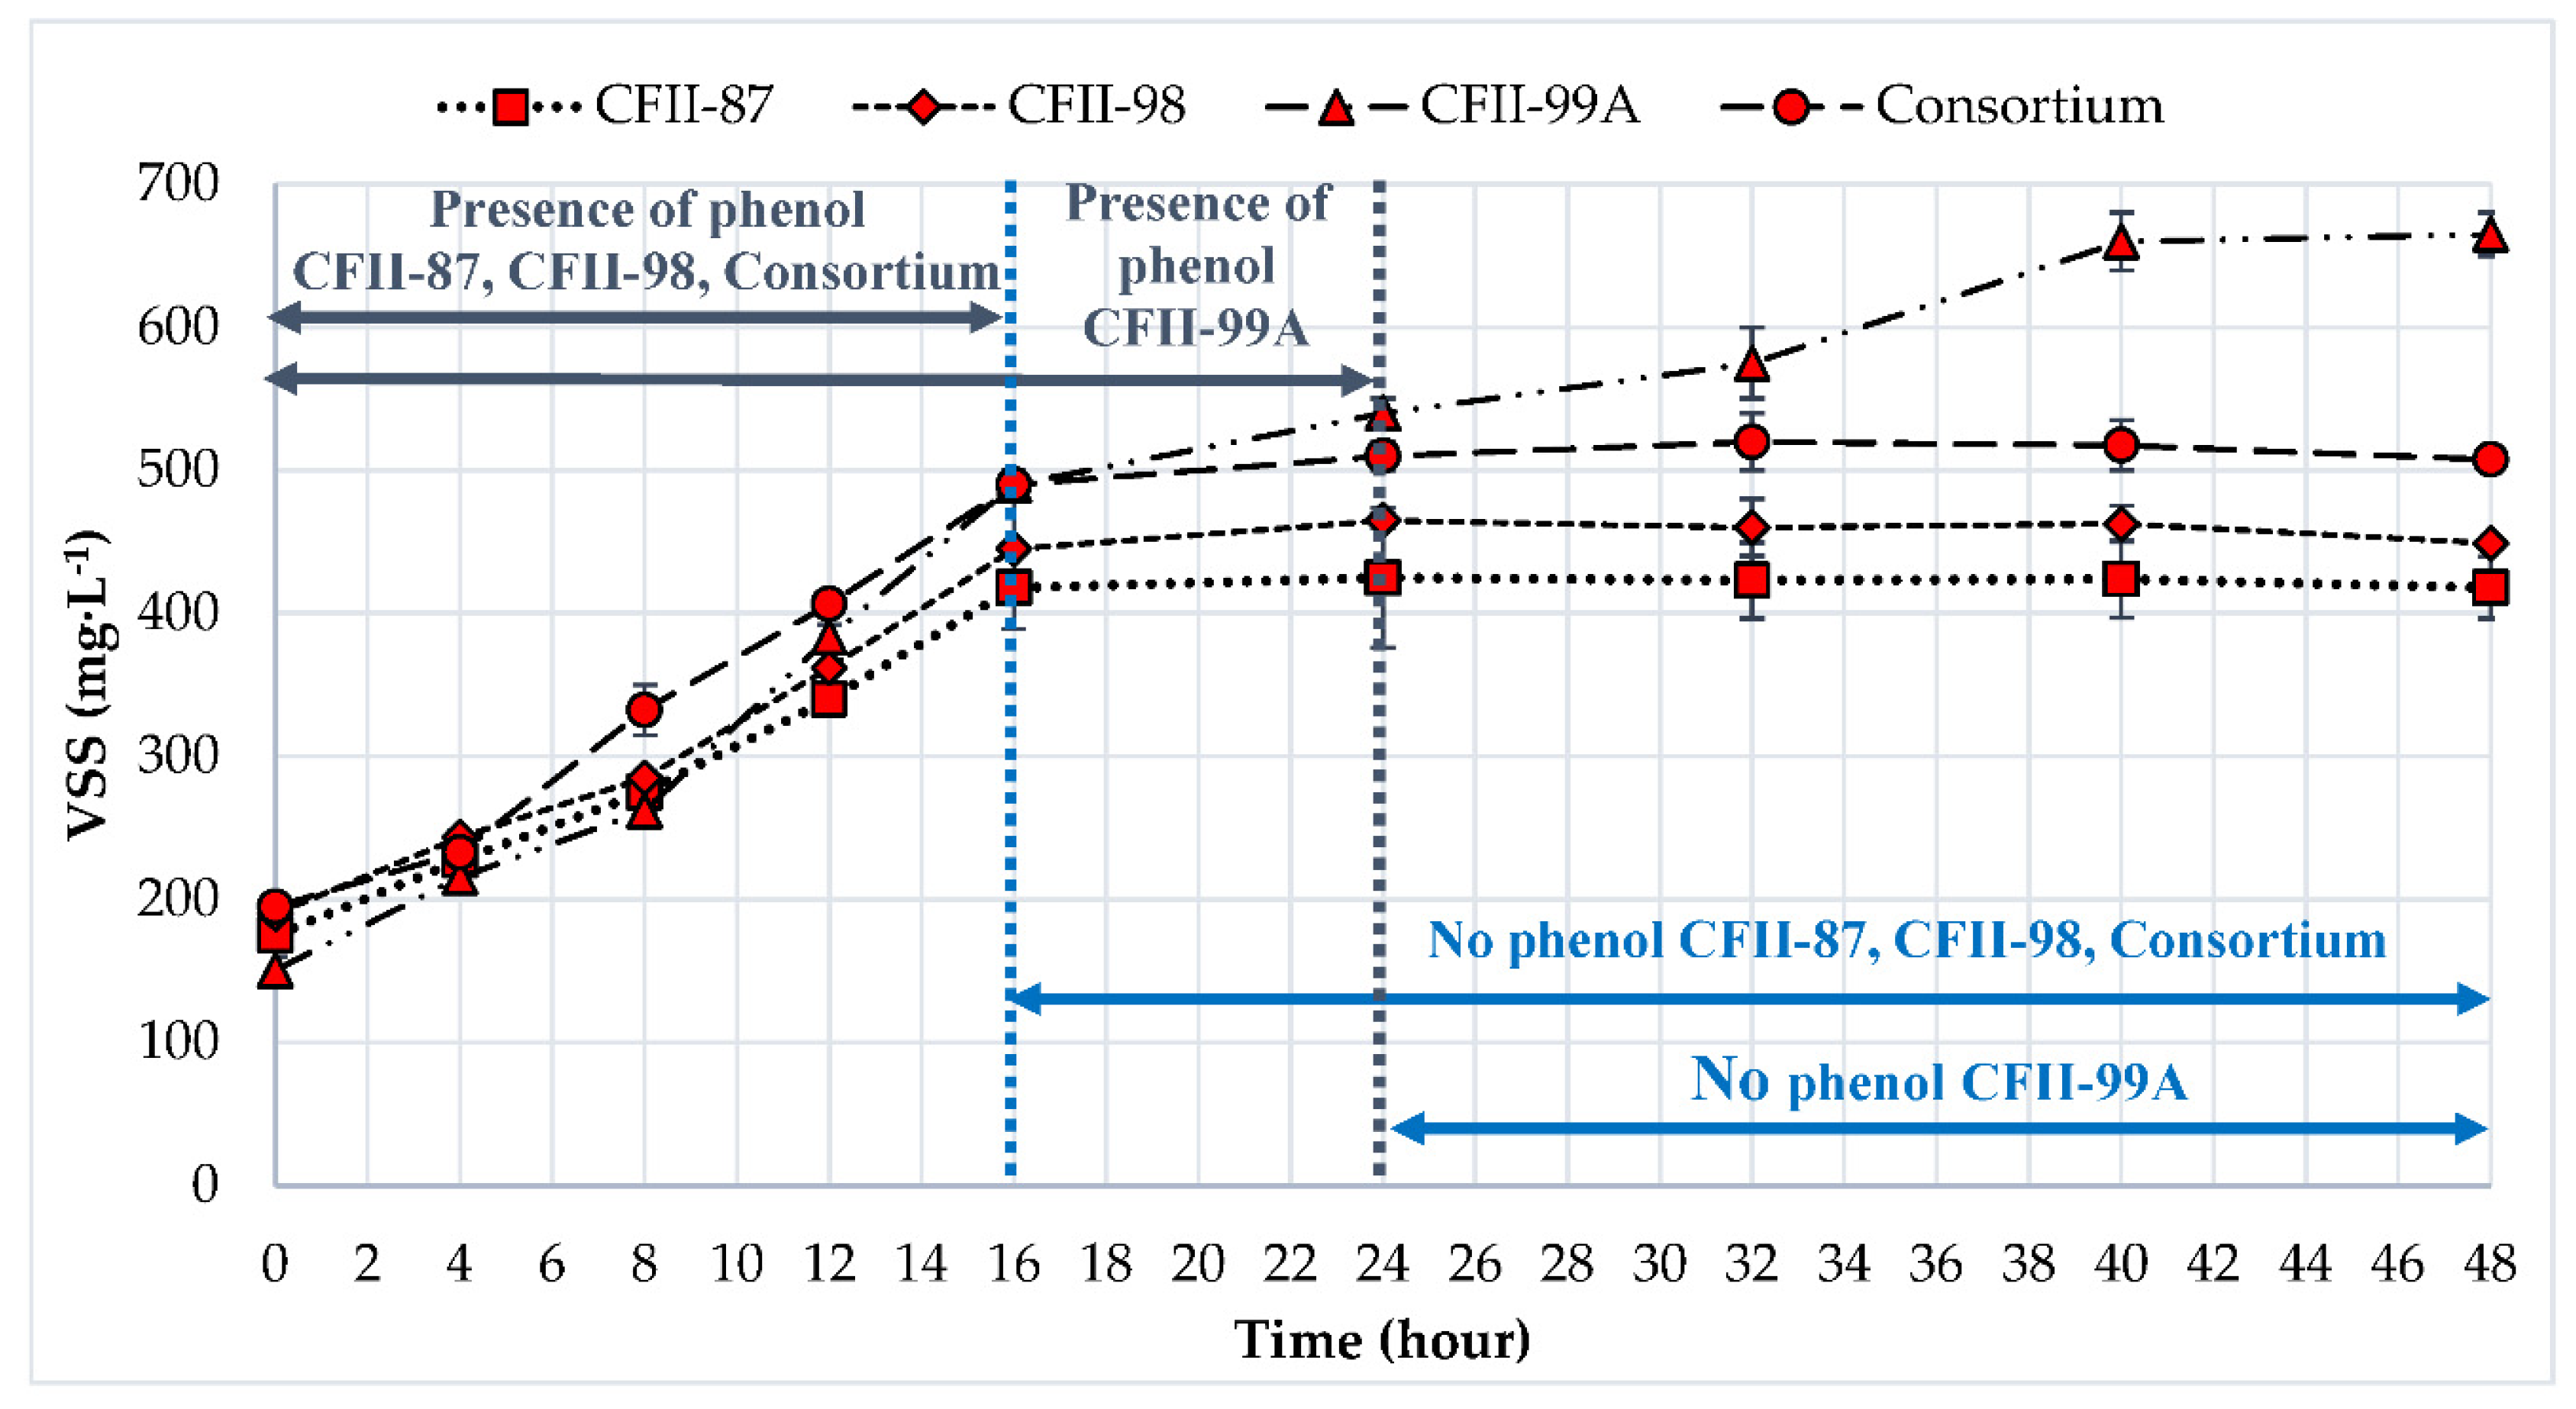
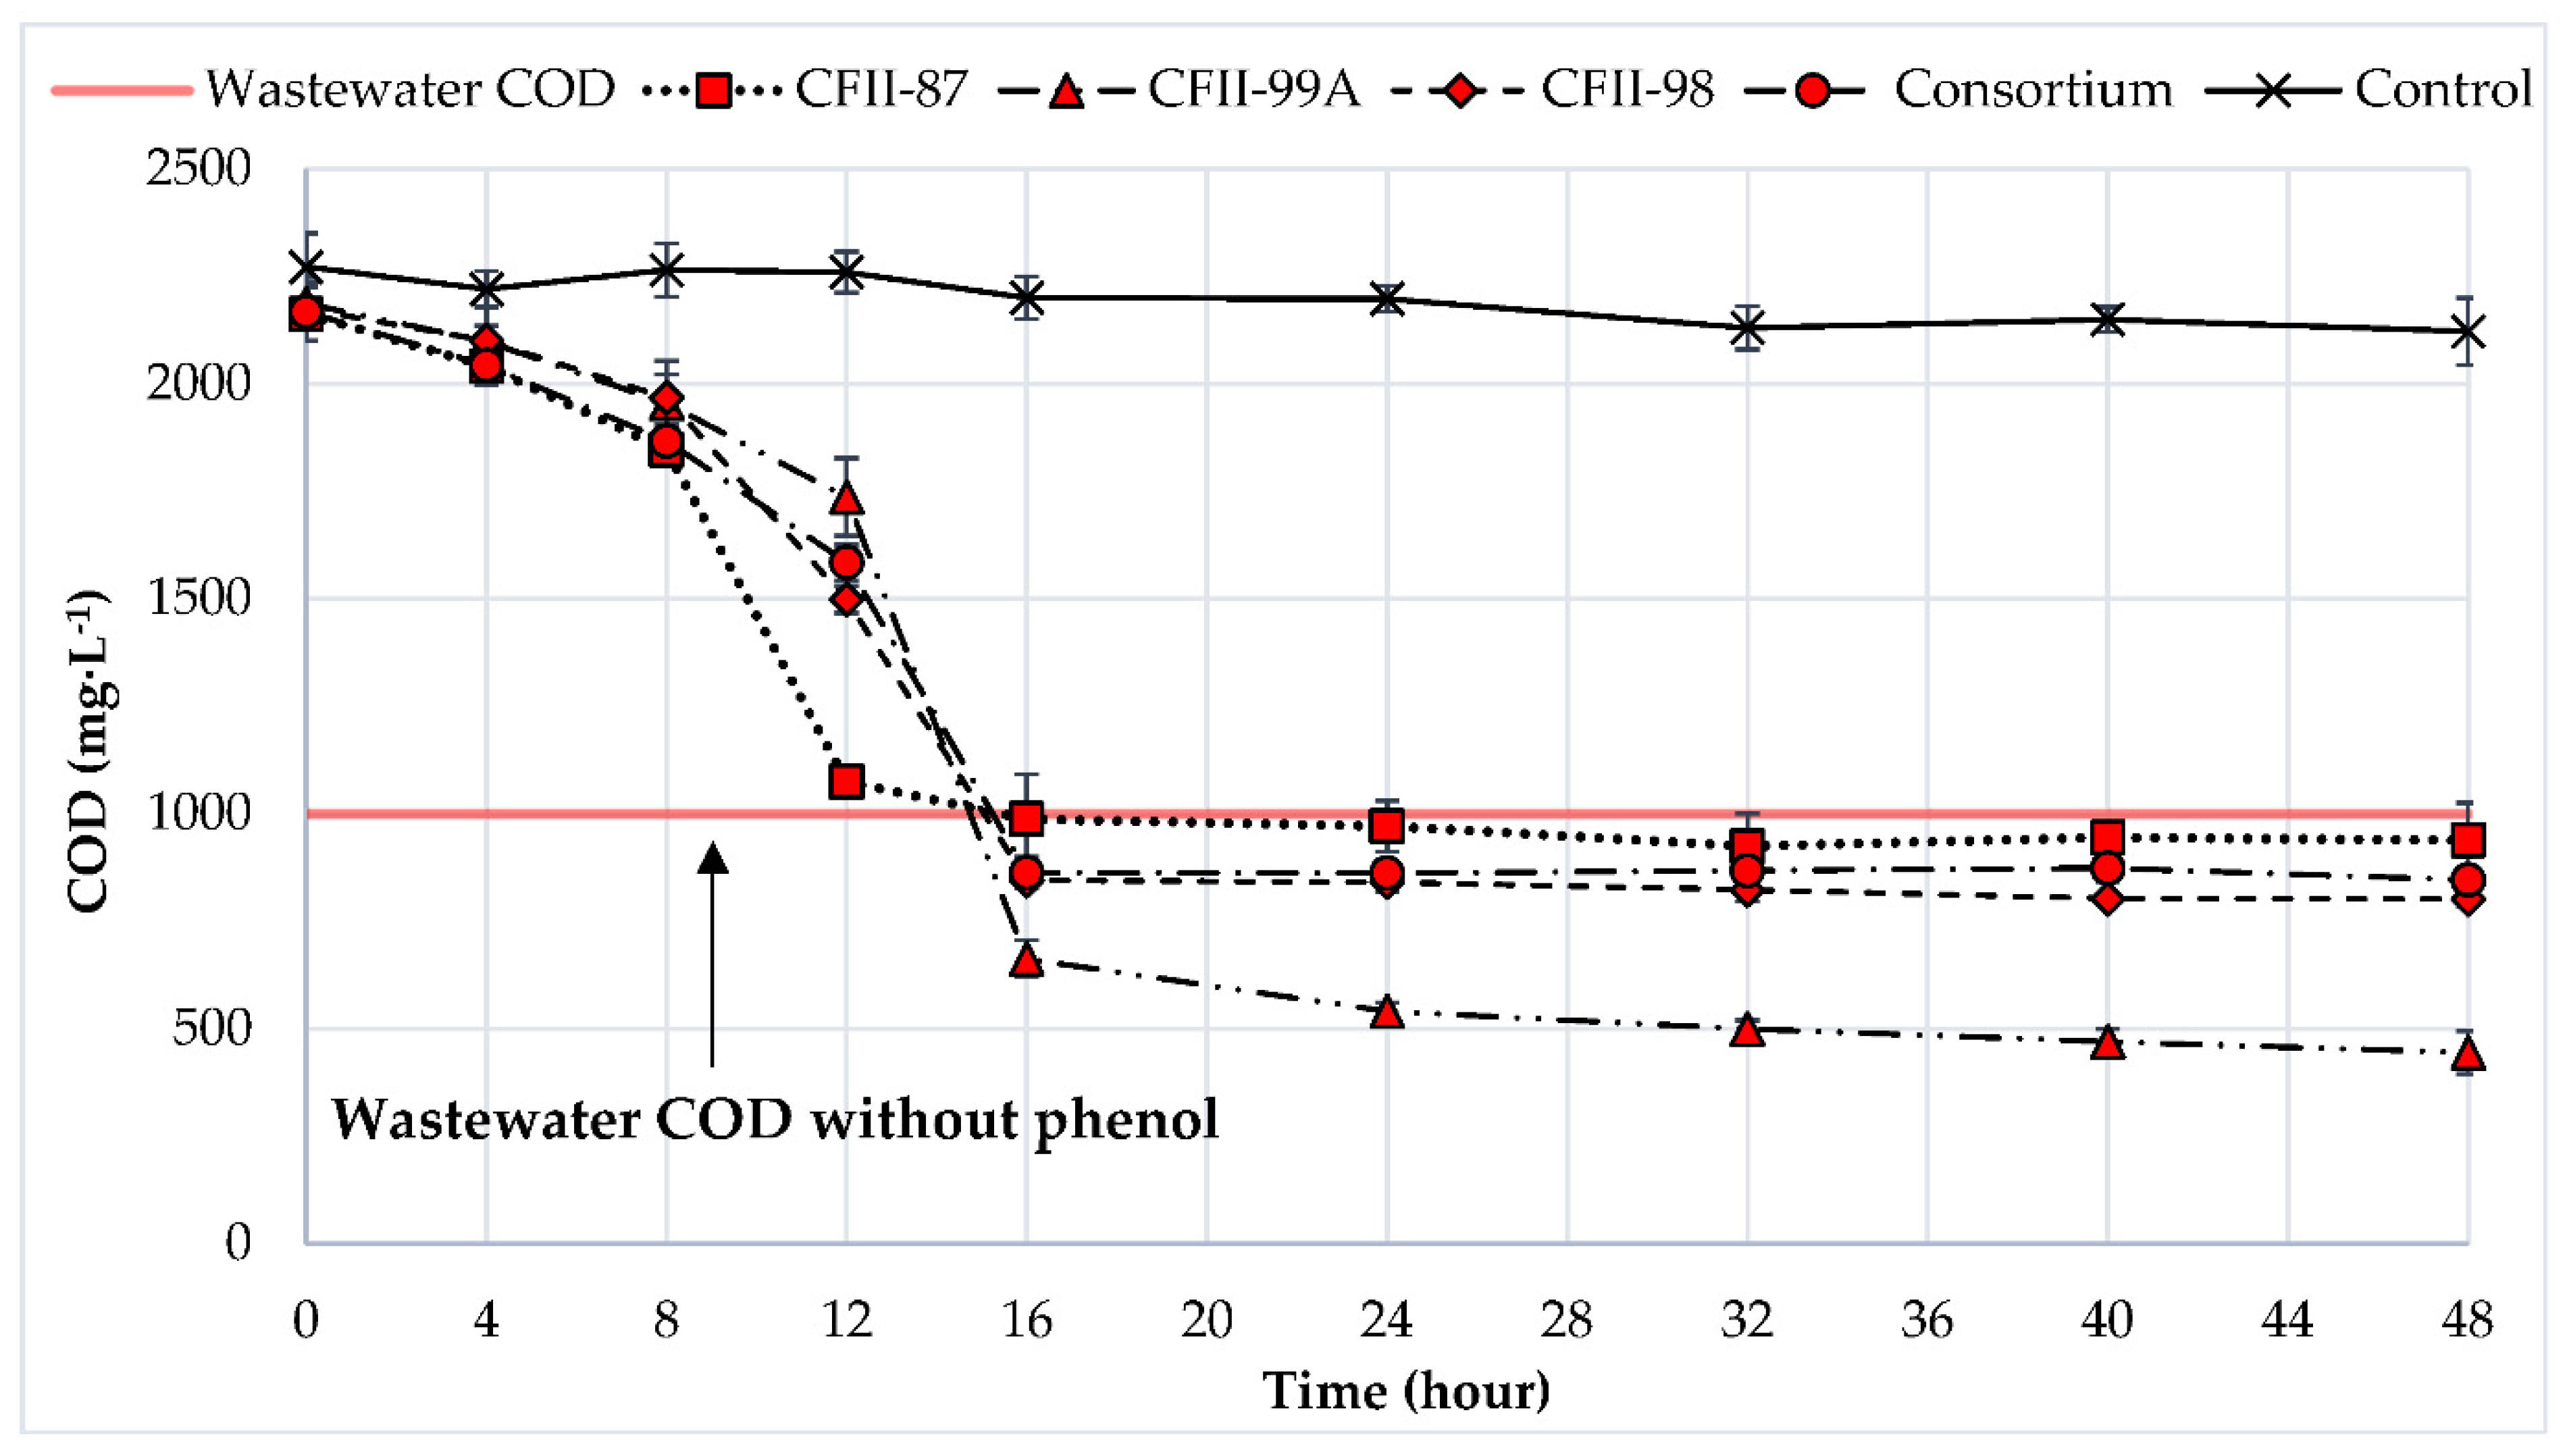
3.2. Phenol Degradation in a Multi-Carbon-Source Condition

The evolution of the volatile biomass (VSS) and phenol concentrations during the phenol-rich wastewater degradation experiments are shown in Figure 3 and Figure 4, respectively. The VSS curves show a strong negative correlation with the phenol: in each reactor, there was substantial biomass growth in the presence of phenol, indicating that the microorganisms primarily used phenol as the carbon and energy source despite the availability of other organic matter in the synthetic wastewater (Figure 3). In three reactors, the VSS concentration reached a plateau where the phenol was completely depleted from the wastewater. Only in the reactor inoculated with the strain A. johnsonii CFII-99A, the VSS concentration continued to increase despite the lack of phenol in the wastewater (after t = 24 h), clearly indicating that this strain also used other carbon sources for growth during the 48 h experiment. Strangely, in the reactor containing the bacterial consortia, no biomass growth was registered after the moment of complete phenol depletion, even though the strain A. johnsonii CFII-99A was also present in this reactor. A possible explanation is that the two other strains present in the reactor have much higher phenol affinity, and thus, they outcompeted the A. johnsonii CFII-99A strain. Hence, the biomass growth observed in this reactor can be attributed almost totally to strains A. towneri CFII-87 and A. sp. CFII-98, and at the moment of phenol depletion, the concentration of the strain A. johnsonii CFII-99A was so low that it could not significantly grow, despite its ability to use another carbon source present in the wastewater.
The reactors containing the strains A. towneri CFII-87 and A. sp. CFII-98 and the consortium degraded phenol almost entirely within 16 h, achieving >98% phenol removal. The same removal efficiency for the strain A. johnsonii CFII-99A was observed after 24 h of incubation time (Figure 4). Actually, the form of the phenol concentration curve of the strain A. towneri CFII-87 suggests that in this case, phenol was probably degraded in less than 16 h, but due to the 4 h sampling period, this information remains uncertain. It can be noted, however, that the reactor containing the strain A. towneri CFII-87 achieved a phenol removal efficiency of approx. 92% after 12 h, which was significantly higher than any of the other reactors (<60% in each case). Generally speaking, the initial phenol concentration of 500 mg·L−1 in synthetic wastewater was degraded somewhat faster than in the phenol removal experiments performed in the single-carbon-source conditions (Figure 2). This may have been due to the slight adaptation of the strains to phenol during inoculum preparation.
Specific phenol biodegradation rates for different time intervals of the degradation experiments, as well as the average values, are presented in Table 3, reflecting the phenol removal capacity of different reactor conditions normalized to biomass concentration. The strain A. towneri CFII-87 had the highest average removal rate of 122.37 mg phenol·g VSS h−1, followed by A. sp. CFII-98 and the consortium, and finally, A. johnsonii CFII-99A showed the lowest value of 77.81 mg phenol·g VSS h−1. The specific rate values corroborate d the findings on phenol and biomass concentration variations (Figure 3 and Figure 4), confirming that A. towneri CFII-87 and A. sp. CFII-98 had remarkable phenol degradation potential that could be used in bioaugmentation. Despite the initially low biomass concentration in the bioreactors, the strains degraded the phenol relatively quickly. This implies that by using these strains for the bioaugmentation of conventional bioreactor systems, good results could be achieved with a relatively small amount of inoculum. This might be especially important in the case of bioreactors without biomass retention, where washout of the active biomass may compromise the success of bioaugmentation.
In order to study the overall phenol removal efficiency based on the COD values, the non-phenolic COD concentration (i.e., synthetic wastewater COD without phenol) and total COD were observed during the experiments (Figure 5). The COD concentration of the control reactor was relatively constant, with an average value of 2196 ± 51.86 mg·L−1. At the end of the experiment (48th hour), the differences between the initial non-phenolic COD of 1000 mg·L−1 (Figure 5, WW COD) and the residual non-phenolic COD concentration in the reactor containing the strains A. towneri CFII-87 and A. sp. CFII-98 and the consortium were 938, 822 and 846 mg·L−1, respectively. These very similar values indicate that after the phenol was depleted in the reactors (around the 16th hour, Figure 4 and Figure 5), there was no remarkable consumption of other carbon sources. This finding was also supported by the plateau of the biomass concentration curves, which was reached after 16 h (Figure 3).
In the case of A. johnsonii CFII-99A, the COD concentration observed at t = 16 h was distinctly lower than in the other cases, showing that this strain also consumed other carbon sources, even when phenol was available in the reactor. The ability of the strain A. johnsonii CFII-99A to degrade carbon sources other than phenol was also confirmed by the slow decrease in the COD values in the reactor after the complete consumption of phenol (the period between 24 and 48 h). Due to this consumption of the non-phenolic COD by the end of the experiment (48 h), a final COD value of approx. 460 mg·L−1 was observed, which was significantly lower than in the other reactors. Furthermore, the form of the COD curve suggests that the concentration of COD would have further decreased in time after 48 h. The remaining high COD values in the other reactors indicate that A. towneri CFII-87, A. sp. CFII-98 and the consortium did not adapt to the use of other carbon sources besides the phenol found in the medium during the 48 h batch test.
The results of phenol degradation tests in the multi-carbon-source condition confirm that the strains A. towneri CFII-87 and A. sp. CFII-98 could be used for bioaugmentation of bioreactors treating phenolic wastewater. Both strains showed a high affinity toward phenol and manifested high specific phenol consumption rates (in excess of 100 mg phenol·g VSS h−1) in the multi-carbon-source environment. This latter is a very important parameter for bioaugmentation, where in practice, only a limited quantity of selected strains can be added to the autochthonous microbial population of the reactor. In this sense, the strain A. towneri CFII-87 in particular is remarkable, with a specific phenol consumption rate of 122.37 mg phenol·g VSS h−1 (related to the initial VSS quantity) and no lag time, promising fast and efficient bioaugmentation. These values were also good when compared with data reported in the literature on bioreactors treating phenolic wastewater. The experiments conducted by Lin et al. (2020) showed that phenol-adapted P. putida degraded 563.4 mg·L−1 phenol within 432 h in batch experiments using Mineral Salt Medium supplemented with beef extract and peptone, resulting in a specific degradation rate of 63.9 mg phenol·g VSS h−1 at 30 °C [39]. Kamali et al. (2019) reported a specific degradation rate of 117 mg phenol·g VSS h−1 using a long-time-acclimatized mixed-culture-activated sludge with an initial MLSS concentration of 1400 mg·L−1 in SBR running mode with a 500 mg·L−1 phenol concentration at room temperature [40]. In these conditions, it took 3 h to degrade the 500 mg·L−1 phenol. Many Acinetobacter strains were reported to be able to degrade and detoxify various types of pollutants [41,42,43,44,45,46,47,48]; therefore, due to versatile metabolic capabilities and adaptability to diverse environmental conditions (pH variations, temperature fluctuations, high levels of salinity), members of this genus seem to be good candidates for the bioremediation of hazardous materials.
Furthermore, our results indicate that based on their phenol-degrading capacity, the strains A. towneri CFII-87 and A. sp. CFII-98 could be used for the bioaugmentation of bioreactors, as other studies also pointed out that the long-term presence of the beneficial strains in the bioaugmented systems is equally important [49]. Survival and activity depend strongly on the type of system into which the strains are introduced and further trials are needed to determine the inoculation quantity and treatment time in long-term bioreactor experiments [50,51].

4. Conclusions

The three phenol-degrading bacteria, previously isolated from a landfill-leachate–treating bioreactor and identified as A. towneri CFII-87, A. johnsonii CFII-99A and A. sp. CFII-98, completely degraded the initial 500 mg·L−1 phenol, both in the single-carbon- and multi-carbon-source batch degradation experiments. The highest specific phenol degradation rates were observed for the strain A. towneri CFII-87, both in the tests with phenol as the sole carbon source and when tested on phenolic wastewater.
A. towneri CFII-87, A. sp. CFII-98 and the mixture of the three strains (consortium) degraded the initial 500 mg·L−1 phenol in a multi-carbon-source condition in 16 h and did not show significant affinity to other carbon sources present in the wastewater (as reflected by the high remaining residual COD). The strain A. johnsonii CFII-99A degraded the phenol in only 24 h and also utilized carbon sources other than phenol, resulting in significantly lower residual COD than in the other cases.
Our results indicate that the strains A. towneri CFII-87 and A. sp. CFII-98 showed a high affinity to phenol, utilizing it as the preferred carbon source; thus, their use separately or together in the bioaugmentation of wastewater bioreactors might be a viable way to increase the phenol removal rate of such systems. The fact that quick phenol removal was achieved despite using small amounts of inocula is also a desired attribute in practical bioaugmentation. In this study, better phenol degradation ratios were obtained in the bioreactors with mono-cultures, suggesting that the best bacterial strain for degrading also performed most of the phenol decomposition when used in the consortium.

Author Contributions

Conceptualization, S.S.; methodology, I.M. and D.-R.F.; validation, I.M. and S.S.; formal analysis, S.S. and D.-R.F.; resources, I.M. and T.F.; data curation, S.S. and D.-R.F.; writing—original draft preparation, S.S. and D.-R.F.; writing—review and editing, B.R.; visualization, S.S. and D.-R.F.; supervision, B.R. and S.L.; project administration, I.M. and T.F. All authors have read and agreed to the published version of the manuscript.

Funding

This work was funded by the Sapientia Foundation—Institute for Scientific Research grant IPC: 13/24/17.05.2017, and the preliminary results for the sampling and strain identification was funded by the Romanian National Authority for Scientific Research CNCS-UEFISCDI, grant PN-II-RU-TE-2012-3-0319.

Data Availability Statement

Not applicable.

Acknowledgments

Dezső-Róbert Fikó thanks the Collegium Talentum 2019 Programme of Hungary for their support. Tamás Felföldi was supported by the János Bolyai Research Scholarship of the Hungarian Academy of Sciences (grant ID: BO/00837/20/8).

Conflicts of Interest

The authors declare no conflict of interest.

References

  1. Nuhoglu, A.; Yalcin, B. Modelling of phenol removal in a batch reactor. Process. Biochem. 2005, 40, 1233–1239. [Google Scholar] [CrossRef]
  2. Duraisamy, P.; Sekar, J.; Arunkumar, A.D.; Ramalingam, P.V. Kinetics of Phenol Biodegradation by Heavy Metal Tolerant Rhizobacteria Glutamicibacter nicotianae MSSRFPD35 from Distillery Effluent Contaminated Soils. Front. Microbiol. 2020, 11, 1573. [Google Scholar] [CrossRef] [PubMed]
  3. Radziff, S.B.M.; Ahmad, S.A.; Shaharuddin, N.A.; Merican, F.; Kok, Y.-Y.; Zulkharnain, A.; Gomez-Fuentes, C.; Wong, C.-Y. Potential Application of Algae in Biodegradation of Phenol: A Review and Bibliometric Study. Plants 2021, 10, 2677. [Google Scholar] [CrossRef] [PubMed]
  4. Guerin, T.F. The effect of interactions between soil compaction and phenol contamination on plant growth characteristics: Implications for scaling bioremediation at industrial sites. J. Environ. Manag. 2022, 302, 114017. [Google Scholar] [CrossRef]
  5. Li, H.; Zhang, G.C.; Xie, H.C.; Li, K.; Zhang, S.Y. The effects of the phenol concentrations on photosynthetic parameters of Salix babylonica L. Photosynthetica 2015, 53, 430–435. [Google Scholar] [CrossRef]
  6. GESAMP. Revised GESAMP: Hazard Evaluation Procedure for Chemical Substances Carried by Ships, 2nd ed.; International Maritime Organization: London, UK.
  7. Duan, W.; Meng, F.; Cui, H.; Lin, Y.; Wang, G.; Wu, J. Ecotoxicity of phenol and cresols to aquatic organisms: A review. Ecotoxicol. Environ. Saf. 2018, 157, 441–456. [Google Scholar] [CrossRef]
  8. Canadian Council of Ministers of the Environment. Canadian water quality guidelines for the protection of aquatic life: Phenols—Mono- and dihydric phenols. In Canadian Environmental Quality Guidelines; Canadian Council of Ministers of the Environment: Winnipeg, MB, Canda, 1999. [Google Scholar]
  9. Public Health England. Phenol General Information; PHE Publications: Letchworth, UK, 2016; pp. 1–4.
  10. Hannaford, A.M.; Kuek, C. Aerobic batch degradation of phenol using immobilized Pseudomonas putida. J. Ind. Microbiol. Biotechnol. 1999, 22, 121–126. [Google Scholar] [CrossRef]
  11. Arutchelvan, V.; Kanakasabai, V.; Elangovan, R.; Nagarajan, S.; Muralikrishnan, V. Kinetics of high strength phenol degradation using Bacillus brevis. J. Hazard. Mater. 2006, 29, 216–222. [Google Scholar] [CrossRef]
  12. World Meteorological Organization (WMO). 2021 State of Climate Services: Water; World Meteorological Organization (WMO): Geneva, Switzerland, 2021. [Google Scholar]
  13. Said, K.A.M.; Ismail, A.F.; Karim, Z.A.; Abdullah, M.S.; Hafeez, A. A review of technologies for the phenolic compounds recovery and phenol removal from wastewater. Process. Saf. Environ. Prot. 2021, 151, 257–289. [Google Scholar] [CrossRef]
  14. Nakhli, S.A.A.; Ahmadizadeh, K.; Fereshtehnejad, M.; Rostami, M.H.; Safari, M.; Borghei, S.M. Biological removal of phenol from saline wastewater using a moving bed biofilm reactor containing acclimated mixed consortia. Springerplus 2014, 3, 112. [Google Scholar] [CrossRef] [Green Version]
  15. Pradeep, N.V.; Anupama, S.; Navya, K.; Shalini, H.N.; Idris, M.; Hampannavar, U.S. Biological removal of phenol from wastewaters: A mini review. Appl. Water Sci. 2015, 5, 105–112. [Google Scholar] [CrossRef]
  16. Inglezakis, V.; Malamis, S.; Omirkhan, A.; Nauruzbayeva, J.; Makhtayeva, Z.; Seidakhmetov, T.; Kudarova, A. Investigating the inhibitory effect of cyanide, phenol and 4-nitrophenol on the activated sludge process employed for the treatment of petroleum wastewater. J. Environ. Manag. 2017, 203, 825–830. [Google Scholar] [CrossRef]
  17. Rongsayamanont, C.; Khongkhaem, P.; Luepromchai, E.; Khan, E. Inhibitory effect of phenol on wastewater ammonification. Bioresour. Technol. 2020, 309, 123312. [Google Scholar] [CrossRef] [PubMed]
  18. Herrero, M.; Stuckey, D. Bioaugmentation and its application in wastewater treatment: A review. Chemosphere 2015, 140, 119–128. [Google Scholar] [CrossRef]
  19. Bajaj, M.; Gallert, C.; Winter, J. Biodegradation of high phenol containing synthetic wastewater by an aerobic fixed bed reactor. Bioresour. Technol. 2008, 99, 8376–8381. [Google Scholar] [CrossRef]
  20. Sivasubramanian, S.; Namasivayam, S.K.R. Phenol degradation studies using microbial consortium isolated from environmental sources. J. Environ. Chem. Eng. 2015, 3, 243–252. [Google Scholar] [CrossRef]
  21. Felföldi, T.; Nagymáté, Z.; Székely, A.J.; Jurecska, L.; Márialigeti, K. Biological treatment of coke plant effluents: From a microbiological perspective. Biol. Futur. 2020, 71, 359–370. [Google Scholar] [CrossRef]
  22. Hao, O.J.; Kim, M.H.; Seagren, E.A.; Kim, H. Kinetics of phenol and chlorophenol utilization by Acinetobacter species. Chemosphere 2002, 46, 797–807. [Google Scholar] [CrossRef] [PubMed]
  23. Poi, G.; Aburto-Medina, A.; Mok, P.C.; Ball, A.S.; Shahsavari, E. Bioremediation of Phenol-Contaminated Industrial Wastewater Using a Bacterial Consortium—From Laboratory to Field. Water Air Soil Pollut. 2017, 228, 89. [Google Scholar] [CrossRef]
  24. Silva, C.C.; Hayden, H.; Sawbridge, T.; Mele, P.; De Paula, S.O.; Silva, L.C.F.; Vidigal, P.M.P.; Vicentini, R.; Sousa, M.P.; Torres, A.P.R.; et al. Identification of Genes and Pathways Related to Phenol Degradation in Metagenomic Libraries from Petroleum Refinery Wastewater. PLoS ONE 2013, 8, e61811. [Google Scholar] [CrossRef] [Green Version]
  25. Van Schie, P.M.; Young, L.Y. Biodegradation of Phenol: Mechanisms and Applications. Bioremediation J. 2000, 4, 1–18. [Google Scholar] [CrossRef]
  26. Zhang, X.; Gao, P.; Chao, Q.; Wang, L.; Senior, E.; Zhao, L. Microdiversity of phenol hydroxylase genes among phenol-degrading isolates of Alcaligenes sp. from an activated sludge system. FEMS Microbiol. Lett. 2004, 237, 369–375. [Google Scholar] [CrossRef] [Green Version]
  27. Szilveszter, S.; Fikó, D.-R.; Máthé, I.; Felföldi, T.; Ráduly, B. Kinetic characterization of a new phenol degrading Acinetobacter towneri strain isolated from landfill leachate treating bioreactor. World J. Microbiol. Biotechnol. 2023, 39, 1–11. [Google Scholar] [CrossRef] [PubMed]
  28. APHA. Standard Methods for the Examination of Water and Wastewater; American Public Health Association (APHA): Washington, DC, USA, 2005.
  29. Watanabe, K.; Teramoto, M.; Futamata, H.; Harayama, S. Molecular Detection, Isolation, and Physiological Characterization of Functionally Dominant Phenol-Degrading Bacteria in Activated Sludge. Appl. Environ. Microbiol. 1998, 64, 4396–4402. [Google Scholar] [CrossRef]
  30. Nopens, I.; Capalozza, C.; Vanrolleghem, P.A. Stability Analysis of a Synthetic Municipal Wastewater (Technical Report); Department of Applied Mathematics Biometrics and Process Control, University of Gent: Gent, Belgium, 2001. [Google Scholar]
  31. Xu, N.; Qiu, C.; Yang, Q.; Zhang, Y.; Wang, M.; Ye, C.; Guo, M. Analysis of Phenol Biodegradation in Antibiotic and Heavy Metal Resistant Acinetobacter lwoffii NL1. Front. Microbiol. 2021, 12, 725755. [Google Scholar] [CrossRef] [PubMed]
  32. Tian, M.; Du, D.; Zhou, W.; Zeng, X.; Cheng, G. Phenol degradation and genotypic analysis of dioxygenase genes in bacteria isolated from sediments. Braz. J. Microbiol. 2017, 48, 305–313. [Google Scholar] [CrossRef] [PubMed]
  33. Liu, Z.; Xie, W.; Li, D.; Peng, Y.; Li, Z.; Liu, S. Biodegradation of Phenol by Bacteria Strain Acinetobacter Calcoaceticus PA Isolated from Phenolic Wastewater. Int. J. Environ. Res. Public Health 2016, 13, 300. [Google Scholar] [CrossRef] [Green Version]
  34. Wang, Y.; Tian, Y.; Han, B.; Zhao, H.-B.; Bi, J.-N.; Cai, B.-L. Biodegradation of phenol by free and immobilized Acinetobacter sp. strain PD12. J. Environ. Sci. 2007, 19, 222–225. [Google Scholar] [CrossRef] [PubMed]
  35. Adav, S.S.; Chen, M.-Y.; Lee, D.-J.; Ren, N.-Q. Degradation of phenol by Acinetobacter strain isolated from aerobic granules. Chemosphere 2007, 67, 1566–1572. [Google Scholar] [CrossRef]
  36. Gracioso, L.H.; Vieira, P.B.; Baltazar, M.P.G.; Avanzi, I.R.; Karolski, B.; Nascimento, C.A.O.; Perpetuo, E.A. Removal of phenolic compounds from raw industrial wastewater by Achromobacter sp. isolated from a hydrocarbon-contaminated area. Water Environ. J. 2018, 33, 40–50. [Google Scholar] [CrossRef] [Green Version]
  37. Alexievaa, Z.; Gerginova, M.; Zlateva, P.; Peneva, N. Comparison of growth kinetics and phenol metabolizing enzymes of Trichosporon cutaneum R57 and mutants with modified degradation abilities. Enzym. Microb. Technol. 2004, 34, 242–247. [Google Scholar] [CrossRef]
  38. Adav, S.S.; Chen, M.-Y.; Lee, D.-J.; Ren, N.-Q. Degradation of phenol by aerobic granules and isolated yeast Candida tropicalis. Biotechnol. Bioeng. 2006, 96, 844–852. [Google Scholar] [CrossRef] [PubMed]
  39. Lin, Y.-H.; Cheng, Y.-S. Phenol Degradation Kinetics by Free and Immobilized Pseudomonas putida BCRC 14365 in Batch and Continuous-Flow Bioreactors. Processes 2020, 8, 721. [Google Scholar] [CrossRef]
  40. Kamali, M.; Gameiro, T.; Costa, M.E.; Capela, I.; Aminabhavi, T.M. Enhanced biodegradation of phenolic wastewaters with acclimatized activated sludge—A kinetic study. Chem. Eng. J. 2019, 378, 122186. [Google Scholar] [CrossRef]
  41. Lin, H.; Chen, G.; Zhang, Z.; Ren, Y. Exploration of the mechanism of 2-CP degradation by Acinetobacter sp. stimulated by Lactobacillus plantarum fermentation waste: A bio-waste reuse. Environ. Res. 2023, 231, 116119. [Google Scholar] [CrossRef]
  42. Wang, P.; Wei, H.; Ke, T.; Fu, Y.; Zeng, Y.; Chen, C.; Chen, L. Characterization and genome analysis of Acinetobacter oleivorans S4 as an efficient hydrocarbon-degrading and plant-growth-promoting rhizobacterium. Chemosphere 2023, 331, 138732. [Google Scholar] [CrossRef] [PubMed]
  43. Xiang, Y.; Li, S.; Rene, E.R.; Lun, X.; Zhang, P.; Ma, W. Detoxification of fluoroglucocorticoid by Acinetobacter pittii C3 via a novel defluorination pathway with hydrolysis, oxidation and reduction: Performance, genomic characteristics, and mechanism. J. Hazard. Mater. 2023, 452, 131302. [Google Scholar] [CrossRef]
  44. Tang, L.; Zhao, X.; Chen, X.; Jiang, Y.; Gudda, F.; Wang, Y.; Ling, W. Distribution of bound-PAH residues and their correlations with the bacterial community at different depths of soil from an abandoned chemical plant site. J. Hazard. Mater. 2023, 453, 131328. [Google Scholar] [CrossRef] [PubMed]
  45. Zhan, H.; Wang, H.; Liao, L.; Feng, Y.; Fan, X.; Zhang, L.; Chen, S. Kinetics and Novel Degradation Pathway of Permethrin in Acinetobacter baumannii ZH-14. Front. Microbiol. 2018, 9, 98. [Google Scholar] [CrossRef] [Green Version]
  46. Ye, T.; Zhou, T.; Fan, X.; Bhatt, P.; Zhang, L.; Chen, S. Acinetobacter lactucae Strain QL-1, a Novel Quorum Quenching Candidate Against Bacterial Pathogen Xanthomonas campestris pv. campestris. Front. Microbiol. 2019, 10, 2867. [Google Scholar] [CrossRef] [Green Version]
  47. Ye, T.; Zhou, T.; Xu, X.; Zhang, W.; Fan, X.; Mishra, S.; Zhang, L.; Zhou, X.; Chen, S. Whole-Genome Sequencing Analysis of Quorum Quenching Bacterial Strain Acinetobacter lactucae QL-1 Identifies the FadY Enzyme for Degradation of the Diffusible Signal Factor. Int. J. Mol. Sci. 2020, 21, 6729. [Google Scholar] [CrossRef] [PubMed]
  48. Zhang, W.; Luo, Q.; Zhang, Y.; Fan, X.; Ye, T.; Mishra, S.; Bhatt, P.; Zhang, L.; Chen, S. Quorum Quenching in a Novel Acinetobacter sp. XN-10 Bacterial Strain against Pectobacterium carotovorum subsp. carotovorum. Microorganisms 2020, 8, 1100. [Google Scholar] [CrossRef] [PubMed]
  49. Zhu, X.; Liu, R.; Liu, C.; Chen, L. Bioaugmentation with isolated strains for the removal of toxic and refractory organics from coking wastewater in a membrane bioreactor. Biodegradation 2015, 26, 465–474. [Google Scholar] [CrossRef]
  50. Fuller, M.E.; Hatzinger, P.B.; Condee, C.W.; Andaya, C.; Vainberg, S.; Michalsen, M.M.; Crocker, F.H.; Indest, K.J.; Jung, C.M.; Eaton, H.; et al. Laboratory evaluation of bioaugmentation for aerobic treatment of RDX in groundwater. Biodegradation 2015, 26, 77–89. [Google Scholar] [CrossRef] [PubMed]
  51. Tchelet, R.; Meckenstock, R.; Steinle, P.; van der Meer, J.R. Population dynamics of an introduced bacterium degrading chlorinated benzenes in a soil column and in sewage sludge. Biodegradation 1999, 10, 113–125. [Google Scholar] [CrossRef]
Figure 1. Schematic representation of the assembled bioreactor used in this study.
Water 15 02815 g001
Figure 2. Biomass growth and substrate degradation patterns of the strains in flasks. Measurements were performed in triplicates.
Water 15 02815 g002aWater 15 02815 g002b
Figure 3. Evolution of the biomass concentration of the studied strains and the consortium in the bioreactors treating phenol-rich synthetic wastewater.
Water 15 02815 g003
Figure 4. The change in phenol concentration of the studied strains and the consortium in the bioreactors.
Water 15 02815 g004
Figure 5. Evolution of the COD concentrations in the batch bioreactors treating phenol-rich synthetic wastewater in the case of the studied bacterial strains and the bacterial consortium.
Water 15 02815 g005
Table 1. Composition of the synthetic wastewater used in the experiment [30].
mg·L−1COD, mg·L−1N, mg·L−1P, mg·L−1g·2 L−1 conc. = 240 L
Chemical Compounds
Urea91.7423.22 42.81022.01
NH4Cl12.7503.5203.06
Na-acetate 3H2O131.6479.370031.59
Peptone17.4117.410.6704.17
MgHPO4·3H2O29.02005.146.96
KH2PO423.40003.145.61
FeSO4·7H2O5.800001.39
Main carbon sources
Starch122.00122.000029.28
Milk powder116.19116.196.951.1427.88
Yeast extract52.2452.246.28012.53
Soy oil29.0229.02006.96
Total631.21439.4560.239.42151.44
Trace metals mg metal/L
Cr(NO3)3·9H2O0.7700.100 0.1848
CuCl2·2H2O0.5360.200 0.1286
MnSO4·H2O0.1080.035 0.0259
NiSO4·6H2O0.3360.075 0.0806
PbCl20.1000.075 0.0240
ZnCl20.2080.100 0.0499
Total2.0580.585 0.4938
Table 2. Growth rates of the bacterial strains at different initial phenol concentrations.
Bacterial Strain/Phenol Concentration100 mg·L−1500 mg·L−1
Lag Time (h)µµmaxmg Phenol·L−1·h−1Lag Time (h)µµmaxmg Phenol·L−1·h−1
A. towneri CFII-8700.420.5919.6600.230.3031.25
A. johnsonii CFII-99A30.360.5012.86120.140.2015.68
A. sp. CFII-9840.460.6411.9080.210.2925.68
Table 3. Specific phenol biodegradation rates in synthetic wastewater.
Time Interval (Hour)/
Sample
mg Phenol·g VSS h−1
A. towneri CFII-87A. johnsonii CFII-99AA. sp. CFII-98Consortium
1–476.07 ± 11.7963.08 ± 18.0842.76 ± 3.2969.54 ± 15.70
4–8100.82 ± 7.4272.78 ± 15.3959.26 ± 2.3481.26 ± 0.72
8–12282.11 ± 13.3490.41 ± 9.78178.84 ± 20.9593.20 ± 5.48
12–1630.46 ± 0.94141.01 ± 11.94133.06 ± 7.82146.76 ± 3.33
16–24 21.75 ± 0.95
Average122.37 ± 1.8377.81 ± 1.41103.48 ± 1.8797.69 ± 3.69
Disclaimer/Publisher’s Note: The statements, opinions and data contained in all publications are solely those of the individual author(s) and contributor(s) and not of MDPI and/or the editor(s). MDPI and/or the editor(s) disclaim responsibility for any injury to people or property resulting from any ideas, methods, instructions or products referred to in the content.

