
Selection Frameworks for Potential Rainwater Harvesting Sites in Arid and Semi-Arid Regions: A Systematic Literature Review


Abstract
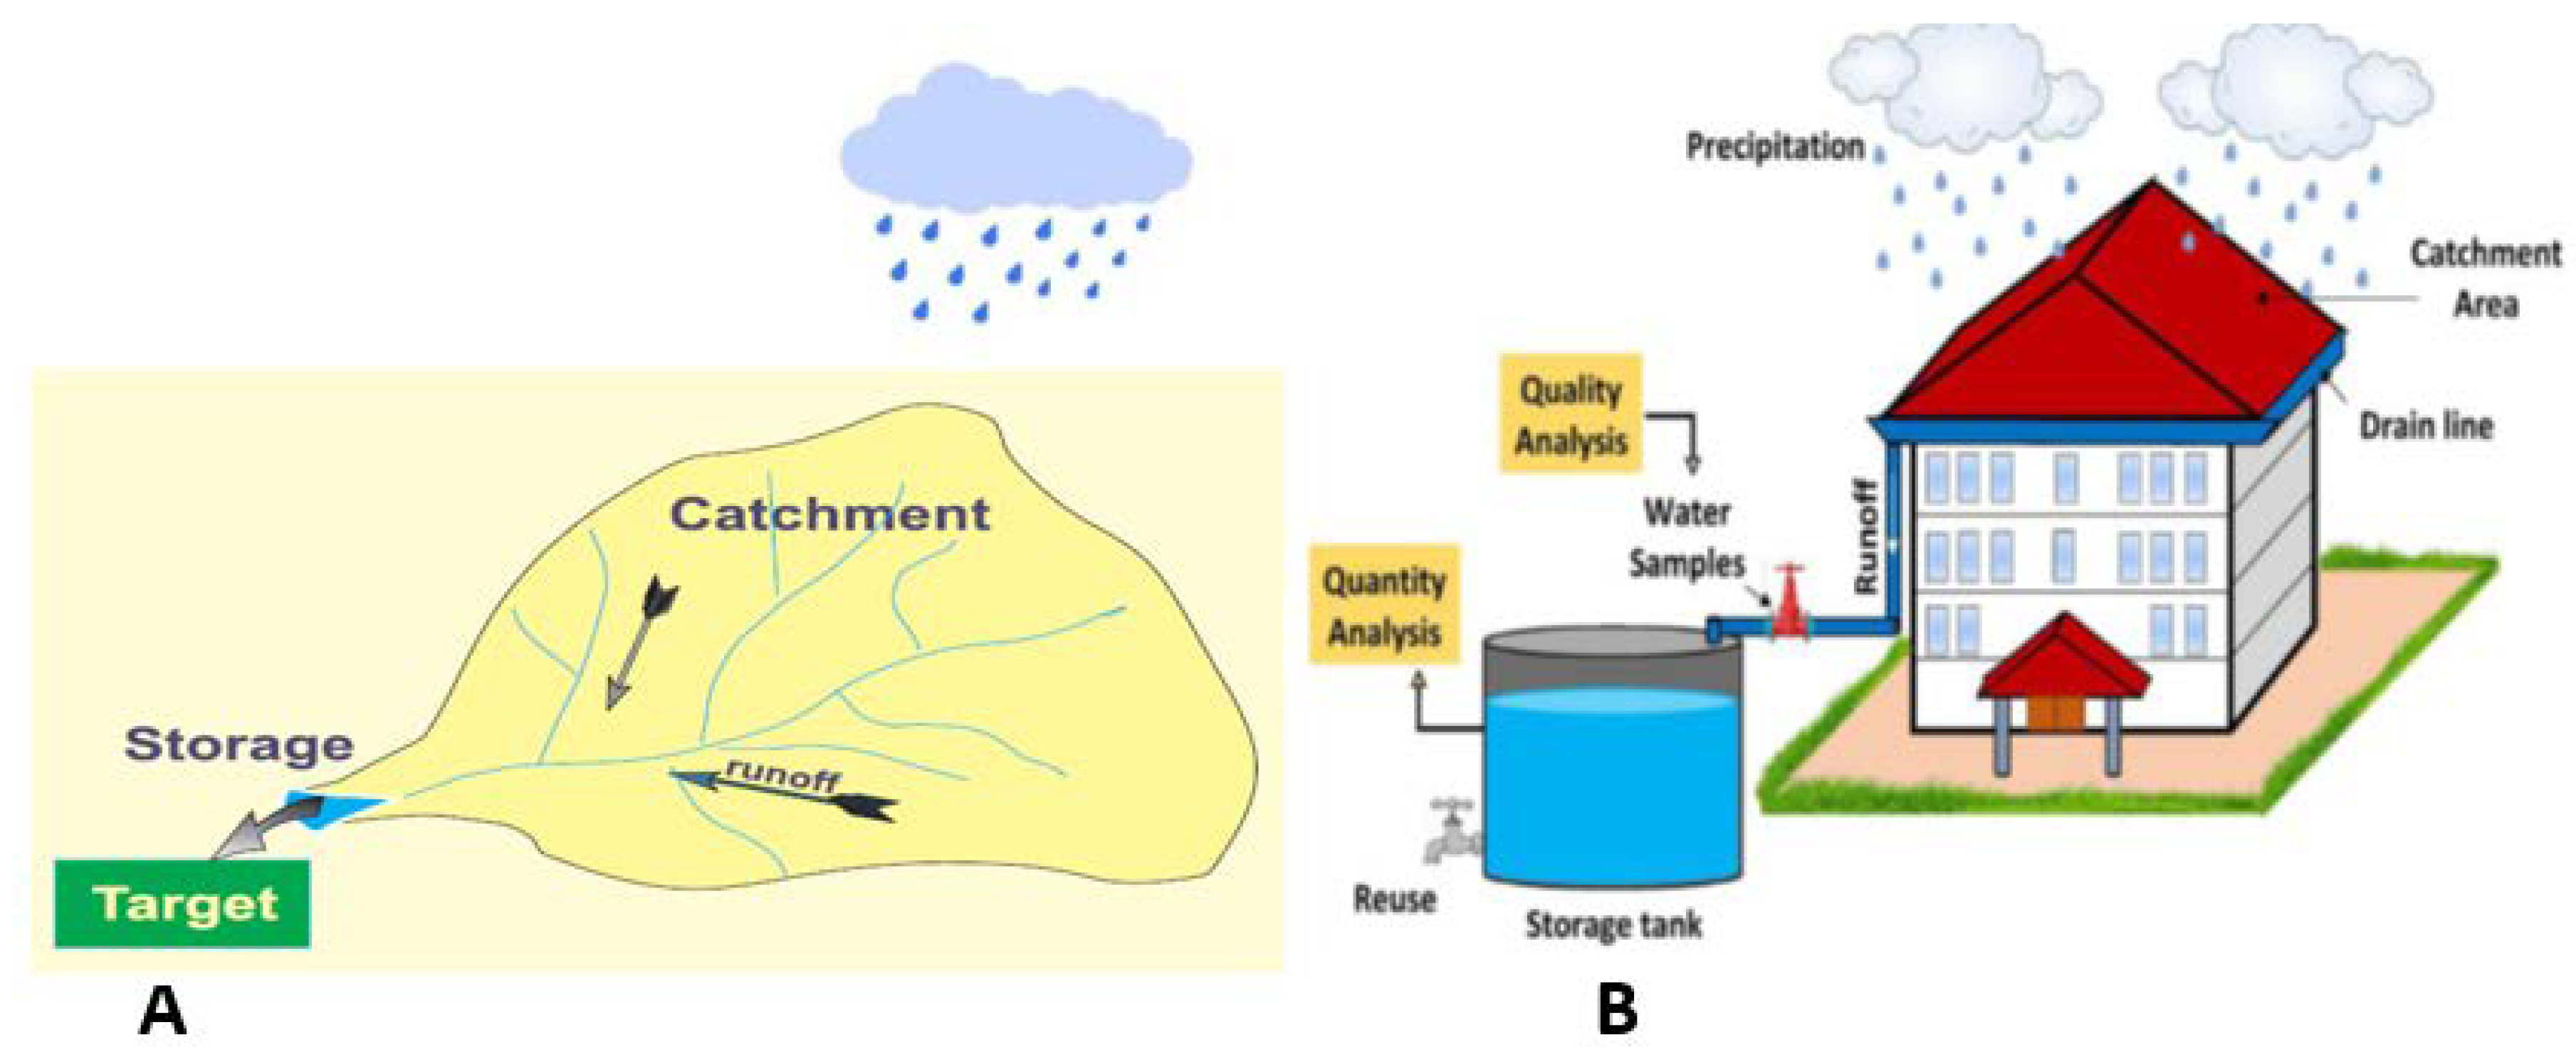
1. Introduction
- What RWH site selection criteria have been used in existing frameworks?
- What are the differences and similarities in the way these frameworks combine the criteria they use, i.e., their scaling and weighting methods?
- What gaps exist in the criteria currently applied, and what future work is necessary to improve frameworks, particularly bearing in mind the need for sustainability?
2. Indicator-Based Frameworks and Their Criteria
2.1. Indicators
- Available: the data should be easy to access or measure.
- Measurable: the criterion may be easily measured and analysed quantitatively.
- Repeatability: if the indicator is evaluated following the same method for the same region under the same conditions, it will provide the same result each time.
- Validity: There must be a distinct connection between a criterion and the issue it is intended to demonstrate.
2.2. Standardization of Indicators
2.3. Weighting Scheme
3. Methodology
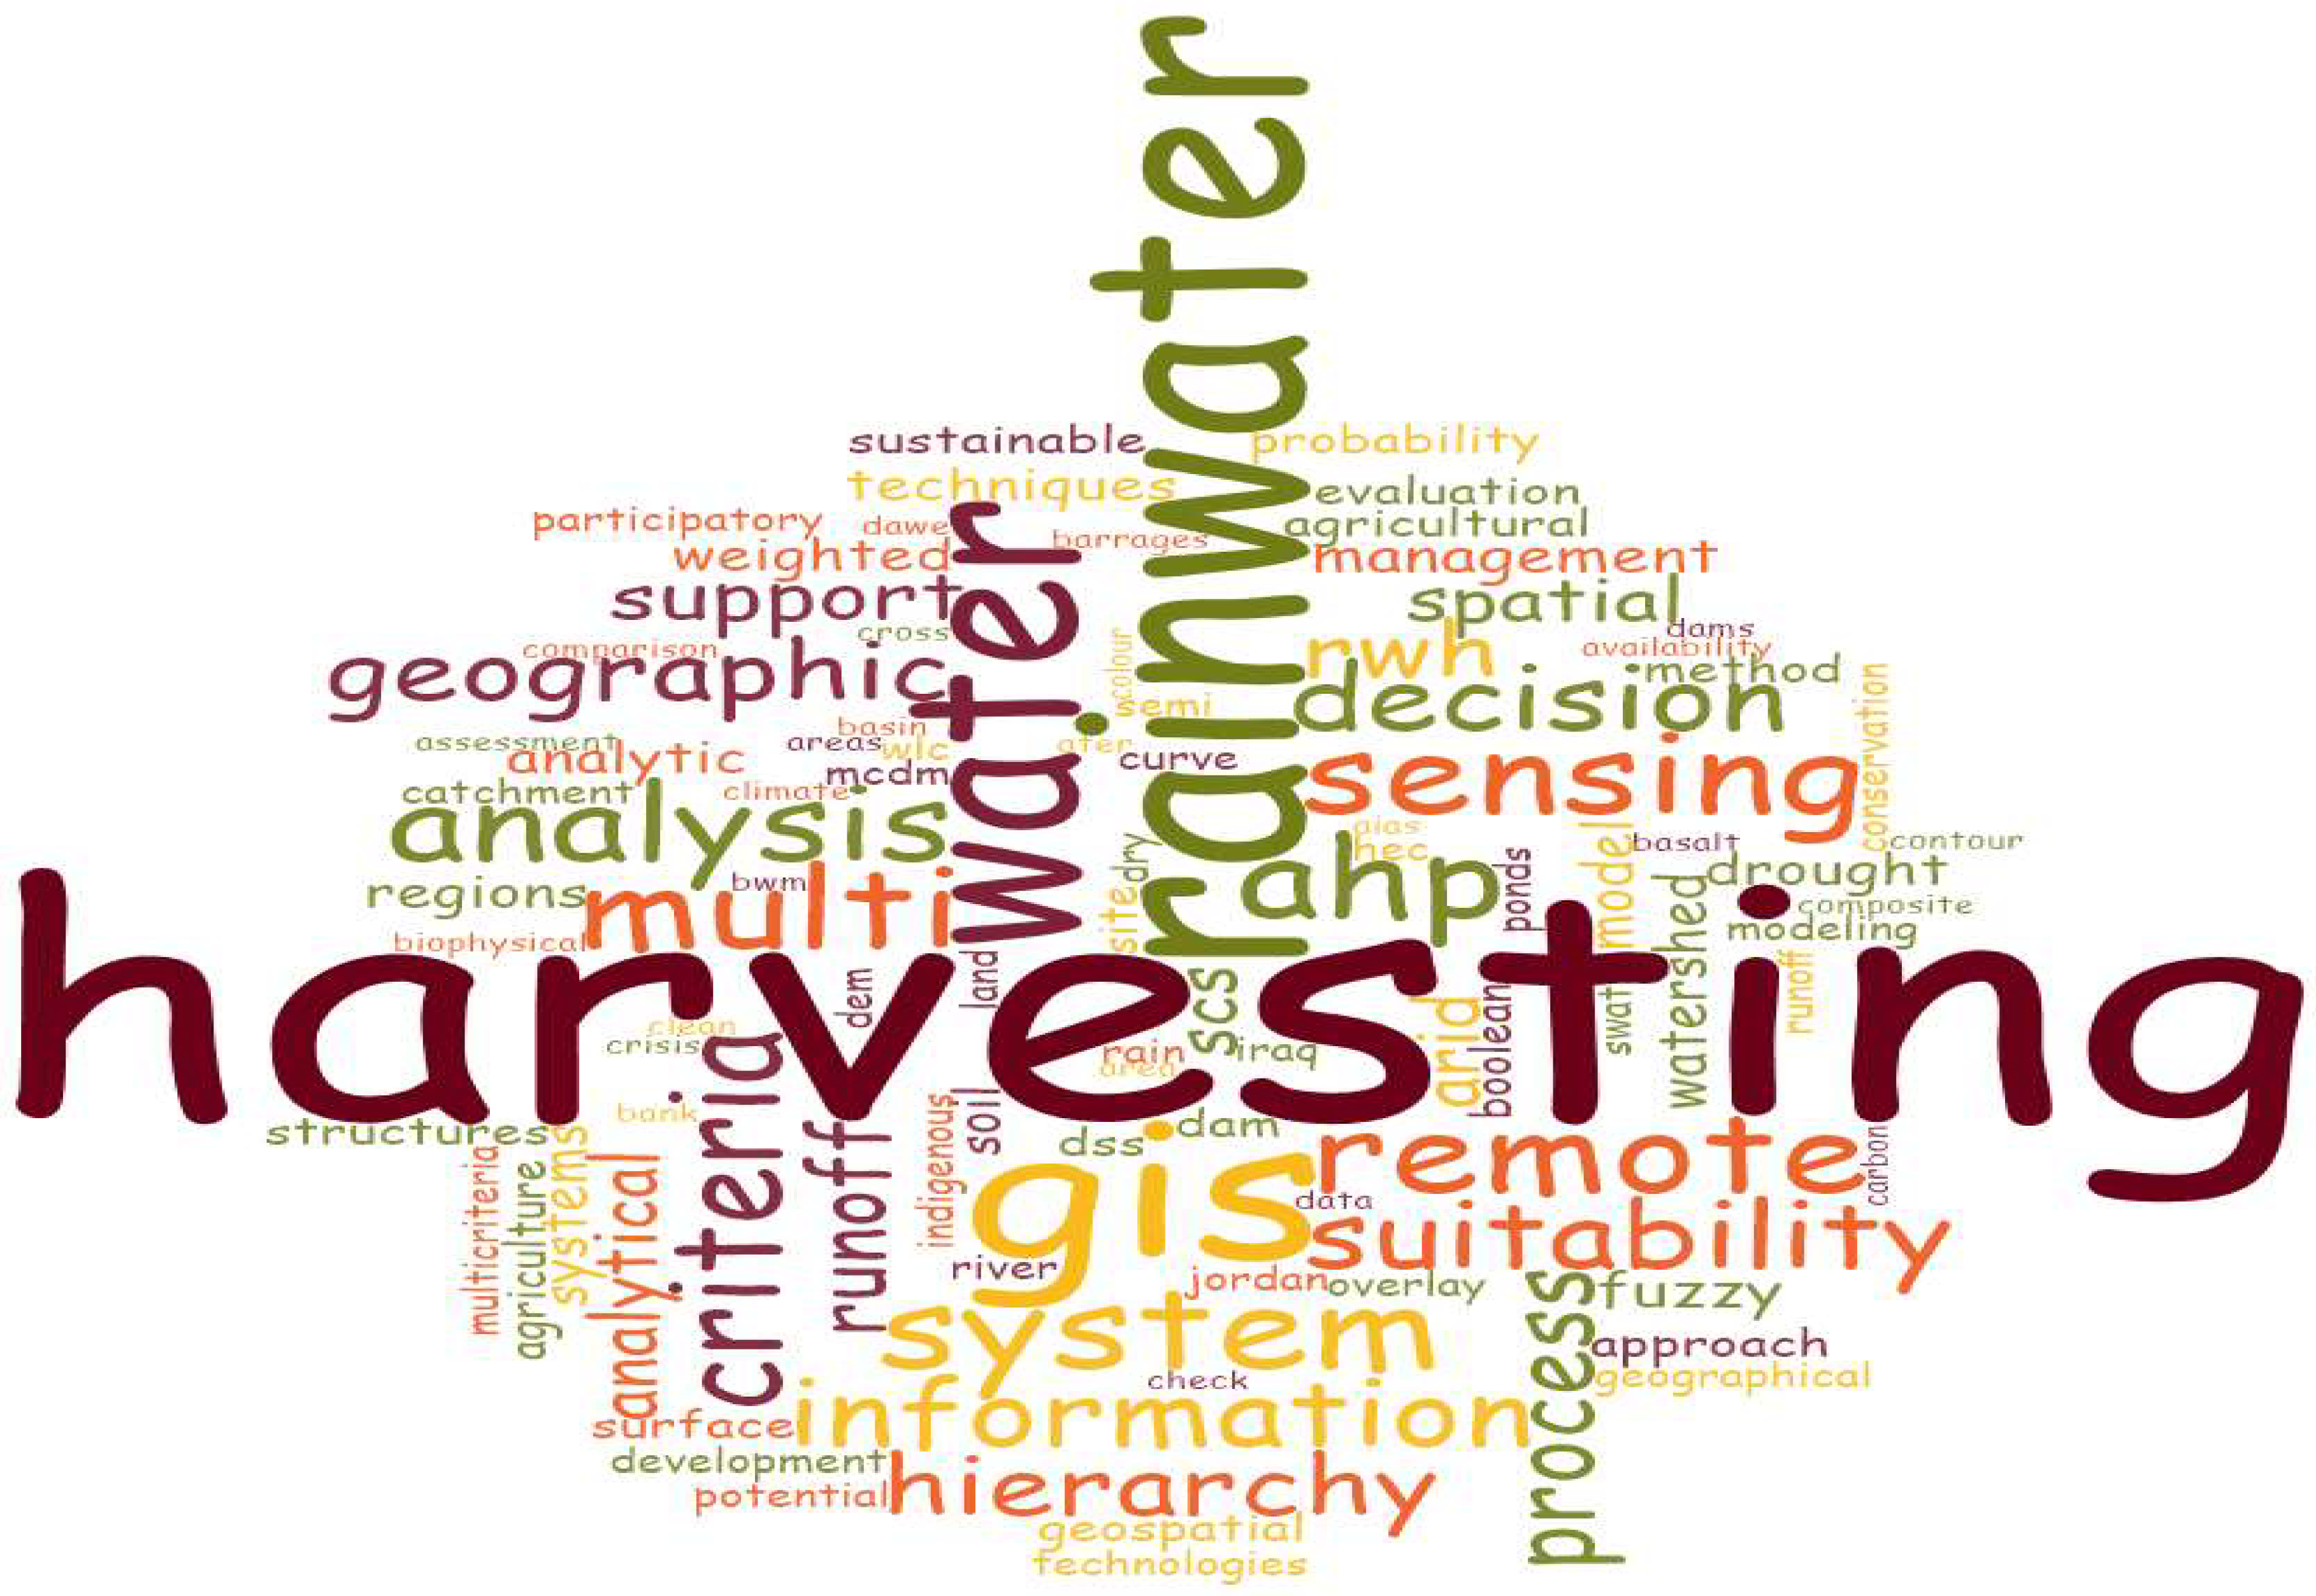
3.1. Search Queries and Keyword Selection
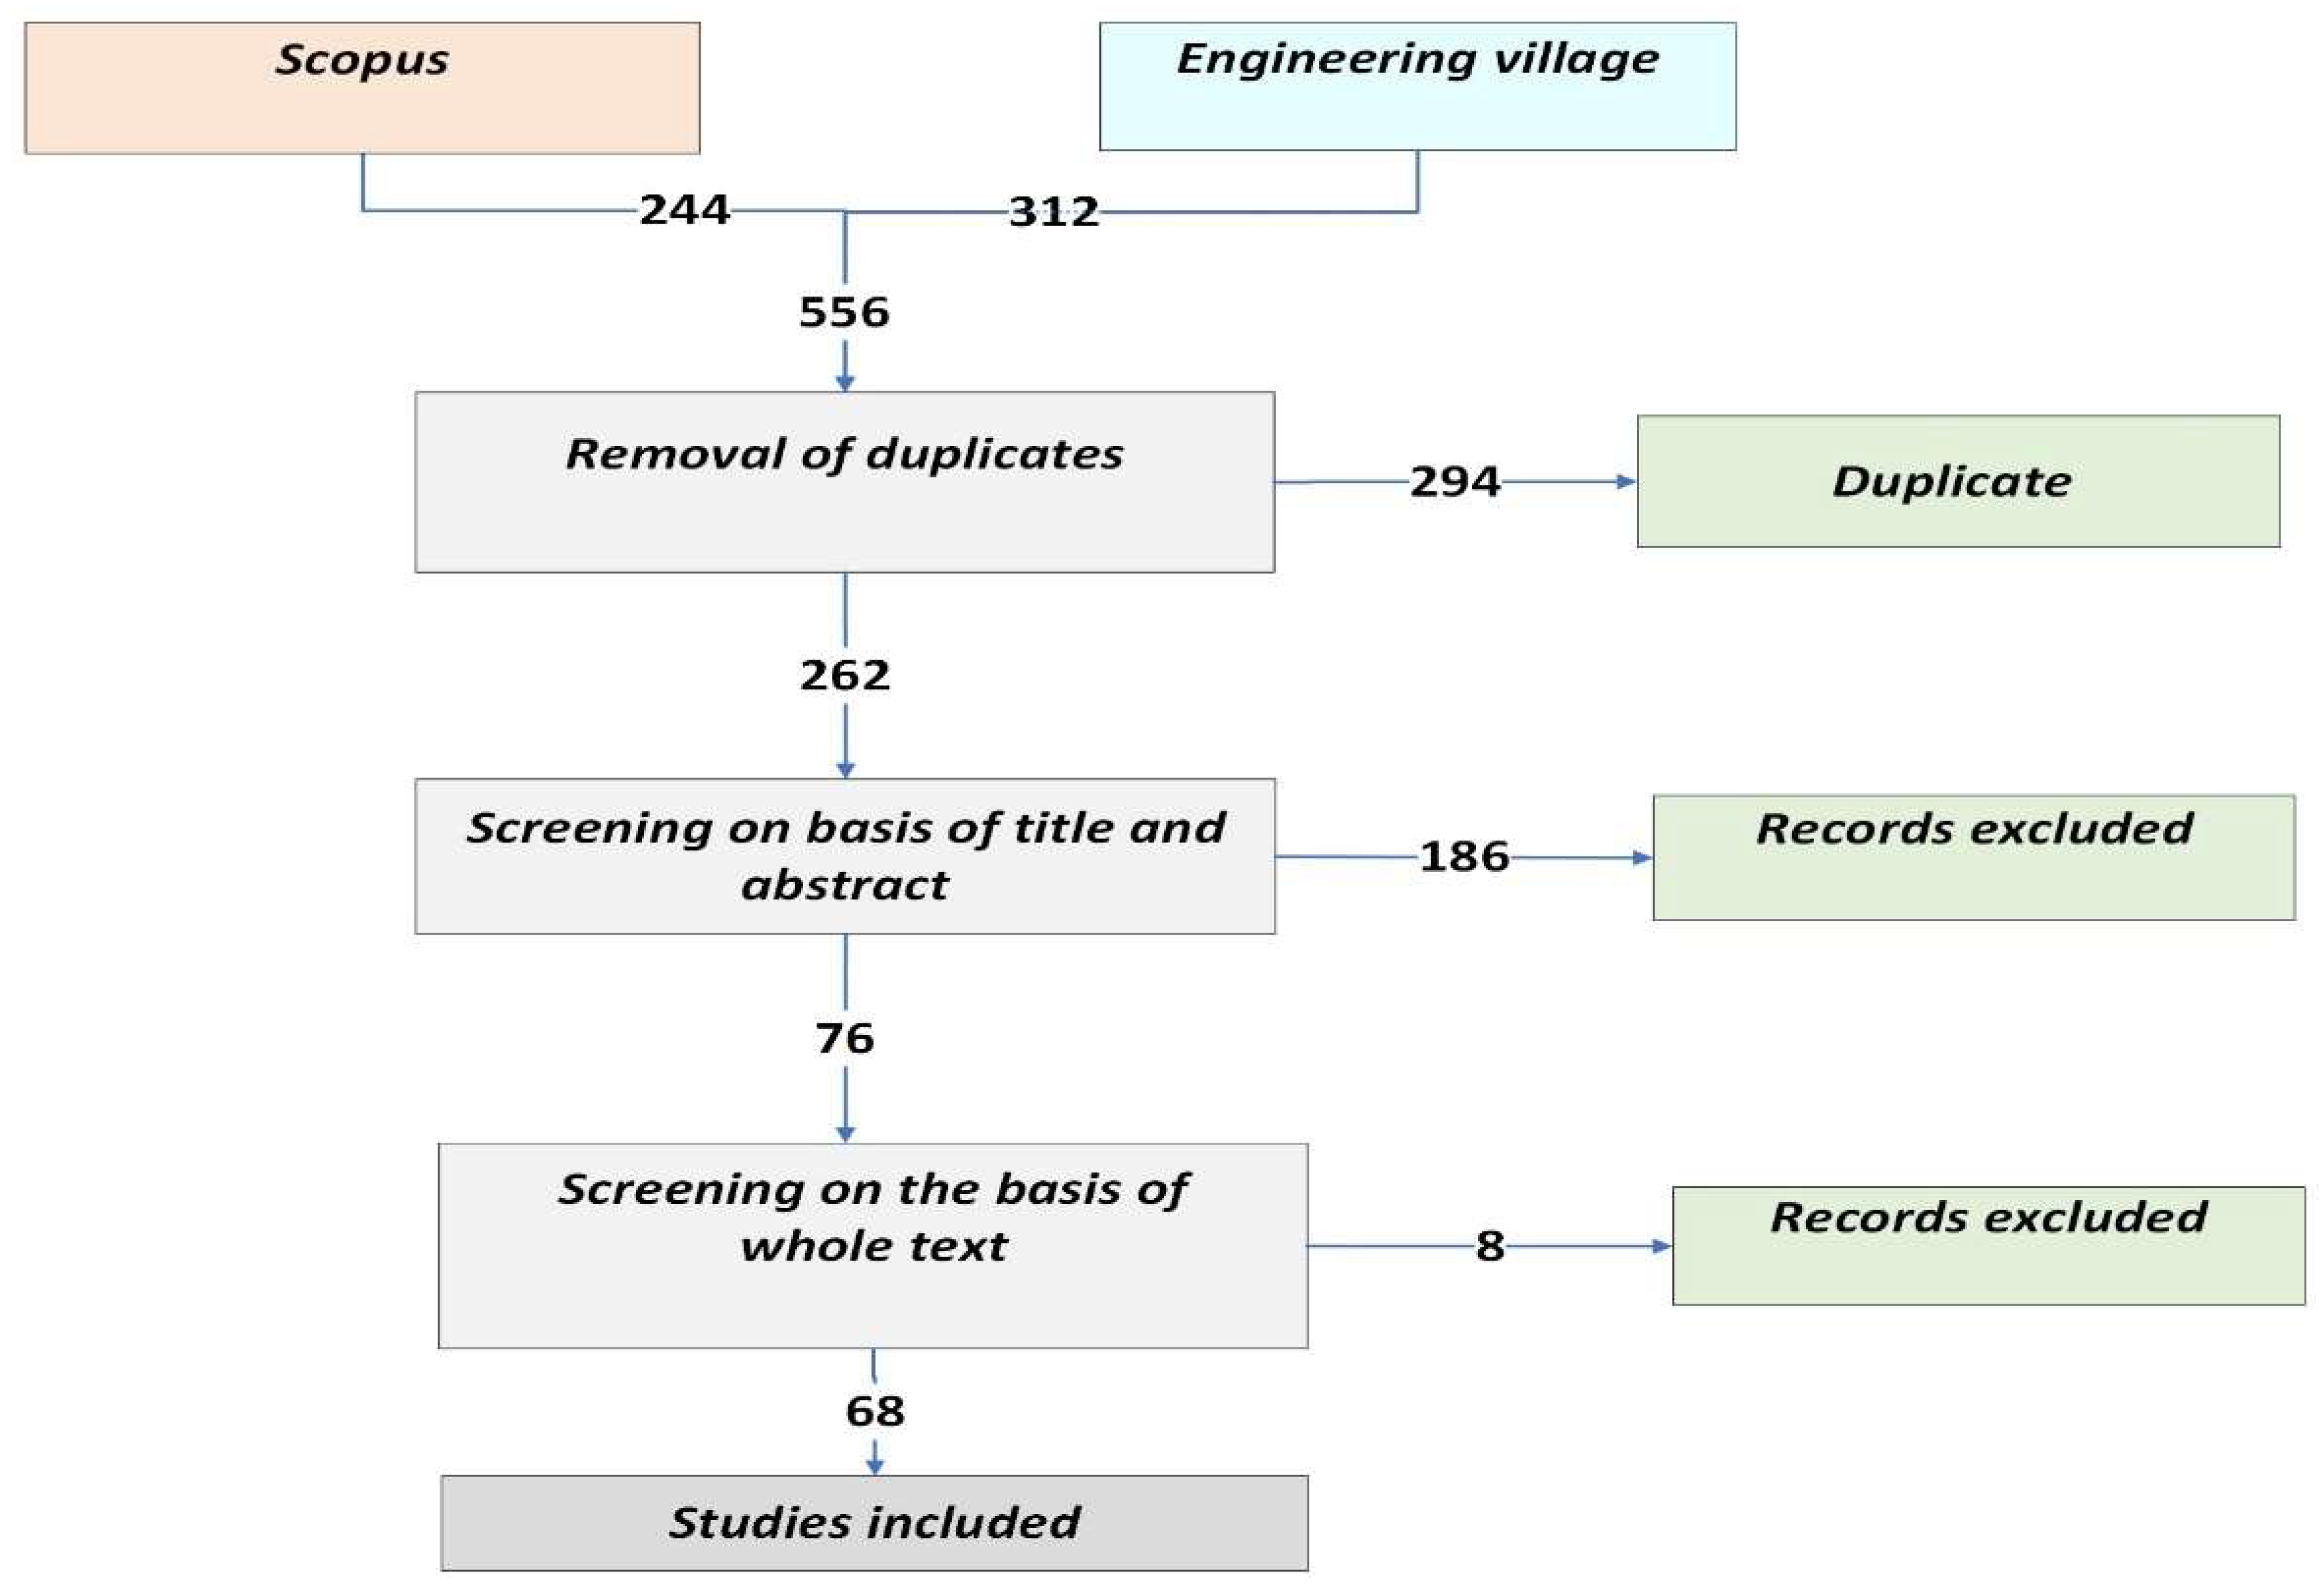
3.2. Database Search
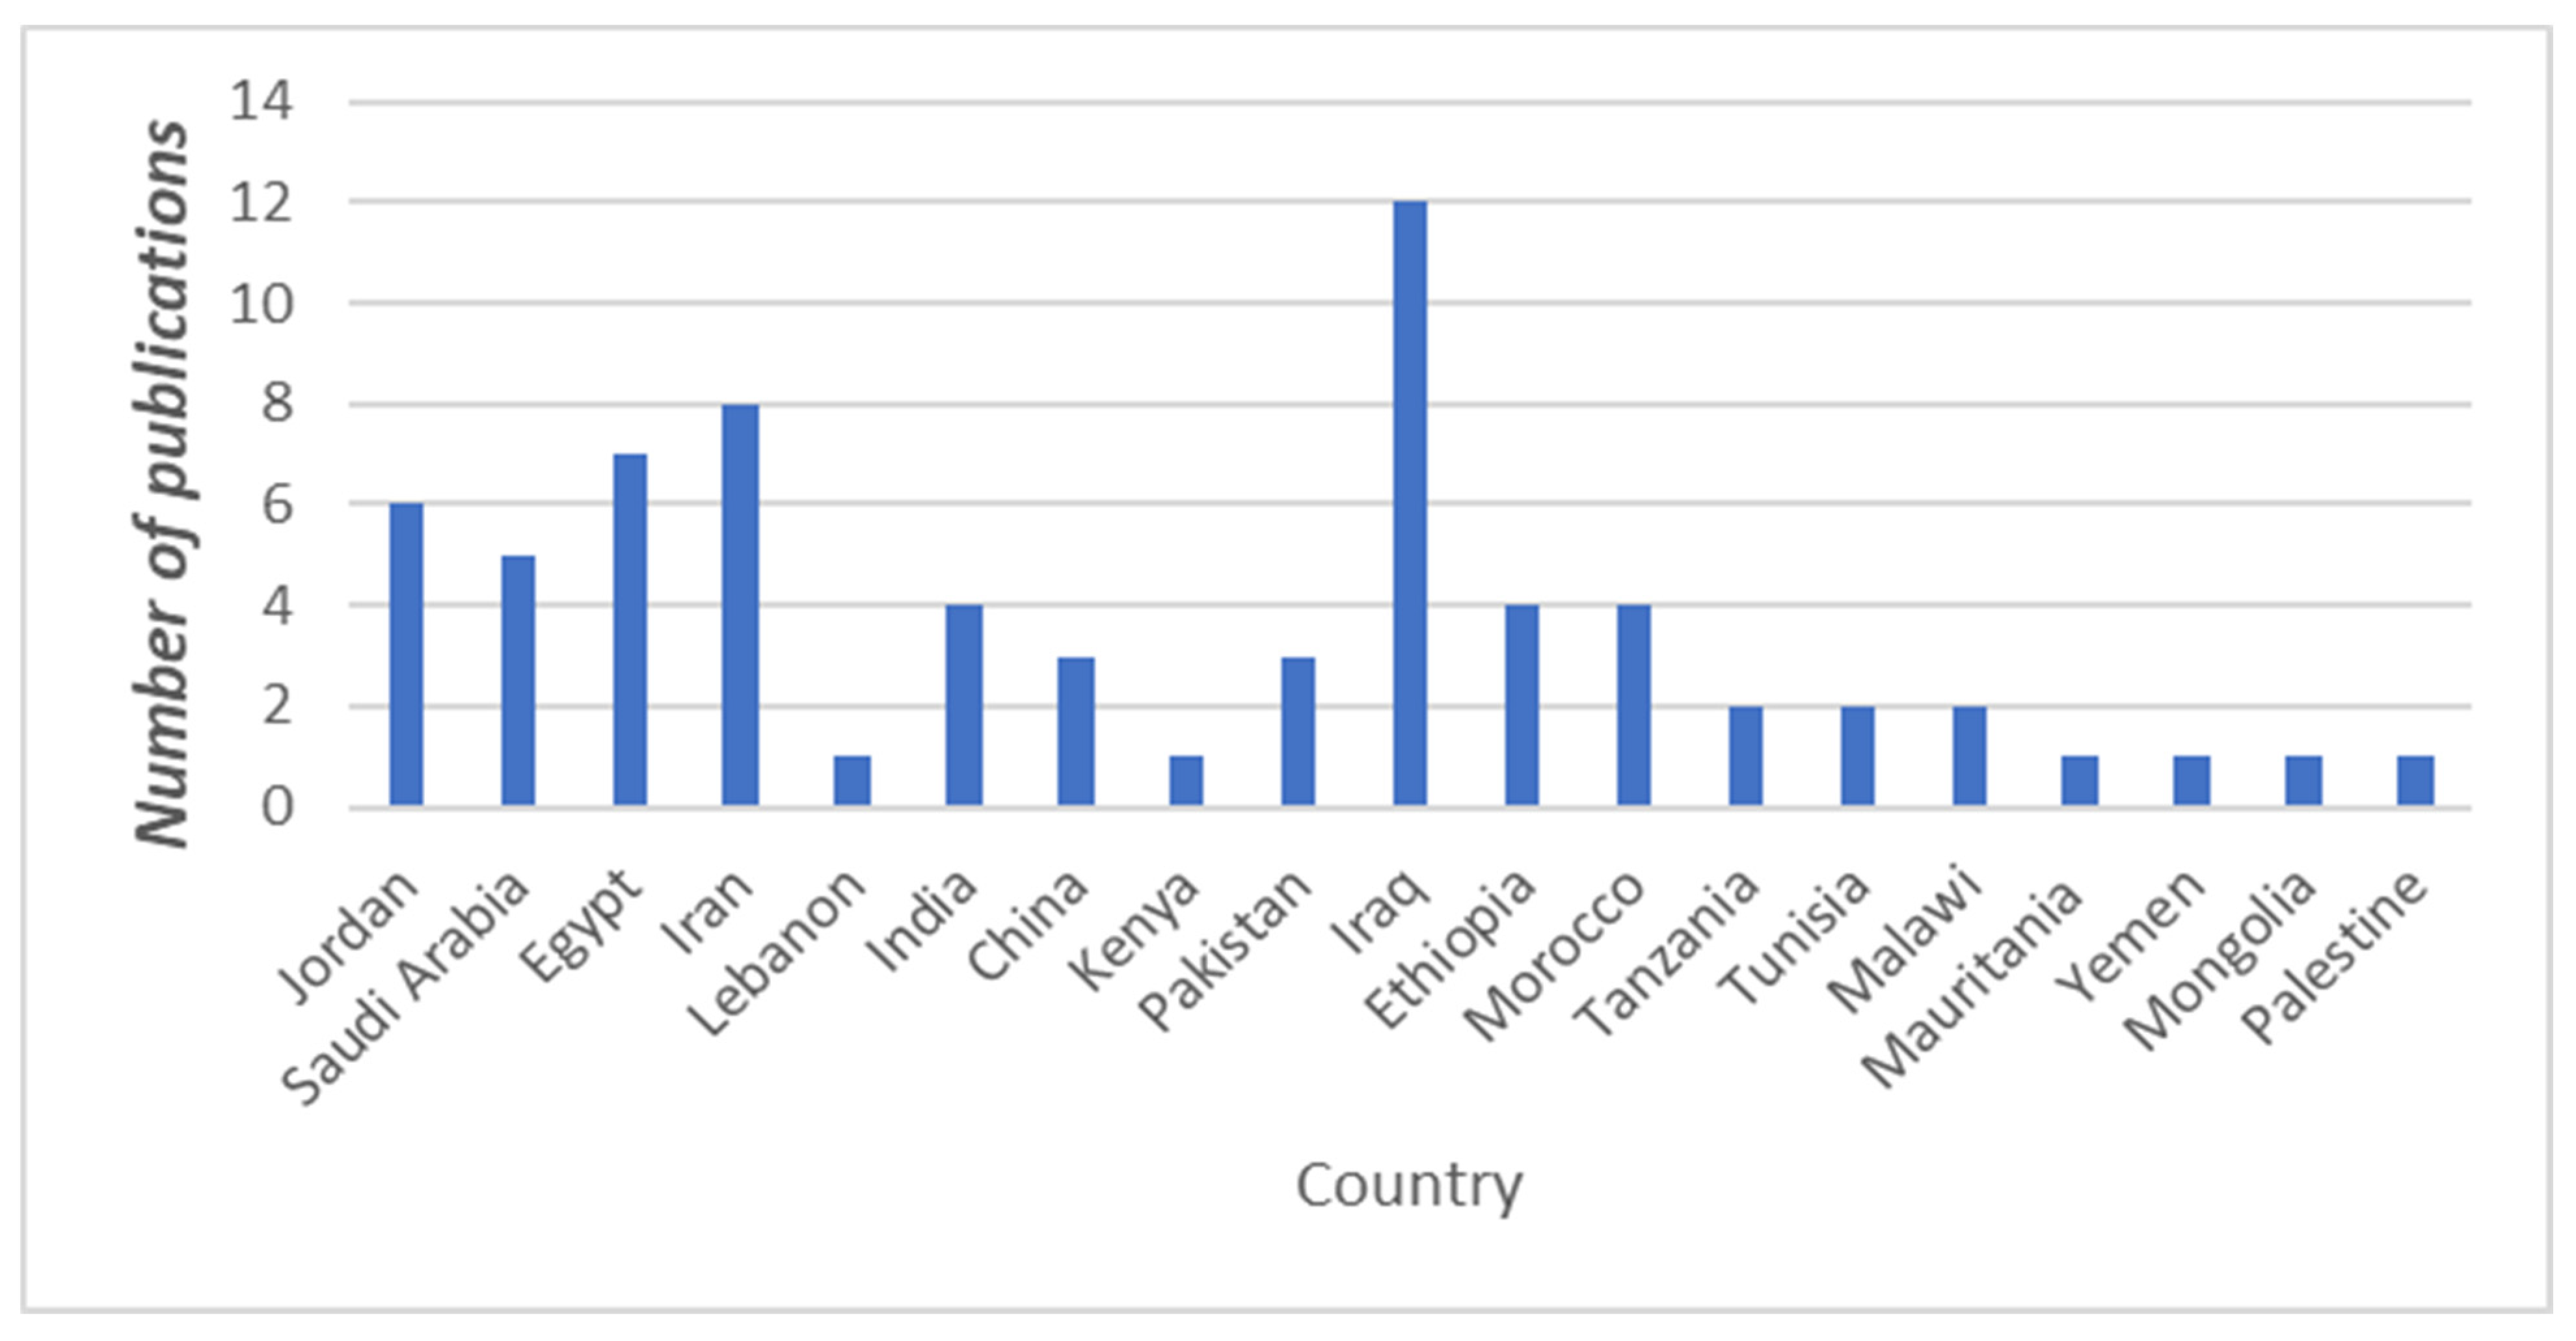
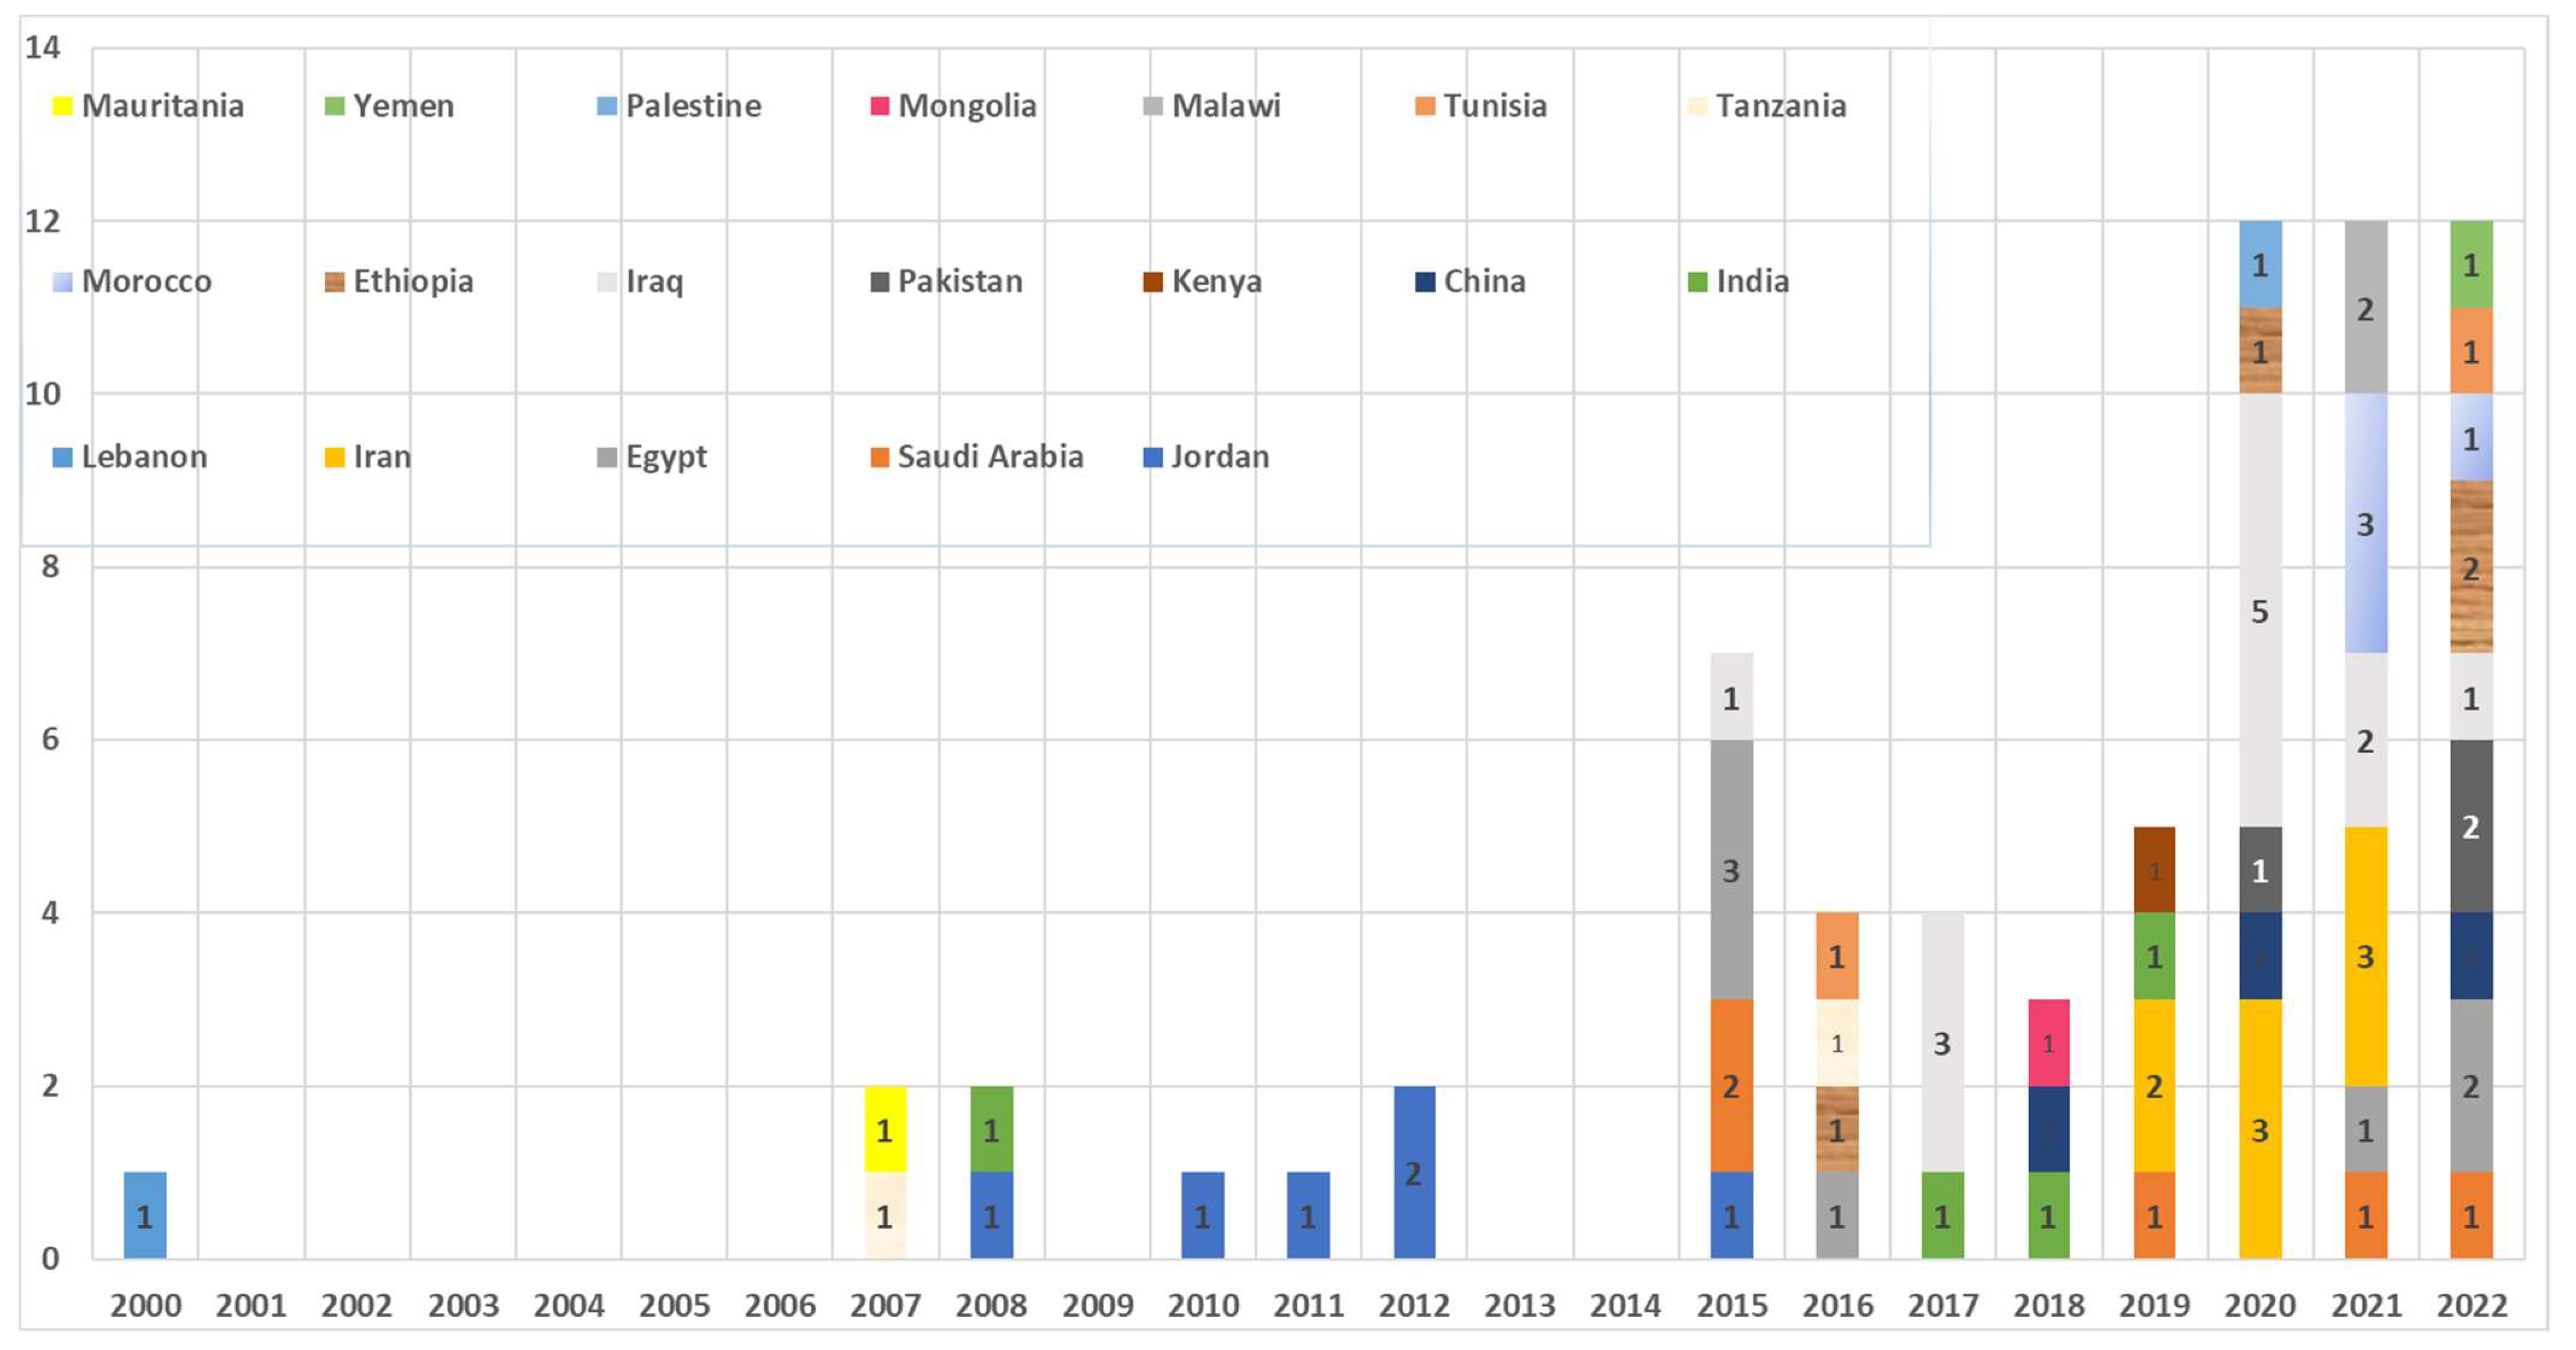
4. Overview of Retained Publications
5. Current Frameworks and Their Criteria
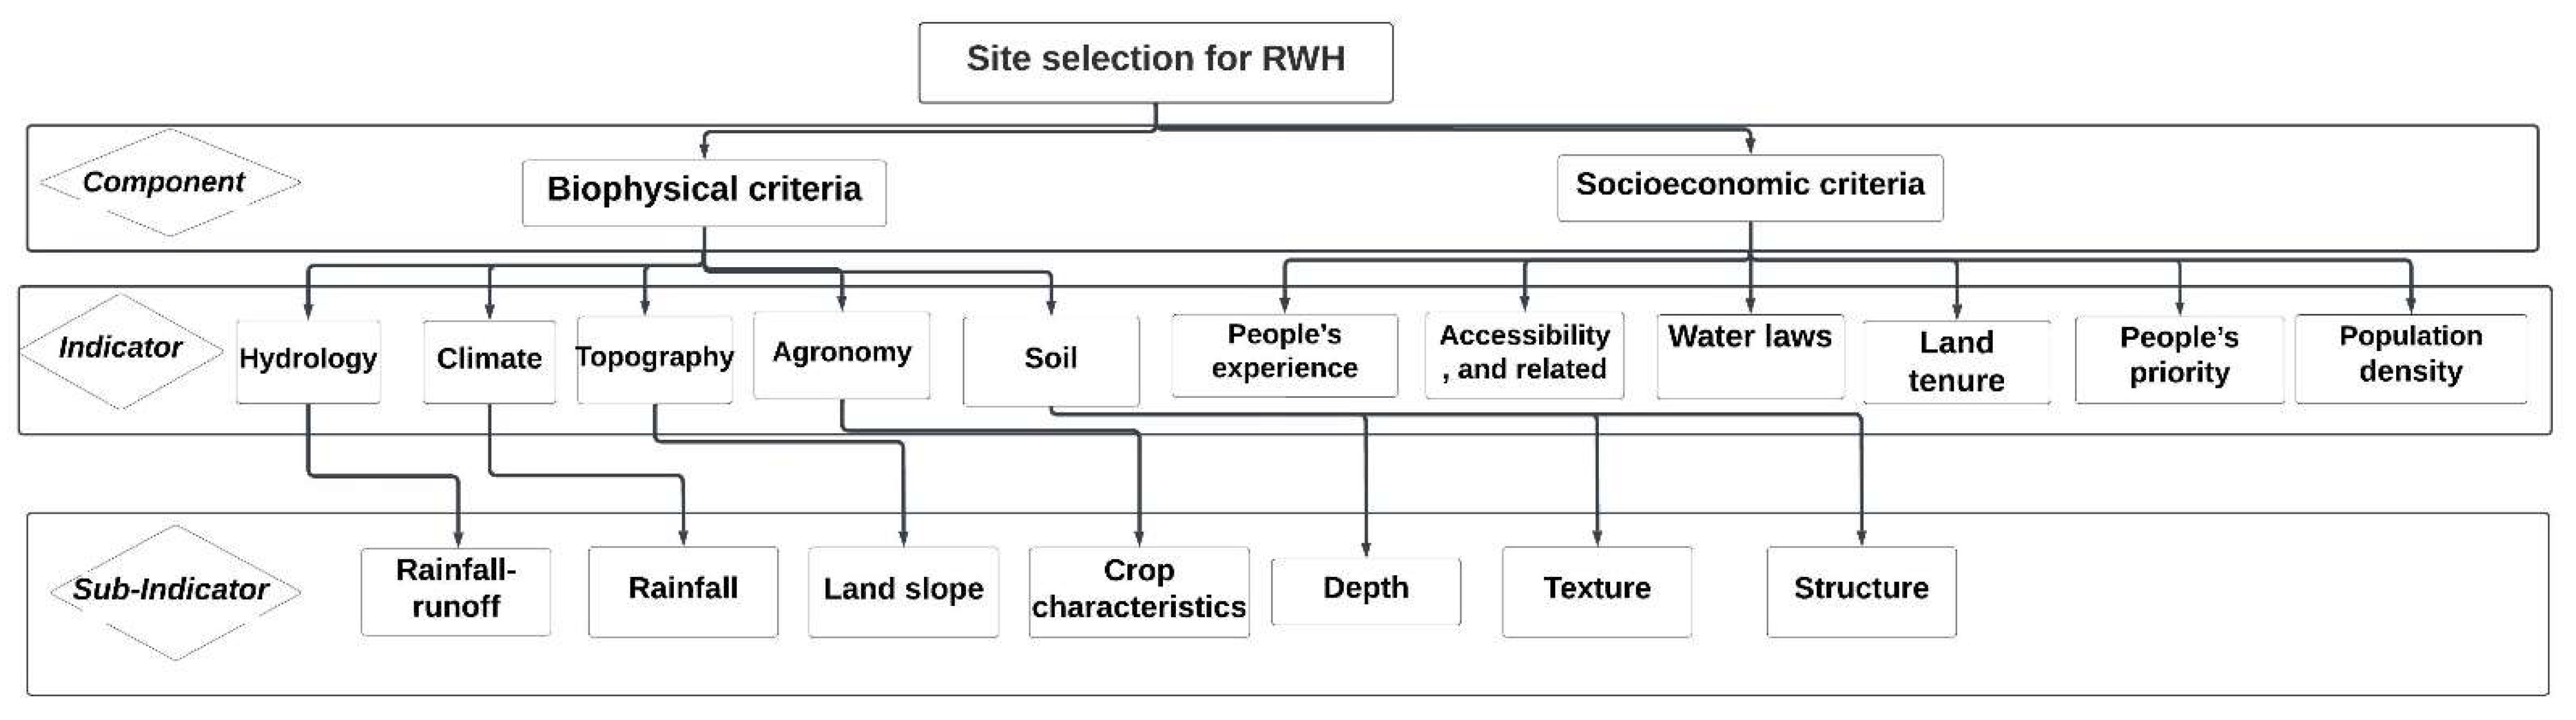
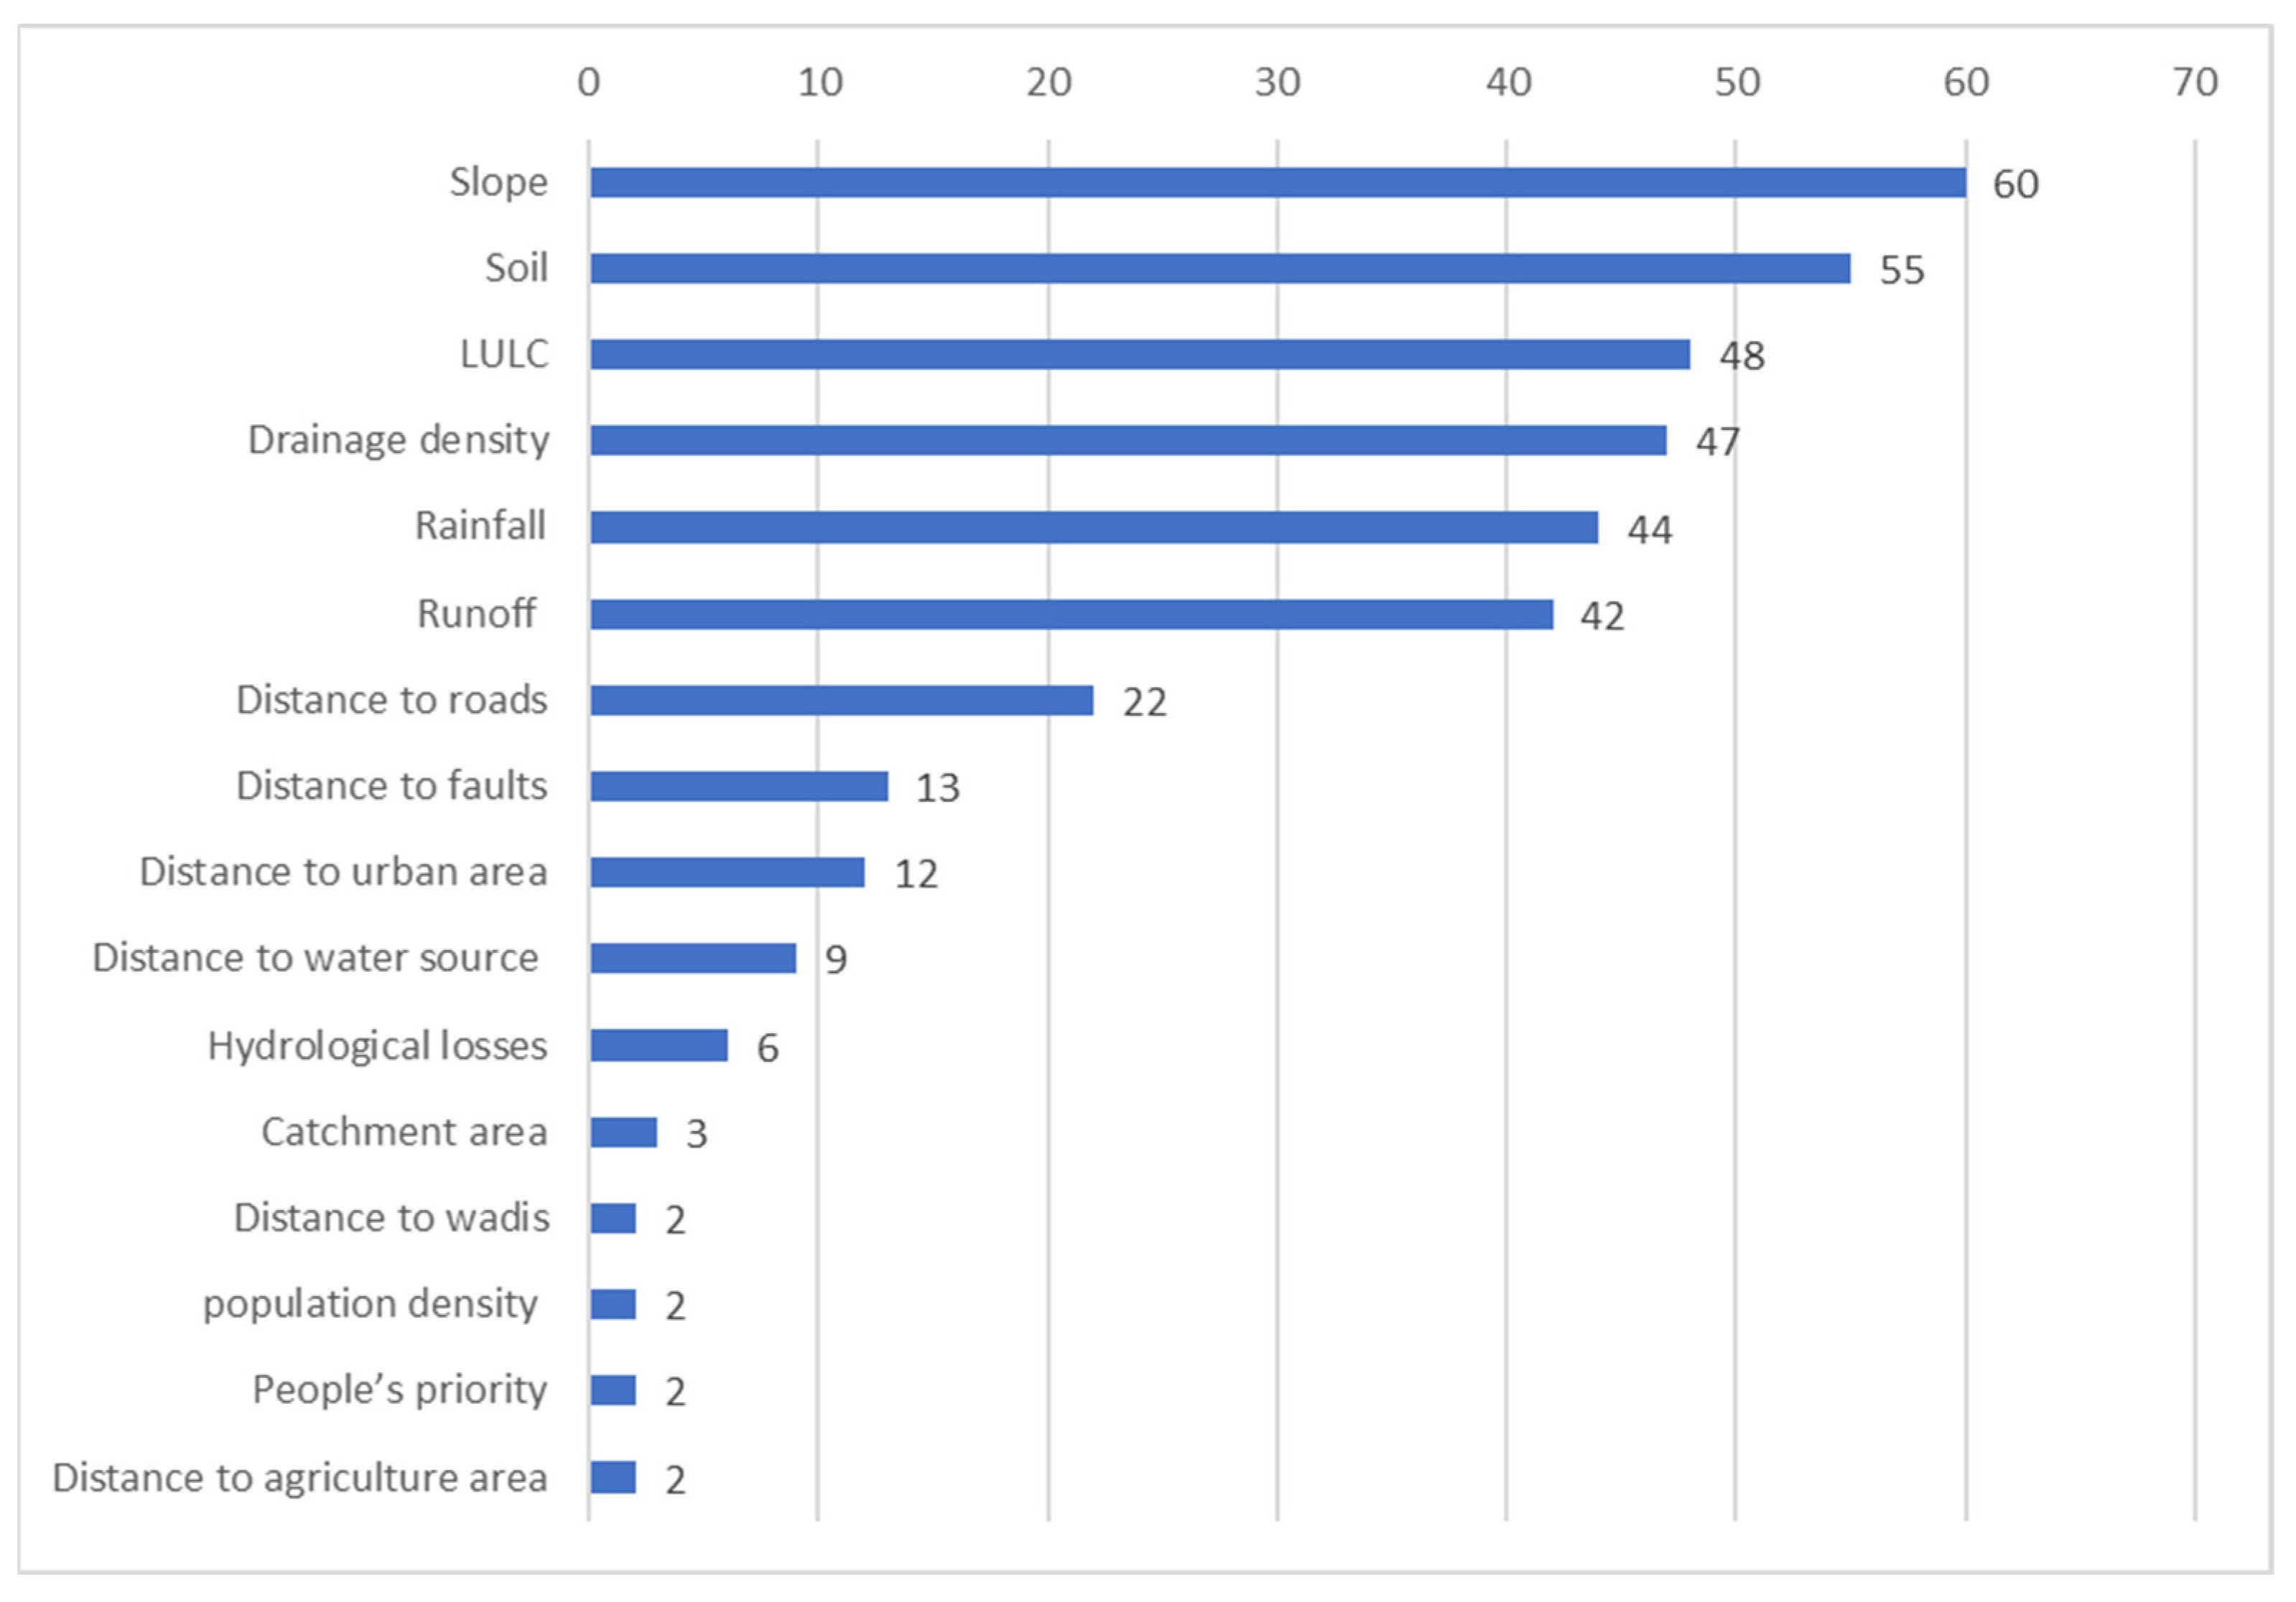
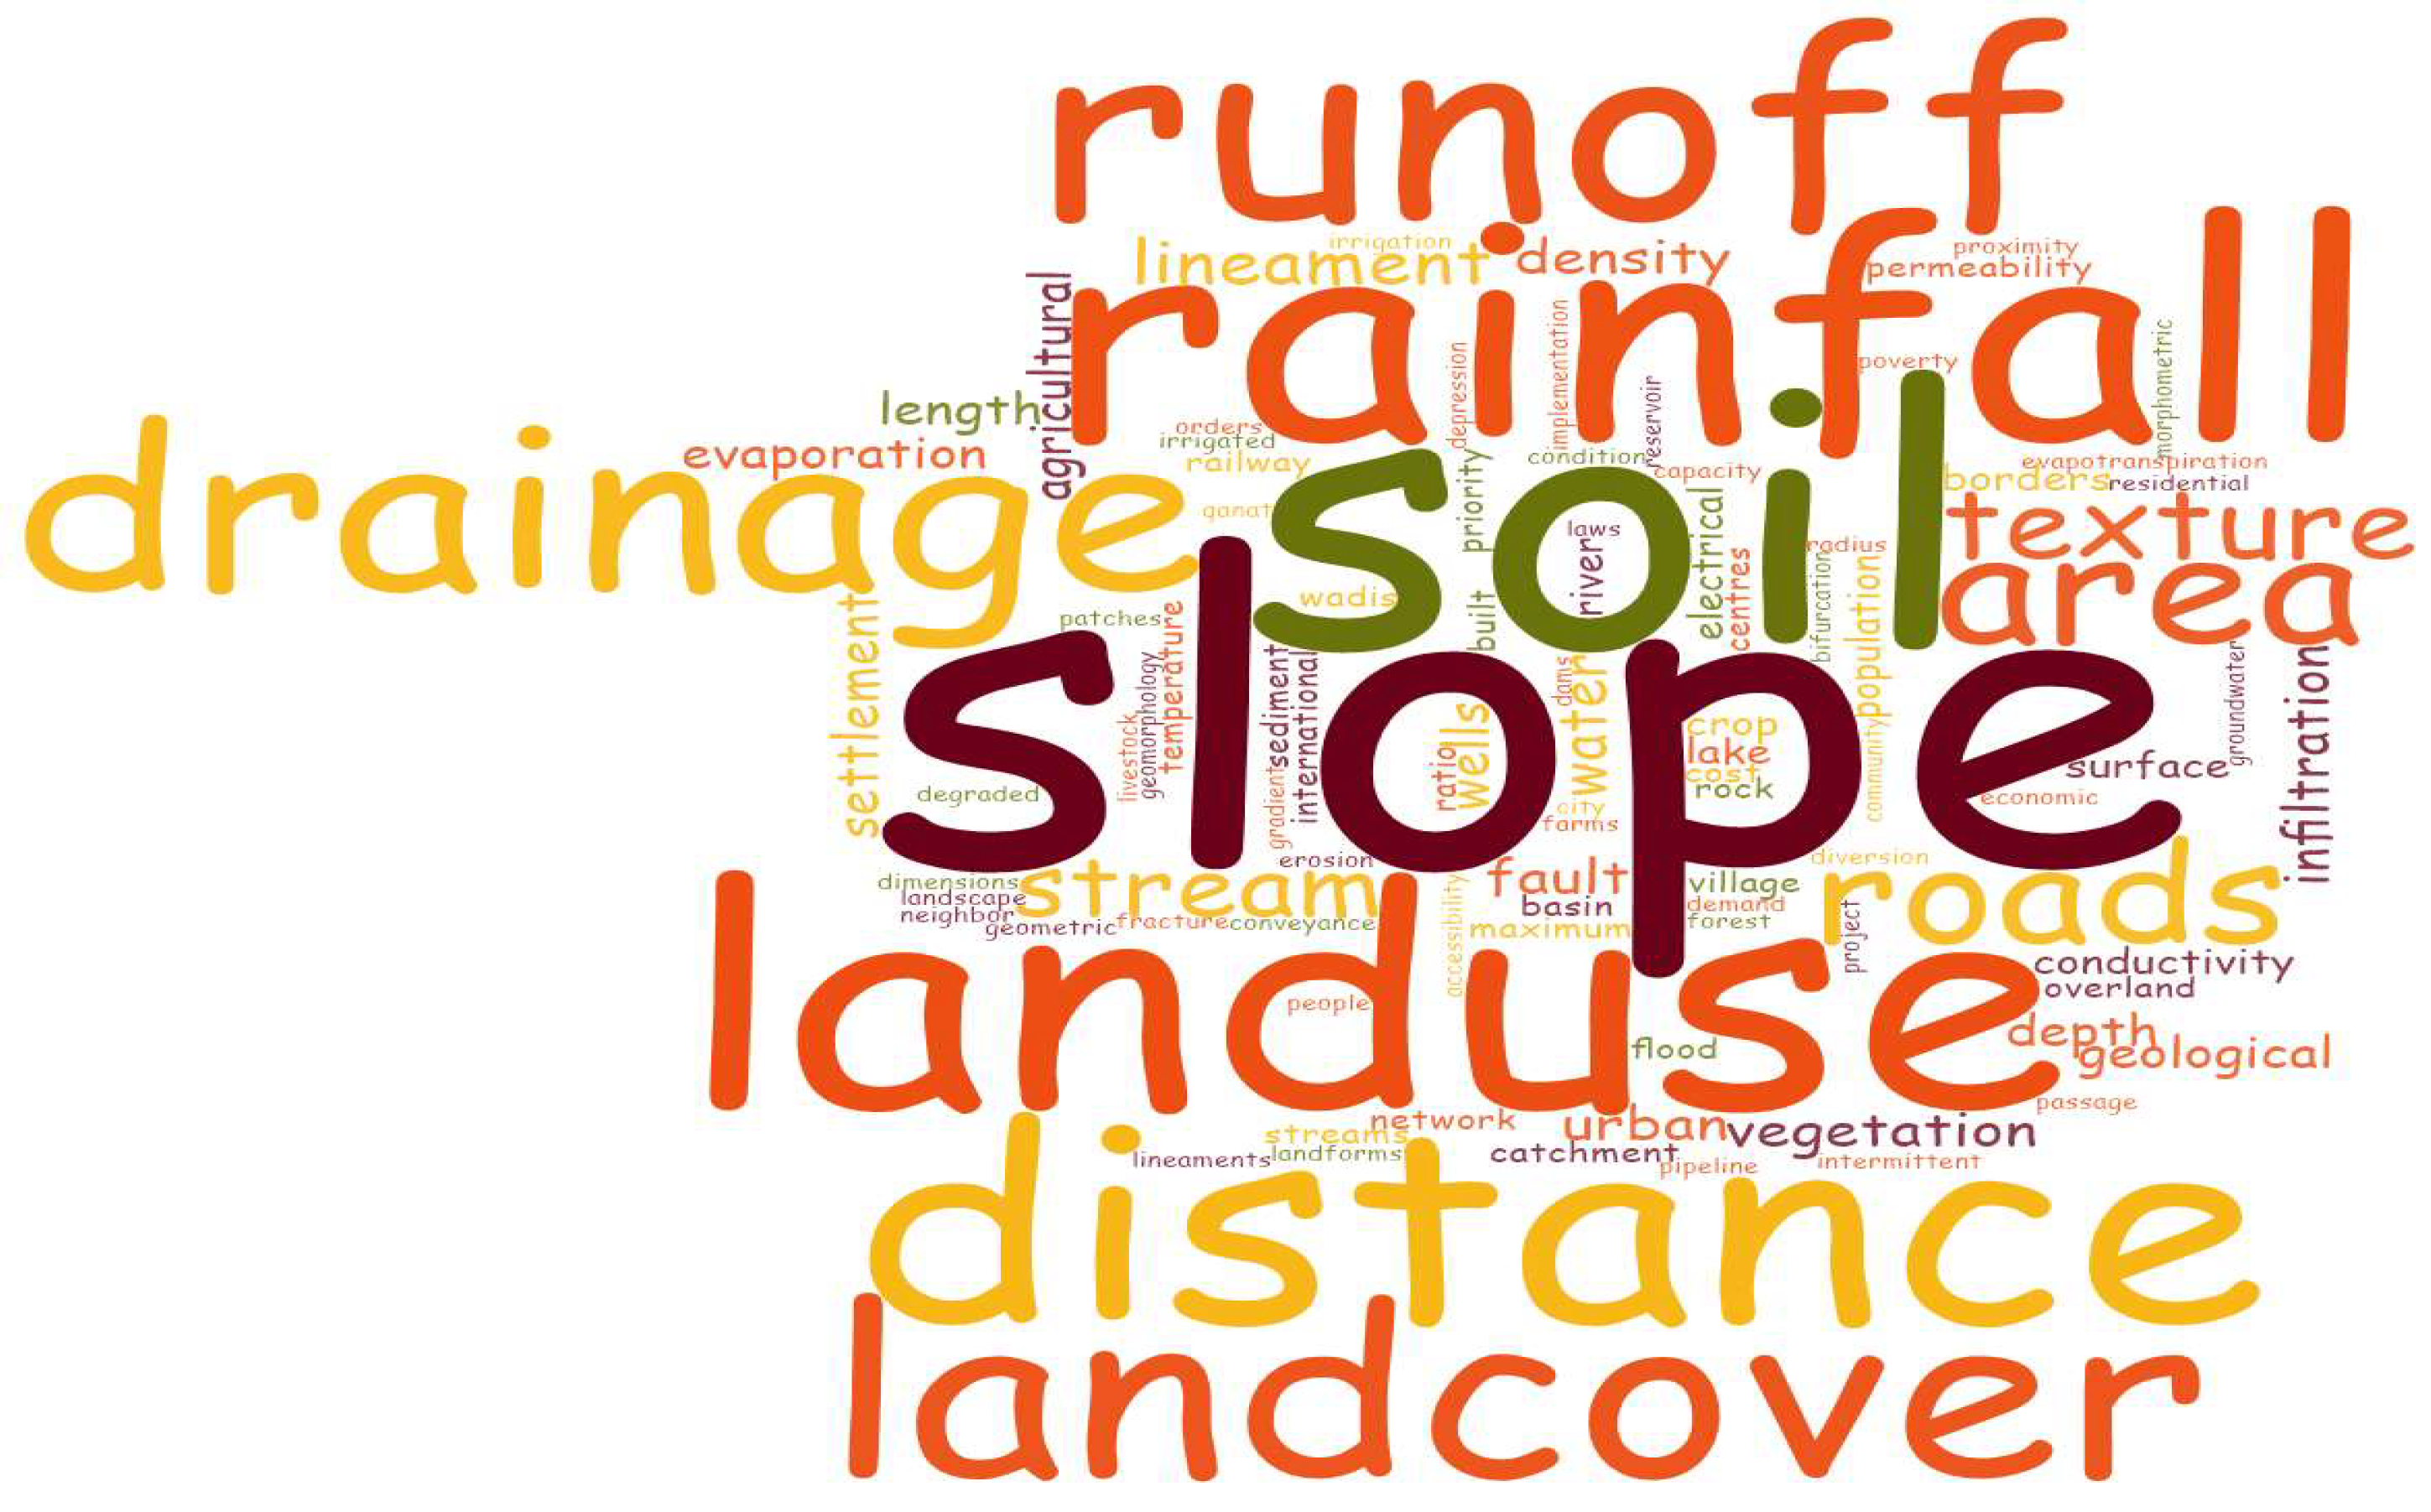
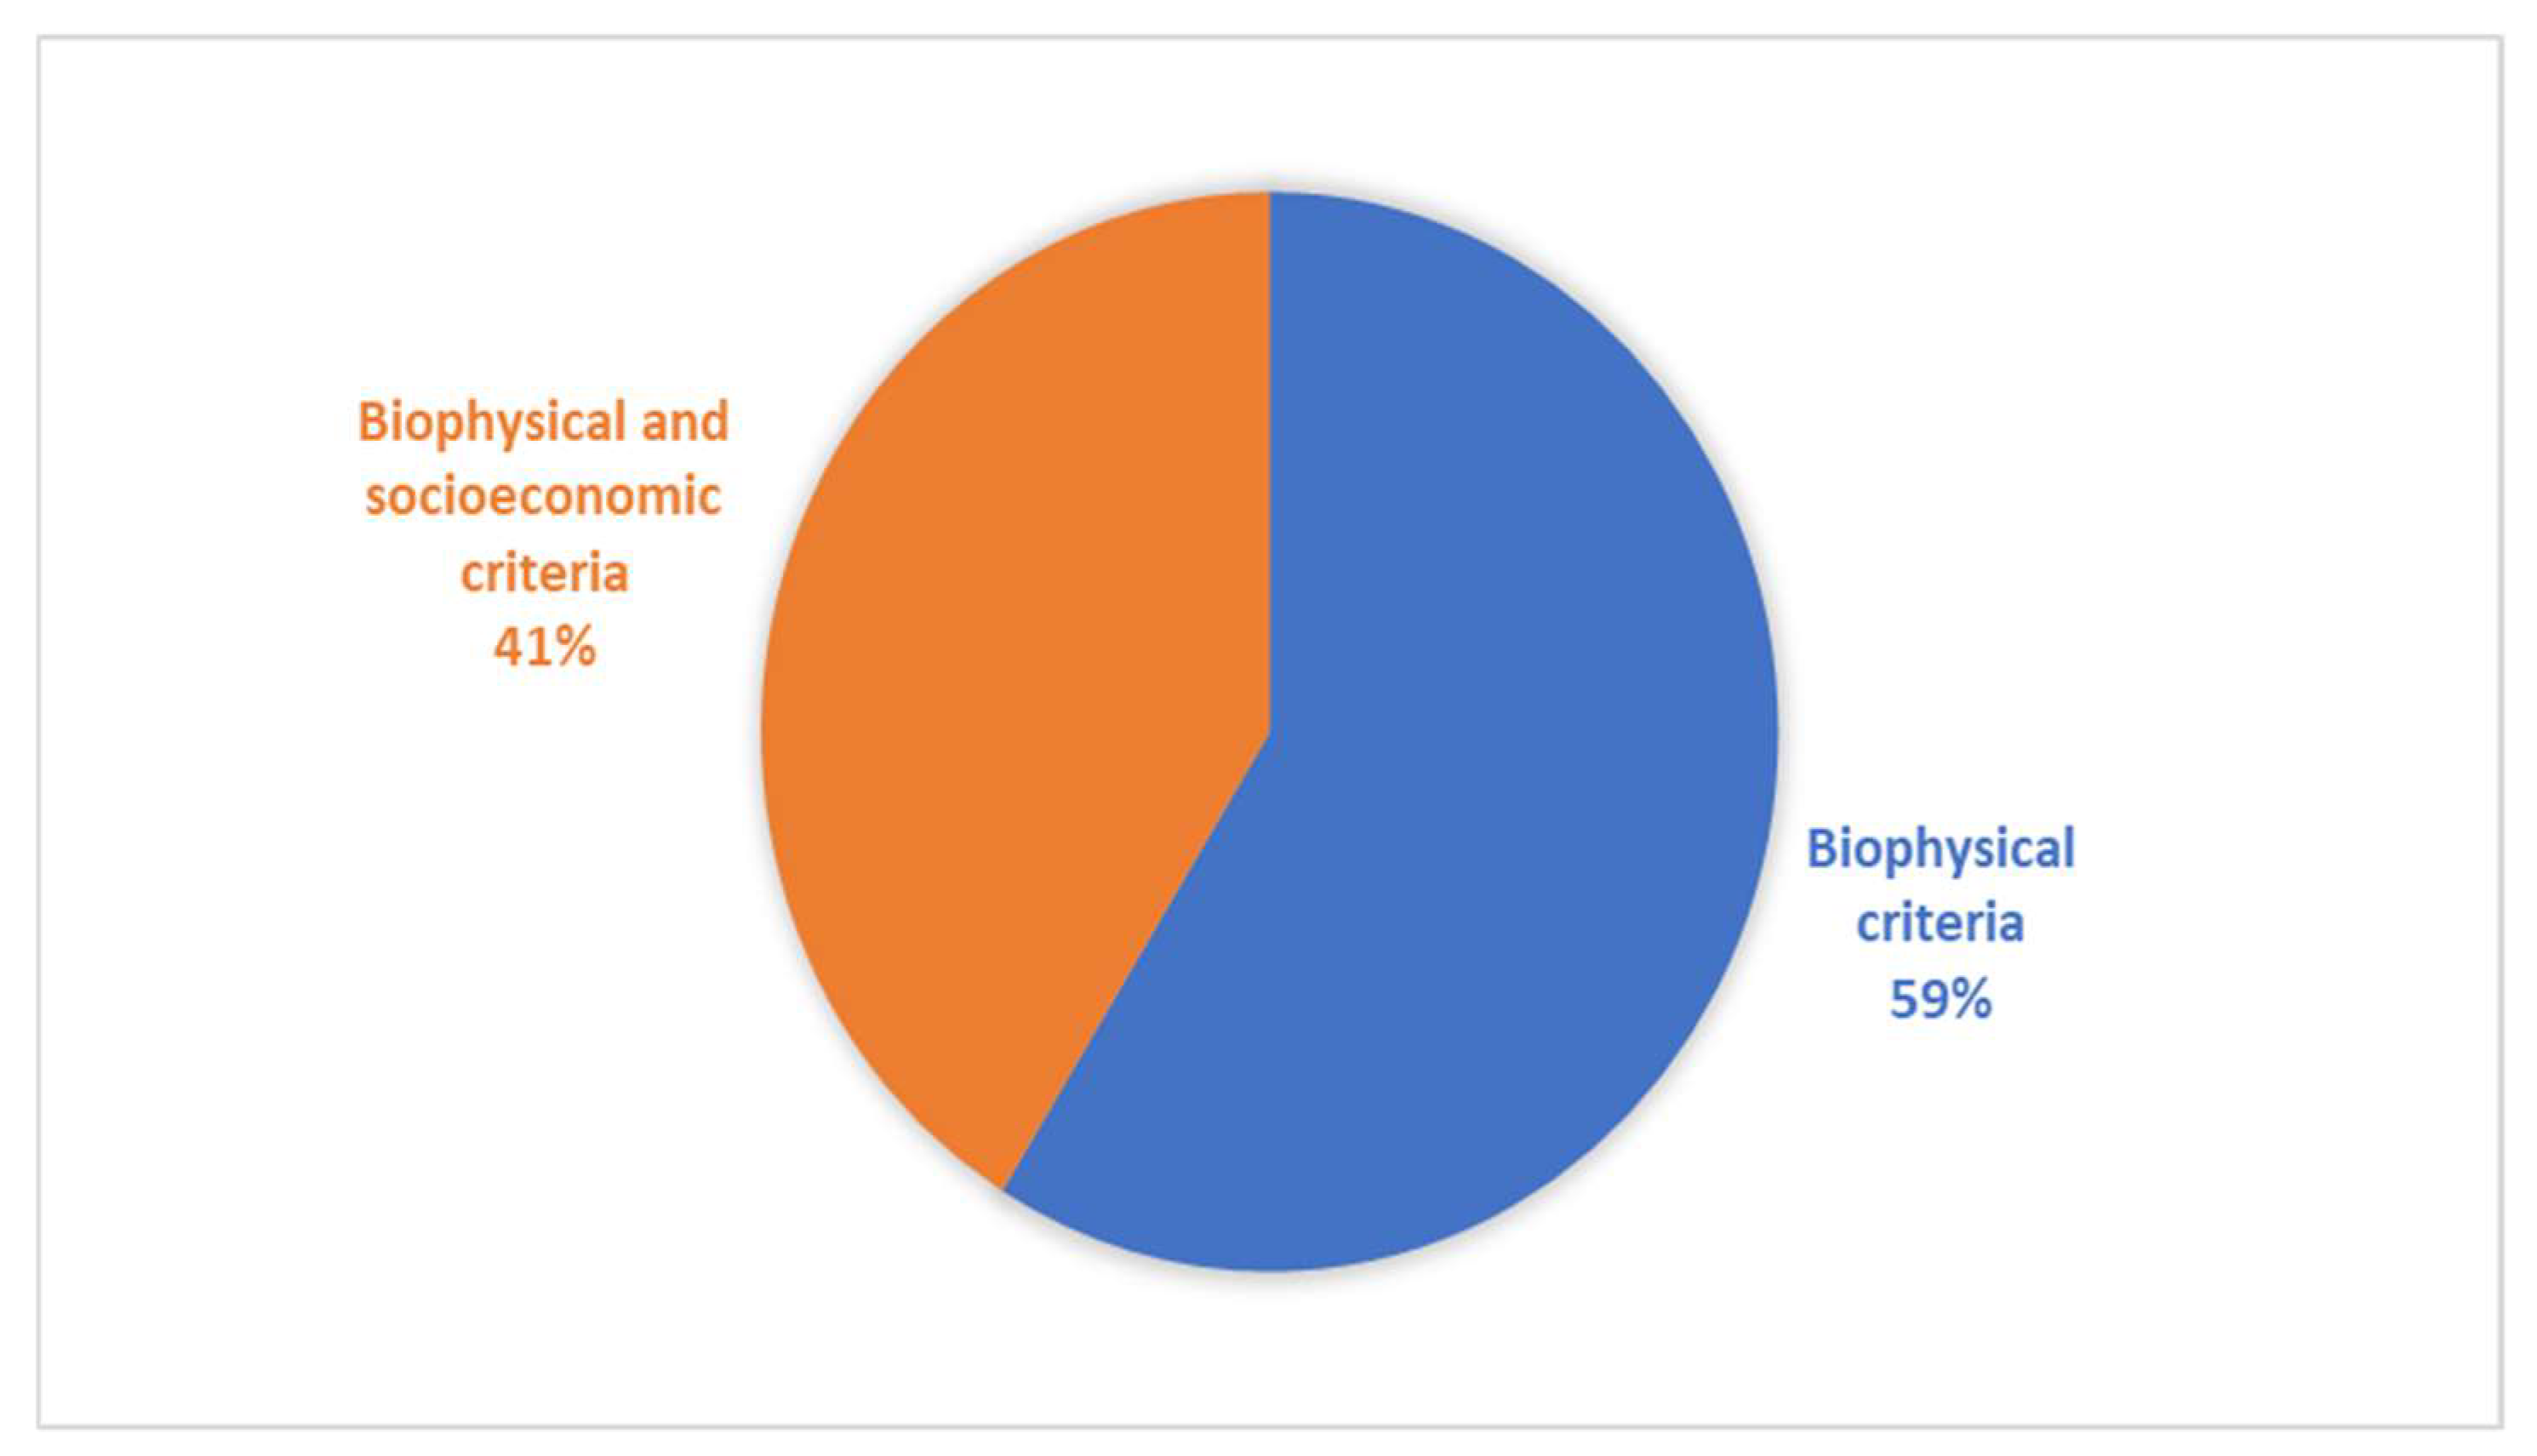
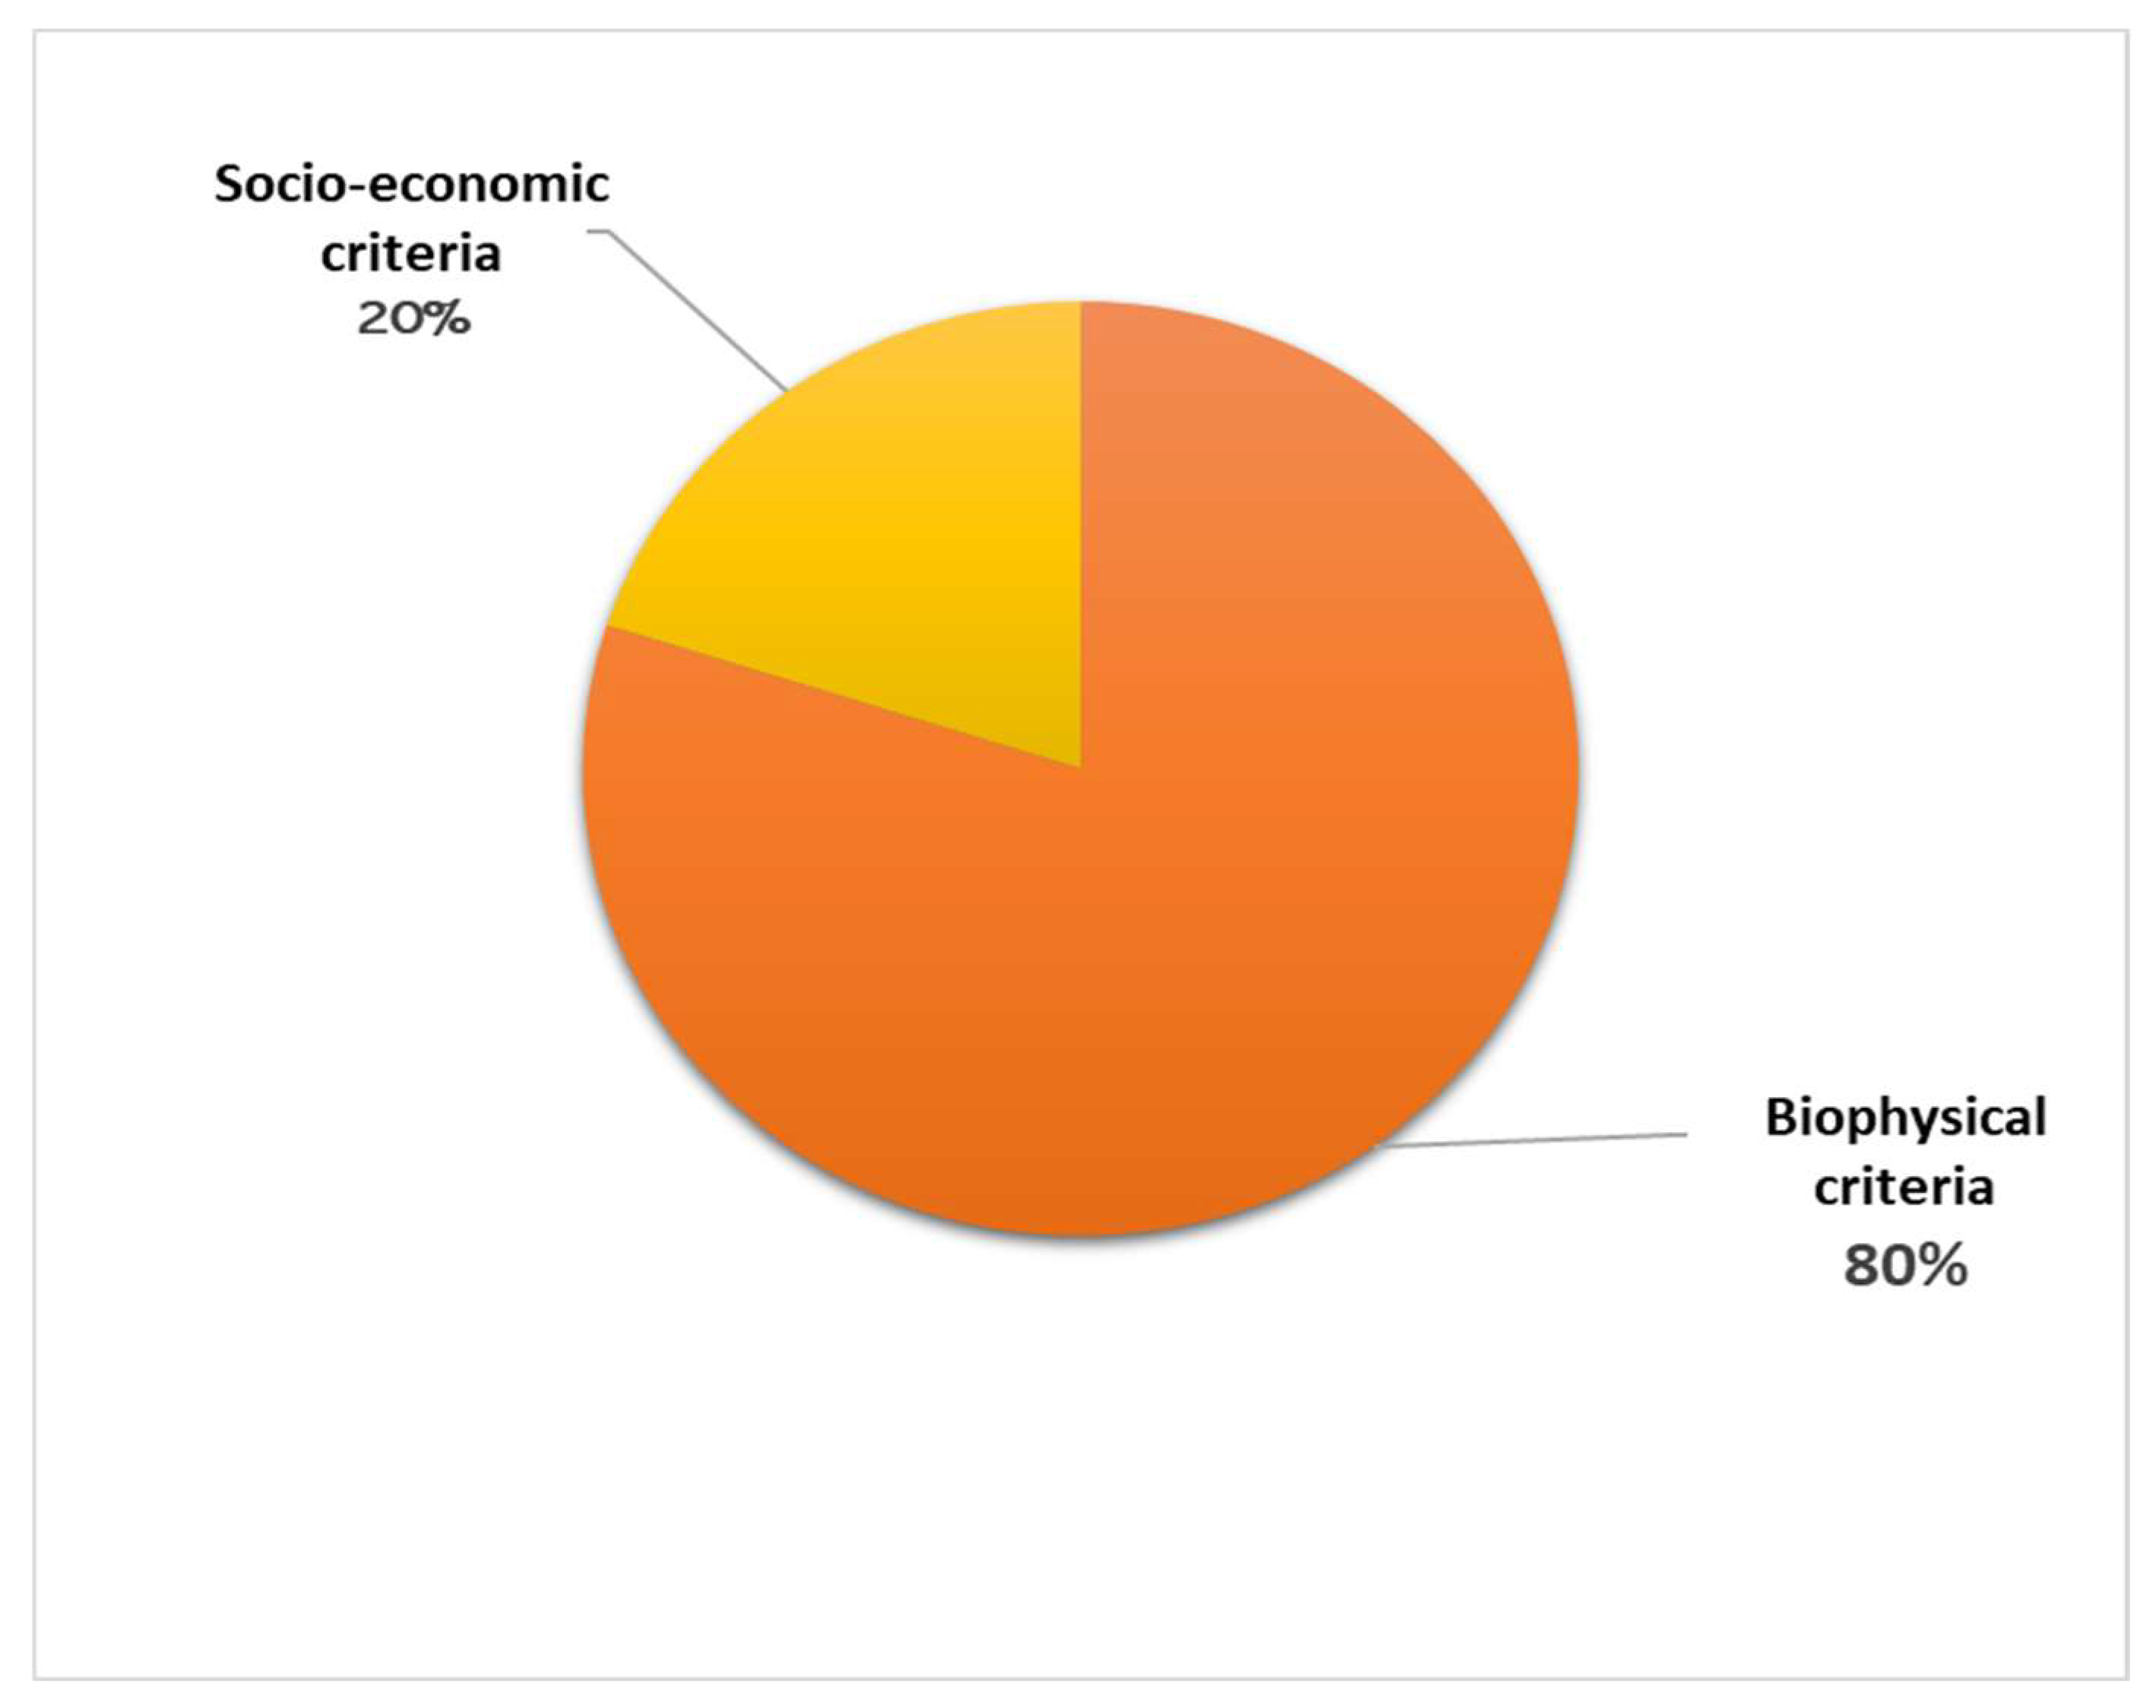
5.1. Criteria Currently Used for RWH Site Selection
5.1.1. Biophysical Criteria
- 1-
- Rainfall (mm)
- 2-
- Runoff
- 3-
- Hydrological Losses
- 4-
- Slope (%)
- 5-
- Site Soil
Land Use/Land Cover (LULC)
- 6-
- Drainage Density
- 7-
- Catchment Area
- 8-
- Distance to Wadis
- 9-
- Distance to Faults
- 10-
- Distance to Water Source (m)
5.1.2. Socioeconomic Criteria
- 1-
- Distance from Roads (m)
- 2-
- Distance from Agriculture (m)
- 3-
- People’s Priorities
- 4-
- Population Density
- 5-
- Distance to Urban Area (m)
- Annual rainfall should be more than 100 mm and less than 750 mm.
- The slope should be no more than 10% (not recommended for areas where the slope is greater than that).
- Soil should have a clay content of no less than 10%.
- The distance to a wadi should be more than 50 m and less than 2000 m.
- The distance to faults should be more than 1000 m.
- The distance to the water source should be more than 1500 m.
- The distance to a road should be more than 250 m.
- The distance to an agricultural area should be more than 250 m.
- The distance to an urban area should be more than 250 m and less than 2000 m.
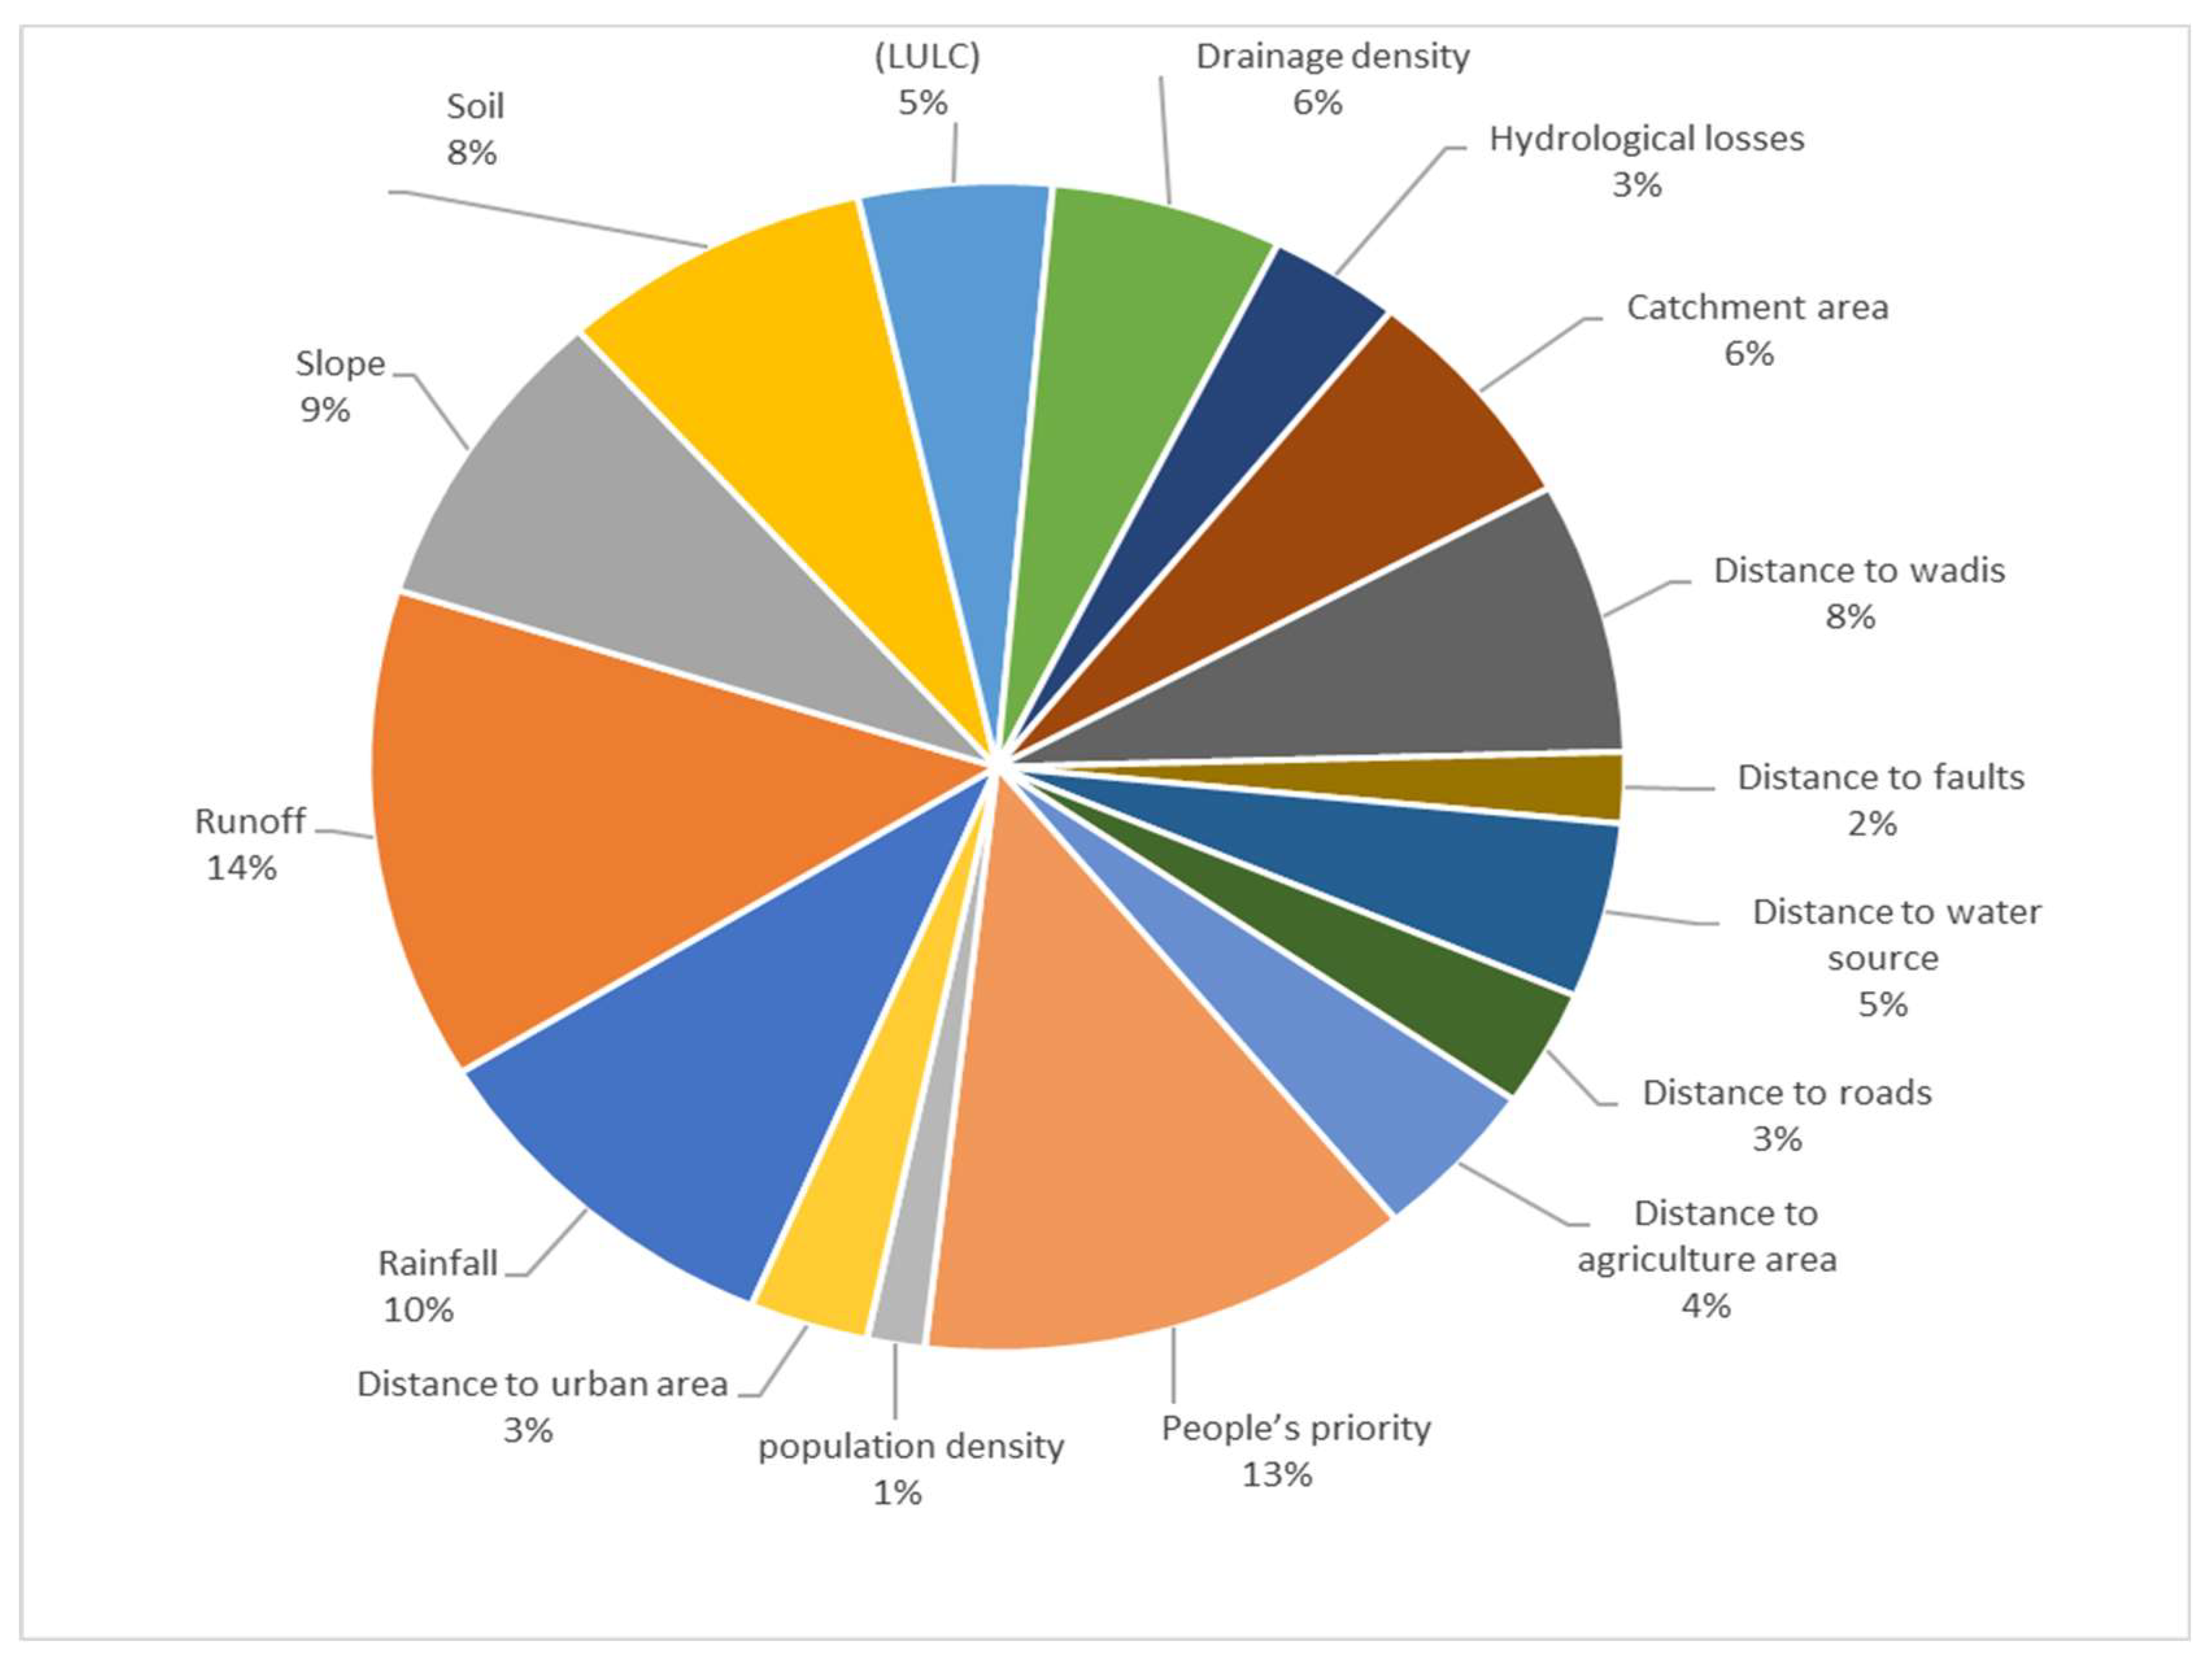
5.2. Analysis of Current Frameworks’ Criteria
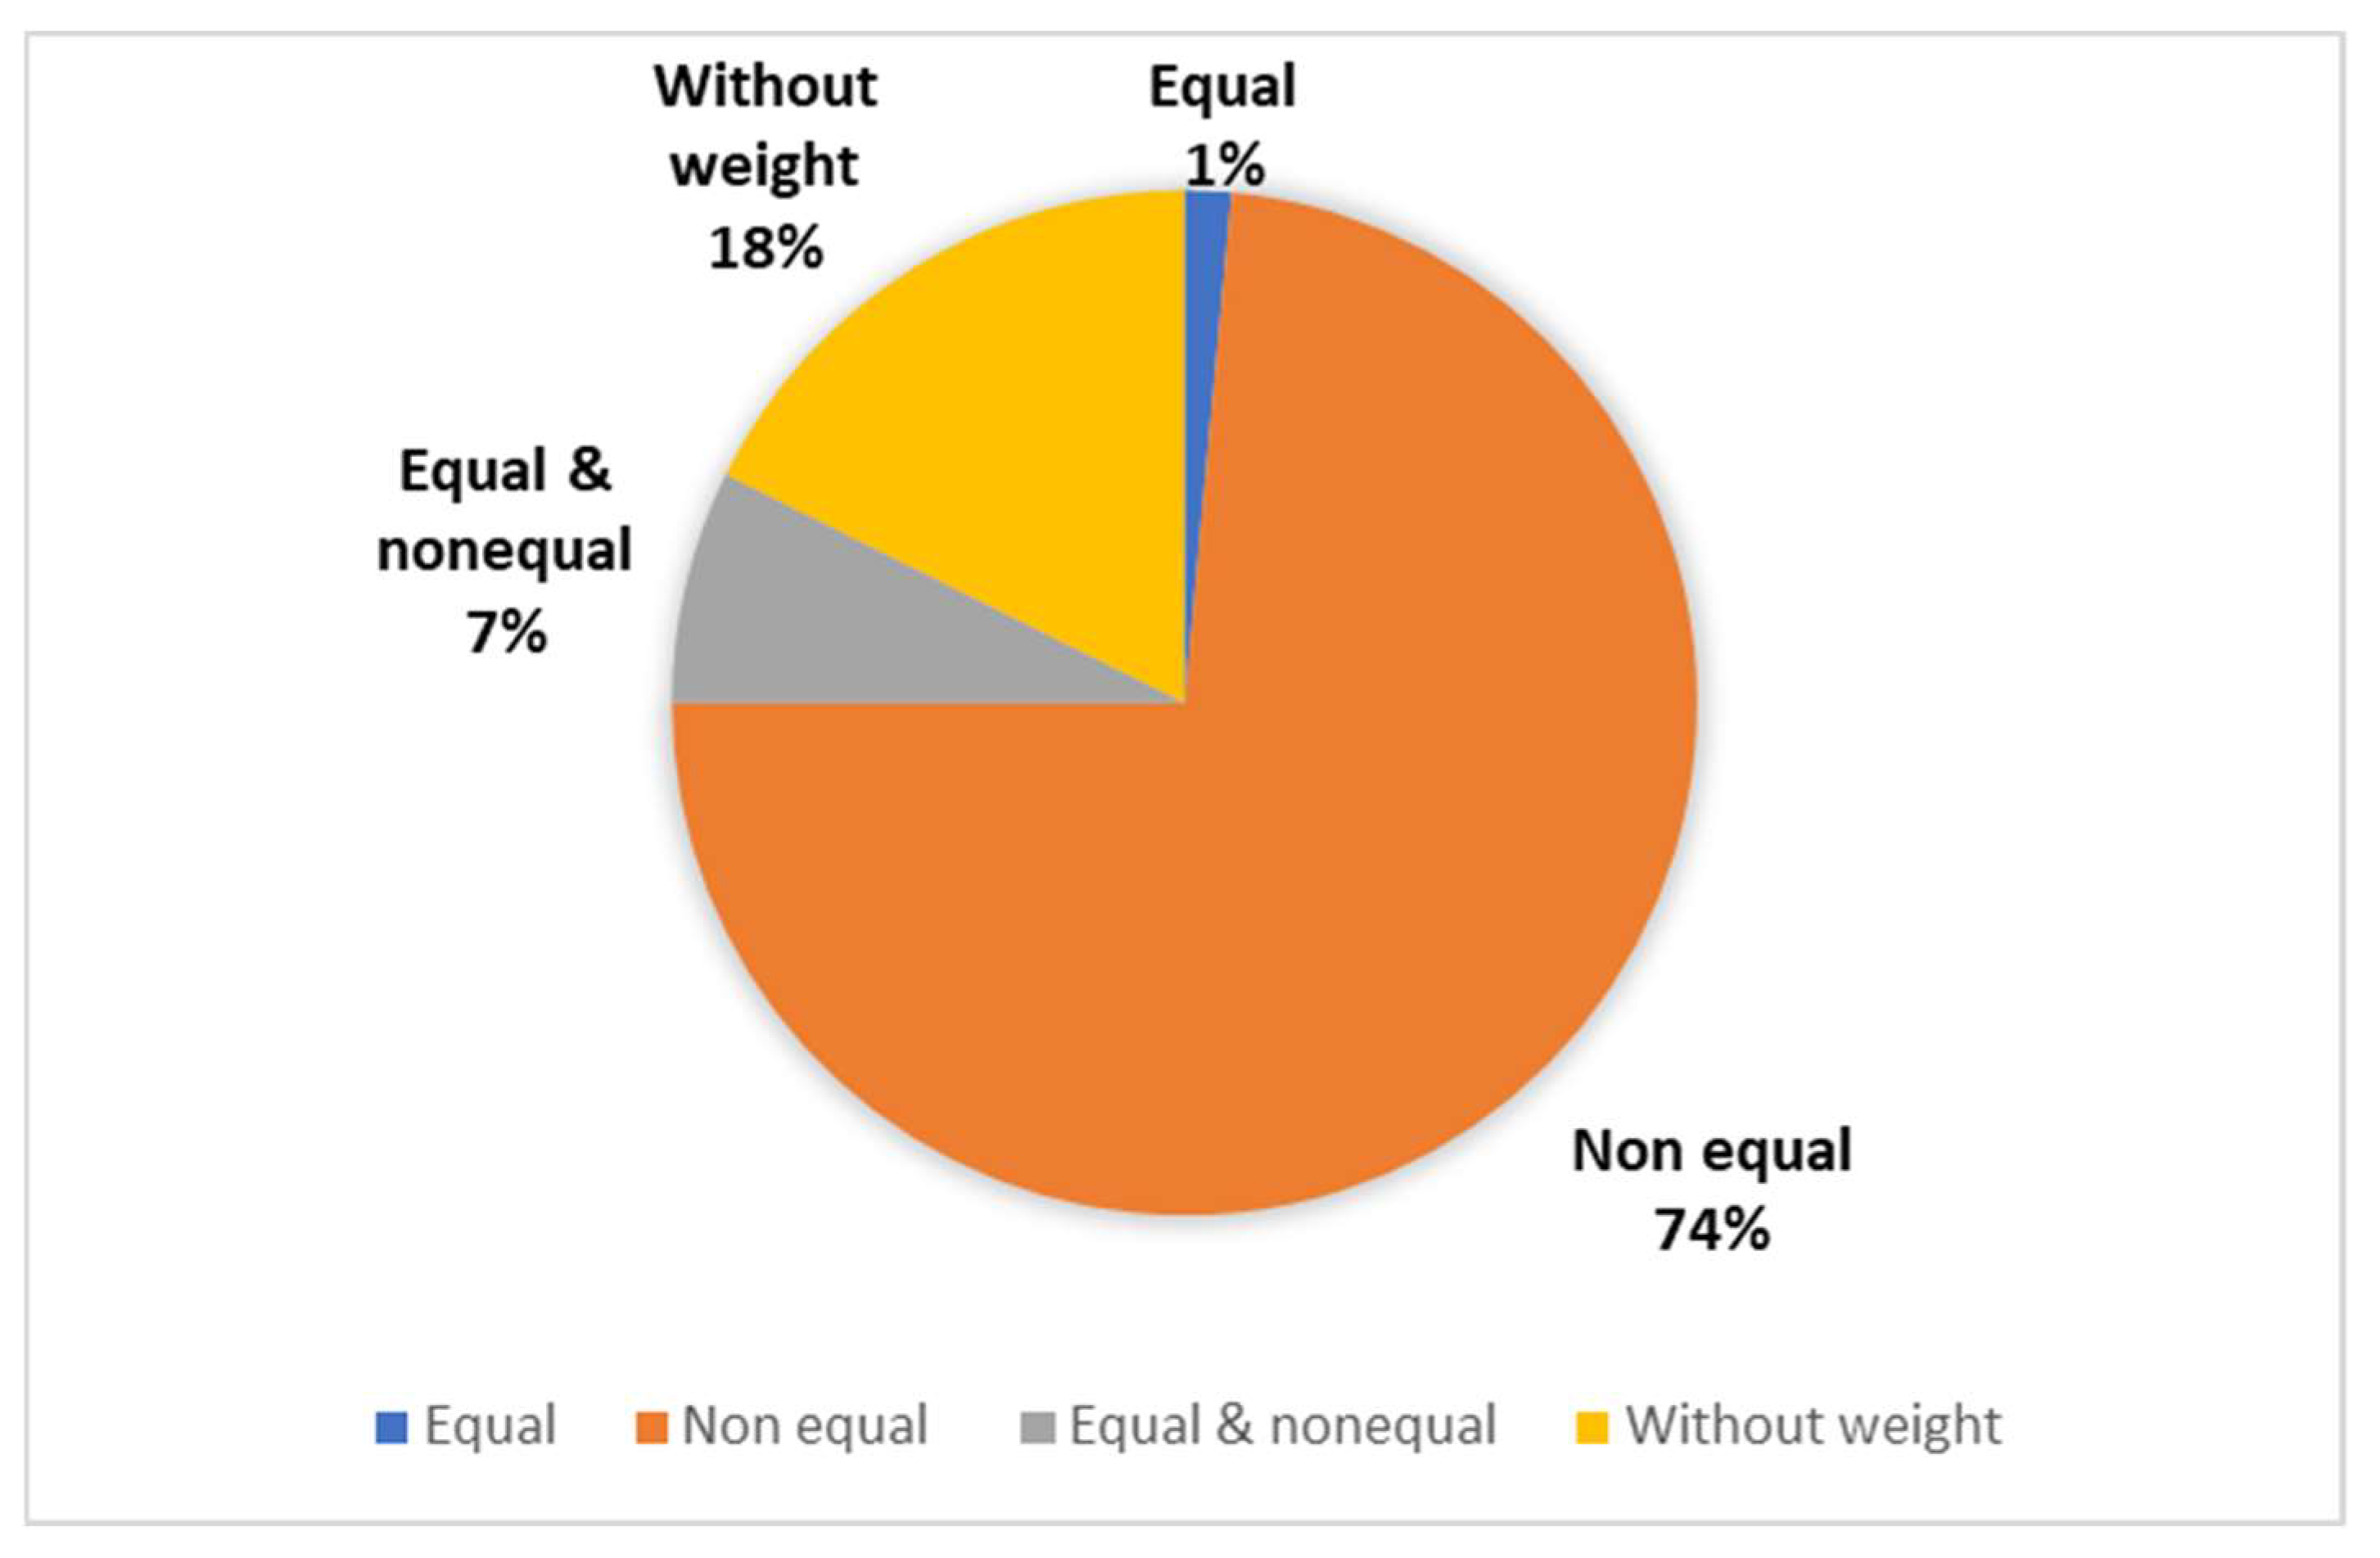
5.3. Weighting Process and Intervals for Suitability
- Equal weights: imply that each criterion in the framework is accorded the same degree of importance.
- Nonequal weights: indicate that different criteria are assigned varying levels of importance or significance within the framework. Weight for each criterion is based on the importance of the criterion for the purpose of the framework; for example, if the slope is more important than the soil for the framework, that means the slope is given a higher weight than the soil.
6. Discussion
7. Conclusions
Future Work
- Identification of the most important structural criteria (biophysical and socioeconomic).
- Formulation of a methodology to identify the most significant ecological criteria and combine them with structural criteria.
- Engagement of stakeholders and experts to weight the criteria and validate the framework.
- The resultant hybrid framework will be applied to a case study to demonstrate its use as a decision-support tool for potential users. The selection of the case study will be based on criteria such as its location in an arid or semi-arid region, and the availability of relevant information about the region.
Funding
Data Availability Statement
Conflicts of Interest
Appendix A

| No | Reference | Country and Year | Criteria | Tools | Keywords | Catchment Area km2 | Annual Rainfall (mm) | Range of Index Value | Temp °C | Methods for Weighting | Criteria Selection and Score |
|---|---|---|---|---|---|---|---|---|---|---|---|
| 1- | [56] | Jordan, 2015 | Edge, Edge Contrast Proximity Index, class area proportion, class area, patch size, radius of gyration, number of patches, shape and neighbour distance (10) | (AHP) | Rainwater harvesting, analytic hierarchy process, landscape metrics | 21,565 | 250 150 | 0–1 | 12–23 °C | Nonequal | Biophysical criteria |
| 2- | [57] | Saudi Arabia, 2015 | slope, rainfall, runoff, soil texture, and land use/land cover (5) | GIS-based (DSS) | Geographic information system, in situ water harvesting, remote sensing, decision support system | 200–600 | (1–5) | 12–23 °C | Nonequal | Biophysical criteria | |
| 3- | [63] | Egypt, Sinai, 2016 | Length of overland flow, drainage density stream frequency, infiltration number, bifurcation ratio, drainage texture (6) | RS and GIS techniques | Runoff water harvesting, remote sensing, GIS weighted spatial probability modeling, watershed morphometry | 23,380.93 | 95 mm [73] | (1–4) | 23.2 °C [73] 23.2 °C [73] | Equal and nonequal weights | Biophysical criteria |
| 4- | [58] | Iran, 2020 | Proximity to qanat, slope, geomorphology, climate, land use, rainfall, geology, distance to rock source, fault, stream, well, water spring, proximity to road, proximity to village (14) | DSS, Boolean and fuzzy logic | Water harvesting, cross section, valley’s profile, check dam, satisfaction, rural | 345 | 0–1 | 11 °C | Nonequal | Biophysical and socioeconomic criteria | |
| 5- | [46] | Northern China, 2020 | Streams, roads, lake area, roads and railway, lake area or reservoir, built-up areas, rainfall runoff, drainage density, slope (10) | Remote sensing–based MCA, (WLC), combination with the Boolean approach in a GIS | Water management, geographic information system [74], rainwater harvesting, multi-criteria analysis, analytical hierarchy process (AHP) | 744.57 | 325.8 | (0–1) | 5.2 °C | Nonequal | Biophysical and socioeconomic criteria |
| 6- | [75] | Kenya, 2019 | Drainage density, lineament density, runoff depth, slope, land use/land cover, soil texture (6) | GIS and remote sensing, use of SCS-CN for runoff | Weighted overlay analysis, runoff depth, rainwater harvesting structures, SCS-CN method | 699 mm to 1058 mm | 1–5 | 26 °C [76] 26 °C | Nonequal | Biophysical and socioeconomic criteria | |
| 7- | [77] | Pakistan, 2020 | Slope, drainage density, geological setup, soil texture and drainage stream characteristics, runoff, land use/land cover (7) | GIS, conservation service (SCS) | Rainwater harvesting Remote sensing, GIS, site suitability | 2987 | 580 | 1–3 | 5–41 °C | Nonequal | Biophysical criteria |
| 8- | [62] | Iraq, 2017 | Slope, land use, rainfall, geological, soil type, condition, road, vegetation, village, sediment, evaporation (10) | RS, MCA fuzzy, AHP | GIS. Multi-criteria decision techniques, rainwater harvesting structure, remote sensing | 13,370 | 115 | (0–1) | 2.6–42.8 °C | Equal, and nonequal weights | Biophysical and socioeconomic criteria |
| 9- | [59] | Egypt, 2016 | land use, land cover, slope, runoff coefficient precipitation, soil type (5) | GIS and (DSS) and remote sensing | Normalized difference, drought management, decision support system (DSS), geographic information system, vegetation index (NDVI), multi-criteria evaluation, rainwater harvesting, analytical hierarchy process (AHP) | 10,130 | 110 | 1–5 | 32 °C | Nonequal | Biophysical criteria |
| 10- | [40] | India, 2019 | Stream networks, digital elevation, soil quality (3) | GIS and digital elevation model (DEM), ArcGIS | Rainwater harvesting, DEM, India, drought | None | 26.98 °C [78] | Nonequal | Biophysical | ||
| 11- | [50] | Iraq | Land use/land cover, slope, stream orders, rainfall, soil, elevation, runoff, roads and settlements, agriculture density, livestock water demand, population and rural density (13) | GIS, multi-criteria model, (AHP) | Water harvesting, Iraq, GIS, multi-criteria, AHP | 6135.77 | 350 | 1–5 | 7.8—33.9 °C | Nonequal | Biophysical and socioeconomic criteria |
| 12- | [79] | Ethiopia, 2020 | Soil texture, runoff, slope, stakeholders’ priorities, land use/land cover (5) | (SWAT), RS, MCA | Rainfall runoff, geographic information system, the Dawe River watershed, rainwater harvesting, the Wabe Shebelle River basin, soil and water assessment tool (SWAT) | 368 | 723.36–534 | 1–3 | 27.14 °C | Nonequal | Biophysical and socioeconomic criteria |
| 13- | [80] | Iran, 2021 | Evaporation, rainfall, soil depth, permeability of soil, organic matter of soil, soil texture, electrical EC of soil, vegetation condition, vegetation types, percentage of vegetation, fault density, slope aspect, EC of water, groundwater, groundwater drop transport capability, drainage density, stream order, runoff, discharge management, land use, participation, alluvium thickness, distance from water resources, distance from a road, population density | Geographic Information System. | Rainwater harvesting, Shannon, TOPSIS, geographic information system, entropy | 83,000 | 115 | 1–4 | 19.17 °C [81] | Nonequal | Biophysical and socioeconomic criteria |
| 14- | [61] | Egypt, 2021 | Flood, maximum flow distance, drainage density, infiltration, slope, watershed length, watershed area, flow distance (8) | WMS and remote sensing techniques, (MPDSM) | Runoff water harvesting (RWH), remote sensing, analytical hierarchy process (AHP), multi-parametric spatial model (MPDSM), dry regions, decision | 3515 | 54.87 | 0–100 | 23.2 °C [73] 23.2 °C | Equal and nonequal weights | Biophysical criteria |
| 15- | [61] | Iran, 2021 | Temperature, precipitation, discharge, soil texture, land use, discharge density, slope, evapotranspiration (8) | GIS, (AHP), (WLC), multi-criteria decision analysis | AHP, WetSpa model, GIS, WLC, RWH | 1132 | 528.3 | 0–1 | 4.85–25.16 °C | Nonequal weights | Biophysical criteria |
| 16- | [82] | Saudi Arabia, 2021 | Rainfall, soil, slope, land use/land cover, drainage network (5) | GIS, MCDA, SCS-CN | GIS, MCDA, rainwater harvesting, suitability SCS-CN, AHP | 681 | 197 | 1–3 | 29 °C | Nonequal | Biophysical criteria |
| 17- | [83] | Morocco, 2021 | Soil texture, drainage density, slope, land use/land cover, runoff (5) | GIS-based fuzzy (FAHP), remote sensing, (DEM) | RWH Suitability, SCS-CN, FAHP, RS, GIS, Kenitra province | 3052 | 450 | 0–1 | 13.1–20.1 °C | Nonequal | Biophysical criteria |
| 18- | [53] | Iran, 2020 | Rainfall, Spatial Geographic Information, Slope, Land use/cover, Soil texture, Drainage network, Basin/sub basin, River, Road and railway, Fault, City. (10) | Best-Worst Method and fuzzy logic in a GIS-based decision support system | RWH, BWM, agriculture, decision support system | 12,981 | 125–700 | 1–5 | 15.6 °C [84] | None | Biophysical and socioeconomic criteria |
| 19- | [28] | China, 2018 | Slope and hydrological soil groups, land use, hydrological soil groups (4) | ArcGIS, SCS-CN model | --------- | 90,021 | 370 mm [84] | 1–4 | 0–7 °C | None | Biophysical criteria |
| 20- | [41] | Iraq, 2019 | Lineament frequency, drainage frequency density, slope, maximum flow distance, stream order, flood, basin area, geological condition, distance from villages, distance from main roads, geometric and morphometric, basin length, vegetation index, land use (14) | GIS techniques, (DEM), remote sensing, (SRTM) | Barrages, reservoirs, dams, hydrology, water resource, environment | 13,370 | 115 | 0–1 | 2.6–42.8 °C | Equal weight and nonequal | Biophysical and socioeconomic criteria |
| 21- | [85] | India, 2017 | Soil texture, rainfall, soil depth, land use/land cover, slope | GIS, Google Earth, remote sensing | water-harvesting runoff, remote sensing, GIS, structures’ potential | 16,600 | 735 mm | NA | 11–45 °C | None | Biophysical criteria |
| 22- | [86] | Lebanon, 2000 | Slope, permeability, runoff coefficient, stream order, watershed area, soil type, rainfall (7) | Hydrologic modelling, (AHP) | Hydrologic modelling, geographic information systems, water harvesting, Lebanon, analytic hierarchy process | 300 mm | 0–1 | 16.23 °C [86] | Nonequal | Biophysical criteria | |
| 23- | [39] | Rajasthan/India, 2018 | Soil map, rainfall, drainage network, land use/land cover, depth of depression, slope, runoff (7) | MCAintegrated with RS and GIS | GIS rainwater harvesting, DEM, suitable location, surface runoff | 162 | 234.88 | 1–3 | 31.9–18.8 °C [87] | None | Biophysical criteria |
| 24- | [88] | Tanzania, 2007 | Drainage, slope, land use/land cover, soil texture, soil depth, rainfall (6) | (DSS), remote sensing | Remote sensing, rainwater harvesting, geographic information systems, decision support system, technologies | 400–700 | 0–100 | 26.55 °C [89] | Nonequal | Biophysical criteria | |
| 25- | [90] | Iraq, 2020 | Soil texture, drainage, land use/land cover, rainfall, slope (5) | RS, MCD | 452.6 | 116 | 1–5 | 8–33 °C | Nonequal | Biophysical | |
| 26- | [90] | Tunisia, 2022 | Economic, social, environmental indicators, land use, slope, stream network, road network (6) | Geographic information systems | Spatial multi-criteria, rainwater harvesting, indicator, analysis, Tunisia, composite sustainability | 361 | 157 mm. | 0–10 | −3–48 °C | Nonequal | Biophysical and socioeconomic |
| 27- | [91] | Iran, 2021 | Soil type, soil depth, rainfall, land use, slope (5) | GIS, SWAT, (WLC), multi-criteria decision analysis | SWAT model, geospatial techniques, arid and semi-arid regions, rainwater harvesting, multi-criteria decision analysis | 9762 | 303 | 1–4 | 11.6–26.7 °C | Nonequal | Biophysical criteria |
| 28- | [92] | Morocco, 2021 | Land use/land cover, soil type, lithology, rainfall, hydrographic typology, slope, lineament density (7) | RS and GIS data | Remote sensing, geographic information system water harvesting structures, multi-criteria analysis, dam | 20,500 | 300 | 0–10 | 20 °C | None | Biophysical criteria |
| 29- | [93] | Saudi Arabia, 2021 | Slope, alluvial, drainage density, rainfall distribution, runoff depth, soil, closeness to streams, curve number (8) | AHP, GIS, RS. | AHP, rainwater harvesting, pairwise comparison, arid regions, suitability map | 572.17 | 95 | 1–5 | 30.8 °C [94] 30.8 °C | Nonequal | Biophysical criteria |
| 30- | [95] | India, 2008 | Geomorphology, land use/land cover, road, drainage and lineaments (5) | Remote Sensing and GIS | Rainwater harvesting site suitability | 560 | 747.52 | 0–100 Rank 1–4 | 32.1 °C | Nonequal | Biophysical and socioeconomic |
| 31- | [67] | Saudi Arabia, 2015 | Slope, runoff, rainfall, soil texture, land use/land cover (5) | GIS, DSS | Rainwater harvesting, GIS, multi-factor evaluation (MFE), analytical hierarchy process, decision support system (DSS) | 12,000 | 600 | 1–5 suitability | 12–23 °C | Nonequal | Biophysical |
| 32- | [65] | Punjab, Pakistan, 2022 | Slope, runoff depth, land use/land cover, drainage density (4) | MCA, GIS, AHP | HEC-GeoHMS, rainwater harvesting, SCS-CN modification, satellite, multi-criteria analysis, water resource management, remote sensing | 300 | 781.4 | 0–100 | 21.5 °C [96] 21.5 °C | Nonequal | Biophysical criteria |
| 33- | [36] | Northern Jordan, 2010 | Distance to international borders, distance to roads, Distance to wells, distance to wadis, distance to roads, distance to urban centres, distance to faults, soil, rainfall, slope (12) | GIS, Boolean | WLC, GIS, Jordan, ponds, Boolean, harvesting | 2611 | 600 | (1–4) | 20.36 °C [97] | Nonequal | Biophysical and socioeconomic criteria |
| 34- | [98] | Northern Ethiopia, 2022 | Land use/land cover, soil texture, project, workforce and people’s priorities and water laws, rainfall, slope, runoff, implementation costs, accessibility (8) | GIS-, MCA, hydrological model | Catchment multi-criteria analysis, SCS curve number, water harvesting techniques, Werie, analytical hierarchy process, surface runoff | 1797 | 610 | 1–5 | 17 °C [99] 17 °C | Nonequal | Biophysical and socioeconomic criteria |
| 35- | [100] | Al-Qadisiyah, Iraq, 2020 | Runoff, soil, rainfall (3) | Geographical information system techniques, multi-criteria evaluation techniques | GIS multi-criteria, clean water quality, rainwater harvesting, runoff, remote sensing, water availability. | 8957.682 | 180 | (1–4) | 25 °C | Nonequal | Biophysical criteria |
| 36- | [54] | Iran, 2020 | Roads, faults, rainfall, land use, slope, soil depth, drainage density, drainage networks, RWH zones, soil type, farms and wells, urban areas (11) | MCA, hydrological models | Rainwater harvesting, decision support system, geospatial techniques, water conservation | 9762 | 262 | 0–1 | 11.6–26.7 °C | Nonequal | Biophysical and socioeconomic criteria |
| 37- | [101] | Iraq, 2017 | Land cover, surface distance to river, slope, soil, runoff (5) | GIS, fuzzy, AHP, | Analytic hierarchy process, system, Iraq, water harvesting, fuzzy logic, geographical information | 2098 | 190 | (1–5) | 23.74 and 26.43 °C | Nonequal | Biophysical criteria |
| 38- | [102] | Malawi, 2021 | Land use, soil type, slope, runoff, environmental factors, rainfall, socioeconomic factors (6) | RS, number (SCS-CN) | Harvesting technologies, rainwater, geographic information systems, service contour-tied ridging soil mulching, soil conservation | 343.1 | 700–900 | 1–5 | 12–30 °C | Nonequal | Biophysical, socioeconomic |
| 39- | [103] | Northern Ethiopia, 2016 | Soil data, drainage network, slope map, land use map, rainfall, stream order (6) | GIS-based multi-criteria analysis | Decision support suitability approach, multi-criteria analysis, indicators selection, suitability maps, participatory | 2380 | 520–680 | 1–10 | 16–20 °C | Nonequal | Biophysical criteria |
| 40- | [32] | Jordan, 2008 | Distance to international borders, distance to Agricultural areas, distance to roads, distance to urban areas, distance to wells, soil, slope, rainfall, distance to wadi, distance to water pipeline (10) | GIS layers, Boolean logic to find combinations of layers | Jordan, basalt, harvesting, ponds, GIS | 56,930 | 100–300 | 0–1 (suitability) | 35–40 °C (max annual 2–9 °C (min | Equal weights | Biophysical and socioeconomic criteria |
| 41- | [104] | Mongolia, 2018 | Runoff, forest land, mining area, agricultural land, road, soil type, surface slope, precipitation, catchment slope, drainage density, settlement area, water catchment area, lake (14) | GIS, AHP, spatial multi-criteria analysis | Analytic hierarchy process, water harvesting pond, spatial multi-criteria analysis, error matrix, proper sink | 1850.09 | 250 mm | 0–1 | 0–25 °C | Nonequal | Biophysical and socioeconomic criteria |
| 42- | [35] | Northwest Ethiopia, 2022 | Soil depth, slope, rainfall, distance from settlement, lineament density, soil, land use, distance from road (8) | AHP and combined in a GIS environment | Drought-prone area, rainwater harvesting, site suitability | 7073.79 | 620 mm | (1–4) | 27 °C | Nonequal | Biophysical criteria |
| 43- | [105] | West Bank, Palestine, 2020 | {Agricultural water poverty index (AWPI)}: (agricultural access, citizens above poverty line, illiteracy, agricultural extension, agricultural resources, drainage network, irrigated areas to governorate area), rainfall, curve number, surface slope, soil texture, evapotranspiration (ET), electrical conductivity, land use (14) | GIS environment, analytical hierarchy process (AHP) | Agricultural rainwater harvesting, GIS agricultural, rainwater suitability, sustainable agriculture, water poverty, harvesting | 5860 | 153–698 | 1–10 | 23.44 °C [106] | Nonequal | Biophysical criteria |
| 44- | [34] | Wadi Oum Zessar, Tunisia, 2016 | Climate and drainage (rainfall–drainage length), structure design (storage capacity–structure dimensions ratio –CCR ratio), site characteristic (soil depth–soil texture– slope), socioeconomic (distance to settlements), structure reliability (reliability ratio), demand and supply (10) | Analytical hierarchy process (AHP) supported by a geographic information system | RWH suitability, AHP, approach, GIS | 367 | 150–230 | (1–5) | 19–22 °C | Nonequal | Biophysical criteria |
| 45- | [107] | Mharib, Jordan, 2012 | Soil depth, soil texture, land tenure, slope, stoniness (5) | GIS | Socioeconomic and biophysical benchmark suitability, watershed, land tenure, participatory approach multidisciplinary, GIS, suitability | 60 | 100–150 | none | Nonequal | Biophysical and socioeconomic criteria | |
| 46- | [48] | Sinai Peninsula, Egypt, 2022 | Slope, land use/land cover, runoff depth topographic wetness index, drainage density, distance to roads, basin area, lineament frequency density, infiltration number, flow distance, distance to built-up areas, Bedouin community, distance to roads (12) | GIS, RS, MCA, hydrological modeling | Boolean analysis, multi-criteria analysis, remote sensing, sustainable development goals | 3580 | 55.86 | 0–1 | Nonequal | Biophysical and socioeconomic | |
| 47- | [108] | Maharloobakhtegan basin, Fars province, southern Iran, 2021 | Distance from road, slope, temperature, land use, soil type, population density, distance from lakes, elevation, precipitation, curve number (CN), geology, distance from river (13) | GIS and remote sensing techniques | Planning AIAs, optimum range artificial intelligence algorithms (AIAs), water scarcity, RWH, probability curve (PC) | 31,511 | 350–390 mm | (0–1) | 12.80–15.16 °C | None | Biophysical and socioeconomic criteria |
| 48- | [109] | ElDabaa area, Northwestern Coast of Egypt, 2015 | Landform, watershed area, rainfall amounts, geologic setting drainage lines, surface runoff, flow accumulation, flow direction, slope, morphometric parameters (10) | GIS and remote sensing | Geomorphology, rainwater harvesting, remote sensing, runoff, GIS | 770 | 164 mm | (1–5) | 22–31.6 °C 7.2–23.7 °C | None | Biophysical criteria |
| 49- | [42] | Qaradaqh basin, Sulaimaniyah city, Iraq, 2022 | Stream, geology, rain lineament, DEM, CN, land use/land cover, soil, villages, slope (10) | GIS, MCDM, AHP, sum average weighted method SAWM, fuzzy-based index (FBI) techniques | Drought crisis, water shortage, AHP, sustainable water development | 605 | 650 mm | (1–10) | 18 °C to 40 °C | Nonequal | Biophysical and socioeconomic |
| 50- | [110] | Egypt, 2015 | Slope, soil texture runoff, land use/land cover, rainfall (5) | (AHP), (DSS) 2 level (2,5) | Decision support system (DSS), geographic information system, rainwater harvesting, analytical hierarchy process (AHP), multi-criteria evaluation, (RWH) | 556,961 | 100–200 | (1–5) | Nonequal | Biophysical criteria | |
| 51- | [111] | Makanya catchment, Kilimanjaro region, Tanzania, 2005 | Production (ndiva), near water sources, e.g., stream, sloping terrain, shallow water table, Charco Dam (lambo), soils with good flat area, far from settlement, presence of conveyance system, non-saline soils, diversion canal (sasi), hard stable soils, water holding capacity, gentle slope, no rocks, ridges and border soils, water storage structure for crop slopes, soil type runoff (location of the farm) (15) | Geographic information system decision-making process, tow level (4,15) | Rainwater harvesting, indigenous knowledge, agriculture | 300 | 250 and 400 mm | (1–3) | None | Biophysical criteria | |
| 52- | [26] | Iraq, Anbar Province, Al-Muhammadi Valley, 2020 | Soil texture, drainage density, slope, vegetation cover, distance to the roads. (5) | Remote sensing, GIS | 5332 | 115 mm | 1–4 | 0–52 °C | Nonequal weight | Biophysical and socioeconomic criteria | |
| 53- | [13] | Toudgha watershed, Morocco, 2022 | Slope, drainage density, permeability, runoff depth, fracture density, rainfall, groundwater depth, closeness to stream (8) | MCDM coupled with GIS techniques, 2 level (2,8) | GIS, remote sensing, water management, rainwater harvesting, MCDM | 2296 | 40 to 345 mm | 1–5 | 18 °C | Nonequal | Biophysical criteria |
| 54- | [112] | Maysan Province, Iraq, 2020 | Stream order, roads, soil type, evaporation, slope, NDVI, precipitation (7) | 2 level (3, 7) | GIS, MCE, water harvesting catchment, spatial analysis, fuzzy model | 16,072 | rainfall range (14_39) mm/month | (0–1) | 23.74–26.43 °C | Nonequal | Biophysical and socioeconomic criteria |
| 55- | [113] | Kavir Area of Iran, 2019 | Soil texture, slope and drainage network, rainfall, infiltration (5) | Multi-criteria techniques | Suitability, GIS, arid land, fuzzy, AHP, runoff harvesting, MCDM | 680,000 hectares | 240 mm | (1–5) | Annual temperature of 19 °C in | Nonequal | Biophysical criteria |
| 56- | [64] | Wadi Hodein Basin, Red Sea, Egypt, 2022 | Drainage density, infiltration number, basin area, max. flow distance, flood volume, basin length, basin slope, flow distance (8) | Integration between watershed modelling and remote sensing | Remote sensing, (RWH), arid and semi-arid, rainwater harvesting regions, spatial probability model (WSPM), weighted | 11,600 | 0–1 | 37.5–14 °C | Two scenarios Equal and nonequal weights | Biophysical criteria | |
| 57- | [114] | Saudi Arabia, Riyadh, 2022 | Land use/land cover, slope, precipitation, potential runoff coefficient [17], soil texture (5) | Multi-criteria DSS, AHP | GIS, RST, arid climate, spatial distribution PRWH, MCDSS, AHP | 8500 | 150 mm | (1–5) | (28–46 °C) (15–35 °C) | Nonequal | Biophysical |
| 58- | [115] | Xinjiang, China, 2020 | Runoff, slope, crop characteristics, soil, rainfall, land use/land cover (5) | GIS, MCA | Runoff potential, ecological restoration, gully erosion, rainwater harvesting | 400 mm | (1–5) | 10 °C | Nonequal | Biophysical criteria | |
| 59- | [43] | Mediterranean region in northern Jordan, 2011 | Type of soil, vegetation, land use types, geometric, slope, sub-catchments, water drainage (6) | GIS, DEM and remote sensing technique | Management of watershed, landsat organic carbon colour, soil | 1000 | 150–650 mm | NA | 5.2–22.0 °C 2.5–28 °C | None | Biophysical criteria |
| 60- | [116] | Northeastern desert, Jordan, 2012 | Drainage networks, slope, drainage network, flow direction, runoff (5) | GIS | Flow discharge, harvesting, unit hydrograph, watershed models | 200 mm | NA | None | Biophysical criteria | ||
| 61- | [117] | Oasis zone, Mauritania, 2007 | Land cover, drainage, geomorphology, slope, geology, lineament (6) | Landsat image and GIS based on AHP | Water harvesting, GIS, remote sensing | 455,745 hac | Arid land | NA | Nonequal | Biophysical criteria | |
| 62- | [118] | Wadi Horan, Iraq, 2020 | Sediment index, cost–benefit index, hydrology index, evaporation index (4) | GIS-based multi-criteria analysis, the analytic hierarchy process (AHP), fuzzy | Harvesting, GIS, AHP, rainwater, fuzzy | 115 mm | 1–10 | Nonequal | Biophysical criteria | ||
| 63- | [119] | West Bank, Palestine, 2022 | Runoff, rainfall, slope, soil texture, land use (5) | Analytical hierarchy process (AHP) methods and GIS techniques | Technique (RWH), analytical hierarchy process, the West Bank, Palestine, rainwater harvesting method (AHP), GIS | 5860 | 450 | 0–100 | Nonequal | Biophysical criteria | |
| 64- | [120] | Western Desert of Iraq, 2021 | Irrigated lands, slope, land use/land cover, residential areas, distance from roads, runoff, soil texture (7) | Boolean, (WLC) | Rainwater harvesting, earthen dam, GIS, WLC, Boolean | 1953.1 | 115 | (1–4) | 40–2.6 °C | Nonequal | Biophysical and socioeconomic criteria |
| 65- | [121] | Ghazi Tehsil, Khyber Pakhtunkhwa, Pakistan, 2022 | Elevation, land cover, rainfall, drainage and various land uses (such as roads, settlements), surface slope, geology, soil (7) | Geospatial Approach, GIS, arc GIS | SCS-CN, HMS, geospatial technology, method, harvesting, HEC-geo-weighted overlay analysis, rainwater | 348 | Semi-arid | (1–3) | 4.8–44 °C | Nonequal | Biophysical and socioeconomic criteria |
| 66- | [122] | Morocco, 2021 | Drainage density, slope, runoff, land use/land cover, soil texture (5) | GIS, FAHP | Fuzzy AHP, GIS, rainwater harvesting, SCS-CN, WaTEM/SE, DEM | 4435 | 119 to 377 mm | 1–4 | 20 °C | Nonequal | Biophysical |
| 67- | [123] | Kirkuk, Iraq, 2015 | Runoff depth, slope, drainage, land use/land cover (4) | RS, GIS, | Rainwater harvesting, remote sensing and geographic information system, multi-criteria decision analysis | 4875 | 360 mm | 1–3 | Nonequal | Biophysical criteria | |
| 68- | [124] | Sana’a Basin, Yemen, 2022 | Slope, soil type, land use/land cover, precipitation, proximity to urban areas, water wells, dams, roads, open sewage passage, wadis, drainage networks (11) | Multi-criteria analysis, analytical hierarchy process | RWH, spate, indigenous, multi-criteria, socioeconomic criteria, dry areas, systems analysis irrigation systems, limited data | 3200 km2 | 240 mm | 1–5 | 20 °C | Nonequal | Biophysical and socioeconomic criteria |
Appendix B
| Reference | Selection Process for Criteria | Advantage | Disadvantage |
|---|---|---|---|
| [56] | Experts and stakeholders |
|
|
| [57] | Literature |
|
|
| [63] | Literature |
|
|
| [58] | Literature |
|
|
| [46] | Literature |
|
|
| [75] | Availability of data |
|
|
| [77] | Literature |
|
|
| [62] | Literature |
|
|
| [59] | Strategy of selecting criteria unclear |
|
|
| [40] | None |
| |
| [50] | Literature reviews |
|
|
| [79] | Literature reviews |
|
|
| [80] | Experts’ opinions |
|
|
| [61] | Literature |
|
|
| [60] | None |
|
|
| [82] | Literature |
|
|
| [83] | Literature |
|
|
| [53] | Literature |
|
|
| [28] | None |
|
|
| [41] | None |
|
|
| [85] | None |
|
|
| [86] | Experts and literature |
|
|
| [39] | None |
|
|
| [88] | Not mentioned |
|
|
| [90] | Literature |
|
|
| [90] | Literature and experts |
|
|
| [91] | Literature |
|
|
| [92] | Literature |
|
|
| [93] | Literature |
|
|
| [95] | Data availability |
|
|
| [67] | None |
|
|
| [65] | Literature |
|
|
| [36] | Literature |
|
|
| [98] | Literature |
|
|
| [100] | None |
|
|
| [54] | Literature |
|
|
| [101] | Literature review and available data |
|
|
| [102] | Literature review |
|
|
| [103] | Stakeholder workshop |
|
|
| [32] | Literature |
|
|
| [104] | Literature |
|
|
| [35] | Literature |
|
|
| [105] | Literature |
|
|
| [34] | Literature |
|
|
| [107] | Literature |
|
|
| [48] | Literature |
|
|
| [108] | Literature |
|
|
| [109] | Literature |
|
|
| [42] | Literature and experts |
|
|
| [110] | Literature and experts’ opinions |
|
|
| [111] | Literature and experts’ opinions |
|
|
| [26] | Literature |
|
|
| [13] | Literature and experts |
|
|
| [112] | Literature |
|
|
| [113] | Literature and experts’ opinions |
(5 experts) |
|
| [64] | Literature |
|
|
| [114] | Literature |
|
|
| [115] | Literature |
|
|
| [43] | Non |
|
|
| [116] | Non |
|
|
| [117] | Not mentioned |
|
|
| [118] | Not mentioned |
|
|
| [119] | Literature and experts |
|
|
| [120] | Literature |
|
|
| [121] | Literature |
|
|
| [122] | Literature |
|
|
| [123] | Available data |
|
|
| [124] | Literature |
|
|
References
- Ammar, A.A. Evaluating Rainwater Harvesting Systems in Arid and Semi-Arid Regions. Ph.D. Thesis, Wageningen University, Wageningen, The Netherlands, 2017. [Google Scholar]
- Rutherford, R. Water Harvesting: An Overview. 2000. Available online: https://protosh2o.act.be/VIRTUELE_BIB/Watertechniek/310_Oppervl_Water/311_RUT_E2_Water_Harvesting.pdf (accessed on 20 July 2023).
- Beckers, B.; Berking, J.; Schütt, B. Ancient water harvesting methods in the drylands of the Mediterranean and Western Asia. J. Anc. Stud. 2013, 2, 145–164. [Google Scholar]
- Prinz, D. Water Harvesting–History, techniques, trends. Z. F. Bewaesserungswirtschaft 1996, 31, 64–105. [Google Scholar]
- Boers, T.M.; Ben-Asher, J. A review of rainwater harvesting. Agric. Water Manag. 1982, 5, 145–158. [Google Scholar] [CrossRef]
- Oweis, T.Y.; Prinz, D.; Hachum, A.Y. Rainwater Harvesting for Agriculture in the Dry Areas; CRC Press: Boca Raton, FL, USA, 2012; pp. 1–276. [Google Scholar]
- Prinz, D. Water harvesting—Past and future. In Sustainability of Irrigated Agriculture; Springer: Berlin/Heidelberg, Germany, 1996; pp. 137–168. [Google Scholar]
- Iliopoulou, T.; Dimitriadis, P.; Siganou, A.; Markantonis, D.; Moraiti, K.; Nikolinakou, M.; Meletopoulos, I.T.; Mamassis, N.; Koutsoyiannis, D.; Sargentis, G.-F. Modern Use of Traditional Rainwater Harvesting Practices: An Assessment of Cisterns’ Water Supply Potential in West Mani, Greece. Heritage 2022, 5, 2944–2954. [Google Scholar] [CrossRef]
- Sazakli, E.; Alexopoulos, A.; Leotsinidis, M. Rainwater harvesting, quality assessment and utilization in Kefalonia Island, Greece. Water Res. 2007, 41, 2039–2047. [Google Scholar] [CrossRef]
- Critchley, W.; Siegert, K.; Chapman, C. Water Harvesting: A Manual Guide for the Design and Construction of Water Harvesting Schemes for Plant Production; FAO: Rome, Italy, 1991. [Google Scholar]
- Oweis, T.; Prinz, D.; Hachum, A. Water Harvesting: Indigenous Knowledge for the Future of the Drier Environments; ICARDA: Beirut, Lebanon, 2001. [Google Scholar]
- Anchan, S.S.; Prasad, H.S. Feasibility of roof top rainwater harvesting potential—A case study of South Indian University. Clean. Eng. Technol. 2021, 4, 100206. [Google Scholar] [CrossRef]
- Ouali, L.; Hssaisoune, M.; Kabiri, L.; Slimani, M.M.; El Mouquaddam, K.; Namous, M.; Arioua, A.; Ben Moussa, A.; Benqlilou, H.; Bouchaou, L. Mapping of potential sites for rainwater harvesting structures using GIS and MCDM approaches: Case study of the Toudgha watershed, Morocco. Euro-Mediterr. J. Environ. Integr. 2022, 7, 49–64. [Google Scholar] [CrossRef]
- Pereira, L.S.; Cordery, I.; Iacovides, I. Coping with Water Scarcity, Technical Documents in Hydrology; International Hydrological Programme—UNESCO: Paris, France, 2002. [Google Scholar]
- Lund, J.R. Integrating social and physical sciences in water management. Water Resour. Res. 2015, 51, 5905–5918. [Google Scholar] [CrossRef]
- Qu, B.; Zhao, H.; Chen, Y.; Yu, X. Effects of low-light stress on aquacultural water quality and disease resistance in Nile tilapia. PLoS ONE 2022, 17, e0268114. [Google Scholar] [CrossRef]
- Blabolil, P.; Logez, M.; Ricard, D.; Prchalová, M.; Říha, M.; Sagouis, A.; Peterka, J.; Kubečka, J.; Argillier, C. An assessment of the ecological potential of Central and Western European reservoirs based on fish communities. Fish. Res. 2016, 173, 80–87. [Google Scholar] [CrossRef]
- Alsaeed, B.S.; Hunt, D.V.L.; Sharifi, S. Sustainable Water Resources Management Assessment Frameworks (SWRM-AF) for Arid and Semi-Arid Regions: A Systematic Review. Sustainability 2022, 14, 15293. [Google Scholar] [CrossRef]
- Juwana, I.; Muttil, N.; Perera, B. Indicator-based water sustainability assessment—A review. Sci. Total Environ. 2012, 438, 357–371. [Google Scholar] [CrossRef] [PubMed]
- Shafiei, M.; Rahmani, M.; Gharari, S.; Davary, K.; Abolhassani, L.; Teimouri, M.S.; Gharesifard, M. Sustainability assessment of water management at river basin level: Concept, methodology and application. J. Environ. Manag. 2022, 316, 115201. [Google Scholar] [CrossRef] [PubMed]
- Bradley Guy, G.; Kibert, C.J. Developing indicators of sustainability: US experience. Build. Res. Inf. 1998, 26, 39–45. [Google Scholar] [CrossRef]
- Schwemlein, S.; Cronk, R.; Bartram, J. Indicators for monitoring water, sanitation, and hygiene: A systematic review of indicator selection methods. Int. J. Environ. Res. Public Health 2016, 13, 333. [Google Scholar] [CrossRef] [PubMed]
- Sayl, K.N. Rainwater Harvesting Quantification and Planning in an Arid Region Using Geographic Information System and Remote Sensing Technologies. Ph.D. Thesis, Universiti Kebangsaan Malaysia, Bangi, Malaysia, 2017. [Google Scholar]
- Joshi, A.; Kale, S.; Chandel, S.; Pal, D.K. Likert scale: Explored and explained. Br. J. Appl. Sci. Technol. 2015, 7, 396. [Google Scholar] [CrossRef]
- Piper, R.J. How to write a systematic literature review: A guide for medical students. In National AMR, Fostering Medical Research; University of Edinburgh: Edinburgh, UK, 2013; Volume 1, pp. 1–8. [Google Scholar]
- Khudhair, M.A.; Sayl, K.N.; Darama, Y. Locating Site Selection for Rainwater Harvesting Structure using Remote Sensing and GIS. In Proceedings of the 3rd International Conference on Sustainable Engineering Techniques (ICSET 2020), Baghdad, Iraq, 15 April 2020; IOP Publishing: Bristol, UK, 2020. [Google Scholar]
- Sayl, K.N.; Mohammed, A.S.; Ahmed, A.D. GIS-based approach for rainwater harvesting site selection. In Proceedings of the 4th International Conference on Buildings, Construction and Environmental Engineering (BCEE4 2019), Istanbul, Turkey, 7–9 October 2019; Institute of Physics Publishing: Bristol, UK, 2019. [Google Scholar]
- Zheng, H.; Gao, J.; Xie, G.; Jin, Y.; Zhang, B. Identifying important ecological areas for potential rainwater harvesting in the semiarid area of Chifeng, China. PLoS ONE 2018, 13, e0201132. [Google Scholar] [CrossRef]
- Nanekely, M.A.A. A Regulatory Directive Technical Framework for Sustainable Water Management in the Semi-Arid Climates; University of Salford: Salford, UK, 2020. [Google Scholar]
- Oweis, T.; Oberle, A.; Prinz, D. Determination of potential sites and methods for water harvesting in central Syria. Adv. GeoEcology 1998, 31, 83–88. [Google Scholar]
- FAO. Training Course on Water Harvesting: Land and Water Digital Media Series; Food and Agriculture Organization of the United Nations (FAO): Rome, Italy, 2003. [Google Scholar]
- Al-Adamat, R. GIS as a decision support system for siting water harvesting ponds in the basalt aquifer/NE Jordan. J. Environ. Assess. Policy Manag. 2008, 10, 189–206. [Google Scholar] [CrossRef]
- Team, Q.D. QGIS 3.28 Geographic Information System. Open Source Geospatial Foundation Project. 2023. Available online: https://docs.qgis.org/3.28/en/docs/gentle_gis_introduction/spatial_analysis_interpolation.html (accessed on 2 January 2023).
- Adham, A.; Riksen, M.; Ouessar, M.; Ritsema, C.J. A methodology to assess and evaluate rainwater harvesting techniques in (semi-) arid regions. Water 2016, 8, 198. [Google Scholar] [CrossRef]
- Yegizaw, E.S.; Ejegu, M.A.; Tolossa, A.T.; Teka, A.H.; Andualem, T.G.; Tegegne, M.A.; Walle, W.M.; Shibeshie, S.E.; Dirar, T.M. Geospatial and AHP Approach Rainwater Harvesting Site Identification in Drought-Prone Areas, South Gonder Zone, Northwest Ethiopia. J. Ind. Soc. Remote Sens. 2022, 50, 1321–1331. [Google Scholar] [CrossRef]
- Al-Adamat, R.; Diabat, A.; Shatnawi, G. Combining GIS with multicriteria decision making for siting water harvesting ponds in Northern Jordan. J. Arid Environ. 2010, 74, 1471–1477. [Google Scholar] [CrossRef]
- Ibrahim, S.; Brasi, B.; Yu, Q.; Siddig, M. Curve number estimation using rainfall and runoff data from five catchments in Sudan. Open Geosci. 2022, 14, 294–303. [Google Scholar] [CrossRef]
- Thompson, R.D.; Perry, A.H. Applied Climatology: Principles and Practice; Psychology Press: London, UK, 1997. [Google Scholar]
- Tiwari, K.; Goyal, R.; Sarkar, A. GIS-based Methodology for Identification of Suitable Locations for Rainwater Harvesting Structures. Water Resour. Manag. 2018, 32, 1811–1825. [Google Scholar] [CrossRef]
- Karani, R.; Joshi, A.; Joshi, M.; Velury, S.; Shah, S. Optimization of rainwater harvesting sites using GIS. In Proceedings of the 5th International Conference on Geographical Information Systems Theory, Applications and Management (GISTAM 2019), Heraklion, Greece, 3–5 May 2019; pp. 228–233. [Google Scholar]
- Sayl, K.N.; Muhammad, N.S.; El-Shafie, A. Identification of potential sites for runoff water harvesting. Proc. Inst. Civ. Eng. Water Manag. 2019, 172, 135–148. [Google Scholar] [CrossRef]
- Alkaradaghi, K.; Hamamin, D.; Karim, H.; Al-Ansari, N.; Ali, S.S.; Laue, J.; Ali, T. Geospatial Technique Integrated with MCDM Models for Selecting Potential Sites for Harvesting Rainwater in the Semi-arid Region. Water Air Soil Pollut. 2022, 233, 313. [Google Scholar] [CrossRef]
- Makhamreh, Z. Using remote sensing approach and surface landscape conditions for optimization of watershed management in Mediterranean regions. Phys. Chem. Earth 2011, 36, 213–220. [Google Scholar] [CrossRef]
- Adham, A.; Sayl, K.N.; Abed, R.; Abdeladhim, M.A.; Wesseling, J.G.; Riksen, M.; Fleskens, L.; Karim, U.; Ritsema, C.J. A GIS-based approach for identifying potential sites for harvesting rainwater in the Western Desert of Iraq. Int. Soil Water Conserv. Res. 2018, 6, 297–304. [Google Scholar] [CrossRef]
- Carlston, C.W. Drainage Density and Streamflow; US Government Printing Office: Washington, DC, USA, 1963.
- Matomela, N.; Li, T.; Ikhumhen, H.O. Siting of Rainwater Harvesting Potential Sites in Arid or Semi-arid Watersheds Using GIS-based Techniques. Environ. Process. 2020, 7, 631–652. [Google Scholar] [CrossRef]
- Newton, I.H.; Zaman, R.U.; Nowreen, S.; Islam, A.S.; Razzaque, S.; Islam, G.T. Deciphering of groundwater recharge potential zones in Dhaka City, Bangladesh by RS and GIS techniques. In Water, Flood Management and Water Security Under a Changing Climate: Proceedings from the 7th International Conference on Water and Flood Management, Dhaka, Bangladesh, 2–4 March 2019; Springer: Berlin/Heidelberg, Germany, 2019; pp. 85–97. [Google Scholar]
- Ezzeldin, M.; Konstantinovich, S.E.; Igorevich, G.I. Determining the suitability of rainwater harvesting for the achievement of sustainable development goals in Wadi Watir, Egypt using GIS techniques. J. Environ. Manag. 2022, 313, 114990. [Google Scholar] [CrossRef]
- Al-Adamat, R.; AlAyyash, S.; Al-Amoush, H.; Al-Meshan, O.; Rawajfih, Z.; Shdeifat, A.; Al-Harahsheh, A.; Al-Farajat, M. The combination of indigenous knowledge and geo-informatics for water harvesting siting in the Jordanian Badia. J. Geogr. Inf. Syst. 2012, 4, 366–376. [Google Scholar] [CrossRef]
- Faisal, R.M.; Abdaki, M. Multi-Criteria Analysis For Selecting Suitable Sites Of Water Harvesting In Northern Al Tharthar Watershed. J. Sustain. Sci. Manag. 2021, 16, 218–236. [Google Scholar] [CrossRef]
- Hatibu, N.; Mahoo, H. Rainwater harvesting technologies for agricultural production: A case for Dodoma, Tanzania. In Conservation Tillage with Animal Traction; ATNESA: Harare, Zimbabwe, 1999; Volume 161. [Google Scholar]
- Barron, J.; Noel, S.; Malesu, M.; Oduor, A.; Shone, G.; Rockström, J. Agricultural Water Management in Smallholder Farming Systems: The Value of Soft Components in Mesoscale Interventions; Stockholm Environment Institute: Stockholm, Sweden, 2008. [Google Scholar]
- Aghaloo, K.; Chiu, Y.-R. Identifying optimal sites for a rainwater-harvesting agricultural scheme in iran using the best-worst method and fuzzy logic in a GIS-based decision support system. Water 2020, 12, 1913. [Google Scholar] [CrossRef]
- Shadmehri Toosi, A.; Ghasemi Tousi, E.; Ghassemi, S.A.; Cheshomi, A.; Alaghmand, S. A multi-criteria decision analysis approach towards efficient rainwater harvesting. J. Hydrol. 2020, 582, 124501. [Google Scholar] [CrossRef]
- Heimerl, F.; Lohmann, S.; Lange, S.; Ertl, T. Word cloud explorer: Text analytics based on word clouds. In Proceedings of the 2014 47th Hawaii International Conference on System Sciences, Waikoloa, HI, USA, 6–9 January 2014; pp. 1833–1842. [Google Scholar]
- Albalawneh, A.; Chang, T.K.; Huang, C.W.; Mazahreh, S. Using landscape metrics analysis and analytic hierarchy process to assess water harvesting potential sites in jordan. Environments 2015, 2, 415–434. [Google Scholar] [CrossRef]
- Mahmoud, S.H.; Alazba, A.A. The potential of in situ rainwater harvesting in arid regions: Developing a methodology to identify suitable areas using GIS-based decision support system. Arab. J. Geosci. 2015, 8, 5167–5179. [Google Scholar] [CrossRef]
- Jamali, A.A.; Ghorbani Kalkhajeh, R. Spatial Modeling Considering valley’s Shape and Rural Satisfaction in Check Dams Site Selection and Water Harvesting in the Watershed. Water Resour. Manag. 2020, 34, 3331–3344. [Google Scholar] [CrossRef]
- Mahmoud, S.H.; Adamowski, J.; Alazba, A.A.; El-Gindy, A.M. Rainwater harvesting for the management of agricultural droughts in arid and semi-arid regions. Paddy Water Environ. 2016, 14, 231–246. [Google Scholar] [CrossRef]
- Karimi, H.; Zeinivand, H. Integrating runoff map of a spatially distributed model and thematic layers for identifying potential rainwater harvesting suitability sites using GIS techniques. Geocarto Int. 2021, 36, 320–339. [Google Scholar] [CrossRef]
- Elewa, H.H.; Zelenakova, M.; Nosair, A.M. Integration of the analytical hierarchy process and gis spatial distribution model to determine the possibility of runoff water harvesting in dry regions: Wadi watir in sinai as a case study. Water 2021, 13, 804. [Google Scholar] [CrossRef]
- Sayl, K.N.; Muhammad, N.S.; El-Shafie, A. Robust approach for optimal positioning and ranking potential rainwater harvesting structure (RWH): A case study of Iraq. Arab. J. Geosci. 2017, 10, 413. [Google Scholar] [CrossRef]
- Elewa, H.H.; Ramadan, E.S.M.; Nosair, A.M. Spatial-based hydro-morphometric watershed modeling for the assessment of flooding potentialities. Environ. Earth Sci. 2016, 75, 927. [Google Scholar] [CrossRef]
- Aly, M.M.; Sakr, S.A.; Zayed, M.S.M. Selection of the optimum locations for rainwater harvesting in arid regions using WMS and remote sensing. Case Study: Wadi Hodein Basin, Red Sea, Egypt. Alex. Eng. J. 2022, 61, 9795–9810. [Google Scholar] [CrossRef]
- Farooq, S.; Mahmood, K.; Faizi, F. Comparative Simulation of GIS-Based Rainwater Management Solutions. Water Resour. Manag. 2022, 36, 3049–3065. [Google Scholar] [CrossRef]
- El-Awar, F.A.; Makke, M.; Zurayk, R.A.; Mohtar, R.H. A hydro-spatial hierarchical methodology for siting water harvesting reservoirs in dry areas. In Proceedings of the 2000 ASAE Annual International Meeting, Technical Papers: Engineering Solutions for a New Century, Milwaukee, WI, USA, 9–12 July 2000; pp. 1635–1667. [Google Scholar]
- Mahmoud, S.H.; Mohammad, F.S.; Alazba, A.A. Delineation of potential sites for rainwater harvesting structures using a geographic information system-based decision support system. Hydrol. Res. 2015, 46, 591–606. [Google Scholar] [CrossRef]
- Lee, D.K.; In, J.; Lee, S. Standard deviation and standard error of the mean. Korean J. Anesthesiol. 2015, 68, 220–223. [Google Scholar] [CrossRef]
- Parsons, H.M.; Ekman, D.R.; Collette, T.W.; Viant, M.R. Spectral relative standard deviation: A practical benchmark in metabolomics. Analyst 2009, 134, 478–485. [Google Scholar] [CrossRef]
- Chaves, H.M.; Alipaz, S. An integrated indicator based on basin hydrology, environment, life, and policy: The watershed sustainability index. Water Resour. Manag. 2007, 21, 883–895. [Google Scholar] [CrossRef]
- Radaideh, J.; Al-Zboon, K.; Al-Harahsheh, A.; Al-Adamat, R. Quality assessment of harvested rainwater for domestic uses. Jordan J. Earth Environ. Sci. 2009, 2, 26–31. [Google Scholar]
- Schets, F.; Italiaander, R.; Van Den Berg, H.; de Roda Husman, A. Rainwater harvesting: Quality assessment and utilization in The Netherlands. J. Water Health 2010, 8, 224–235. [Google Scholar] [CrossRef]
- Weather & Climate. North Sinai Climate. Available online: https://tcktcktck.org/egypt/north-sinai (accessed on 22 September 2022).
- Dezerald, O.; Leroy, C.; Corbara, B.; Dejean, A.; Talaga, S.; Cereghino, R. Tank bromeliads sustain high secondary production in neotropical forests. Aquat. Sci. 2018, 80, 14. [Google Scholar] [CrossRef]
- Mugo, G.M.; Odera, P.A. Site selection for rainwater harvesting structures in Kiambu County-Kenya. Egypt. J. Remote Sens. Space Sci. 2019, 22, 155–164. [Google Scholar] [CrossRef]
- Wikipedia. Kiambu County. 2022. Available online: https://en.wikipedia.org/wiki/Kiambu_County#Climate. (accessed on 22 September 2022).
- Mahmood, K.; Qaiser, A.; Farooq, S.; Nisa, M. RS- and GIS-based modeling for optimum site selection in rain water harvesting system: An SCS-CN approach. Acta Geophys. 2020, 68, 1175–1185. [Google Scholar] [CrossRef]
- National Informatics Centre, Ministry of Electronics and Information Technology, Government of India. DISTRICT NAGPUR. 2022. Available online: https://nagpur.gov.in/geography-climate/#. (accessed on 9 April 2023).
- Harka, A.E.; Roba, N.T.; Kassa, A.K. Modelling rainfall runoff for identification of suitable water harvesting sites in Dawe River watershed, Wabe Shebelle River basin, Ethiopia. J. Water Land Dev. 2020, 47, 186–195. [Google Scholar] [CrossRef]
- Tahvili, Z.; Khosravi, H.; Malekian, A.; Khalighi Sigaroodi, S.; Pishyar, S.; Singh, V.P.; Ghodsi, M. Locating suitable sites for rainwater harvesting (RWH) in the central arid region of Iran. Sustain. Water Resour. Manag. 2021, 7, 10. [Google Scholar] [CrossRef]
- Weather & Climate. Anarak Climate. Available online: https://tcktcktck.org/iran/ilam/anarak (accessed on 22 September 2022).
- Al-Ghobari, H.; Dewidar, A.Z. Integrating GIS-based MCDA techniques and the SCS-CN method for identifying potential zones for rainwater harvesting in a semi-arid area. Water 2021, 13, 704. [Google Scholar] [CrossRef]
- Aghad, M.; Manaouch, M.; Sadiki, M.; Batchi, M.; Al Karkouri, J. Identifying suitable sites for rainwater harvesting using runoff model (Scs-cn), remote sensing and gis based fuzzy analytical hierarchy process (FAHP) in Kenitra Province, NW Morocco. Geogr. Technol. 2021, 16, 111–127. [Google Scholar] [CrossRef]
- Wikipedia. Chifeng. 2022. Available online: https://en.wikipedia.org/wiki/Chifeng. (accessed on 4 April 2023).
- Rejani, R.; Rao, K.V.; Srinivasa Rao, C.H.; Osman, M.; Sammi Reddy, K.; George, B.; Pratyusha Kranthi, G.S.; Chary, G.R.; Swamy, M.V.; Rao, P.J. Identification of Potential Rainwater-Harvesting Sites for the Sustainable Management of a Semi-Arid Watershed. Irrig. Drain. 2017, 66, 227–237. [Google Scholar] [CrossRef]
- Climate Change Knowledge Portal. Lebanon. 2022. Available online: https://climateknowledgeportal.worldbank.org/country/lebanon/climate-data-historical. (accessed on 22 September 2022).
- Wikipedia. Climate of Rajasthan. Available online: https://en.wikipedia.org/wiki/Climate_of_Rajasthan (accessed on 22 September 2022).
- Mbilinyi, B.P.; Tumbo, S.D.; Mahoo, H.F.; Mkiramwinyi, F.O. GIS-based decision support system for identifying potential sites for rainwater harvesting. Phys. Chem. Earth 2007, 32, 1074–1081. [Google Scholar] [CrossRef]
- World Climate Guide. Climate—Tanzania. Available online: https://www.climatestotravel.com/climate/tanzania (accessed on 20 September 2022).
- Abdeladhim, M.A.; Fleskens, L.; Baartman, J.; Sghaier, M.; Ouessar, M.; Ritsema, C.J. Generation of Potential Sites for Sustainable Water Harvesting Techniques in Oum Zessar Watershed, South East Tunisia. Sustainability 2022, 14, 5754. [Google Scholar] [CrossRef]
- Doulabian, S.; Ghasemi Tousi, E.; Aghlmand, R.; Alizadeh, B.; Ghaderi Bafti, A.; Abbasi, A. Evaluation of integrating swat model into a multi-criteria decision analysis towards reliable rainwater harvesting systems. Water 2021, 13, 1935. [Google Scholar] [CrossRef]
- El Ghazali, F.E.; Laftouhi, N.E.; Fekri, A.; Randazzo, G.; Benkirane, M. Enhancing the success of new dams implantation under semi-arid climate, based on a multicriteria analysis approach: Case of Marrakech region (Central Morocco). Open Geosci. 2021, 13, 1494–1508. [Google Scholar] [CrossRef]
- Balkhair, K.S.; Ur Rahman, K. Development and assessment of rainwater harvesting suitability map using analytical hierarchy process, GIS and RS techniques. Geocarto Int. 2021, 36, 421–448. [Google Scholar] [CrossRef]
- Wikipedia. Al Lith. Available online: https://en.wikipedia.org/wiki/Al_Lith (accessed on 19 September 2022).
- Kumar, M.G.; Agarwal, A.K.; Bali, R. Delineation of potential sites for water harvesting structures using remote sensing and GIS. J. Indian Soc. Remote Sens. 2008, 36, 323–334. [Google Scholar] [CrossRef]
- Wikipedia. Punjab, Pakistan. Available online: https://en.wikipedia.org/wiki/Punjab,_Pakistan#Climate (accessed on 19 September 2022).
- Climate Weather and Portal. Jordon. Available online: https://climateknowledgeportal.worldbank.org/country/jordan/climate-data-historical (accessed on 22 September 2022).
- Alem, F.; Abebe, B.A.; Degu, A.M.; Goitom, H.; Grum, B. Assessment of water harvesting potential sites using GIS-based MCA and a hydrological model: Case of Werie catchment, northern Ethiopia. Sustain. Water Resour. Manag. 2022, 8, 70. [Google Scholar] [CrossRef]
- World Climate Guide. Climate—Ethiopia. Available online: https://www.climatestotravel.com/climate/ethiopia (accessed on 9 April 2023).
- Al-Khuzaie, M.M.; Janna, H.; Al-Ansari, N. Assessment model of water harvesting and storage location using GIS and remote sensing in Al-Qadisiyah, Iraq. Arab. J. Geosci. 2020, 13, 1154. [Google Scholar] [CrossRef]
- Al-Abadi, A.M.; Shahid, S.; Ghalib, H.B.; Handhal, A.M. A GIS-Based Integrated Fuzzy Logic and Analytic Hierarchy Process Model for Assessing Water-Harvesting Zones in Northeastern Maysan Governorate, Iraq. Arab. J. Sci. Eng. 2017, 42, 2487–2499. [Google Scholar] [CrossRef]
- Nyirenda, F.; Mhizha, A.; Gumindoga, W.; Shumba, A. A gis-based approach for identifying suitable sites for rainwater harvesting technologies in kasungu district, malawi. Water SA 2021, 47, 347–355. [Google Scholar] [CrossRef]
- Grum, B.; Hessel, R.; Kessler, A.; Woldearegay, K.; Yazew, E.; Ritsema, C.; Geissen, V. A decision support approach for the selection and implementation of water harvesting techniques in arid and semi-arid regions. Agric. Water Manag. 2016, 173, 35–47. [Google Scholar] [CrossRef]
- Ochir, A.; Boldbaatar, D.; Zorigt, M.; Tsetsgee, S.; van Genderen, J.L. Site selection for water harvesting ponds using spatial multi-criteria analysis in a region with fluctuating climate. Geocarto Int. 2018, 33, 699–712. [Google Scholar] [CrossRef]
- Shadeed, S.; Judeh, T.; Riksen, M. Rainwater harvesting for sustainable agriculture in high water-poor areas in the West Bank, Palestine. Water 2020, 12, 380. [Google Scholar] [CrossRef]
- Weather and Climate. Climate—Ethiopia. 2010. Available online: https://tcktcktck.org/palestine/west-bank/bethlehem (accessed on 9 November 2022).
- Ziadat, F.; Bruggeman, A.; Oweis, T.; Haddad, N.; Mazahreh, S.; Sartawi, W.; Syuof, M. A Participatory GIS Approach for Assessing Land Suitability for Rainwater Harvesting in an Arid Rangeland Environment. Arid. Land Res. Manag. 2012, 26, 297–311. [Google Scholar] [CrossRef]
- Darabi, H.; Moradi, E.; Davudirad, A.A.; Ehteram, M.; Cerda, A.; Haghighi, A.T. Efficient rainwater harvesting planning using socio-environmental variables and data-driven geospatial techniques. J. Clean. Prod. 2021, 311, 1308–1321. [Google Scholar] [CrossRef]
- Yousif, M.; Bubenzer, O. Geoinformatics application for assessing the potential of rainwater harvesting in arid regions. Case study: El Daba’a area, Northwestern Coast of Egypt. Arab. J. Geosci. 2015, 8, 9169–9191. [Google Scholar] [CrossRef]
- Mahmoud, S.H.; Alazba, A.A.; Adamowski, J.; El-Gindy, A.M. GIS methods for sustainable stormwater harvesting and storage using remote sensing for land cover data—Location assessment. Environ. Monit. Assess. 2015, 187, 598. [Google Scholar] [CrossRef]
- Mbilinyi, B.P.; Tumbo, S.D.; Mahoo, H.F.; Senkondo, E.M.; Hatibu, N. Indigenous knowledge as decision support tool in rainwater harvesting. Phys. Chem. Earth 2005, 30, 792–798. [Google Scholar] [CrossRef]
- Alwan, I.A.; Aziz, N.A.; Hamoodi, M.N. Potential water harvesting sites identification using spatial multi-criteria evaluation in Maysan Province, Iraq. ISPRS Int. J. Geo-Inf. 2020, 9, 235. [Google Scholar] [CrossRef]
- Shalamzari, M.J.; Zhang, W.; Gholami, A.; Zhang, Z. Runoff harvesting site suitability analysis for wildlife in sub-desert regions. Water 2019, 11, 194. [Google Scholar] [CrossRef]
- Radwan, F.; Alazba, A.A. Suitable sites identification for potential rainwater harvesting (PRWH) using a multi-criteria decision support system (MCDSS). Acta Geophys. 2022, 71, 449–468. [Google Scholar] [CrossRef]
- Li, Z.; Zhang, W.; Aikebaier, Y.; Dong, T.; Huang, G.; Qu, T.; Zhang, H. Sustainable development of arid rangelands and managing rainwater in Gullies, Central Asia. Water 2020, 12, 2533. [Google Scholar] [CrossRef]
- Hadadin, N.; Shawash, S.; Tarawneh, Z.; Banihani, Q.; Hamdi, M.R. Spatial hydrological analysis for water harvesting potential using ArcGIS model: The case of the north-eastern desert, Jordan. Water Policy 2012, 14, 524–538. [Google Scholar] [CrossRef]
- Ahmed, A.O.C.; Nagasawa, R.; Hattori, K.; Chongo, D.; Perveen, M.F. Analytical hierarchic process in conjunction with GIS for identification of suitable sites for water harvesting in the Oasis areas: Case study of the Oasis zone of Adrar, Northern Mauritania. J. Appl. Sci. 2007, 7, 2911–2917. [Google Scholar] [CrossRef]
- Sayl, K.; Adham, A.; Ritsema, C.J. A GIS-based multicriteria analysis in modeling optimum sites for rainwater harvesting. Hydrology 2020, 7, 51. [Google Scholar] [CrossRef]
- AbdeladhimAdham, A.; Riksen, M.; Abed, R.; Shadeed, S.; Ritsema, C. Assessing Suitable Techniques for Rainwater Harvesting Using Analytical Hierarchy Process (AHP) Methods and GIS Techniques. Water 2022, 14, 2110. [Google Scholar] [CrossRef]
- Hashim, H.Q.; Sayl, K.N. Detection of suitable sites for rainwater harvesting planning in an arid region using geographic information system. Appl. Geomat. 2021, 13, 235–248. [Google Scholar] [CrossRef]
- Khan, D.; Raziq, A.; Young, H.-W.V.; Sardar, T.; Liou, Y.-A. Identifying Potential Sites for Rainwater Harvesting Structures in Ghazi Tehsil, Khyber Pakhtunkhwa, Pakistan, Using Geospatial Approach. Remote Sens. 2022, 14, 5008. [Google Scholar] [CrossRef]
- Manaouch, M.; Sadiki, M.; Fenjiro, I. Integrating GIS-based FAHP and WaTEM/SEDEM for identifying potential RWH areas in semi-arid areas. Geocarto Int. 2021, 37, 8882–8905. [Google Scholar] [CrossRef]
- Buraihi, F.H.; Shariff, A.R.M. Selection of rainwater harvesting sites by using remote sensing and GIS techniques: A case study of Kirkuk, Iraq. J. Teknol. 2015, 76, 75–81. [Google Scholar] [CrossRef]
- Aklan, M.; Al-Komaim, M.; de Fraiture, C. Site suitability analysis of indigenous rainwater harvesting systems in arid and data-poor environments: A case study of Sana’a Basin, Yemen. Environ. Dev. Sustain. 2022, 76, 75–81. [Google Scholar] [CrossRef]


| Biophysical Criteria | Socioeconomic Criteria | ||
|---|---|---|---|
| Criteria | Synonyms | Criteria | Synonyms |
|
|
| |
|
| ||
|
| ||
|
|
| |
|
|
|
|
|
| ||
|
|
|
|
|
|
|
|
| |||
|
| ||
|
| ||
| Soil Type | Infiltration Rate (mm/h) |
|---|---|
| Coarse sand | >22 |
| Fine sand | >15 |
| Fine sandy loam | 12 |
| Silt loam | 10 |
| Silty clay loam | 9 |
| Clay loam | 7.5 |
| Silty clay | 5 |
| Clayey soil | 4 |
| Criteria | Max. Weight (%) | Min. Weight (%) | Average (%) | Standard Deviation (%) | Relative Standard Deviation (RSD) | Frequency of Criteria in Existing Frameworks |
|---|---|---|---|---|---|---|
| 45.7 | 6 | 23.2 | 10.5 | 45.26 | 44 |
| 53 | 5.5 | 32 | 12.8 | 40.00 | 42 |
| 35.4 | 6 | 19.8 | 8.3 | 41.92 | 60 |
| 42.6 | 3.2 | 18.9 | 10 | 52.91 | 55 |
| 35.5 | 4 | 11.7 | 8.6 | 73.50 | 48 |
| 41.6 | 4.1 | 14 | 9.9 | 70.71 | 47 |
| 13.3 | 4.8 | 8 | 3.4 | 42.50 | 6 |
| 22.2 | 9.81 | 14.8 | 6.5 | 43.92 | 3 |
| 19 | 17 | 17.5 | 1.4 | 8.00 | 2 |
| 13.6 | 4.6 | 4.6 | 2.8 | 60.87 | 13 |
| 19.8 | 5 | 11.4 | 5.9 | 51.75 | 9 |
| 25 | 1.63 | 7.6 | 7.4 | 97.37 | 22 |
| 21.3 | 4.07 | 10.4 | 8.1 | 77.88 | 2 |
| 64.4 | 9.6 | 30 | 30 | 100.00 | 2 |
| 4.3 | 2.77 | 3.5 | 1.1 | 31.43 | 2 |
| 13 | 2.3 | 7.2 | 4 | 55.56 | 12 |
Disclaimer/Publisher’s Note: The statements, opinions and data contained in all publications are solely those of the individual author(s) and contributor(s) and not of MDPI and/or the editor(s). MDPI and/or the editor(s) disclaim responsibility for any injury to people or property resulting from any ideas, methods, instructions or products referred to in the content. |
© 2023 by the authors. Licensee MDPI, Basel, Switzerland. This article is an open access article distributed under the terms and conditions of the Creative Commons Attribution (CC BY) license (https://creativecommons.org/licenses/by/4.0/).
Share and Cite
Ahmed, S.; Jesson, M.; Sharifi, S. Selection Frameworks for Potential Rainwater Harvesting Sites in Arid and Semi-Arid Regions: A Systematic Literature Review. Water 2023, 15, 2782. https://doi.org/10.3390/w15152782
Ahmed S, Jesson M, Sharifi S. Selection Frameworks for Potential Rainwater Harvesting Sites in Arid and Semi-Arid Regions: A Systematic Literature Review. Water. 2023; 15(15):2782. https://doi.org/10.3390/w15152782
Chicago/Turabian StyleAhmed, Safaa, Mike Jesson, and Soroosh Sharifi. 2023. "Selection Frameworks for Potential Rainwater Harvesting Sites in Arid and Semi-Arid Regions: A Systematic Literature Review" Water 15, no. 15: 2782. https://doi.org/10.3390/w15152782
APA StyleAhmed, S., Jesson, M., & Sharifi, S. (2023). Selection Frameworks for Potential Rainwater Harvesting Sites in Arid and Semi-Arid Regions: A Systematic Literature Review. Water, 15(15), 2782. https://doi.org/10.3390/w15152782