Article

Quantifying the Impact of Changes in Sinuosity on River Ecosystems

1
School of Water Conservancy and Hydroelectric Power, Hebei University of Engineering, Handan 056002, China
2
Hebei Key Laboratory of Smart Water Conservancy, Hebei University of Engineering, Handan 056002, China
3
China Institute of Water Resources and Hydropower Research, Beijing 100038, China
4
HeBei Water Conservancy Engineering Bureau Group Limited, Shijiazhuang 050021, China
*
Author to whom correspondence should be addressed.
Water 2023, 15(15), 2751; https://doi.org/10.3390/w15152751
Submission received: 13 June 2023 / Revised: 26 July 2023 / Accepted: 27 July 2023 / Published: 29 July 2023
(This article belongs to the Special Issue Impact of Environmental Factors on Aquatic Ecosystem)

Abstract

:
To quantitatively study the hydrodynamic changes in different river morphologies and clarify the impact of morphological changes on river ecosystems, this study examined a section of the Nansha River near Laoniuwan in the Haidian District, Beijing, and characterized different river morphologies by river sinuosity. The River 2D model was used for simulation and analysis, and the depth and velocity diversity indices were introduced to quantify the distribution of depth and velocity under different sinuosities. Cyprinus carpio was selected as the target fish in this study, and its suitability curve was determined using literature and field surveys. Combined with the simulation results, a weighted usable area curve was established to identify its inflection point and maximum value and determine the ecological flow in the river under different sinuosities, that is, to clarify the relationship between sinuosity and ecological flow. The results showed that the lower the sinuosity, the worse the depth and velocity diversity, but a greater sinuosity did not lead to better depth and velocity diversity. The depth and velocity diversity of a sinuosity of 1.5 were better than those of 1.89 in general, except for low flow conditions (Q = 5 m3/s). For rivers with water use restricted by nature and society and where ecological needs exist, ecological engineering that appropriately changes the planform of rivers can be considered to increase the diversity of river/channel geometry and provide a basis for the ecological restoration of rivers.

1. Introduction

Globally, more than two-thirds of rivers are substantially affected by human activity [1]. In recent years, several urban rivers have been channelized and linearized in the planning stages because of the convenience of land use and the safety of flood discharge; thus, their natural form and direction are often drastically changed [2]. For example, only approximately 2% of the rivers and lakes in the United States and Germany are in a natural state [3,4]. Between 1929 and 1942, the U.S. Army Corps of Engineers constructed 14 cut-offs in the Lower Mississippi River between Memphis, Tennessee, and Red River Landing, Louisiana. Engineered cut-offs, in combination with two natural cut-offs, resulted in a net shortening of the river by approximately 235 km [5]. In the mid-to-late 19th century, systematic river channelization engineering was applied in Europe and elsewhere, leading to notable changes in the landscape, from multi-to single-line channel configurations such as the Danube, Rhone, Rhine, Italian rivers, and braided rivers in the French Alps [6]. River channelization in China began in the 1940s, but its rapid development was concentrated from the late 1950s to the mid-1970s. From 1958 to 1962, channelization or segmented channelization projects were conducted nationwide with a total length of approximately 1500 km [7].
Narrowing of the river channel and hardening of its banks accelerate the flow of river water, reducing the ratio of infiltration and interception of runoff during rainfall, increasing the peak volume, advancing it, and reducing the river water quality accordingly [8]. These canalized rivers often have regular and geometric cross sections owing to land occupation and engineering volumes. However, the channelization of curved rivers has not yet been fully demonstrated [9]. When the curved shape of a river changes in its natural state, it also changes its hydrological and hydraulic characteristics [9]. In addition to changes in river scouring and siltation, which have an impact on flood safety, it also leads to the disappearance of geomorphological diversity within the river; that is, it results in changes in the patterns of mainstreams, tributaries, shoals, and jets in natural rivers [10].
In the 1980s, countries such as Germany and Switzerland proposed the concept of “re-naturalization” to restore rivers to a state close to that of nature [11,12]. The United Kingdom has adopted near-natural river management techniques that emphasize the need to give priority to the ecological functions of rivers when restoring and maintaining them [13]. The Netherlands has emphasized the combination of ecological restoration of rivers and flood control and has put forward the concept of “giving space to the river” [14]. Guaranteeing ecological flows is one of the most important initiatives for restoring the naturalization of rivers [9]. With the increasing destruction of ecological and environmental resources, the ecological flow of rivers has received increasing attention. In recent years, research related to the ecological flow of rivers has developed rapidly and has become a major global concern in the 20th century [15,16,17]. Ecological flow is the amount of water, time, and water quality required to maintain the natural ecosystem of rivers and estuaries and to sustain the ecosystem on which human survival and development depend. The scientific determination of ecological flow is essential for high-quality regional ecological development [18].
After years of research and development, ecological flow calculation methods have been divided into four major categories: hydrological, hydraulic, habitat, and integrated. Both hydraulic and habitat methods determine the ecological flow in a study area by analyzing the relationship between the flow and the type and quantity of habitat provided by the water flowing through a river [19]. Changes in river morphology inevitably cause changes in the diversity of water depths and velocities in a river, affecting the type and quantity of habitats available to certain organisms and causing a considerable change in the ecological flow that maintains that section of the river [9,20,21].
To address the above problems, this study selected a river section near Laoniuwan in the Nansha River Basin of the Haidian District, Beijing, China, as the research object. Based on local historical and field research data, the River 2D model was used to simulate and analyze the results of the simulation, introduce a weighted usable area (WUA) diversity index, and quantitatively analyze the influence of changes in river morphology on WUA diversity. Using Cyprinus carpio as the target species, we statistically analyzed the changes in the WUA under different sinuosities and summarized the relationship between sinuosity and ecological flow to provide a basis for the ecological restoration of a river.

2. Materials and Methods

2.1. Study Area and Indicators

Haidian District is located in Northwest Beijing at the junction of the North China Plain and Taihang Mountains remnants (of a mountain range). The total area of Haidian District is 430.73 km2, lying between latitudes 39°53′–40°09′ north and longitudes 116°03′–116°23′ east.
The Nansha River is located in the northwestern part of Haidian District, in a floodplain behind mountains. The total length of the main channel and the river basin is approximately 30.6 km and 263 km2, respectively (Figure 1). The basin belongs to the warm belt of semi-humid monsoon continental climate, with average precipitation and surface evaporation for many years of up to 619 and 1883 mm, respectively. The river depth, upper mouth width, and bottom of the river longitudinal slope of the basin are approximately 4.0–5.0 m, 80.0–130.0 m, and 1–2.6‰, respectively, belonging to the Wenyu river system. A U-shaped bend is present on the west side of the Beijing–Bao Expressway near Laoniuwan, with a small turning radius and poor flow conditions, which are not conducive to flooding and regional drainage safety. The original Nansha River was scheduled to be straightened in the local comprehensive improvement plan of 2008; however, this plan has not yet been implemented. Moreover, there has always been controversy over whether the reach should remain in its current state or transform into a straight state. In recent years, as the concept of river management has advanced, the importance of maintaining the river’s existing form in terms of flood control and ecology has been recognized. However, there has been no quantitative comparison of the impact on river ecology between the two maintenance cases of the existing planar meander form and its planned straightening. In this context, discussions and analyses in this area have practical importance for the development of locally related work.
Fish are the top predators in river ecosystems, play an important role in the energy flow and material cycle of the entire ecosystem, and are important indicators of regional water conservation and environmental safety [22]. Based on the principles of representation, accessibility, and feasibility, a species with rich historical research data and a definitive research foundation that fully reflects the changes in habitat, that is, the changes in habitat suitability caused by changes in different planar forms, was selected. In addition, C. carpio is the dominant species in this area owing to its large population. Based on these factors, C. carpio was selected as the indicator species through a combination of field research and data mining.
Fish are the top predators in river ecosystems and play an important role in the energy flow and material cycle of the whole ecosystem, as well as being an important indicator of regional water conservation and environmental safety [22]. Based on the principles of representation, accessibility, and feasibility, species with rich historical research data and a definitive research foundation were selected, fully reflecting the changes in habitat—that is, the changes in habitat suitability caused by changes in different planar forms. In addition, Cyprinus carpio is the dominant species in this area, with a large number. Based on the above factors, Cyprinus carpio was selected as the indicator species through a combination of field research and data mining.

2.2. Hydraulic Model and WUA

In this paper, the ecological flow was determined using a habitat simulation method based on the principle of the in-channel flow increase method (IFIM)—which is the earliest and most widely used method in habitat simulation [23]—to establish the relationship between the quantity and quality of a suitable fish habitat and flow through a hydraulic ecological model, evaluate the impact of flow changes on the fish habitat, and adjust the flow to improve the ecological environment. The model used was River 2D, which is an unsteady two-dimensional depth-averaged finite element hydrodynamic model written by Professor Peter Steffler of the University of Alberta [24]. Its hydrodynamic simulation is based on a two-dimensional Saint-Venant set of equations consisting of mass conservation and momentum conservation equations in the x- and y-directions [25,26].
The weighted usable area of the selected target species is abbreviated as WUA:
W U A = i = 1 n C S F ( V i , C i , D i ) × A i
In Equation (1), WUA represents the WUA of the selected study reach. C S F ( V i , D i , C i ) is the overall suitability value of each cell. Among them, i represents the number of cells; V, C, and D represent the flow velocity, bed substrate, and depth suitability index, respectively; and Ai represents the area of each cell level. After the field survey, the substrate in the study section is known to be more uniform, so its suitability index can be considered to be 1.

2.3. Data Processing

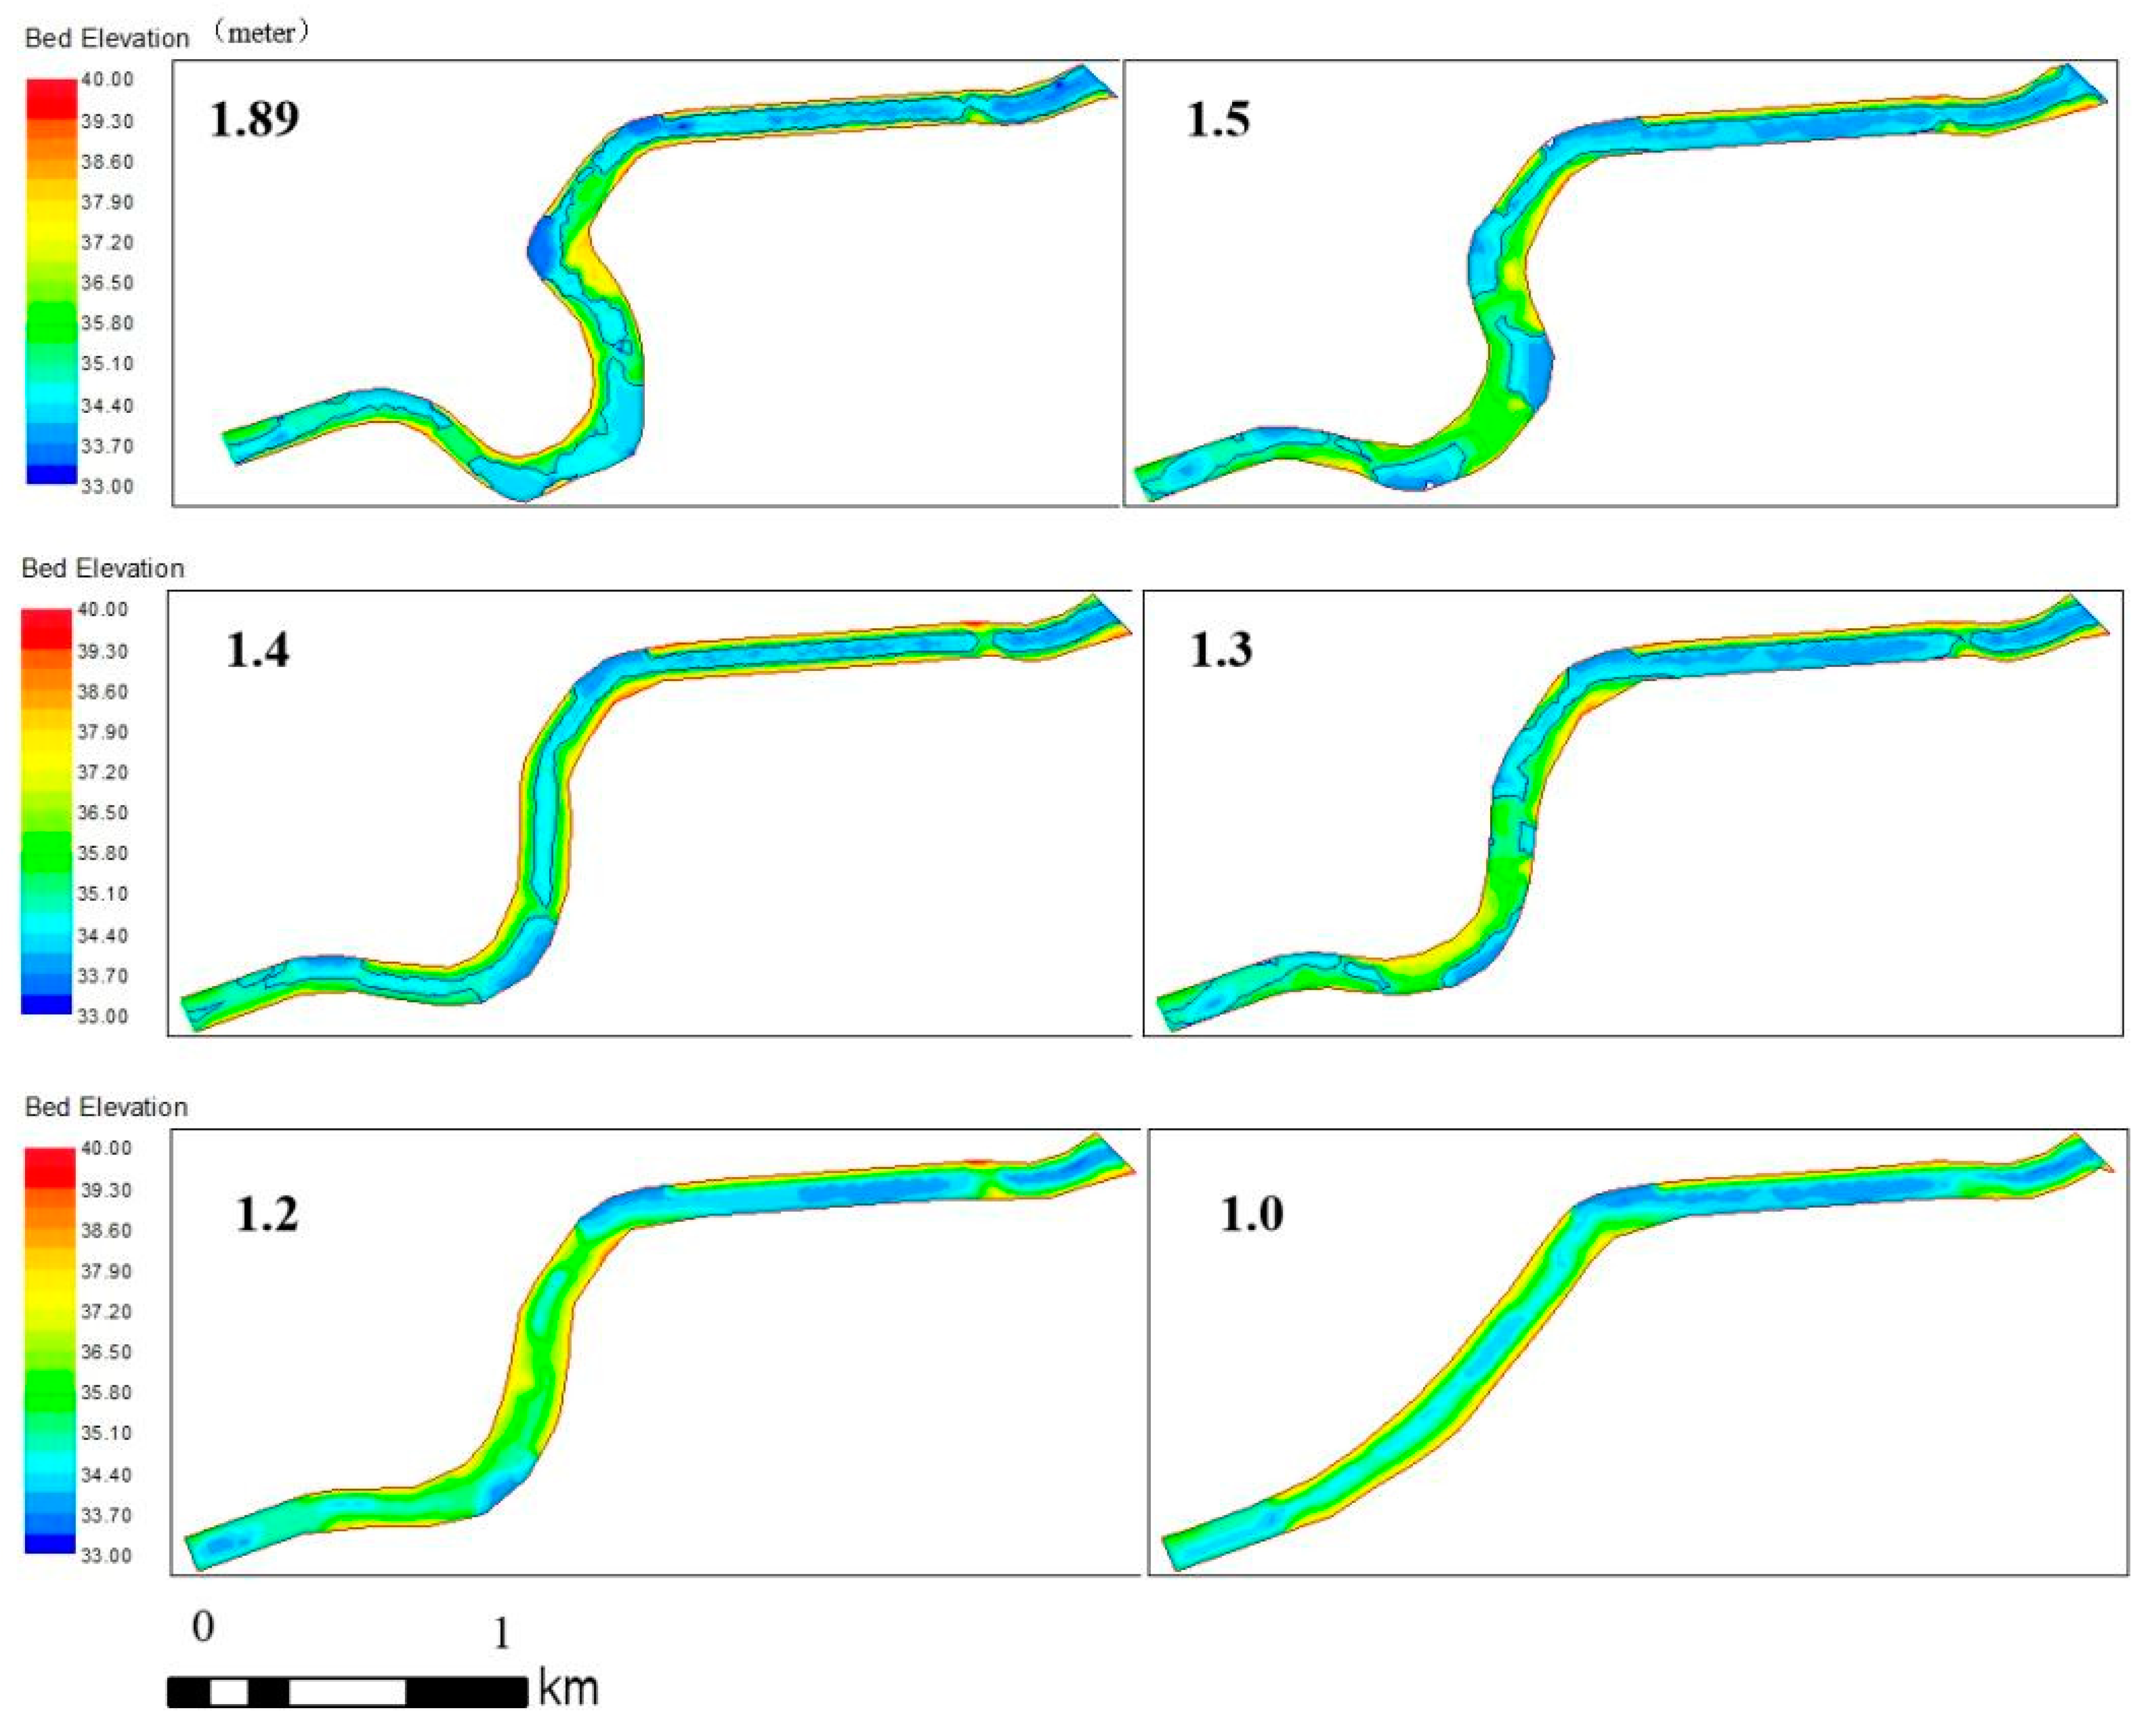
Sinuosity is defined as the ratio of the length of the curved arc along the river channel between the two endpoints of a river segment to the length of a straight line between the two endpoints [27]. According to the river classification and the actual situation of the studied river section, based on the current elevation data of the Nansha River, six planar meander forms were constructed using the replication and interpolation methods as follows.
First, based on the actual situation and the reasons for the selection of the above-mentioned study river section, the range of sinuosities was determined to be 1.0 (planning) to 1.89 (current situation).
Second, based on the current situation, we identified and analyzed the elevation data of the meander section; the elevation data of the river section without the sinuosity changing was guaranteed to be consistent, and the data of the changed river section was replicated based on the location correspondence.
Thirdly, when the sinuosity changed, the length of the river section would change. Based on the replication method, the River 2D model was used to perform model interpolation during data preprocessing. Finally, the six determined planar meander morphology maps are shown below in Figure 2.

2.4. Determination of the Suitability Curve

A key factor that determines the accuracy of habitat simulation results is the habitat suitability index (HSI), which is used to quantitatively describe the suitability of a species to a habitat, with values ranging from 0 to 1, with 0 being completely unsuitable and 1 being completely suitable; the larger the value, the better the suitability [28].
Currently, there is a lack of information on the suitability of the hydraulic characteristics for fish distributed in the Nansha River. In this study, we refer to the existing literature [29] and actual local information to obtain a preliminary suitable flow and water depth for the target fish and derive the suitability curve for C. carpio. The substrate size and water quality in the study area were homogeneous and were ignored during this estimation. The suitable and optimal flow velocities for C. carpio were 0.1–1.1 m/s and 0.2–0.6 m/s, respectively. The suitable water depths for C. carpio were 0.2–2.5 m, and the optimum water depths were 1.0–1.5 m (Figure 3).

2.5. Model Building and Validation

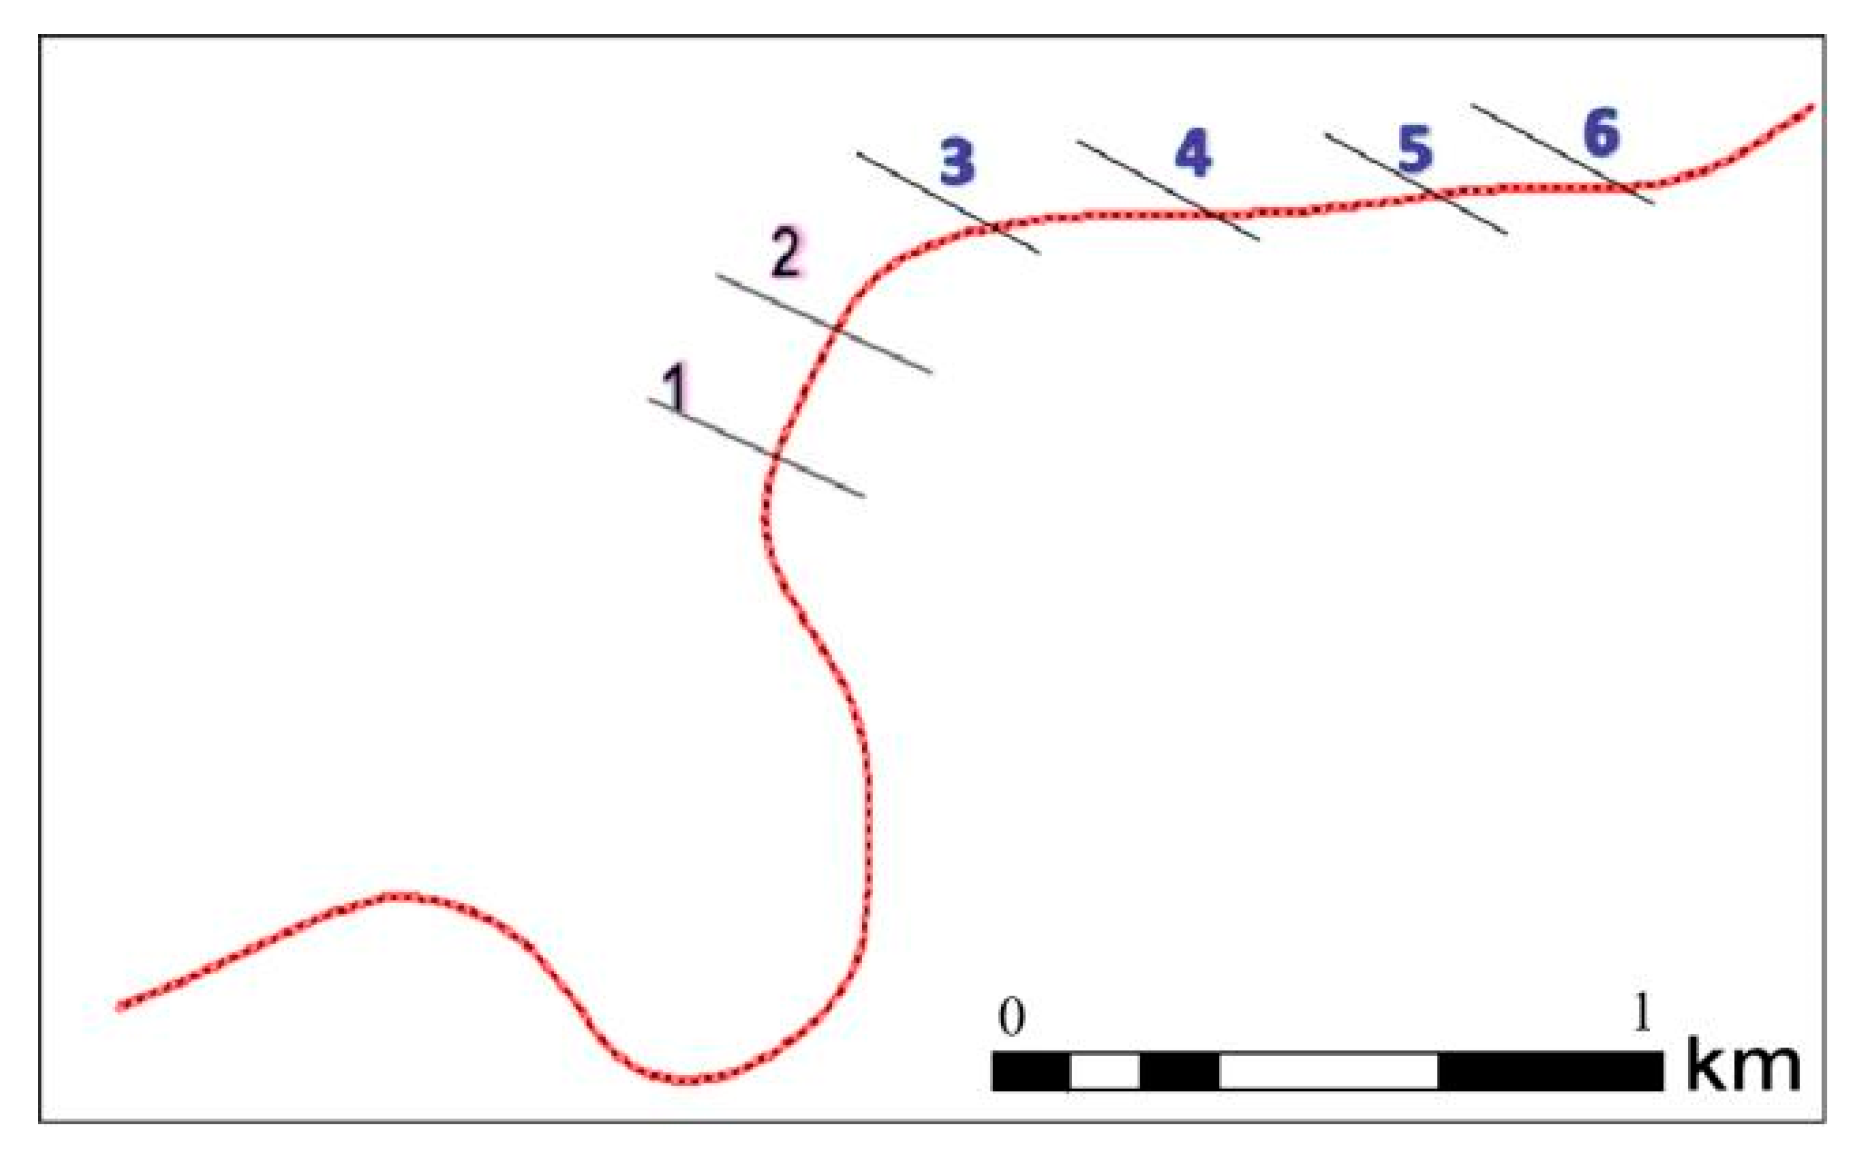
Based on the local hydrological data, six flow conditions were simulated—5, 10, 15, 20, 25, and 30 m3/s—and the roughness was taken as 0.035. River sections 1–6 were selected (see Figure 4). Comparing the simulated water level of the model—with an initial flow of 520 m3/s—to the design water level of the “Haidian District Nansha River (Shangzhuang gate district boundary) Desilting Control Project” (the planning report of which has been approved and is being implemented) in 2016, it can be seen that the simulated value of the water level of the constructed model matched well with the design water level value of the desilting control project being implemented. The relative error was small (see Table 1), and the model established in this study exhibited good simulation ability for the hydrodynamic conditions of the Nansha River, where the spacing between 1 and 6 in each section is 300 m.

2.6. Depth and Velocity Diversity Index

Diversity indices originated from the quantitative characterization of species diversity, Fisher proposed the concept of the species diversity index in 1943 [30]. Later, it was developed and gradually applied in the fields of environmental science, physical geography, and basic agricultural science—Fatch Paul et al. [31] proposed the overall agricultural diversity index for measuring agricultural diversity. Li Changchao et al. proposed a comprehensive index of microplastic diversity by clarifying the differences between microplastics in different environments and analyzing them retrospectively [32]. Currently, the indices for quantifying depth and velocity diversity are not yet clear. Combining the generalization and application of diversity indices from previous authors, this paper constructs a depth and velocity diversity index based on Shannon’s index to better characterize depth and velocity diversity quantitatively.
The Shannon (H) diversity index can be used to reflect the degree of depth and velocity heterogeneity [33]. The higher its value, the better the degree of depth and velocity flow heterogeneity, and the more stable the survival of organisms in the region.
H = - i = 1 m ( P i ) × log 2 ( P i )
In Equation (2), H denotes the diversity index; m denotes the number of different types of areas; and Pi denotes the proportion of the study area occupied by the ith type.
In order to consider the heterogeneous results of the combination of water depth and velocity, this paper introduces the depth and velocity diversity index based on the above analysis, referring to the research of related experts and scholars. We use He to express it, which is calculated as follows:
H e = i = 1 m ( P i ) × log 2 ( P i ) j = 1 n ( P j ) × log 2 ( P j )
In Equation (3), He represents the depth and velocity diversity index; m represents the number of different depth regions, n is the number of different velocity regions; Pi is the proportion of the study area occupied by the ith depth interval, and Pj is the proportion of the study area occupied by the jth velocity interval.

3. Results

3.1. Analysis of Water Depth and Flow Velocity Diversity at Each Sinuosity

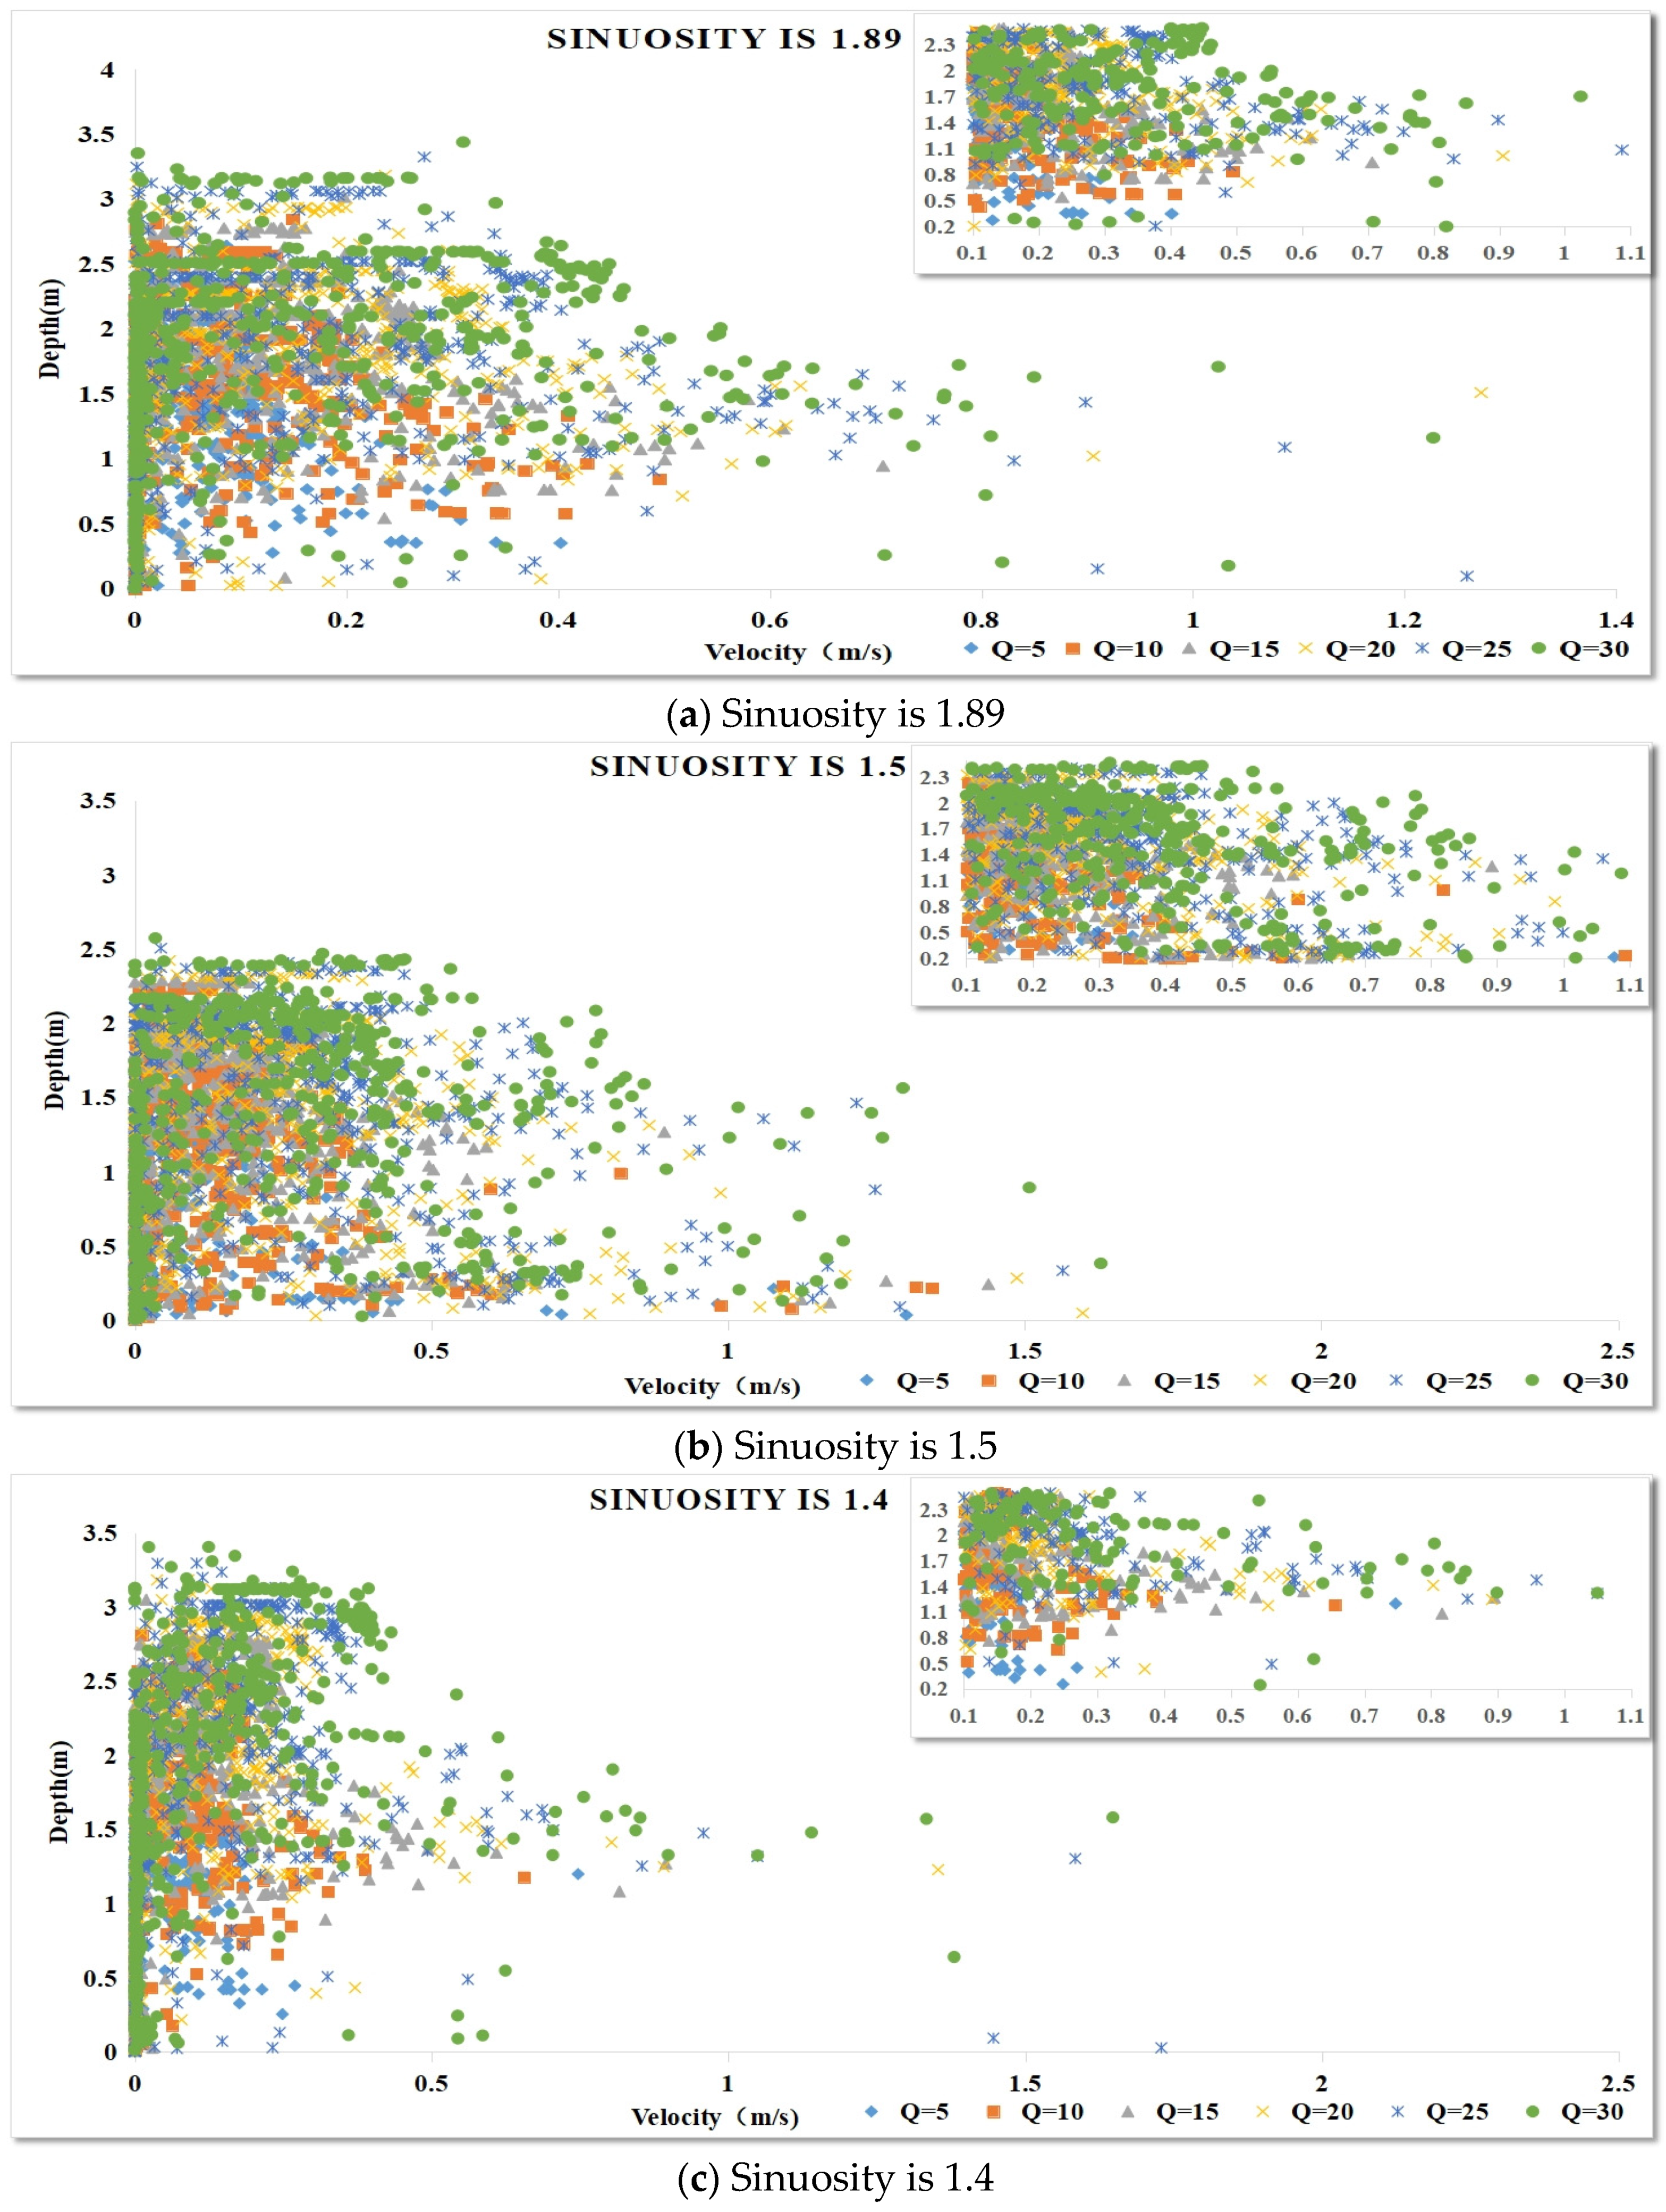
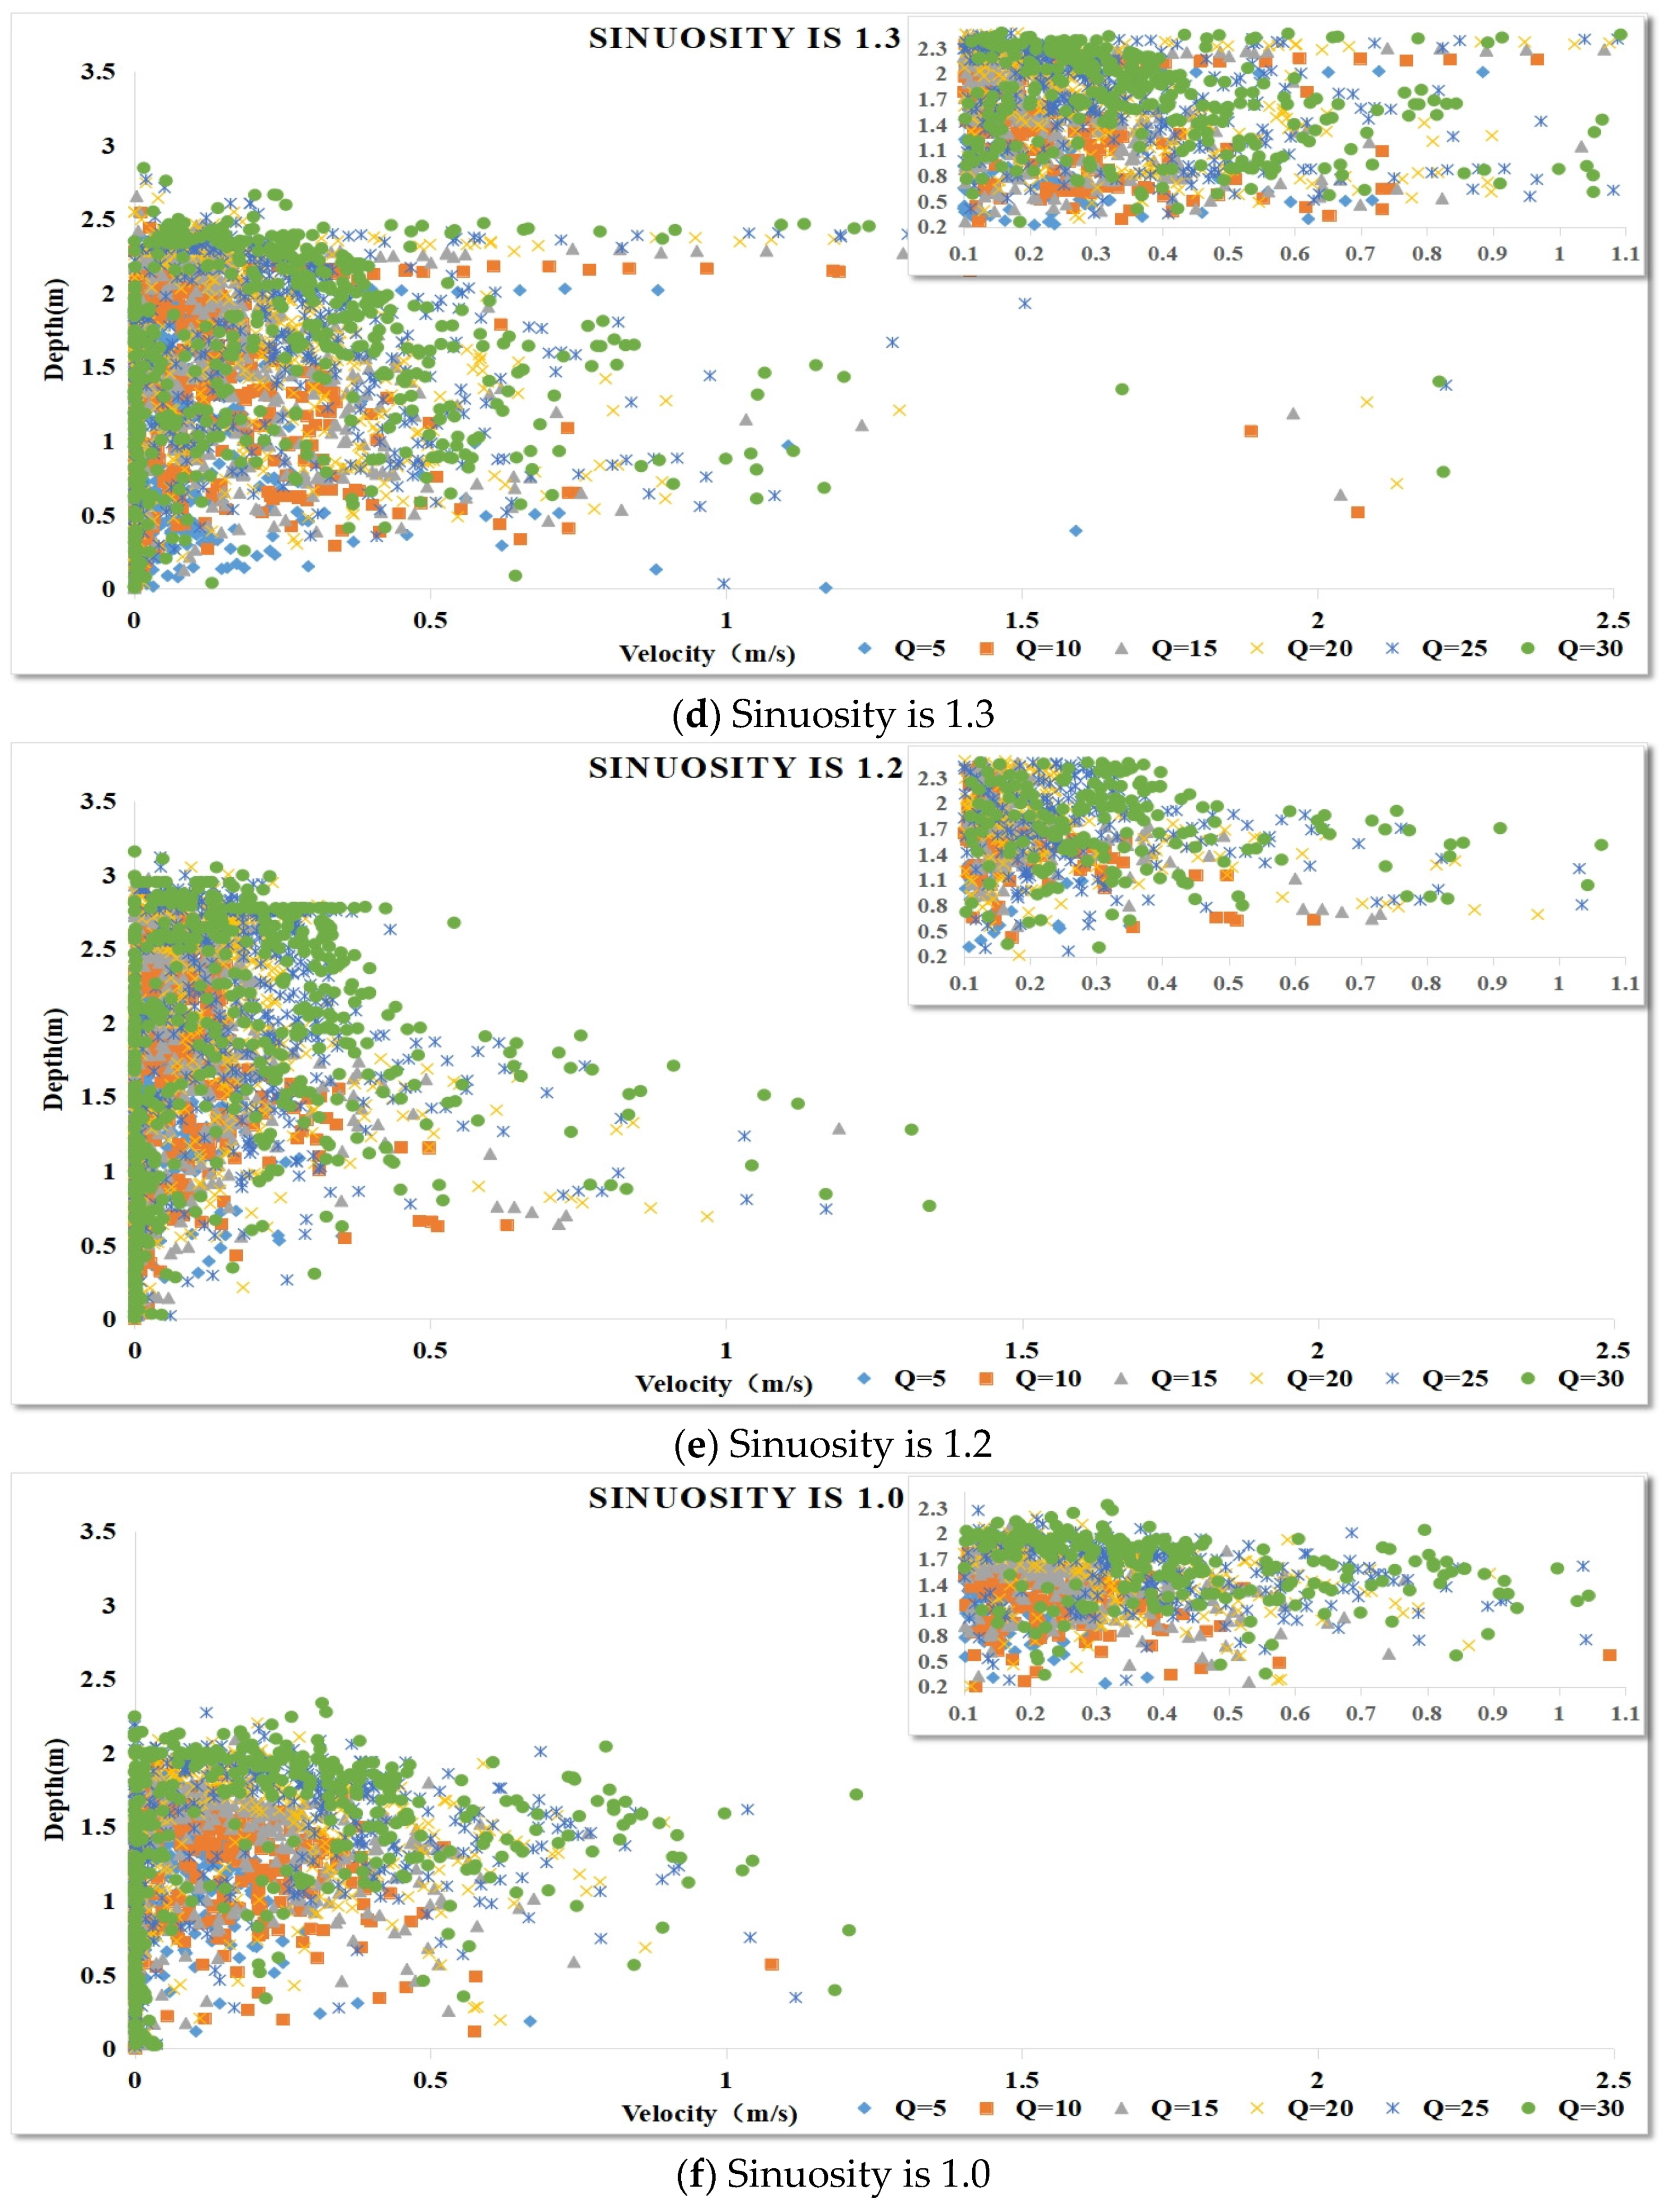
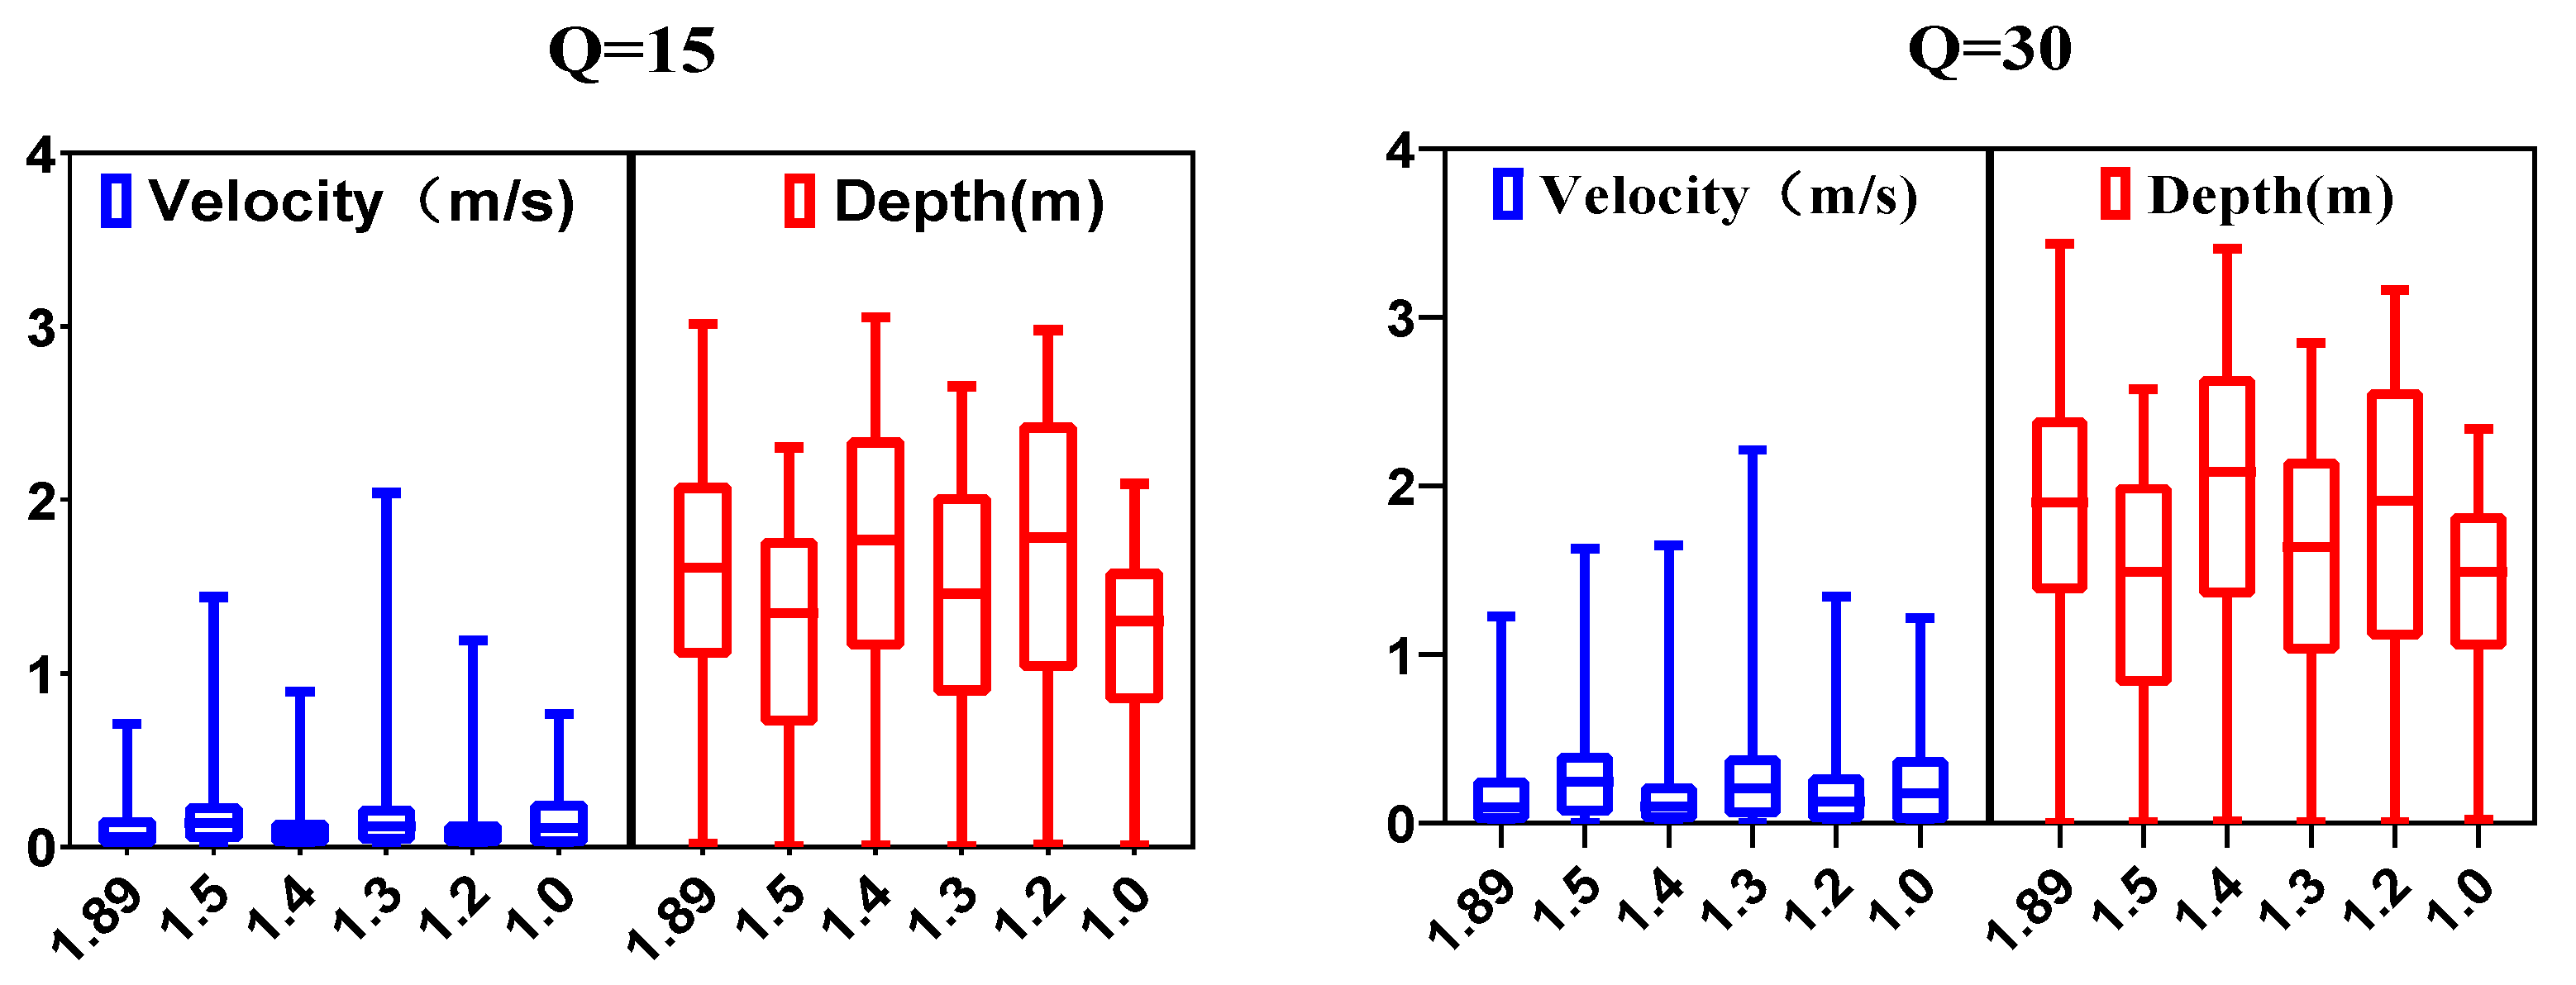
The simulation results were processed and analyzed, and the water depth and velocity distribution of each sinuosity at different flows were calculated. The water depth and flow velocity scatter distribution maps and box plots are shown in Figure 5 and Figure 6. Notably, most scatter points fall in an area with a water depth of 0.5–2.5 m and a flow velocity of 0–0.5 m/s. The studied river section was suitable for the survival of the target fish. Under the same sinuosity, the scattering points showed a more dispersed trend with increasing flow, and the maximum depth and velocity diversity values gradually increased. That is, depth and velocity diversity exhibited better trends, and the distribution of depth and velocity was more dispersed for sinuosities 1.3, 1.5, and 1.89. Under the same flow, as the sinuosity increased, the water depth exhibited a steady upward trend, and the flow velocity initially increased before falling.
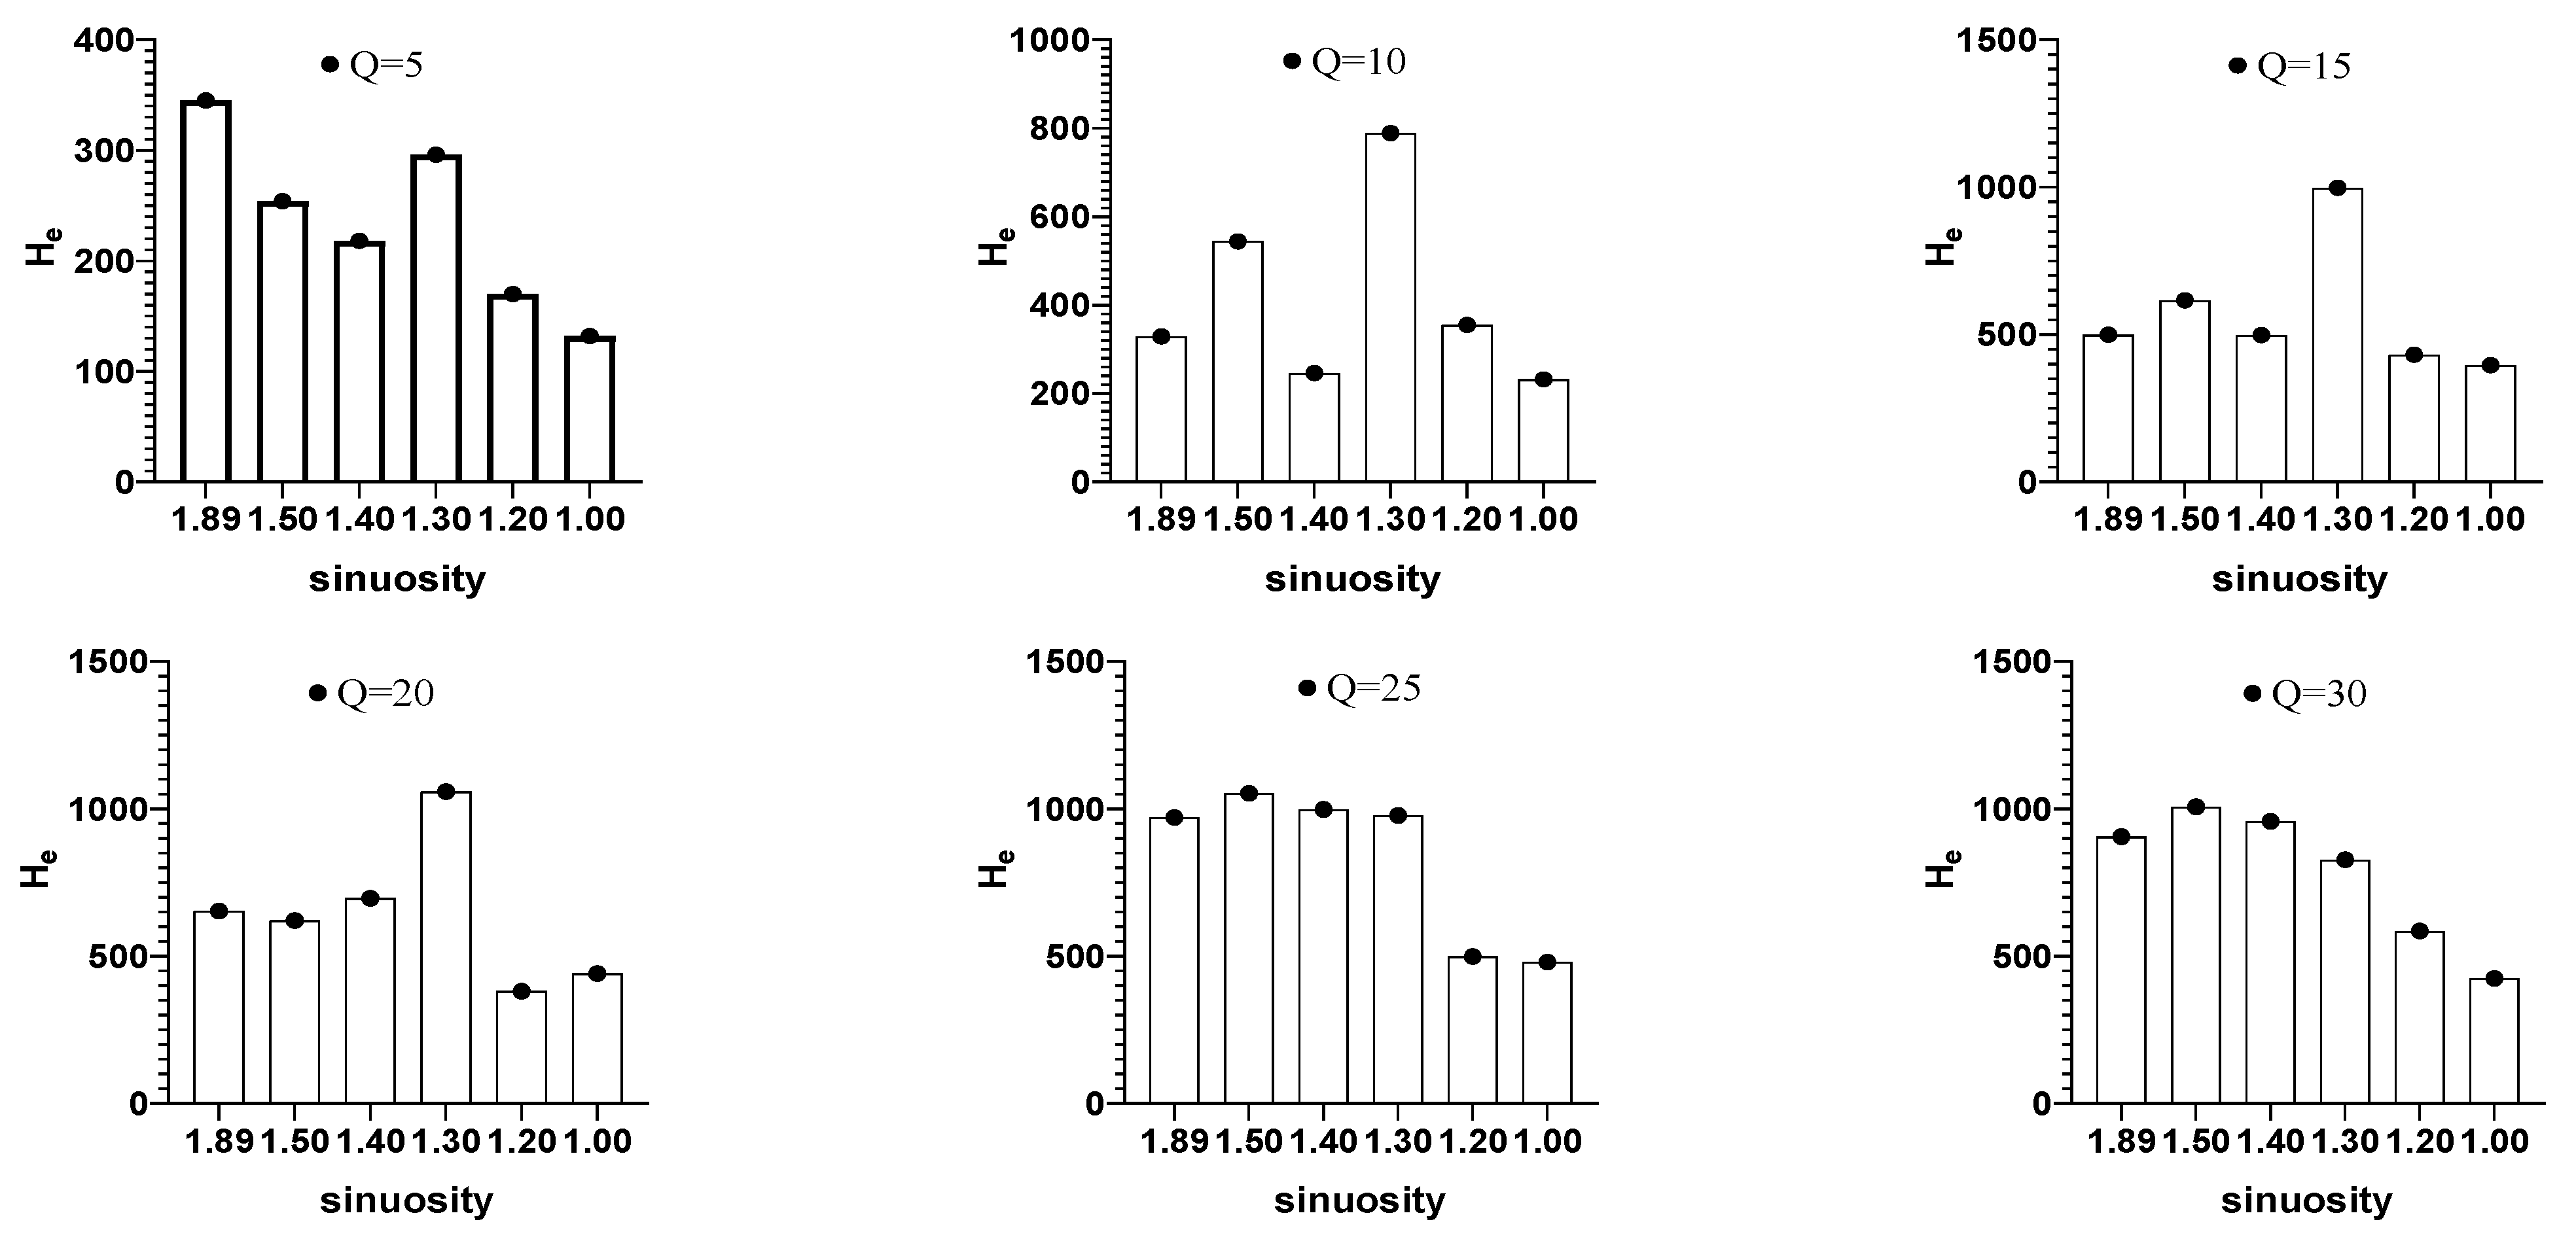
To quantify the relationship between sinuosity and diversity of water depth and velocity, the velocity was divided into nine intervals, 0–0.1, 0.1–0.2, 0.2–0.4, 0.4–0.6, 0.6–0.8, 0.8–1.0, 1.0–1.2, 1.2–1.5, and 1.5 m/s or more, based on the actual conditions of the studied river and the suitable survival threshold of the target fish. The water depth was divided into six intervals: 0.5–1.0, 1.0–1.5, 1.5–2.0, 2.0–2.5, 2.5–3.0, and 3.0 m or more. Based on the simulation results, the percentage of each interval in the water area of the river section was derived and used as the Pij quantity to calculate the water depth flow diversity index and quantitatively describe the relationship between sinuosity, depth, and velocity diversity under different flows (Figure 7 and Table 2).
The overall trends in depth and velocity diversity increased with increasing sinuosity. This does not necessarily imply that greater sinuosity results in better depth and velocity diversity. For the index calculation results, the maximum value of the index was 1059 for the river form with a sinuosity of 1.3. However, lower sinuosity resulted in worse depth and velocity diversity. The sinuosities of 1.2 and 1.01 exhibited a substantially lower depth and velocity diversity index than the other forms under all flow conditions (Figure 8).
With increasing flow, most plane forms with different sinuosities showed an increasing trend, but this did not imply that greater flow resulted in better depth and velocity diversity. Furthermore, the maximum value of the index of sinuosity of 1.89–1.0 is obtained in the following order: Q = 25, 25, 25, 20, 30, and 25 m3/s. In the case of a low flow of Q = 5 m3/s, the greater the sinuosity, the better the depth and velocity diversity within a certain range (Figure 9).

3.2. Sinuosity and Ecological Flow

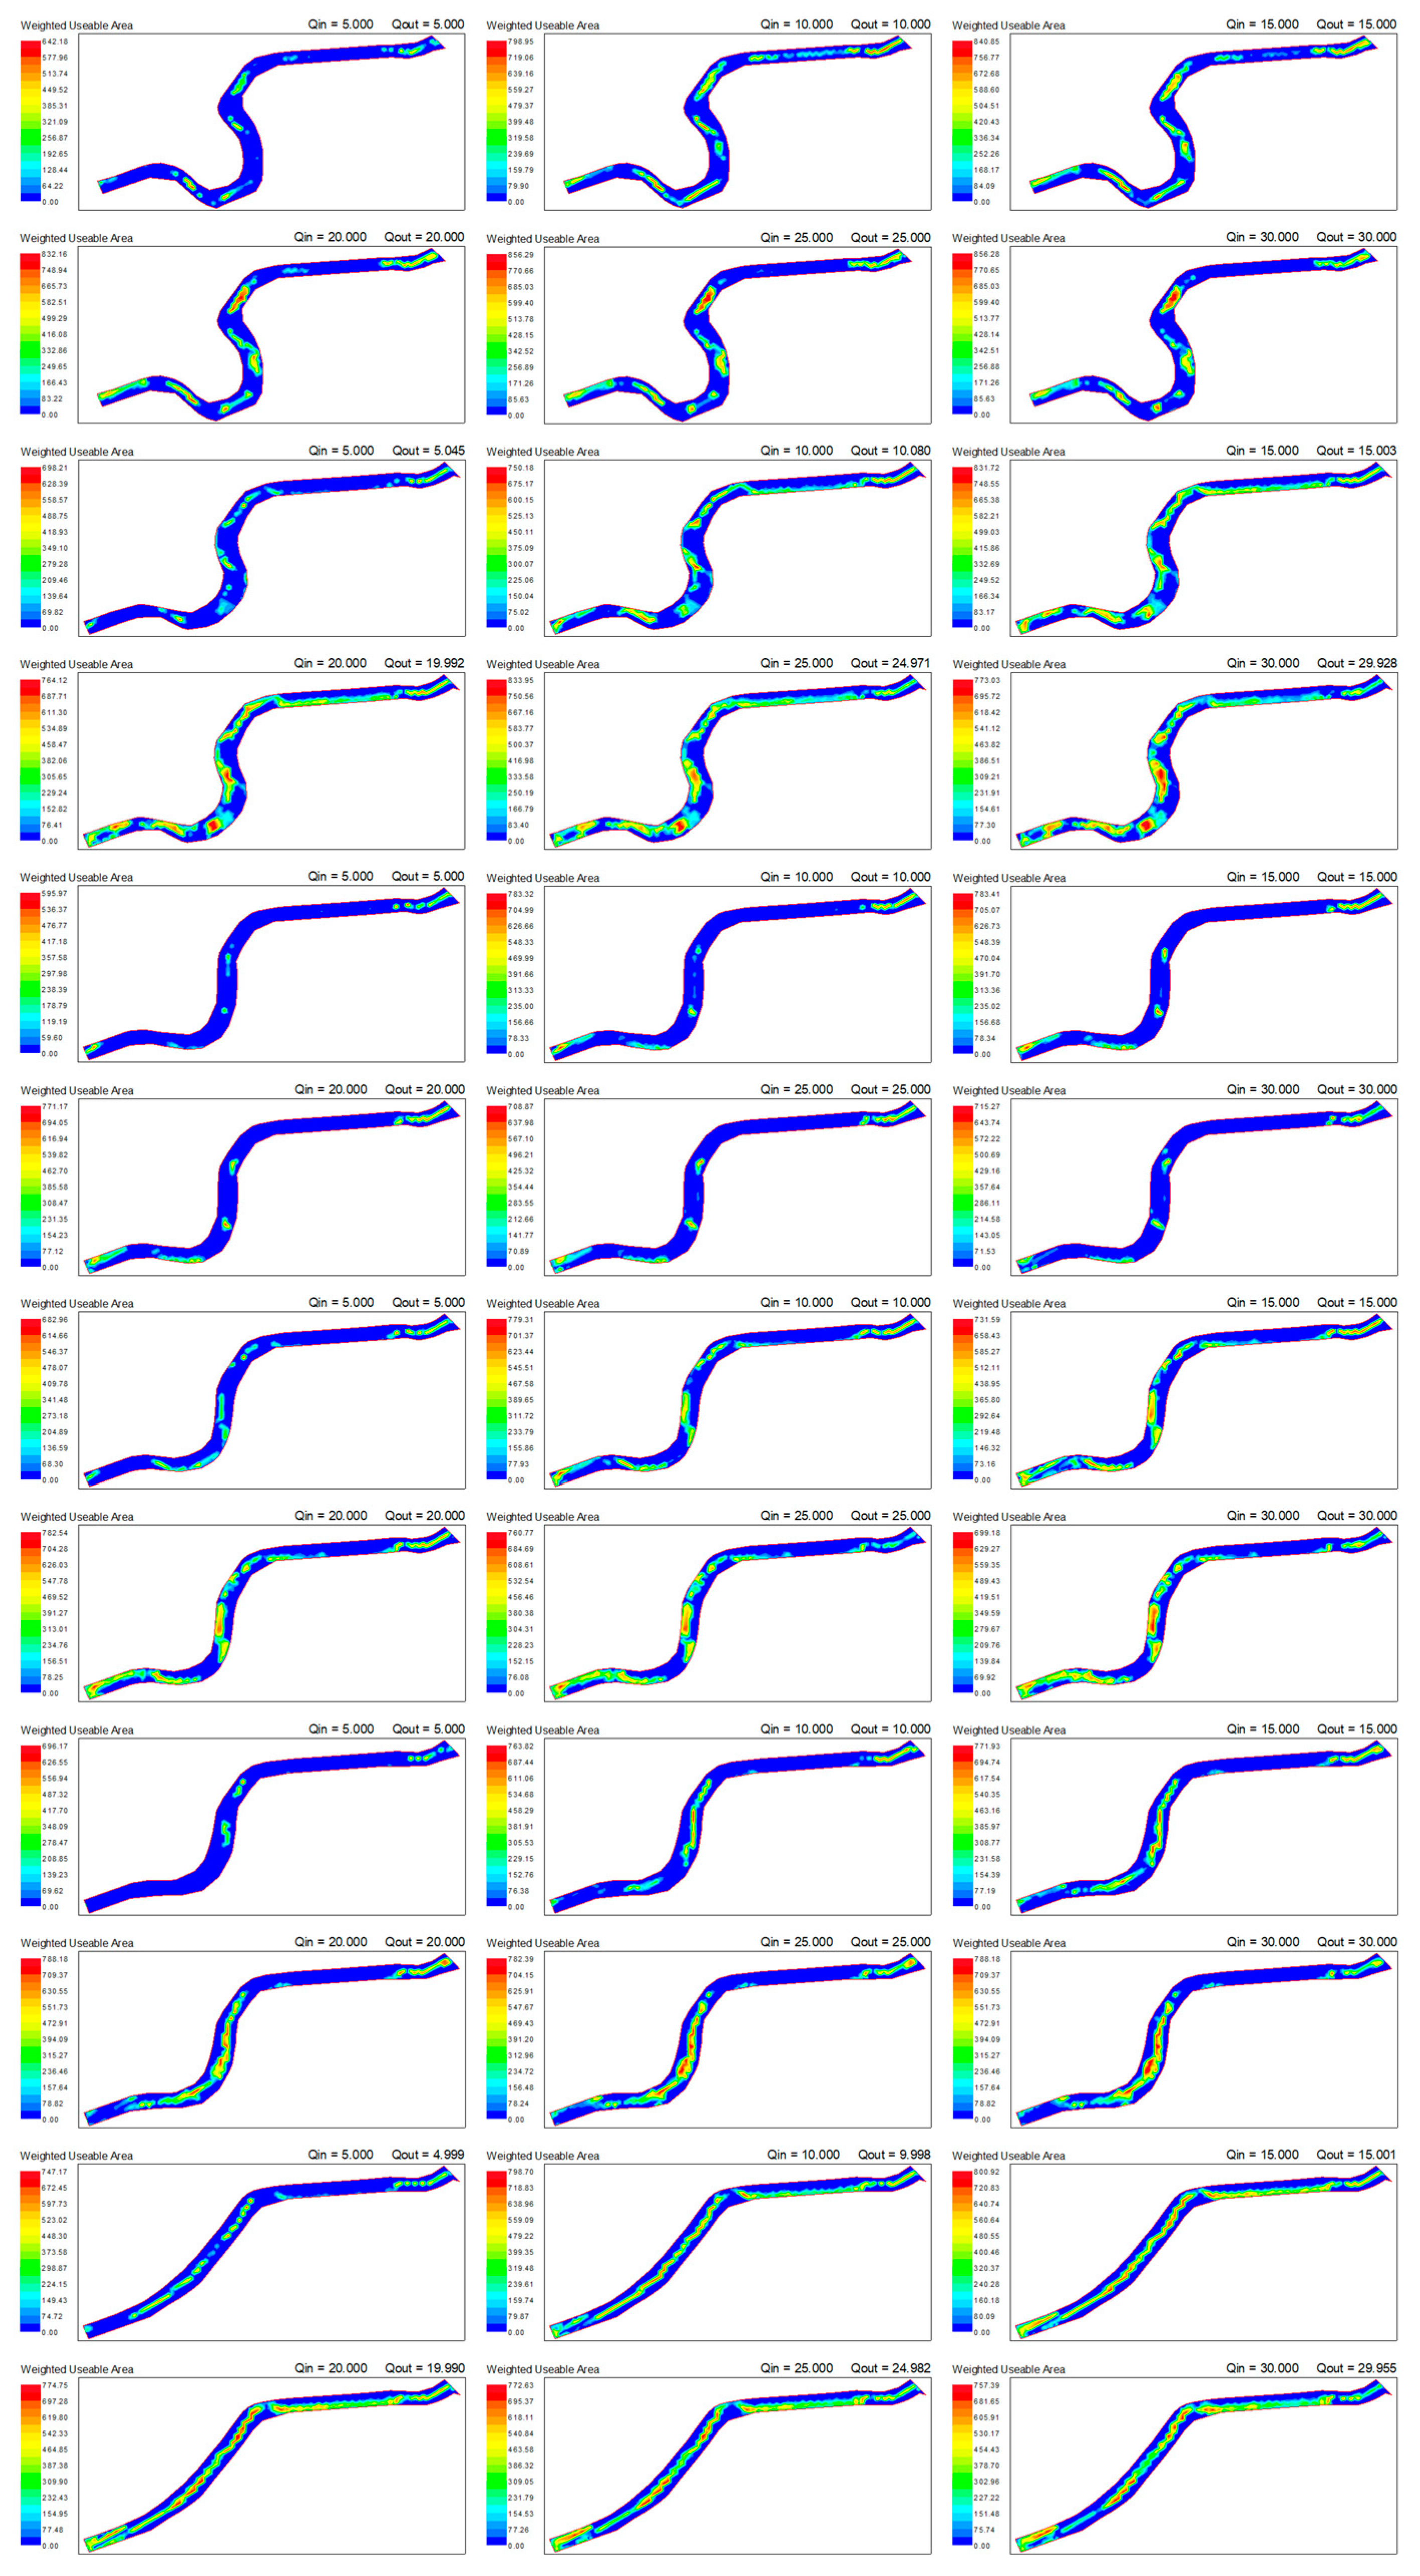
Based on the suitability curve of C. carpio, the WUA distribution of the species at six sinuosities under different flow conditions was determined by simulation analysis (Figure 10). With an increasing flow rate, the WUA exhibited an overall increasing trend. At the same flow, river sections with greater sinuosity were relatively better; these more suitable areas were mostly at river bends, and the areas more suitable for C. carpio in the straight section were substantially smaller. The WUA distribution was organized, and the Q-WUA relationship curves were plotted.
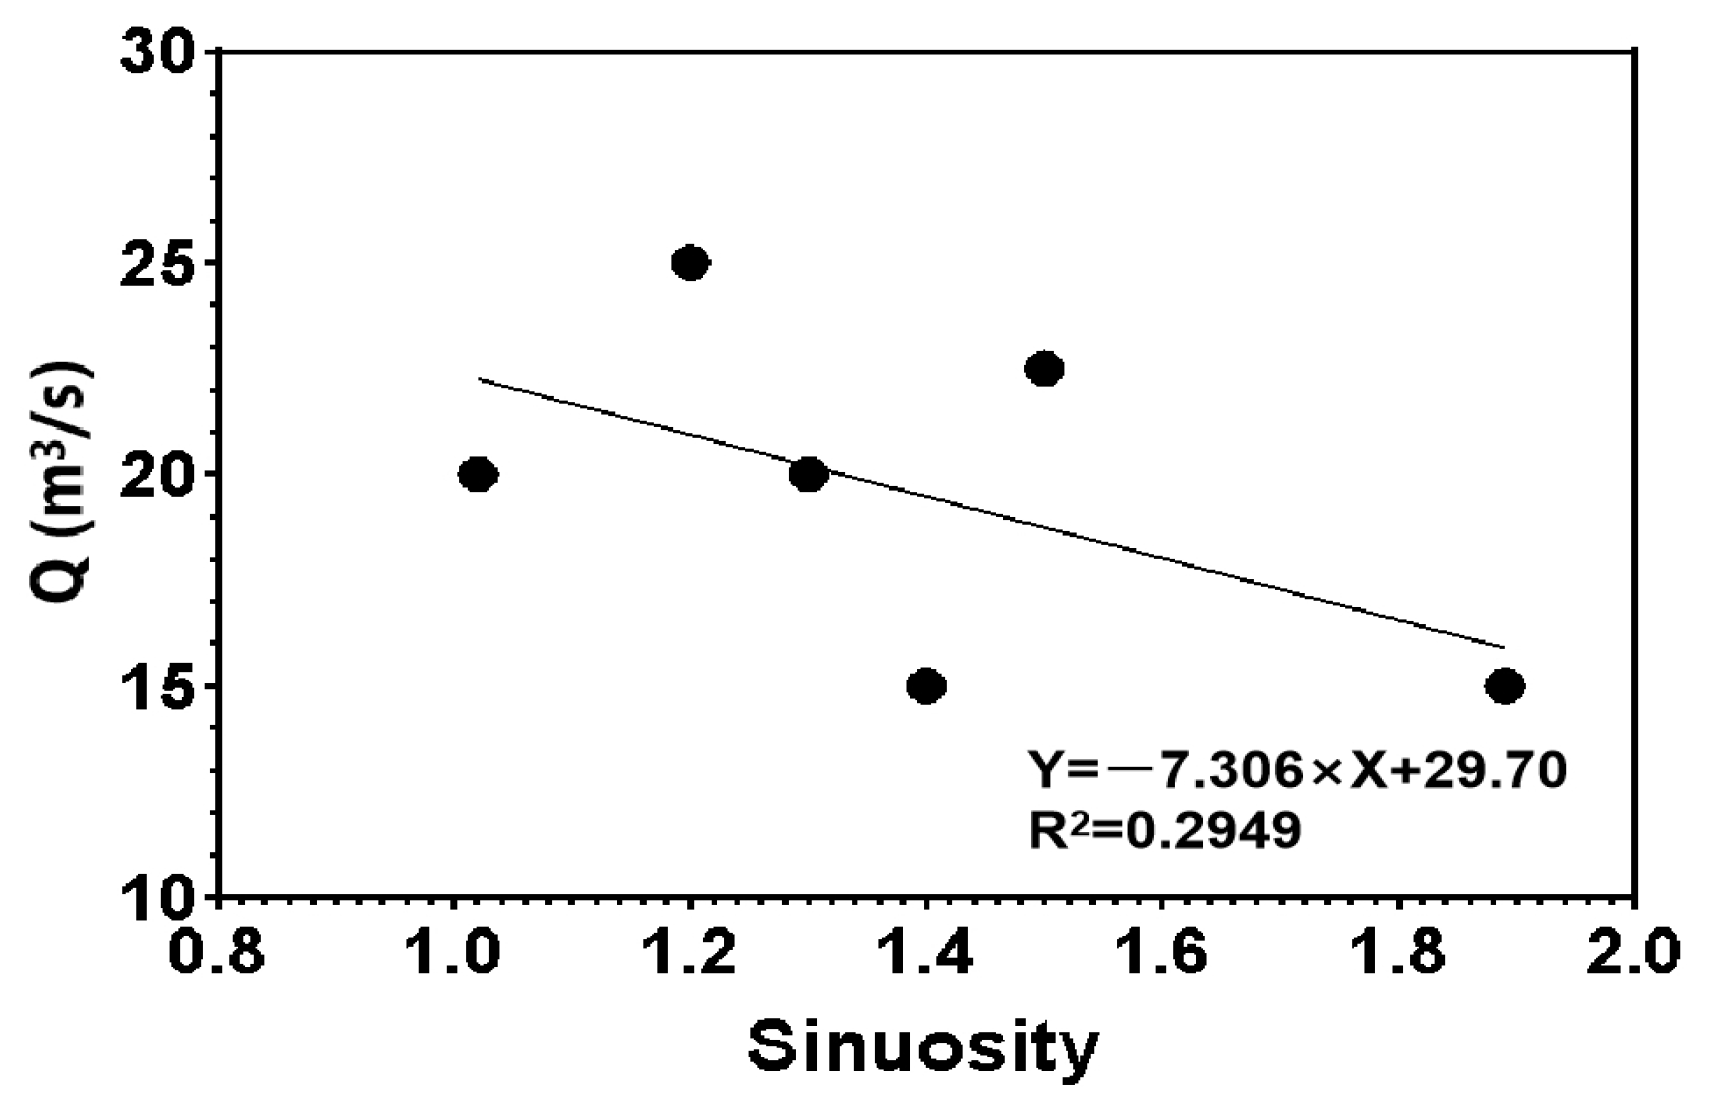
As seen from the curves, a peak sinuosity of 1.5 was the largest, and that of 1.4 was the smallest. Under low flow, the suitable survival area of the river section with high sinuosity was substantially better than that of the river section with low sinuosity. At higher flows, the meanders were also better; however, there were more suitable areas for smaller meanders. Combined with the habitat simulation method, the highest point of the curve was the ecological flow of the river, and we could identify the ecological flow of meanders from 1.0–1.89 as being 20, 25, 20, 15, 22.5, and 15 m3/s. When determining the ecological flow of meanders at a sinuosity of 1.5, the flows of 20 and 25 m3/s did not exhibit monotonic increasing or decreasing trends. Thus, using a trial calculation of 22.5 m3/s WUA, we found that the WUA corresponding to Q = 22.5 was the maximum value on the curve.
With increasing sinuosity, the overall ecological flow required by the target fish in the studied river section exhibited a decreasing trend, and sinuosity and ecological flow exhibited a negative correlation (Figure 11). Meanders with high sinuosity have a greater diversity of water depths and velocities, more geomorphological unit variety, and a strong regulation ability, which makes the rivers more suitable for the survival and reproduction of fish at lower flows. The smallest ecological flow of 15 m3/s was required with sinuosities of 1.89 and 1.4. Comparing the WUA under the two morphologies, 1.89 was much larger than that of 1.4. In this study, considering the relationship between the social economy and ecology, a sinuosity of 1.89 was considered the appropriate morphology.

4. Discussion

4.1. Quantification of River Depth and Velocity Diversity

Many experts and scholars have conducted studies on the depth and velocity diversity. Scholars have introduced the habitat depth and velocity diversity index to quantitatively analyze the effects of artificial step-deep pool systems on aquatic habitats and river ecology [34]. Stähly et al. quantified the spatial variation in aquatic habitats in river segments using the hydroform diversity index [35]. The establishment of related indices allows a more intuitive quantitative study of the relationship between geomorphology, hydrology, and river ecosystems, and the use of hydrodynamic models to quantitatively simulate and analyze the spatial distribution and trend changes in water depth and flow velocity can provide technical support for the layout of river ecological restoration measures and the assessment of restoration effects [36,37,38].

4.2. Habitat Modeling Methodology and Ecological Flows

The habitat simulation method is used to determine the ecological water demand of rivers according to the physical habitat conditions required by the indicator species through field monitoring or water environment modeling to obtain the spatial and temporal distribution of habitat factors and habitat suitability evaluation indexes. Simulation of the quantitative relationship between the flow and distribution of suitable habitats is performed to obtain the ecological flow of aquatic organisms for the protection of the indicator species, mostly fish, and to provide a basis for the rational development and utilization of water resources [39,40,41]. Habitat simulation methods more adequately consider a single or multiple species, such as this study, which considers the dominant species in the study area, C. carpio, which reflects specific ecological needs, although the entire river ecosystem is ignored. Our results show that, as the flow changed, the inflection point of the Q-He curve did not coincide with the maximum value and Q-WUA curve, which initially showed the limitations of the ecological flow calculated by habitat simulation methods alone. In general, the better the diversity of the habitat, the better the biodiversity and the healthier the river ecosystem [42,43]. Further research is needed to determine if the flow required to maintain the stability of the entire river ecosystem should be considered.

4.3. Relationships between Changes in Sinuosity, River Ecology, and Socioeconomics

Changes in river morphology affect not only the physical form and dynamic river processes of individual reaches but also longer reaches and even entire river systems, including some tributaries [44]. Human intervention in river environments always needs to consider the unintended side effects and potential long-term legacies that may create new problems upstream or downstream [45], thereby affecting habitat availability and ecological status in longer reaches [9]. Furthermore, it is particularly important to clarify the relationship between sinuosity and the ecological and regional socioeconomic needs of rivers when carrying out comprehensive river sinuosity adjustment-oriented improvement projects.
Scholars have studied the mechanism of sinuosity in the self-purification of water bodies and proposed increasing the sinuosity to improve the ability of rivers to remove pollutants from water, which was thought to increase the growth rate of dissolved oxygen. However, the excessive meandering of rivers can affect flooding, sand drainage, and the safety of riverbanks [46]. Changes in the meandering of rivers must be justified, as there is a corresponding relationship between the meandering of rivers, society, and ecology; that is, no blind remediation is possible. Moreover, meanders of rivers that do not require remediation and whose meanders have remained unchanged for a long time should be left unchanged [47]. Meandering river ecosystems are sensitive and have difficulty recovering from damage [48]. Consequently, unnecessary human interference should be reduced to prevent the destruction of river habitats, which affect the stability of river ecosystems [49]. River morphology characterized by sinuosity is linked to the abundance, evenness, and diversity of organisms in the structure of river ecosystems, and there are large differences in organisms living at different geomorphic units of rivers [50,51]. In general, the complex sinuosity of water supports the diversity of river organisms [52,53]. Against the risk of riparian soil erosion along dammed rivers, the configuration of river morphology should be considered as one of the potential management strategies for offsetting the negative impacts of damming [54]. Moreover, after changing the sinuosity of rivers, monitoring of river habitat types and the corresponding biological changes should continue [55]. In this study, we quantified the relationship between sinuosity, depth, velocity diversity, and ecological flow and argued for an appropriate sinuosity, which has practical implications for the multi-objective ecological restoration of rivers.
For some water-scarce rivers affected by the natural environment, geographic location, socioeconomic factors, and human factors, there may be much less in-channel runoff than the ecological flow calculated through hydraulics and habitat simulation. In such cases where water diversion and replenishment cannot be guaranteed, research such as this study should be considered to determine the appropriate sinuosity through quantitative methods to maintain the stability of river ecosystems at relatively low flow rates through ecological engineering to adjust the river sinuosity.

5. Conclusions

In this study, a River 2D model was used to simulate the hydrodynamics and habitats of six morphologies of the studied river, which, combined with the depth and velocity diversity index and the Q-WUA curve, were used to determine the relationship between sinuosity, depth and velocity diversity, and the ecological flow required by the target species. Quantitative research showed that, as the sinuosity increased, the depth and velocity diversity of the water increased, and the two were positively correlated; however, this did not imply that the greater the sinuosity, the better the depth and velocity diversity, except under low flow conditions. Our results showed that the ecological flow required for the target species in the reach exhibited a downward trend and was negatively correlated with sinuosity.

Author Contributions

Investigation, data curation, writing—original draft, Z.Y.; methodology, data curation, writing—original draft, Y.F.; writing—review and editing, Y.Z.; writing—review and editing, Z.L.; investigation and methodology, Y.L. All authors have read and agreed to the published version of the manuscript.

Funding

This research received no external funding.

Data Availability Statement

The datasets generated and analyzed during the current study are not publicly available due to the fact that basic and analytical data involve local planning, but are available from the corresponding author on reasonable request.

Acknowledgments

Thank you to all authors for their contributions to the article.

Conflicts of Interest

The authors declare no conflict of interest.

References

  1. Giller, P.S. River restoration: Seeking ecological standards. Editor’s introduction. J. Appl. Ecol. 2005, 42, 201–207. [Google Scholar] [CrossRef]
  2. Walteros, J.M.; Ramírez, A. Urban streams in Latin America: Current conditions and research needs. Rev. Biol. Trop. 2020, 68, 13–28. [Google Scholar] [CrossRef]
  3. Jähnig, S.; Hering, D.; Sommerhäuser, M. Fließgewässer-Renaturierung Heute und Morgen: EG-Wasserrahmenrichtlinie, Maßnahmen und Effizienzkontrolle; mit 55 Tabellen; Schweizerbart: Stuttgart, Germany, 2011. [Google Scholar]
  4. Lytle, D.A.; Poff, N. Adaptation to natural flow regimes. Trends Ecol. Evol. 2004, 19, 94–100. [Google Scholar] [CrossRef] [PubMed]
  5. Winkley, B.R. Man-Made Cutoffs on the Lower Mississippi River, Conception, Construction and River Response; Army Engineer District: Vicksburg, MS, USA, 1977. [Google Scholar]
  6. Arnaud, F.; Schmitt, L.; Johnstone, K.; Rollet, A.-J.; Piégay, H. Engineering impacts on the Upper Rhine channel and floodplain over two centuries. Geomorphology 2019, 330, 13–27. [Google Scholar] [CrossRef]
  7. Tao, G. Development and Prospects of Canalization Engineering in China. Adv. Sci. Technol. Water Resour. 1995, 4, 4–8+35. (In Chinese) [Google Scholar]
  8. Kadoya, M. A review of the study on runoff changes due to urbanization. Proc. JSCE 1985, 363. [Google Scholar] [CrossRef]
  9. Dong, Z.; Sun, D.; Zhao, J.; Jing, Z. River Restoration; China Water Conservancy and Hydropower Publishing: Beijing, China, 2013. (In Chinese) [Google Scholar]
  10. Dutta, V.; Sharma, U.; Iqbal, K.; Adeeba; Kumar, R.; Pathak, A.K. Impact of river channelization and riverfront development on fluvial habitat: Evidence from Gomti River, a tributary of Ganges, India. Environ. Sustain. 2018, 1, 167–184. [Google Scholar]
  11. Larsen, P. Restoration of River Corridors: German Experiences. In The Rivers Handbook: Hydrological and Ecological Principles; Wiley: Hoboken, NJ, USA, 1994; pp. 419–438. [Google Scholar]
  12. Li, P.; Li, D.; Sun, X.; Chu, Z.; Xia, T.; Zheng, B. Application of Ecological Restoration Technologies for the Improvement of Biodiversity and Ecosystem in the River. Water 2022, 14, 1402. [Google Scholar] [CrossRef]
  13. Tijdeman, E.; Hannaford, J.; Stahl, K. Human influences on streamflow drought characteristics in England and Wales. Hydrol. Earth Syst. Sci. 2018, 22, 1051–1064. [Google Scholar] [CrossRef] [Green Version]
  14. WarWarner, J.F.; van Buuren, A.; Edelenbos, J. Making Space for the River: Governance Experiences with Multifunctional River Flood Management in the US and Europe; IWA Publishing: London, UK, 2012. [Google Scholar]
  15. Wineland, S.M.; Bașağaoğlu, H.; Fleming, J.; Laura, G.-D.; Kellogg, W.; Koch, J.; Lane, B.A.; Mirchi, A.; Nava, L.F.; Neeson, Y.M.; et al. The environmental flows implementation challenge: Insights and recommendations across water-limited systems. Wiley Interdiscip. Rev. Water 2022, 9, e1565. [Google Scholar] [CrossRef]
  16. Xu, Z.; Wu, W.; Yu, S. Ecological baseflow: Progress and challenge. J. Hydroelectr. Eng. 2016, 35, 1–11. (In Chinese) [Google Scholar]
  17. Palmer, M.A.; Bernhardt, E.S. Hydroecology and river restoration: Ripe for research and synthesis. Water Resour. Res. 2006, 42, W03S07. [Google Scholar]
  18. Acreman, M.; Arthington, A.H.; Colloff, M.J.; Couch, C.; Crossman, N.D.; Dyer, F.J.; Overton, I.; Pollino, C.A.; Stewardson, M.J.; Young, W. Environmental flows for natural, hybrid, and novel riverine ecosystems in a changing world. Front. Ecol. Environ. 2014, 12, 466–473. [Google Scholar] [CrossRef] [PubMed] [Green Version]
  19. Ying, C.; Zhang, Q.; Chen, X.A.; Qiang, T. Advances in the theories and calculation methods of ecological water requirement. J. Lake Sci. 2010, 4, 465–480. (In Chinese) [Google Scholar]
  20. Brookes, A. River channel change. In The Rivers Handbook: Hydrological and Ecological Principles; Wiley-Blackwell: Hoboken, NJ, USA, 1994; Volume 2, pp. 55–75. [Google Scholar]
  21. Wang, Y.; Xia, J.; Cai, W.; Liu, Z.; Li, J.; Yin, J.; Zu, J.; Dou, C. Response of Fish Habitat Quality to Weir Distribution Change in Mountainous River Based on the Two-Dimensional Habitat Suitability Model. Sustainability 2023, 15, 8698. [Google Scholar] [CrossRef]
  22. Chunguang, Z.; Yahui, Z.; Yingchun, X.; Ruilu, G.; Qing, Z.; Yun, F.; Enyuan, F. Fish species diversity and conservation in Beijing and adjacent areas. Biodivers. Sci. 2011, 19, 597–604. [Google Scholar] [CrossRef]
  23. McManamay, R.A.; Brewer, S.K.; Jager, H.I.; Troia, M.J. Organizing Environmental Flow Frameworks to Meet Hydropower Mitigation Needs. Environ. Manag. 2016, 58, 365–385. [Google Scholar] [CrossRef]
  24. Steffler, P.; Blackburn, J. Two-Dimensional Depth Averaged Model of River Hydrodynamics and Fish Habitat. In River2D User’s Manual; University of Alberta: Edmonton, AB, Canada, 2002. [Google Scholar]
  25. Naderi, M.H.; Zakerinia, M.; Salarijazi, M. Improvement of habitat simulation method using River2D hydrodynamic model to determine ecological regime of river. Proc. R. Soc. Edinb. 2019, 72, 263–277. [Google Scholar]
  26. Bum, R.K.; Chun, P.S.; Hoon, J.Y.; Ok, P.M. Study on ecological instream flow estimation using River2D model in the Seomjin River. J. Korean Soc. Water Environ. 2011, 822–829. [Google Scholar]
  27. Leopold, L.B.; Wolman, M.G. River Channel Patterns: Braided, Meandering, and Straight; US Government Printing Office: Washinton, DC, USA, 1957.
  28. Yi, Y.; Wang, Z.; Yang, Z. Two-dimensional habitat modeling of Chinese sturgeon spawning sites. Ecol. Model. 2010, 221, 864–875. [Google Scholar] [CrossRef]
  29. Yang, Z.; Yu, S.; Chen, H.; She, D. Model for defining environmental flow thresholds of spring flood period using abrupt habitat change analysis. Adv. Water Sci. 2010, 21, 567–574. (In Chinese) [Google Scholar]
  30. Williams, C.B. Area and number of species. Nature 1943, 152, 264–267. [Google Scholar] [CrossRef]
  31. Fatch, P.; Masangano, C.; Hilger, T.; Jordan, I.; Mambo, I.; Kamoto, J.F.M.; Kalimbira, A.; Nuppenau, E.-A. Holistic agricultural diversity index as a measure of agricultural diversity: A cross-sectional study of smallholder farmers in Lilongwe district of Malawi. Agric. Syst. 2020, 187, 102991. [Google Scholar] [CrossRef]
  32. Li, C.; Gan, Y.; Chao, Z.; Huan, H.; Fang, J.; Wang, L.; Yan, W.; Jian, L. “Microplastic communities” in different environments: Differences, links, and role of diversity index in source analysis. Water Res. 2020, 188, 116574. [Google Scholar] [CrossRef] [PubMed]
  33. Zhang, A.; Dong, Z.; Zhao, J.; Sun, D. Progress of analysis and research on landscape pattern of river basin. Water Resour. Hydropower Eng. 2012, 7, 5. (In Chinese) [Google Scholar]
  34. Yu, G.A.; Wang, Z.Y.; Zhang, K.; Wang, F.X. Effect of artificial step-pools on improving aquatic habitats and stream ecological in incised river channel. J. Hydraul. Eng. 2008, 2, 162–167. (In Chinese) [Google Scholar]
  35. Stähly, S.; Gostner, W.; Franca, M.J.; Robinson, C.T.; Schleiss, A.J. Sampling sufficiency for determining hydraulic habitat diversity. J. Ecohydraulics 2018, 3, 130–144. [Google Scholar] [CrossRef]
  36. Bockelmann, B.N.; Fenrich, E.K.; Lin, B.; Falconer, R.A. Development of an ecohydraulics model for stream and river restoration. Ecol. Eng. 2004, 22, 227–235. [Google Scholar] [CrossRef]
  37. Roni, P.; Hall, J.E.; Drenner, S.M.; Arterburn, D. Monitoring the effectiveness of floodplain habitat restoration: A review of methods and recommendations for future monitoring. WIREs Water 2019, 6, e1355. [Google Scholar] [CrossRef]
  38. Xing, Y.; Lv, B.; Ma, D.; Zhang, H.; Yu, G. Hydrodynamic modeling to evaluate the influence of inland navigation channel training works on fish habitats in the Upper Yellow River. Ecol. Eng. 2021, 169, 106289. [Google Scholar]
  39. Maddock, I. The importance of physical habitat assessment for evaluating river health. Freshw. Biol. 1999, 41, 373–391. [Google Scholar] [CrossRef]
  40. Poff, N.L.; Zimmerman, J.K.H. Ecological responses to altered flow regimes: A literature review to inform the science and management of environmental flows. Freshw. Biol. 2010, 55, 194–205. [Google Scholar] [CrossRef]
  41. Alsterberg, C.; Roger, F.; Sundbäck, K.; Juhanson, J.; Hulth, S.; Hallin, S.; Gamfeldt, L. Habitat diversity and ecosystem multifunctionality—The importance of direct and indirect effects. Sci. Adv. 2017, 3, e1601475. [Google Scholar]
  42. Palmer, M.A.; Menninger, H.L.; Bernhardt, E. River restoration, habitat heterogeneity and biodiversity: A failure of theory or practice? Freshw. Biol. 2010, 55, 205–222. [Google Scholar] [CrossRef]
  43. Geist, J.; Hawkins, S.J. Habitat recovery and restoration in aquatic ecosystems: Current progress and future challenges. Aquat. Conserv. Mar. Freshw. Ecosyst. 2016, 26, 942–962. [Google Scholar] [CrossRef]
  44. Hohensinner, S.; Hauer, C.; Muhar, S. River morphology, channelization, and habitat restoration. In Riverine Ecosystem Management: Science for Governing towards a Sustainable Future; Springer: Cham, Switzerland, 2018; pp. 41–65. [Google Scholar]
  45. Gregory, K. The human role in changing river channels. Geomorphology 2006, 79, 172–191. [Google Scholar]
  46. Wanjie, Z.; Linjuan, X. Review on Artificial Bending Cutoff and Regulation of Distorted River Bends. In Proceedings of the 2018 3rd International Conference on Smart City and Systems Engineering (ICSCSE), Xiamen, China, 29–30 December 2018; pp. 905–907. [Google Scholar]
  47. Murniningsih, S. Analysis of the relation between meander river transformation and soil classification in urban area. IOP Conf. Ser. Earth Environ. Sci. 2020, 612, 012073. [Google Scholar]
  48. Graf, W.; Leitner, P.; Hanetseder, I.; Ittner, L.D.; Dossi, F.; Hauer, C. Ecological degradation of a meandering river by local channelization effects: A case study in an Austrian lowland river. Hydrobiologia 2016, 772, 145–160. [Google Scholar] [CrossRef]
  49. Saha, P.; Islam, M.; Oyshi, J.T.; Khanum, R.; Nishat, A. A sustainability analysis on the trends and frequency of the channel flow of a carp breeding river against human interventions and governing public–private partnership (PPP) as adaptation. SN Appl. Sci. 2020, 2, 969. [Google Scholar] [CrossRef] [Green Version]
  50. Gray, D.P.; Harding, J.S. Braided River Ecology: A Literature Review of Physical Habitats and Aquatic Invertebrate Communities; Science & Technical Pub., Department of Conservation: Setúbal, Portugal, 2007. [Google Scholar]
  51. Blettler, M.C.M.; Amsler, M.L.; Eberle, E.G.; Szupiany, R.; Latosinski, F.G.; Abrial, E.; Oberholster, P.J.; Espinola, L.A.; Paira, A.; Poza, A.; et al. Linking hydro-morphology with invertebrate ecology in diverse morphological units of a large river-floodplain system. Water Resour. Res. 2016, 52, 9495–9510. [Google Scholar] [CrossRef] [Green Version]
  52. Garcia, X.-F.; Schnauder, I.; Pusch, M.T. Complex hydromorphology of meanders can support benthic invertebrate diversity in rivers. Hydrobiologia 2011, 685, 49–68. [Google Scholar] [CrossRef]
  53. Lorenz, A.W.; Jähnig, S.C.; Hering, D. Re-meandering German lowland streams: Qualitative and quantitative effects of restoration measures on hydromorphology and macroinvertebrates. Environ. Manag. 2009, 44, 745–754. [Google Scholar] [CrossRef] [PubMed]
  54. Ran, Y.; Liu, Y.; Wu, S.; Li, W.; Zhu, K.; Ji, Y.; Mir, Y.; Ma, M.; Huang, P. A higher river sinuosity increased riparian soil structural stability on the downstream of a dammed river. Sci. Total. Environ. 2021, 802, 149886. [Google Scholar] [CrossRef] [PubMed]
  55. Nagayama, S.; Nakamura, F. The significance of meandering channel to habitat diversity and fish assemblage: A case study in the Shibetsu River, northern Japan. Limnology 2018, 19, 7–20. [Google Scholar] [CrossRef] [Green Version]
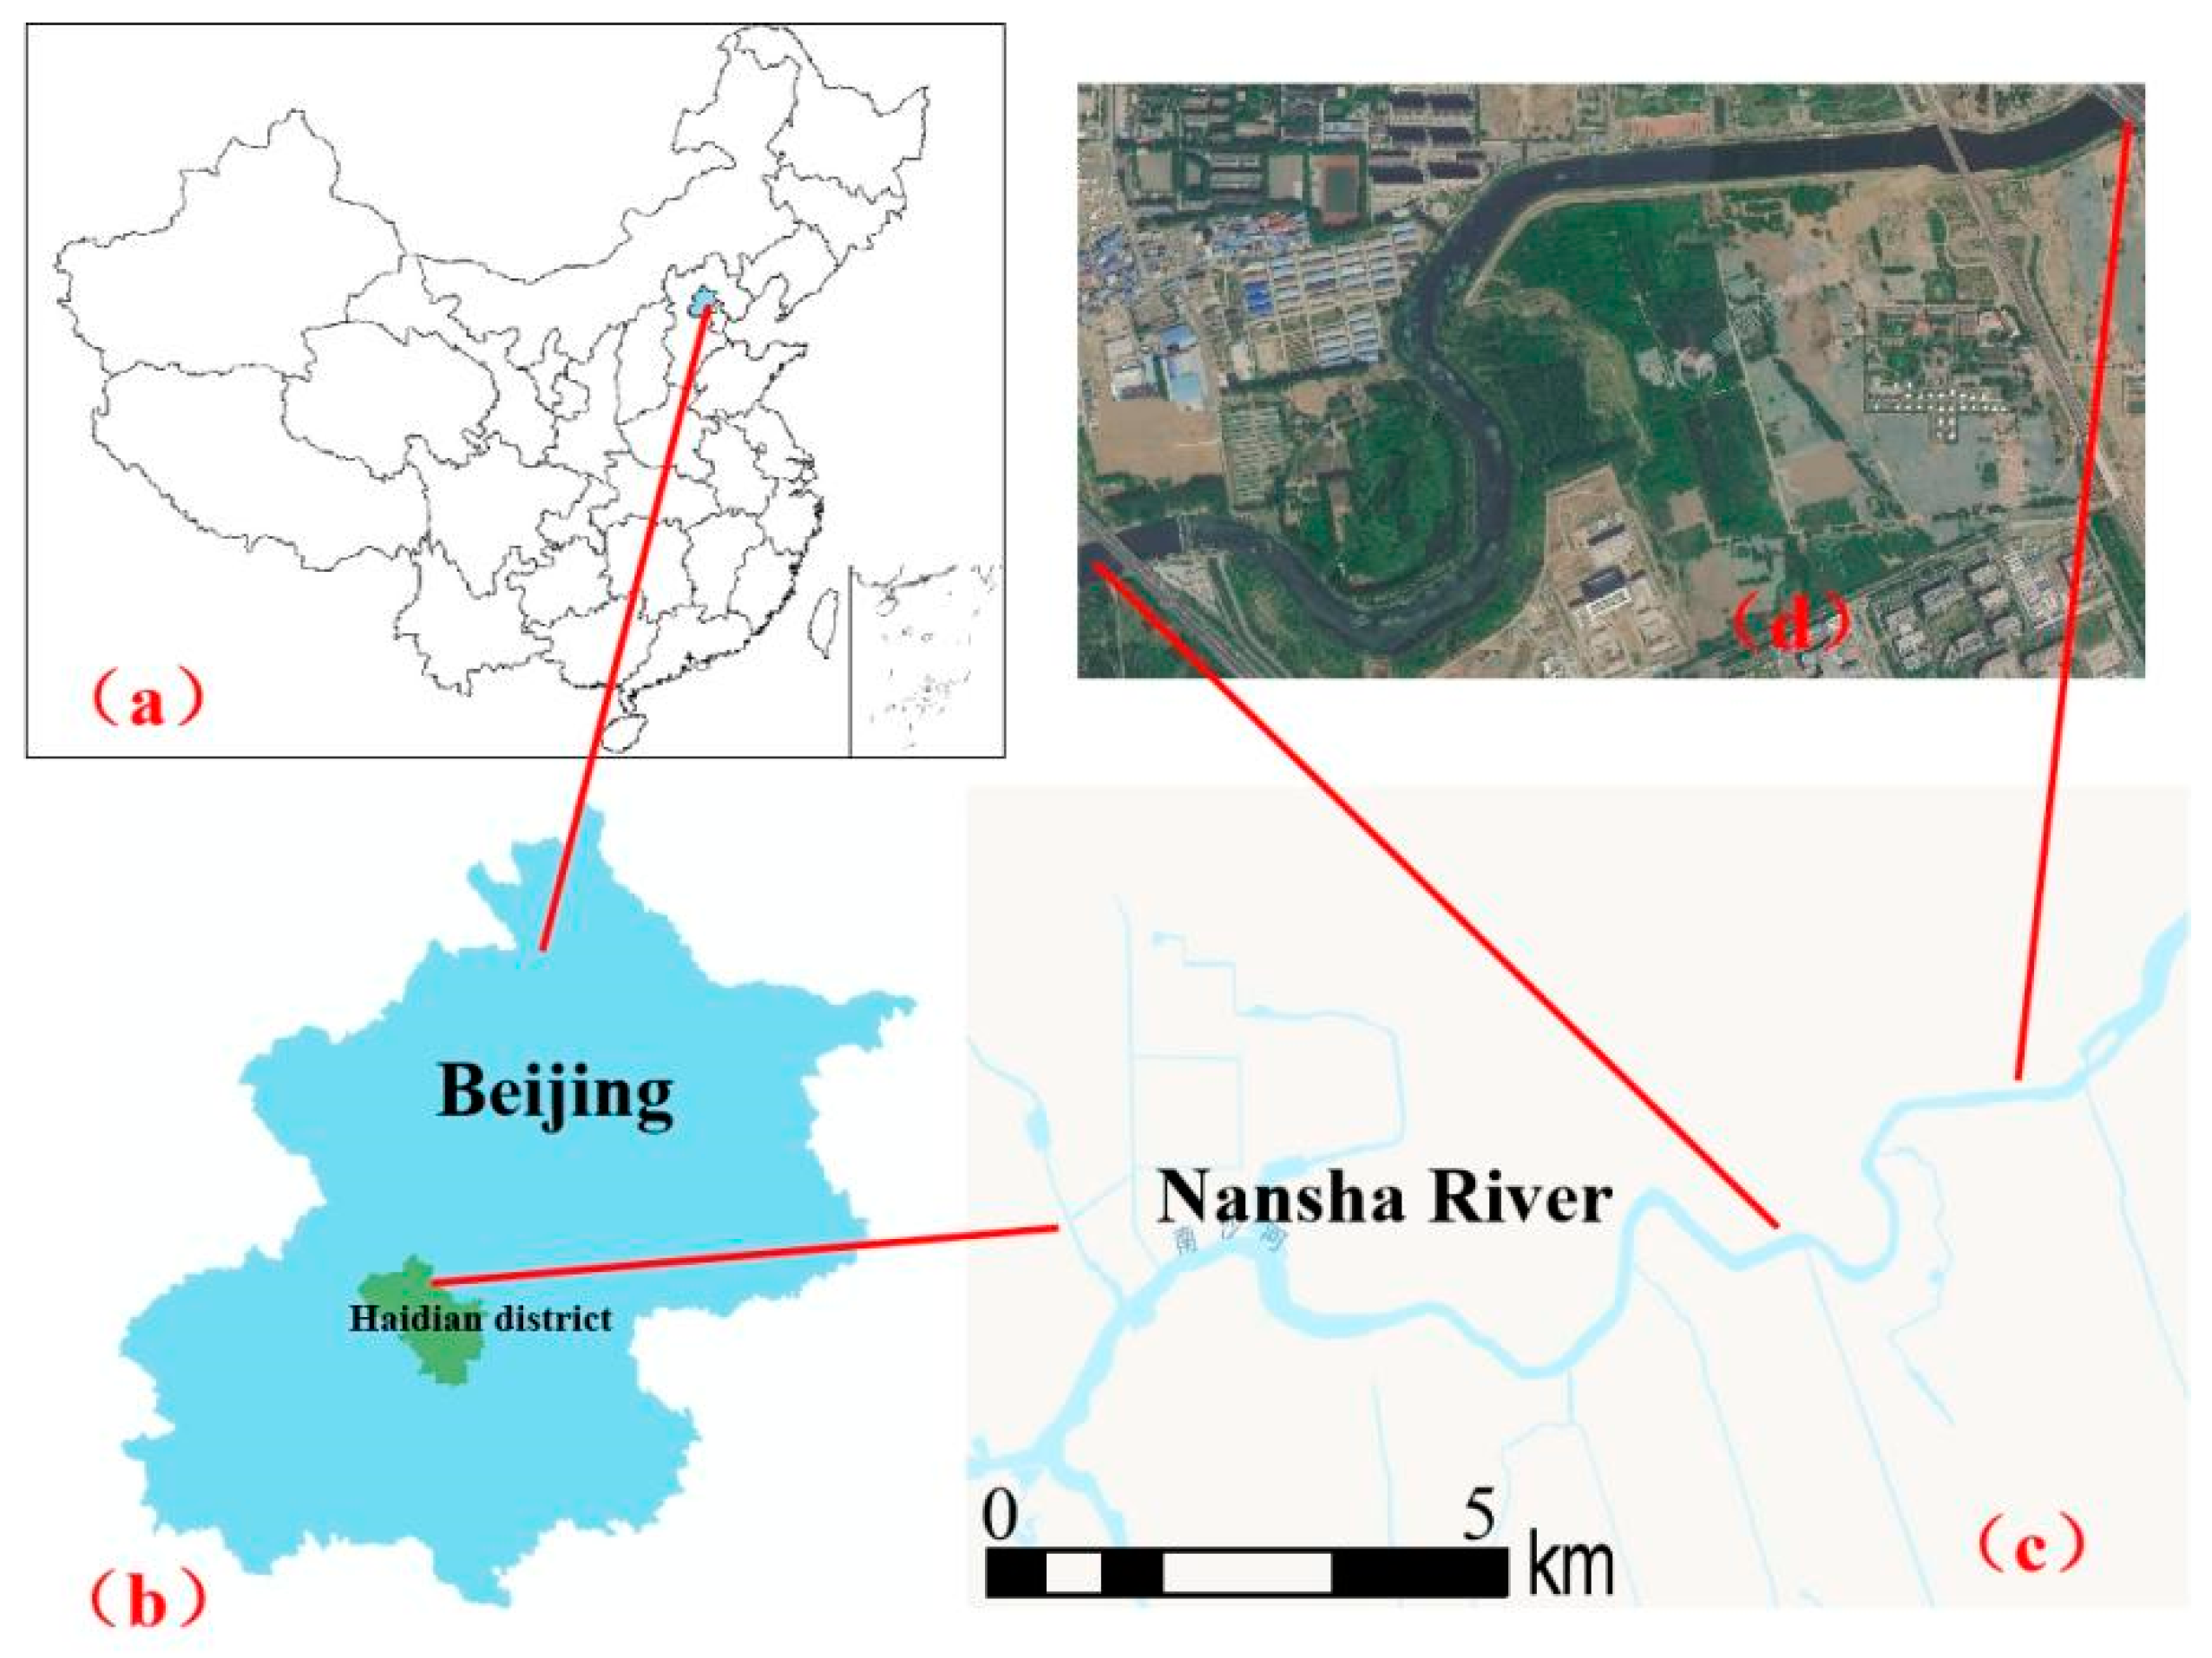
Figure 1. Study area. (a) Map of China; (b) scope of Beijing; (c) the main stream of the Nansha River and some of its tributaries; and (d) schematic of the study reach.
Water 15 02751 g001
Figure 2. Different sinuosities (1.89–1.0).
Water 15 02751 g002
Figure 3. Velocity and depth suitability curves for Cyprinus carpio. (Drawings based on the research of Yang et al. [29]).
Water 15 02751 g003
Figure 4. Schematic diagram of the cross section.
Water 15 02751 g004
Figure 5. Scatter diagrams of depth and velocity distribution under different sinuosities with different flows.
Water 15 02751 g005aWater 15 02751 g005b
Figure 6. Velocity and depth distribution under different sinuosities.
Water 15 02751 g006
Figure 7. Diversity index of water depth and rate at different flows.
Water 15 02751 g007
Figure 8. Trend of depth and velocity diversity index.
Water 15 02751 g008
Figure 9. Distribution of WUA at different flows (with sinuosities of 1.89–1.0).
Water 15 02751 g009
Figure 10. Q-WUA curves at different sinuosities.
Water 15 02751 g010
Figure 11. Relationship between sinuosity and ecological flow.
Water 15 02751 g011
Table 1. Sections 1–6 simulation and water level design.
Section Name123456
Simulated water level (m)38.5538.4338.2038.0837.9637.92
Design water level (approved dredging project) (m)38.4538.4038.4038.3938.3638.28
Relative error (%)0.260.080.520.801.050.98
Table 2. Diversity index values of depth and velocity at different sinuosities.
S1.891.51.41.31.21.0
Q (m3/s)
5345254218296170132
10329544246789355232
15499616498998431396
206536216971059381441
259711053998978499480
309061007958827585425
Disclaimer/Publisher’s Note: The statements, opinions and data contained in all publications are solely those of the individual author(s) and contributor(s) and not of MDPI and/or the editor(s). MDPI and/or the editor(s) disclaim responsibility for any injury to people or property resulting from any ideas, methods, instructions or products referred to in the content.