
Measuring Nitrate Leaching in the Vadose Zone of Loess Soils—Comparison of Batch Extraction and Centrifugation


Abstract
:1. Introduction
2. Materials and Methods
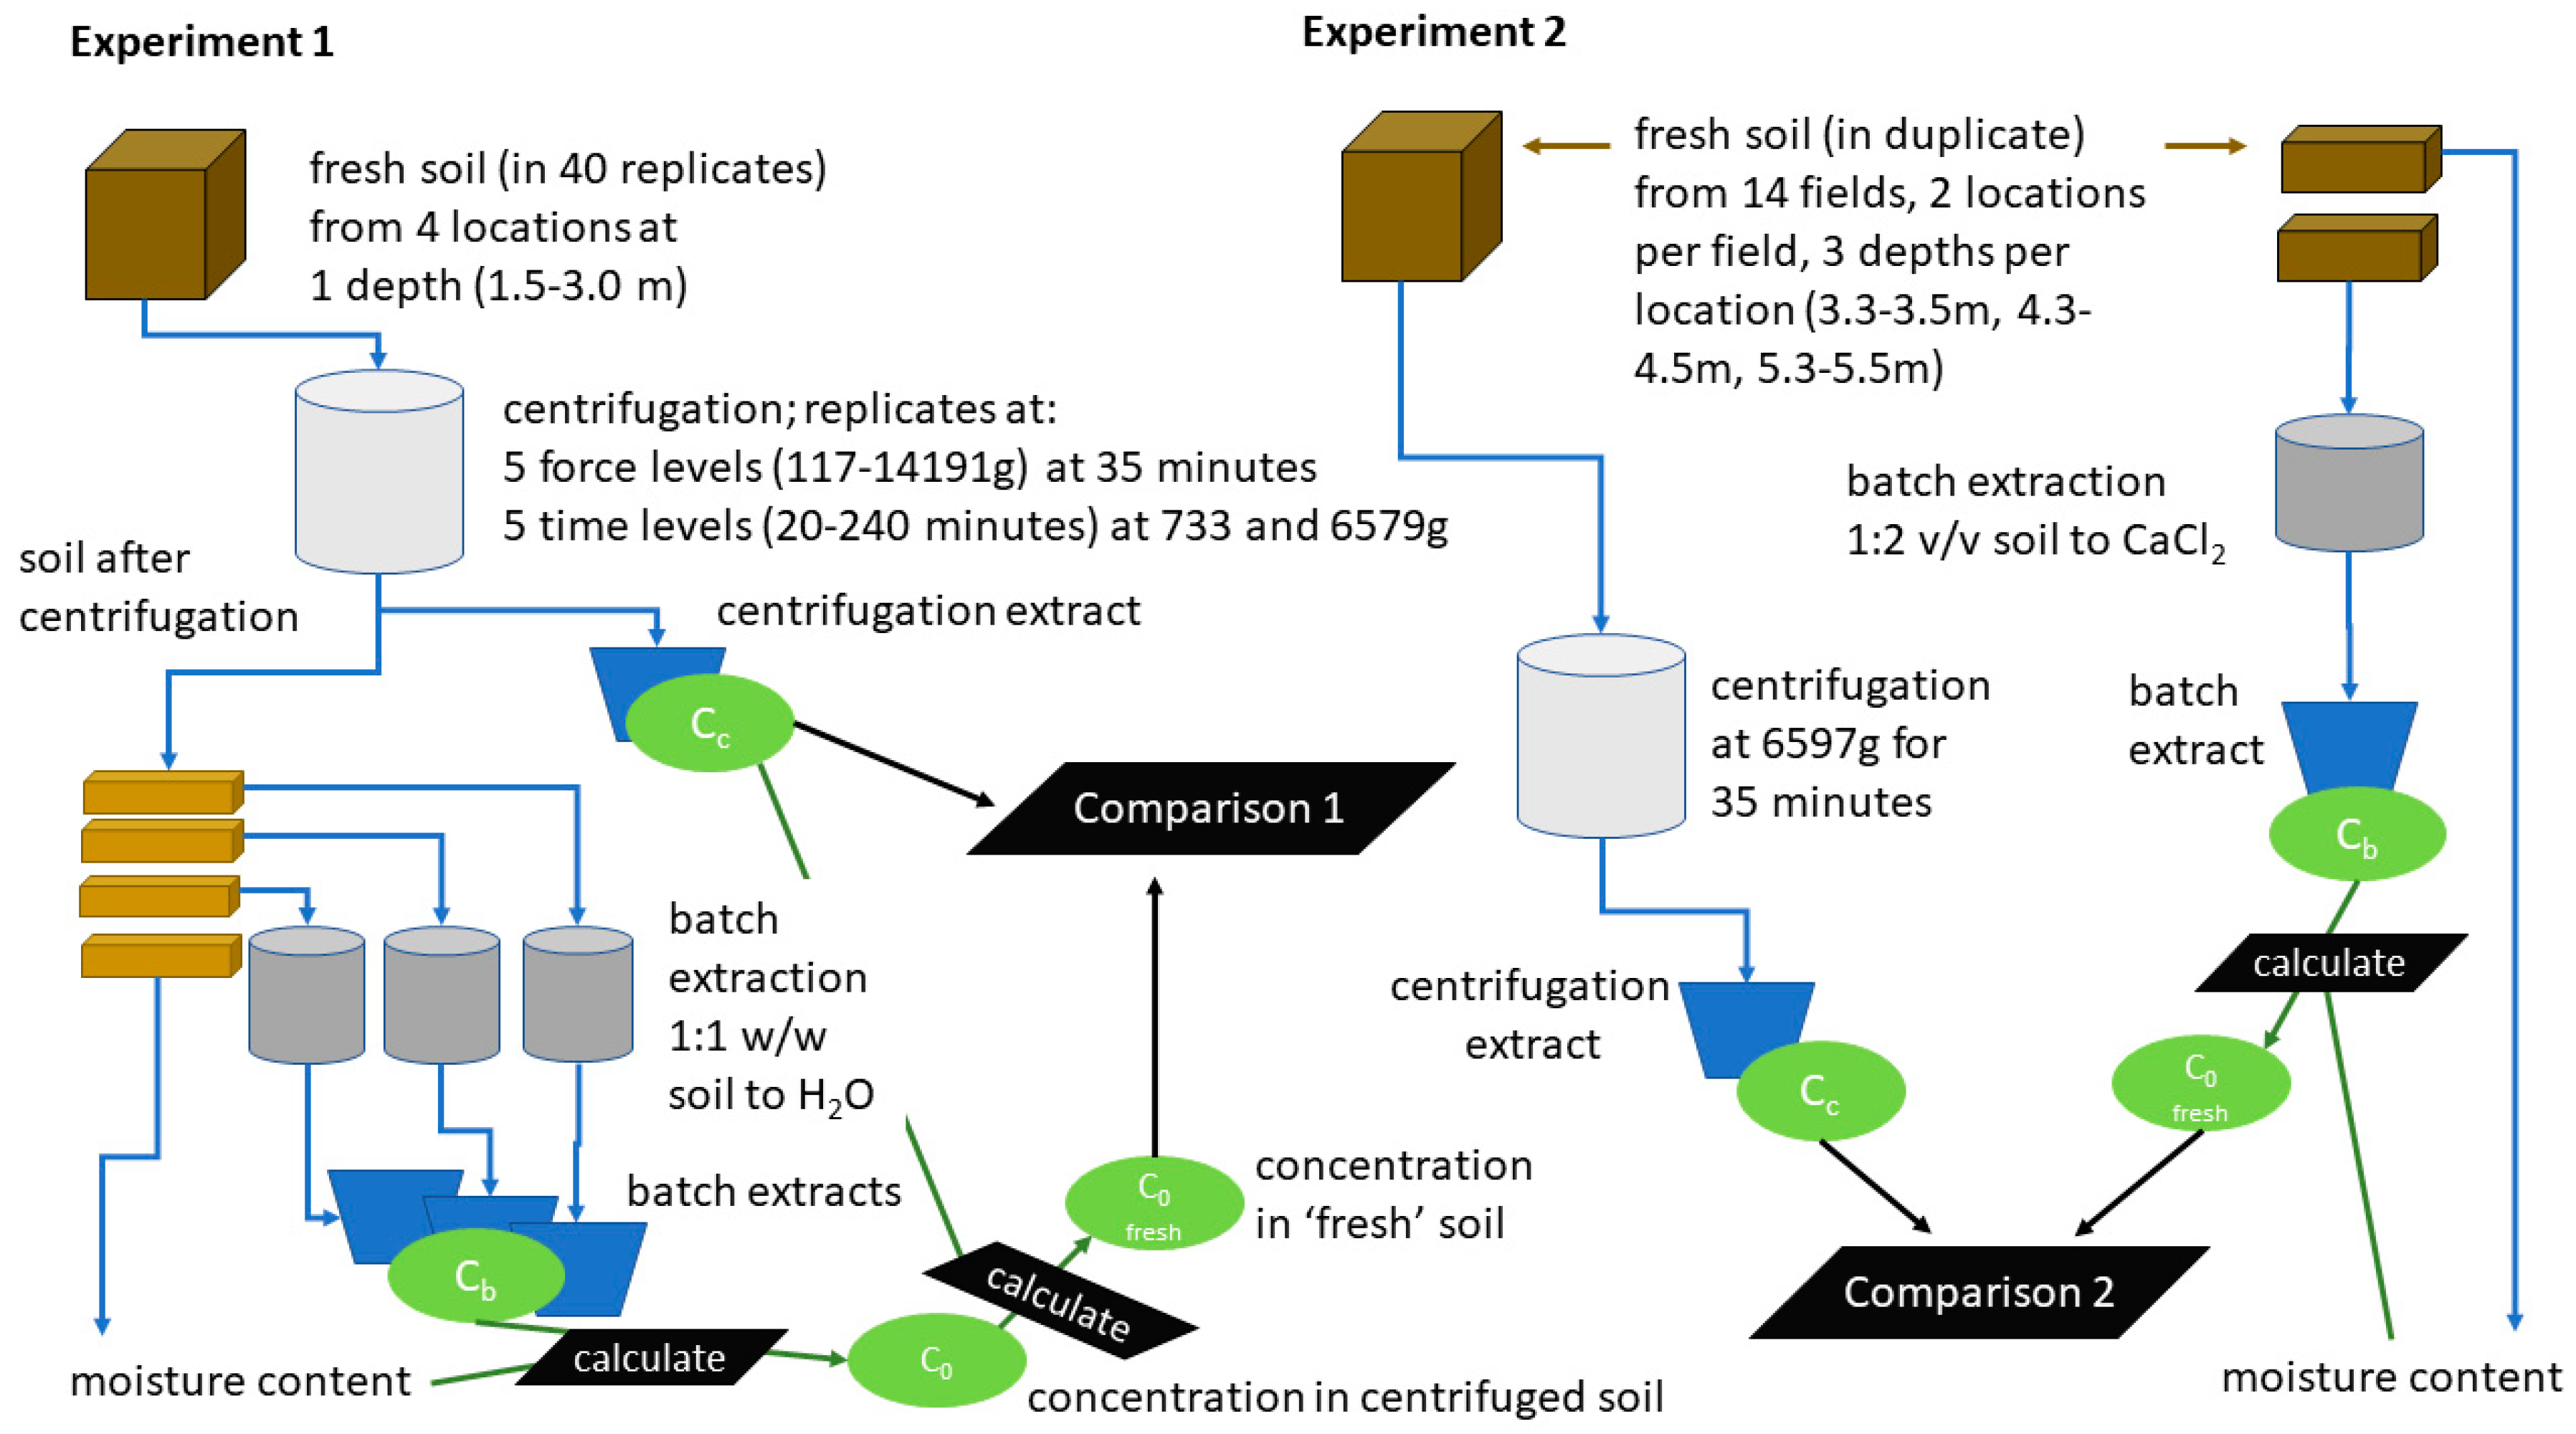
2.1. General Setup of the Study
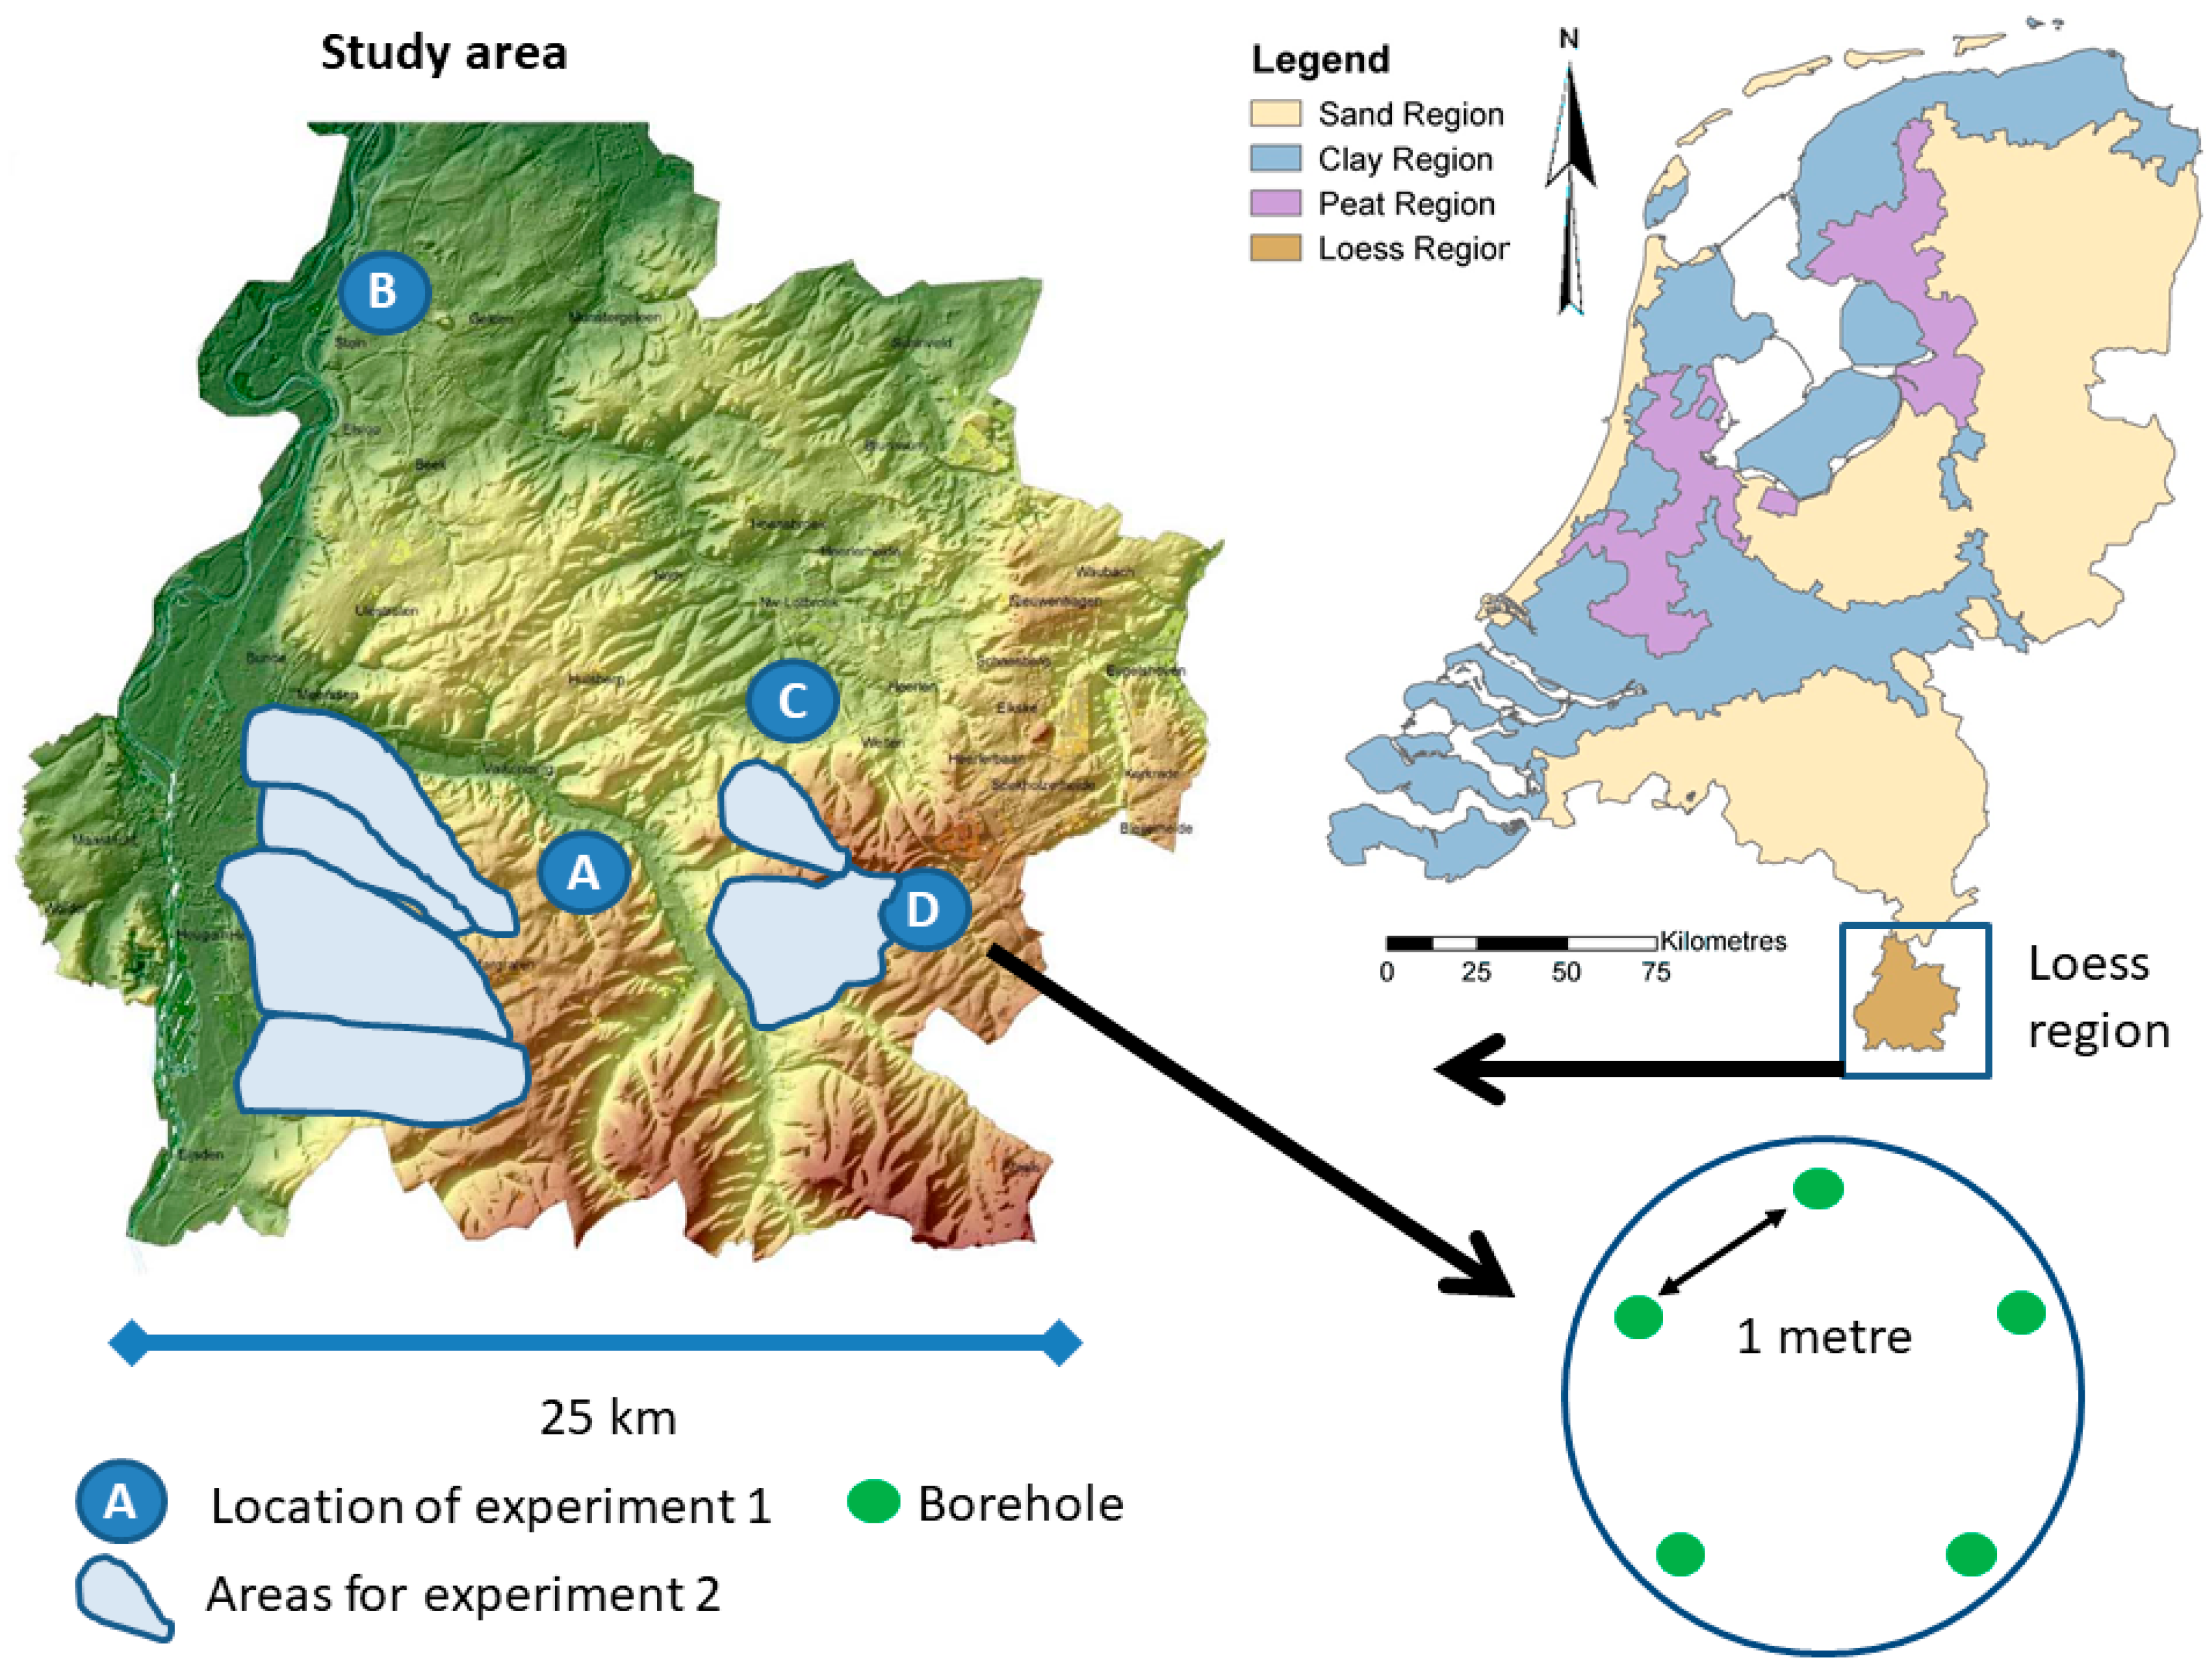
2.2. Site Description and Sampling
2.3. Soil Analysis
2.4. Experiment 1: Centrifugation and 1:1 Water Extraction
2.5. Experiment 2: Centrifugation and 1:2 CaCl2 Extraction
2.6. Data Analysis
3. Results
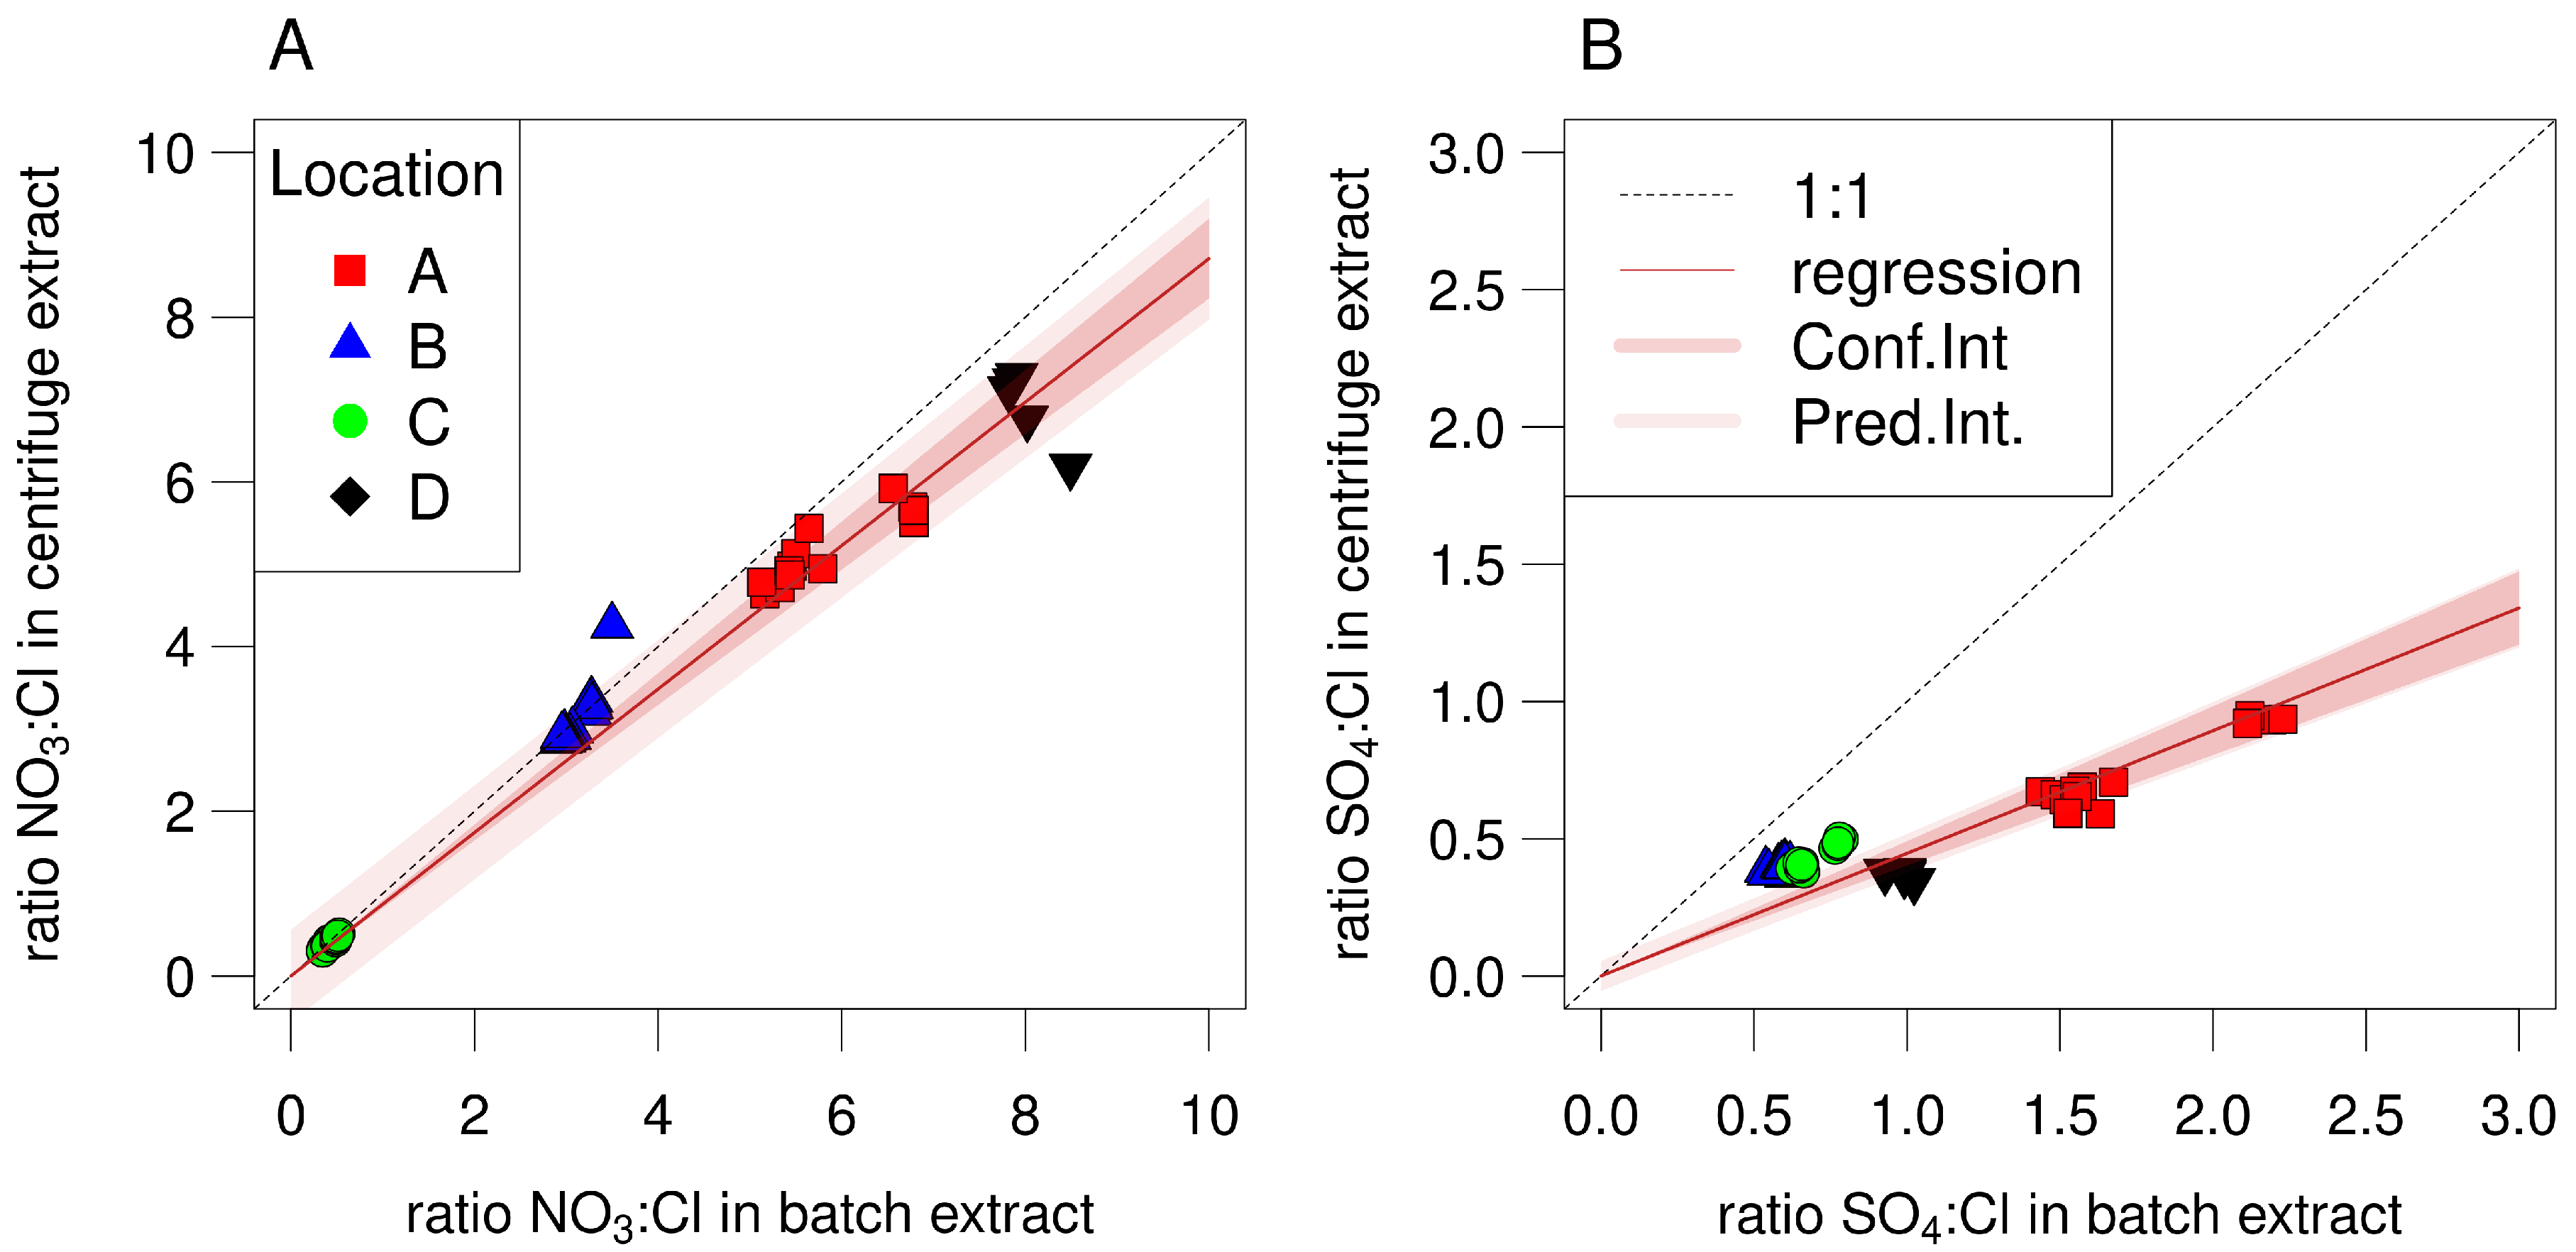
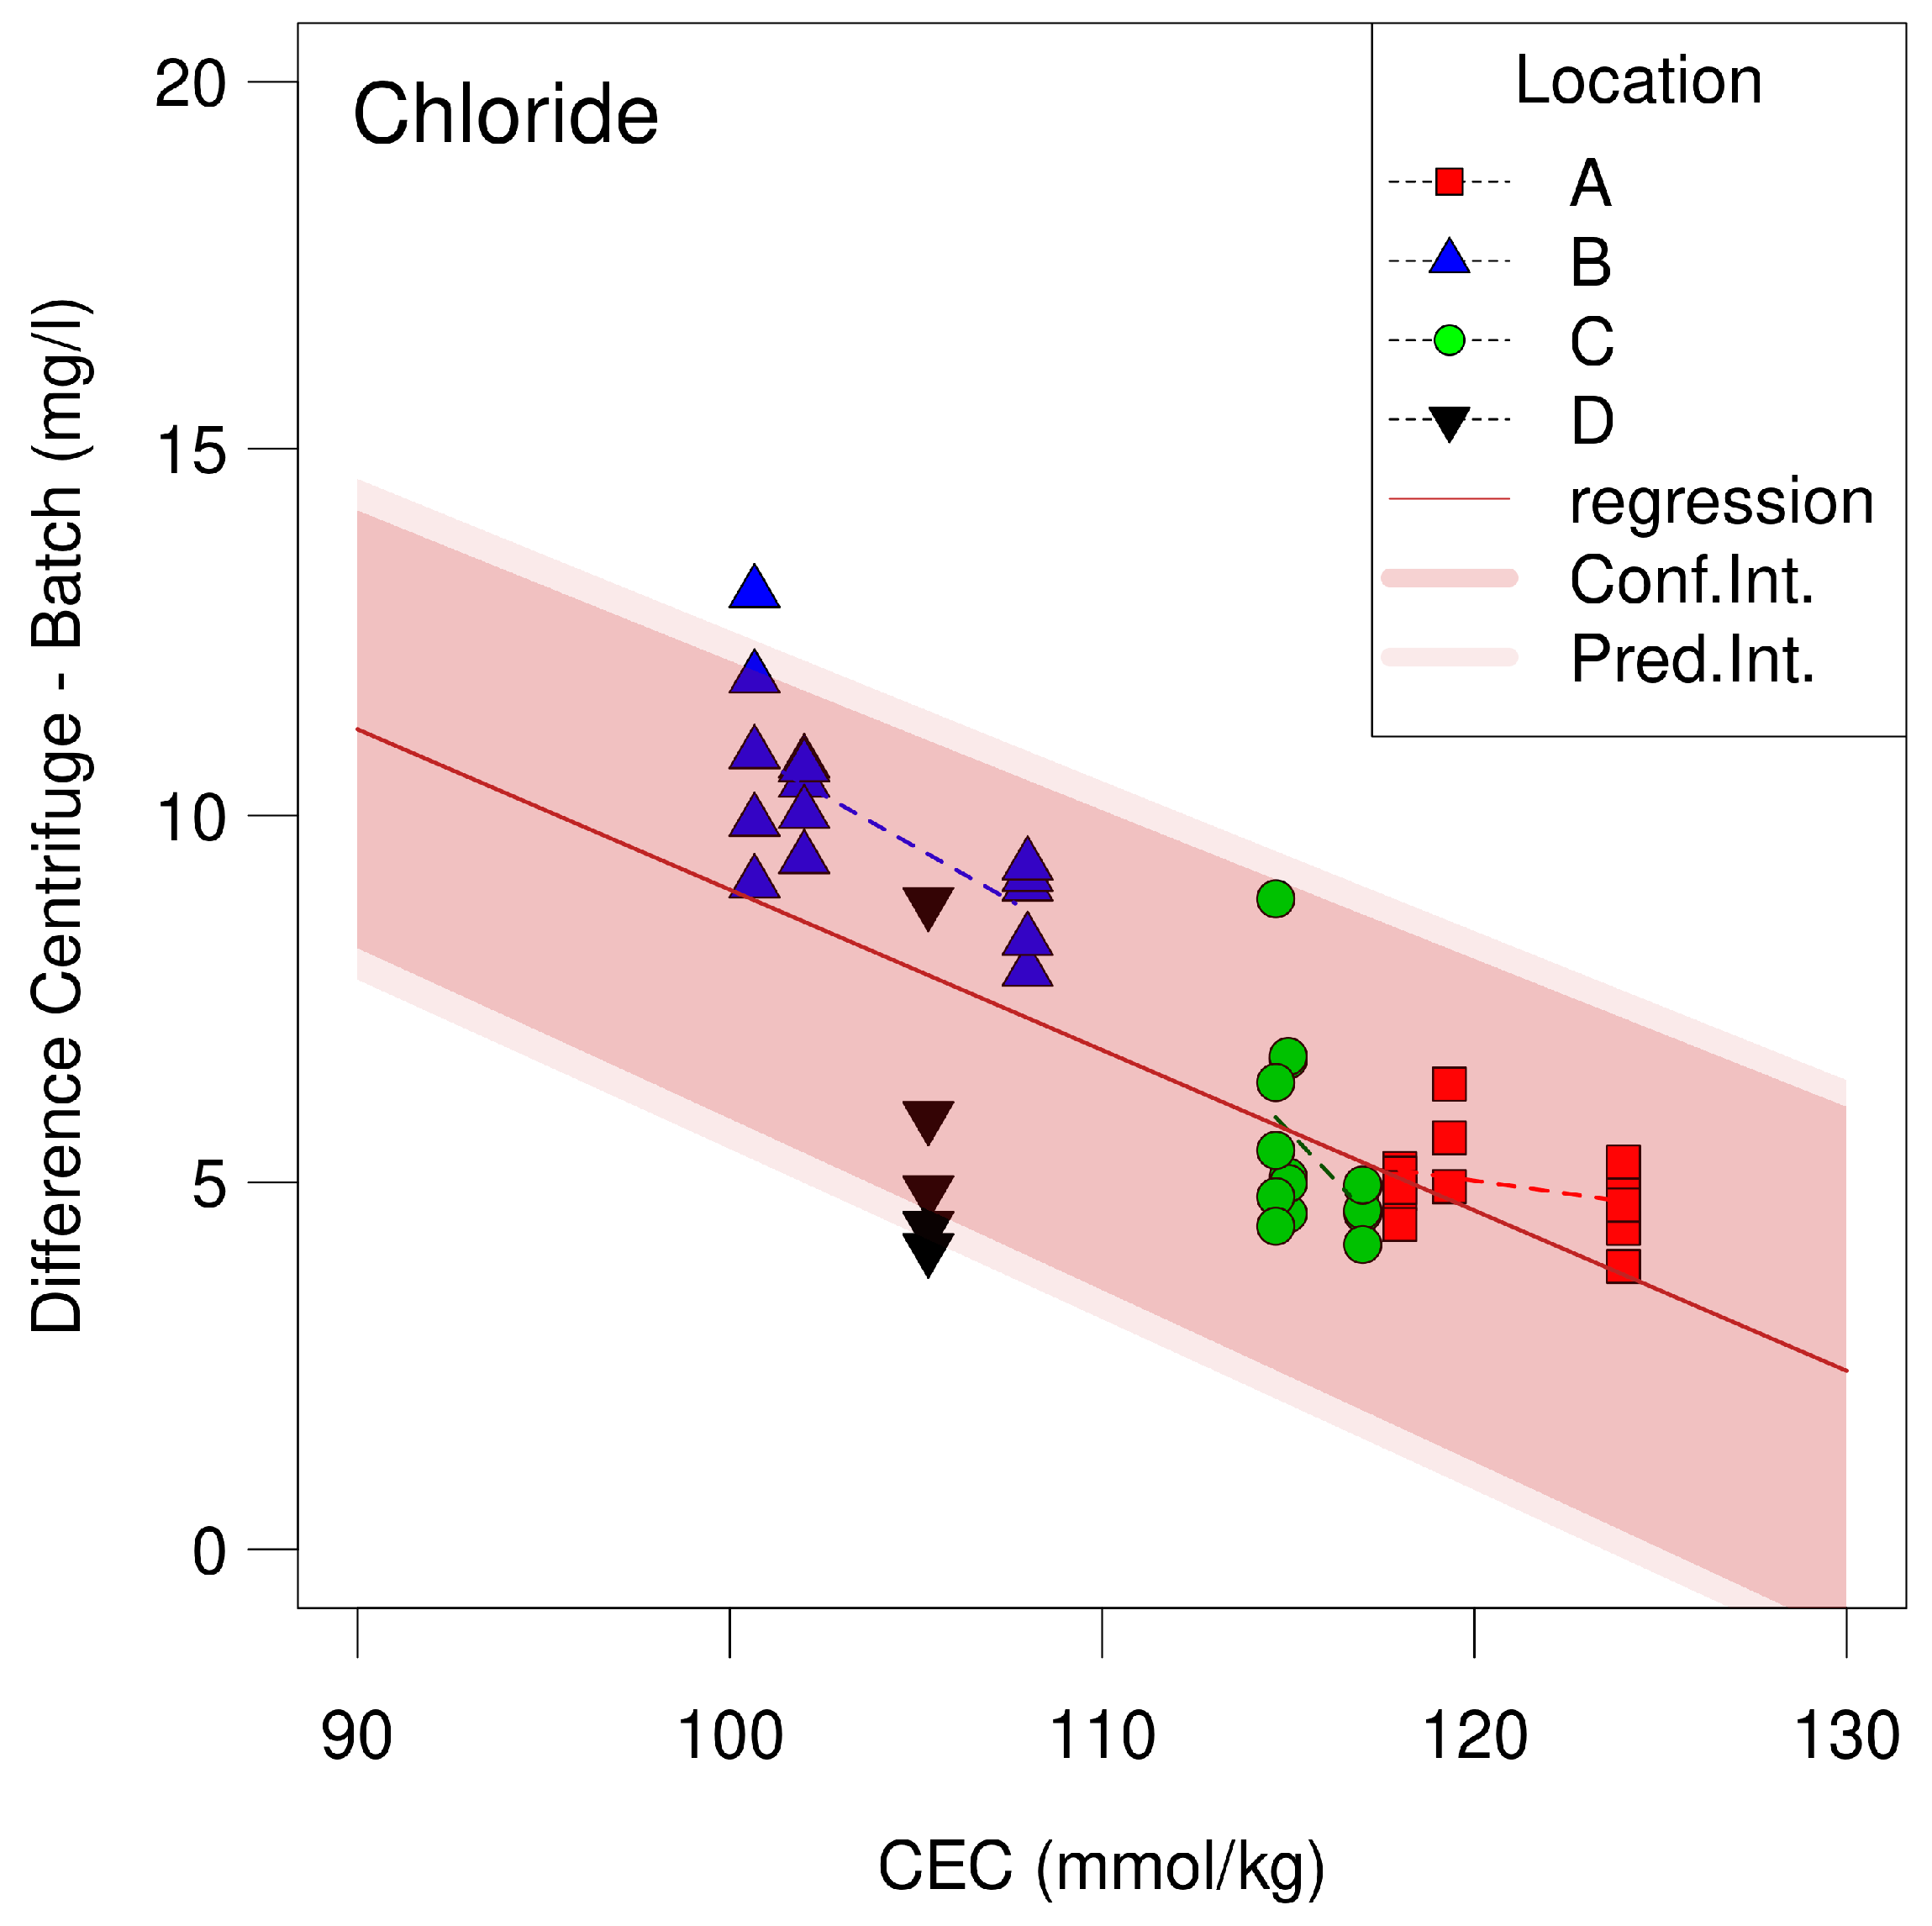
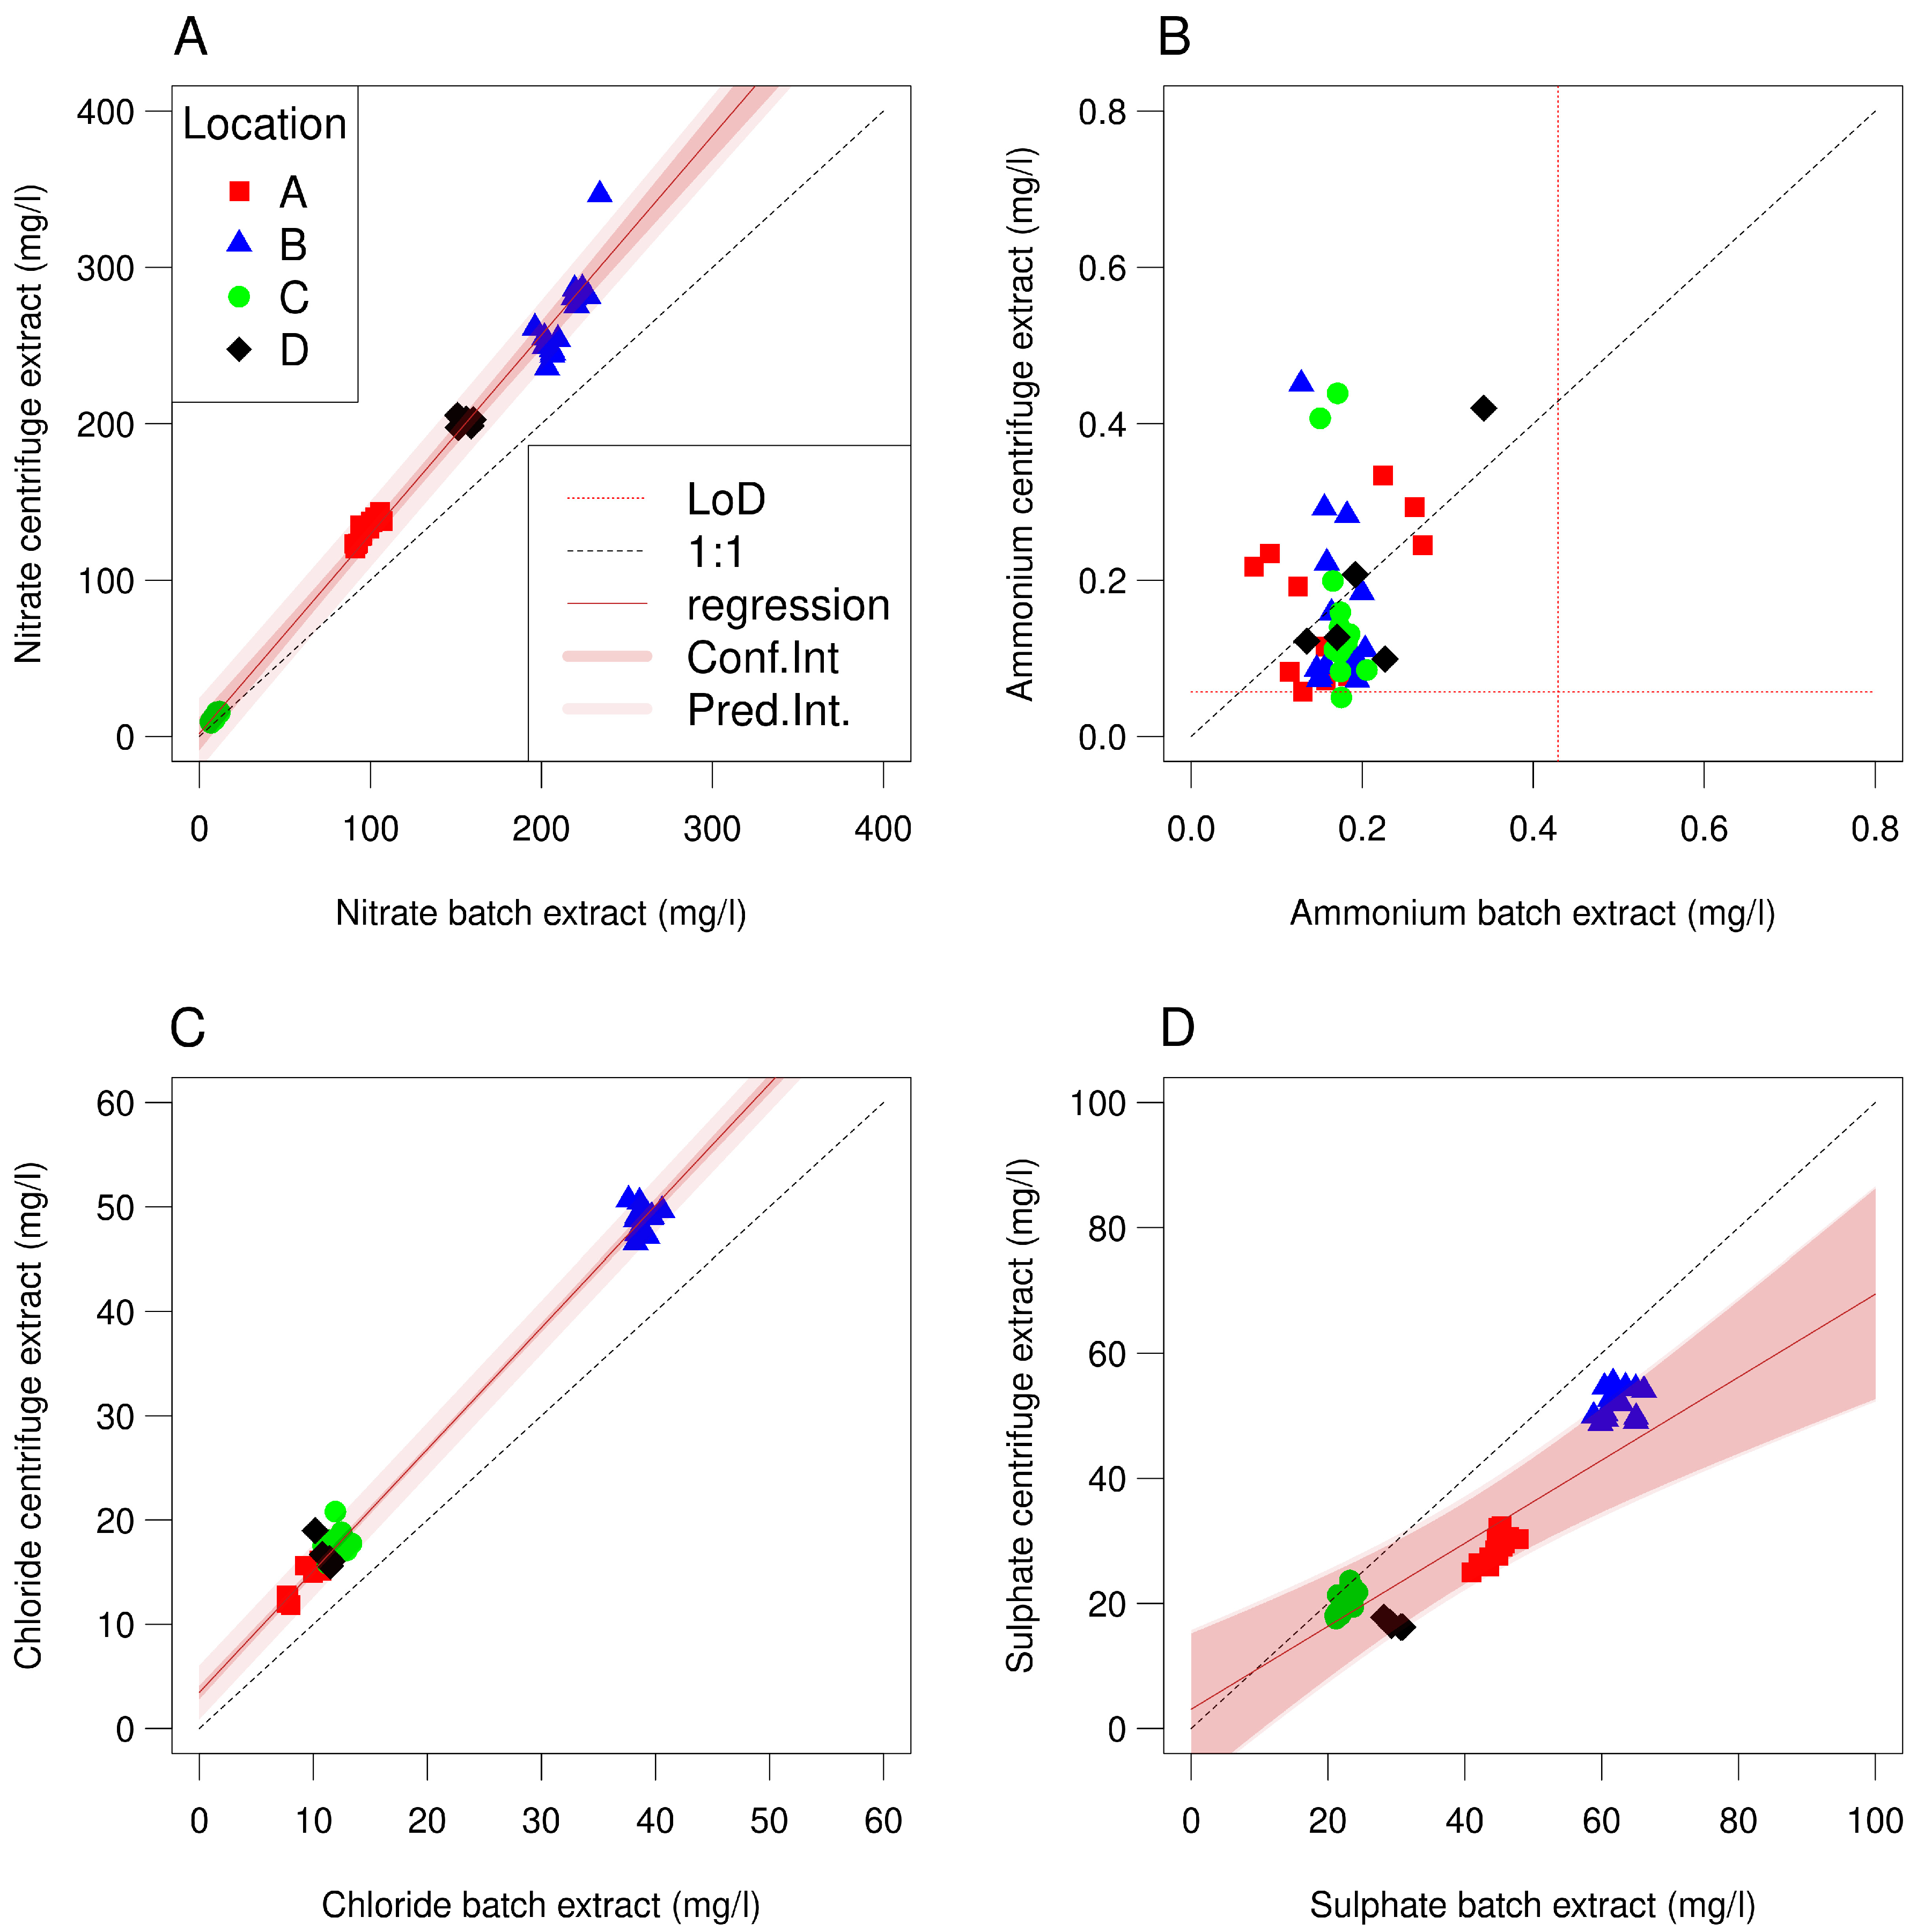
3.1. Experiment 1

| Parameter | Centrifugation 1 | Batch 1:1 2 | Batch 1:1 3 | Difference 4 | t-Value 4 |
|---|---|---|---|---|---|
| Nitrate | 153 (8.7–346) | 108 | 116 (6.5–234) | 34 | 3.03 |
| Ammonium 5 | 0.17 (<0.064–0.45) | 0.20 | 0.18 (<0.073–0.35) | −0.01 | −0.49 |
| Chloride | 24.5 (11.9–50.7) | 16.1 | 17.7 (5.4–40.6) | 6.5 | 5.47 |
| Sulphate | 29.4 (16.2–55.3) | 42.7 | 40.4 (21.0–66.2) | −10.3 | −3.55 |
| Parameter | Experiment | Intercept | Coefficient | ||||
|---|---|---|---|---|---|---|---|
| Mean | SE | p-Value 1 | Mean | SE | p-Value 1 | ||
| nitrate | 1 | 1.81 | 5.37 | 0.73 | 1.27 | 0.038 | <0.001 |
| nitrate | 2 | 17.9 | 8.80 | 0.046 | 1.09 | 0.091 | 0.33 |
| ammonium | 1 | 0.077 | 0.065 | 0.24 | 0.51 | 0.360 | 0.18 |
| chloride | 1 | 3.46 | 0.33 | <0.001 | 1.17 | 0.014 | <0.001 |
| sulphate | 1 | 3.07 | 6.06 | 0.61 | 0.66 | 0.128 | 0.012 |
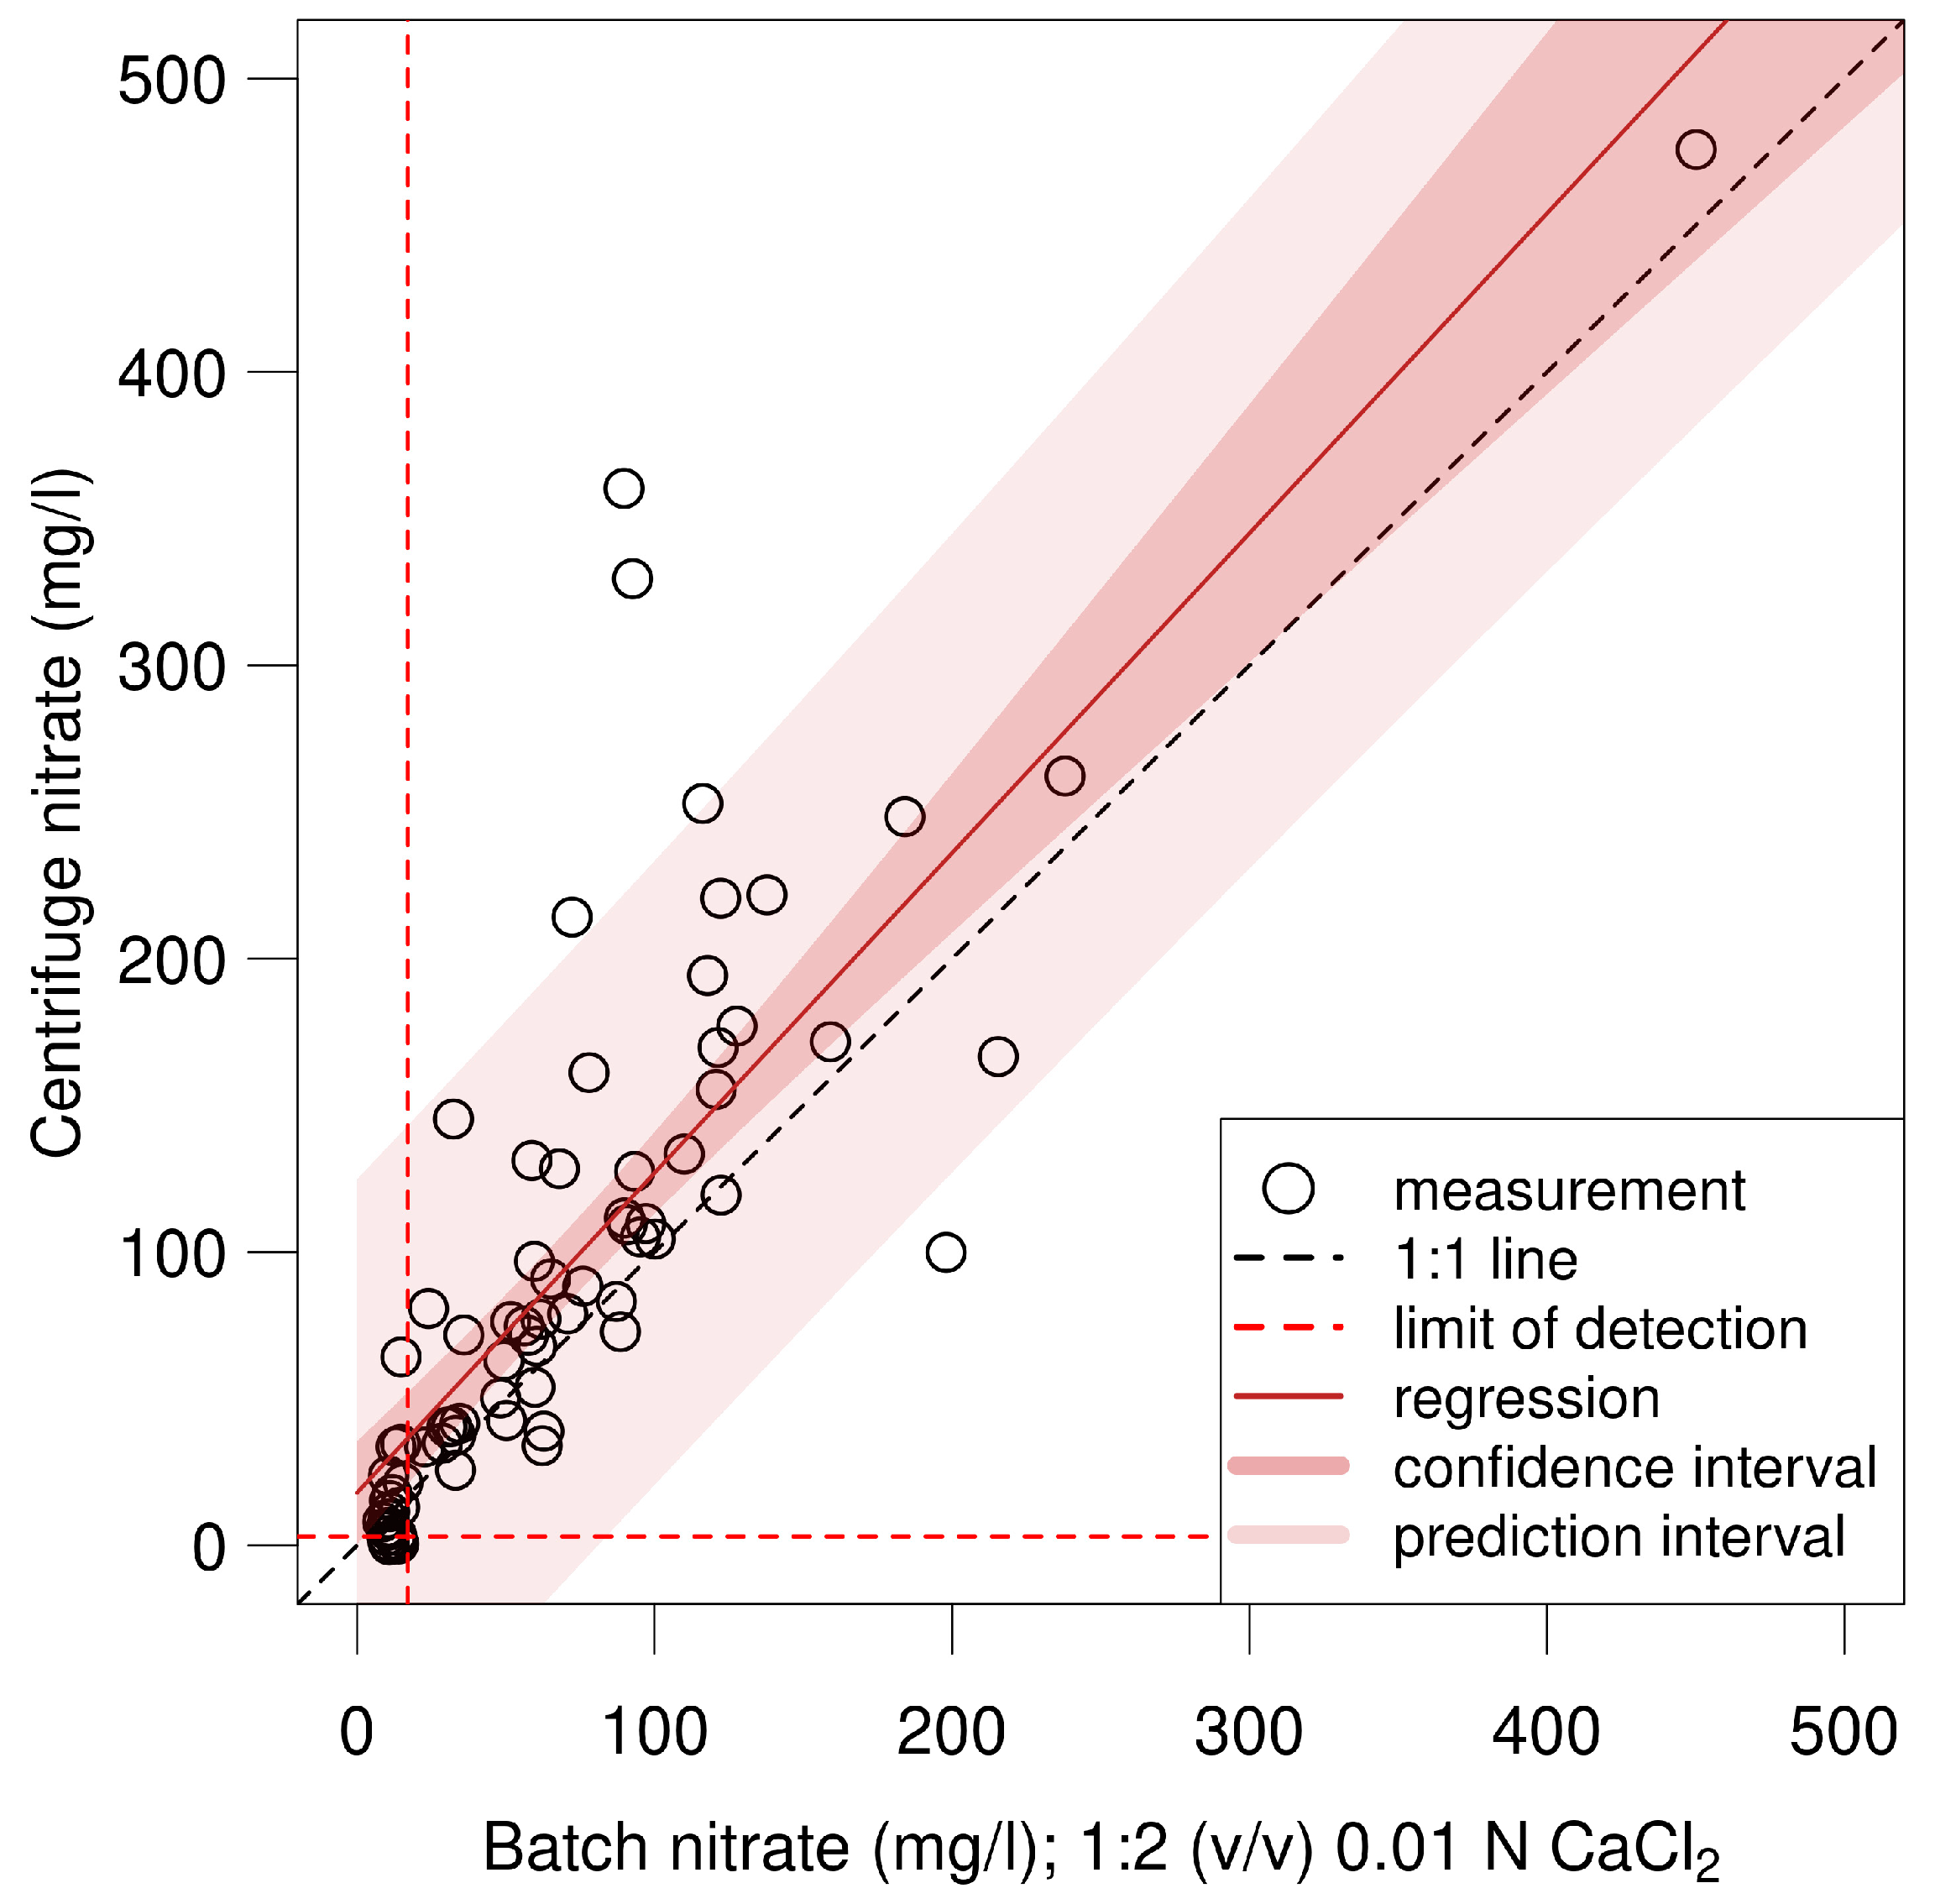
3.2. Experiment 2
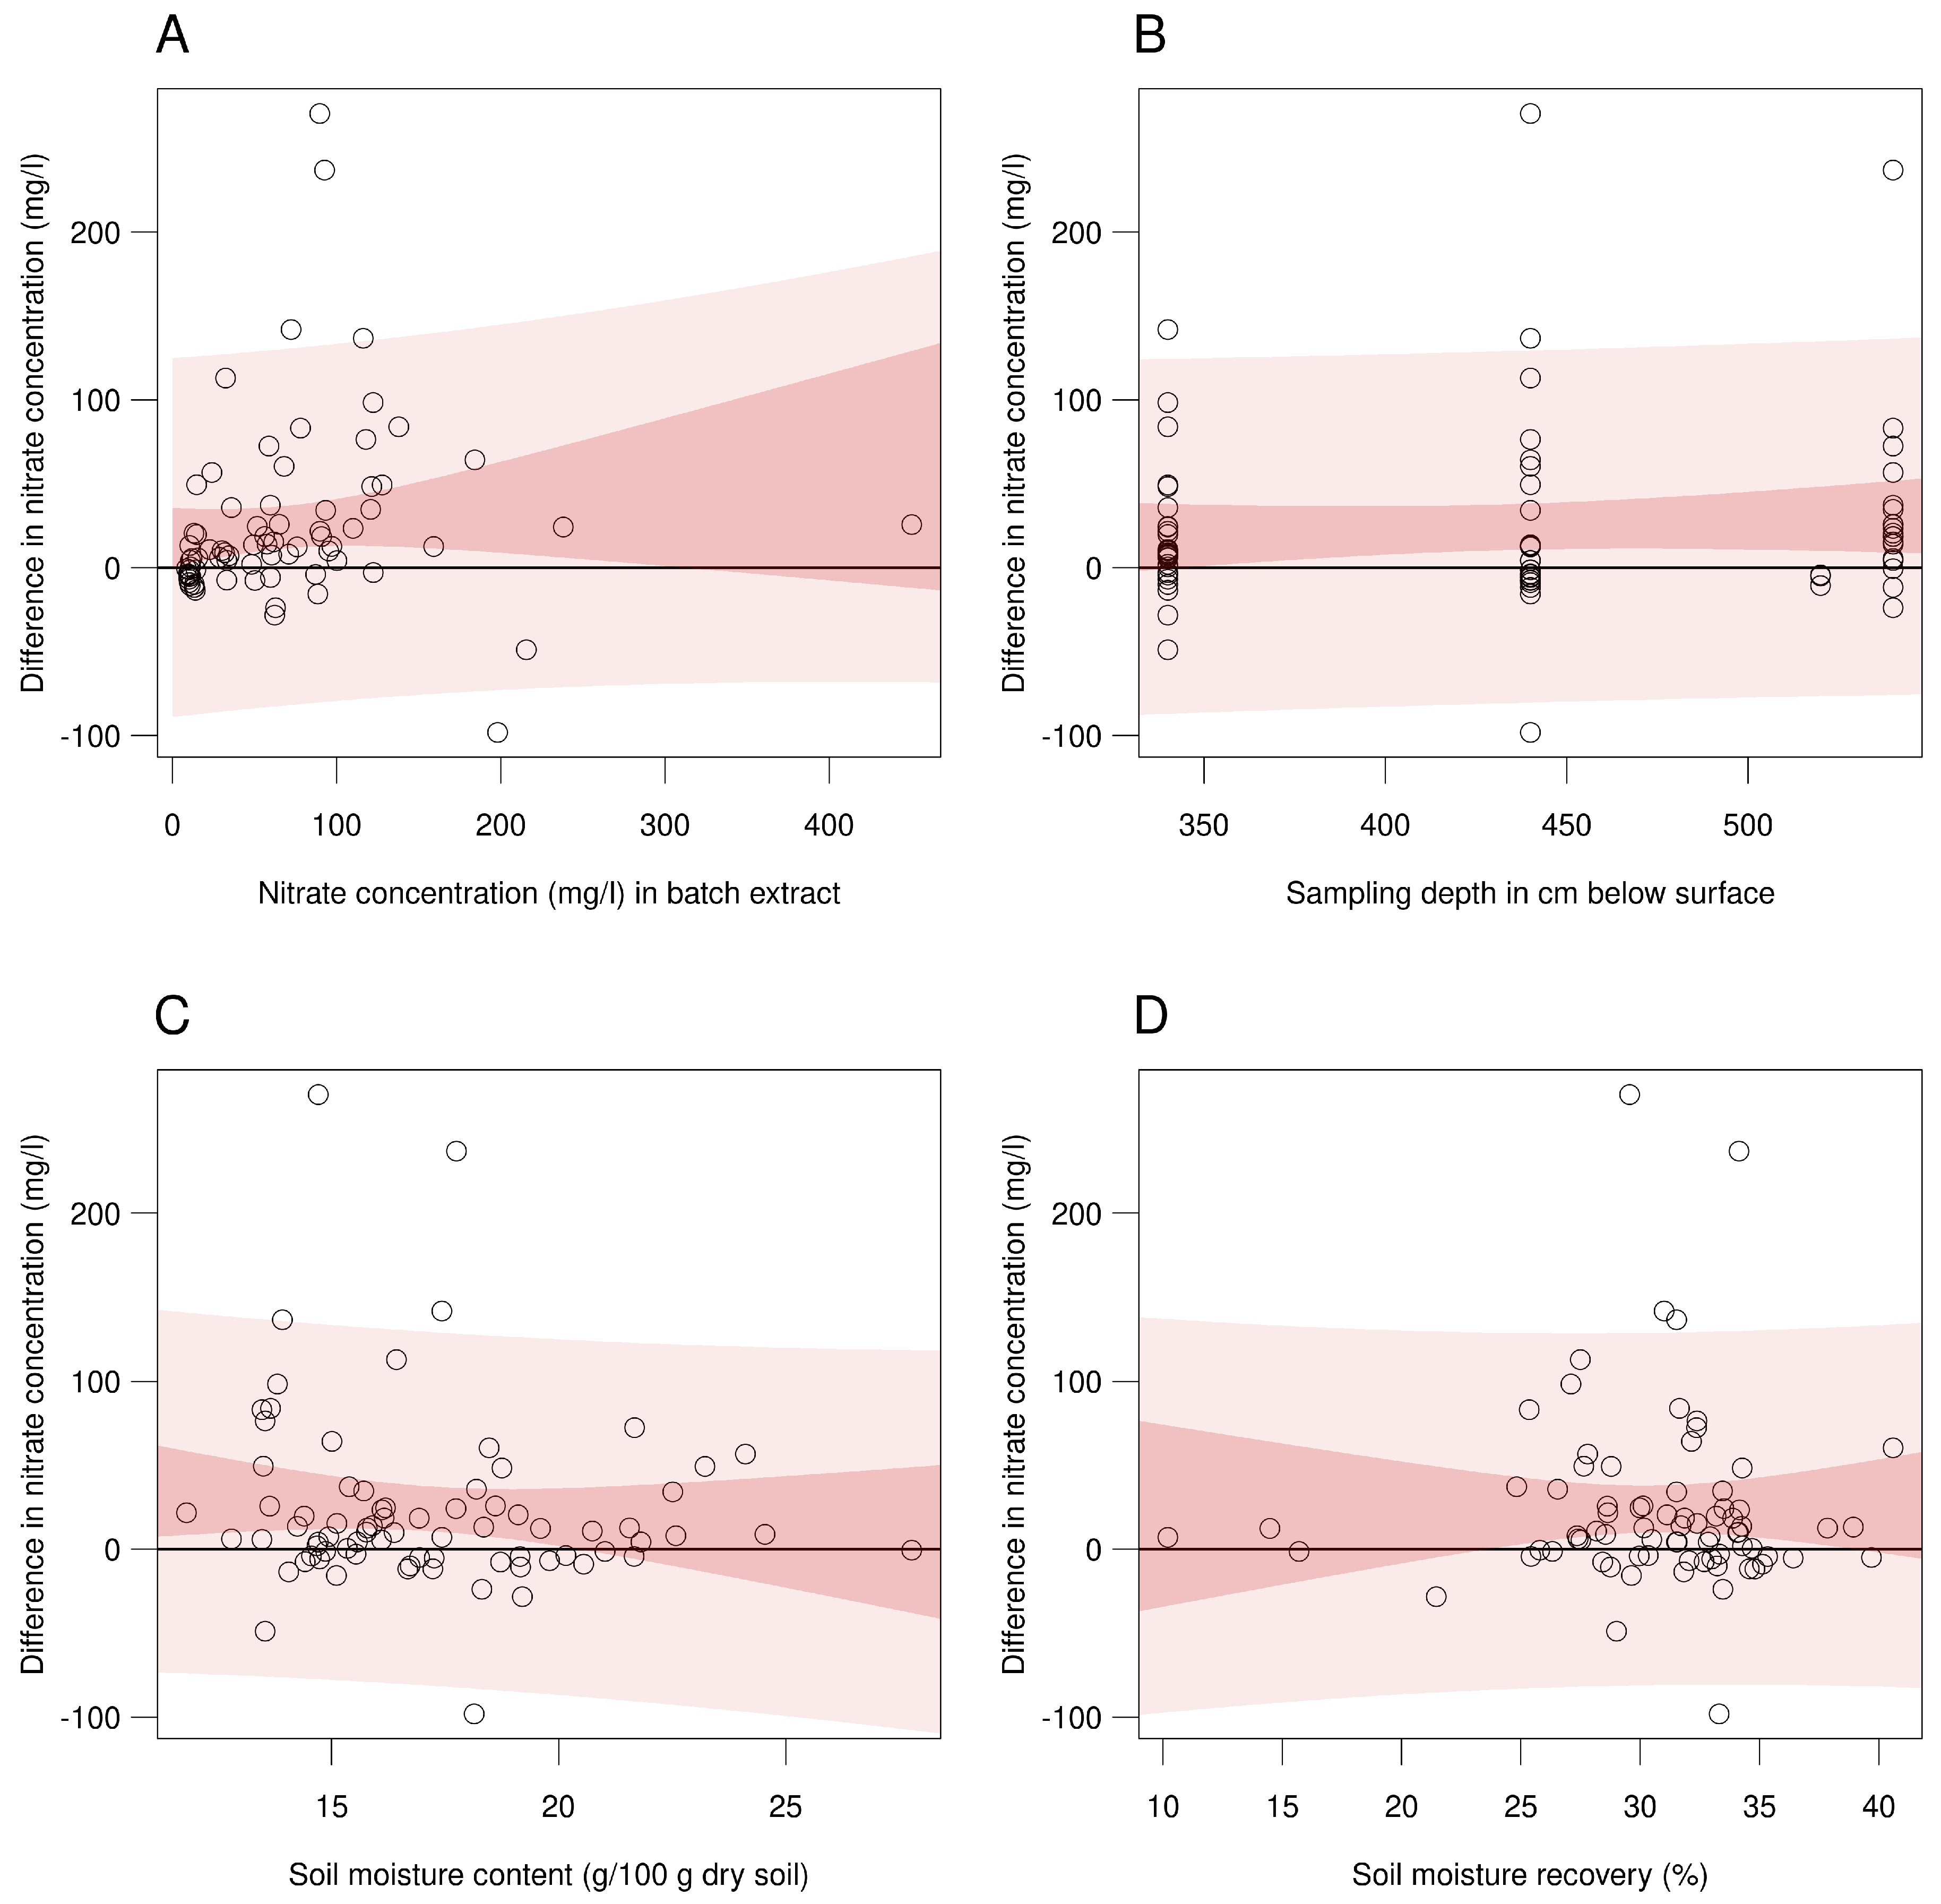
4. Discussion
- Spatial microvariation in nitrate concentration
- Impact of extraction methodology and type of sample
- Estimating nitrate concentration leaching to groundwater
5. Conclusions and Outlook
Author Contributions
Funding
Data Availability Statement
Acknowledgments
Conflicts of Interest
Appendix A


References
- Schulte-Uebbing, L.; De Vries, W. Reconciling food production and environmental boundaries for nitrogen in the European Union. Sci. Total Environ. 2021, 786, 147427. [Google Scholar] [CrossRef]
- Ahmed, M.; Rauf, M.; Mukhtar, Z.; Saeed, N.A. Excessive use of nitrogenous fertilizers: An unawareness causing serious threats to environment and human health. Environ. Sci. Pollut. Res. 2017, 24, 26983–26987. [Google Scholar] [CrossRef] [PubMed]
- Bryan, N.S.; Van Grinsven, H. The Role of Nitrate in Human Health. Adv. Agron. 2013, 119, 153–182. [Google Scholar] [CrossRef]
- United Nations. UN Paris Agreement. 2015. Available online: https://unfccc.int/files/essential_background/convention/application/pdf/english_paris_agreement.pdf (accessed on 22 June 2023).
- EC Farm to Fork Strategy. For a Fair, Healthy and Environmentally-Friendly Food System. European Commission, Brussels. 2020. Available online: https://food.ec.europa.eu/system/files/2020-05/f2f_action-plan_2020_strategy-info_en.pdf (accessed on 22 June 2023).
- Spijker, J.; Fraters, D.; Vrijhoef, A. A machine learning based modelling framework to predict nitrate leaching from agricultural soils across the Netherlands. Environ. Res. Commun. 2021, 3, 45002. [Google Scholar] [CrossRef]
- Di Bonito, M.; Breward, N.; Crout, N.; Smith, B.; Young, S.D.; Zhang, H. Extraction and Characterization of Pore Water in Contaminated Soils. In Environmental Geochemistry: Site Characterization, Data Analysis and Case Histories, 2nd ed.; De Vivo, B., Belkin, H.E., Lima, A., Eds.; Elsevier: Amsterdam, The Netherlands, 2018; Chapter 10; pp. 195–235. [Google Scholar]
- Fares, A.; Deb, S.K.; Fares, S. Review of vadose zone soil solution sampling techniques. Environ. Rev. 2009, 17, 215–234. [Google Scholar] [CrossRef]
- Weihermüller, L.; Siemens, J.; Deurer, M.; Knoblauch, S.; Rupp, H.; Göttlein, A.; Pütz, T. In situ soil water extraction: A review. J. Environ. Qual. 2007, 36, 1735–1748. [Google Scholar] [CrossRef]
- Ramos, C.; Kücke, M. A review of methods for nitrate leaching measurement. Acta Hortic. 2001, 563, 259–266. [Google Scholar] [CrossRef]
- Litaor, M.I. Review of soil solution samplers. Water Resour. Res. 1988, 24, 727–733. [Google Scholar] [CrossRef]
- Ji, W.; Huang, Y.; Li, B.; Li, Z. Identifying multivariate controls of water and nitrate in deep loess deposits under different land use types. J. Hydrol. 2022, 613, 128409. [Google Scholar] [CrossRef]
- Huang, P.; Zhang, J.; Zhu, A.; Li, X.; Ma, D.; Xin, X.; Zhang, C.; Wu, S.; Garland, G.; Pereira, E.I.P. Nitrate accumulation and leaching potential reduced by coupled water and nitrogen management in the Huang-Huai-Hai Plain. Sci. Total Environ. 2018, 610–611, 1020–1028. [Google Scholar] [CrossRef]
- Sprenger, M.; Erhardt, M.; Riedel, M.; Weiler, M. Historical tracking of nitrate in contrasting vineyards using water isotopes and nitrate depth profiles. Agric. Ecosyst. Environ. 2016, 222, 185–192. [Google Scholar] [CrossRef]
- Scanlon, B.R.; Gates, J.B.; Reedy, R.C.; Jackson, W.A.; Bordovsky, J.P. Effects of irrigated agroecosystems: 2. Quality of soil water and groundwater in the southern High Plains, Texas. Water Resour. Res. 2010, 46, W09538. [Google Scholar] [CrossRef] [Green Version]
- Parks, J.M.; Stewart, M.A.; McCartney, J.S. Validation of a centrifuge permeameter for investigation of transient infiltration and drainage flow processes in unsaturated. Geotech. Test. J. 2012, 35, 11. [Google Scholar] [CrossRef]
- Gillman, G.P. A Centrifuge Method for Obtaining Soil Solution; CSIRO report no. 16, 6; Commonwealth Scientific and Industrial Research Organization: Division of Soils: Canberra, Australia, 1976. [CrossRef]
- Moncur, M.C.; Blowes, D.W.; Ptacek, C.J. Pore-water extraction from the unsaturated and saturated zones. Can. J. Earth Sci. 2013, 50, 1051–1058. [Google Scholar] [CrossRef]
- Di Bonito, M. Trace Element in Soil Pore Water—A Comparison of Sampling Methods. Ph.D. Thesis, University of Nottingham, Nottingham, UK, May 2005. Available online: https://eprints.nottingham.ac.uk/10123/1/Marcello_Di_Bonito.pdf (accessed on 22 June 2023).
- Li, K.-Y.; Zhao, Y.-Y.; Yuan, X.-L.; Zhao, H.-B.; Wang, Z.-H.; Li, S.-X.; Malhi, S.S. Comparison of Factors Affecting Soil Nitrate Nitrogen and Ammonium Nitrogen Extraction. Soil Sci. Plant Anal. 2012, 43, 571–588. [Google Scholar] [CrossRef]
- Van Erp, P.J.; Houba, V.J.G.; Van Beusichem, M.L. Effect of drying temperature on amount of nutrient elements extracted with 0.01 M CaCl2 soil extraction procedure. Commun. Soil Sci. Plant Anal. 2001, 32, 33–48. [Google Scholar] [CrossRef]
- Orlowski, N.; Pratt, D.L.; McDonnell, J.J. Intercomparison of soil pore water extraction methods for stable isotope analysis and interpretation of hillslope runoff sources. Hydrol. Process. 2019, 33, 2939–2954. [Google Scholar] [CrossRef] [Green Version]
- Orlowski, N.; Pratt, D.L.; McDonnell, J.J. Intercomparison of soil pore water extraction methods for stable isotope analysis. Hydrol. Process. 2016, 30, 3434–3449. [Google Scholar] [CrossRef] [Green Version]
- Fraters, D.; Boom, G.J.F.L.; Boumans, L.J.M.; De Weerd, H.; Wolters, M. Extraction of soil solution by drainage centrifugation—Effects of centrifugal force and time of centrifugation on soil moisture recovery and solute concentration in soil moisture of loess subsoils. Environ. Monit. Assess. 2017, 189, 83. [Google Scholar] [CrossRef] [Green Version]
- Di Bonito, M.; Breward, N.; Crout, N.; Smith, B.; Young, S. Overview of selected soil pore water extraction methods for the determination of potentially toxic elements in contaminated soils: Operational and technical Aspects. In Environmental Geochemistry: Site Characterisation, Data Analysis and Case Histories, 1st ed.; De Vivo, B., Belkin, H.E., Lima, A., Eds.; Elsevier: London, UK, 2008; pp. 213–249. [Google Scholar] [CrossRef] [Green Version]
- Regelink, I.C.; Koopmans, G.F. Effects of Biostimulants and Fertilization on Nutrient Uptake by Grass and Composition of Soil Pore Water Versus 0.01 M CaCl2 Soil Extracts. Commun. Soil Sci. Plant Anal. 2021, 52, 2516–2532. [Google Scholar] [CrossRef]
- Moon, J.-W.; Paradis, C.J.; Joyner, D.C.; Von Netzer, F.; Majumder, E.L.; Dixon, E.R.; Podar, M.; Ge, X.; Walian, P.J.; Smith, H.J.; et al. Characterization of subsurface media from locations up- and down-gradient of a uranium-contaminated aquifer. Chemosphere 2020, 255, 126951. [Google Scholar] [CrossRef] [PubMed]
- Van den Brink, C.; Hoogendoorn, M.; Verloop, K.; De Vries, A.; Leendertse, P. Effectiveness of voluntary measures to reduce agricultural impact on groundwater as a source for drinking water: Lessons learned from cases in the Dutch provinces Overijssel and Noord-Brabant. Water 2021, 13, 3278. [Google Scholar] [CrossRef]
- Fraters, B.; Hooijboer, A.E.J.; Vrijhoef, A.; Plette, A.C.C.; Van Duijnhoven, N.; Rozemeijer, J.C.; Gosseling, M.; Daatselaar, C.H.G.; Roskam, J.L.; Begeman, H.A.L. Agricultural Practice and Water Quality in the Netherlands: Status (2016–2019) and Trend (1992–2019). Nitrate Report with the Results of the Monitoring of the Effects of the EU Nitrates Directive Action Programmes; RIVM report 2020–0184; National Institute for Public Health and the Environment: Bilthoven, The Netherlands, 2021. [CrossRef]
- Ma, B.; Huang, T.; Li, J.; Li, Z.; Long, Y.; Zhang, F.; Pang, Z. Tracing nitrate source and transformation in a semiarid loess aquifer with the thick unsaturated zone. Catena 2021, 198, 105045. [Google Scholar] [CrossRef]
- Huang, Y.; Evaristo, J.; Li, Z. Multiple tracers reveal different groundwater recharge mechanisms in deep loess deposits. Geoderma 2019, 353, 204–212. [Google Scholar] [CrossRef]
- Gates, J.B.; Scanlon, B.R.; Mu, X.M.; Zhang, L. Impacts of soil conservation on groundwater recharge in the semi-arid Loess Plateau, China. Hydrogeol. J. 2011, 19, 865–875. [Google Scholar] [CrossRef]
- Ma, B.L.; Ying, J.; Balchin, D. Impact of sample preservation methods on the extraction of inorganic nitrogen by potassium chloride. J. Plant Nutr. 2005, 28, 785–796. [Google Scholar] [CrossRef]
- Ros, G.H.; Hoffland, E.; Van Kessel, C.; Temminghoff, E.J.M. Extractable and dissolved soil organic nitrogen—A quantitative assessment. Soil Biol. Biochem. 2009, 41, 1029–1039. [Google Scholar] [CrossRef]
- Darrouzet-Nardi, A.; Weintraub, M.N. Evidence for spatially inaccessible labile N from a comparison of soil core extractions and soil pore water lysimetry. Soil Biol. Biochem. 2014, 73, 22–32. [Google Scholar] [CrossRef]
- Hamidian Shoormasti, N.; Tabatabaei-Nezhad, S.A. A novel mechanistic anion exclusion model to investigate partially water-saturated transport in soils and shales: A case study of nitrate solution flow. Eur. J. Soil Sci. 2022, 73, e13194. [Google Scholar] [CrossRef]
- Allred, B.J.; Brown, G.O.; Martinez, L.R. Laboratory investigation of boundary condition impacts on nitrate anion exclusion in an unsaturated soil. Soil Sci. Soc. Am. J. 2015, 79, 742–756. [Google Scholar] [CrossRef]
- González-Delgado, A.M.; Shukla, M.K. Coupled transport of nitrate and chloride in soil columns. Soil Sci. 2011, 176, 346–355. [Google Scholar] [CrossRef]
- Polubesova, T.; Borisover, M. Two components of chloride anion exclusion volume in montmorillonitic soils. Colloids Surf. A Physicochem. Eng. Asp. 2009, 347, 175–179. [Google Scholar] [CrossRef]
- Smethurst, P.J.; Herbert, A.M.; Ballard, L.M. A paste method for estimating concentrations of ammonium, nitrate, and phosphate in soil solution. Aust. J. Soil Res. 1997, 35, 209–225. [Google Scholar] [CrossRef]
- Lindau, C.W.; Spalding, R.F. Major procedural discrepancies in soil extracted nitrate levels and nitrogen isotopic values. Ground Water 1984, 22, 273–278. [Google Scholar] [CrossRef]
- Herbel, M.J.; Spalding, R.F. Vadose zone fertilizer-derived nitrate and δ15N extracts. Ground Water 1993, 31, 376–382. [Google Scholar] [CrossRef]
- Alves, A.C.; de Souza, E.R.; de Melo, H.F.; Pinto, J.G.O.; de Andrade Rego Junior, F.E.; de Souza Junior, V.S.; Marques, F.A.; do Santos, M.A.; Schaffer, B.; Raj Gheyi, H. Comparison of solution extraction methods for estimating electrical conductivity in soils with contrasting mineralogical assemblages and textures. Catena 2022, 218, 106581. [Google Scholar] [CrossRef]
- Jones, D.L.; Willett, V.B.; Stockdale, E.A.; Macdonald, A.J.; Murphy, D.V. Molecular weight of dissolved organic carbon, nitrogen, and phenolics in grassland soils. Soil Sci. Soc. Am. J. 2012, 76, 142–150. [Google Scholar] [CrossRef]
- Ali, T.; Bylund, D.; Essén, S.A.; Lundström, U.S. Liquid extraction of low molecular mass organic acids and hydroxamate siderophores from boreal forest soil. Soil Biol. Biochem. 2011, 43, 2417–2422. [Google Scholar] [CrossRef]
- Schuwirth, N.; Hofmann, T. Comparability of and alternatives to leaching tests for the assessment of the emission of inorganic soil contamination. J. Soils Sediments 2006, 6, 102–112. [Google Scholar] [CrossRef]
- Strobel, B.W. Influence of vegetation on low-molecular-weight carboxylic acids in soil solution—A review. Geoderma 2001, 99, 169–198. [Google Scholar] [CrossRef]
- Van Dijk, P.M.; Kwaad, F.J.P.M. Runoff generation and soil erosion in small agricultural catchments with loess derived soils. Hydrol. Process. 1996, 10, 1049–1059. [Google Scholar] [CrossRef]
- European Commission. EC Soil Atlas of Europe, European Soil Bureau Network; European Commission, Office for Official Publications of the European Communities: Luxembourg, 2005; p. L-2995. Available online: https://esdac.jrc.ec.europa.eu/content/soil-atlas-europe (accessed on 26 June 2023).
- Annual Average Precipitation, Average Values for 1991–2020. Available online: https://www.knmi.nl/klimaat-viewer/kaarten/neerslag-verdamping/gemiddelde-hoeveelheid-neerslag/jaar/Periode_1991-2020 (accessed on 22 June 2023).
- Houba, V.J.G.; Temminghoff, E.J.M.; Gaikhorst, G.A.; Van Vark, W. Soil analysis procedures using 0.01 M calcium chloride as extraction reagent. Commun. Soil Sci. Plant Anal. 2000, 31, 1299–1396. [Google Scholar] [CrossRef]
- R Core Team. R: A Language and Environment for Statistical Computing; R Foundation for Statistical Computing: Vienna, Austria, 2022; Available online: https://www.R-project.org (accessed on 22 June 2023).
- Wickham, H.; Averick, M.; Bryan, J.; Chang, W.; D’Agostino McGowan, L.; François, R.; Grolemund, G.; Hayes, A.; Henry, L.; Hester, J.; et al. Welcome to the tidyverse. J. Open Source Softw. 2019, 4, 1686. [Google Scholar] [CrossRef] [Green Version]
- Pinheiro, J.; Bates, D. R Core Team Nlme: Linear and Nonlinear Mixed Effects Models, R Package Version 3.1-157. 2022. Available online: https://CRAN.R-project.org/package=nlme (accessed on 22 June 2023).
- Extract Prediction Band from Lme fit. Answered 21 January 2013 at 9:47 (Roland), Edited 8 June 2018 at 15:18 (Hugo). Available online: https://stackoverflow.com/questions/14358811/extract-prediction-band-from-lme-fit (accessed on 8 February 2023).
- Lenth, R. Emmeans: Estimated Marginal Means, Aka Least-Squares Means, R Package Version 1.7.0. 2021. Available online: https://CRAN.R-project.org/package=emmeans (accessed on 22 June 2023).
- Djurhuus, J.; Jacobsen, O.H. Comparison of ceramic suction cups and KCl extraction for the determination of nitrate in soil. Eur. J. Soil Sci. 1995, 46, 387–395. [Google Scholar] [CrossRef]
- Lord, E.I.; Shepherd, M.A. Developments in the use of porous ceramic cups for measuring nitrate leaching. Eur. J. Soil Sci. 1993, 44, 435–449. [Google Scholar] [CrossRef]
- Ranger, J.; Marques, R.; Jussy, J.-H. Forest soil dynamics during stand development assessed by lysimeter and centrifuge solutions. For. Ecol. Manag. 2001, 144, 129–145. [Google Scholar] [CrossRef]
- Funk, R.; Maidl, F.-X.; Fischbeck, G. Nitratabbau in tieferen bodenschichten süddeutscher ackerstandorte auf löß|Denitrification in deeper soil layers of arable land in southern Germany. Z. Fur Pflanzenernahr. Und Bodenkd. 1996, 159, 207–213. [Google Scholar] [CrossRef]
- Wang, Y.; Ji, H.; Wang, R.; Hu, Y.; Guo, S. Synthetic Fertilizer Increases Denitrifier Abundance and Depletes Subsoil Total N in a Long-Term Fertilization Experiment. Front. Microbiol. 2020, 11, 2026. [Google Scholar] [CrossRef]
- Müller, C.; Clough, T.J. Advances in understanding nitrogen flows and transformations: Gaps and research pathways. J. Agric. Sci. 2014, 152, S34–S44. [Google Scholar] [CrossRef]
- Rohe, L.; Apelt, B.; Vogel, H.J.; Well, R.; Wu, G.-M.; Schlüter, S. Denitrification in soil as a function of oxygen availability at the microscale. Biogeosciences 2021, 18, 64, 1185–1201. [Google Scholar] [CrossRef]
- Gvirtzman, H.; Ronen, D.; Magaritz, M. Anion exclusion during transport through the unsaturated zone. J. Hydrol. 1986, 87, 267–283. [Google Scholar] [CrossRef]
- Gvirtzman, H.; Gorelick, S.M. Dispersion and advection in unsaturated porous media enhanced by anion exclusion. Nature 1991, 352, 793–795. [Google Scholar] [CrossRef]
- Heinrichs, H.; Böttcher, G.; Brumsack, H.-J.; Pohlmann, M. Squeezed soil-pore solutes—A comparison to lysimeter samples and percolation experiments. Water Air Soil Pollut. 1996, 89, 189–204. [Google Scholar] [CrossRef]
- Long, Y.; Huang, T.; Zhang, F.; Li, Z.; Ma, B.; Li, Y.; Pang, Z. Origin of sulphate in the unsaturated zone and groundwater of a loess aquifer. Hydrol. Process. 2021, 35, e14166. [Google Scholar] [CrossRef]
- Bibiso, M.; Tadesse, A.; Assefa, M. Evaluation of Three Universal Extractants for the Determination of P, NO3 and K in Some Soils of Ethiopia. Adv. Life Sci. Technol. 2012, 6, 16–24. [Google Scholar]
- Hamdi, W.; Gamaoun, F.; Pelster, D.E.; Seffen, M. Nitrate sorption in an agricultural soil profile. Appl. Environ. Soil Sci. 2013, 2013, 597824. [Google Scholar] [CrossRef] [Green Version]
- Webster, C.P.; Shepherd, M.A.; Goulding, K.W.T.; Lord, E. Comparisons of methods for measuring the leaching of mineral nitrogen from arable land. Eur. J. Soil Sci. 1993, 44, 49–62. [Google Scholar] [CrossRef]
- Boumans, L.J.M.; Fraters, D.; Van Drecht, G. Nitrate leaching in agriculture to upper groundwater in the sandy regions of the Netherlands during the 1992–1995 period. Environ. Monit. Assess. 2005, 102, 225–241. [Google Scholar] [CrossRef] [PubMed]
- Fraters, B.; Boumans, L.J.M.; Van Leeuwen, T.C.; De Hoop, W.D. Monitoring nitrogen leaching for the evaluation of the Dutch minerals policy for agriculture in clay regions. Sci. World J. 2001, 1, 758–766. [Google Scholar] [CrossRef] [Green Version]


| Parameter | Centrifugation | Batch | Difference | t-Value | ||
|---|---|---|---|---|---|---|
| mg/L | % < LoD | mg/L | % < LoD | |||
| Nitrate | 90.5 (120) | 0 | 66.8 (86.6) | 30 | 24.0 (34.0) | 3.49 (4.13) |
| Ammonium | 0.13 | 0 | <2.7 | 100 | - | - |
Disclaimer/Publisher’s Note: The statements, opinions and data contained in all publications are solely those of the individual author(s) and contributor(s) and not of MDPI and/or the editor(s). MDPI and/or the editor(s) disclaim responsibility for any injury to people or property resulting from any ideas, methods, instructions or products referred to in the content. |
© 2023 by the authors. Licensee MDPI, Basel, Switzerland. This article is an open access article distributed under the terms and conditions of the Creative Commons Attribution (CC BY) license (https://creativecommons.org/licenses/by/4.0/).
Share and Cite
Fraters, D.; Ros, G.H.; Brussée, T. Measuring Nitrate Leaching in the Vadose Zone of Loess Soils—Comparison of Batch Extraction and Centrifugation. Water 2023, 15, 2709. https://doi.org/10.3390/w15152709
Fraters D, Ros GH, Brussée T. Measuring Nitrate Leaching in the Vadose Zone of Loess Soils—Comparison of Batch Extraction and Centrifugation. Water. 2023; 15(15):2709. https://doi.org/10.3390/w15152709
Chicago/Turabian StyleFraters, Dico, Gerard H. Ros, and Timo Brussée. 2023. "Measuring Nitrate Leaching in the Vadose Zone of Loess Soils—Comparison of Batch Extraction and Centrifugation" Water 15, no. 15: 2709. https://doi.org/10.3390/w15152709
APA StyleFraters, D., Ros, G. H., & Brussée, T. (2023). Measuring Nitrate Leaching in the Vadose Zone of Loess Soils—Comparison of Batch Extraction and Centrifugation. Water, 15(15), 2709. https://doi.org/10.3390/w15152709