Article

Assemblage Patterns of Microalgae along the Upstream to Downstream Gradient of the Okavango Delta: Abundance, Taxonomic Diversity, and Functional Diversity

1
Environmental Change Research Center, University College London, London WC1E 6BT, UK
2
Institute of Environment, Florida International University, Miami, FL 33199, USA
3
Botswana International University of Science and Technology, Palapye 10071, Botswana
*
Author to whom correspondence should be addressed.
Water 2023, 15(15), 2692; https://doi.org/10.3390/w15152692
Submission received: 7 April 2023 / Revised: 19 June 2023 / Accepted: 20 June 2023 / Published: 26 July 2023

Abstract

:
This study addresses the gap in understanding the diversity, species, and functional trait distribution of different algal groups that occur in the Okavango Delta (a near-pristine subtropical wetland in northwestern Botswana) across hydrological and habitat gradients. We systematically characterize the delta’s algal flora, addressing the gap left by previous research that was limited to single algal groups (e.g., diatoms) and/or only looking at upstream areas in the Okavango River basin. We analyzed 130 algal samples from 49 upstream and downstream sites with higher and lower flooding frequency, respectively, across a river-to-floodplain habitat gradient. Chlorophyta and Bacillariophyta dominated both abundance and taxon richness (>80%) of the total 494 taxa found from 49,158 algal units counted (cells, colonies, coenobia, and filaments). Smaller algae were more abundant in downstream floodplains than in upstream channels and lagoons. Motile and siliceous algae were much more abundant than non-motile, nitrogen fixing, and phagotrophic algae. The frequency of these traits was associated more with flooding frequency than habitat type. The highest algal richness and diversity were found downstream, where shallow floodplain ecosystems with seasonally fluctuating water depths offer greater habitat heterogeneity, and macronutrients are resuspended. The increasing threats from upstream water abstraction plans, fracking, and climate change require enhanced protection and monitoring of the Okavango Delta’s natural annual flood-pulse to maintain the high species and functional diversity of this unique wetland’s microalgae.

1. Introduction

Flood-pulsed wetlands globally occupy between 12 and 17 million km2 [1,2] and are characterized by the annual predictable flooding of lateral floodplain habitats [3]. These aquatic ecosystems provide a range of ecosystem services, from food, fiber, and clean water to nutrient cycling and flood control [4] and are common in large tropical rivers in Africa, Southeast Asia, and South America [5]. Flood-pulsed wetlands are threatened by water abstraction and diversion, habitat loss and fragmentation, pollution and eutrophication, species invasions, and climate change, especially in the subtropics (i.e., in SE Asia and Sahelian Africa) [5,6,7,8]). In these ecosystems, living organisms evolved morphological, phenological, physiological, and behavioral adaptations to cope with drier or wetter seasons and/or years [9]. Functional traits, such as size, deformations, and metabolic pathways, are often indicative of the level of environmental stress to biota [10,11,12]. In tropical and subtropical regions, species diversity is particularly high because high speciation rates produce many endemic species [13], for example, trees and invertebrates in floodplains in Amazonia [14].
The Okavango Delta is a near-pristine, flood-pulsed wetland experiencing different levels of desiccation (and hence salinity stress) along the upstream-downstream axis. Its upstream habitats generally have longer hydroperiods and lower conductivity, whereas downstream habitats exhibit shorter hydroperiods and greater salinity [15,16]. This hydrological gradient is also exhibited laterally in downstream zones of the delta, where areas further away from the main channel are inundated for shorter time periods and have higher conductivity levels than the main channel [15,17].
While the delta is relatively pristine [18] it faces multiple threats that necessitate describing diversity patterns of its biota against which future changes can be assessed. Presently, water quality across the delta meets World Health Organization criteria for solutes [19], but the Thamalakane River outflow faces potential nitrogen and organic matter pollution due to discharges from vegetable fields, pit latrines, and livestock [20]. In the future, water quantity and quality may also be affected by upstream water abstraction and diversion for agriculture and hydroelectric power production, pollution from pesticide and fertilizer use [7,21,22,23], and from mining operations [24], and tourism [25]. Water demand is likely to increase both from increased population pressure in Ngamiland region (from 149,755 in 2011 to 193,725 in 2022 [26]) and because of increasing population in upstream areas [7,21,22] caused by improved economic and social conditions in the recently politically stabilized Angola, where 76% of the river basin’s population lives [27]. Climate change may also lead to higher temperatures and increases in extreme droughts and floods in Southern Africa [28], which would affect fisheries and flood-recession agriculture in the delta [29]. Above 2 °C, the frequency and duration of meteorological drought are projected to double over North Africa, the western Sahel, and southern Africa (medium confidence) [30].
Studying ecosystems in near-pristine ecosystems is critical to understanding their structure and function. Baseline information is particularly scarce on microscopic organisms at the base of their food webs, such as algae. In aquatic ecosystems, including wetlands, microalgae (hereafter algae) are particularly important for primary production and other ecosystem services, such as food and habitat provision to consumers, water purification, and nutrient cycling [31]. While aquatic macrophytes, leaf litter, and other organic matter provide biomass to aquatic organisms through the ‘dead-end’ microbial loop, algae (especially benthic ones) often contribute more to the biomass of aquatic consumers because of their greater digestibility [32,33,34], with higher contributions of algae to amino acids and fatty acids in consumers than terrestrial input, such as litter [35].
Algae are used as early warning signals of environmental change [36,37,38] because of their rapid generation times and variations in species distribution, diversity, and biomass, often in relation to changes in water quantity and quality. Algal species diversity and distribution are influenced by abiotic and biotic factors. Abiotic factors include hydrology (e.g., water depth), dissolved oxygen (DO), water temperature, light, conductivity, pH, turbidity, macro- and micro-nutrients (e.g., nitrogen, phosphorus, silica, and various cations and anions) [39], and habitat size, diversity, and connectivity [11,12]. Biotic factors include algal species’ dispersal ability [40,41,42] as well as competition, predation, and immigration rates [43].
In the Okavango River basin, previous studies mostly focused on single algal groups, such as diatoms, and/or focused on upstream areas in this basin. Cholnoky [44] analyzed diatom species distribution and richness in upstream and downstream areas of the delta. Grönblad and Croasdale [45] and Coesel and van Geest [46,47] focused on desmids (i.e., Chlorophyta in the Mesotaeniaceae family [48]) at the Namibia-Botswana border (~150 km upstream of the delta) and in the delta, respectively. As part of a geographically limited study largely focused on water chemistry, Cronberg and colleagues [17] investigated the species distribution, richness, and biomass of all algae in the seasonally flooded areas of the Jay/Boro region. Three studies have more recently addressed the drivers of diatom community structure but giving little attention to patterns in functional traits. Davidson and colleagues [49] found that diatom richness was controlled by spatial and temporal hydrological variations and conductivity, and Mackay and colleagues [16] found that diatom species distribution was determined by hydrological variability, but also nutrients, including total nitrogen and silica. Marazzi and colleagues (2017) [50] found that algal species richness increased, to an extent, with higher total phosphorus concentrations in the delta, which increases when the annual flood mobilizes nutrients accumulated in the sediment.
Although these studies have addressed questions on all algae or diatom distribution and ecology in the delta, questions remain regarding the overall species and taxon richness of algae in this wetland, as compared to other subtropical wetlands, and on the relative frequency of algal traits across regions and sites with different flood frequency and habitat types. This work addresses this gap by providing a multiannual study of the algal abundance, richness, and diversity across the upstream-downstream and hydrological gradients of the Okavango Delta.
While growth form traits (guilds) have previously been characterized for diatoms only in the delta [16], little is known about how these functional traits may (i) influence algal species performance in general, and (ii) mediate their growth, sedimentation, grazing losses, and nutrient acquisition [51]. For diatoms and other algae, functional traits are commonly associated with resource availability (e.g., light and nutrients) and disturbance [52,53]. In this study, we looked at representative morphological, behavioral, and physiological traits of the algae: Cell size, motility, and capability to fix nitrogen [54]. The Okavango Delta is an understudied, remote wetland, and algal traits (structural, morphological, and metabolic ones) have been shown to be important for ecosystem structure and functioning [55]. Therefore, our results can start filling a knowledge gap about algal trait distribution patterns in Southern Africa and stimulate (more) similar work in other subtropical wetlands.
We provide the first comprehensive baseline assessment of the diversity and species distribution of all algae in this wetland across geographical, hydrological, and habitat gradients. To achieve this aim, we undertook the following objectives: (1) Systematically characterize the delta’s algal phyla, genera, and species, and key traits across hydrological and habitat gradients, (2) assess patterns and drivers of algal species richness, diversity, and relative abundance in relation to space (i.e., delta regions), time (i.e., seasons/flooding phases), hydrological conditions (long-term average flooding frequency), and habitat types.

2. Methods

2.1. Study Region

Located in the semiarid Kalahari Basin, the delta provides water and food for wildlife and for almost 200,000 people living in the North-West District of Botswana [26], many of whom rely on subsistence fisheries and agriculture for their livelihoods [56]. The Okavango Delta is a subtropical, flood-pulsed alluvial fan in northwestern Botswana. It is the world’s second-largest inland delta, with the alluvial fan created by sediment deposition in the northern part of the Kalahari Basin. The Okavango Delta is the world’s largest Ramsar-protected Wetland of International Importance [57] 2023 and has also been designated as a UNESCO World Heritage Site because of its (i) complex climatic, geomorphological, hydrological, and biological processes, (ii) unique mosaic of habitats that greatly change between dry and wet season, and (iii) remarkable species diversity (e.g., 1,061 species of plants and 482 of birds) [58]. The main source of water for the delta are the seasonal floods from the Okavango River, which has its catchments in the Angolan Highlands. Upon entering Botswana, the floods flow into a relatively flat plain constrained by geological faults and mostly characterized by permanent swamps (upper and lower Panhandle regions—UPH and LPH; Figure 1).
Precipitation in November in the Angolan highlands feeds an annual flood pulse that takes ~6 months to reach the delta in April/May, supplemented by local summer rainfalls [60]. The main river channels in the delta flow eastbound into large, flooded lagoons, such as Xakanaxa (XAK), and southbound, into seasonally and occasionally inundated floodplains in the Jao-Boro River system (BOR) and into the Santantadibe (SAN) region (Figure 1). Mean annual rainfall in the delta is ~500 mm and takes place mainly between December and February, 98% of the water is lost through evaporation (c. 74%) and transpiration (c. 24%) processes. The remaining 2% of water flows into the Thamalakane River and forms Lake Ngami [22] which is currently experiencing a wet phase that started in the late 2000s and is linked to considerable multi-annual fluctuations of inflows and outflows [61].

2.2. Sampling Protocols

To capture variations in algal abundance and richness/diversity across regions, hydrological gradients (e.g., flooding frequency), and habitat types, we undertook two field campaigns as part of two connected projects. Campaign (1) focused on diatom algae [16,62] and invertebrates [49], and Campaign (2) focused on all groups of algae [59] and zooplankton [63,64]. We report on 130 algal samples from 49 sites in the five study regions (Table 1 and Figure 1; see Table S1). In Campaign 1, we collected 61 samples from 41 sites using 1.5-L PVC bottles filled at ~30 cm below the water surface in three periods: September 2006 (flood recession), April/May 2007 (flood expansion), and July/August 2007 (high water; [16]). In Campaign 2, we focused on the floodplain environments with high algal diversity [16,17]). We took 69 samples in eight seasonally flooded and occasionally flooded sites in the distal Boro and Santantadibe regions by collecting a ~300 mL subsample with a bottle from a 20-L bucket filled by pushing a plexiglass tube multiple times through the macrophytes or water column in four hydroperiods: May 2009 (flood expansion), July/August 2009 (high water), October 2009 (flood recession), and February 2010 (low water) [63,64]. These methods allowed us to sample planktonic algae as well as benthic algae, especially in shallow sites, and algae that may both have a planktonic and a benthic habit (e.g., those resuspended from the sediments by currents or winds). We preserved all the samples in Lugol’s iodine solution and stored them in a refrigerator. This solution was prepared using 100 g I, 200 g KI, 200 mL glacial acetic acid, and 2000 mL of distilled water [65].

2.3. Algal Analyses

Prior to microscopy, we resuspended algae by shaking the tubes for 2 min, filled 5-, 10-, or 15-mL sedimentation chambers (depending on cell density), and let algal cells settle for at least 8 to 12 h to obtain a random distribution of the algal units (i.e., cells, coenobia, colonies, and filaments [66]. To ensure accurate identifications, algae were identified at species (or even variety), genera, or broader categories (e.g., family, class, or phylum, depending on how visible diagnostic features were. We use taxon richness as the number of the total taxonomic units identified (e.g., three species, four genera, and two families yield a taxon richness of nine taxa) in a sample. The identification and counting of at least 400 algal units were done by scanning the chamber in random fields of view under an inverted microscope [67] at 100× and 400× magnification. To identify algae, we used the following references [17,44,46,47,48,68,69,70,71,72,73,74,75,76,77,78], alongside websites, such as algaebase.org (accessed on 18 September 2013), desmids.nl (accessed on 18 September 2013), http://protist.i.hosei.ac.jp (accessed on 18 September 2013), and https://diatoms.org (accessed on 18 September 2013). To classify the taxa identified (species, genera, phyla) as planktonic, benthic, or planktonic/benthic (for taxa that are not always planktonic or benthic, e.g., tychoplankton resuspended from sediments), we used [18]).

2.4. Algal Traits

We classified the algae found in our samples according to three general traits, consistent with [48,79,80], including: (i) Cell length (the most frequent Greatest Axial Linear Dimension; [10]): <25 μm, 25–50 μm, and >50 μm, (ii) motility or lack of it, and (iii) metabolism: Nitrogen fixation, phagotrophy, and siliceous exoskeleton. Algae can move by means of one or more flagella, a raphe, or other movement types (e.g., some Oscillatoriales whose filaments slide to reorient the cells to a light source). Nitrogen-fixing algae can fix N2 from the atmosphere using specialized organelles called heterocysts (e.g., Nostocales) or cyanobacterial N2-fixing endosymbiont organelles (e.g., some diatom taxa), phagotrophic algae may ingest living or dead particles to assimilate additional nutrients to those produced by photosynthesis and tend to have flagella (e.g., Cryptophyta and Euglenophyta), siliceous algae are those that need silica for their exoskeleton and include Bacillariophyta and some Chrysophyta. We classified all algae observed into size and motility classes, and ~50% with one of the metabolic traits.

2.5. Statistical Analyses

To compare algal species richness, diversity and abundance across the delta’s regions, flood class (permanently, seasonally, and occasionally flooded, hereafter, PF, SF, OF), flood class, habitat types, and seasons, we applied the one-Way ANOVA (O.W.A.) test and the Tukey HSD Honest Significant Difference post-hoc test on normally distributed variables with homogenous variances, and the Kruskal–Wallis and post-hoc Nemenyi tests on variables with other distributions. Trait abundance patterns are only presented across regions, flood class, and habitat types, as insufficient information was available in the literature to draw meaningful comparisons of overall trait abundance patterns across seasons with other subtropical wetlands. To assess the normality and homogeneity of variance of the variables of interest, we employed the Shapiro–Wilk and Levene’s tests, respectively (significance threshold set at p = 0.01). We conducted these analyses in SPSS®, apart from the Nemenyi test, for which we used the R package PMCMR [81]).

3. Results

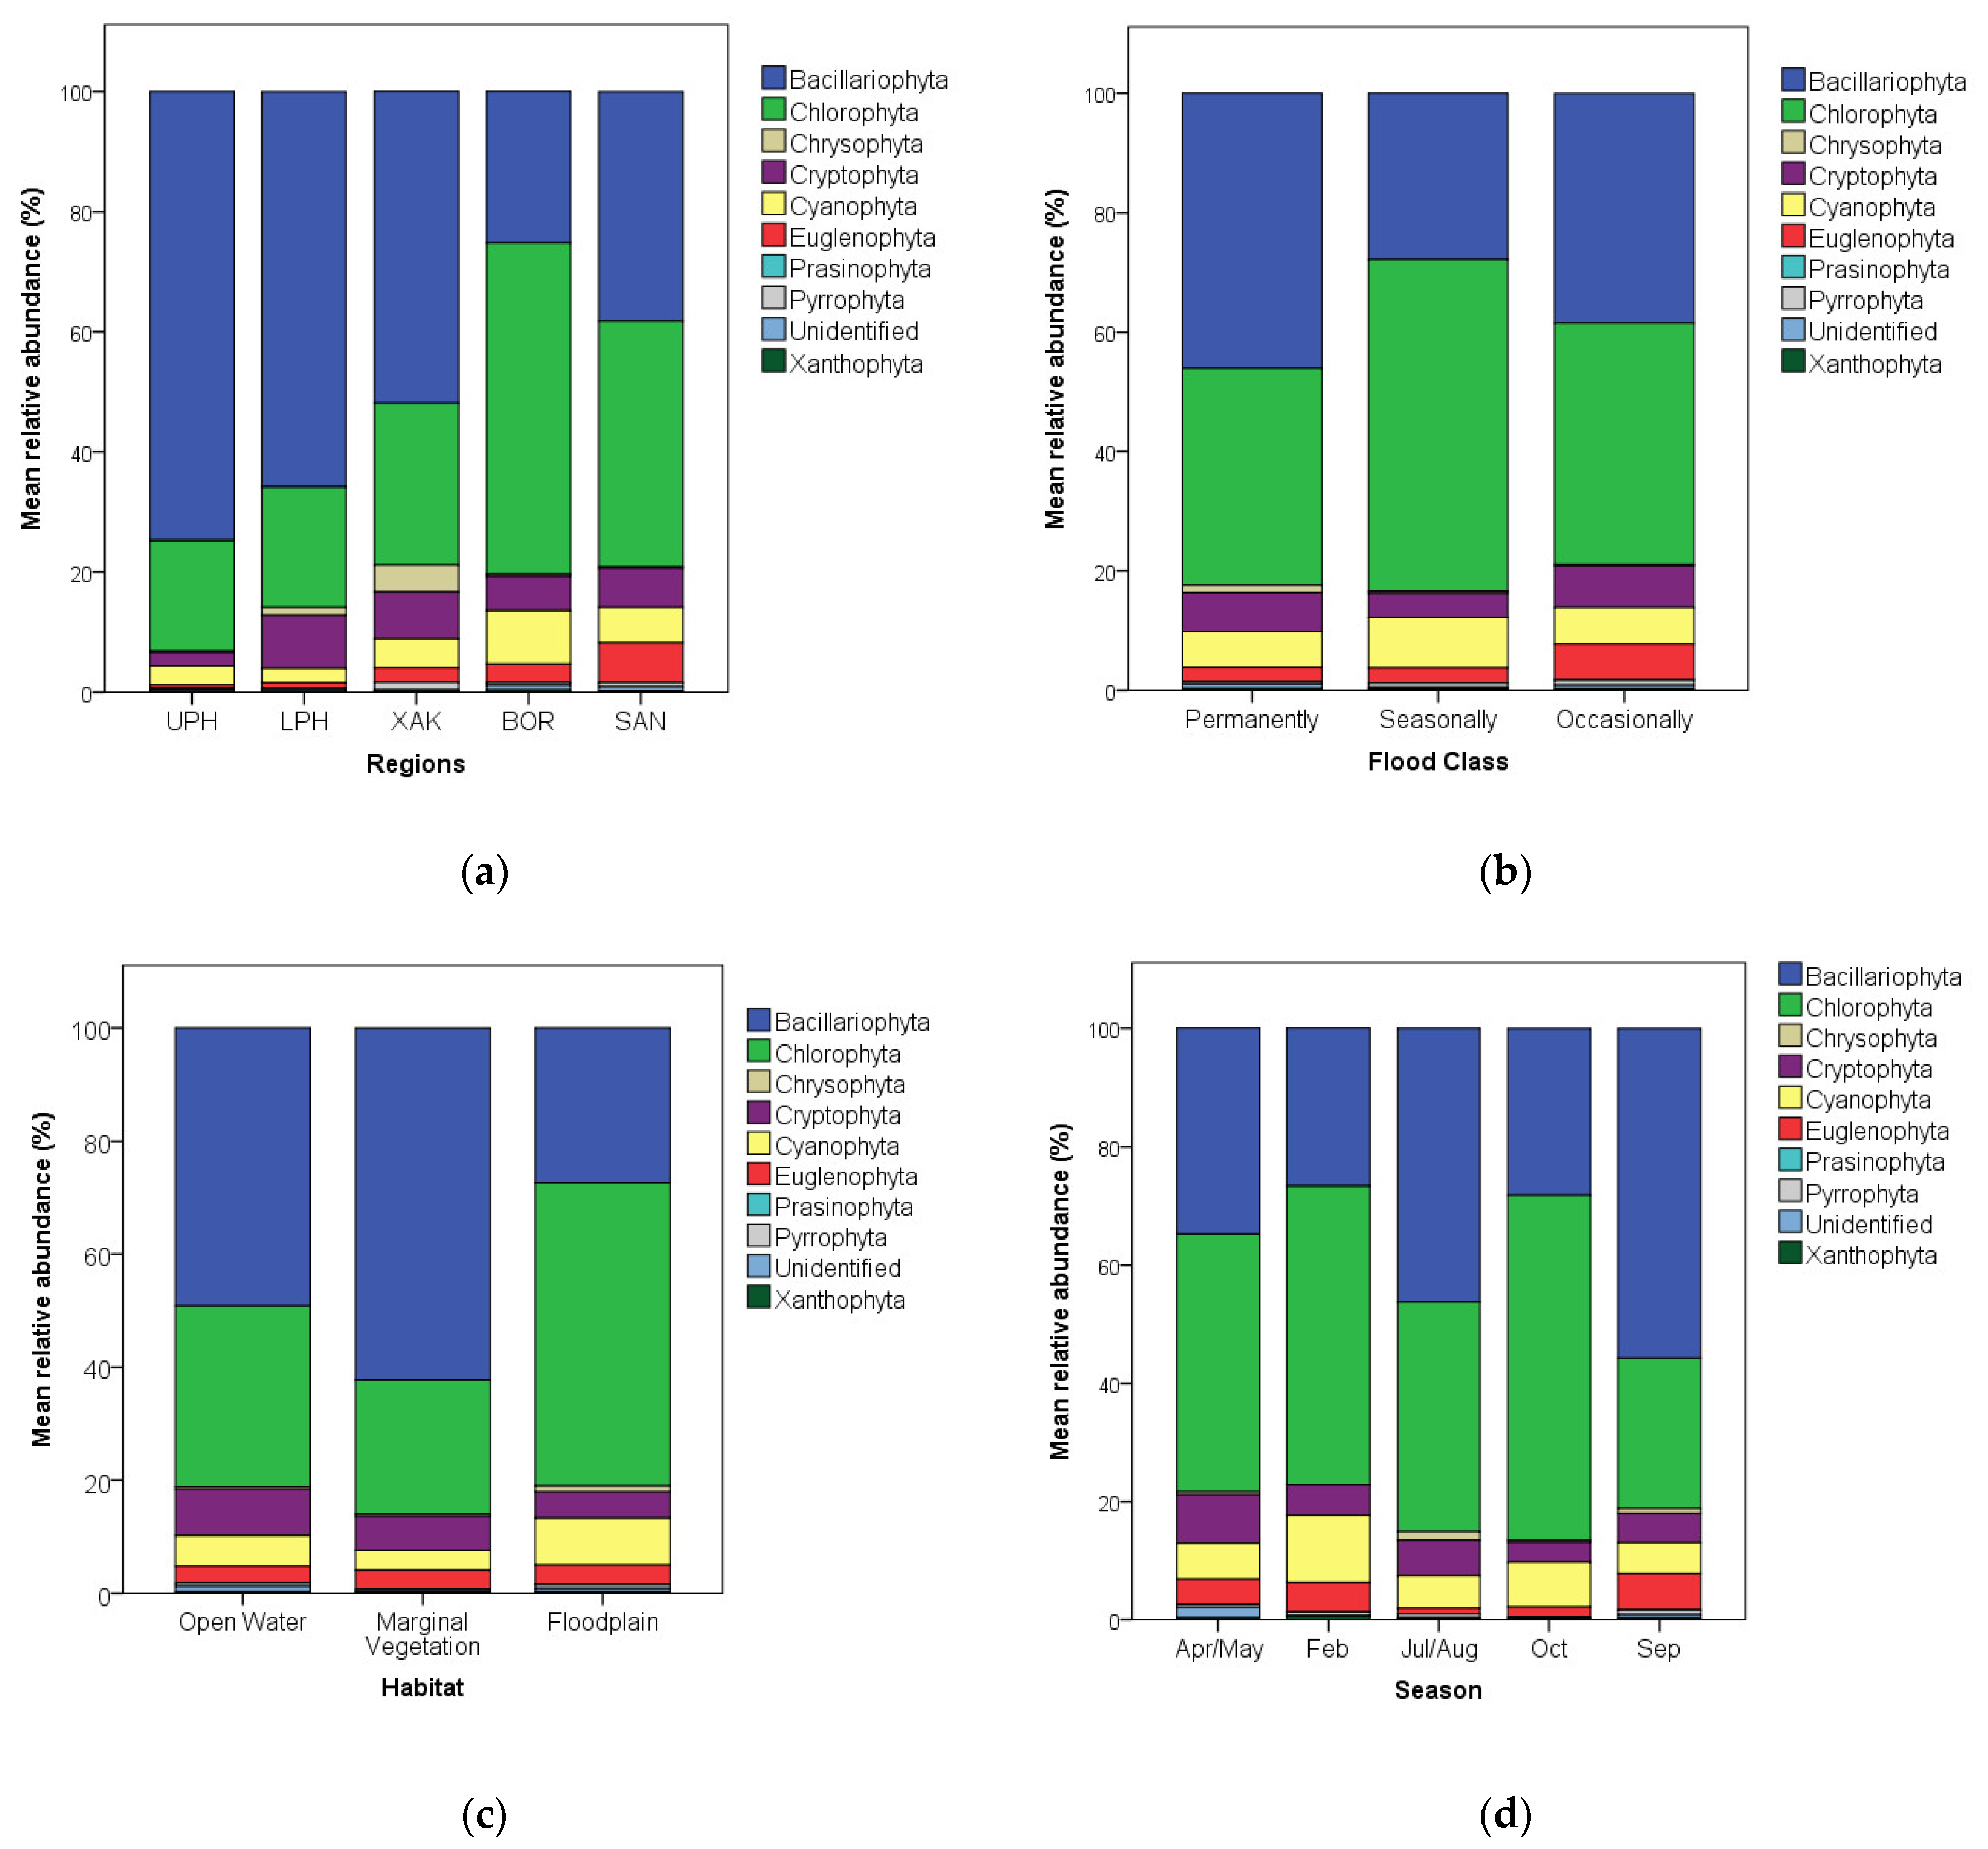
3.1. Algal Relative Abundance Patterns

In all samples, Bacillariophyta (diatoms) comprised 42.4% of the total algal units counted (cells, colonies, coenobia, and filaments), Chlorophyta (green algae) 39.4%, Cyanophyta 6.7%, Cryptophyta 6.0%, Euglenophyta 3.3%, Chrysophyta 0.8%, Pyrrophyta 0.6%, Xanthophyta 0.3%, and other algae or unidentified specimens 0.6%. Out of the 41 algal taxa with mean relative abundance >0.5%, the four most abundant taxa were Eunotia sp. (Bacillariophyta), Mougeotia sp. (Chlorophyta), the Pennate Diatom group (Bacillariophyta), and Cosmarium sp. (Chlorophyta), each with >2000 algal units in 130 samples. Among the other 37 taxa with relative abundance >0.5%, 14 were Chlorophyta, 13 Bacillariophyta, five Cyanophyta, two Cryptophyta, two Euglenophyta, and one was Chrysophyta. These 41 taxa (26 species, 11 genera, and four other groups) comprise ~77% of all the algal units observed and occurred, on average, in 90 samples (17 taxa were found in >100 samples) (Table 2).
The mean relative abundance (hereafter abundance) by phylum varied significantly across regions, flood classes, and habitats (Figure 2). When considering regions of the delta, the most abundant group/phylum of upper (UPH) and lower (LPH) Panhandle regions and Xakanaka region was Bacillariophyta. Bacillariophyta were thus more abundant in the permanent floodplains (PF) than in the seasonal floodplains (SF) (K.W.: χ2 = 12.47) and in open water (OW) than marginal vegetation (MV) or floodplain (F) habitats (K.W.: χ2 = 37.6). Chlorophyta were more abundant in Boro and Santantadibe than in the other regions. In turn, Chlorophyta were more abundant in Boro than in Santantadibe (O.W.A.: F = 31.8) and were thus more abundant in the seasonal and occasionally flooded floodplains than in permanent floodplain habitats (K.W.: χ2 = 11.8). In turn, Chlorophyta were more abundant in seasonally flooded than occasionally flooded habitats and in floodplains than open water and marginal vegetation habitats (K.W.: χ2 = 36.09). Cyanophyta were more abundant in the distal Boro region than either the upper or Lower Panhandle regions (O.W.A.: F = 6.33), in seasonally rather than occasional or permanent floodplain habitats (χ2 = 36.05) and in floodplain rather than marginal vegetation or open-water habitats (K.W.: χ2 = 7.15). Euglenophyta were more abundant in Santantadibe than in the upper and lower Panhandle regions (K.W.: χ2 = 23.47) and in occasionally flooded floodplains than in permanently flooded floodplain habitats (K.W.: χ2 = 13.28).
The full data on taxon (species, genera, phylum, depending on the identification possible with the microscope used, see Methods) abundance are presented by Marazzi and colleagues; see Supplementary Information in [50]). The mean abundance of typically benthic taxa was highest in permanently flooded sites, while the mean abundance of planktonic and planktonic/benthic sites was highest in seasonally and occasionally flooded sites (Table 3).
The mean abundance of typically benthic taxa was higher in the low (Feb) and high (Jul/Aug) water phases than in the expansion (Apr/May) and recession (Sep) phases (Table 4). Similar mean abundances of planktonic taxa were observed across the different flooding phases, and a slightly higher mean abundance of benthic taxa was recorded during high and low water conditions, while taxa not clearly classifiable as either planktonic or benthic had slightly higher mean abundance during the expansion and recession phases of the annual flood in the delta (Table 4).

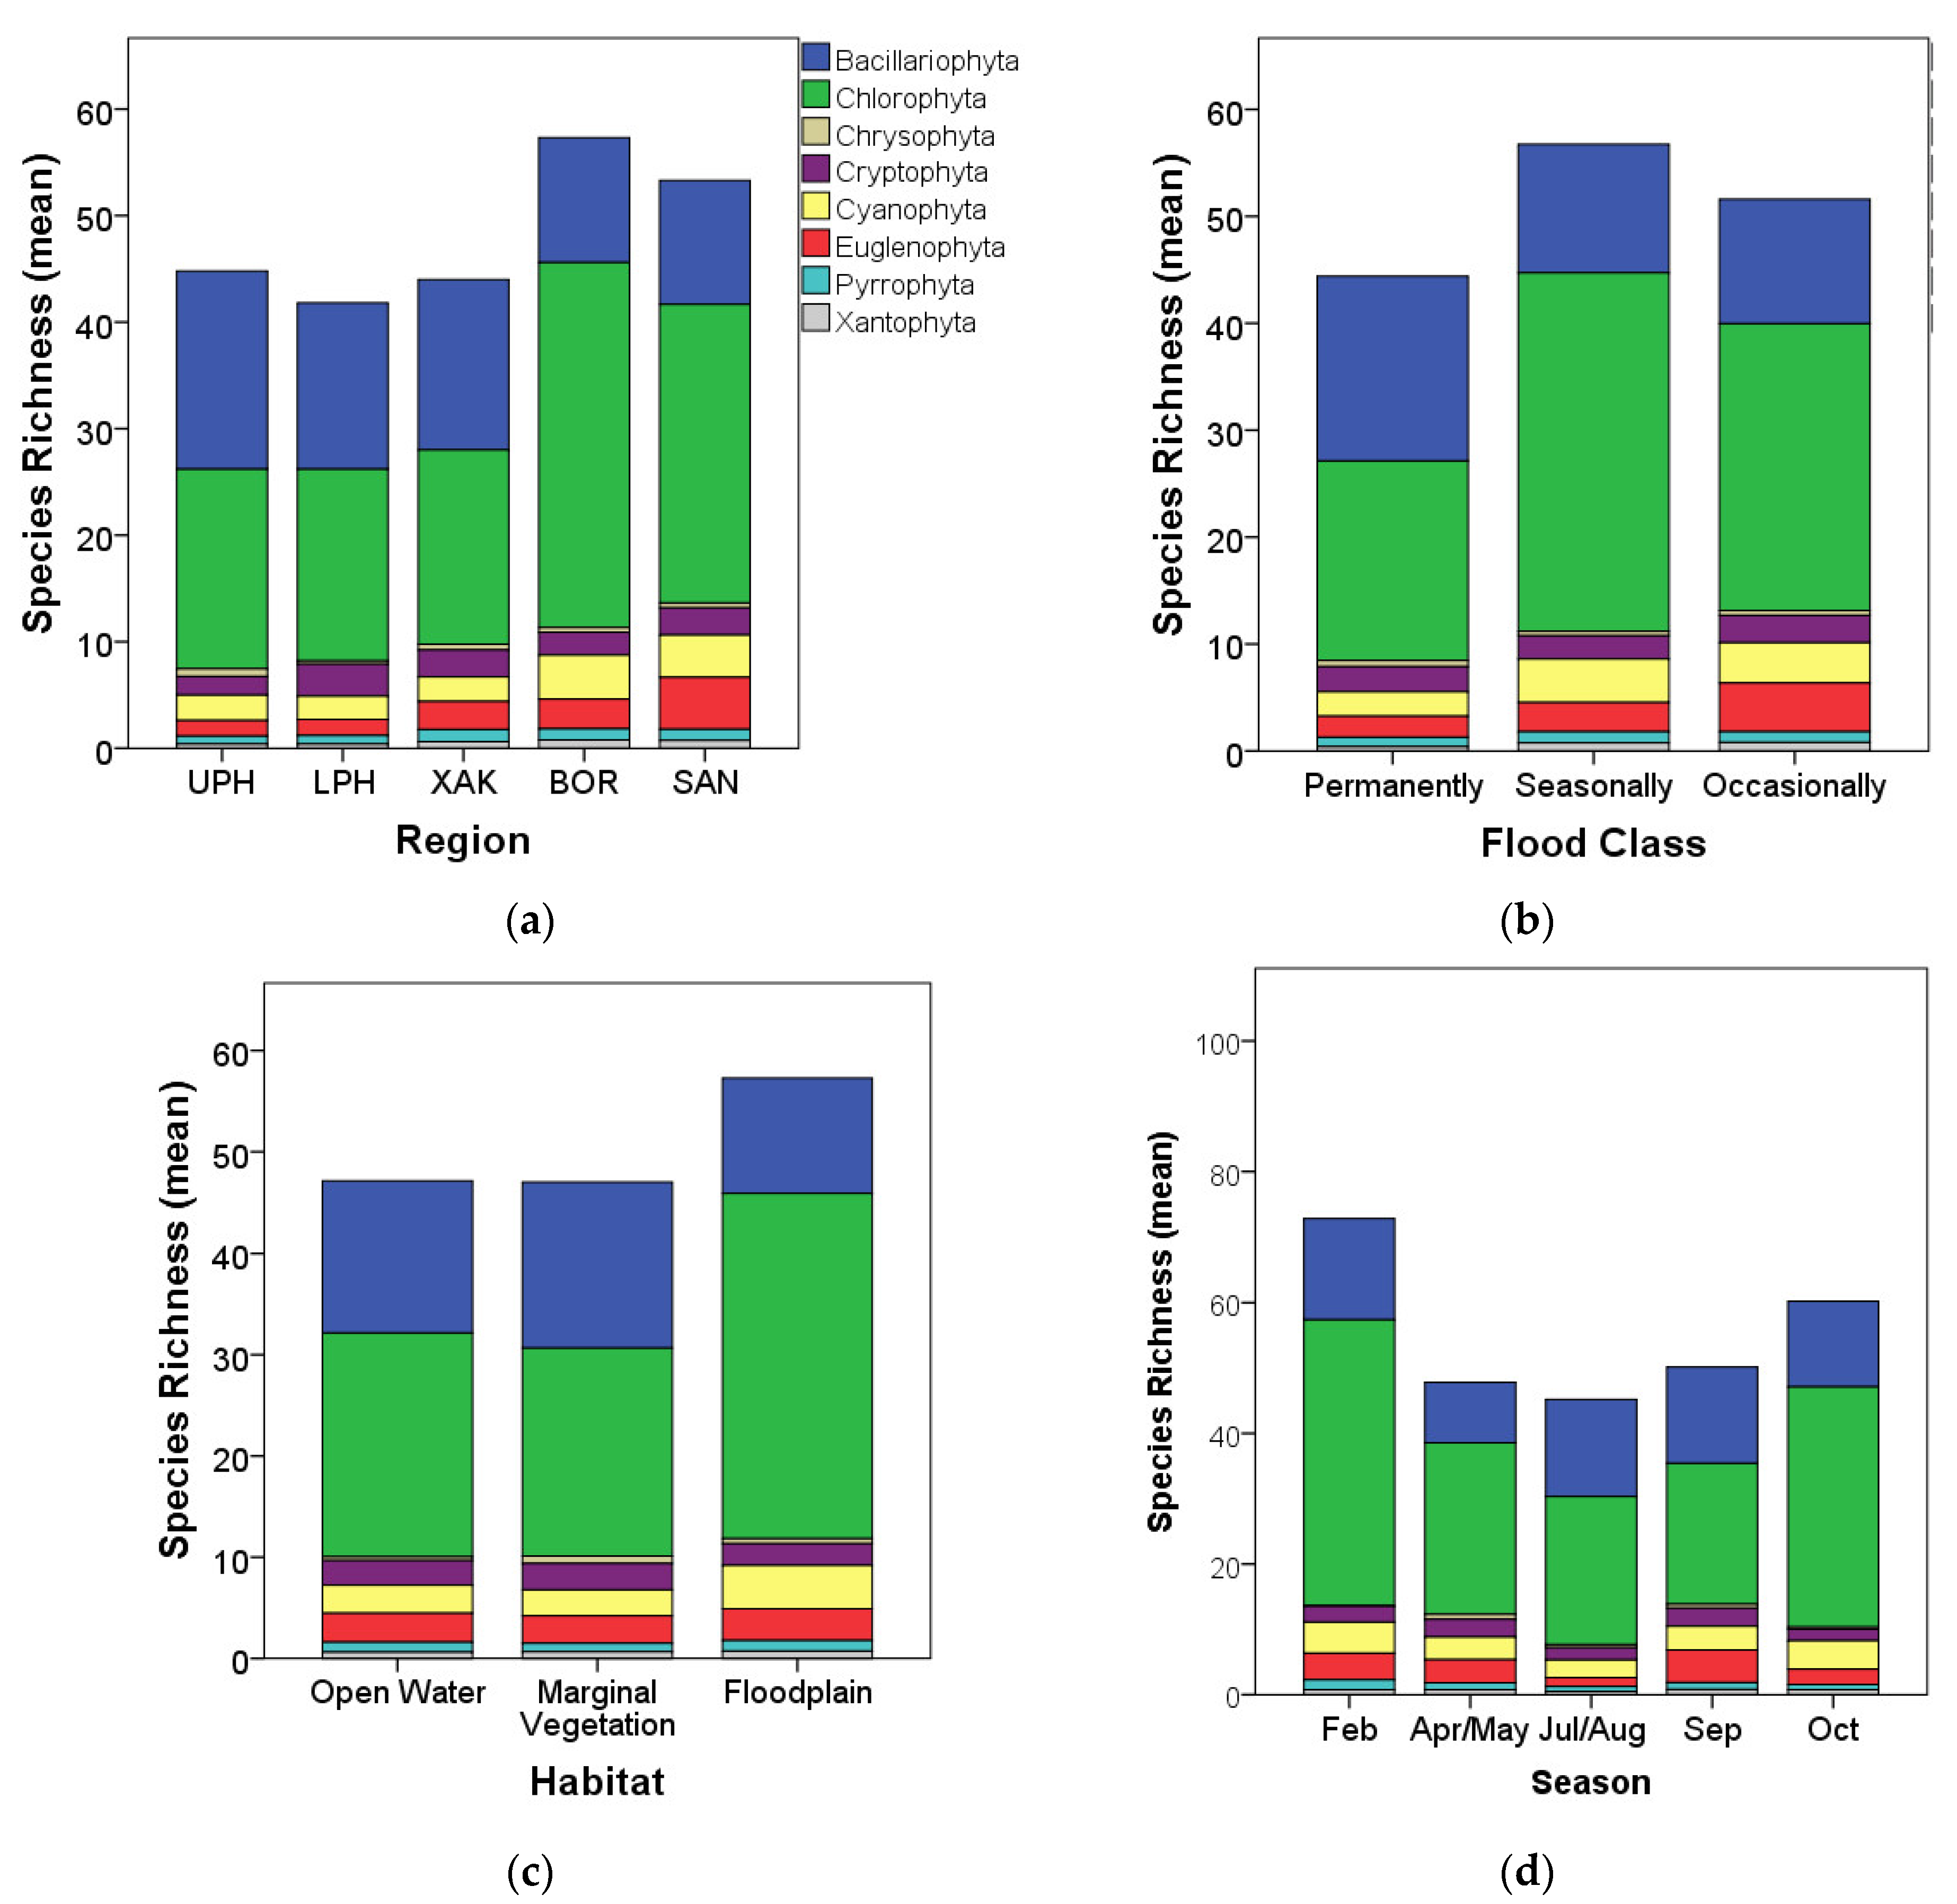
3.2. Algal Species Richness and Diversity Patterns
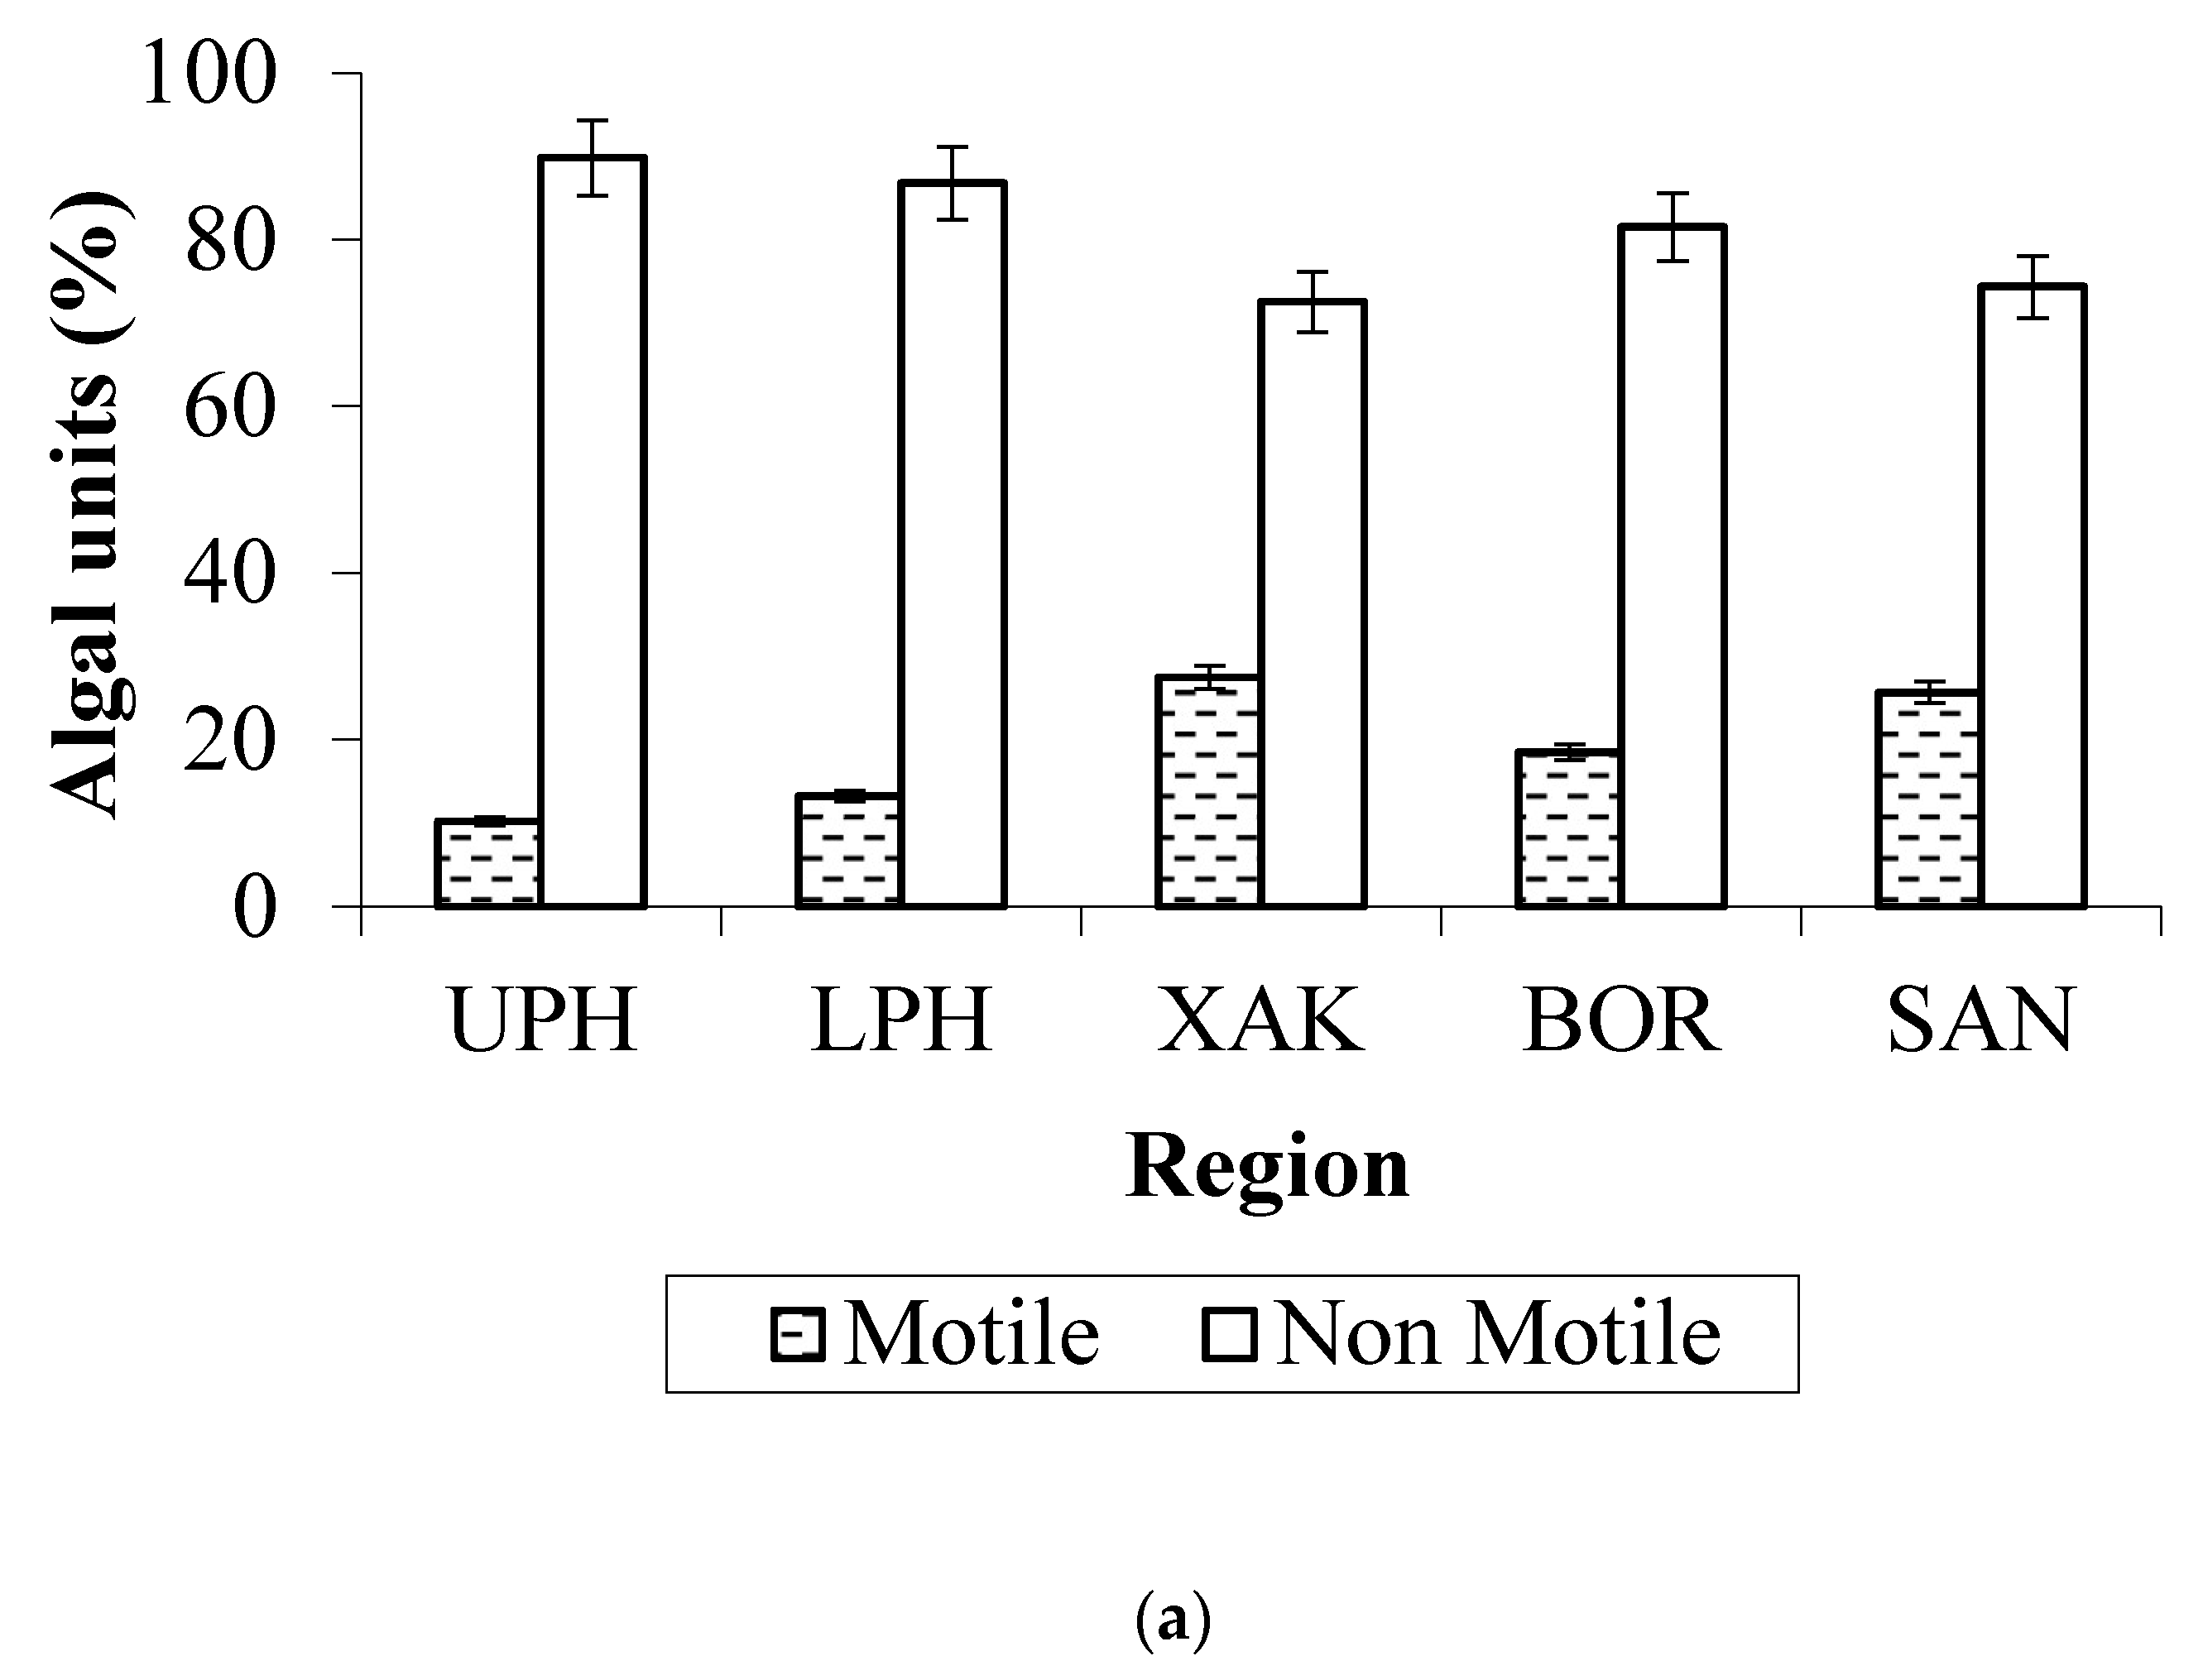
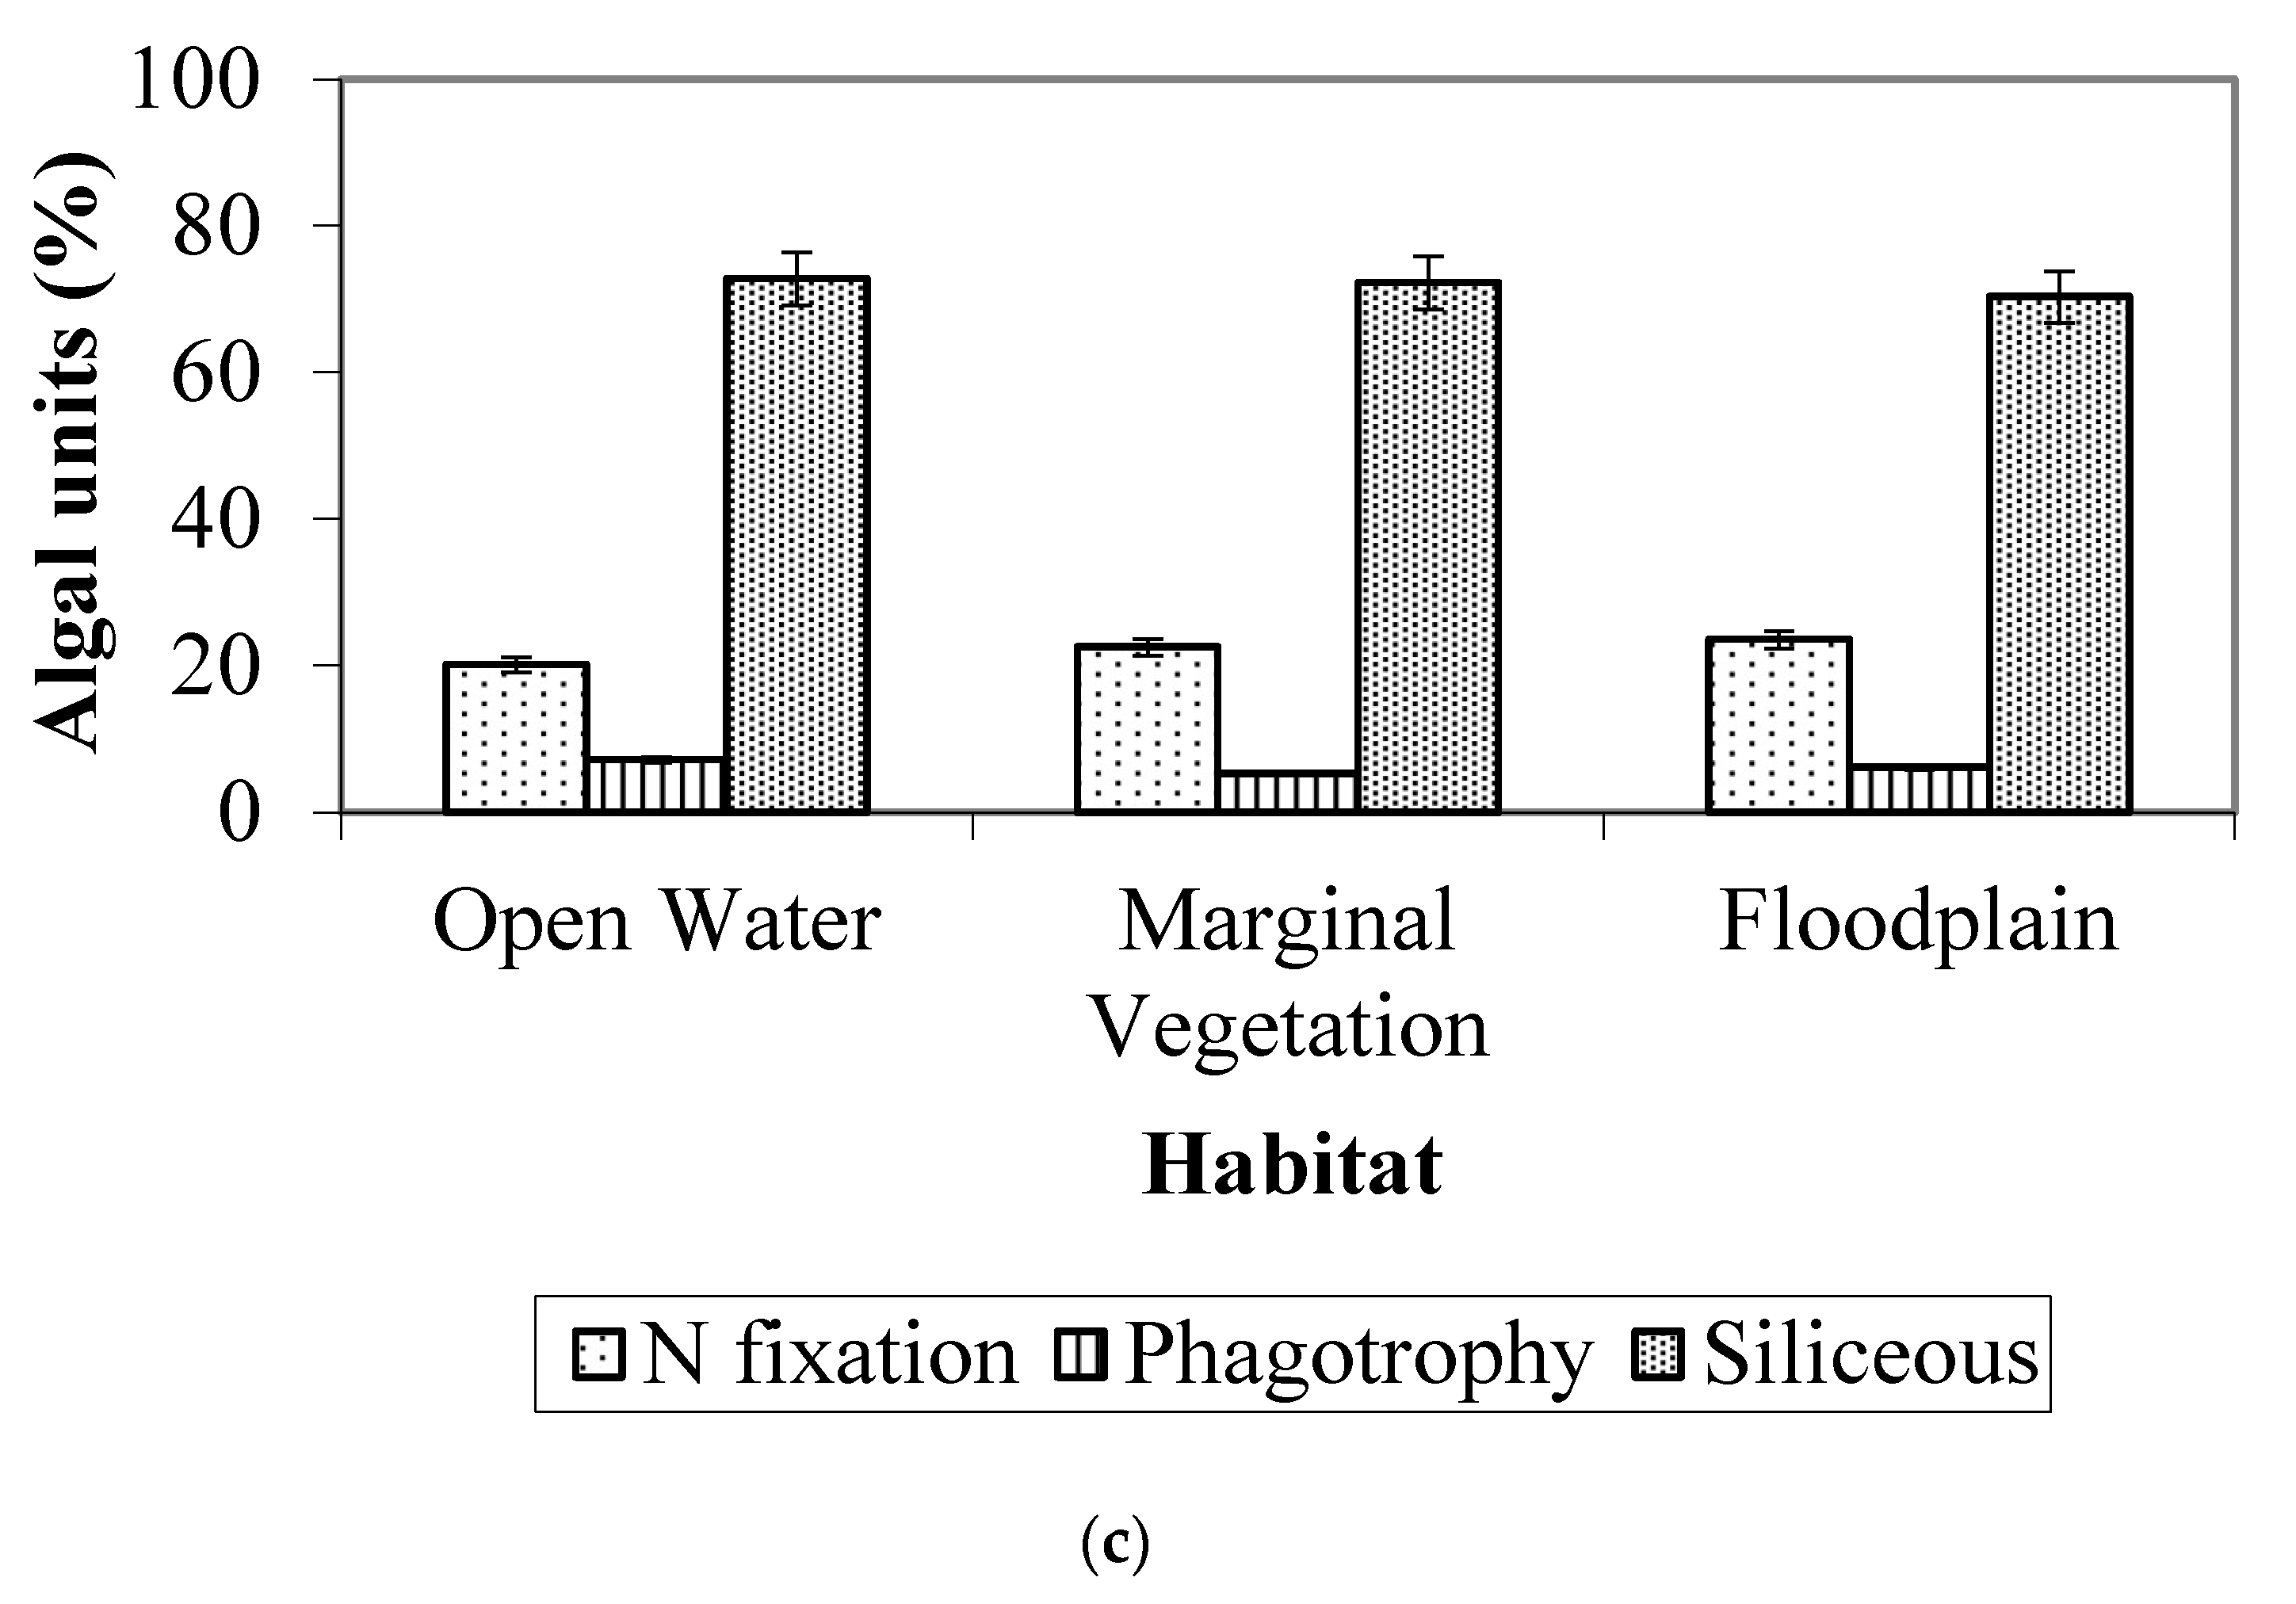
In all samples, we observed 494 taxa (423 identified to species and 71 to genus) from 171 genera. Out of the species found, ~57% were Chlorophyta, and ~23% were Bacillariophyta (Table 5; see full species list in [50]). Desmids (Desmidiales, division Streptophyta, class Zygnemophyceae) were the most diverse group, with 184 species from 23 genera (see also [59,82]).
Chlorophyta, Euglenophyta, and Cyanophyta had the highest species richness in the distal Boro and Santantadibe regions (O.W.A.: F = 7.55; Kruskal–Wallis, K.W.: χ2 = 48.66; χ2 = 21.31, respectively), as compared to highest Bacillariophyta richness in the upper and lower Panhandle regions (one-way ANOVA: O.W.A.: F = 6.78) (Figure 3a). Bacillariophyta and Chlorophyta had higher species richness in permanent and seasonally flooded sites (O.W.A.: F = 4.128 and F = 3.126; Figure 3b) and in open water and marginal vegetation than in floodplain habitats (F = 8.56; Figure 3c). Euglenophyta had higher richness in occasionally flooded habitats (than permanent or seasonally flooded habitats) (K.W.: χ2 = 13.49) (Figure 3b), while Chlorophyta and Cyanophyta richness was highest in floodplain habitats (K.W.: χ2 = 36.34 and O.W.A.: F = 14.32, respectively) (Figure 3c). In terms of season, Bacillariophyta had higher species richness in the recession (Sep and Oct), low water (Feb), and high water (Jul/Aug) phases than in the expansion phase (Apr/May), while Chlorophyta had higher species richness in the recession (Sep and Oct) and low water phases (Feb) (Figure 3d).
Species diversity, as indicated by Shannon Index for species and genera (Figure S1), had similar patterns to those of species richness (see also [59]), with diversity generally being highest in the seasonally flooded floodplains than in other habitats. Some seasonal differences were apparent, e.g., richness and diversity were slightly higher during February in the lower Panhandle, Boro, and Santantadibe regions, but all in all, differences were not major (see Table S2).

3.3. Algal Traits

Approximately ~30% of the algal units were <25 μm long, ~30% were 25–50 μm long, and ~30% were > 50 μm long. Small algae (<25 μm) were more abundant in the distal Boro and Santantadibe regions than in the upper and lower Panhandle regions (<25 μm: O.W.A.: F = 22.011). Conversely, medium-sized algae were more abundant in the upper and lower Panhandle regions than Boro and in Santantadibe than Boro (25–50 μm: KW: χ2 = 37.920) as well. Large algae (>50 μm) were more abundant in the upper Panhandle than Xakanaka, and in the lower Panhandle and Boro than in Santantadibe (>50 μm: χ2 = 23.596) (Figure 4a). Small algae were least abundant in the permanent floodplains (O.W.A.: <25 μm: F = 8.473; OF and SF > PF; Figure 4b), while medium-sized algae were least abundant in the seasonal floodplains (O.W.A.: >50 μm: F = 14.836) (Figure 4b). Smaller algae were least abundant in marginal vegetation habitats (K.W.: χ2 = 17.632), medium-sized algae were least abundant in floodplain habitats, and larger algae were least abundant in open-water habitats (Figure 4c).
Lack of motility was the commonest trait (66.8% of all algal units counted; Figure 5), followed by the presence of a siliceous exoskeleton (39.6% of all algal units counted). Motile algae were generally more abundant in Xakanaka, Boro, and Santantadibe than in the upper and lower Panhandle regions (Figure 5a), although they were more abundant in the upper Panhandle than Xakanaka. Within the distal regions, motile taxa were more abundant in Xakanaka and Santantadibe than Boro (KW: χ2 = 26.496). Motile algae were slightly more abundant in the occasionally flooded floodplain sites than in more frequently flooded sites (Figure 5b) and equally abundant across habitats, regardless of these habitat’s upstream or downstream location (Figure 5c).
Siliceous algae (mostly diatoms) were much more abundant than nitrogen-fixing and phagotrophic algae (Figure 6). Overall, ~57% of all the algal units counted belong to nitrogen-fixing taxa (22% of these) or phagotrophic taxa (6%), or taxa having a siliceous exoskeleton (72%). Metabolic trait frequency varied significantly across regions (nitrogen fixation: F = 3.804, p < 0.01; phagotrophy: KW: χ2 = 17.434; siliceous: F = 6.045). Nitrogen-fixing algae, phagotrophic algae, and siliceous algae were least abundant in the upper Panhandle and Santantadibe, and lower Panhandle and Boro, respectively (Figure 6a). Nitrogen-fixing algae were least abundant in occasionally flooded habitats (O.W.A.: F = 9.470), phagotrophs were slightly more abundant in seasonally flooded habitats, while siliceous algae were more abundant in occasionally flooded habitats than in the permanent floodplain regions (O.W.A.: F = 7.158; Figure 6b). Nitrogen-fixing algae, phagotrophs, and siliceous algae were least abundant in open water, marginal vegetation, and floodplain habitats, respectively (Figure 6c).

4. Discussion

In summary, the three key findings of this study are:
  • Abundance and richness: Chlorophyta and Bacillariophyta were the most abundant and diverse algae in the Okavango, with diatoms being most abundant and diverse in deeper, permanently flooded sites (especially upstream) and green algae being most abundant and diverse in shallower, seasonally flooded sites (especially downstream);
  • Mode of living: The mean abundance of typically benthic taxa was higher in the low and high-water phases than in the expansion and recession phases;
  • Traits: Smaller algae were more abundant in downstream seasonally flooded sites, while medium-sized to larger algae were more abundant in permanently flooded sites. The great majority of the algae observed were non-motile, and the presence of a siliceous exoskeleton (predominantly in Bacillariophyta) was the second most common trait.
This algal study is one of the most comprehensive for the Okavango Delta and builds on previous work by taking a more systematic approach to enumeration and taxonomy across important hydrological and habitat gradients. In comparison to other studies, Mackay and colleagues [16] found 117 species of Bacillariophyta that we did not observe from 100 samples, and David Williamson found 60 additional species of desmids (unpublished data) from several of our samples in BOR and SAN (Table S3), including the new variety Cosmarium pseudosulcatum var. okavangicum [83]. Therefore, we estimate that at least 670 algal species live in the delta, and this is almost certainly an underestimation (see [50]). The total number of species identified (494 algal taxa) reveals a total richness (or γ-diversity) of a similar order of magnitude to that observed in previous Okavango studies and in other large wetlands in general. For example, Grönblad and Croasdale [45] found >200 algal species from upstream areas in the Okavango River, including 146 species of desmids (as compared to our 184 species) and other Chlorophyta, Euglenophyta, and Cyanophyta. In locations upstream or downstream of the delta, Cholnoky [44] observed 327 species of Bacillariophyta. In the delta’s distal reaches, Cronberg and colleagues [17] found 198 algal species, and Coesel and van Geest [46,47] found 25 desmid species. We found 57 species (~13% of our 423 species) in common with Cholnoky [44], 48 diatom species (~42% of our 113 diatom species) in common with Mackay and colleagues [16], and 51 species (10%) in common with Cronberg and colleagues [17]. Among desmids, we found 24 species (13% of our 184 species) of Cosmarium, Euastrum, Micrasterias, Onychonema, and Staurastrum in common with Grönblad and Croasdale [45], ten species of Euastrum, Micrasterias, Penium, and Tetmemorus (~5%) in common with Coesel and van Geest [46], and nine species of Cosmarium and Staurastrum taxa (~5%) in common with Coesel and van Geest [47]. Whilst 207 taxa were also found in six previous studies of the Okavango Delta, almost 290 taxa had not been found in this wetland before, representing almost 60% of all taxa ever observed here (Table S4).

4.1. Algal Abundance Patterns

Bacillariophyta were more abundant in the permanent floodplains, while Chlorophyta and Euglenophyta were more abundant in the seasonal and occasionally flooded floodplain habitats. Cronberg and colleagues [17] also observed a higher presence (in relative biomass terms) and diversity of Chlorophyta and Cyanophyta in the swamp and floodplain sites than in river channels in the Okavango region. These differences may be due to Bacillariophyta’s preference for deeper, colder waters and Chlorophyta’s and Euglenophyta’s preference for shallower and warmer waters [84]. Moreover, silica might also be more available as dissolved silica, which is essential for diatom growth [85], in the delta’s permanent waters where Bacillariophyta were more abundant. Diatoms’ preference for deeper, colder waters is detailed in [59] (same dataset as this paper). The abundance of the most abundant taxa overall, Eunotia sp., was shown to be higher in deeper, colder waters with lower conductivity; the abundance of Cosmarium sp. and other green algae (Chlorophyta) was higher in shallower, warmer waters, while the abundance of Mougeotia sp. displayed less clear trends [59]. The desmid taxa above, which prefer mesotrophic conditions, were more abundant in our samples than more strictly oligotrophic taxa (e.g., Desmidium and Micrasterias). Eunotia sp. prefers environments with low pH and conductivity [86]. Mougeotia sp. are well adapted to warm temperatures and low pH and prefer mesotrophic and eutrophic conditions [87] and were highly abundant in our samples from the delta. These algal abundance data are in agreement with this wetland’s Chlorophyll a and total phosphorus levels to suggest that the Okavango delta’s floodplains are mesotrophic [59]. The mean relative abundance of benthic taxa was higher in permanently flooded sites and with either low- or high-water conditions, while the mean relative abundance of planktonic and planktonic/benthic taxa was higher in seasonally and occasionally flooded sites, but less variable between flooding phases. Early flooding (i.e., flood expansion) tends to create more turbid conditions, where benthic algae (e.g., periphytic ones) have been observed to increase in higher biomass in floodplains, while planktonic algae are favored by decreasing turbidity [88]. In floodplains in Oregon (USA), Weilhofer and colleagues [89] observed higher abundances of planktonic diatoms with short/high magnitude floods, which might be due to increases in nutrients and decreases in light [90]. In the Delta, benthic algae may require either low or high-water levels to settle in higher numbers on, e.g., sand, or submerged vegetation, for example, in colonial assemblages of Chlorophyta. By contrast, although planktonic algae do not appear to prefer a specific flood phase, these taxa were more abundant in seasonally and occasionally flooded sites, which might be linked to the higher turbidity and nutrient levels in the distal reaches of the delta (see [59]).
Investigations in other subtropical wetlands recorded rather similar total species richness values. A total of ~690 species were found in the Kakadu wetlands in Australia (in 70 samples [91,92,93], 337 species in the Pantanal in Brazil (in 100 samples, [94]), and 332 species in the Paraguay river (in 53 samples [95]). In the Everglades, Hagerthey (unpublished data quoted in [87]) observed ~1,700 periphytic algal taxa, mostly Cyanophyta, Bacillariophyta, and Chlorophyta. Solely based on the information available on the sampling effort made in this study and three of the studies above-mentioned, the Okavango Delta’s algal flora may have fewer taxa than in either the Kakadu wetlands and Paraguay river and more taxa than in the Pantanal. The Kakadu studies showed the highest number of species normalized by sampling effort (9.8 new species/samples), as compared to 3.8 new species/samples in this study on the Okavango Delta, 3.4 new species/samples in the Pantanal, and 6.2 new species/sample in the Paraguay river (number of total samples unavailable for the Everglades synthesis study). These differences are likely due to a combination of differences in sampling techniques (e.g., 25 μm mesh size plankton net for the Kakadu and Paraguay river studies and 25 μm net; additional periphyton samples for the Kakadu sites) and differences in long-term ecological processes, such as speciation levels, in these wetlands. Such ‘real’ richness level differences cannot be captured by these studies across a few years and several sites; long-term sampling with systematic collection of climatic, hydrological, and water and soil chemistry data is needed.

4.2. Algal Richness Patterns

Algal species richness was higher in floodplain sites than in open water sites, consistent with what Cronberg and colleagues [17] observed (i.e., 52 taxa in floodplains, as compared to 25 taxa in river channels). Bacillariophyta richness was slightly higher in February (low water phase), July/August (high water phase), and September (flood recession phase) than in April/May (flood expansion phase). Our findings show that the diversity and relative abundance of algae vary substantially in relation to flooding frequency across space and time. These results are consistent with those of Mackay and colleagues [16] and Davidson and colleagues [49]. Mackay and colleagues [16] concluded that diatom species composition was controlled by hydroperiod and by nutrients in the floodplains. Davidson and colleagues [49] found that hydroperiod and phase of the flood are good indicators of species abundance, richness, and community composition and likely integrate various direct and indirect drivers such as nutrients and trophic interaction. Therefore, the possible future attenuation of the delta’s floods due to increased water abstraction and diversion upstream [22,23] is likely to impact algal communities in the Okavango. In a comparative study on total estimated algal richness in the delta and the Florida Everglades, Marazzi and colleagues [50] observed the highest numbers of species per sample in seasonally flooded sites. Hydrological drivers act as an important control on algal community richness, and therefore, primary production in the delta. As primary production is a key ecosystem service, maintaining algal richness is key to preserving ecosystem health and ecosystem services [96,97]. Attenuation of the annual flood pulse is a distinct threat through anthropogenic activity, which may have an undesirable impact on algal diversity, ecosystem function, and service.

4.3. Algal Traits

This study provides an overall first-ever estimate of the frequency of algal traits across space, time, hydrological gradient, and habitat types in the Okavango Delta. Smaller algae, such as Chlorococcales (Chlorophyta) and Chroococcales (Cyanophyta), likely have a higher relative abundance in seasonally flooded floodplains because they have higher growth rates and resilience, more common under high disturbance regimes [52,98]. Nutrient concentrations were rather similar across the delta’s regions [59] and can be overall defined as mesotrophic [7,59]. Therefore, smaller algae able to uptake nutrients more rapidly than larger ones are not favored as much as where nutrient limitation is present [52,98,99]. Algae that are actively motile, such as diatoms with a raphe (e.g., the genera Navicula and Pinnularia), were more abundant in occasionally flooded floodplains than in those permanently or seasonally flooded. In shallow habitats, these organisms are able to move to the best position in the biofilm matrix to gather nutrients and light [51,52]). Nitrogen-fixing algae were not overall abundant across the delta (probably due to relatively high levels of nitrogen and phosphorus in this wetland [5,59]. In [16], diatoms were found to be characteristically N-heterotrophs requiring elevated concentrations of key resources, such as nitrogen and silica. This study shows that the relative abundance of N-fixing algae (e.g., some Cyanophyta taxa) varied more across sites with different flooding frequencies than across habitats (regardless of these habitats’ position with respect to the main river channel: open water, marginal vegetation, sedge, or grass floodplain). However, no silica concentration data were available to make inferences about the abundance of diatoms and other algae demanding silica for their growth. Phagotrophic algae were more abundant in the seasonal and occasionally flooded habitats than in permanent floodplain habitats, which may be due to higher dissolved organic carbon (DOC) in Boro than elsewhere [59].

4.4. Summary of Scientific Contribution

Biodiversity inventories, such as the one provided by this study, are important for understanding ecosystem health. This study provides a significant improvement in understanding the range of algae present in a near-pristine sub-tropical flood-pulsed system, thus providing a baseline for future comparisons, particularly useful in view of ongoing climatic changes in the region [30]. Algae are important primary producers at the base of most wetland food webs, hence understanding how different species were, are, and will be distributed in relation to, e.g., hydrological conditions, may help us understand the contribution of algal primary production to energy flow/dynamics for consumer species [96]. This work provides an estimate of the minimum number of species existing in the Okavango Delta and a detailed description of how many algal taxa can be found across multiple years and over 40 sites in relation to geography, hydrology, seasonality, and habitat types. Future work can take our (1) systematic characterization of this delta’s algal phyla, genera and species, and key traits across hydrological and habitat gradients, and (2) assessment of patterns and drivers of algal species richness, diversity, and relative abundance in relation to space, time, hydrological conditions, and habitat types to test hypotheses to determine whether ongoing and ensuing human impacts will have significantly modified the algal flora and/or the food webs of the delta that such rich flora supports. To this end, previous work on this wetland’s algae [16,49]) and comparisons with other subtropical wetlands [50] can provide complementary information as to how environmental conditions (e.g., nutrients and hydrological variability) influence these delta’s algal assemblages.

5. Conclusions

This study provides one of the few systematic bodies of evidence on algal richness, diversity, and species community composition and species distribution in the Okavango Delta, a globally important near-pristine wetland. The new baseline data create an opportunity for future comparisons of the distribution of algal taxa in this ecosystem and useful insights for comparisons with other similar flood-pulsed systems subject to different levels of anthropogenic impacts. We also highlighted the critical role of hydrology in structuring communities of all algae in the delta in terms of abundance and species, and functional diversity. This study offers complementary insights to those provided by earlier works on microscopic algae at the base of the Okavango Delta’s food webs that can be used to track the impacts of ongoing environmental changes on this unique ecosystem.

Supplementary Materials

The following supporting information can be downloaded at: https://www.mdpi.com/article/10.3390/w15152692/s1, Figure S1: Mean Shannon Index (species) and mean Shannon Index (genera) across regions, flood classes, habitats, and seasons; Table S1: Detailed information on the sites sampled; Table S2: Mean richness and diversity in different seasons by region; Table S3: List of additional species and varieties identified by David Williamson in Campaign 2 samples from seven floodplains; Table S4: List of algal taxa found in this and other Okavango Delta studies.

Author Contributions

Conceptualization, L.M., A.W.M. and V.J.J.; Methodology, L.M.; Data curation, L.M.; Writing—original draft, L.M.; Writing—review & editing, L.M., A.W.M., V.J.J. and R.M.; Supervision, A.W.M. and V.J.J. All authors have read and agreed to the published version of the manuscript.

Funding

Fieldwork research and travel were funded by the Royal Geographical Society—Institute British Geographers (RGS-IGB) Postgraduate Research Award, the UCL Graduate School, and the UK Department for Environment, Food and Rural Affairs (Defra) The Darwin Initiative: reference 14-029.

Data Availability Statement

The data presented in this study are available on request from the corresponding author.

Acknowledgments

We gratefully acknowledge funding for fieldwork and laboratory analyses from the Royal Geographical Society, the UCL Graduate School, and the UK Department for Environment, Food and Rural Affairs (Defra) The Darwin Initiative. We thank Nqobizitha Siziba and the Okavango Research Institute technicians and the Department of Water Affairs for undertaking sampling and water chemistry analyses and for providing boats and drivers, respectively. We also thank: David Williamson and Chris Carter for, respectively, providing drawings and photomicrographs and identifications of algae specimens from additional samples from our 2009–2010 campaign; Lars Ramberg and Sophie des Clers for co-supervising LM in the early-mid Ph.D. stages; and Paul Julian and four anonymous reviewers for their constructive comments, which helped improve our manuscript.

Conflicts of Interest

The authors declare no conflict of interest.

References

  1. Fluet-Chouinard, E.; Lehner, B.; Rebelo, L.-M.; Papa, F.; Hamilton, S.K. Development of a global inundation map at high spatial resolution from topographic downscaling of coarse-scale remote sensing data. Remote Sens. Environ. 2015, 158, 348–361. [Google Scholar] [CrossRef]
  2. Davidson, N.C.; Fluet-Chouinard, E.; Finlayson, C.M. Global extent and distribution of wetlands: Trends and issues. Mar. Freshw. Res. 2018, 69, 620–627. [Google Scholar] [CrossRef] [Green Version]
  3. Junk, W.J.; Bayley, P.B.; Sparks, R.E. The flood pulse concept in river–floodplain systems. Can. J. Fish. Aquat. Sci. 1989, 106, 110–127. [Google Scholar]
  4. Maltby, E.; Acreman, M.C. Ecosystem services of wetlands: Pathfinder for a new paradigm. Hydrol. Sci. J. 2011, 56, 1341–1359. [Google Scholar] [CrossRef]
  5. Junk, W.J.; An, S.; Finlayson, C.M.; Gopal, B.; Květ, J.; Mitchell, S.A.; Mitsch, W.J.; Robarts, R.D. Current state of knowledge regarding the world’s wetlands and their future under global climate change: A synthesis. Aquat. Sci. 2013, 75, 151–167. [Google Scholar] [CrossRef] [Green Version]
  6. Junk, W.J. Long-term environmental trends and the future of tropical wetlands. Environ. Conserv. 2002, 29, 414–435. [Google Scholar] [CrossRef]
  7. Junk, W.J.; Da Cunha, C.N.; Wantzen, K.M.; Petermann, P.; Strüssmann, C.; Marques, M.I.; Adis, J. Biodiversity and its conservation in the Pantanal of Mato Grosso, Brazil. Aquat. Sci. 2006, 68, 278–309. [Google Scholar] [CrossRef]
  8. Erwin, K.L. Wetlands and global climate change: The role of wetland restoration in a changing world. Wetl. Ecol. Manag. 2009, 17, 71–84. [Google Scholar] [CrossRef]
  9. Adis, J.; Junk, W.J. Terrestrial invertebrates inhabiting lowland river floodplains of Central Amazonia and Central Europe: A review. Freshw. Biol. 2002, 47, 711–731. [Google Scholar] [CrossRef]
  10. Reynolds, C.S. Vegetation Processes in the Pelagic: A Model for Ecosystem Theory; Ecology Institute: Oldendorf, Germany, 1997. [Google Scholar]
  11. Reynolds, C.S. Ecology of Phytoplankton, 3rd ed.; Cambridge University Press: Cambridge, UK, 2006. [Google Scholar]
  12. Law, R.J. A review of the function and uses of, and factors affecting, stream phytobenthos. Freshw. Rev. 2013, 4, 135–166. [Google Scholar] [CrossRef]
  13. Junk, W.J.; Piedade, M.T.F.; Lourival, R.; Wittmann, F.; Kandus, P.; Lacerda, L.D.; Bozelli, R.L.; Esteves, F.A.; Nunes da Cunha, C.; Maltchik, L.; et al. Brazilian wetlands: Their definition, delineation, and classification for research, sustainable management, and protection. Aquat. Conserv. Mar. Freshw. Ecosyst. 2014, 24, 5–22. [Google Scholar] [CrossRef]
  14. Wittmann, F.; Householder, E.; Piedade, M.T.F.; Assis, R.L.; Schöngart, J.; Parolin, P.; Junk, W.J. Habitat specificity, endemism and the neotropical distribution of Amazonian white-water floodplain trees. Ecography 2013, 36, 690–707. [Google Scholar] [CrossRef]
  15. McCarthy, T.S.; Ellery, W.N. The effect of vegetation on soil and ground water chemistry and hydrology of islands in the seasonal swamps of the Okavango Fan, Botswana. J. Hydrol. 1994, 154, 169–193. [Google Scholar] [CrossRef]
  16. Mackay, A.W.; Davidson, T.; Wolski, P.; Woodward, S.; Mazebedi, R.; Masamba, W.R.L.; Todd, M. Diatom sensitivity to hydrological and nutrient variability in a subtropical, flood-pulse wetland. Ecohydrology 2012, 5, 491–502. [Google Scholar] [CrossRef]
  17. Cronberg, G.; Gieske, A.; Martins, E.; Nengu, J.P.; Stenstrom, I.M. Major ion chemistry, plankton, and bacterial assemblages of the Jao/Boro River, Okavango Delta, Botswana: The swamps and flood plains. Arch. Für Hydrobiol. Supplementband. Monogr. Beiträge 1996, 107, 335–407. [Google Scholar]
  18. West, D.T.; van As, J.G.; van As, L.L. Surface water quality in the Okavango Delta panhandle, Botswana. Afr. J. Aquat. Sci. 2015, 40, 359–372. [Google Scholar] [CrossRef]
  19. Mosimane, K.; Struyf, E.; Gondwe, M.J.; Frings, P.; van Pelt, D.; Wolski, P.; Schoelynck, J.; Schaller, J.; Conley, D.J.; Murray-Hudson, M. Variability in chemistry of surface and soil waters of an evapotranspiration-dominated flood-pulsed wetland: Solute processing in the Okavango Delta, Botswana. Water SA 2017, 43, 104–115. [Google Scholar] [CrossRef] [Green Version]
  20. Masamba, W.R.; Mazvimavi, D. Impact on water quality of land uses along Thamalakane-Boteti River: An outlet of the Okavango Delta. Phys. Chem. Earth 2008, 33, 687–694. [Google Scholar] [CrossRef]
  21. Pinheiro, I.; Gabaake, G.; Heyns, P. Cooperation in the Okavango River Basin: The OKACOM Perspective; Turton, A.R., Ashton, P., Cloete, E., Eds.; African Water Issues Research Unit (AWIRU): Pretoria, South Africa; Green Cross International (GCI): Geneva, Switzerland, 2003. [Google Scholar]
  22. Mendelsohn, J.M.; Vanderpost, C.; Ramberg, L.; Murray-Hudson, M.; Wolski, P.; Mosepele, K. Okavango Delta: Floods of Life; Raison: Windhoek, Namibia, 2010. [Google Scholar]
  23. Quammen, D. Inside the Mission to Save Africa’s Okavango Delta. National Geographic Magazine November 2017. Available online: https://www.nationalgeographic.com/magazine/article/africa-expedition-conservation-okavango-delta-cuito (accessed on 10 June 2014).
  24. Milzow, C.; Kgotlhang, L.; Bauer-Gottwein, P.; Meier, P.; Kinzelbach, W. Regional review: The hydrology of the Okavango Delta, Botswana—Processes, data and modelling. Hydrogeol. J. 2009, 17, 1297–1328. [Google Scholar] [CrossRef]
  25. Musora, O.; Mbaiwa, J.E.; Murray-Hudson, M. Tourists’ perceptions of environmental impacts of tourism development on water resources in the Okavango Delta, Botswana. Afr. J. Hosp. Tour. Leis. 2017, 6, 1–10. [Google Scholar]
  26. Statistics Botswana. Population and Housing Census Preliminary Results. Gaborone, Botswana, 2022. Available online: https://www.statsbots.org.bw/sites/default/files/2022%20Population%20and%20Housing%20Census%20Preliminary%20Results.pdf (accessed on 15 January 2023).
  27. Mitchell, S.A. The status of wetlands, threats and the predicted effect of global climate change: The situation in Sub-Saharan Africa. Aquat. Sci. 2013, 75, 95–112. [Google Scholar] [CrossRef]
  28. Niang, I.; Ruppel, O.C.; Abdrabo, M.A.; Essel, A.; Lennard, C.; Padgham, J.; Urquhart, P. Africa. In Climate Change 2014, Impacts, Adaptation, and Vulnerability. Part B: Regional Aspects. Contribution of Working Group II to the Fifth Assessment Report of the Intergovernmental Panel on Climate Change; Barros, V.R., Field, C.B., Dokken, D.J., Mastrandrea, K.J., Mach, T.E., Bilir, M., Chatterjee, K.L., Ebi, Y.O., Estrada, R.C., Genova, B., et al., Eds.; Cambridge University Press: Cambridge, UK; New York, NY, USA, 2014. [Google Scholar]
  29. Kgathi, D.L.; Mmopelwa, G.; Vanderpost, C.; Wolski, P.; Motsholapheko, M.R. Impacts of desiccation on ecosystem services and household adaptation in the Okavango Delta, Botswana. Biodivers. Ecol. 2013, 5, 263–278. [Google Scholar] [CrossRef] [Green Version]
  30. Pörtner, H.O.; Roberts, D.C.; Adams, H.; Adler, C.; Aldunce, P.; Ali, E.; Begum, R.A.; Betts, R.; Kerr, R.B.; Biesbroek, R.; et al. Technical Summary. In Climate Change 2022, Impacts, Adaptation and Vulnerability. Contribution of Working Group II to the Sixth Assessment Report of the Intergovernmental Panel on Climate Change 2022; Pörtner, H.-O., Roberts, D.C., Tignor, M., Poloczanska, E.S., Mintenbeck, K., Alegría, A., Craig, M., Langsdorf, S., Löschke, S., Möller, V., et al., Eds.; Cambridge University Press: Cambridge, UK; New York, NY, USA, 2022; pp. 37–118. [Google Scholar]
  31. Stevenson, R.J.; Bothwell, M.L.; Lowe, R.L.; Thorp, J.H. Algal Ecology: Freshwater Benthic Ecosystem; Academic Press: Cambridge, MA, USA, 1996. [Google Scholar]
  32. Lewis, W.M., Jr.; Hamilton, S.K.; Rodríguez, M.A.; Saunders, J.F., III; Lasi, M.A. Foodweb analysis of the Orinoco floodplain based on production estimates and stable isotope data. J. N. Am. Benthol. Soc. 2001, 20, 241–254. [Google Scholar] [CrossRef]
  33. Douglas, M.M.; Bunn, S.E.; Davies, P.M. River and wetland food webs in Australia’s wet–dry tropics: General principles and implications for management. Mar. Freshw. Res. 2005, 56, 329–342. [Google Scholar] [CrossRef] [Green Version]
  34. Thompson, R.M.; Dunne, J.A.; Woodward, G. Freshwater food webs: Towards a more fundamental understanding of biodiversity and community dynamics. Freshw. Biol. 2012, 57, 1329–1341. [Google Scholar] [CrossRef]
  35. Brett, M.T.; Bunn, S.E.; Chandra, S.; Galloway, A.W.; Guo, F.; Kainz, M.J.; Kankaala, P.; Lau, D.C.; Moulton, T.P.; Power, M.E.; et al. How important are terrestrial organic carbon inputs for secondary production in freshwater ecosystems? Freshw. Biol. 2017, 62, 833–853. [Google Scholar] [CrossRef]
  36. McCormick, P.V.; Cairns, J. Algae as indicators of environmental change. J. Appl. Phycol. 1994, 6, 509–526. [Google Scholar] [CrossRef]
  37. Stevenson, J. Ecological assessments with algae: A review and synthesis. J. Phycol. 2014, 50, 437–461. [Google Scholar] [CrossRef]
  38. Wu, N.; Dong, X.; Liu, Y.; Wang, C.; Baattrup-Pedersen, A.; Riis, T. Using river microalgae as indicators for freshwater biomonitoring: Review of published research and future directions. Ecol. Indic. 2017, 81, 124–131. [Google Scholar] [CrossRef]
  39. Passy, S.I. Continental diatom biodiversity in stream benthos declines as more nutrients become limiting. Proc. Natl. Acad. Sci. USA 2008, 105, 9663–9667. [Google Scholar] [CrossRef]
  40. Finlay, B.J. Global dispersal of free-living microbial eukaryote species. Science 2002, 296, 1061–1063. [Google Scholar] [CrossRef] [Green Version]
  41. Lachance, M.A. Here and there or everywhere? BioScience 2004, 54, 884. [Google Scholar] [CrossRef] [Green Version]
  42. Vyverman, W.; Verleyen, E.; Sabbe, K.; Vanhoutte, K.; Sterken, M.; Hodgson, D.A.; Mann, D.G.; Juggins, S.; Vijver, B.V.D.; Jones, V.; et al. Historical processes constrain patterns in global diatom diversity. Ecology 2007, 88, 1924–1931. [Google Scholar] [CrossRef]
  43. Bolgovics, Á.; Ács, É.; Várbíró, G.; Görgényi, J.; Borics, G. Species area relationship (SAR) for benthic diatoms: A study on aquatic islands. Hydrobiologia 2016, 764, 91–102. [Google Scholar] [CrossRef] [Green Version]
  44. Cholnoky, B.J. Die Diatomeen im Unterlaufe des Okawango Flusses. Beih. Nova Hedwig. 1966, 21, 1–102. [Google Scholar]
  45. Grönblad, R.; Croasdale, H. Desmids from Namibia. Acta Bot. Fenn. 1971, 93, 1–40. [Google Scholar]
  46. Coesel, P.F.M.; van Geest, A. Taxonomic and biogeographical notes on Okavango desmids (Zygnematophyceae, Streptophyta). Syst. Geogr. Plants 2008, 78, 27–46. [Google Scholar]
  47. Coesel, P.F.M.; van Geest, A. Taxonomic and biogeographical notes on Okavango desmids (Zygnematophyceae, Streptophyta) II: Genera Cosmarium, Xanthidium and Staurastrum. Syst. Geogr. Plants 2009, 79, 15–31. [Google Scholar]
  48. John, D.M.; Whitton, B.A.; Brook, A.J. The Freshwater Algal Flora of the British Isles: An Identification Guide to Freshwater and Terrestrial Algae; Cambridge University Press: Cambridge, UK, 2002. [Google Scholar]
  49. Davidson, T.A.; Mackay, A.W.; Wolski, P.; Mazebedi, R.; Murray-Hudson, M.; Todd, M. Seasonal and spatial hydrological variability drives aquatic biodiversity in a flood-pulsed, sub-tropical wetland. Freshw. Biol. 2012, 57, 1253–1265. [Google Scholar] [CrossRef] [Green Version]
  50. Marazzi, L.; Gaiser, E.E.; Jones, V.J.; Tobias, F.A.; Mackay, A.W. Algal richness and life-history strategies are influenced by hydrology and phosphorus in two major subtropical wetlands. Freshw. Biol. 2017, 62, 274–290. [Google Scholar] [CrossRef]
  51. Weithoff, G. The concepts of ‘plant functional types’ and ‘functional diversity’ in lake phytoplankton–a new understanding of phytoplankton ecology? Freshw. Biol. 2003, 48, 1669–1675. [Google Scholar] [CrossRef]
  52. Passy, S.I. Diatom ecological guilds display distinct and predictable behavior along nutrient and disturbance gradients in running waters. Aquat. Bot. 2007, 86, 171–178. [Google Scholar] [CrossRef]
  53. Rimet, F.; Bouchez, A. Life-forms, cell-sizes and ecological guilds of diatoms in European rivers. Knowl. Manag. Aquat. Ecosyst. 2012, 406, 1–12. [Google Scholar] [CrossRef]
  54. Lange, K.; Townsend, C.R.; Matthaei, C.D. A trait-based framework for stream algal communities. Ecol. Evol. 2016, 6, 23–36. [Google Scholar] [CrossRef] [PubMed] [Green Version]
  55. Tapolczai, K.; Bouchez, A.; Stenger-Kovács, C.; Padisák, J.; Rimet, F. Trait-based ecological classifications for benthic algae: Review and perspectives. Hydrobiologia 2016, 776, 1–17. [Google Scholar] [CrossRef]
  56. Mosepele, K. Preliminary Length-Based Stock Assessment of the Main Exploited Stocks of the Okavango Delta Fishery. Master’s Thesis, University of Bergen, Bergen, Norway, 2000. [Google Scholar]
  57. Secretariat of the Convention on Wetlands. The List of Wetlands of International Importance, Convention on Wetlands Secretariat. Gland, Switzerland, 2023. Available online: https://www.ramsar.org/sites/default/files/documents/library/sitelist.pdf (accessed on 26 December 2017).
  58. United Nations Educational, Scientific and Cultural Organisation (UNESCO). Okavango Delta. Available online: http://whc.unesco.org/en/list/1432/ (accessed on 27 December 2017).
  59. Marazzi, L. Biodiversity and Biomass of Algae in the Okavango Delta (Botswana), A Subtropical Flood-Pulsed Wetland. Ph.D. Thesis, UCL (University College London), London, UK, 2014. [Google Scholar]
  60. McCarthy, J.M.; Gumbricht, T.; McCarthy, T.; Frost, P.; Wessels, K.; Seidel, F. Flooding patterns of the Okavango Wetland in Botswana between 1972 and 2000. Ambio A J. Hum. Environ. 2003, 32, 453–457. [Google Scholar] [CrossRef]
  61. Kurugundla, C.N.; Parida, B.P.; Buru, J.C. Revisiting Hydrology of Lake Ngami in Botswana. Hydrol. Curr. Res. 2018, 9, 1–11. [Google Scholar]
  62. Mackay, A.W.; Davidson, T.; Wolski, P.; Mazebedi, R.; Masamba, W.R.L.; Huntsman-Mapila, P.; Todd, M. Spatial and seasonal variability in surface water chemistry in the Okavango Delta, Botswana: A multivariate approach. Wetlands 2011, 31, 815–829. [Google Scholar] [CrossRef]
  63. Siziba, N.; Chimbari, M.J.; Masundire, H.; Mosepele, K. Spatial and temporal variations of microinvertebrates across temporary floodplains of the Lower Okavango Delta, Botswana. Phys. Chem. Earth 2011, 36, 939–948. [Google Scholar] [CrossRef]
  64. Siziba, N.; Chimbari, M.J.; Masundire, H.; Mosepele, K. Spatial variations of microinvertebrates across different microhabitats of temporary floodplains of Lower Okavango Delta, Botswana. Afr. J. Ecol. 2012, 50, 43–52. [Google Scholar] [CrossRef]
  65. Willén, T. Studies on the phytoplankton of some lakes connected with or recently isolated from the Baltic. Oikos 1962, 13, 169–199. [Google Scholar] [CrossRef]
  66. European Standard. Water quality—Guidance standard for the routine analysis of phytoplankton abundance and composition using inverted microscopy (Utermöhl technique) prEN 15204:2005. European Committee for Standardization (CEN), 2005.
  67. Utermohl, H. Zur Vervollkommung der quantitativen phytoplankton-methodik. Mitt Int. Ver Limnol. 1958, 9, 38. [Google Scholar]
  68. Thomasson, K. Notes on the plankton of Lake Bangwelu. Nova Acta Regiae Soc. Sci. Ups. 1957, 17, 1–18. [Google Scholar]
  69. Thomasson, K. Notes on the plankton of Lake Bangwelu. Nova Acta Regiae Soc. Sci. Ups. 1960, 17, 1–43. [Google Scholar]
  70. Thomasson, K. Notes on algal vegetation of Lake Kariba. Nova Acta Regiae Soc. Sci. Ups. 1965, 19, 1. [Google Scholar]
  71. Thomasson, K. Amazonian algae. Inst. R. Sci. Nat. Belg. 1971, 2, 1–57. [Google Scholar]
  72. Coesel, P.F.M. The relevance of desmids in the biological typology and evaluation of fresh waters. Aquat. Ecol. 1975, 9, 93–101. [Google Scholar]
  73. Coesel, P.F.M. Structural characteristics and adaptations of desmid assemblages. J. Ecol. 1982, 70, 163–177. [Google Scholar] [CrossRef]
  74. Ramberg, L. Compendium on Phytoplankton; Unpublished manuscript; Uppsala University: Uppsala, Sweden, 1986. [Google Scholar]
  75. Gerrath, J.F.; John, D.M. The Desmids of Ghana, West Africa, I. Nova Hedwig 1988, 46, 187–230. [Google Scholar]
  76. Ricci, S.; Alfinito, S.; Fumanti, B. Desmids from Guma Valley (Sierra Leone, West Africa). Hydrobiologia 1990, 208, 235–243. [Google Scholar] [CrossRef]
  77. Cox, E.J. Identification of Freshwater Diatoms from Live Material; Chapman & Hall: London, UK, 1996. [Google Scholar]
  78. Carter, C.F. Desmid Images in Three Dimensions—An Aid to Identification; Unpublished material—Advanced Course on Blue-Green and Green Algae; Durham University: Durham, UK, 2011. [Google Scholar]
  79. Van Dam, H.; Mertensen, A.; Sinkeldam, J. A coded checklist and ecological indicator values of freshwater diatoms from the Netherlands. Neth. J. Aquat. Ecol. 1994, 28, 117–133. [Google Scholar]
  80. Porter, K.G. Phagotrophic phytoflagellates in microbial food webs. Hydrobiologia 1988, 159, 89–97. [Google Scholar] [CrossRef]
  81. Pohlert, T. The Pairwise Multiple Comparison of Mean Ranks Package (PMCMR). R package. 2014. Available online: https://CRAN.R-project.org/package=PMCMR (accessed on 26 December 2017).
  82. Marazzi, L. Okavango Delta—Biodiversity of Microalgae, precious invisible plants. Biodiv. Ecol. 2013, 5, 161–163. [Google Scholar] [CrossRef]
  83. Williamson, D.B.; Marazzi, L. A new Cosmarium (Chlorophyta, Desmidiaceae) variety from the Okavango Delta, Botswana. Quekett J. Microsc. 2013, 42, 35–37. [Google Scholar]
  84. Butterwick, C.; Heaney, S.; Talling, J. Diversity in the influence of temperature on the growth rates of freshwater algae, and its ecological relevance. Freshw. Biol. 2005, 50, 291–300. [Google Scholar] [CrossRef]
  85. Martin-Jézéquel, V.; Hildebrand, M.; Brzezinski, M.A. Silicon metabolism in diatoms: Implications for growth. J. Phycol. 2000, 36, 821–840. [Google Scholar] [CrossRef]
  86. Sala, S.E.; Duque, S.R.; Núñez-Avellaneda, M.; Lamaro, A.A. Diatoms from the Colombian Amazon: Some species of the genus Eunotia (Bacillariophyceae). Acta Amaz. 2002, 3, 589–603. [Google Scholar] [CrossRef] [Green Version]
  87. Hagerthey, S.E.; Bellinger, B.J.; Wheeler, K.; Gantar, M.; Gaiser, E. Everglades periphyton: A biogeochemical perspective. Crit. Rev. Environ. Sci. Technol. 2011, 41, 309–343. [Google Scholar] [CrossRef]
  88. Engle, D.L.; Melack, J.M. Consequences of riverine flooding for seston and the periphyton of floating meadows in an Amazon floodplain lake. Limnol. Oceanogr. 1993, 38, 1500–1520. [Google Scholar] [CrossRef]
  89. Weilhoefer, C.L.; Pan, Y.; Eppard, S. The effects of river floodwaters on floodplain wetland water quality and diatom assemblages. Wetlands 2008, 28, 473–486. [Google Scholar] [CrossRef]
  90. Squires, M.M.; Lesack, L.F.W. Benthic algal response to pulsed versus distributed inputs of sediments and nutrients in a Mackenzie Delta lake. J. N. Am. Benthol. Soc. 2001, 20, 369–384. [Google Scholar] [CrossRef]
  91. Thomas, D.P. A Limnological Survey of the Alligator Rivers Region, I. Diatoms (Bacillariophyceae) of the Region; Research Report 3; Supervising Scientist for the Alligator Rivers Region, AGPS: Canberra, Australia, 1983. [Google Scholar]
  92. Ling, H.; Tyler, P.A. A Limnological Survey of the Alligator Rivers Region. II Freshwater Algae, Exclusive of Diatoms; Australian Government Publishing Service Research Report 3; Australian Government Publishing Services: Canberra, Australia, 1986. [Google Scholar]
  93. Finlayson, C.M.; Lowry, J.; Bellio, M.G.; Nou, S.; Pidgeon, R.; Walden, D.; Humphrey, C.; Fox, G. Biodiversity of the wetlands of the Kakadu region, Northern Australia. Aquat. Sci. 2006, 68, 374–399. [Google Scholar] [CrossRef]
  94. De-Lamonica-Freire, E.M.; Heckman, C.W. The seasonal succession of biotic assemblages in wetlands of the tropical wet and dry climatic zone: III. The algal assemblages in the Pantanal of Mato Grosso, Brazil, with a comprehensive list of the known species and revision of two desmid taxa. Int. Rev. Gesamten Hydrobiol. Hydrogr. 1996, 81, 253–280. [Google Scholar] [CrossRef]
  95. Zalocar de Domitrovic, Y.Z. Structure and variation of the Paraguay River phytoplankton in two periods of its hydrological cycle. Hydrobiologia 2002, 472, 177–196. [Google Scholar] [CrossRef]
  96. Jardine, T.D.; Hunt, R.; Faggotter, S.; Valdez, D.; Burford, M.; Bunn, S. Carbon from periphyton supports fish biomass in waterholes of a wet–dry tropical river. River Res. Appl. 2013, 29, 560–573. [Google Scholar] [CrossRef] [Green Version]
  97. Molinari, B.; Stewart-Koster, B.; Adame, M.F.; Campbell, M.D.; McGregor, G.; Schulz, C.; Malthus, T.J.; Bunn, S. Relationships between algal primary productivity and environmental variables in tropical floodplain wetlands. Inland Waters 2021, 11, 180–190. [Google Scholar] [CrossRef]
  98. Biggs, B.J.F.; Stevenson, R.J.; Lowe, R.L. A habitat matrix conceptual model for stream periphyton. Arch. Hydrobiol. 1998, 143, 21–56. [Google Scholar] [CrossRef]
  99. Litchman, E.; Klausmeier, C.A. Trait-based community ecology of phytoplankton. Annu. Rev. Ecol. Evol. Syst. 2008, 39, 615–639. [Google Scholar] [CrossRef] [Green Version]
Figure 1. Map of our sampling sites and regions in the Okavango Delta. Campaign 1 included sites across the five regions, while Campaign 2 sites included only sits in BOR and SAN. UPH = Upper Panhandle; LPH = Lower Panhandle; XAK = Xakanaxa; BOR = Boro; SAN = Santantadibe (see Table S2 and [59] for full details and more detailed map).
Water 15 02692 g001
Figure 2. Mean relative abundance of algal phyla across (a) regions, (b) flood classes, (c) habitats, and (d) seasons. Results of the Kruskal–Wallis and Neymenyi post-hoc tests.
Water 15 02692 g002
Figure 3. Mean species richness of algae observed in our samples across (a) regions, (b) flood classes (i.e., permanently flooded, seasonally flooded, and occasionally flooded), (c) habitats, and (d) seasons.
Water 15 02692 g003
Figure 4. Frequency of mean cell length (or greater linear axial dimension) classes (white: <25 µm; dotted: 25–50 µm; densely dotted: >50 µm) across: (a) Regions, (b) flood classes (permanently flooded, seasonally, and occasionally flooded), (c) habitats.
Water 15 02692 g004aWater 15 02692 g004b
Figure 5. Frequency of motility across: (a) regions, (b) flood classes (permanently flooded, seasonally, and occasionally flooded), (c) habitats.
Water 15 02692 g005aWater 15 02692 g005b
Figure 6. Frequency of metabolic traits across: (a) Regions, (b) flood classes (permanently flooded, seasonally, and occasionally flooded), and (c) habitats.
Water 15 02692 g006aWater 15 02692 g006b
Table 1. Number of algal samples collected by region, flood class, and habitat (UPH: Upper Panhandle; LPH: Lower Panhandle; XAK: Xakanaxa; BOR: Boro; SAN: Santantadibe).
Region/Flooding FrequencyHabitatTotal
Open WaterMarginal VegetationFloodplain
UPH
Permanently flooded94215
LPH
Permanently flooded36 9
Seasonally flooded 11
XAK
Permanently flooded2428
Seasonally flooded2 2
Occasionally flooded 33
BOR
Seasonally flooded1344865
SAN
Occasionally flooded12 1527
Total411871130
Table 2. Algal taxa with mean relative abundance >0.5% in the 130 samples analyzed, the number of samples in which they occurred, and the mean abundance across all samples (including where absent).
TaxonTaxonomic
Resolution
PhylumTotal CountsOccurrence
Frequency
Mean %
Abundance
Eunotia sp.GenusBacillariophyta35351057.17
Mougeotia sp.GenusChlorophyta31611166.32
Pennate DiatomOther groupsBacillariophyta20451264.67
Cosmarium sp.GenusChlorophyta20291284.07
Gomphonema sp.GenusBacillariophyta18601113.72
Scenedesmus sp.GenusChlorophyta17921273.62
Synedra sp.GenusBacillariophyta17681203.67
Monoraphidium arcuatumSpeciesChlorophyta14431192.88
Synedra ulnaGenusBacillariophyta1426922.97
Cryptomonas sp.GenusCryptophyta13271032.84
Chroococcales OrderCyanophyta11101052.20
Monoraphidium griffithiiSpeciesChlorophyta10771212.14
Aulacoseira sp.GenusBacillariophyta851711.79
Nitzschia sp.GenusBacillariophyta848961.69
Chroomonas sp.GenusCryptophyta8321041.70
Staurastrum sp.GenusChlorophyta8191111.60
Navicula sp.GenusBacillariophyta8091011.57
Oedogonium sp.GenusChlorophyta7961031.63
Eunotia pectinalisSpeciesBacillariophyta752491.51
Eunotia rhomboideaSpeciesBacillariophyta663831.36
Pediastrum tetrasSpeciesChlorophyta6321171.28
Oscillatoriales OrderCyanophyta571921.24
Euglena sp.GenusEuglenophyta511941.05
Euastrum sp.GenusChlorophyta509931.06
Chlorococcales OrderChlorophyta495941.01
Closterium sp.GenusChlorophyta4761090.98
Chlorella sp.GenusChlorophyta462500.86
Pinnularia sp.GenusBacillariophyta459990.96
Amphora sp.GenusBacillariophyta450750.94
Monoraphidium irregulareSpeciesChlorophyta417780.81
Eunotia bilunarisSpeciesBacillariophyta398740.79
Oscillatoria sp.GenusCyanophyta392680.78
Chroococcus sp.GenusCyanophyta384710.74
Eunotia flexuosaSpeciesBacillariophyta375750.75
Oocystis sp.GenusChlorophyta357870.72
Staurodesmus sp.GenusChlorophyta359850.66
Phacus sp.GenusEuglenophyta308790.63
Dinobryon sp. GenusChrysophyta296220.61
Anabaena sp.GenusCyanophyta295430.53
Gomphonema gracileSpeciesBacillariophyta294680.58
Scenedesmus arcuatusSpeciesChlorophyta279760.54
Average 897901.84
Table 3. Mean relative abundance (%) of all algal taxa identified in this study that typically live in the plankton, benthos, or both in sites with different flood frequencies (flood class).
Flood PhaseBenthicPlanktonicPlanktonic/Benthic
Permanently343728
Seasonally224533
Occasionally294533
Total294030
Table 4. Mean relative abundance (%) of all algal taxa identified in this study that typically live in the plankton, benthos, or both in different flood phases.
Flood PhaseBenthicPlanktonicPlanktonic/Benthic
Expansion (Apr/May)264131
High (Jul)303930
Low (Feb)324028
Recession (Sep)284032
Total294030
Table 5. Number of species and genera identified in 130 samples.
PhylumN Species%N Genera%
Bacillariophyta 11322.93721.6
Chlorophyta 28357.38650.3
Chrysophyta81.674.1
Cryptophyta112.231.8
Cyanophyta285.72212.9
Euglenophyta367.352.9
Prasinophyta10.210.6
Pyrrophyta81.674.1
Xanthophyta61.231.8
Total494100.0171100.0
Disclaimer/Publisher’s Note: The statements, opinions and data contained in all publications are solely those of the individual author(s) and contributor(s) and not of MDPI and/or the editor(s). MDPI and/or the editor(s) disclaim responsibility for any injury to people or property resulting from any ideas, methods, instructions or products referred to in the content.

