Water Pollution Indexes Proposal for a High Andean River Using Multivariate Statistics: Case of Chumbao River, Andahuaylas, Apurímac
Abstract
:1. Introduction
2. Materials and Methods
2.1. Study Area
2.2. Analysis of Water Quality Parameters
2.3. Evaluation of Water Pollution Index (WPI)
2.4. Statistical Analysis
3. Results and Discussion
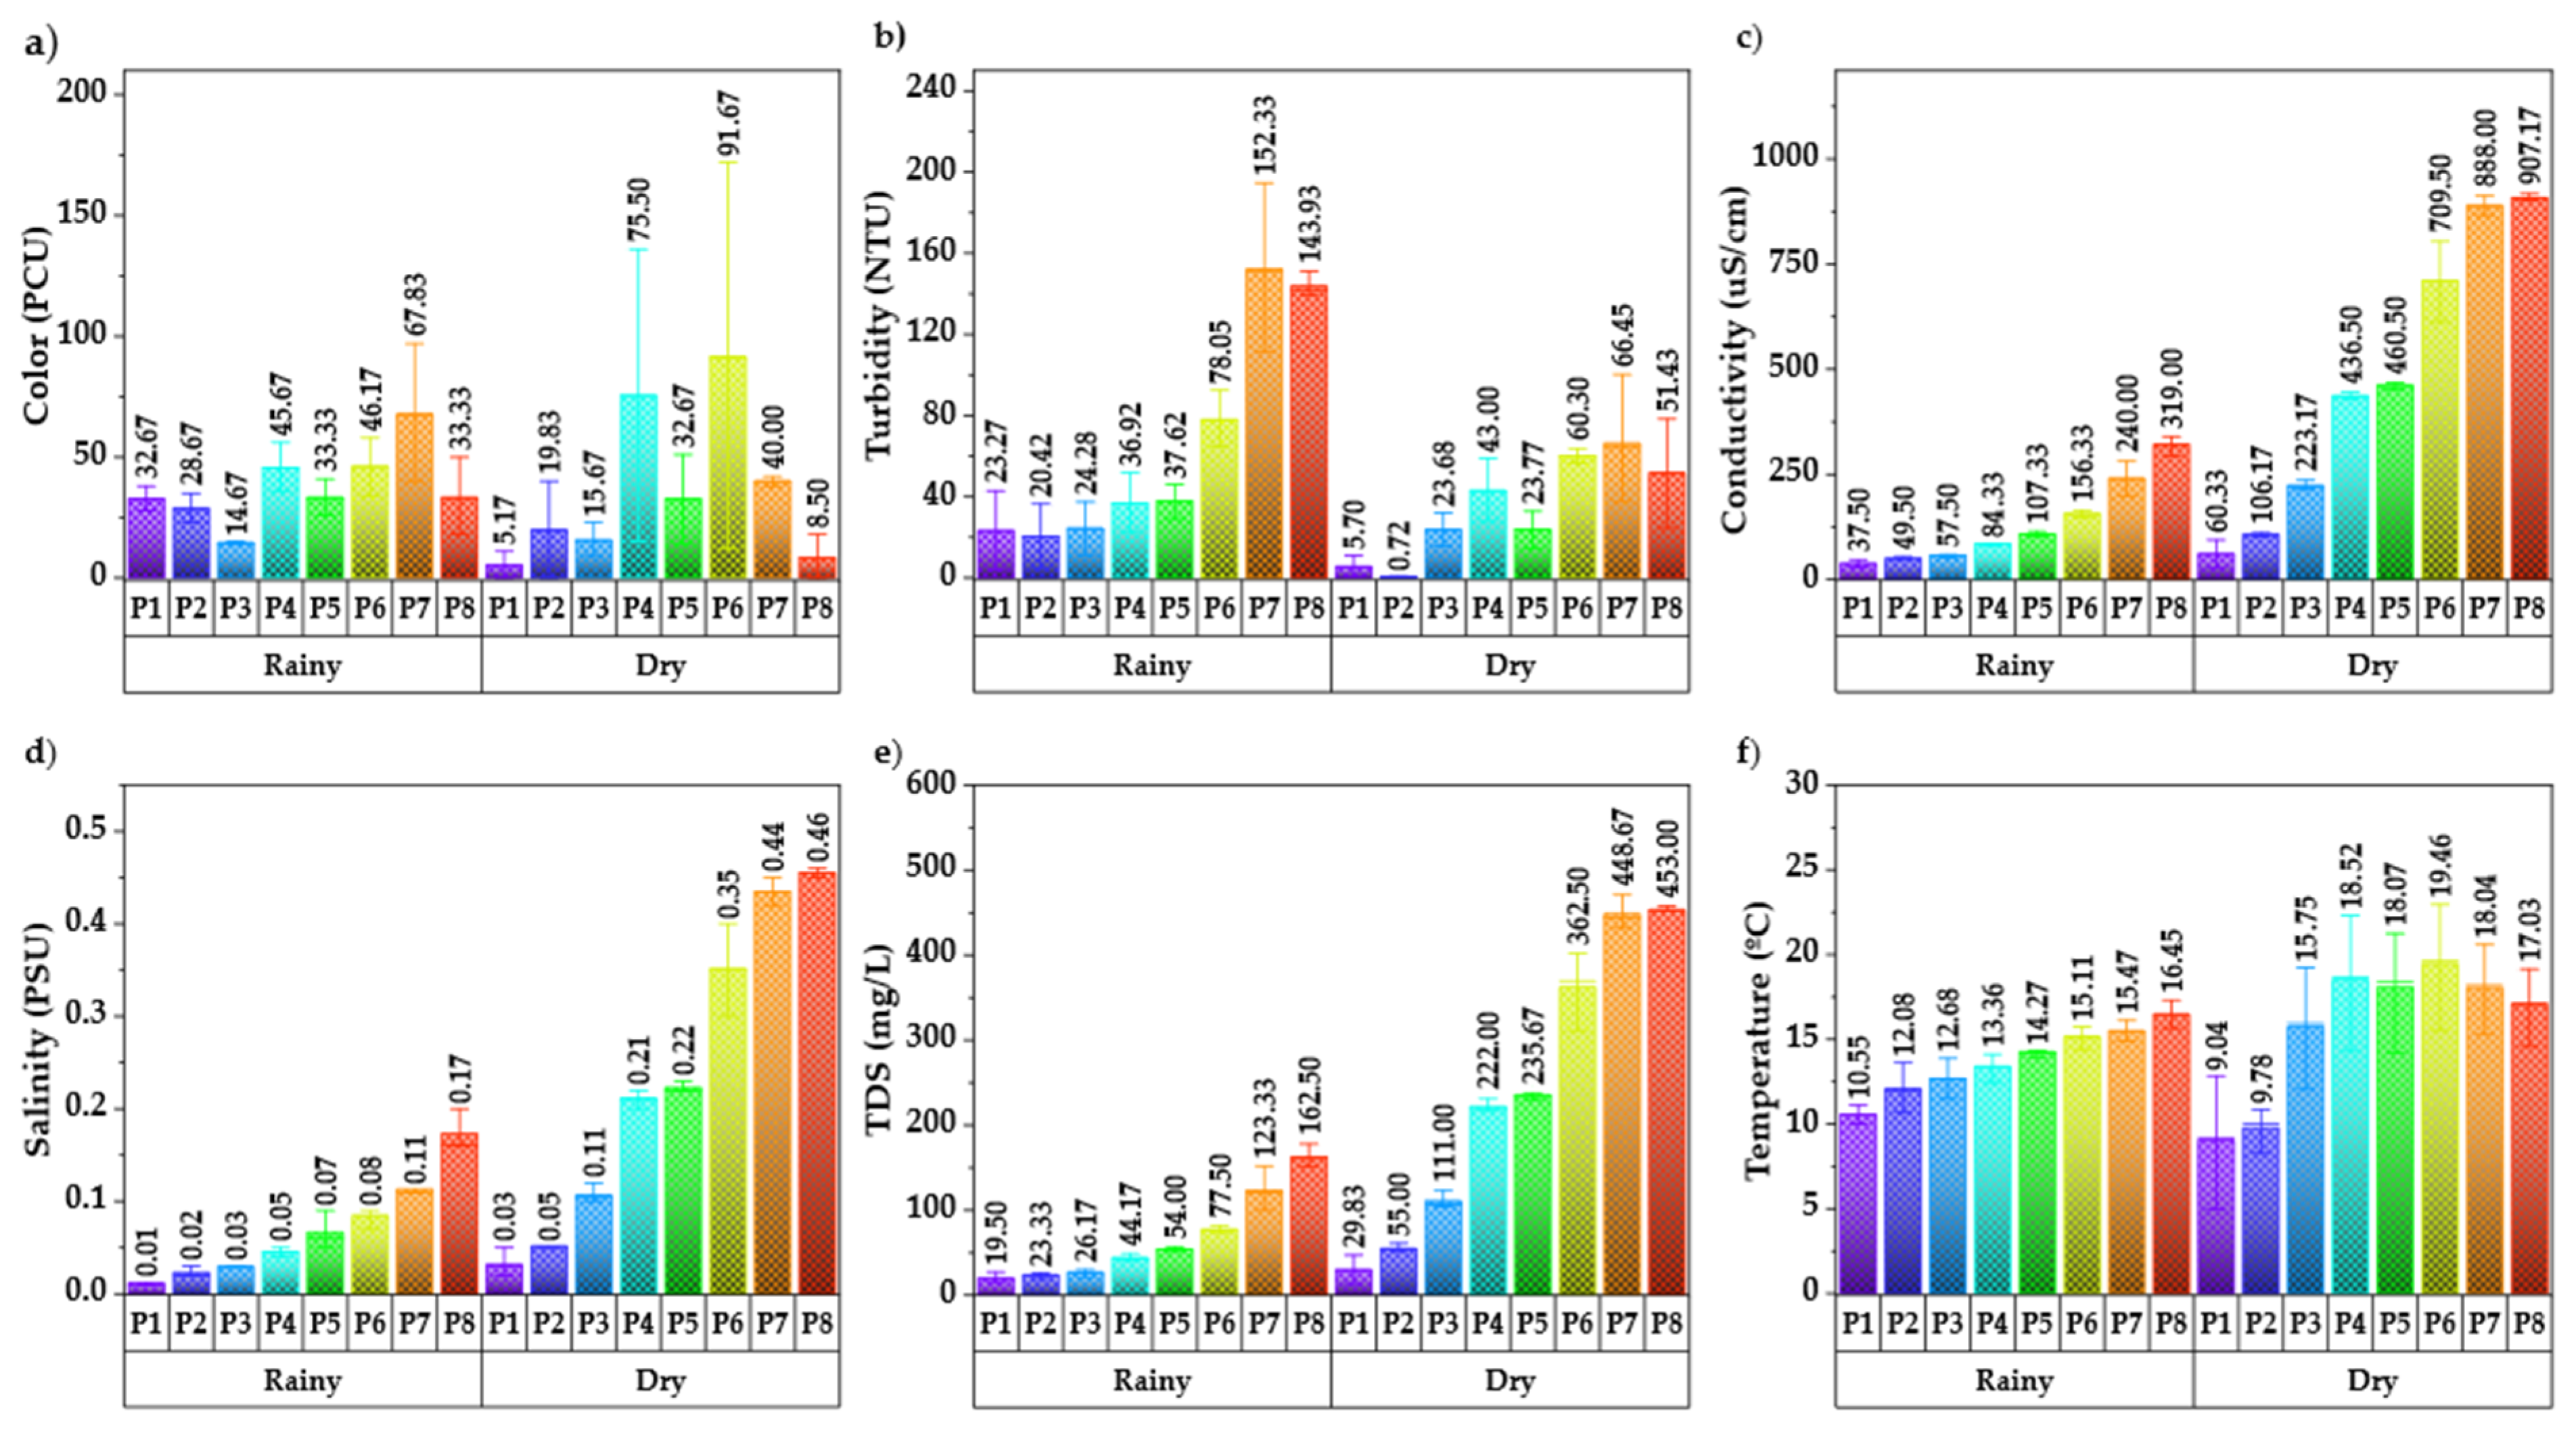
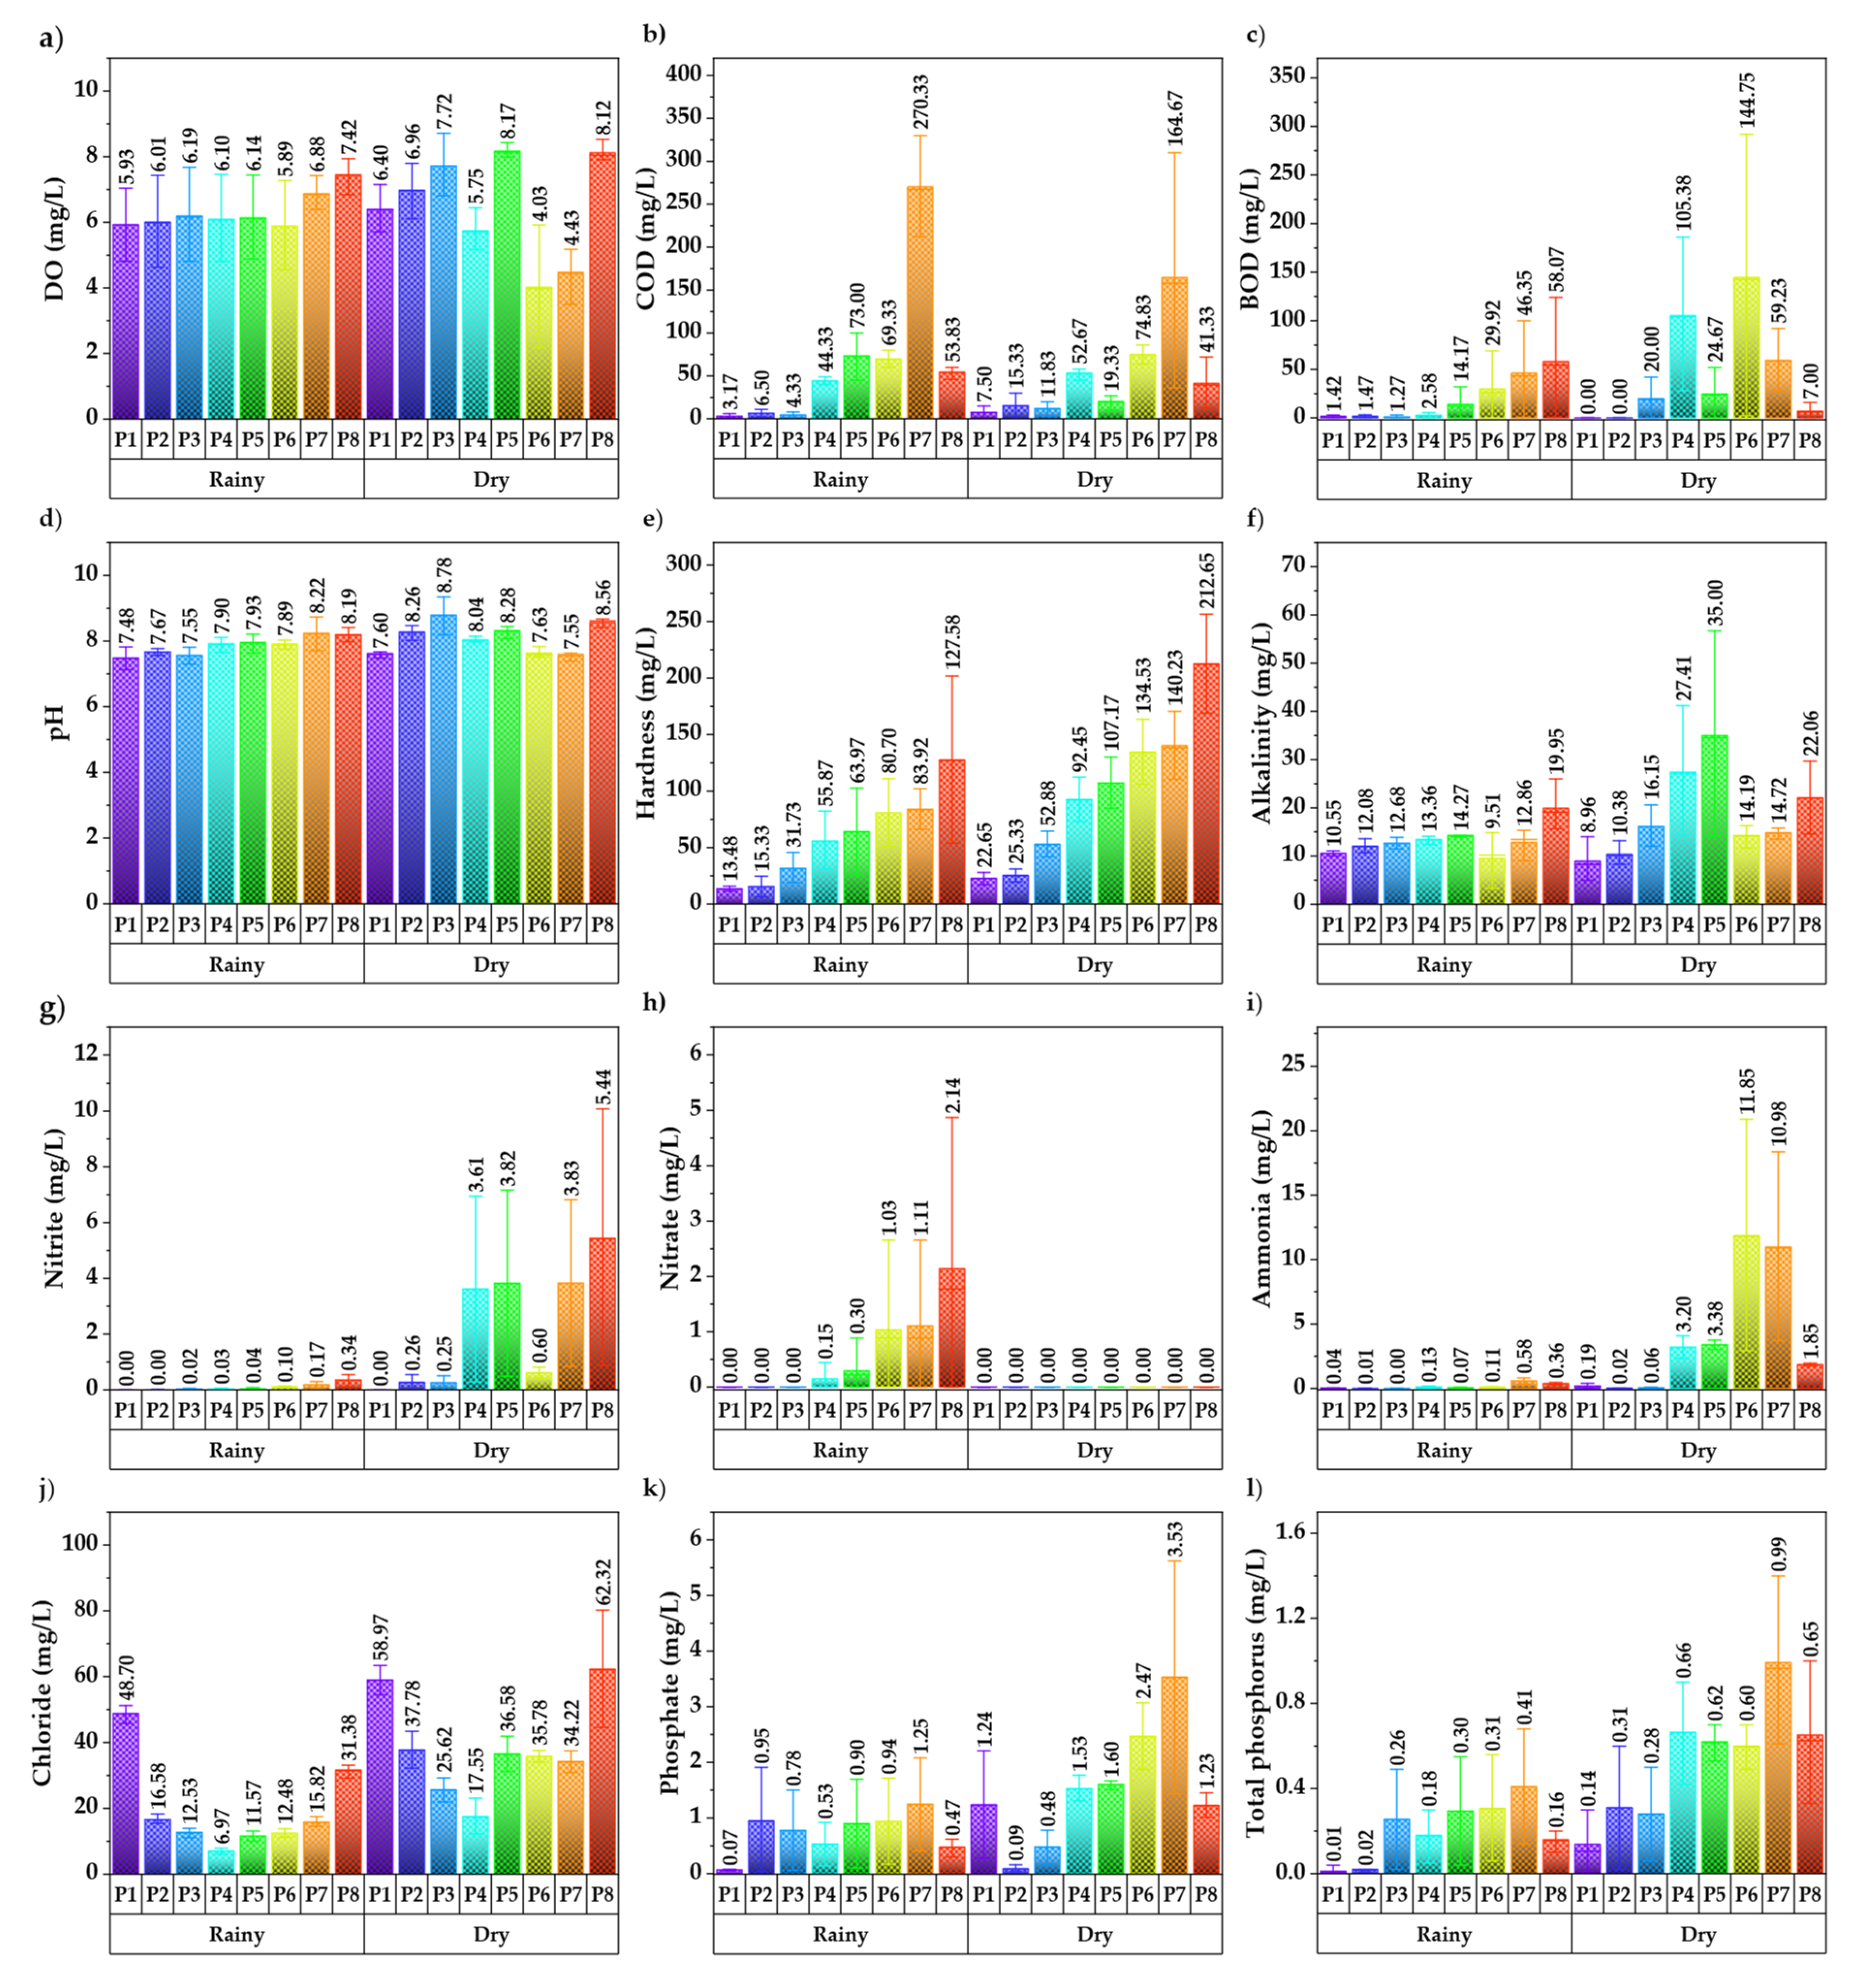
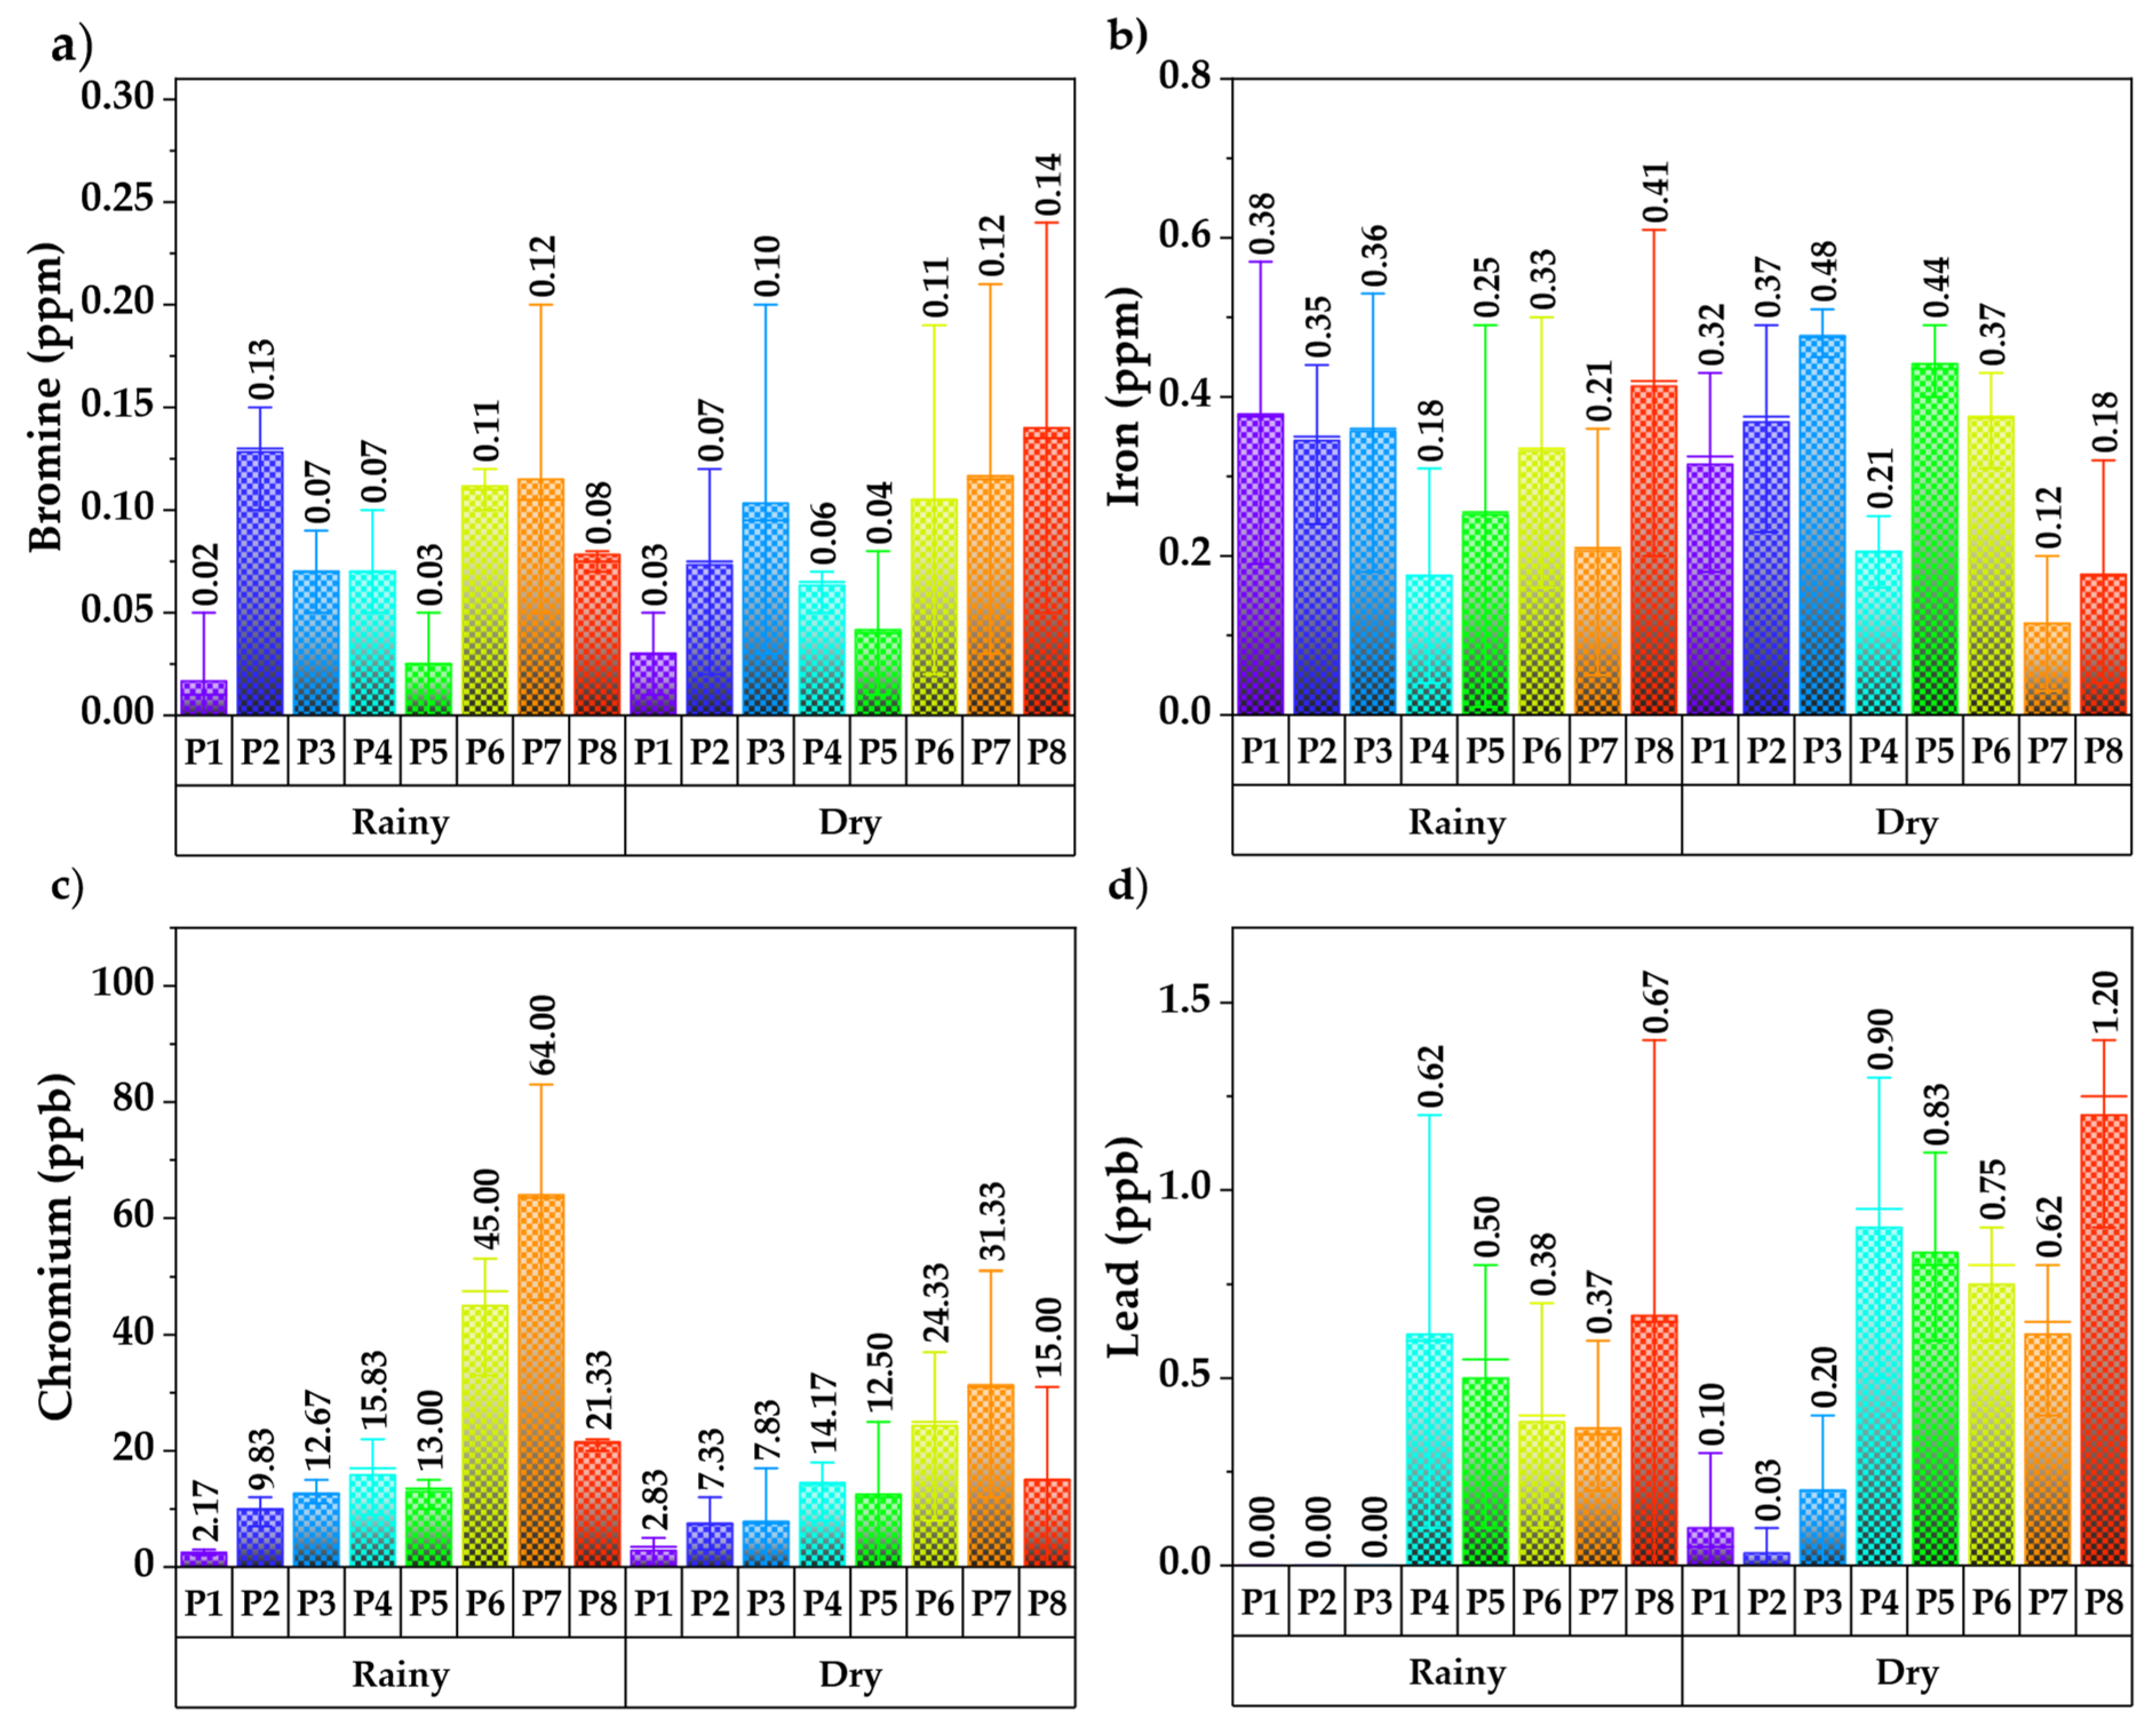
3.1. Analysis of Water Quality Parameters
3.2. Correlation of Water Quality Parameters
3.3. Spatial Similarity and Site Clustering
3.4. Spatial and Season Variation of River Water Quality
3.5. Identification of Source of Pollution
3.6. Identification of Sources of Pollution
4. Conclusions
Author Contributions
Funding
Data Availability Statement
Acknowledgments
Conflicts of Interest
References
- Mamun, M.; An, K.-G. Application of Multivariate Statistical Techniques and Water Quality Index for the Assessment of Water Quality and Apportionment of Pollution Sources in the Yeongsan River, South Korea. Int. J. Environ. Res. Public Health 2021, 18, 8268. [Google Scholar] [CrossRef] [PubMed]
- Choque-Quispe, D.; Froehner, S.; Palomino-Rincón, H.; Peralta-Guevara, D.E.; Barboza-Palomino, G.I.; Kari-Ferro, A.; Zamalloa-Puma, L.M.; Mojo-Quisani, A.; Barboza-Palomino, E.E.; Zamalloa-Puma, M.M.; et al. Proposal of a Water-Quality Index for High Andean Basins: Application to the Chumbao River, Andahuaylas, Peru. Water 2022, 14, 654. [Google Scholar] [CrossRef]
- Barakat, A.; El Baghdadi, M.; Rais, J.; Aghezzaf, B.; Slassi, M. Assessment of spatial and seasonal water quality variation of Oum Er Rbia River (Morocco) using multivariate statistical techniques. Int. Soil Water Conserv. Res. 2016, 4, 284–292. [Google Scholar] [CrossRef]
- Ligarda Samanez, C.A.; Choque Quispe, D.; Ramos Pacheco, B.S.; Peralta Guevara, D.E.; Moscoso Moscoso, E.; Rincon, H.P.; Carrión, M.L.H. The Influence of Anthropogenic Activities on the Concentration of Pesticides, Physicochemical and Microbiological Properties in the Chumbao River, Andahuaylas, Perú. Int. J. Adv. Sci. Eng. Inf. Technol. 2021, 11, 1977–1985. [Google Scholar] [CrossRef]
- Abdel-Satar, A.M.; Ali, M.H.; Goher, M.E. Indices of water quality and metal pollution of Nile River, Egypt. Egypt. J. Aquat. Res. 2017, 43, 21–29. [Google Scholar] [CrossRef]
- Varol, M. Use of water quality index and multivariate statistical methods for the evaluation of water quality of a stream affected by multiple stressors: A case study. Environ. Pollut. 2020, 266, 115417. [Google Scholar] [CrossRef]
- Zeinalzadeh, K.; Rezaei, E. Determining spatial and temporal changes of surface water quality using principal component analysis. J. Hydrol. Reg. Stud. 2017, 13, 1–10. [Google Scholar] [CrossRef]
- Wu, Z.; Wang, X.; Chen, Y.; Cai, Y.; Deng, J. Assessing river water quality using water quality index in Lake Taihu Basin, China. Sci. Total Environ. 2018, 612, 914–922. [Google Scholar] [CrossRef]
- Varol, M. Spatio-temporal changes in surface water quality and sediment phosphorus content of a large reservoir in Turkey. Environ. Pollut. 2020, 259, 113860. [Google Scholar] [CrossRef]
- Hajigholizadeh, M.; Melesse, A.M. Assortment and spatiotemporal analysis of surface water quality using cluster and discriminant analyses. Catena 2017, 151, 247–258. [Google Scholar] [CrossRef]
- Tian, Y.; Jiang, Y.; Liu, Q.; Dong, M.; Xu, D.; Liu, Y.; Xu, X. Using a water quality index to assess the water quality of the upper and middle streams of the Luanhe River, northern China. Sci. Total Environ. 2019, 667, 142–151. [Google Scholar] [CrossRef] [PubMed]
- Ustaoğlu, F.; Tepe, Y. Water quality and sediment contamination assessment of Pazarsuyu Stream, Turkey using multivariate statistical methods and pollution indicators. Int. Soil Water Conserv. Res. 2019, 7, 47–56. [Google Scholar] [CrossRef]
- Haji Gholizadeh, M.; Melesse, A.M.; Reddi, L. Water quality assessment and apportionment of pollution sources using APCS-MLR and PMF receptor modeling techniques in three major rivers of South Florida. Sci. Total Environ. 2016, 566–567, 1552–1567. [Google Scholar] [CrossRef]
- Mamun, M.; Kim, J.Y.; An, K.-G. Multivariate Statistical Analysis of Water Quality and Trophic State in an Artificial Dam Reservoir. Water 2021, 13, 186. [Google Scholar] [CrossRef]
- Singh, K.P.; Malik, A.; Sinha, S. Water quality assessment and apportionment of pollution sources of Gomti river (India) using multivariate statistical techniques—A case study. Anal. Chim. Acta 2005, 538, 355–374. [Google Scholar] [CrossRef]
- Varol, M.; Gökot, B.; Bekleyen, A.; Şen, B. Water quality assessment and apportionment of pollution sources of Tigris river (Turkey) using multivariate statistical techniques—A case study. River Res. Appl. 2012, 28, 1428–1438. [Google Scholar] [CrossRef]
- Akoto, O.; Adopler, A.; Tepkor, H.E.; Opoku, F. A comprehensive evaluation of surface water quality and potential health risk assessments of Sisa River, Kumasi. Groundw. Sustain. Dev. 2021, 15, 100654. [Google Scholar] [CrossRef]
- Oketola, A.A.; Adekolurejo, S.M.; Osibanjo, O.J.J.O.E.P. Water Quality Assessment of River Ogun Using Multivariate Statistical Techniques. J. Environ. Prot. 2013, 4, 466–479. [Google Scholar] [CrossRef] [Green Version]
- de Andrade Costa, D.; Soares de Azevedo, J.P.; dos Santos, M.A.; dos Santos Facchetti Vinhaes Assumpção, R. Water quality assessment based on multivariate statistics and water quality index of a strategic river in the Brazilian Atlantic Forest. Sci. Rep. 2020, 10, 22038. [Google Scholar] [CrossRef]
- Medeiros, A.C.; Faial, K.R.F.; do Carmo Freitas Faial, K.; da Silva Lopes, I.D.; de Oliveira Lima, M.; Guimarães, R.M.; Mendonça, N.M. Quality index of the surface water of Amazonian rivers in industrial areas in Pará, Brazil. Mar. Pollut. Bull. 2017, 123, 156–164. [Google Scholar] [CrossRef] [PubMed]
- Muniz, D.H.F.; Malaquias, J.V.; Lima, J.E.F.W.; Oliveira-Filho, E.C. Proposal of an irrigation water quality index (IWQI) for regional use in the Federal District, Brazil. Environ. Monit. Assess. 2020, 192, 607. [Google Scholar] [CrossRef]
- Pratama, M.A.; Immanuel, Y.D.; Marthanty, D.R. A Multivariate and Spatiotemporal Analysis of Water Quality in Code River, Indonesia. Sci. World J. 2020, 2020, 8897029. [Google Scholar] [CrossRef] [PubMed]
- Wrublack, S.C.; Mercante, E.; Vilas, M.A.; Prudente, V.H.R.; y Silva, J. Variation of water quality along a river in agricultural watershed with support of geographic information systems and multivariate analysis. Eng. Agrícola 2018, 38, 74–81. [Google Scholar] [CrossRef] [Green Version]
- Alves, J.P.H.; Fonseca, L.C.; Chielle, R.S.A.; Macedo, L.C.B. Monitoring water quality of the Sergipe River basin: An evaluation using multivariate data analysis. Braz. J. Water Resour. 2018, 23. [Google Scholar] [CrossRef] [Green Version]
- Rahman, K.; Barua, S.; Imran, H.M. Assessment of water quality and apportionment of pollution sources of an urban lake using multivariate statistical analysis. Clean. Eng. Technol. 2021, 5, 100309. [Google Scholar] [CrossRef]
- Cecconello, S.T.; Centeno, L.N.; Guedes, H.A.S.; Cecconello, S.T.; Centeno, L.N.; Guedes, H.A.S. Water quality index modified by using multivariate analysis: A case study of Pelotas Stream, RS, Brazil. Eng. Sanit. E Ambient. 2018, 23, 973–978. [Google Scholar] [CrossRef]
- Silva, M.I.; Gonçalves, A.M.L.; Lopes, W.A.; Lima, M.T.V.; Costa, C.T.F.; Paris, M.; Firmino, P.R.A.; De Paula Filho, F.J. Assessment of groundwater quality in a Brazilian semiarid basin using an integration of GIS, water quality index and multivariate statistical techniques. J. Hydrol. 2021, 598, 126346. [Google Scholar] [CrossRef]
- Liu, J.; Zhang, D.; Tang, Q.; Xu, H.; Huang, S.; Shang, D.; Liu, R. Water quality assessment and source identification of the Shuangji River (China) using multivariate statistical methods. PLoS ONE 2021, 16, e0245525. [Google Scholar] [CrossRef]
- Liu, G.; Ma, F.; Liu, G.; Zhao, H.; Guo, J.; Cao, J. Application of Multivariate Statistical Analysis to Identify Water Sources in a Coastal Gold Mine, Shandong, China. Sustainability 2019, 11, 3345. [Google Scholar] [CrossRef] [Green Version]
- Zhang, X.; Wang, Q.; Liu, Y.; Wu, J.; Yu, M. Application of multivariate statistical techniques in the assessment of water quality in the Southwest New Territories and Kowloon, Hong Kong. Environ. Monit. Assess. 2011, 173, 17–27. [Google Scholar] [CrossRef]
- Lee, K.-H.; Kang, T.-W.; Ryu, H.-S.; Hwang, S.-H.; Kim, K. Analysis of spatiotemporal variation in river water quality using clustering techniques: A case study in the Yeongsan River, Republic of Korea. Environ. Sci. Pollut. Res. 2020, 27, 29327–29340. [Google Scholar] [CrossRef] [PubMed]
- Elumalai, V.; Nethononda, V.G.; Manivannan, V.; Rajmohan, N.; Li, P.; Elango, L. Groundwater quality assessment and application of multivariate statistical analysis in Luvuvhu catchment, Limpopo, South Africa. J. Afr. Earth Sci. 2020, 171, 103967. [Google Scholar] [CrossRef]
- Alam, R.; Ahmed, Z.; Seefat, S.M.; Nahin, K.T.K. Assessment of surface water quality around a landfill using multivariate statistical method, Sylhet, Bangladesh. Environ. Nanotechnol. Monit. Manag. 2021, 15, 100422. [Google Scholar] [CrossRef]
- Ramirez, A.; Restrepo, R.; Cardeñosa, M. Índices de contaminación para caracterización de aguas continentales y vertimientos. Formulaciones. Cienc. Tecnol. Futuro 1999, 1, 89–99. [Google Scholar]
- Uddin, M.G.; Nash, S.; Olbert, A.I. A review of water quality index models and their use for assessing surface water quality. Ecol. Indic. 2021, 122, 107218. [Google Scholar] [CrossRef]
- Akhtar, N.; Ishak, M.I.; Ahmad, M.I.; Umar, K.; Md Yusuff, M.S.; Anees, M.T.; Qadir, A.; Ali Almanasir, Y.K. Modification of the Water Quality Index (WQI) Process for Simple Calculation Using the Multi-Criteria Decision-Making (MCDM) Method: A Review. Water 2021, 13, 905. [Google Scholar] [CrossRef]
- Lumb, A.; Sharma, T.C.; Bibeault, J.-F. A Review of Genesis and Evolution of Water Quality Index (WQI) and Some Future Directions. Water Qual. Expo. Health 2011, 3, 11–24. [Google Scholar] [CrossRef]
- Horton, R.K. An index number system for rating water quality. J. Water Pollut. Control Fed. 1965, 37, 300–306. [Google Scholar]
- Tiri, A.; Lahbari, N.; Boudoukha, A. Assessment of the quality of water by hierarchical cluster and variance analyses of the Koudiat Medouar Watershed, East Algeria. Appl. Water Sci. 2017, 7, 4197–4206. [Google Scholar] [CrossRef] [Green Version]
- Hossain, M.; Patra, P.K. Water pollution index—A new integrated approach to rank water quality. Ecol. Indic. 2020, 117, 106668. [Google Scholar] [CrossRef]
- Choque-Quispe, D.; Ligarda-Samanez, C.A.; Solano-Reynoso, A.M.; Ramos-Pacheco, B.S.; Quispe-Quispe, Y.; Choque-Quispe, Y.; Kari-Ferro, A. Índice de calidad de agua en la microcuenca altoandina del río Chumbao, Andahuaylas, Apurímac, Perú. Tecnol. Cienc. Agua 2021, 12, 37–73. [Google Scholar] [CrossRef]
- Choque-Quispe, D.; Ramos-Pacheco, B.S.; Ligarda-Samanez, C.A.; Solano-Reynoso, A.M.; Correa-Cuba, O.; Quispe-Quispe, Y.; Choque-Quispe, Y. Water pollution index of high Andean micro-basin of the Chumbao River, Andahuaylas, Peru. Rev. Fac. Ing. Univ. Antioq. 2021, 20–28. [Google Scholar] [CrossRef]
- Custodio, M.; Peñaloza, R. Data on the spatial and temporal variability of physical-chemical water quality indicators of the Cunas River, Peru. Chem. Data Collect. 2021, 33, 100672. [Google Scholar] [CrossRef]
- Choque-Quispe, D.; Ligarda-Samanez, C.A.; Ramos-Pacheco, B.S.; Solano-Reynoso, A.M.; Quispe-Quispe, Y. Cafeína y barrido UV-Vis y el índice de calidad de agua en la microcuenca altoandina del río Chumbao, Andahuaylas, Apurímac, Perú. J. Tecnol. Química 2019, 39, 619–637. [Google Scholar]
- Ana, A.N.d.A. Autoridad Nacional del Agua—Protocolo Nacional para el Monitoreo de la Calidad de Recursos Hídricos Superficiales 2016. Available online: https://www.ana.gob.pe/publicaciones/protocolo-nacional-para-el-monitoreo-de-la-calidad-de-los-recursos-hidricos-0 (accessed on 18 January 2023).
- Baird, R.; Bridgewater, L. Standard Methods for the Examination of Water and Wastewater, 23rd ed.; American Public Health Association: Washington, DC, USA, 2017. [Google Scholar]
- Minam, M.d.A. Ministerio del Ambiente—Estándar de Calidad Ambiental del Agua Decreto Supremo N°004-2017-MINAM. Available online: https://www.minam.gob.pe/disposiciones/decreto-supremo-n-004-2017-minam/ (accessed on 18 January 2023).
- Noori, R.; Sabahi, M.S.; Karbassi, A.R.; Baghvand, A.; Taati Zadeh, H. Multivariate statistical analysis of surface water quality based on correlations and variations in the data set. Desalination 2010, 260, 129–136. [Google Scholar] [CrossRef]
- Dimri, D.; Daverey, A.; Kumar, A.; Sharma, A. Monitoring water quality of River Ganga using multivariate techniques and WQI (Water Quality Index) in Western Himalayan region of Uttarakhand, India. Environ. Nanotechnol. Monit. Manag. 2021, 15, 100375. [Google Scholar] [CrossRef]
- Bozorg-Haddad, O.; Delpasand, M.; Loáiciga, H.A. 10—Water quality, hygiene, and health. In Economical, Political, and Social Issues in Water Resources; Bozorg-Haddad, O., Ed.; Elsevier: Amsterdam, The Netherlands, 2021; pp. 217–257. [Google Scholar]
- Jain, S.K.; Singh, V.P. Chapter 4—Statistical Techniques for Data Analysis. In Developments in Water Science; Jain, S.K., Singh, V.P., Eds.; Elsevier: Amsterdam, The Netherlands, 2003; Volume 51, pp. 207–276. [Google Scholar]
- Kosseva, M.R. Chapter 4—Sources, characteristics, treatment, and analyses of animal-based food wastes. In Food Industry Wastes, 2nd ed.; Kosseva, M.R., Webb, C., Eds.; Academic Press: Cambridge, MA, USA, 2020; pp. 67–85. [Google Scholar]
- Boyd, C.E.; Tucker, C.S.; Somridhivej, B. Alkalinity and Hardness: Critical but Elusive Concepts in Aquaculture. J. World Aquac. Soc. 2016, 47, 6–41. [Google Scholar] [CrossRef]
- Martínez-Alvarez, V.; González-Ortega, M.J.; Martin-Gorriz, B.; Soto-García, M.; Maestre-Valero, J.F. 14—Seawater desalination for crop irrigation—Current status and perspectives. In Emerging Technologies for Sustainable Desalination Handbook; Gude, V.G., Ed.; Butterworth-Heinemann: Oxford, UK, 2018; pp. 461–492. [Google Scholar]
- Trick, J.K.; Stuart, M.; Reeder, S. Chapter 3—Contaminated Groundwater Sampling and Quality Control of Water Analyses. In Environmental Geochemistry, 2nd ed.; De Vivo, B., Belkin, H.E., Lima, A., Eds.; Elsevier: Amsterdam, The Netherlands, 2018; pp. 25–45. [Google Scholar]
- Li, Y.; Yang, Z.; Yang, K.; Wei, J.; Li, Z.; Ma, C.; Yang, X.; Wang, T.; Zeng, G.; Yu, G.; et al. Removal of chloride from water and wastewater: Removal mechanisms and recent trends. Sci. Total Environ. 2022, 821, 153174. [Google Scholar] [CrossRef]
- Brandt, M.J.; Johnson, K.M.; Elphinston, A.J.; Ratnayaka, D.D. Chapter 7—Chemistry, Microbiology and Biology of Water. In Twort’s Water Supply, 7th ed.; Brandt, M.J., Johnson, K.M., Elphinston, A.J., Ratnayaka, D.D., Eds.; Butterworth-Heinemann: Boston, MA, USA, 2017; pp. 235–321. [Google Scholar]
- Das, P.; Chetry, B.; Paul, S.; Bhattacharya, S.S.; Nath, P. Detection and quantification of phosphate in water and soil using a smartphone. Microchem. J. 2022, 172, 106949. [Google Scholar] [CrossRef]
- Abdulla, M. Chapter 13—Lead. In Essential and Toxic Trace Elements and Vitamins in Human Health; Prasad, A.S., Brewer, G.J., Eds.; Academic Press: Cambridge, MA, USA, 2020; pp. 181–191. [Google Scholar]
- Roy, S.; Edwards, M.A. Preventing another lead (Pb) in drinking water crisis: Lessons from the Washington D.C. and Flint MI contamination events. Curr. Opin. Environ. Sci. Health 2019, 7, 34–44. [Google Scholar] [CrossRef]
- Sarkar, M.; Rahman, A.K.M.L.; Bhoumik, N.C. Remediation of chromium and copper on water hyacinth (E. crassipes) shoot powder. Water Resour. Ind. 2017, 17, 1–6. [Google Scholar] [CrossRef]
- Inyinbor Adejumoke, A.; Adebesin Babatunde, O.; Oluyori Abimbola, P.; Adelani-Akande Tabitha, A.; Dada Adewumi, O.; Oreofe Toyin, A. Water Pollution: Effects, Prevention, and Climatic Impact. In Water Challenges of an Urbanizing World; Matjaž, G., Ed.; IntechOpen: Rijeka, Croatia, 2018; pp. 33–47. [Google Scholar]
- Rahman, S.S.; Hossain, M.M. Gulshan Lake, Dhaka City, Bangladesh, an onset of continuous pollution and its environmental impact: A literature review. Sustain. Water Resour. Manag. 2019, 5, 767–777. [Google Scholar] [CrossRef]
- Thirumalini, S.; Joseph, K. Correlation between electrical conductivity and total dissolved solids in natural waters. Malays. J. Sci. 2009, 28, 55–61. [Google Scholar] [CrossRef]
- Segnini, S.; Chacón, M.M.J.E. Caracterización fisicoquímica del hábitat interno y ribereño de los ríos andinos en la cordillera de Mérida, Venezuela. An. Acad. Bras. Ciências 2005, 18, 38–61. [Google Scholar]
- Mani Tripathi, S.; Chaurasia, S. Detection of Chromium in surface and groundwater and its bio-absorption using bio-wastes and vermiculite. Eng. Sci. Technol. Int. J. 2020, 23, 1153–1161. [Google Scholar] [CrossRef]
- Izbicki, J.A.; Wright, M.T.; Seymour, W.A.; McCleskey, R.B.; Fram, M.S.; Belitz, K.; Esser, B.K. Cr(VI) occurrence and geochemistry in water from public-supply wells in California. Appl. Geochem. 2015, 63, 203–217. [Google Scholar] [CrossRef] [Green Version]
- Bendicho, C.; Lavilla, I. WATER ANALYSIS|Sewage. In Encyclopedia of Analytical Science, 2nd ed.; Worsfold, P., Townshend, A., Poole, C., Eds.; Elsevier: Oxford, UK, 2005; pp. 300–307. [Google Scholar]
- Verma, P.; Ratan, J.K. Chapter 5—Assessment of the negative effects of various inorganic water pollutants on the biosphere—An overview. In Inorganic Pollutants in Water; Devi, P., Singh, P., Kansal, S.K., Eds.; Elsevier: Amsterdam, The Netherlands, 2020; pp. 73–96. [Google Scholar]
- Adams, F.V.; Wakaso, A.I.; Daramola, M.O.; Oluwasina, O.O.; Mulaba-Bafubiandi, A.F.; Joshua, M.O.; Chukwuneke, C.E.; O’donnell, S.P. 11—Remediation of oil-contaminated water for reuse using polymeric nanocomposites. In Water Engineering Modeling and Mathematic Tools; Samui, P., Bonakdari, H., Deo, R., Eds.; Elsevier: Amsterdam, The Netherlands, 2021; pp. 213–234. [Google Scholar]
- Mattson, M.D. Alkalinity of Freshwater. In Reference Module in Earth Systems and Environmental Sciences; Elsevier: Amsterdam, The Netherlands, 2014. [Google Scholar]
- Chanda, S.; Mehendale, H.M. Bromine. In Encyclopedia of Toxicology, 2nd ed.; Wexler, P., Ed.; Elsevier: New York, NY, USA, 2005; pp. 342–344. [Google Scholar]
- von Glasow, R.; Hughes, C. BIOGEOCHEMICAL CYCLES|Bromine. In Encyclopedia of Atmospheric Sciences, 2nd ed.; North, G.R., Pyle, J., Zhang, F., Eds.; Academic Press: Oxford, UK, 2015; pp. 194–200. [Google Scholar]
- Winid, B. Bromine and water quality—Selected aspects and future perspectives. Appl. Geochem. 2015, 63, 413–435. [Google Scholar] [CrossRef]
- Khanoranga; Khalid, S. An assessment of groundwater quality for irrigation and drinking purposes around brick kilns in three districts of Balochistan province, Pakistan, through water quality index and multivariate statistical approaches. J. Geochem. Explor. 2019, 197, 14–26. [Google Scholar] [CrossRef]
- Varol, M.; Li, S. Biotic and abiotic controls on CO2 partial pressure and CO2 emission in the Tigris River, Turkey. Chem. Geol. 2017, 449, 182–193. [Google Scholar] [CrossRef]
- Zobkov, M.B.; Zobkova, M.V. New spectroscopic method for true color determination in natural water with high agreement with visual methods. Water 2020, 177, 115773. [Google Scholar] [CrossRef]
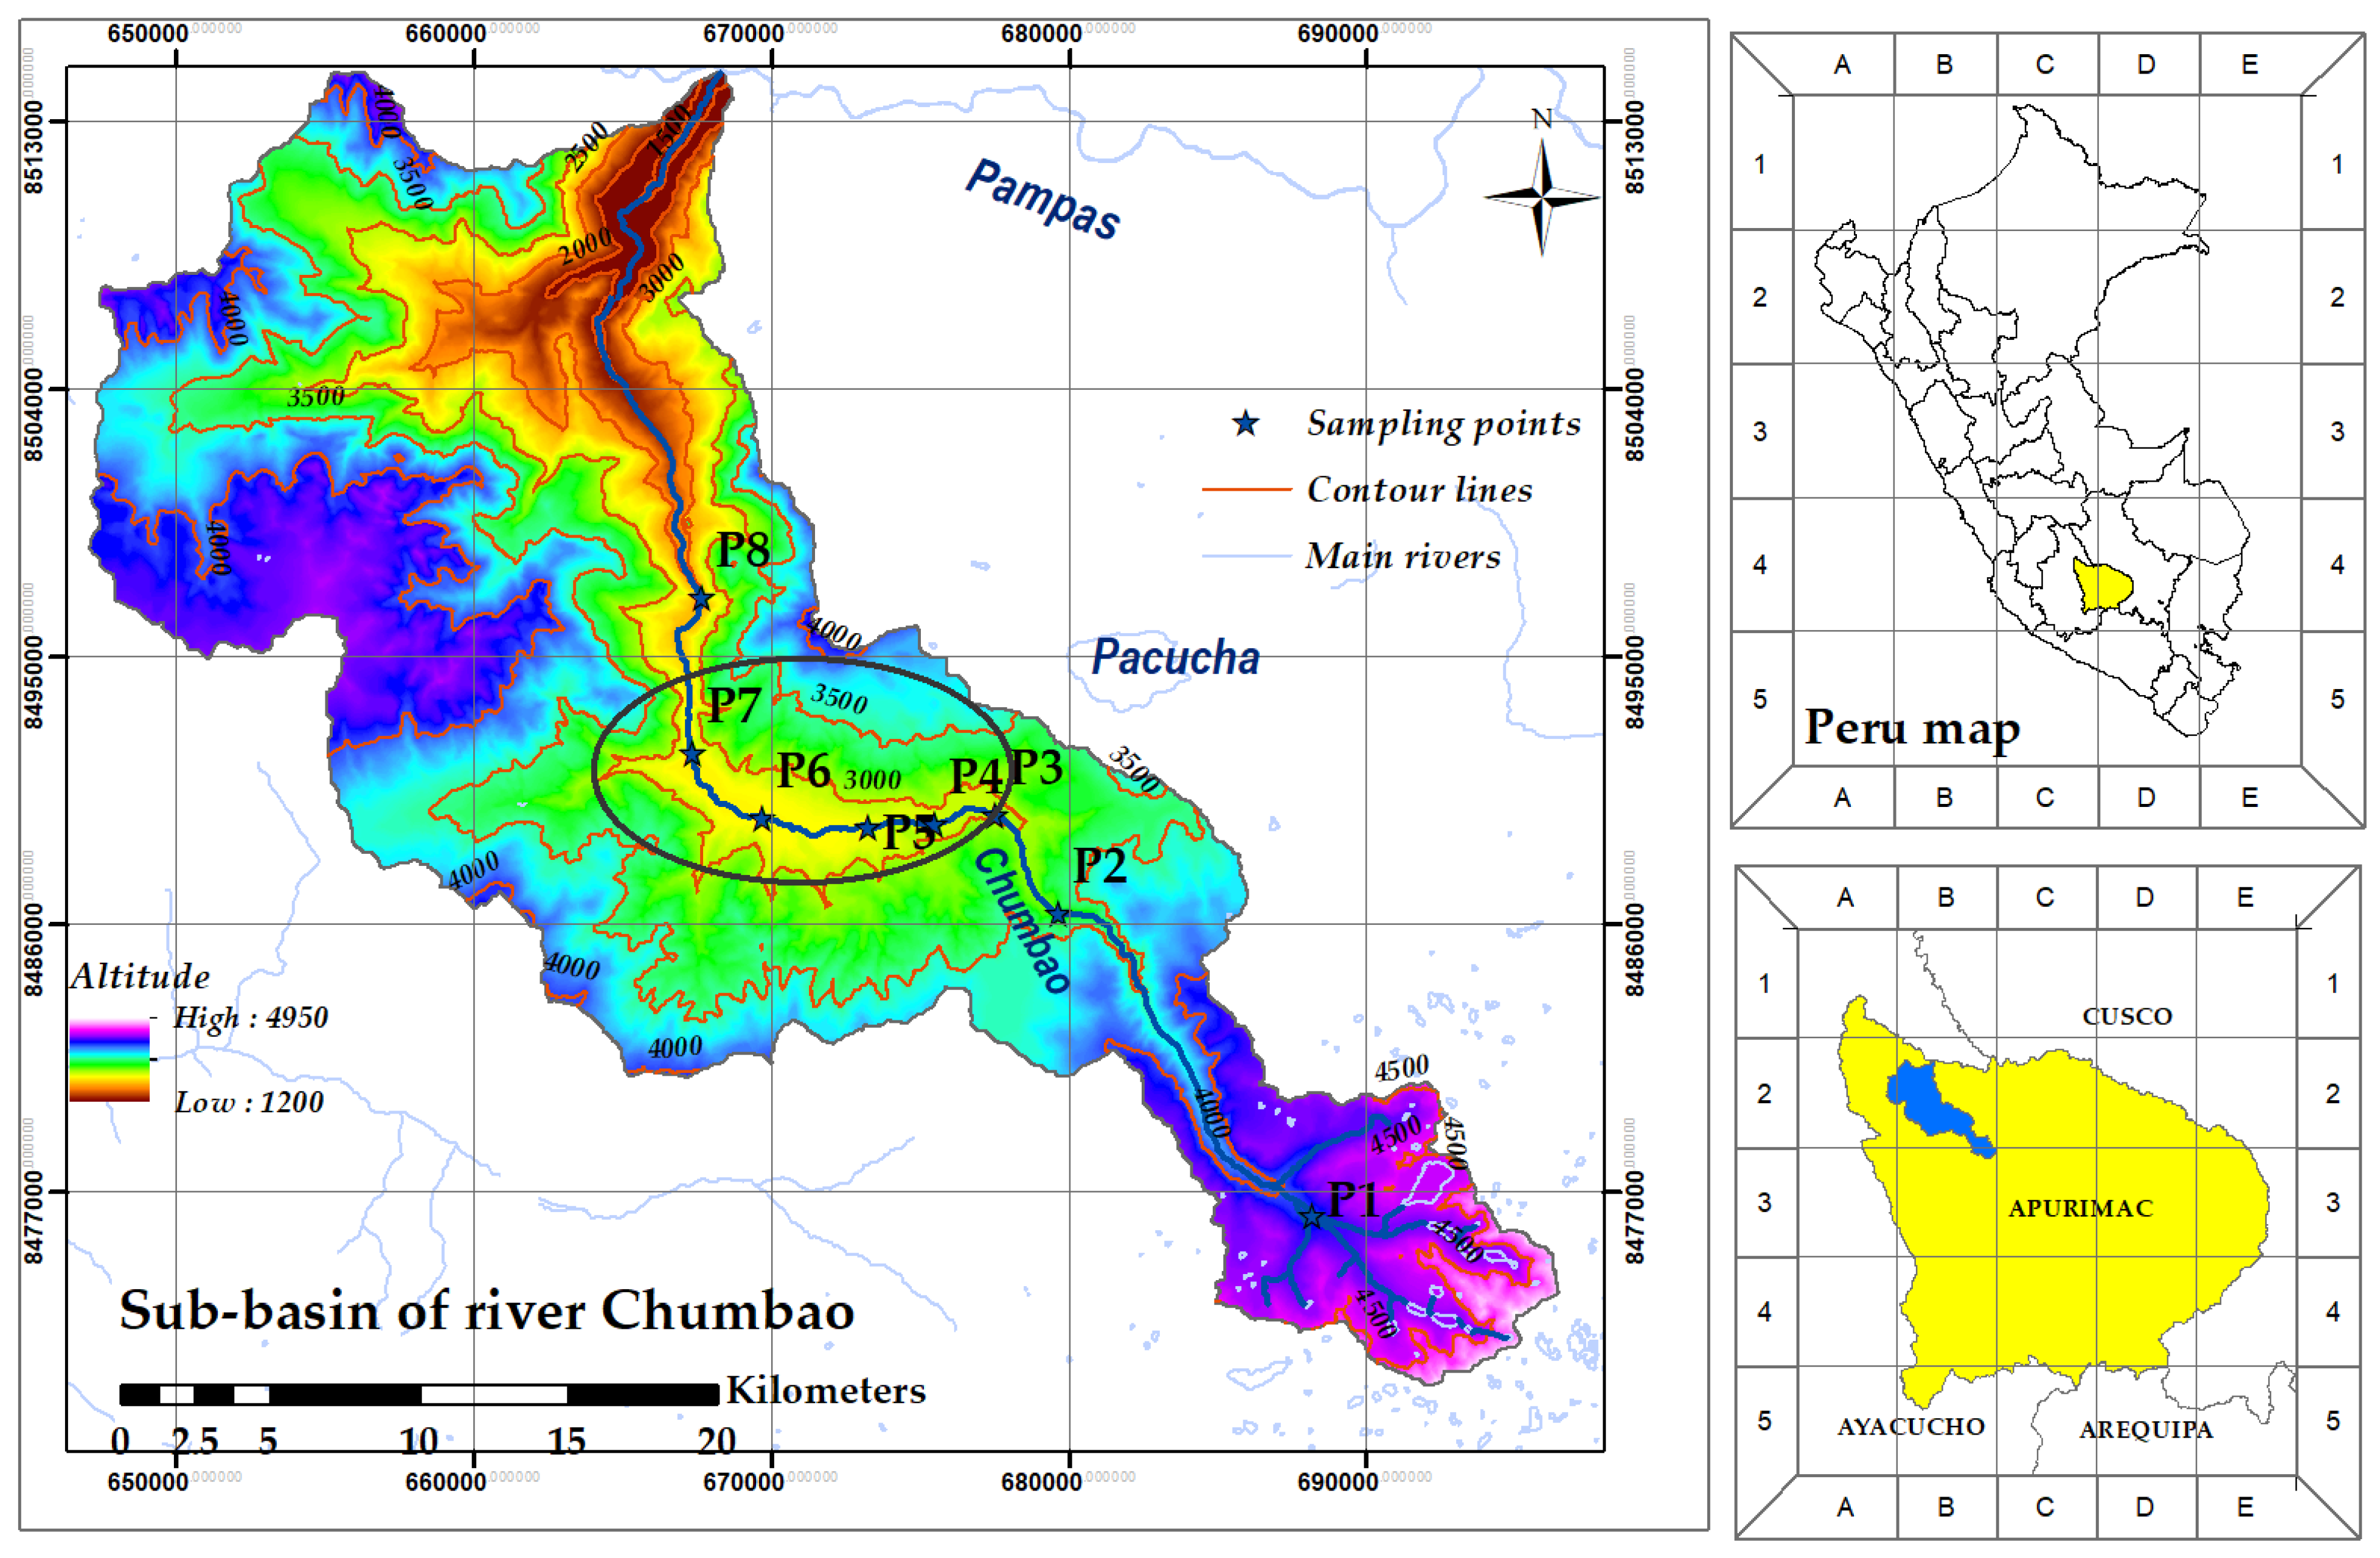


| Sampling Points | Altitude (m) | Reference | Coordinates | Characteristics of the Area | Referential Photo | |
|---|---|---|---|---|---|---|
| South | West | |||||
| P1 | 4079 | River headwater | 13°46′38.4″ | 073°15′32.3″ | Water collecting basin/native flora and fauna |  |
| P2 | 3184 | Hydroelectric | 13°41′10.9″ | 073°20′19.7″ | Water collection basin/limited agriculture and grazing | 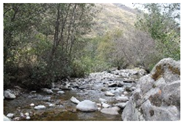 |
| P3 | 2978 | Suylluhuacca bridge | 13°39′23.4″ | 073°21′30.7″ | Limited urbanization, agriculture, and intense grazing |  |
| P4 | 2916 | Andahuaylas coliseum | 13°39′33.2″ | 073°22′38.2″ | Increasing urbanization, limited agriculture and grazing, limited urban industry | 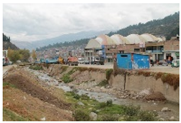 |
| P5 | 2872 | Engineering barracks | 13°39′37.0″ | 073°23′52.7″ | High urbanization and limited urban industry | 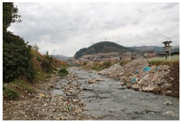 |
| P6 | 2807 | GREMAR college | 13°39′27.4″ | 073°25′50.8″ | High urbanization, limited agriculture, and grazing | 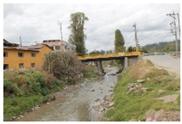 |
| P7 | 2767 | Chihuampata bridge | 13°38′17.0″ | 073°27′10.6″ | Limited urbanization, agriculture, and intense grazing |  |
| P8 | 2572 | Posoccoy bridge | 13°35′26.4″ | 073°27′00.8″ | Agriculture and intense grazing | 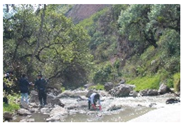 |
| Parameter | Method | Reference |
|---|---|---|
| Color | Spectrophotometric | 2120 B Standard Methods |
| Turbidity | Selective electrode (NFU) | User manual, Multiparameter |
| Conductivity | Selective electrode (Conductometer) | User manual, Multiparameter |
| Salinity | Selective electrode (Conductometer) | 2520 B Standard Methods |
| TDS | Selective electrode (Conductometer) | 2540 C Standard Methods |
| Temperature | Selective electrode (thermometer) | User manual, Multiparameter |
| Alkalinity | Spectrophotometric | User manual, Photometer |
| Hardness | Spectrophotometric | User manual, Photometer |
| Chloride | Chloride selective electrode (ISE) | User manual, Multiparameter |
| pH | Potentiometric | User manual, Multiparameter |
| Ammonia | Ammonia selective electrode (ISE) | 4500-NH3 D Standard Methods |
| Nitrite | Spectrophotometric | User manual, Photometer |
| Nitrate | Nitrate selective electrode (ISE) | User manual, Multiparameter |
| Phosphate | Spectrophotometric | User manual, Photometer |
| DO | Selective electrode (oximetry) | User manual, Multiparameter |
| BOD | Respirometry/manometric | 4500-0C y 5210 B Standard Methods |
| COD | Spectrophotometric | User manual, Photometer |
| Total phosphorus | Spectrophotometric | User manual, Photometer |
| Chromium | Spectrophotometric | User manual, Photometer |
| Lead | Spectrophotometric | User manual, ICP-OES |
| Iron | Spectrophotometric | User manual, Photometer |
| Bromine | Spectrophotometric | User manual, Photometer |
| Total coliforms | Fermentation | 9221 B y 9221C Standard Methods |
| Thermotolerant coliforms | Thermotolerant coliform | 9221 E Standard Method |
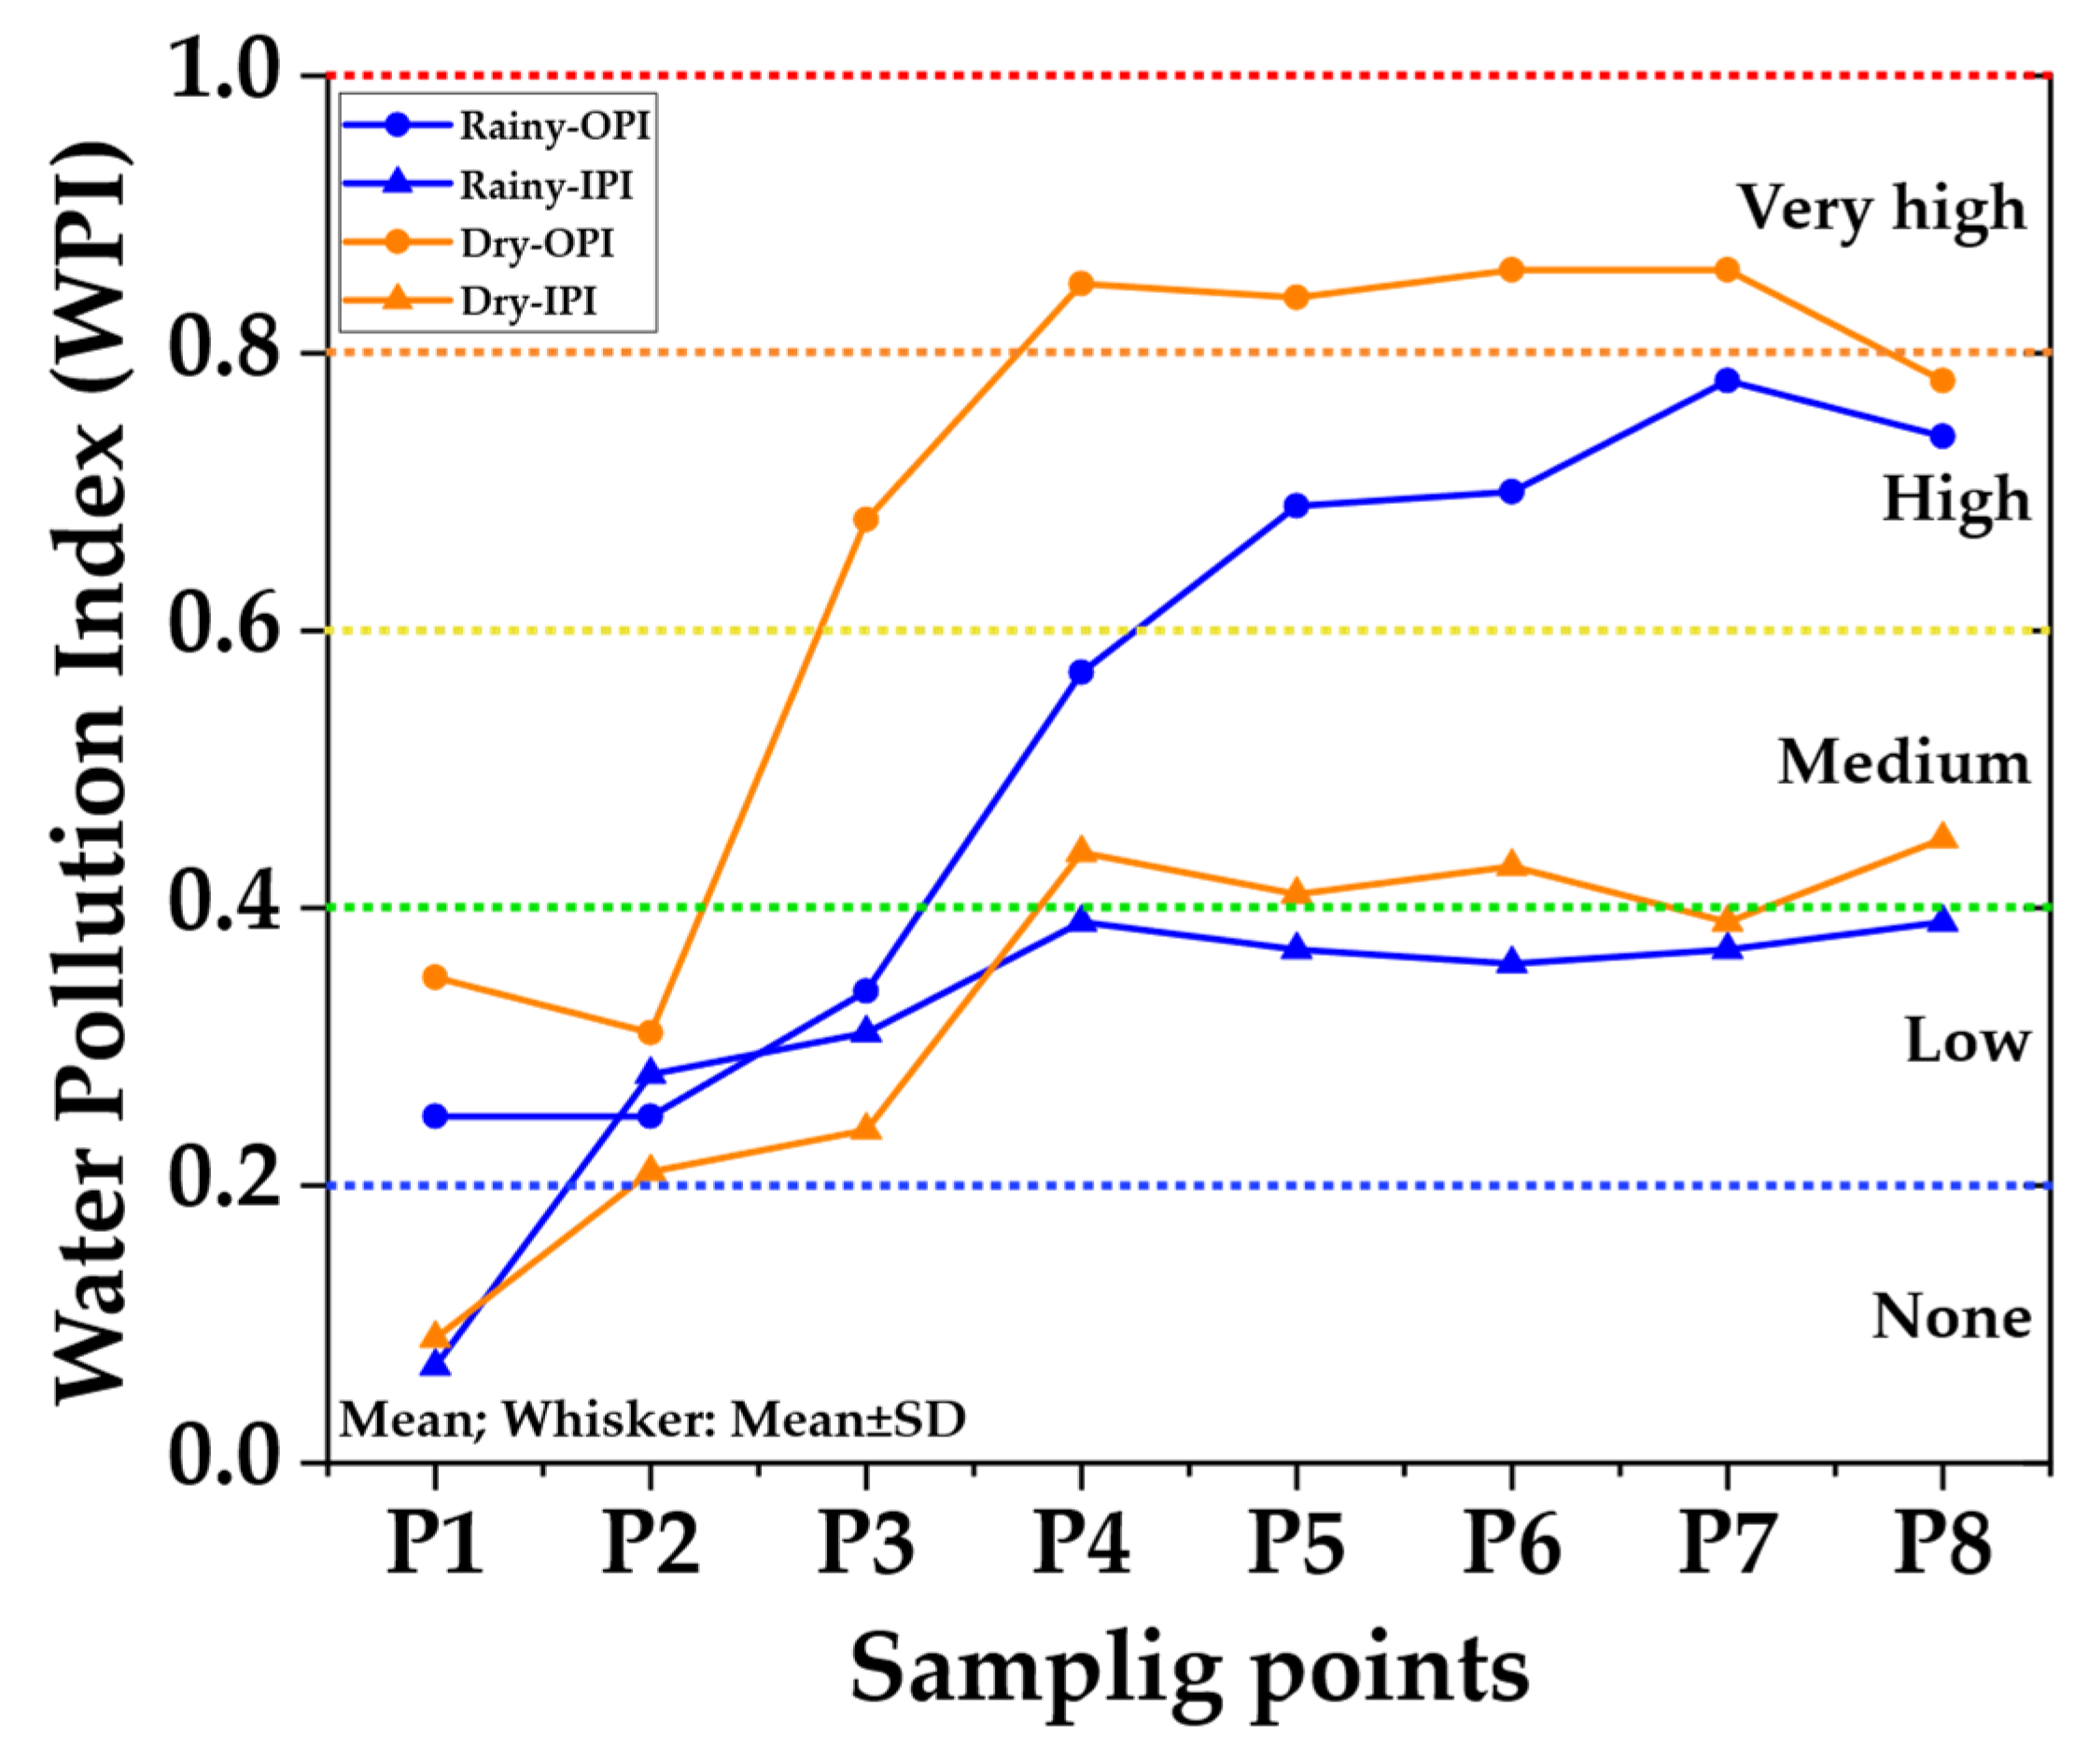
| WPI | Pollution | Color Scale | Characterization |
|---|---|---|---|
| 0.0–0.2 | None | Blue | Pure waters, perhaps with biogenic contributions |
| >0.2–0.4 | Low | Green | Mild anthropic incidence |
| >0.4–0.6 | Medium | Yellow | Notable anthropic activity |
| >0.6–0.8 | High | Orange | Important incidence of pollution |
| >0.8–1.0 | Very high | Red | Highly polluted areas |
| Parameters | N | Min | Max | Mean | SD | CV | ESQ | Units |
|---|---|---|---|---|---|---|---|---|
| Color | 96 | 0.00 | 172.00 | 36.96 | 36.08 | 97.62 | 20 | PCU |
| Turbidity | 96 | 0.60 | 194.60 | 49.49 | 45.97 | 92.89 | NA | NTU |
| Conductivity | 96 | 27.00 | 917.00 | 302.68 | 290.68 | 96.03 | 1000 | µs/cm |
| Salinity | 96 | 0.01 | 0.46 | 0.15 | 0.14 | 95.36 | --- | PSU |
| TDS | 96 | 13.00 | 471.00 | 153.01 | 146.86 | 95.98 | NA | mg/L |
| Temperature | 96 | 4.99 | 22.96 | 14.73 | 3.86 | 26.22 | 3 | °C |
| DO | 96 | 2.18 | 8.72 | 6.38 | 1.51 | 23.59 | 5 | mg/L |
| BOD5 | 96 | 0.00 | 292.00 | 32.27 | 62.20 | 192.77 | 10 | mg/L |
| COD | 96 | 0.00 | 330.00 | 57.02 | 77.77 | 136.39 | NA | mg/L |
| Nitrate | 96 | 0.00 | 4.87 | 0.30 | 0.90 | 305.99 | 13 | mg/L |
| Nitrite | 96 | 0.00 | 10.08 | 1.16 | 2.55 | 220.67 | NA | mg/L |
| Phosphate | 96 | 0.04 | 5.62 | 1.13 | 1.14 | 101.47 | NA | mg/L |
| Ammonia | 96 | 0.00 | 20.89 | 2.05 | 4.72 | 229.88 | 0.88 | mg/L |
| Chloride | 96 | 6.10 | 80.20 | 29.05 | 17.49 | 60.19 | NA | mg/L |
| Alkalinity | 96 | 2.90 | 74.40 | 30.12 | 19.24 | 63.86 | NA | mg/L |
| Hardness | 96 | 6.30 | 256.60 | 78.78 | 61.09 | 77.55 | NA | mg/L |
| pH | 96 | 7.13 | 9.34 | 7.97 | 0.44 | 5.57 | 6.5–9.0 | |
| Total phosphorus | 96 | 0.00 | 1.40 | 0.37 | 0.34 | 92.35 | 0.05 | mg/L |
| Lead | 96 | 0.00 | 1.40 | 0.45 | 0.44 | 98.89 | 2.5 | ppb |
| Chromium | 96 | 0.00 | 83.00 | 18.70 | 18.09 | 96.73 | 11 | ppb |
| Iron | 96 | 0.01 | 0.61 | 0.31 | 0.17 | 55.91 | NA | ppm |
| Bromine | 96 | 0.00 | 0.35 | 0.09 | 0.08 | 81.21 | NA | ppm |
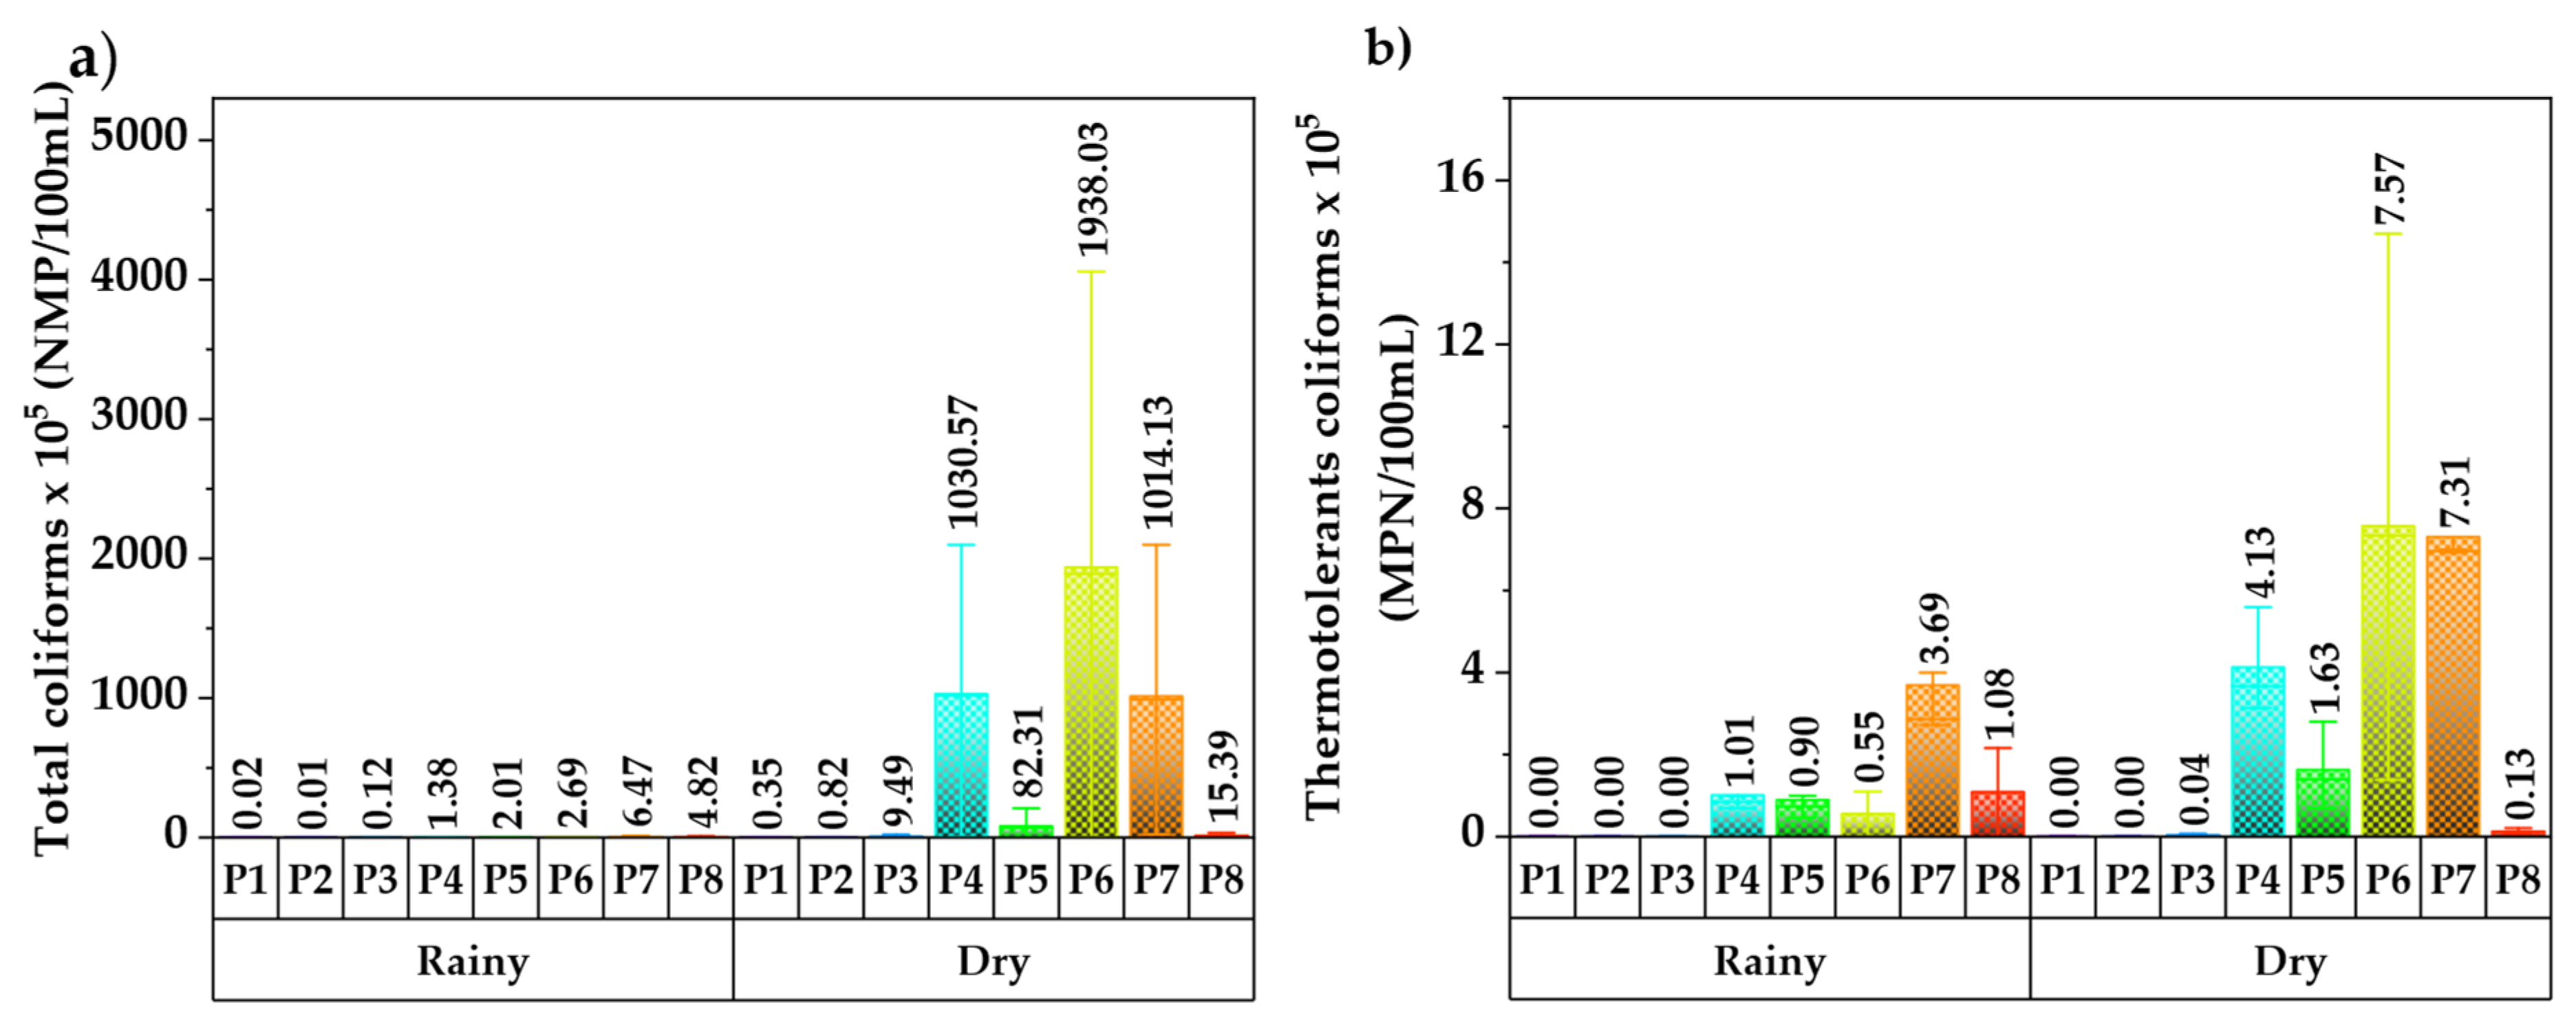
| Total coliforms | 96 | 0.00 | 4.06 × 10⁸ | 2.57 × 10⁷ | 8.18 × 10⁷ | 3.19 × 10² | NA | MPN/100 mL |
| Thermotolerant coliforms | 96 | 0.00 | 1.47 × 10⁶ | 1.75 × 10⁵ | 3.02 × 10⁵ | 1.72 × 10² | 2000 | MPN/100 mL |
| Parameters | F1 | F2 | F3 |
|---|---|---|---|
| COL | −0.03 | 0.87 * | 0.19 |
| TUR | 0.22 | 0.06 | 0.85 * |
| CON | 0.94 * | 0.30 | 0.03 |
| SAL | 0.95 * | 0.29 | 0.04 |
| TDS | 0.94 * | 0.30 | 0.03 |
| TEM | 0.52 | 0.56 | 0.19 |
| DO | 0.11 | −0.72 | 0.08 |
| BOD5 | 0.17 | 0.89 * | 0.04 |
| COD | 0.24 | 0.17 | 0.73 * |
| NITA | −0.08 | −0.18 | 0.66 |
| NITI | 0.58 | 0.22 | −0.28 |
| PHO | 0.46 | 0.60 | −0.11 |
| AMM | 0.39 | 0.82 * | −0.09 |
| CHL | 0.43 | −0.11 | −0.51 |
| ALK | 0.83 * | 0.03 | 0.40 |
| HAR | 0.86 * | 0.04 | 0.15 |
| pH | 0.32 | −0.26 | 0.00 |
| TP | 0.70 * | 0.14 | 0.08 |
| Pb | 0.70 * | −0.06 | 0.33 |
| Cr | 0.09 | 0.36 | 0.70 * |
| Fe | −0.21 | 0.17 | −0.45 |
| Br | 0.75 * | 0.17 | 0.17 |
| TCO | 0.17 | 0.92 * | −0.09 |
| THC | 0.32 | 0.86 * | 0.23 |
| Eigenvalue | 9.29 | 3.89 | 2.86 |
| %Total variance | 38.73 | 16.22 | 11.91 |
| Cumulative % | 38.73 | 54.95 | 66.85 |
| Source of Pollution | Parameters | Factor Loading | |
|---|---|---|---|
| Inorganic | CON | 0.94 | 0.40 |
| Pb | 0.70 | 0.30 | |
| Cr | 0.70 | 0.30 | |
| Total | 2.34 | 1.00 | |
| Organic | DO | 0.72 | 0.15 |
| BOD5 | 0.89 | 0.18 | |
| AMM | 0.82 | 0.17 | |
| TP | 0.70 | 0.14 | |
| COL | 0.87 | 0.18 | |
| THC | 0.86 | 0.18 | |
| Total | 4.86 | 1.00 |
| Sampling Points | Season | DO | BOD5 | AMM | TP | COL | THC | CON | Pb | Cr |
|---|---|---|---|---|---|---|---|---|---|---|
| P1 | Rainy | 0.84 | 0.14 | 0.04 | 0.27 | 0.30 | 0.00 | 0.03 | 0.00 | 0.20 |
| P2 | Rainy | 0.83 | 0.15 | 0.01 | 0.33 | 0.30 | 0.00 | 0.03 | 0.00 | 0.89 |
| P3 | Rainy | 0.81 | 0.13 | 0.00 | 1.00 | 0.31 | 0.00 | 0.01 | 0.00 | 1.00 |
| P4 | Rainy | 0.82 | 0.26 | 0.15 | 1.00 | 0.30 | 1.00 | 0.05 | 0.25 | 1.00 |
| P5 | Rainy | 0.81 | 1.00 | 0.08 | 1.00 | 0.31 | 1.00 | 0.03 | 0.20 | 1.00 |
| P6 | Rainy | 0.85 | 1.00 | 0.12 | 1.00 | 0.29 | 1.00 | 0.05 | 0.15 | 1.00 |
| P7 | Rainy | 0.73 | 1.00 | 0.66 | 1.00 | 0.34 | 1.00 | 0.07 | 0.15 | 1.00 |
| P8 | Rainy | 0.67 | 1.00 | 0.41 | 1.00 | 0.37 | 1.00 | 0.03 | 0.27 | 1.00 |
| P1 | Dry | 0.78 | 0.00 | 0.21 | 1.00 | 0.32 | 0.00 | 0.01 | 0.04 | 0.26 |
| P2 | Dry | 0.72 | 0.00 | 0.02 | 1.00 | 0.35 | 0.00 | 0.02 | 0.01 | 0.67 |
| P3 | Dry | 0.65 | 1.00 | 0.07 | 1.00 | 0.39 | 1.00 | 0.02 | 0.08 | 0.71 |
| P4 | Dry | 0.87 | 1.00 | 1.00 | 1.00 | 0.29 | 1.00 | 0.08 | 0.36 | 1.00 |
| P5 | Dry | 0.61 | 1.00 | 1.00 | 1.00 | 0.41 | 1.00 | 0.03 | 0.33 | 1.00 |
| P6 | Dry | 1.00 | 1.00 | 1.00 | 1.00 | 0.20 | 1.00 | 0.09 | 0.30 | 1.00 |
| P7 | Dry | 1.00 | 1.00 | 1.00 | 1.00 | 0.22 | 1.00 | 0.04 | 0.25 | 1.00 |
| P8 | Dry | 0.62 | 0.70 | 1.00 | 1.00 | 0.41 | 1.00 | 0.01 | 0.48 | 1.00 |
Disclaimer/Publisher’s Note: The statements, opinions and data contained in all publications are solely those of the individual author(s) and contributor(s) and not of MDPI and/or the editor(s). MDPI and/or the editor(s) disclaim responsibility for any injury to people or property resulting from any ideas, methods, instructions or products referred to in the content. |
© 2023 by the authors. Licensee MDPI, Basel, Switzerland. This article is an open access article distributed under the terms and conditions of the Creative Commons Attribution (CC BY) license (https://creativecommons.org/licenses/by/4.0/).
Share and Cite
Ramos-Pacheco, B.S.; Choque-Quispe, D.; Ligarda-Samanez, C.A.; Solano-Reynoso, A.M.; Choque-Quispe, Y.; Aguirre Landa, J.P.; Agreda Cerna, H.W.; Palomino-Rincón, H.; Taipe-Pardo, F.; Zamalloa-Puma, M.M.; et al. Water Pollution Indexes Proposal for a High Andean River Using Multivariate Statistics: Case of Chumbao River, Andahuaylas, Apurímac. Water 2023, 15, 2662. https://doi.org/10.3390/w15142662
Ramos-Pacheco BS, Choque-Quispe D, Ligarda-Samanez CA, Solano-Reynoso AM, Choque-Quispe Y, Aguirre Landa JP, Agreda Cerna HW, Palomino-Rincón H, Taipe-Pardo F, Zamalloa-Puma MM, et al. Water Pollution Indexes Proposal for a High Andean River Using Multivariate Statistics: Case of Chumbao River, Andahuaylas, Apurímac. Water. 2023; 15(14):2662. https://doi.org/10.3390/w15142662
Chicago/Turabian StyleRamos-Pacheco, Betsy S., David Choque-Quispe, Carlos A. Ligarda-Samanez, Aydeé M. Solano-Reynoso, Yudith Choque-Quispe, John Peter Aguirre Landa, Henrry W. Agreda Cerna, Henry Palomino-Rincón, Fredy Taipe-Pardo, Miluska M. Zamalloa-Puma, and et al. 2023. "Water Pollution Indexes Proposal for a High Andean River Using Multivariate Statistics: Case of Chumbao River, Andahuaylas, Apurímac" Water 15, no. 14: 2662. https://doi.org/10.3390/w15142662
APA StyleRamos-Pacheco, B. S., Choque-Quispe, D., Ligarda-Samanez, C. A., Solano-Reynoso, A. M., Choque-Quispe, Y., Aguirre Landa, J. P., Agreda Cerna, H. W., Palomino-Rincón, H., Taipe-Pardo, F., Zamalloa-Puma, M. M., Zamalloa-Puma, L. M., Mescco Cáceres, E., Sumarriva-Bustinza, L. A., & Choque-Quispe, K. (2023). Water Pollution Indexes Proposal for a High Andean River Using Multivariate Statistics: Case of Chumbao River, Andahuaylas, Apurímac. Water, 15(14), 2662. https://doi.org/10.3390/w15142662


