Article

Experimental Study of Roughness Reduction of Large Aqueducts in the Middle Route of the South-to-North Water Diversion Project

State Key Laboratory of Simulation and Regulation of Water Cycle in River Basin, China Institute of Water Resources and Hydropower Research, Beijing 100038, China
*
Author to whom correspondence should be addressed.
Water 2023, 15(14), 2640; https://doi.org/10.3390/w15142640
Submission received: 28 June 2023 / Revised: 16 July 2023 / Accepted: 19 July 2023 / Published: 20 July 2023
(This article belongs to the Special Issue Water Distribution and Drainage Systems)

Abstract

:
The roughness of the aqueduct in the Middle Route of the South-to-North Water Diversion Project has increased due to factors such as the natural aging of concrete and biological attachment. To increase the flow capacity of the project, a roughness reduction test was carried out in April 2021 by installing a nano-rubber coating on the Fangshui River aqueduct, which consists of three aqueduct bodies arranged in parallel. Before and after the test, as well as two years after the test, three field observations were conducted. The analysis revealed that compared to aqueduct body 2, which was only cleaned of surface attachments, after excluding the difference in the background roughness, the nano-rubber coating reduced the roughness of aqueduct body 1 by 0.0013 (10.00%). After two years of operation, the roughness was 0.0010 (7.41%) lower, indicating that the nano-rubber coating had a good and lasting effect on the roughness reduction. The roughness field observation results are sensitive to flow rate and water level measurement errors. For aqueducts with a low head and a high flow rate similar to those of the Fangshui River aqueduct, non-contact measuring instruments should be preferentially utilized, and sufficiently accurate flow rate measurements should be ensured to improve the accuracy of the roughness calculation.

1. Introduction

The Middle Route of the South-to-North Water Diversion Project is the largest inter-basin water transfer project in the world, with a total length of 1432 km. It primarily uses open channel flow for water conveyance and started full operation in December 2014. As of the end of March 2023, the cumulative water transfer to northern China had exceeded 55 billion m3, benefiting over 85 million people directly and resulting in significant social, economic, and ecological benefits [1]. Roughness is a comprehensive coefficient that measures the influences of the flow surface coarseness degree and flow cross-section variation of water conveyance structures on flow resistance. It is one of the key technical parameters for the design and operation of water conveyance systems [2,3]. The Middle Route of the South-to-North Water Diversion Project includes 27 large aqueducts. After years of operation, these aqueducts have been affected by adverse factors such as freeze–thaw cycles, concrete carbonation, and sedimentation. As a result, concrete spalling and algal and freshwater mussel attachment have occurred on the aqueduct surfaces, leading to an increase in surface roughness, reducing the flow capacity of the project [4], and posing a threat to water supply safety. Therefore, it is necessary to conduct research on roughness reduction.
Motion resistance is an essential fluid characteristic, and its mechanism analysis, simulation, and regulation are widely studied [5,6,7,8,9,10,11]. The method of coating the flow surface with drag-reduction materials to reduce the roughness and enhance protective capabilities was first applied to long-distance oil and gas pipelines, such as the Zeepipe pipeline in Norway [12] and the Alliance pipeline between Canada and the United States [13], both of which were internally coated with epoxy resin. In the field of hydraulic engineering, materials such as polyurethane (PU) and polyvinyl chloride (PVC) have been widely used in aqueduct and channel renovation projects due to their excellent anti-seepage and roughness-reduction properties [14,15,16]. In recent years, a new type of nano-modified, inorganic, water-based, permeable, crystalline material called nano-rubber has been used in the field of drag reduction materials [17] to enhance the strength and smoothness of concrete surfaces, suppress the growth of bacteria and algae, and improve the flow capacity. Compared to traditional materials such as PU and PVC, nano-rubber has the advantages of a simple construction process, short construction period, and strong resistance to detachment and erosion, and it has been applied in projects such as the No. 9 Water Plant Water Transfer Tunnel in Beijing [18], the water conservancy hub project in Guangxi [19], and the Xiangyang Sluice in the Chaobai River in Beijing [20]. In April 2021, a test of the roughness reduction ability of nano-rubber coating was conducted on the Fangshui River aqueduct as a pilot test in the South-to-North Water Diversion Project.
Roughness is a hydraulic parameter that cannot be directly measured and can only be indirectly estimated [21,22,23]. The Middle Route of the South-to-North Water Diversion Project is a typical low-head, high-flow water transfer project. The aqueduct has a distributed head of only about 0.2 m, and hence, the estimation of its roughness requires a high measurement accuracy [24,25,26]. Taking the Fangshui River aqueduct as the research object, three field observations were conducted to evaluate the effectiveness and durability of the nano-rubber coating in reducing roughness. This study aimed to provide a reference for selecting appropriate drag-reduction materials for the Middle Route of the South-to-North Water Diversion Project and gain experience from the field observations of the roughness, which can be applied to similar water transfer projects with high-flow, low-head aqueducts.

2. Materials and Methods

2.1. Overview of the Fangshui River Aqueduct

The Fangshui River aqueduct is located in the Tang County section (Baoding City, Hebei Province) of the South-to-North Water Diversion Project. The inverted-siphon check gate of the Tang River is located 25.7 km upstream, and the inverted-siphon check gate of the Puyang River is located 13.2 km downstream. The structure of the Fangshui River aqueduct is shown in Figure 1, including the three aqueduct bodies arranged symmetrically and in parallel. The aqueduct has a designed maximum flow rate of 160 m3/s, which corresponds to a distributed head of 0.16 m. The inlet section consists of a 40 m long transition section and a 20 m long check gate chamber section, with a maximum operating water level of 69.99 m before the gate. The outlet section consists of a 10 m long maintenance gate chamber section and a 40 m long outlet transition section, with a maximum operating water level of 69.83 m before the gate. The aqueduct body section is 240 m long and has a rectangular cross-section and dimensions of 7 m × 5.2 m. During normal operation, the check gate is involved in adjusting the water level and flow rate in the aqueduct, while the maintenance gate is in standby mode with the gate fully open.

2.2. Application of Drag-Reduction Coating

Nano-rubber is a type of nano-modified, inorganic, water-based, permeable, crystalline material. It is a colorless, odorless, completely transparent aqueous solution with a viscosity of less than 15 mPa·s. The size of the nano silica gel particles contained in it mainly ranges from 3 to 50 nm [16]. This material reacts with the calcium hydroxide in concrete to generate calcium silicate hydrate (C-S-H) gel [27], which fills the gaps in the concrete and forms a dense layer, thereby enhancing the surface strength of the concrete, protecting the alkaline environment of the concrete, and inhibiting the intrusion of deteriorating factors such as water, salt, acids, alkalis, carbon dioxide, and microorganisms. Therefore, from a mechanistic perspective, the nano-rubber has the functions of repairing the microstructure of the concrete surface and reducing the roughness of the flow surface.
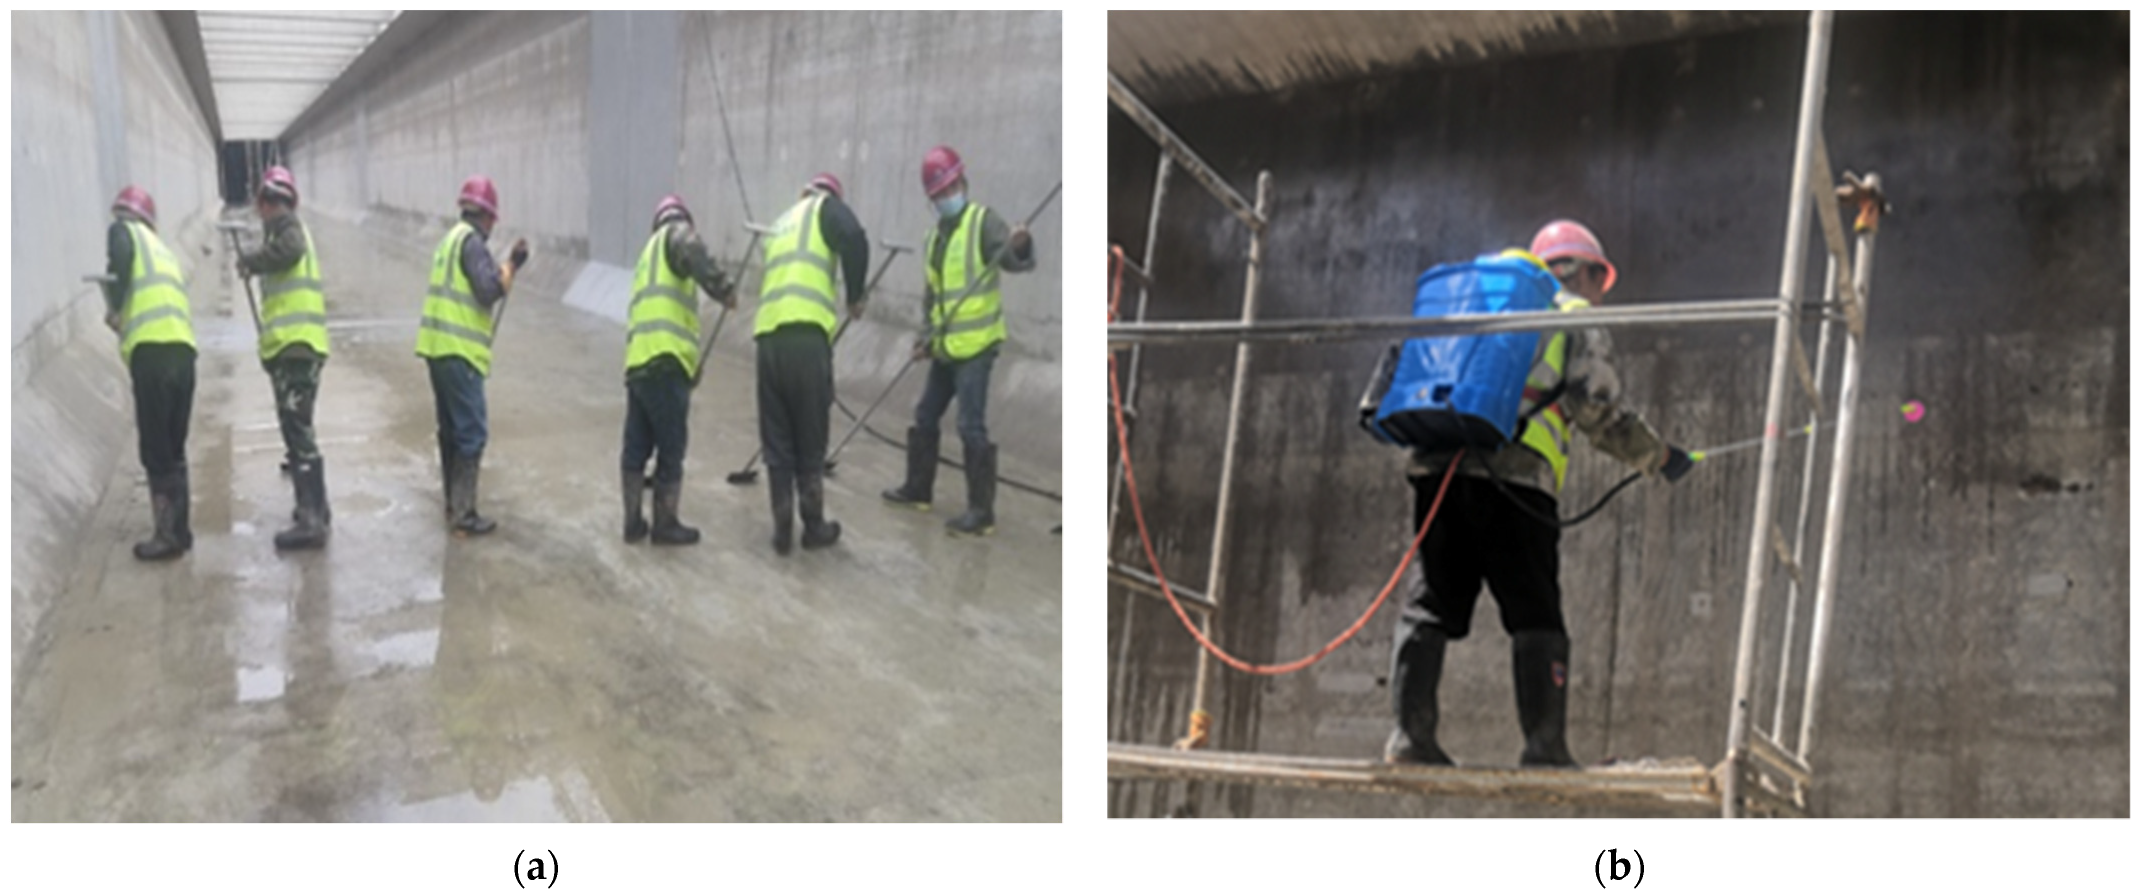
To verify the drag reduction performance of the nano-rubber, a roughness reduction test was conducted in April 2021 using the Fangshui River aqueduct as a pilot project [28]. To facilitate comparison with the roughness reduction effect of the nano-rubber coating, aqueduct body 1 was cleaned of surface attachments (including those on the sidewalls and floor slabs) and then coated with nano-rubber, aqueduct body 2 was only cleaned of surface attachments, and aqueduct body 3 was left in its original state. Figure 2 shows the process of cleaning the attachments from the aqueduct surface and coating it with nano-rubber.

2.3. Calculation of Roughness and Error Analysis

During steady water transfer, the flow in the aqueduct can be considered to be a constant, non-uniform, open channel flow. The energy conservation equation is applied to the upstream measurement cross-section (denoted by subscript 1) and the downstream measurement cross-section (denoted by subscript 2) in Figure 1.
z 1 + α 1 v 1 2 2 g = z 2 + α 2 v 2 2 2 g + h f + h j
where z is the water level of the cross-section; v is the average flow velocity of the cross-section; α is the kinetic energy correction factor; hf is the frictional head loss between the upstream and downstream measurement cross-sections; and hj is the local head loss. The cross-section of the aqueduct is regular and smooth, so hj can be ignored, and α is taken as 1. hf is calculated as follows:
h f = Q 2 n 2 ( A ¯ R ¯ 2 / 3 ) 2 L
where Q is the flow rate, n is the roughness and L is the distance between cross-sections 1 and 2, and A ¯ R ¯ 2 3 = A 1 R 1 2 3 + A 2 R 2 2 3 2 , in which A is the cross-sectional area, and R is the hydraulic radius.
Substituting Equation (2) into Equation (1) yields:
n = A ¯ R ¯ 2 3 Q s 0 + y 1 y 2 L + ( 1 A 1 2 1 A 2 2 ) Q 2 2 g L
where y is the water depth of the cross-section and s0 is the bed slope.
The absolute error of the calculated roughness can be expressed as follows:
Δ n = n Q Δ Q 2 + n y 1 Δ y 1 2 + n y 2 Δ y 2 2 + n s 0 Δ s 0 2 + n L Δ L 2
The partial derivatives are calculated as follows:
n Q = n Q + 1 2 g L Q n A ¯ R ¯ 2 3 2 1 A 1 2 1 A 2 2
n y 1 = n R 1 2 3 6 A ¯ R ¯ 2 3 5 B 1 4 R 1 + 1 2 Q 2 L n A ¯ R ¯ 2 3 2 1 Q 2 B 1 g A 1 3
n y 2 = n R 2 2 3 6 A ¯ R ¯ 2 3 5 B 2 4 R 2 + 1 2 Q 2 L n A ¯ R ¯ 2 3 2 1 Q 2 B 2 g A 2 3
n s 0 = A ¯ R ¯ 2 3 2 2 Q 2 n
n L = A ¯ R ¯ 2 3 2 2 Q 2 n L 2 y 1 y 2
where B is the width of the cross-section, and the other variables are the same as in the previous equations.

2.4. Field Observation Schemes

2.4.1. Field Observation in 2021

  • Scheduling scheme
(1) Before the test, the upstream Tang River inverted-siphon check gate and the downstream Puyang River inverted-siphon check gate were adjusted to maintain a stable water level and flow rate in the Fangshui River aqueduct. At this time, the aqueduct had a water depth of about 3.5 m and a flow rate of about 105 m3/s.
(2) The check gate of aqueduct body 2 was closed, and the check gates of aqueduct bodies 1 and 3 were fully open. After the flow stabilized, the water levels and flow rates of the upstream and downstream measurement cross-sections of aqueduct body 1 were measured and recorded as Condition #1_2021_Before.
(3) The check gate of aqueduct body 1 was closed, and the check gates of aqueduct bodies 2 and 3 were fully open. After the flow stabilized, the water levels and flow rates of the upstream and downstream measurement cross-sections of aqueduct body 2 were measured and recorded as Condition #2_2021_Before. Aqueduct body 1 was cleaned of surface attachments and coated with nano-rubber.
(4) The check gate of aqueduct body 2 was closed, and the check gates of aqueduct bodies 1 and 3 were fully open. After the flow stabilized, the water levels and flow rates of the upstream and downstream measurement cross-sections of aqueduct body 1 were measured and recorded as Condition #1_2021_After. Aqueduct body 2 was cleaned of surface attachments.
(5) The check gate of aqueduct body 1 was closed, and the check gates of aqueduct bodies 2 and 3 were fully open. After the flow stabilized, the water levels and flow rates of the upstream and downstream measurement cross-sections of aqueduct body 2 were measured and recorded as Condition #2_2021_After.
(6) After the completion of all of the measurements, the upstream and downstream check gates were adjusted to restore the channel to its normal operating state.
2.
Observation scheme
(1) Observation instruments. The instruments used in 2021 included a radar water level gauge, electromagnetic flowmeter, electronic level, and electronic rangefinder (Table 1).
(2) Arrangement of measurement points. According to Equation (3), estimating the roughness requires measuring several quantities, including the distance between the upstream and downstream measurement cross-sections, the dimensions of the aqueduct at these cross-sections, the floor elevation, the water depth, and the flow rate. The inlet of the Fangshui River aqueduct is a 40 m long transition section, where the flow gradually narrows and converges to produce a zigzag flow that causes fluctuations in the flow at the inlet section of the aqueduct. The magnitude of these fluctuations increases as the flow increases. Therefore, the upstream and downstream measurement cross-sections were arranged at locations far from the turbulent flow, where the flow was relatively smooth. Specifically, they were located approximately 7 m downstream of the check gate and 3 m upstream of the maintenance gate.
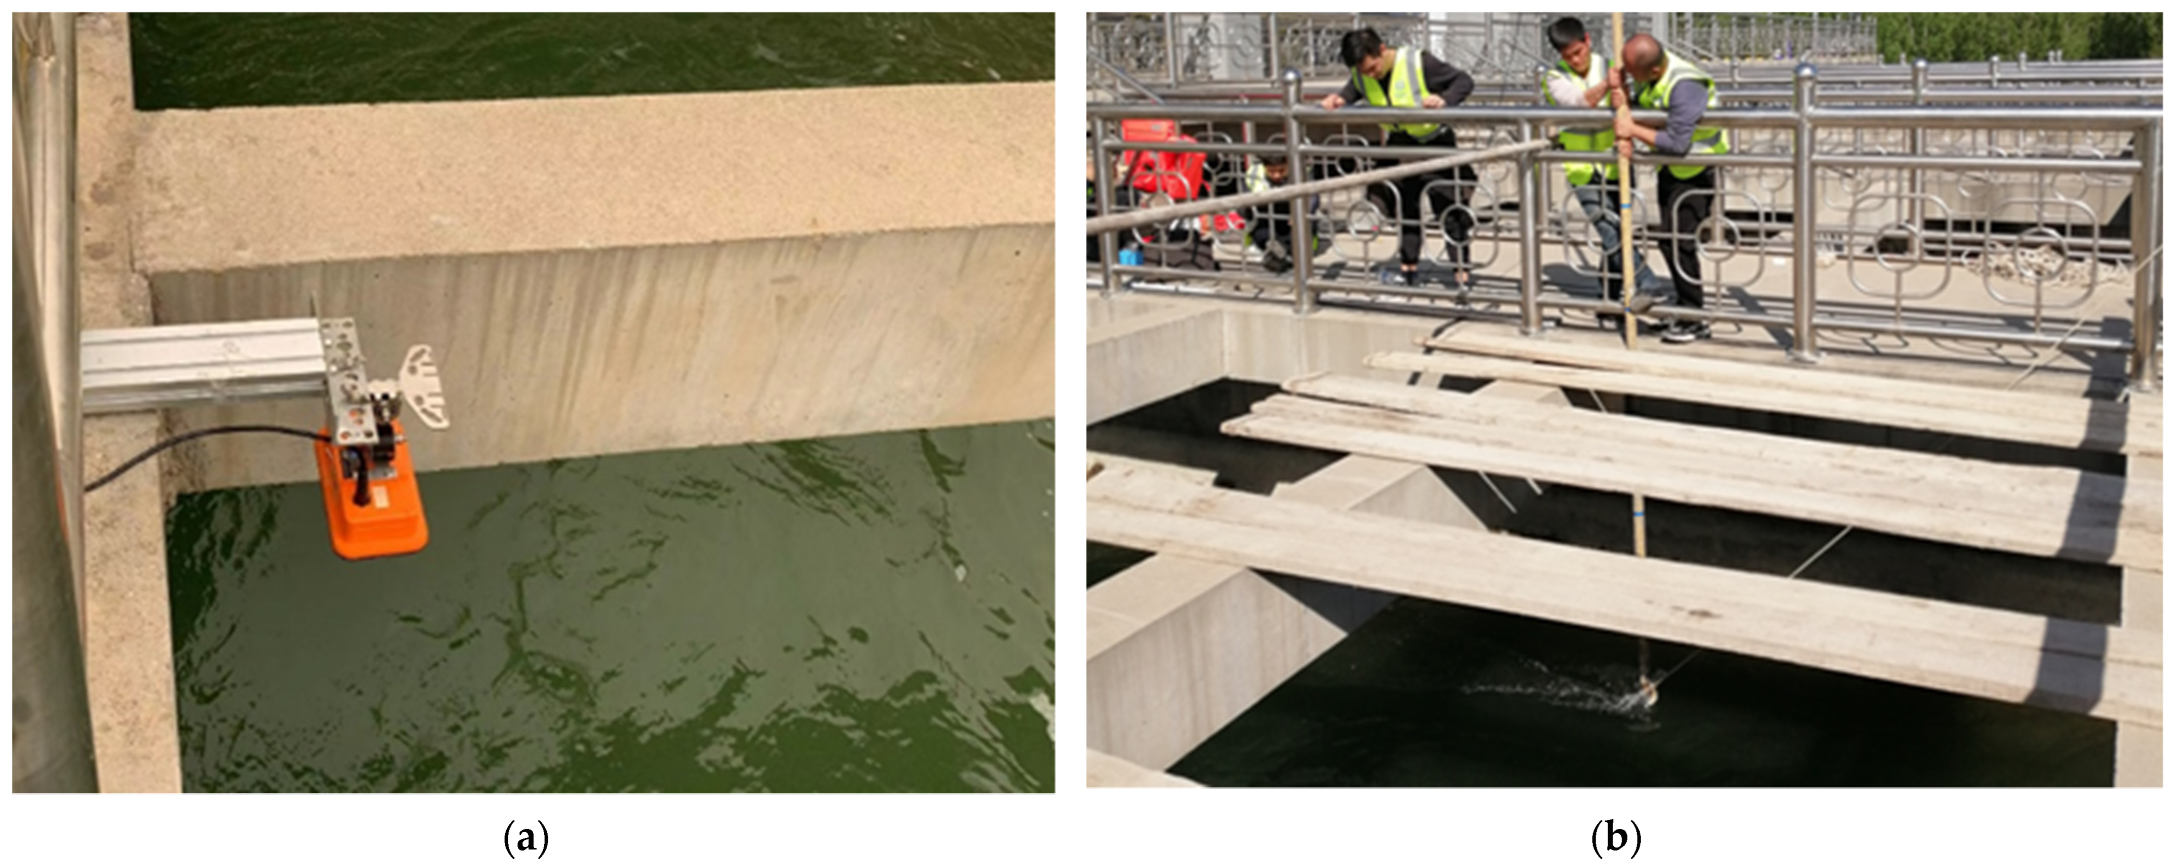
(3) Water level measurement. The installation of the radar water level gauge is shown in Figure 3a, and its horizontal alignment was calibrated using the built-in level. The reference zero point was determined using a level gauge from the secondary reference point measurement of the South-to-North Water Diversion Project. The radar water level gauge was powered by a 12 V direct current (DC) power supply, and the measurement data were recorded using its built-in software. The water level was measured at a frequency of 0.5 Hz, with a sampling time of approximately 900 s. The instrument performance and measurement scheme met the requirements of the Specifications for Water Measurement of Irrigation Canal System (GBT 21303-2017) [29].
(4) Flow rate measurement. The flow velocity distribution at the cross-section was measured using an electromagnetic flowmeter, and the flow rate of the aqueduct was calculated using the velocity-area method. The area of the cross-section was measured before the nano-rubber coating was applied. During the velocity measurement, it was difficult to fix the measuring rod due to the large torque exerted on it by the flow impact (Figure 3b). The actual distribution of the velocity measurement points is shown in Figure 4a. The flow in the aqueduct was simulated using the FLOW-3D software to obtain the velocity distribution at the cross-section (Figure 4b). Based on comparison with the distribution of the velocity measurement points, the formula for calculating the average velocity V ¯ at the cross-section can be obtained:
V ¯ = 3 V ¯ 1 + 2 V ¯ 2 + V ¯ 3 + V ¯ 4 + 2 V ¯ 5 + 3 V ¯ 6 12
where V ¯ i is the average velocity of the ith vertical line.

2.4.2. Field Observation in 2023

1.
Scheduling scheme
(1) Before the test, the upstream Tang River inverted-siphon check gate and the downstream Puyang River inverted-siphon check gate were adjusted to maintain a stable water level and flow rate in the Fangshui River aqueduct. At this time, the aqueduct had a water depth of about 4.0 m and a flow rate of about 87 m3/s.
(2) The check gate of aqueduct body 2 was closed, and the check gates of aqueduct bodies 1 and 3 were fully open. After the flow stabilized, the water levels and flow rates at the upstream and downstream measurement cross-sections of aqueduct body 1 were measured and recorded as Condition #1_2023_After.
(3) The check gate of aqueduct body 2 was fully open, and the check gates of aqueduct bodies 1 and 3 were partially closed symmetrically so that the flow rate in aqueduct body 2 approached its designed maximum water transfer capacity. After the flow stabilized, the water levels and flow rates at the upstream and downstream measurement cross-sections of aqueduct body 2 were measured and recorded as Condition #2_2023_After.
(4) After the completion of all of the measurements, the upstream and downstream check gates were adjusted to restore the channel to its normal operating state.
2.
Observation scheme
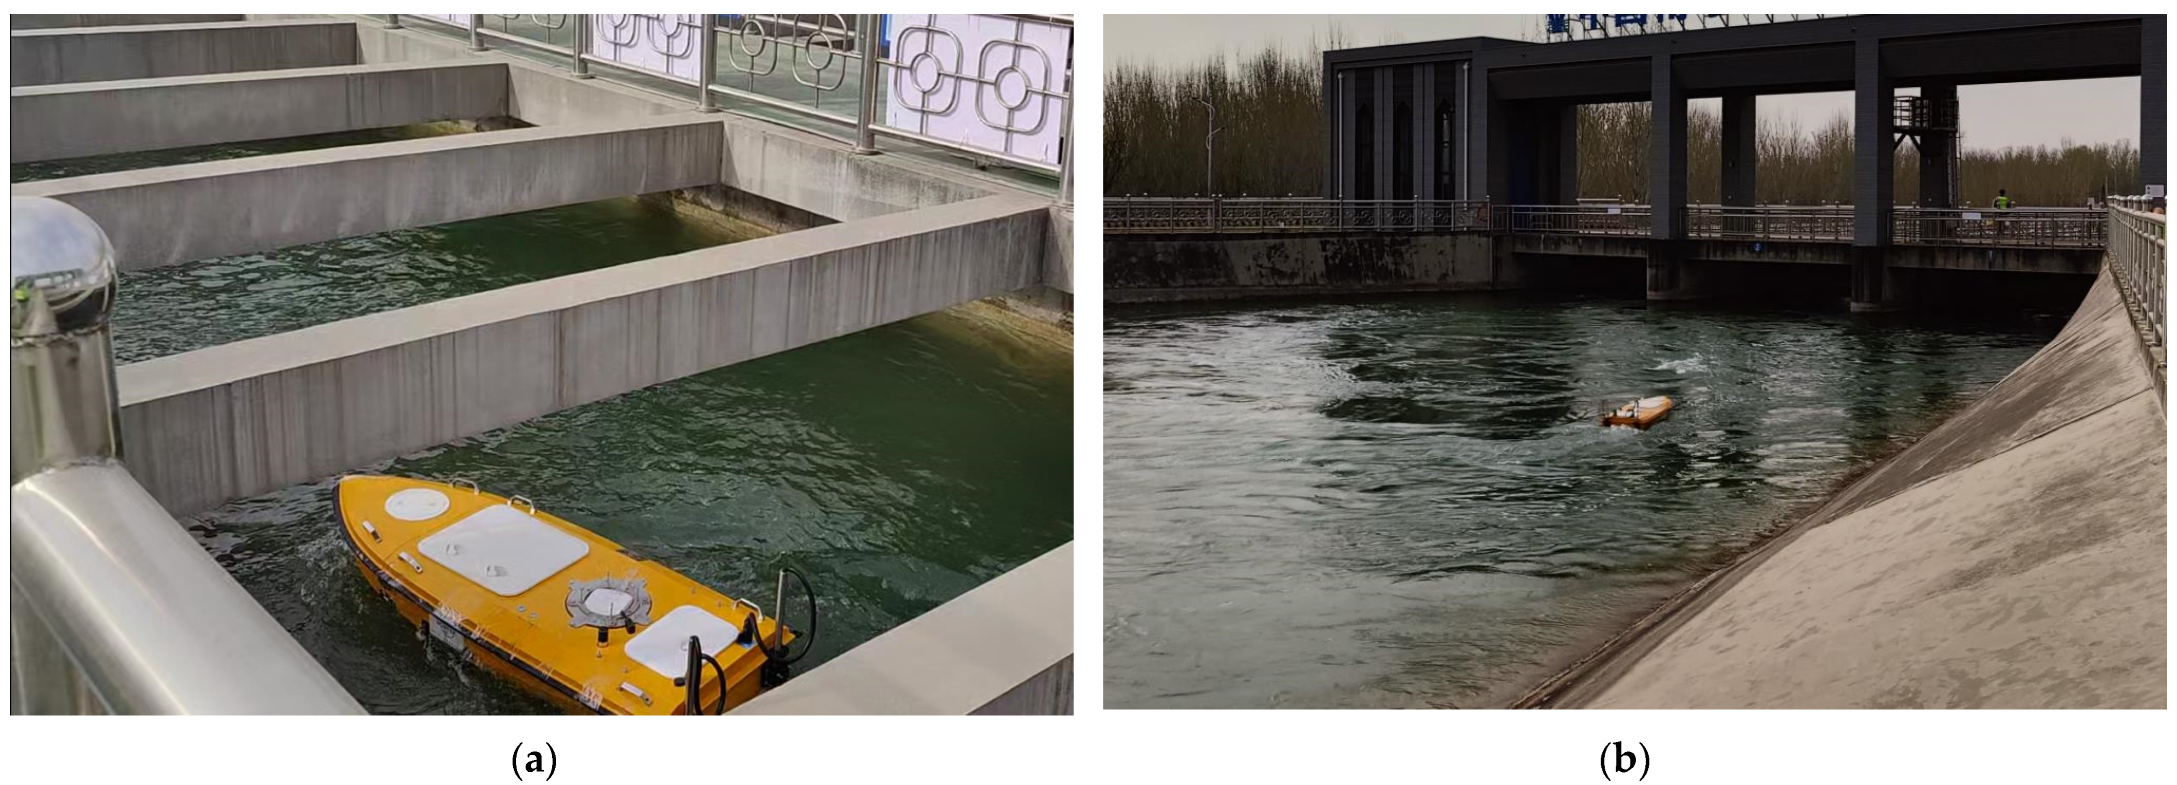
The measurement point layout, instruments, and scheme for the water level measurements were the same as those used in 2021. The flow rate measurements were carried out using a measurement system consisting of an acoustic Doppler current profiler (ADCP) and a remotely controlled, unmanned vessel (Table 1). In addition, the total flow in the aqueduct was measured by setting up a flow rate measurement point downstream of the aqueduct in a section with a smooth flow, which was located approximately 100 m from the outlet of the aqueduct.
Referring to the ADCP flow rate measurement specifications in the Code for Discharge Measurement of Acoustic Doppler Current (SL337-2006) [30], four to seven rounds of measurements were conducted at each cross-section (Figure 5), with a sampling time of 40–160 s. The measurement data were recorded using the built-in software for the instrument. The arithmetic mean of the measured flow rates and the deviation of the return flow rate in each half round from the mean were calculated. The measurements were repeated if the deviation was greater than 5%. The analysis showed that the deviation of the return flow rate from the mean during each half round was within 2%, which is stricter than the requirement of the ADCP flow rate measurement specifications.

3. Field Observation Results

3.1. Results and Errors for 2021

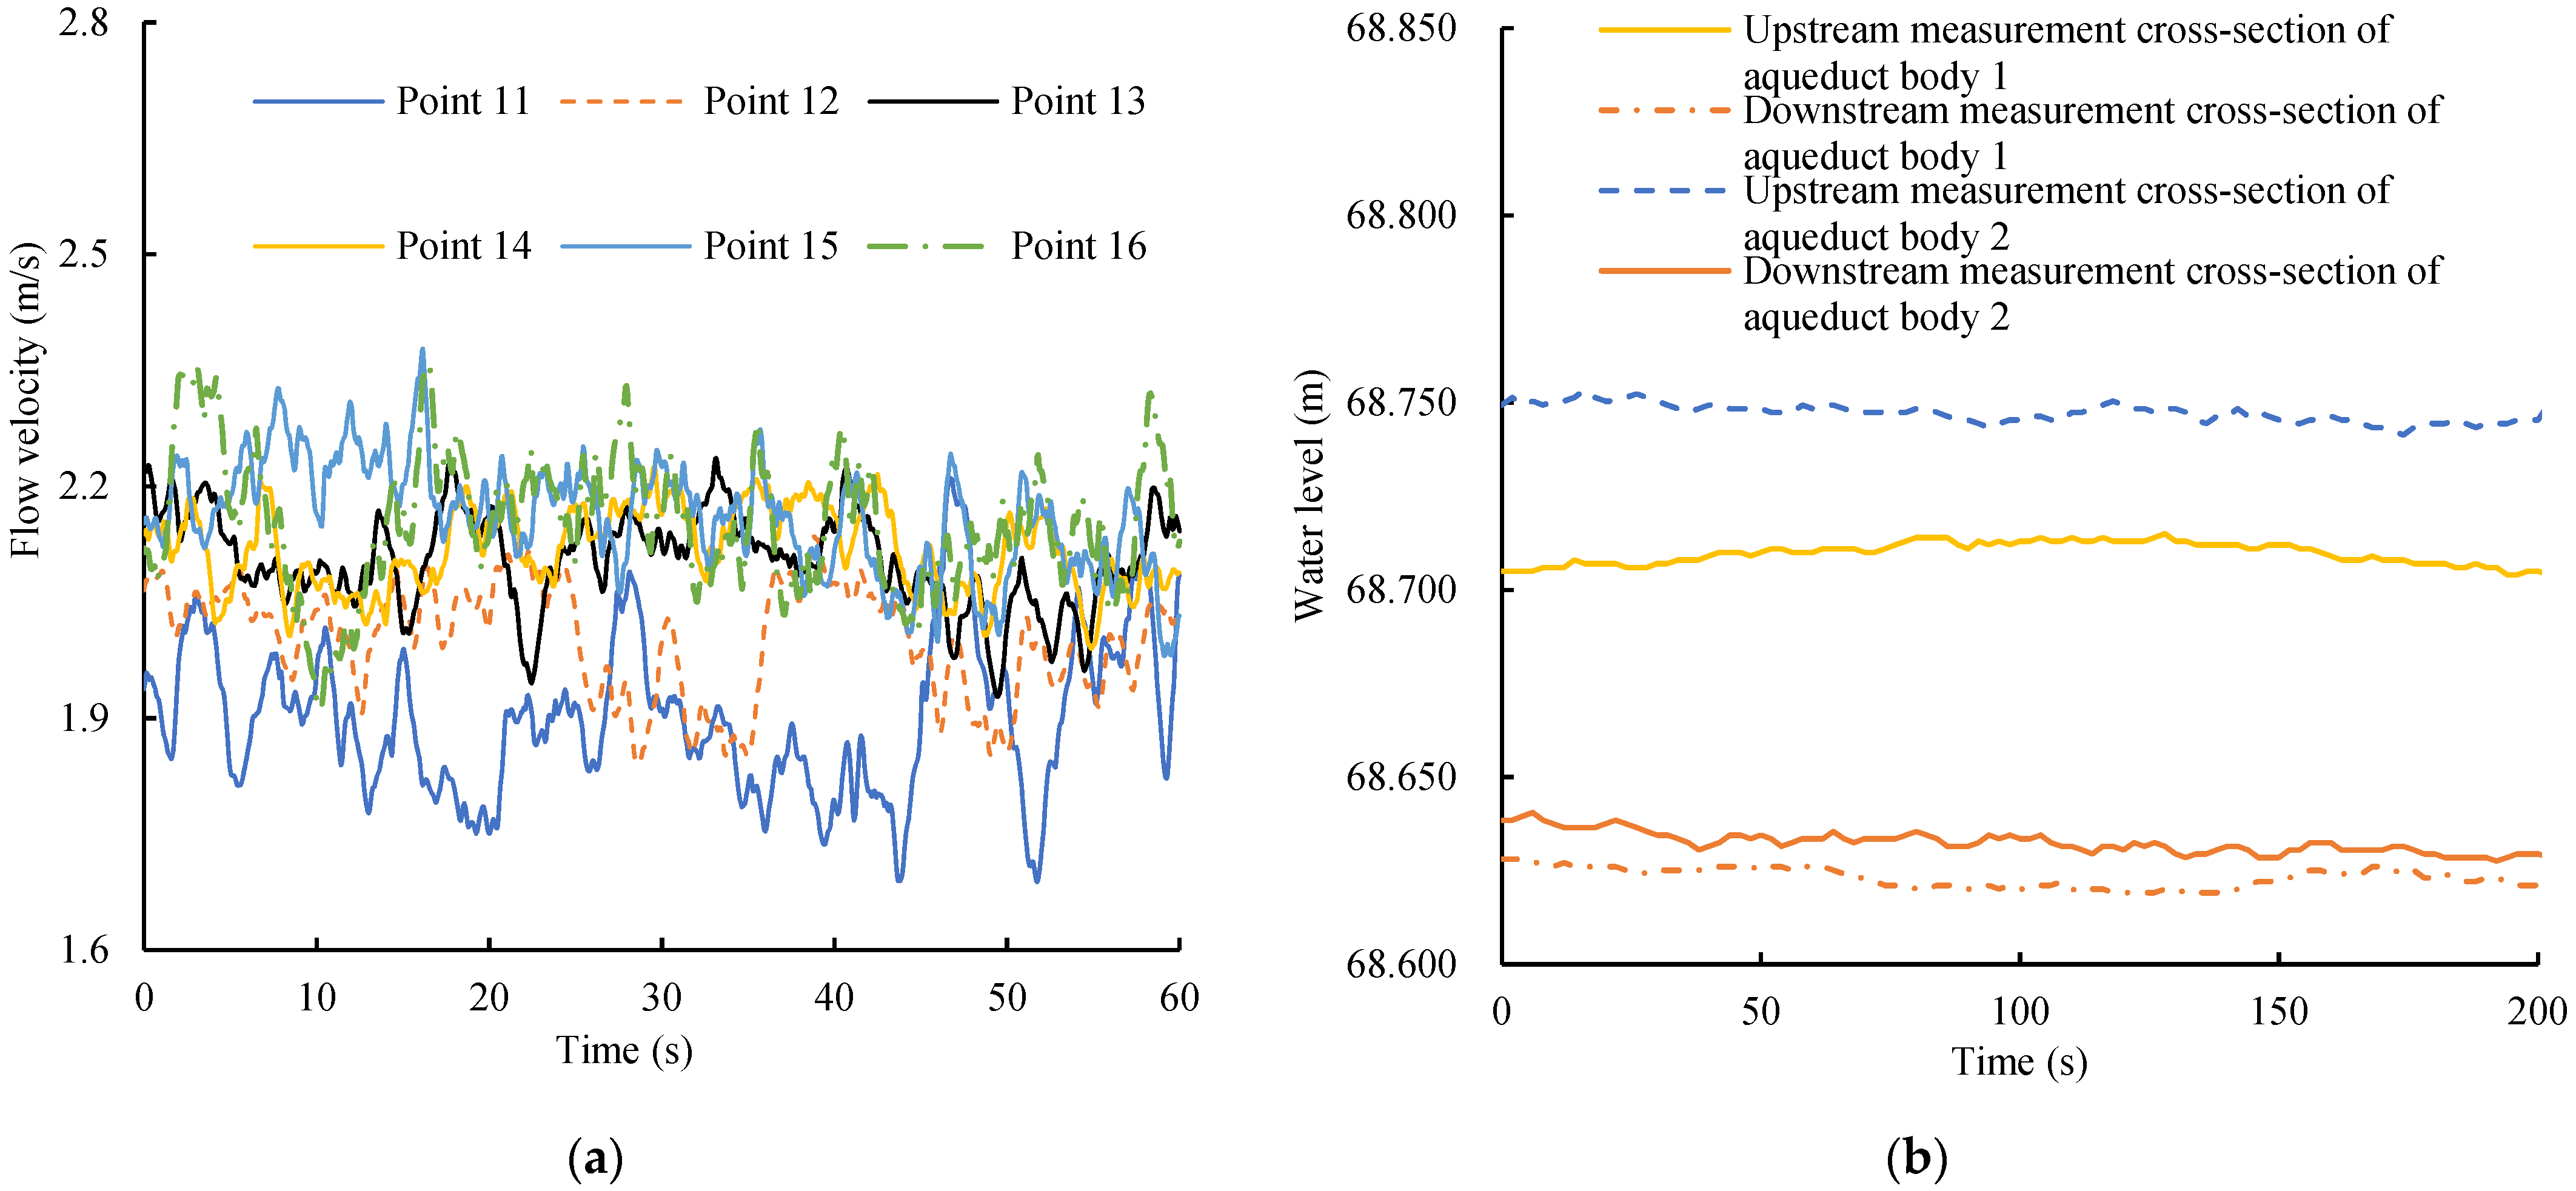
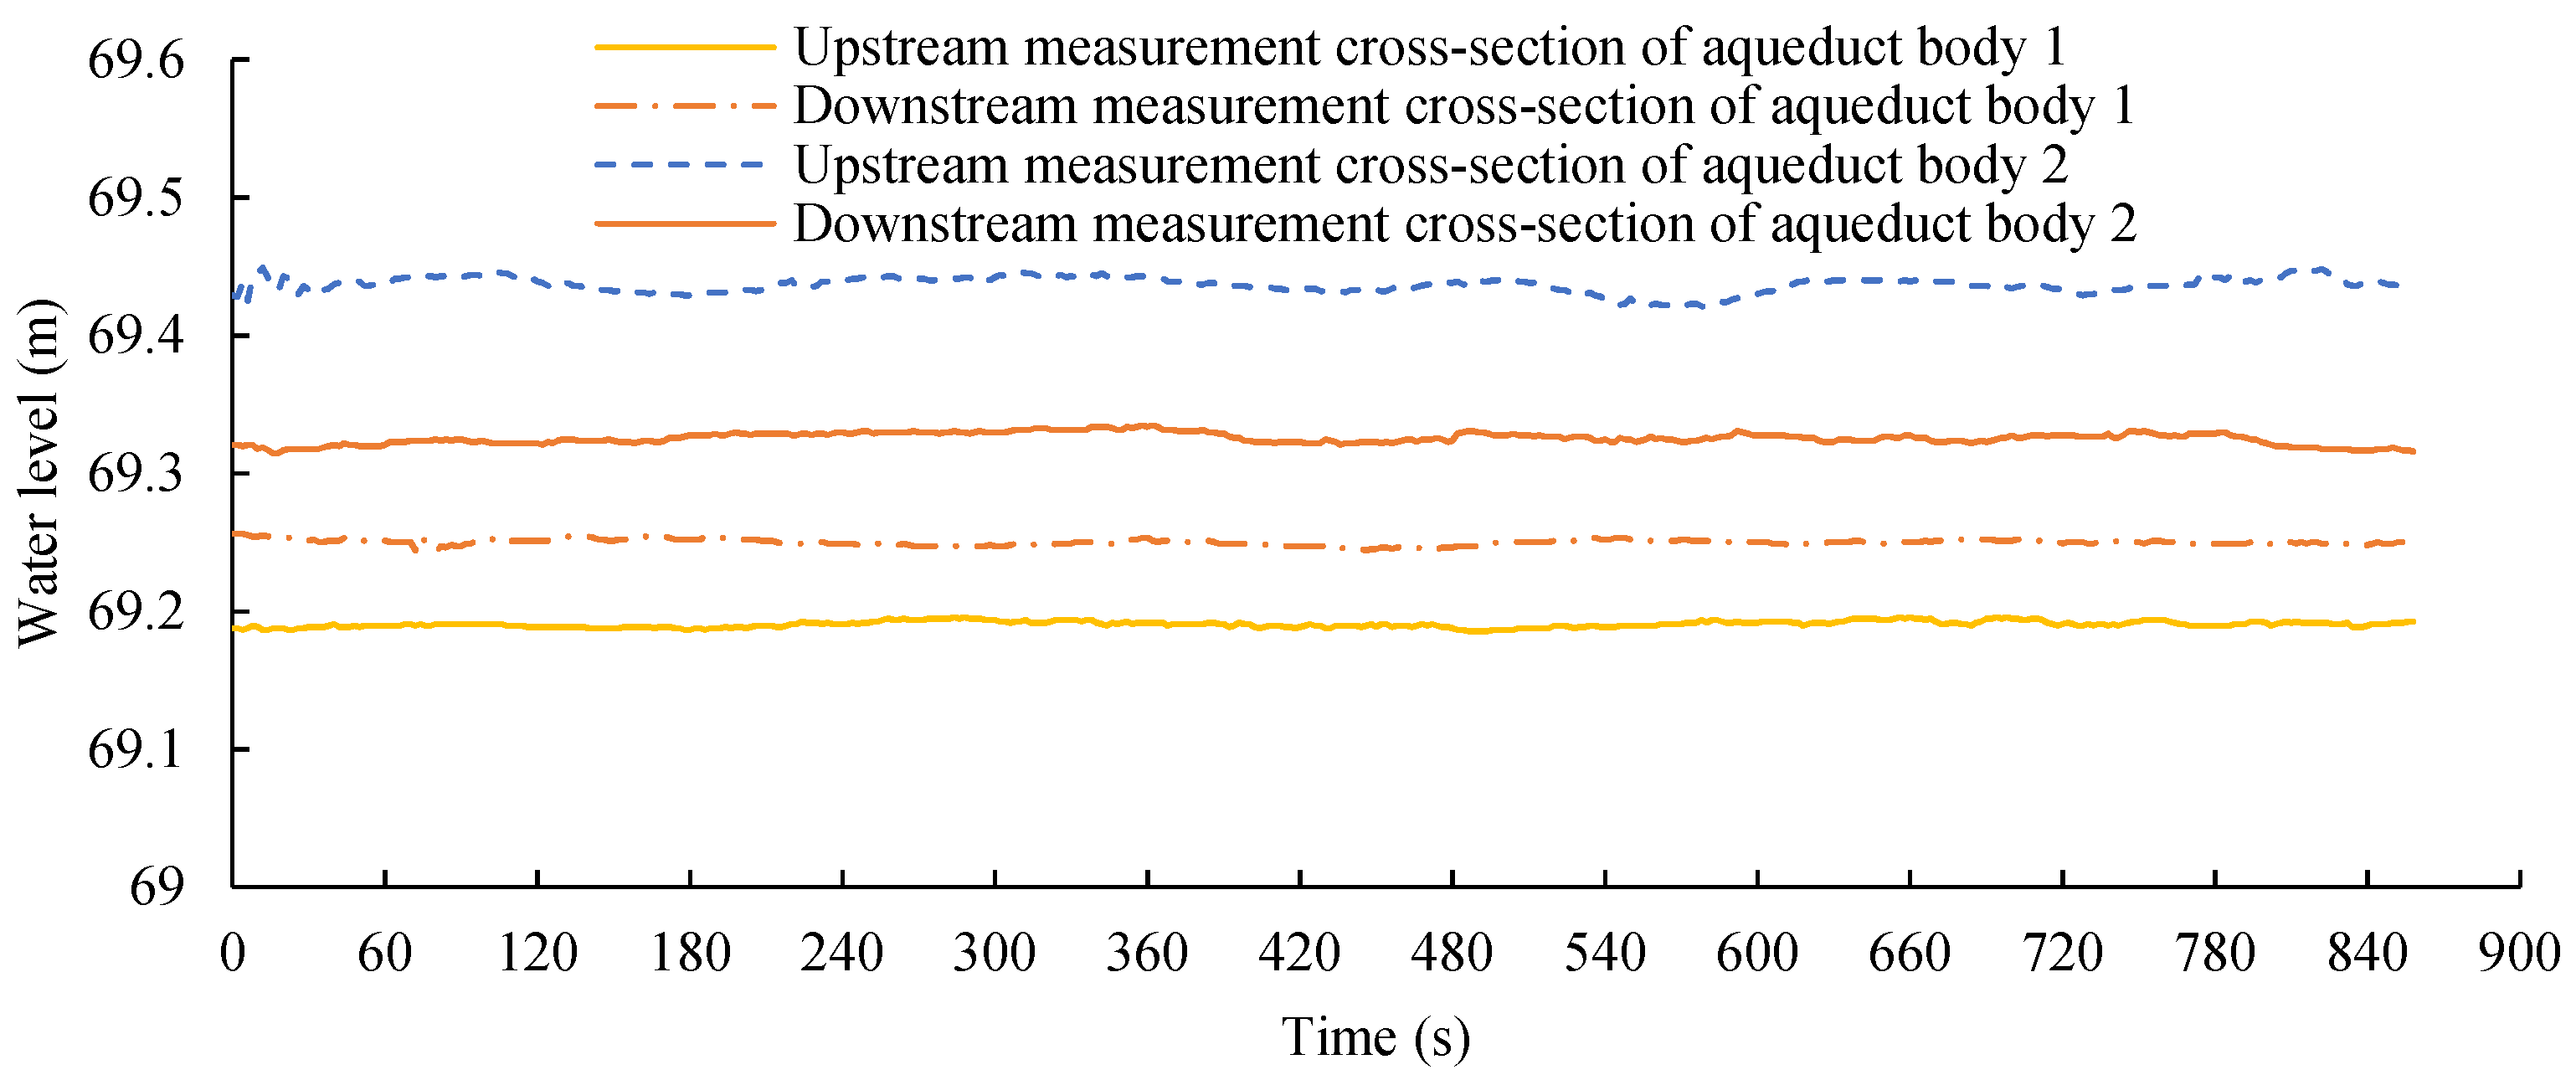
Due to space limitations, only part of the measurement results before the cleaning of the surface adherents are presented here. The velocity history of each measurement point on vertical line 1 at the downstream measurement cross-section of aqueduct body 2 is shown in Figure 6a, and the water level histories at the upstream and downstream measurement cross-sections for aqueduct bodies 1 and 2 are shown in Figure 6b.
For 2021, the water depths, average flow velocities, flow rates, and calculated roughness values for the upstream and downstream measurement cross-sections before and after the cleaning of the surface attachments (i.e., coating with nano-rubber) on aqueduct bodies 1 and 2 are presented in Table 2. Before the cleaning, aqueduct body 1 had a roughness of 0.0130, which decreased to 0.0105 (a decrease of 19.23%) after cleaning and coating with nano-rubber. Before and after the cleaning, the roughness of aqueduct body 2 was 0.0132 and 0.0120 (a decrease of 9.09%), respectively.
Based on the measurement accuracies of the various measuring instruments (Table 1), as well as the measurement results of the hydraulic parameters and structural parameters of each cross-section, the absolute error and relative error of the calculated roughness were obtained. Under four measurement conditions in 2021, the calculated roughness had an absolute error of 0.00043–0.00051 and a relative error of 3.33–4.57%.

3.2. Results and Errors for 2023

The measurement results of the flow rate in the aqueduct are presented in Table 3. The water level histories for the upstream and downstream measurement cross-sections are shown in Figure 7. During the measurement of the flow rate in aqueduct body 2 under Condition #2_2023_After, it was difficult to enter the aqueduct due to the unmanned vessel’s inability to reach the rated speed. Instead, the flow rates in aqueduct bodies 1 and 3 and the total flow rate at the aqueduct’s outlet were measured. The flow rate in aqueduct body 2 was then calculated based on flow conservation, resulting in a value of 65.650 m3/s. To verify the accuracy of this method, during the measurement of the flow rate in aqueduct body 1 under Condition #1_2023_After, the sum of the flow rates of all of the aqueduct bodies and the flow rate at the aqueduct’s outlet were calculated. The difference between the two values was only 0.385 m3/s, which corresponds to a closure error of 0.44%.
The water depths, average flow velocities, flow rates, and calculated roughness values at the upstream and downstream measurement cross-sections in aqueduct bodies 1 and 2 in 2023 are presented in Table 4. The roughness values of aqueducts 1 and 2 were 0.0135 and 0.0147, respectively. The error analysis indicates that the absolute errors of this calculation were 0.00039 and 0.00085, respectively, corresponding to relative errors of 6.28% and 2.64%, respectively.

4. Discussion

4.1. Error Sensitivity Analysis

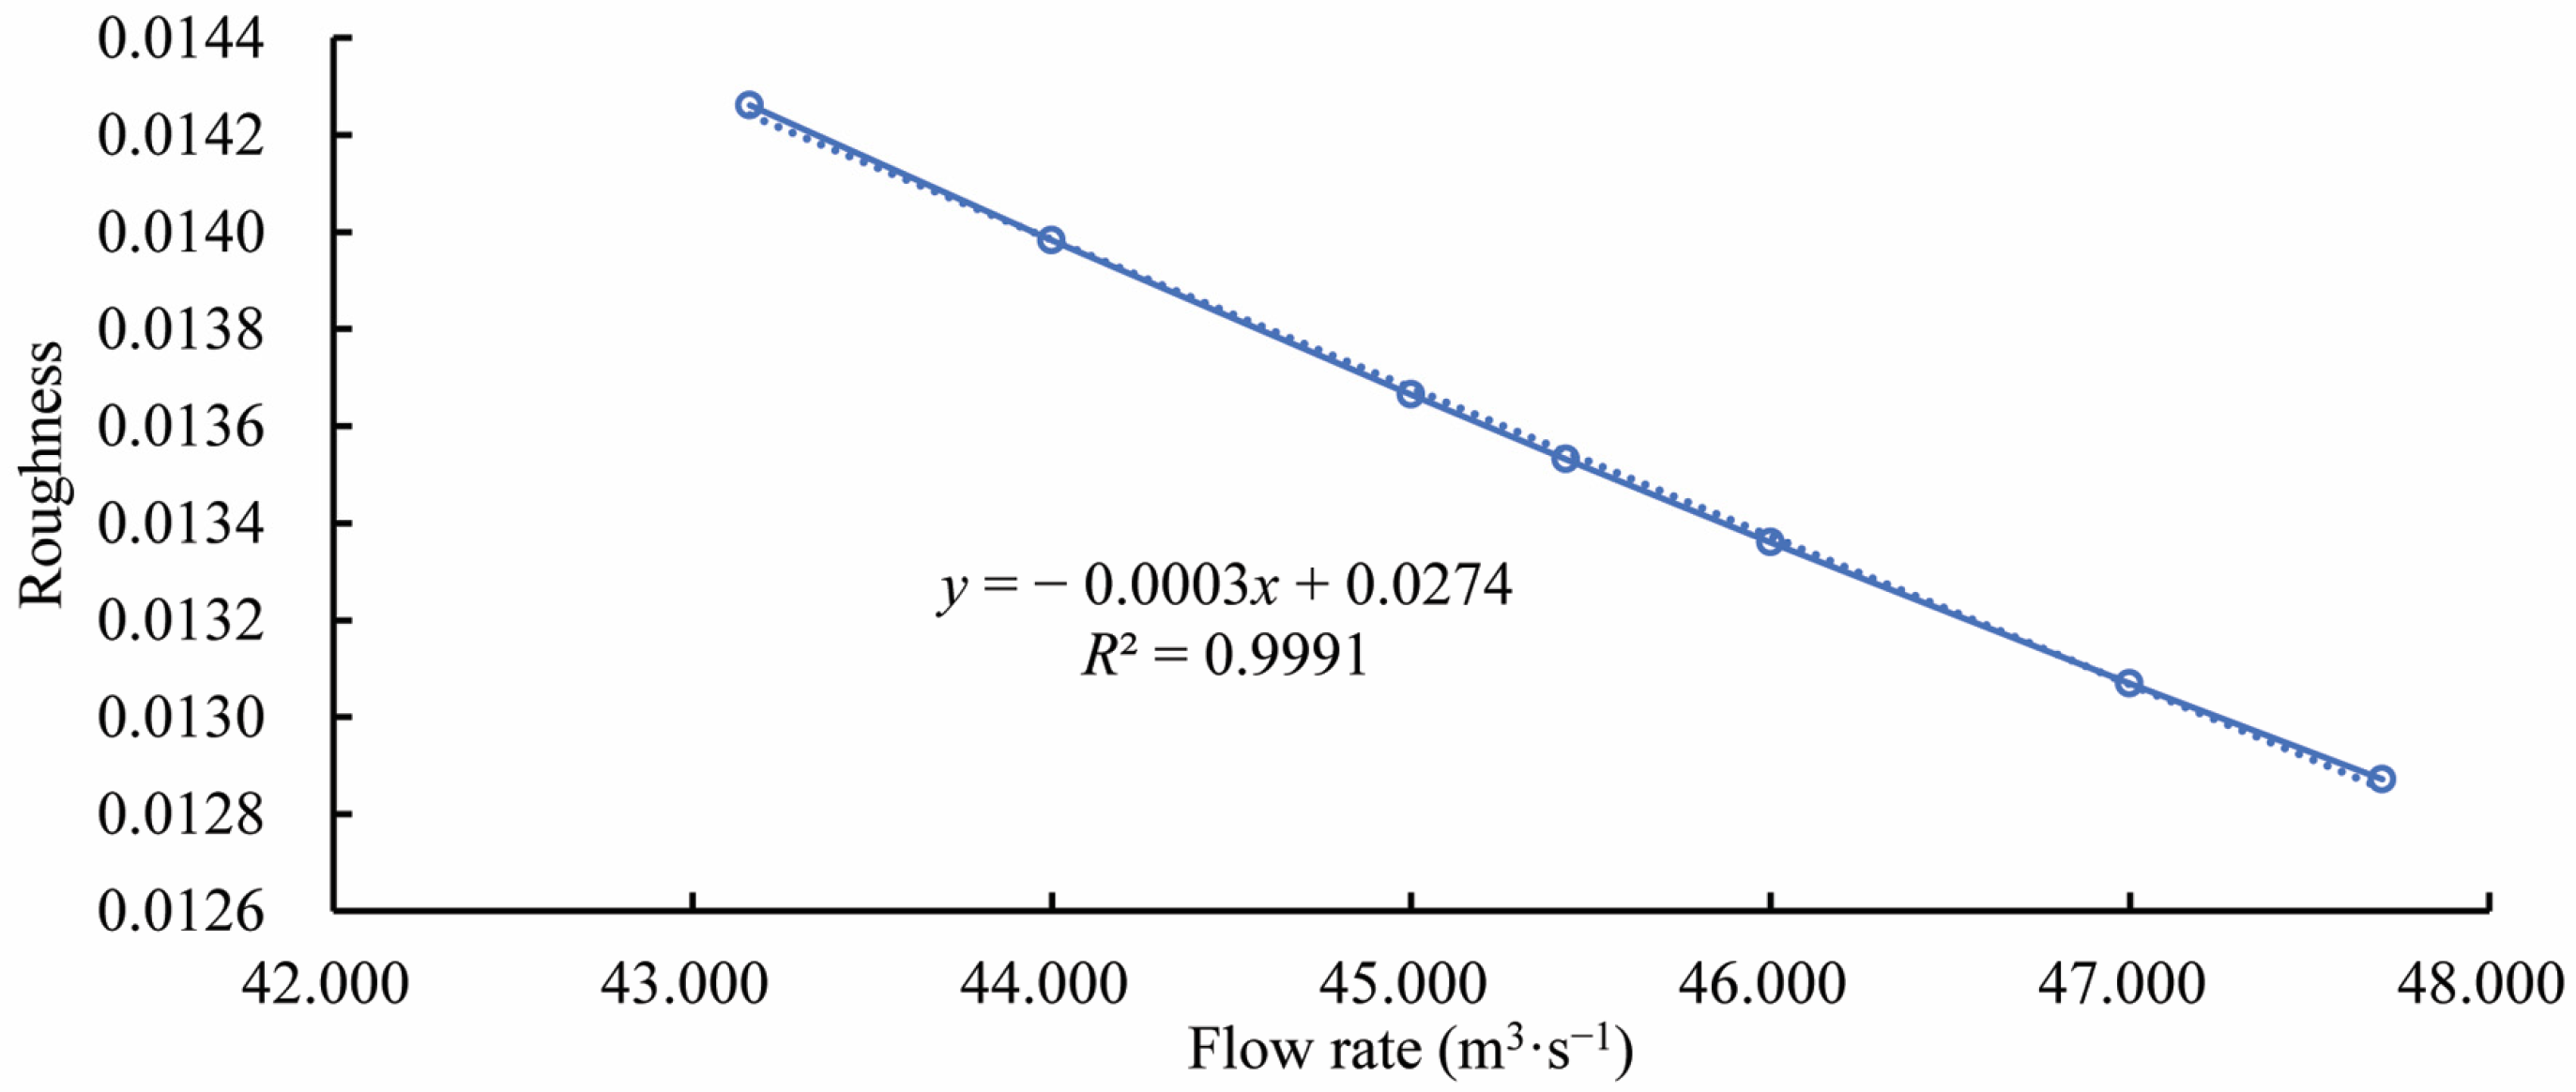
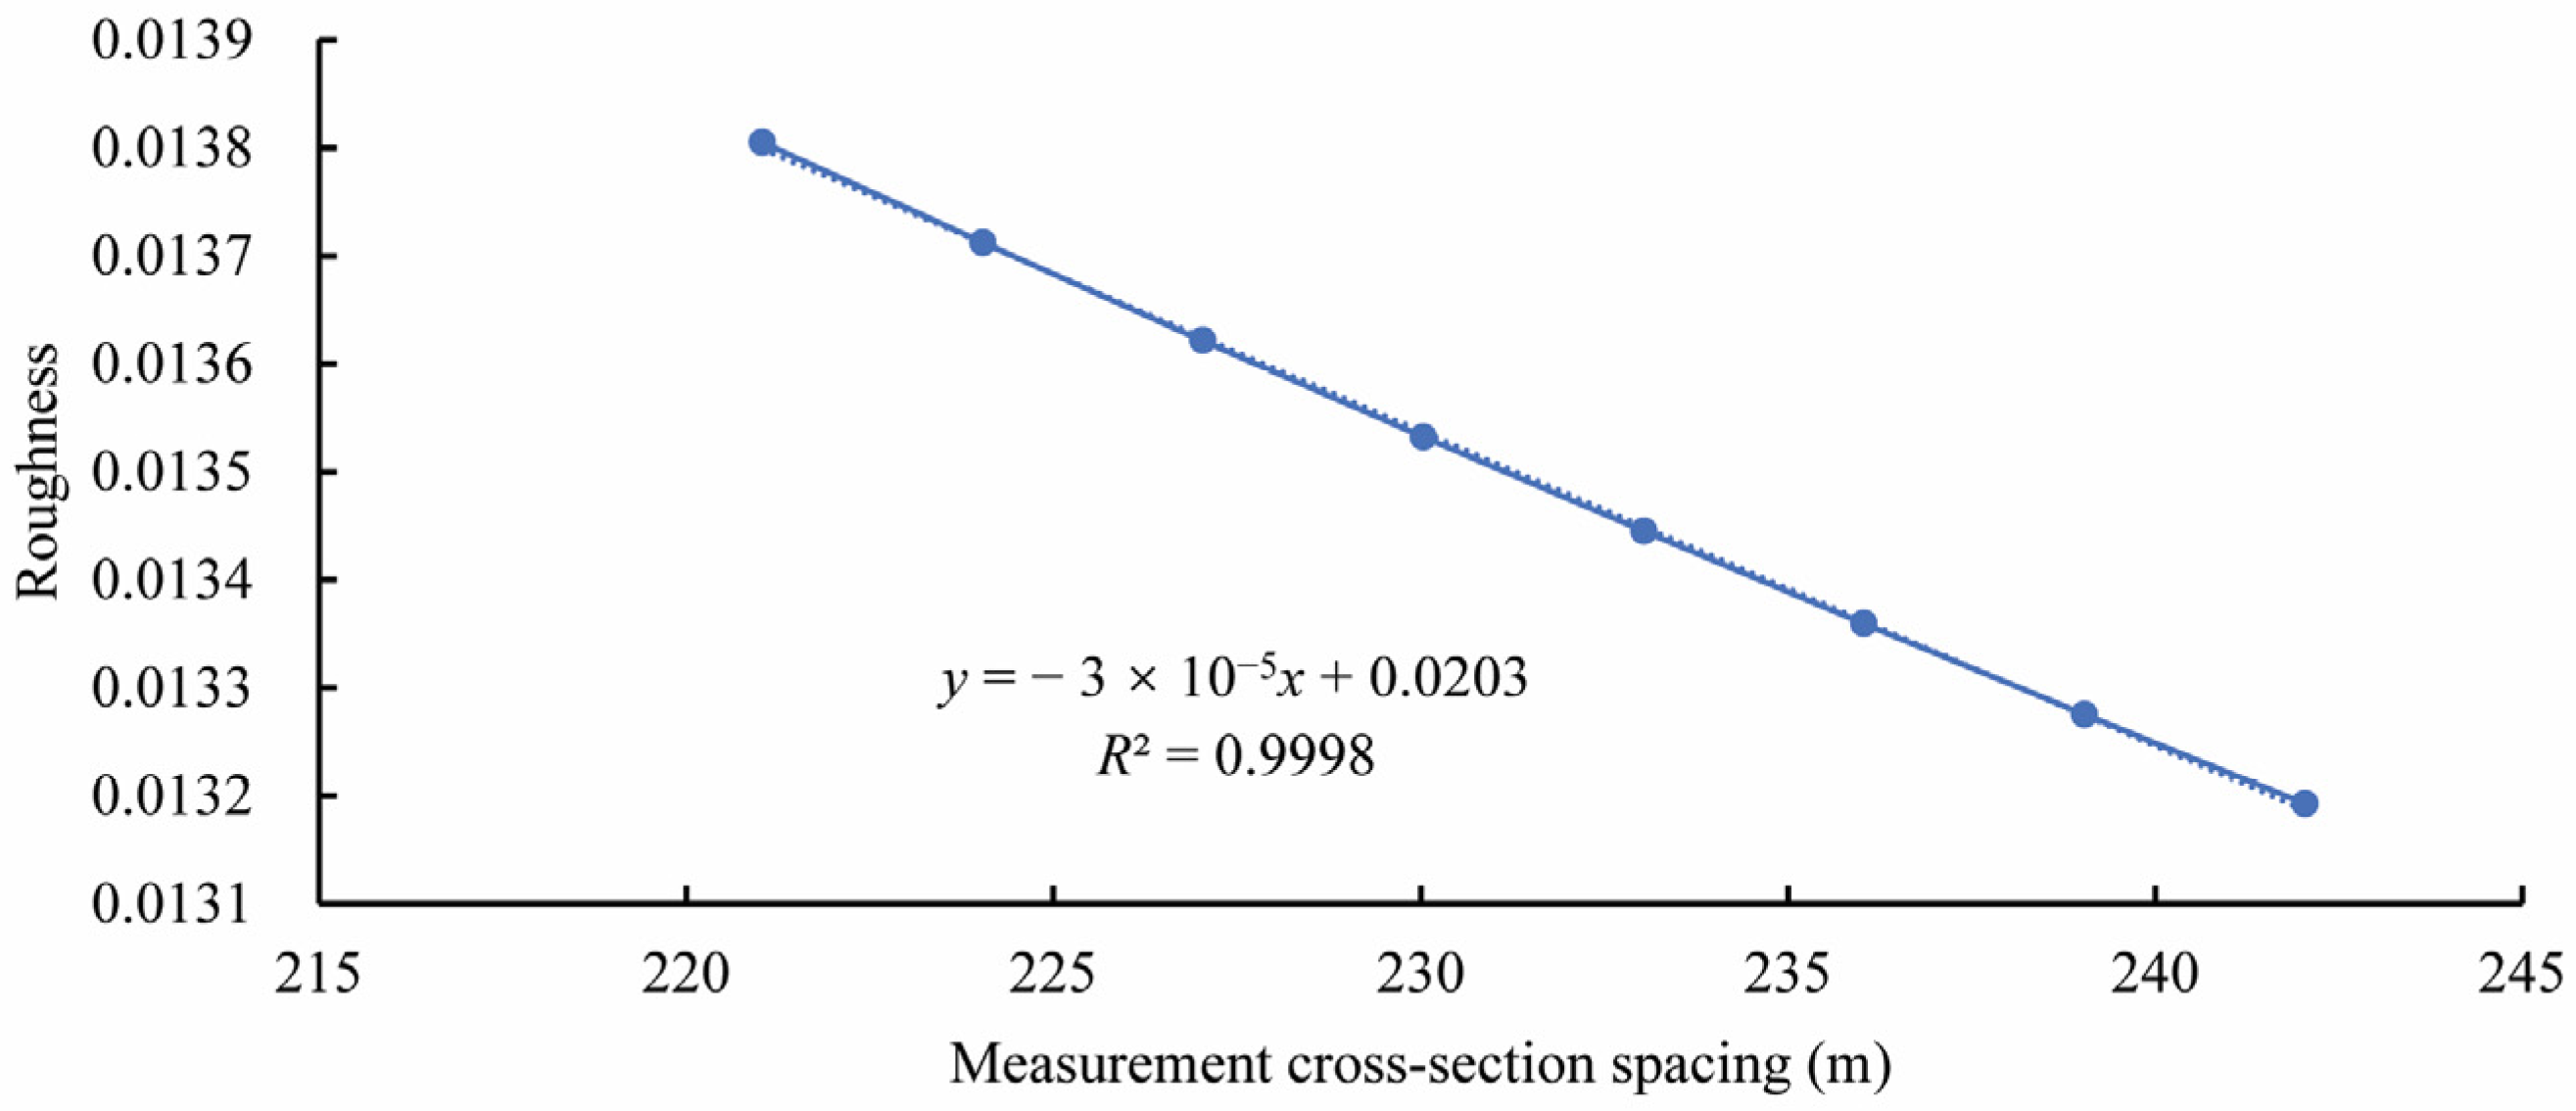
Taking aqueduct body 1 in 2023 as an example, the curves of the relationships between the calculated roughness value and the measured flow rate, water depth at the upstream measurement cross-section, and spacing between the measurement cross-sections were calculated using Equation (4) and plotted (Figure 8, Figure 9 and Figure 10). It can be seen that they all exhibited linear relationships. With a change of 0.0001 in the roughness, the corresponding changes in the flow rate, water level, and section spacing were 0.327 m3/s, 0.0007 m, and 3.401 m, respectively. Based on the performance evaluation of the commonly used measuring instruments, it was found that the calculation error of the roughness had a high sensitivity to the accuracies of the flow rate and water level measurements and a low sensitivity to the accuracy of the distance measurement. In the three field observations, the water level gauge and rangefinder had a measurement accuracy of 0.001 m, which basically meets the above requirements. For the 2021 observations, the flow rate was measured using the velocity-area method, and the estimated measurement error was 5% (approximately 2.5 m3/s), which is lower than the above requirements. For the 2023 observations, the flow rate was measured using an ADCP, and the estimated measurement accuracy was 1% (approximately 0.5 m3/s), which is close to the above accuracy requirements. Improving the accuracy of the flow rate measurement contributes to enhancing the accuracy of the roughness calculation.

4.2. Comparison of Results from Field Observations

The calculated roughness values for 2021 and 2023 are compared in Table 5. The analysis shows that the coating with the roughness reduction material in 2021 led to a decrease in the roughness of aqueduct body 1 by 0.0013 (10.00%) after excluding the difference in the background roughness compared to that of aqueduct body 2, demonstrating a good immediate roughness reduction effect. After two years of operation, the roughness was reduced by 0.0010 (7.41%) after excluding the difference in the background roughness. Due to its ability to repair the microstructure of the concrete surface and reduce the attachment of pollutants, the nano-rubber still exhibited a significant roughness reduction effect after two years of operation. Admittedly, its roughness reduction effect decreased slightly compared to that when it was initially applied in 2021.
The reliabilities of the roughness calculation results for 2021 and 2023 were compared. As can be seen from the previous analysis, the roughness calculation error was mostly attributed to the flow rate measurements. In 2021, the traditional velocity-area method was used, which is a contact measurement method. It was difficult to fix the flow rod due to the high flow velocity at the bottom of the aqueduct, so the velocities at some of the measurement points could not be directly obtained and were indirectly estimated using a FLOW-3D numerical model. In 2023, the ADCP was used for the flow rate measurements. This is a non-contact measurement method. The instrument has a high measurement accuracy and a convenient operation scheme, and the measurement results were cross-checked based on the flow conservation principle. As a result, the roughness calculation results for 2023 are more reliable.

5. Conclusions

The Fangshui River aqueduct in the Middle Route of the South-to-North Water Diversion Project is a large aqueduct consisting of three aqueduct bodies positioned in parallel. In April 2021, a roughness reduction test was conducted. Aqueduct body 1 was cleaned of surface attachments and coated with nano-rubber, aqueduct body 2 was only cleaned of surface attachments, and aqueduct body 3 was left in the original state. Field observations were conducted before and after the test and two years into operation to track and evaluate the effect of the roughness reduction. The findings of the study can be summarized in the following four points:
(1) In 2021, aqueduct body 1 had a roughness of 0.0130 before cleaning and 0.0105 after cleaning and application of the nano-rubber coating, demonstrating a reduction of 19.23%. Aqueduct body 2 had a roughness of 0.0132 before cleaning and 0.0120 after cleaning, i.e., a reduction of 9.09%. Compared to that of aqueduct body 2 after cleaning, the roughness of aqueduct body 1 after cleaning and application of the nano-rubber coating, excluding the difference in the background roughness, was 0.0013 lower, corresponding to a reduction of 10.00%, indicating that the nano-rubber had a good immediate effect in reducing the roughness.
(2) In 2023, the roughnesses of aqueduct bodies 1 and 2 were 0.0135 and 0.0147, respectively. After excluding the difference in the background roughness, the roughness of aqueduct body 1 was 0.0010 (7.41%) lower than that of aqueduct body 2, demonstrating that the nano-rubber still has a good effect in reducing the roughness after two years despite a slight decrease in the degree of roughness reduction.
(3) The relative error of the roughness calculation during the three field observations was 2.64–6.28%, indicating that the calculation results are reliable. The calculated roughness was highly sensitive to the errors in the flow rate and water level measurements and was less sensitive to the error in the section spacing measurements. Taking aqueduct body 1 as an example, in order to achieve a roughness calculation accuracy of 0.0001, the measurement errors of the flow rate, water level, and section spacing should be controlled within 3.270 m3/s, 0.007 m, and 3.401 m, respectively. Improving the accuracy of the flow rate measurement contributes more to enhancing the accuracy of the roughness calculation.
(4) For water conveyance projects with a large flow rate and a low head similar to those of the Fangshui River aqueduct, when developing a scheme for field roughness observation, it is advised that working conditions with a high flow velocity be chosen, that the measurement cross-sections be located away from the turbulent zones near check gates and transition sections, and that non-contact instruments with a high precision be preferentially used for the flow rate and water level measurements.
This research contributes to the understanding of roughness reduction in large aqueducts. Continuing follow-up observations and obtaining more test data are work that should be accomplished, which are essential for a more solid assessment.

Author Contributions

Conceptualization, W.C. (Wenxue Chen), X.M. and W.C. (Wei Cui); methodology, W.C. (Wenxue Chen), W.C. (Wei Cui) and X.M.; field observation, Q.X., J.L., X.L., Z.L. and Z.Z.; writing, W.C. (Wei Cui), W.C. (Wenxue Chen), Q.X. and J.L.; project administration, W.C. (Wenxue Chen) and X.M.; funding acquisition, W.C. (Wei Cui) and X.M. All authors have read and agreed to the published version of the manuscript.

Funding

This research was funded by the National Key R&D Program of China (2021YFC3200905) and the National Natural Science Foundation of China (U20A20316).

Data Availability Statement

Some or all data models that support the findings of this study are available from the corresponding author upon reasonable request.

Acknowledgments

We thank the anonymous reviewers and the editor for providing insightful and detailed comments and suggestions.

Conflicts of Interest

The authors declare no conflict of interest.

References

  1. Niu, X.Q. The First Stage of the Middle-Line South-to-North Water-Transfer Project. Engineering 2022, 16, 21–28. [Google Scholar] [CrossRef]
  2. Li, W.; Xu, X.P. Hydraulics, 3rd ed.; Press of Wuhan University of Hydraulic and Electric Engineering: Wuhan, China, 2002; pp. 152–165. [Google Scholar]
  3. Erhan, A.; Halil, B.U.; Bekir, S.K.; Musa, A.; Serafettin, A. Evaluation of Irrigation Canal Maintenance According to Roughness and Active Canal Capacity Values. J. Irrig. Drain. Eng. 2008, 134, 60–66. [Google Scholar] [CrossRef]
  4. Cui, W.; Chen, W.; Mu, X.; Xiong, Q.; Lu, M. Calculation of Head Losses and Analysis of Influencing Factors of Crossing Water-Conveyance Structures of Main Canal of Middle Route of South-to-North Water Diversion Project. Water 2023, 15, 871. [Google Scholar] [CrossRef]
  5. Asghar, Z.; Shah, R.A.; Shatanawi, W.; Ali, N. A Theoretical Approach to Mathematical Modeling of Sperm Swimming in Viscoelastic Ellis Fluid in a Passive Canal. Arch. Appl. Mech. 2023, 93, 1525–1534. [Google Scholar] [CrossRef]
  6. Asghar, Z.; Khan, M.W.S.; Shatanawi, W.; Gondal, M.A.; Ghaffari, A. An IFDM Analysis of Low Reynolds Number Flow Generated in a Complex Wavy Curved Passage Formed by Artificial Beating Cilia. Int. J. Mod. Phys. B 2023, 37, 2350187. [Google Scholar] [CrossRef]
  7. Kada, B.; Pasha, A.A.; Asghar, Z.; Khan, M.W.S.; Aris, I.B.; Shaikh, M.S. Carreau–Yasuda Fluid Flow Generated via Metachronal Waves of Cilia in a Micro-channel. Phys. Fluids 2023, 35, 013110. [Google Scholar] [CrossRef]
  8. Asghar, Z.; Elmoasry, A.; Shatanawi, W.; Gondal, M.A. An Exact Solution for Directional Cell Movement over Jeffrey Slime Layer with Surface Roughness Effects. Phys. Fluids 2023, 35, 041901. [Google Scholar] [CrossRef]
  9. Asghar, Z.; Shah, R.A.; Ali, N. A Numerical Framework for Modeling the Dynamics of Micro-organism Movement on Carreau-Yasuda layer. Soft. Comput. 2023, 27, 8525–8539. [Google Scholar] [CrossRef]
  10. Asghar, Z. Enhancing Motility of Micro-swimmers via Electric and Dynamical Interaction Effects. Eur. Phys. J. Plus 2023, 138, 357. [Google Scholar] [CrossRef]
  11. Lu, S. Fabrication and Drag Reduction Mechanism of Super-Hydrophobic Surfaces with Micro-Nano Structures. Master’s Thesis, Tsinghua University, Beijing, China, 2012. [Google Scholar]
  12. Falk, C.; Maribu, J.; Eide, L.O. Commissioning the Zeepipe System Sets New Standards. Pipeline Gas J. 1994, 221, 24. [Google Scholar]
  13. Folga, S.M. Natural Gas Pipeline Technology Overview; Argonne National Lab. (ANL): Argonne, IL, USA, 2007. [Google Scholar] [CrossRef] [Green Version]
  14. Qu, D.J. The Engineering Defects and Technologies for Danger Elimination and Reinforcement of Jiangjunshan Aqueduct. J. China Inst. Water Resour. Hydropower Res. 2016, 14, 73–78. [Google Scholar] [CrossRef]
  15. Gu, J.C.; Lu, L.G.; Wang, Y.P.; Zhu, J.; Wu, H.F. Application and Effect Analysis of SCL Impermeable Film in Reducing Roughness of Aqueduct. China Rural Water Hydropower 2020, 9, 71–74. [Google Scholar]
  16. Zhu, J.; Gu, J.C.; Lu, L.G. Application of SK Polyurea in Reducing Roughness and Increasing Flow of Yazhugou Aqueduct in Hongsipu, Ningxia. China Rural Water Hydropower 2020, 10, 181–183+188. [Google Scholar]
  17. Q/HRYSY 001-2020; Nano Modified Silicate Water Solution Permeable Crystal Type Material. Beijing Yisheng Yuan Environmental Protection Engineering Co., Ltd.: Beijing, China, 2020.
  18. Wu, B.; Zhang, K.Y.; Li, X. Application of Nano-rubber in the Reinforcement and Repair Project of Xiangyang Sluice. Water Sci. Eng. Technol. 2021, 6, 66–68. [Google Scholar] [CrossRef]
  19. Zuo, F.S.; Zhao, L.; Wu, H.G. Durability Repairing and Protection Technology of Nano-inorganic Water Permeable Crystalline Concrete and Application Thereof in Hydraulic Concrete. China Water Power Electrif. 2021, 9, 19–23. [Google Scholar] [CrossRef]
  20. Chen, X.C.; Chen, Z.; Liu, B. Application of Nano⁃rubber Concrete Protection Technology in Water Conservancy Projects. Water Conserv. Constr. Manag. 2020, 8, 61–65. [Google Scholar]
  21. Chen, W.X.; Cui, W.; He, S.N.; Mu, X.P. Study on Method of Roughness Calibration for Water Conveyance System. Water Resour. Hydropower Eng. 2019, 50, 116–121. [Google Scholar] [CrossRef]
  22. Abbas, S.A.; Al-Aboodi, A.H.; Ibrahim, H.T. Identification of Manning’s Coefficient Using HEC-RAS Model: Upstream Al-Amarah Barrage. J. Eng. 2020, 2020, 6450825. [Google Scholar] [CrossRef] [Green Version]
  23. Hu, P.N. Prototype Observation of Roughness and Overflow Capacity in Pandaoling Tunnel. J. Yangtze River Sci. Res. Inst. 2019, 36, 67–70+76. [Google Scholar] [CrossRef]
  24. Cui, W.; Liu, L.; Dai, D.C.; Mu, X.P.; Chen, W.X. Uncertainty Analysis of Roughness Measurements for a Large-Scale Canal. In Proceedings of the 38th IAHR World Congress, Panama City, Panama, 1–6 September 2019. [Google Scholar] [CrossRef]
  25. Despax, A.; Perret, C.; Garçon, R.; Hauet, A.; Belleville, A. Considering Sampling Strategy and Cross Section Complexity for Estimating the Uncertainty of Discharge Measurements Using the Velocity-area Method. J. Hydrol. 2016, 533, 128–140. [Google Scholar] [CrossRef] [Green Version]
  26. Yang, K.L.; Wang, Y.S. Error Analysis of Roughness Coefficient Calibration for Channels. J. Hydraul. Eng. 2012, 43, 639–644. [Google Scholar] [CrossRef]
  27. He, Z.; Zheng, Q.; Cai, X.H. Water Characteristics between Nanoparticles of Calcium Silicate Hydrate. J. Hydraul. Eng. 2014, 45, 205–212. [Google Scholar] [CrossRef]
  28. Li, L.Q.; Chen, X.N.; Chen, W.X. A Probe into the Surface Roughness Reduction and Protection of Typical Water Conveyance Structures in the South-to-North Water Diversion Middle Route project. China Rural Water Hydropower 2022, 10, 143–147+153. [Google Scholar] [CrossRef]
  29. GBT 21303-2017; Specifications for Water Measurement of Irrigation Canal System. State General Administration of the People’s Republic of China for Quality Supervision and Inspection and Quarantine. Standardization Administration of the People’s Republic of China: Beijing, China, 2017.
  30. SL 337-2006; Code for Discharge Measurement of Acoustic Doppler Current. Ministry of Water Resources of the People’s Republic of China: Beijing, China, 2006.
Figure 1. Schematic diagram of the structure of the Fangshui River aqueduct.
Water 15 02640 g001
Figure 2. Field roughness test in 2021: (a) cleaning the surface attachments from the aqueduct body; and (b) coating the flow surface with nano-rubber.
Water 15 02640 g002
Figure 3. Field instruments: (a) radar water level gauge; and (b) electromagnetic flowmeter.
Water 15 02640 g003
Figure 4. Fangshui River aqueduct: (a) distribution of measurement points; and (b) simulated flow velocity distribution at the cross-section.
Water 15 02640 g004
Figure 5. Field ADCP flow rate measurement: (a) inside the aqueduct; and (b) downstream of the aqueduct outlet.
Water 15 02640 g005
Figure 6. Measurement data before cleaning: (a) velocity on vertical line 1 at the downstream measurement cross-section for aqueduct body 2; and (b) water levels of upstream and downstream measurement cross-sections for aqueduct bodies 1 and 2.
Water 15 02640 g006
Figure 7. Water level histories at the measurement cross-sections based on field observations obtained in 2023.
Water 15 02640 g007
Figure 8. Relationship between the calculated roughness and the flow rate of aqueduct body 1 based on field observations obtained in 2023.
Water 15 02640 g008
Figure 9. Relationship between the calculated roughness and the water depth at the upstream measurement cross-section of aqueduct body 1 based on field observations obtained in 2023.
Water 15 02640 g009
Figure 10. Relationship between the calculated roughness and the measurement cross-section spacing of aqueduct body 1 based on field observation obtained in 2023.
Water 15 02640 g010
Table 1. Observation instruments and performance parameters.
No.TypeModel or SpecificationMain Performance IndicatorsMeasurementsYear of Observation
1Radar water level gaugeHZ-RLS-26L-50Range: 0.25–15 m; Range hole: 0.25 m; Range accuracy: ±2 mmWater level2021/2023
2ADCPSonTek RiverSurveyorVelocity measurement range: ±10 m/s; Resolution: 0.001 m/s; Accuracy: ±1%Discharge2023
3Remotely controlled, unmanned ship systemNortek USVScope of application: rivers or channels with a velocity of 0–5 m/s/2023
4Electronic levelLeica SPRINTER 100/100MElevation measurement accuracy: 2.0 mm; Distance measurement accuracy: standard deviation = 1‰ of the measured value; Distance measurement range: 2–80 mElevation2021/2023
5RangefinderLeica D5Measuring range: 0.05–200 m; Measuring accuracy: ±1.0 mmDistance2021/2023
6Electromagnetic flowmeterACM2-RSMeasuring range: ±2.50 m/s;
Measuring accuracy: ±0.005 m/s or ±2% (0–±1 m/s);
Resolution: 0.001 m/s;
Flow velocity2021
Table 2. Field observation results for the Fangshui River aqueduct in 2021.
Working ConditionAqueduct BodyWater Depth at the Upstream Measurement Cross-Section (m)Water Depth at the Downstream Measurement Cross-Section (m)Cross-Sectional Average Flow Velocity (m/s)Flow Rate (m3/s)Roughness
#1_2021_Before#13.5193.4702.21753.2160.0130
#1_2021_After#13.4623.4412.30554.8590.0105
#2_2021_Before#23.4763.4382.07949.5300.0132
#2_2021_After#23.4683.4432.11050.3420.0120
Table 3. Field observation results of flow rate measurements in 2023 (m3/s).
Working ConditionAqueduct Body #1Aqueduct Body #2Aqueduct Body #3Aqueduct Outlet
#1_2023_After45.4310.00042.74887.794
#2_2023_After10.907/10.37686.933
Table 4. Field observation results for the Fangshui River aqueduct in 2023.
Working ConditionAqueduct BodyWater Depth at the Upstream Measurement Cross-Section (m)Water Depth at the Downstream Measurement Cross-Section (m)Cross-Sectional Average Flow Velocity (m/s)Flow Rate (m3/s)Roughness
#1_2023_After#14.0154.0121.63145.4310.0135
#2_2023_After#24.2024.1352.26965.6500.0147
Table 5. Comparison of roughness calculation results.
Item20212023Notes
Before ReductionImmediately after ReductionTwo Years after Reduction
Roughness of aqueduct body 10.01300.01050.0135Cleaning and coating
Roughness of aqueduct body 20.01320.01200.0147Cleaning
Difference in the roughnesses of aqueduct bodies 1 and 20.00020.00150.0012Including the difference in background roughness
00.00130.0010Excluding the difference in background roughness
Disclaimer/Publisher’s Note: The statements, opinions and data contained in all publications are solely those of the individual author(s) and contributor(s) and not of MDPI and/or the editor(s). MDPI and/or the editor(s) disclaim responsibility for any injury to people or property resulting from any ideas, methods, instructions or products referred to in the content.