Article

Ciprofloxacin Adsorption onto a Smectite–Chitosan-Derived Nanocomposite Obtained by Hydrothermal Synthesis

by
Marija Ajduković
1,
Gordana Stevanović
1,
Sanja Marinović
1,
Zorica Mojović
1,
Predrag Banković
1,
Katarina Radulović
2 and
Nataša Jović-Jovičić
1,*
1
University of Belgrade—Institute of Chemistry, Technology and Metallurgy, Department of Catalysis and Chemical Engineering, 11000 Belgrade, Serbia
2
University of Belgrade—Institute of Chemistry, Technology and Metallurgy, Department of Microelectronic Technologies, 11000 Belgrade, Serbia
*
Author to whom correspondence should be addressed.
Water 2023, 15(14), 2608; https://doi.org/10.3390/w15142608
Submission received: 19 June 2023 / Revised: 7 July 2023 / Accepted: 15 July 2023 / Published: 18 July 2023

Abstract

:
The employment of compounds obtained from natural sources to produce adsorbents and their application in the elimination of antibiotics from industrial effluents have gained significant attention because of their low production cost and sustainability. Herein, chitosan (biopolymer) and smectite (abundant clay mineral) were used for the low-cost and eco-friendly synthesis of a new type of adsorbent. A low-energy-consumption hydrothermal process was applied to the synthesis of the chitosan-derived carbon–smectite nanocomposite with cobalt (H_Co/C-S). The produced nanocomposite was characterized using elemental analysis, ICP-OES, XRPD, low-temperature N2 adsorption–desorption isotherms, FTIR analysis, and point of zero charge. H_Co/C-S (SBET = 0.73 m2 g−1, d001 = 1.40 nm, pHPZC = 5.3) was evaluated as a ciprofloxacin adsorbent in aqueous solution. Experimental data were fitted with different kinetic models and interpreted by selected adsorption isotherms. The pseudo-second-order model was found to be the most appropriate, while ciprofloxacin adsorption onto H_Co/C-S was best described by the Redlich–Peterson isotherm (R2 = 0.985). The maximum adsorption capacity of H_Co/C-S, according to the Langmuir isotherm (R2 = 0.977), was 72.3 mg g−1. Desorption and thermodynamic studies were performed. The obtained results indicated that the new hierarchically designed H_Co/C-S has promising potential to be further tested for application in real wastewater treatment.

1. Introduction

In a broader sense, antibiotics are defined as synthetic or natural chemotherapeutic agents that are used to treat or inhibit microbial infections caused by microorganisms such as bacteria, fungi, or protozoa [1,2]. They can be grouped by their chemical structure, mechanism of action, action spectrum, and the route of administration [3]. Under different pH conditions, antibiotics can be neutral, cationic, anionic, or zwitterionic [4]. Antibiotics are widely used, and its consumption has risen dramatically worldwide in the past two decades. These compounds are only partially metabolized in human and animal organisms. Therefore, a large proportion of non-metabolized antibiotics are excreted via urine and feces into the aquatic environment [5]. Antibiotics are also present in wastewater from the livestock and pharmaceutical industries [6]. The biggest problem regarding the presence of antibiotics in wastewater, apart from chemical pollution, is the development of antibiotic resistance genes and bacteria in the environment. This poses a great risk to human and animal health [7].
Ciprofloxacin (1-cyclopropyl-6-fluoro-1, 4-dihydro-4-oxo-7-(1piperazinyl)-3-quinoline carboxylic acid; C17H18FN3O3) is a fluoroquinolone antibiotic that is used to treat many bacterial infections. It possesses both basic and acidic functionalities. This hydrophilic antibiotic shows high stability, and it is poorly biodegradable [4,8]. The removal of ciprofloxacin from the aquatic environment has been extensively studied. Physical, chemical, and biological treatments have been applied [9]. It was shown that the degradation of antibiotics often leads to the introduction of even more toxic byproducts, so adsorption as a physicochemical method was found to be simple, effective, and a low-cost method for antibiotic removal from wastewater [10,11].
Many adsorbents were tested for antibiotic removal from wastewater. Among them, zeolites [12], activated carbons [13], metal–organic frameworks [14], and modified clays [15] were the most commonly used. Clay-based adsorbents have been extensively used for the removal of different organic contaminants. Clays are low-cost, ecologically friendly materials with a high specific surface area, good adsorption efficacy, selectivity, and cation exchange capacity [16]. Swelling clay minerals, such as smectite, show a higher adsorption capacity toward heavy metal cations and cationic forms of organic pollutants than non-swelling clay minerals [17]. Nevertheless, the swelling property makes smectite separation after the adsorption process difficult, since it forms very stable colloidal suspensions [18,19]. Although there are numerous publications where smectite was investigated as an adsorbent in fundamental studies, in real wastewater systems, the application of smectites as adsorbents is limited. The modification process strongly contributes to improving the adsorption properties of smectite, reducing the swelling of the adsorbent and makes its separation from the adsorption system easier.
Smectite modification with organic moieties increases the adsorption affinity toward various organic contaminants [16]. Hybrid smectite composites can be obtained by the intercalation of alkylammonium cations (with different carbon chain lengths or with or without aromatic or aliphatic moieties) and phosphonium-ion-based organocations [20]. On the other hand, biohybrid smectites were obtained by the intercalation of polysaccharides such as chitosan, starch, cellulose, gelatin, or polylactic acids. These materials are considered green adsorbents, since they are derived from natural sources [21,22,23,24]. Chitosan is an amino-polysaccharide that is not directly available in the environment but can be derived from the second most abundant biopolymer, chitin. Chitin is the main constituent of the exoskeleton of crabs, shrimp shells, fungi and insects. Chitosan is produced by the partial deacetylation of chitin under alkali conditions. Since it can be obtained from an abundant, naturally available, non-toxic, biodegradable and low-cost source, chitosan can be considered a promising material for many applications, including adsorption. The fact that chitosan can be applied in the circular economy as it can be produced from marine biowaste makes it state-of-the-art material [25,26,27,28,29].
However, there are studies showing that carbon–smectite hybrid composites were able to adsorb higher amounts of pollutants than single-component adsorbents [30]. For this reason, the conversion of a chitosan–smectite nanocomposite to a carbonized smectite material can be performed by hydrothermal carbonization (HTC) as a sustainable process [31]. In addition to this system, the inclusion of transition metals to the adsorbent could contribute to the adsorption efficacy due to complexation interactions with adsorbate molecules that act as ligands [32,33]. Apart from their application in adsorption, materials based on transition metal–carbonaceous phase–clay minerals were successfully used as catalysts in the advanced oxidative degradation of various organic pollutants [34]. Although different transition metals were applied in adsorbent synthesis, cobalt is widely used because, as a bio-essential element, it does not cause major environmental concerns [35].
The novelty of this work is that the smectite–chitosan-derived nanocomposite with cobalt was synthetized via a one-step low-energy consumption hydrothermal carbonization synthesis route at a mild temperature (180 °C). The new procedure in nanocomposite HTC synthesis was applied, and obtained material was, for the first time, investigated as adsorbent for ciprofloxacin removal from aqueous solutions. The effect of different parameters on adsorption performance was followed.

2. Materials and Methods

Smectite-rich bentonite clay from the new deposit of Bogovina (municipality of Boljevac, Eastern Serbia) was used in this work as a starting material. The fraction containing particles of up to 2 µm in diameter was obtained by hydro-separation and submitted to the Na-exchange procedure in order to obtain homo-ionic clay used for the nanocomposite synthesis. Na+-saturated smectite (Na-S) was obtained by the following procedure: A 1 g of the smectite fraction below 2 µm was dispersed into 100 mL of 1 M NaCl. After repeating the procedure three times (until the complete replacement of exchangeable cations by sodium cations), the suspension was separated by filtration. The homo-ionic clay was rinsed with distilled water until a negative reaction on Cl ions in a test with 0.1 M AgNO3) [36].
High molar mass chitosan (deacetylated chitin or poly(D-glucosamine)); (av. MW = 342,500 g mol−1), supplied by Sigma-Aldrich, and Co(CH3COO)2·4H2O, supplied by Alfa Aser, were used for the nanocomposite synthesis.
Ciprofloxacin (C17H18FN3O3–CIP) was obtained from the Alfa Aesar Chemical Company with a chemical purity of 98%, and it was used as a pharmaceutic test model.
All chemicals used in this work were analytical grade.

2.1. Synthesis of Cobalt–Chitosan-Derived Carbon–Smectite Nanocomposite by a Hydrothermal Procedure

The synthesis was performed in a hydrothermal reactor (BERGHOF, BR-300). In the first step, 2 g of chitosan was dissolved in 1% (v/v) acetic acid and stirred at room temperature for 4 h, followed by the addition of cobalt acetate solution. Also, 2 g Na-S was suspended in the appropriate amount of water and stirred for 4 h at room temperature. In the next step, the chitosan/cobalt solution was slowly added to the suspension of Na-S and stirred for 24 h at room temperature. The amount of Co2+ corresponded to 3% of the total amount of chitosan and Na-S. The mixed solution was transferred into a Teflon-lined stainless-steel autoclave with a volume capacity of 250 mL. The carbonization was performed at 180 °C for 24 h and under an autogenous pressure of 9 MPa. When the hydrothermal reaction was finished, the synthesized material was filtered and washed repeatedly with distilled water and dried at 80 °C. The obtained material was denoted as H_Co/C-S.

2.2. Characterization Methods

The sample H_Co/C-S was fully characterized. The elemental composition was determined by CHNS-O, Vario ELIII device, Elementar Analysensysteme GmbH, Hanau, Germany, while the content of cobalt was measured by inductively coupled plasma–optical emission spectrometry (ICP–OES) using an iCPA 6500 Duo ICP Spectrometer (Thermo Fisher Scientific, Cambridge, UK). The emission line of the cobalt was Co II 228.616 nm. Prior to the analysis, the solid sample was digested with microwave assistance (ETHOS1, Advanced Microwave Digestion System).
The X-ray powder diffraction (XRPD) pattern was recorded using a Rigaku SmartLab automatic multipurpose X-ray diffractometer (with a low background Si sample-holder support; 1D D/teX 250 Ultra detector in XRF mode) and a Cu anode (λ = 0.1542 nm). The scanning rate in the applied 2θ range from 2° to 75° was 3° min−1.
FTIR analysis of the investigated sample was performed using a Thermo Scientific Nicolet 6700 FTIR spectrophotometer. Pastilles of KBr containing 4 mg of the investigated samples and 400 mg of KBr were used.
The specific surface area (SBET) and the pore size distribution of the H_Co/C-S sample was determined using nitrogen adsorption–desorption isotherms (Micrometrics ASAP 2020). Prior to the analysis, the sample was degassed at 150 °C for 10 h under reduced pressure. The SBET was calculated using the BET method [37] from the linear plot of adsorption isotherms in the range 0.05 < p/p0 < 0.35. The volume of the mesopores and the pore size distribution were calculated from the desorption isotherm according to the Barrett, Joyner, and Halenda (BJH) method [38]. The volume of the micropores was calculated according to the α-plot analysis [39].
The point of zero charge of the adsorbent H_Co/C-S was determined according to the procedure [40] described in the Supplementary Materials.

2.3. Adsorption Experiments

The adsorption of CIP onto the H_Co/C-S was investigated in aqueous solution in a batch system. The adsorption experiments were conducted in a conical flask placed in a thermostatic shaker (Memmert WNE 14 and SV 1422). Ten milligram samples of the H_Co/C-S were dispersed in 50 mL of adsorbate solution and shaken for a period based on contact time (5, 10, 20, 30, 60, 120, 180, 240, 360, 600, 1080, and 1440 min). After adsorption, solid and liquid phases were separated by centrifugation at 1700 rpm for 3 min (model Heitech Eva 21). The concentration of CIP after adsorption was measured using a UV–Vis spectrophotometer (Thermo Electron Nicolet Evolution 500 UV–Vis) using λmax = 278 nm.
The amount of the adsorbed CIP at time t, qt (mg g−1), was calculated using the following mass balance equation:
q t = ( C 0 C t ) × V m a d s
where C0 and Ct are the initial CIP concentration (in mg L−1) and the CIP concentration at time t, respectively, V is the volume of the adsorption solution (mL), and mads is the mass of adsorbent (mg). The amount of CIP adsorbed at equilibrium time was denoted as qe.
The adsorption of CIP was investigated with respect to the initial CIP concentration, pH, and temperature. The influence of CIP concentration was investigated for the concentrations of 10, 20, 40, and 80 mg L−1 at room temperature, and the pH was unadjusted (pH 5.1). The initial CIP concentration range for the isotherm study was broader (from 5 mg L−1 to 80 mg L−1). The effect of temperature was studied at 25 °C, 35 °C, 45 °C, and 55 °C. For these experiments, the solute concentration was kept constant at 20 mg L−1 and the pH was unadjusted.
A desorption study was performed in order to find the best desorbing eluent for the potential regeneration of H_Co/C-S. Before the desorption experiments, the H_Co/C-S was saturated by CIP under the following adsorption conditions: 10 mg H_Co/C-S was dispersed into 50 mL of CIP solution with an initial concentration of 100 mg L−1 at 25 °C and pH 5.1 for 24 h. After saturation, the CIP-H_Co/C-S was separated, washed, and dried at room temperature. In the desorption experiments, 10 mg of CIP H_Co/C-S was dispersed in 50 mL of 0.1 mol L−1 solution of eluents (HCl, NaOH, NaCl, and H2SO4) and shaken at 25 °C for 180 min in a thermostatic shaker.
The percent of desorbed CIP (D, %) was calculated using following relationship:
D = C D × V D q e × m × 100   %
where CD (mg L−1) is the concentration of CIP in the solution after desorption, V (mL) is the volume of the eluent solution, m (mg) is the mass of the H_Co/C-S saturated by CIP, and qe (mg g−1) is the amount of the adsorbed CIP on the adsorbent.
All adsorption and desorption experiments were performed in triplicate and mean values were presented. The obtained values were reproducible and applied in further analysis of data.

2.4. Interpretation of Adsorption Results

In order to investigate the kinetics of the CIP adsorption onto H_Co/C-S, the experimental data were fitted with the pseudo-first-order kinetic model [41] and the pseudo-second-order kinetic model [42] using their non-linear forms. According to Wang and Guo (2020), the pseudo-first-order kinetic model can be successfully employed to describe the initial stage of adsorption for adsorption processes with a high initial concentration of the adsorbate, and when there are limited number of active sites on the adsorbent surface [43]. The pseudo-second-order kinetic model describes the rate of the adsorption process when the investigated adsorbent is abundant with surface active adsorption sites, and the adsorbate concentration is low and can be applied on the final stage of the adsorption.
The adsorption data were fitted by Freundlich [44], Langmuir [45], Sips [46], and Redlich–Peterson [47] isotherm models. The adsorption data obtained at different temperatures were used to calculate the standard Gibbs energy (ΔG⁰), enthalpy (ΔH⁰), and entropy (ΔS⁰) values for the investigated adsorption process. The thermodynamic parameters were determined according to Huang et al., 2023 and Khankhasaeva et al., 2023 [48,49].

3. Results

3.1. Results of Characterization

The elemental analysis showed that contents of C and N in the carbonized sample were 16.6 mass% and 2.37 mass%, respectively. According to the ICP-OES analysis, the cobalt content was 1.35 mass%. The obtained results confirmed the successful incorporation of carbon phase and cobalt ions into the smectite structure during the hydrothermal process.
The XRPD analysis was performed in the range of 2θ from 2° to 75° for Na-S and H_Co/C-S, and this is presented in Figure 1.
The characteristic reflections on the diffractograms of Na-S and H_Co/C-S were identified according to the literature database [50]. Smectite (Sm) was recognized as main constituent of both samples, while the presence of quartz and calcite, as associated minerals, was also confirmed. The diffractogram of Na-S showed an amorphous phase of aluminosilicate in the region between 27° and 30° 2θ [51,52], while in the carbonized sample, the amorphous phases were present in the range of 2θ from 15° to 30° and corresponded to amorphous phases of both silicates and aluminosilicates [53]. Based on this finding, it can be assumed that the hydrothermal treatment contributed to the formation of amorphous minerals.
In the diffractogram of H_Co/C-S, reflections related to the cobalt phases were not present, which is in accordance with a previous analysis of samples containing cobalt phases below 10% [34].
The values of basal spacing (d001) were 1.28 nm and 1.40 nm for Na-S and H_Co/C-S, respectively. The increase in interlamellar space was a consequence of the carbonization of intercalated chitosan during the hydrothermal treatment. The obtained basal spacing after the carbonization process is in agreement with the previous findings [54,55]. Keeping in mind that the thickness of the smectite lamellae in Bogovina is approximately 1.00 nm, the value of 0.40 nm corresponds to the formation of a carbon monolayer [55] in the interlamellar space of smectite.
The textural analysis provided significant information of the properties relevant to the adsorption behavior. Adsorption–desorption isotherms of nitrogen at −196 °C for Na-S and H_Co/C-S are presented in Figure 2. The textural properties calculated from these isotherms using appropriate models are presented in Table 1.
The adsorption–desorption isotherm of Na-S is reversible at lower equilibrium pressures and represents the Type II isotherms, according to the IUPAC nomenclature, with a hysteresis loop of the H3 type at relative pressure p/p0 ≥ 0.4 [56]. This type of isotherm is characteristic of materials with aggregated particles (tactoids of smectite) with slit-shaped pores [57]. The presence of hysteresis indicates the multilayer nitrogen adsorption and capillary condensation of nitrogen [58,59]. Based on the results presented in Table 1, the SBET value for Na-S is 119 m2 g−1.
The adsorption–desorption isotherm of nitrogen obtained for H_Co/C-S (Figure 2) indicated that the adsorbed amount of nitrogen at p/p0 ≥ 0.9 was negligible. The difference between the adsorption and desorption branches is visible at p/p0 > 0.6 and resulted in the hysteresis loop of type H3. Since there is no plateau in the adsorption branch at higher p/p0, the isotherm can be classified as a Type IIb isotherm [57]. This type of isotherm is characteristic of non-porous materials with aggregated planar particles.
The obtained textural parameters of H_Co/C-S compared with Na-S showed a dramatic decrease in Vmeso and Vmicro (Table 1), most likely due to the blockage of smectite pores with carbonized material in the nanocomposite. Although the SBET value for the nanocomposite was smaller than for Na-S, the main mechanisms for the adsorption of CIP were independent of textural parameters [36,60,61]. Most probably the CIP adsorption was governed by the functional sites present in the adsorbent. For example, in Jović-Jovičić et al. (2013) [60], positively charged ammonium groups in a synthetized organo-bentonite composite strongly contributed to the adsorption process of the anionic organic azo dye Reactive Black 5, achieving a high value of qmax, even though the SBET value was only 1 m2 g−1.
The FTIR spectra of Na-S and H_Co/C-S are shown in Figure 3.
The FTIR spectrum of Na-S consisted of vibration bands characteristic of clay minerals of the smectite group. The two sharp bands at 468 cm−1 and 426 cm−1 belong to Si-O-Si deformation vibrations in the amorphous phase of smectite, while the sharp band at 523 cm−1 was ascribed to the octahedral Al-O-Si bending vibration of octahedral sheet [45]. Three low-intensity bands at 913 cm−1, 875 cm−1, and 838 cm−1 originate from the deformation vibrations of Al-Al-OH, Al-Mg-OH, and Al-Fe-OH, respectively. The vibration bands at 1104 cm−1 and 1030 cm−1 correspond to the perpendicular Si–O stretching vibration and in-plane Si–O stretching vibration, respectively. The perpendicular Si–O deformation vibrations can be expected at 755 cm−1 and 697 cm−1, but due to their low intensity, they are not notable in the Na-S spectrum. The bands at 3424 cm−1 and 1631 cm−1 are from the stretching and banding vibrations of O–H, respectively. The band at 3630 cm−1 was ascribed to the OH stretching of inner-surface hydroxyl groups [62,63].
The FTIR spectrum of H_Co/C-S contains absorption bands originating from both the smectite and the carbonized phase. The process of hydrothermal carbonization increased the intensity of the broad peak at 1032 cm−1. The band at ~1030 cm−1 can be ascribed to the stretching C–O–C vibrations in the organic phase present in the carbonized sample [64] as well as to perpendicular Si–O deformation vibrations [62]. The broad band at 1638 cm−1 probably represents overlapped bands from O–H banding vibrations along with the stretching vibration of the C=O (amide I group) originating from the chitosan structure [64]. New bands in the region from 1464 cm−1 to 1395 cm−1 can be assigned to the -CH2 asymmetric stretching vibration and the -CH3 bending vibration in the amide functional group [65]. According to Thang et al. (2008), the bands originated from cobalt oxides should be visible in the region of wavenumbers from 670 cm−1 to 500 cm−1 [66]. However, due to the low intensity or overlapping with bands originating from the smectite structure, the presence of cobalt species was not visible in the spectrum of H_Co/C-S.
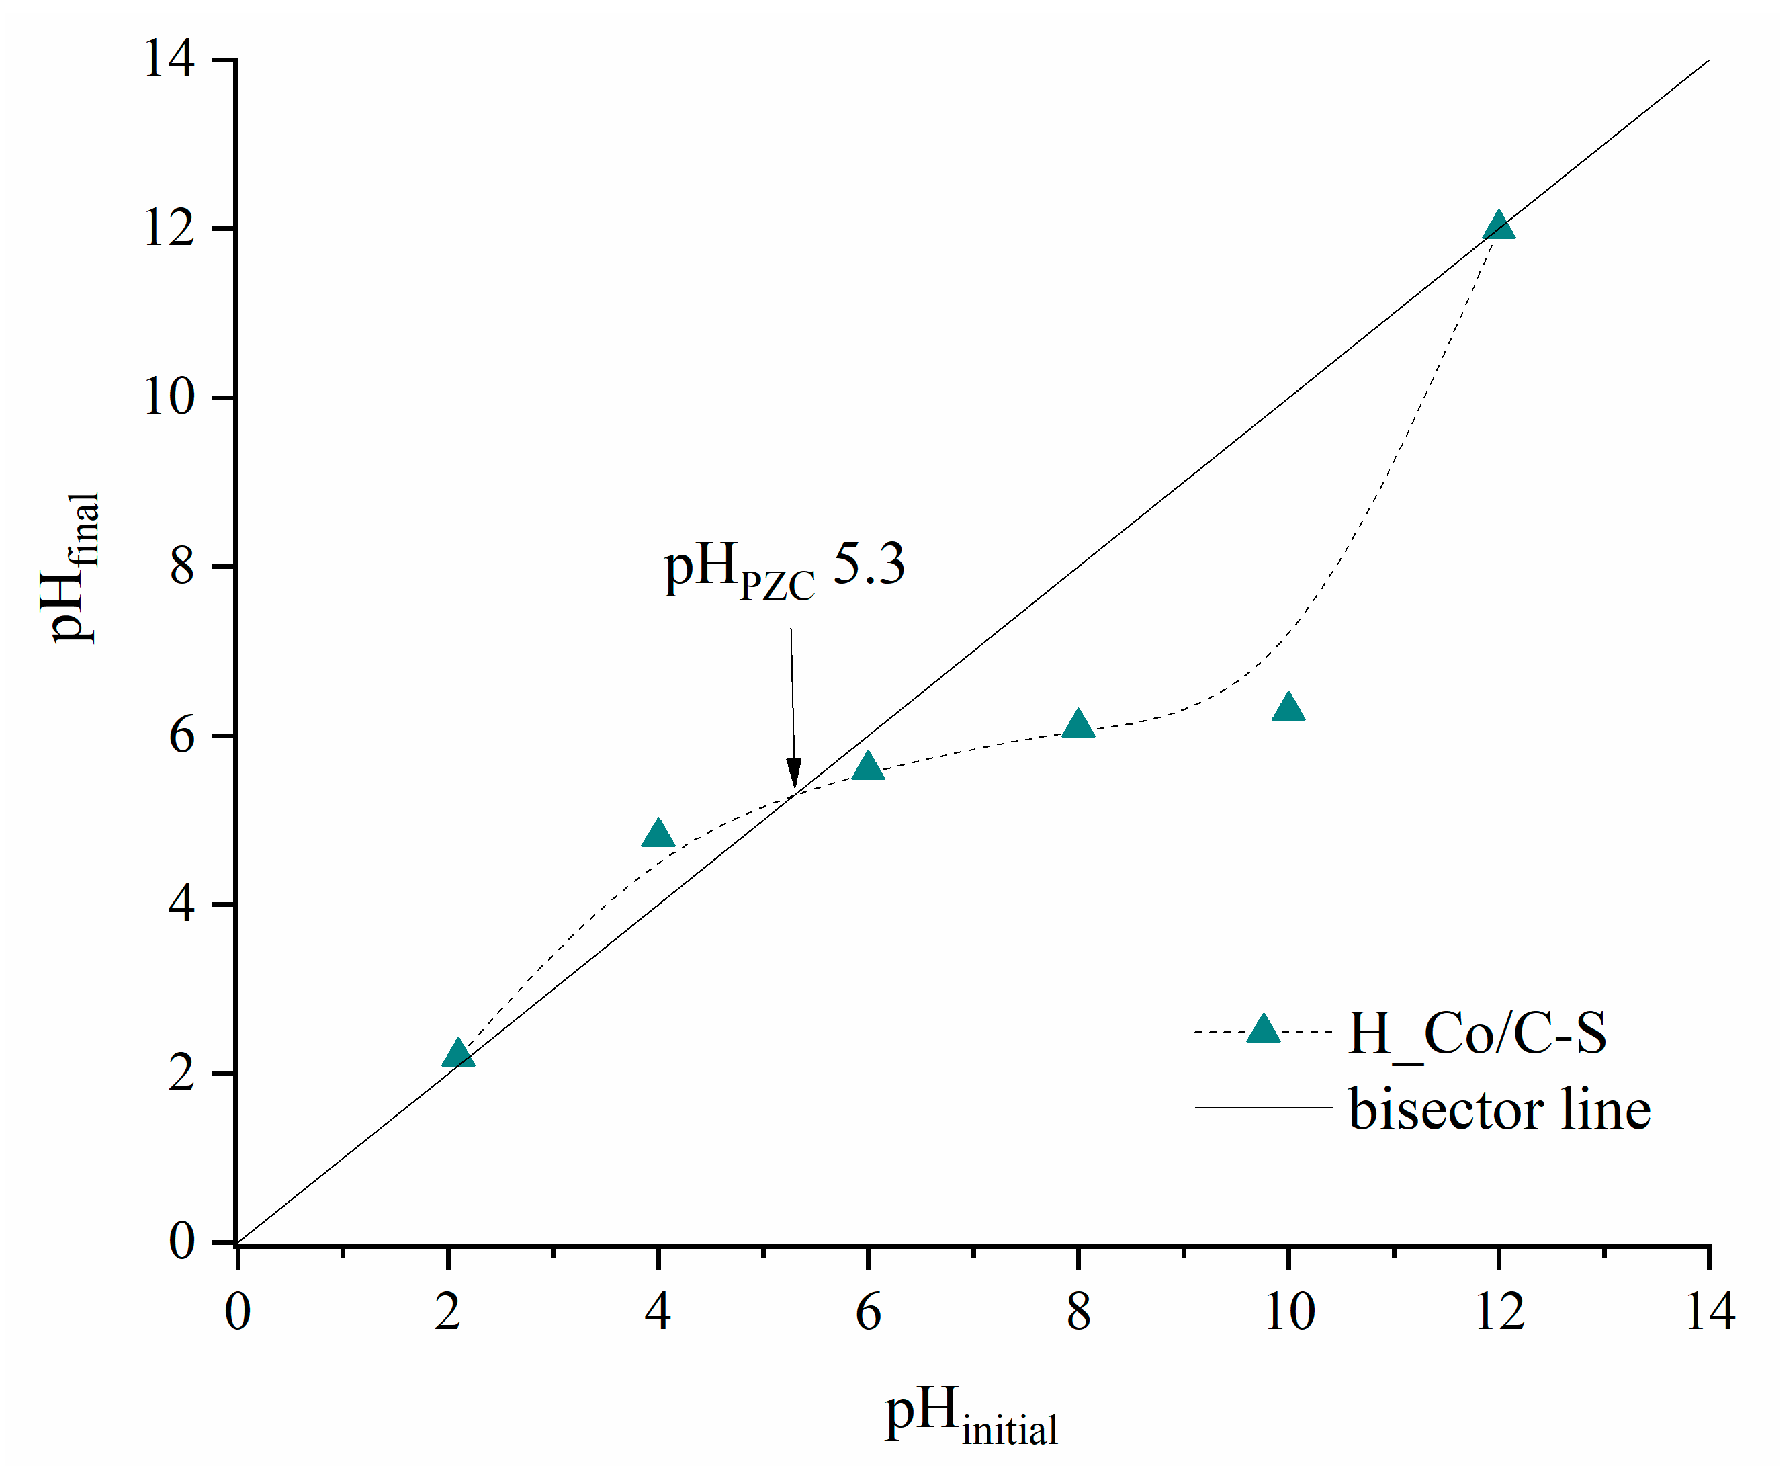
In order to explain the adsorption of CIP at different initial pHs, the point of zero charge of the H_Co/C-S was determined and presented in Figure 4.
The point of zero charge (Figure 4) was determined to be at pH 5.3. The net surface charge of H_Co/C-S below this value was positive, while the net surface charge above a pH value of 5.3 was negative. The charge of H_Co/C-S at different initial CIP solution pHs significantly affected the adsorption of CIP.

3.2. Adsorption Results

3.2.1. The Preliminary Test of Adsorption Efficiency of Na-S and H_Co/C-S

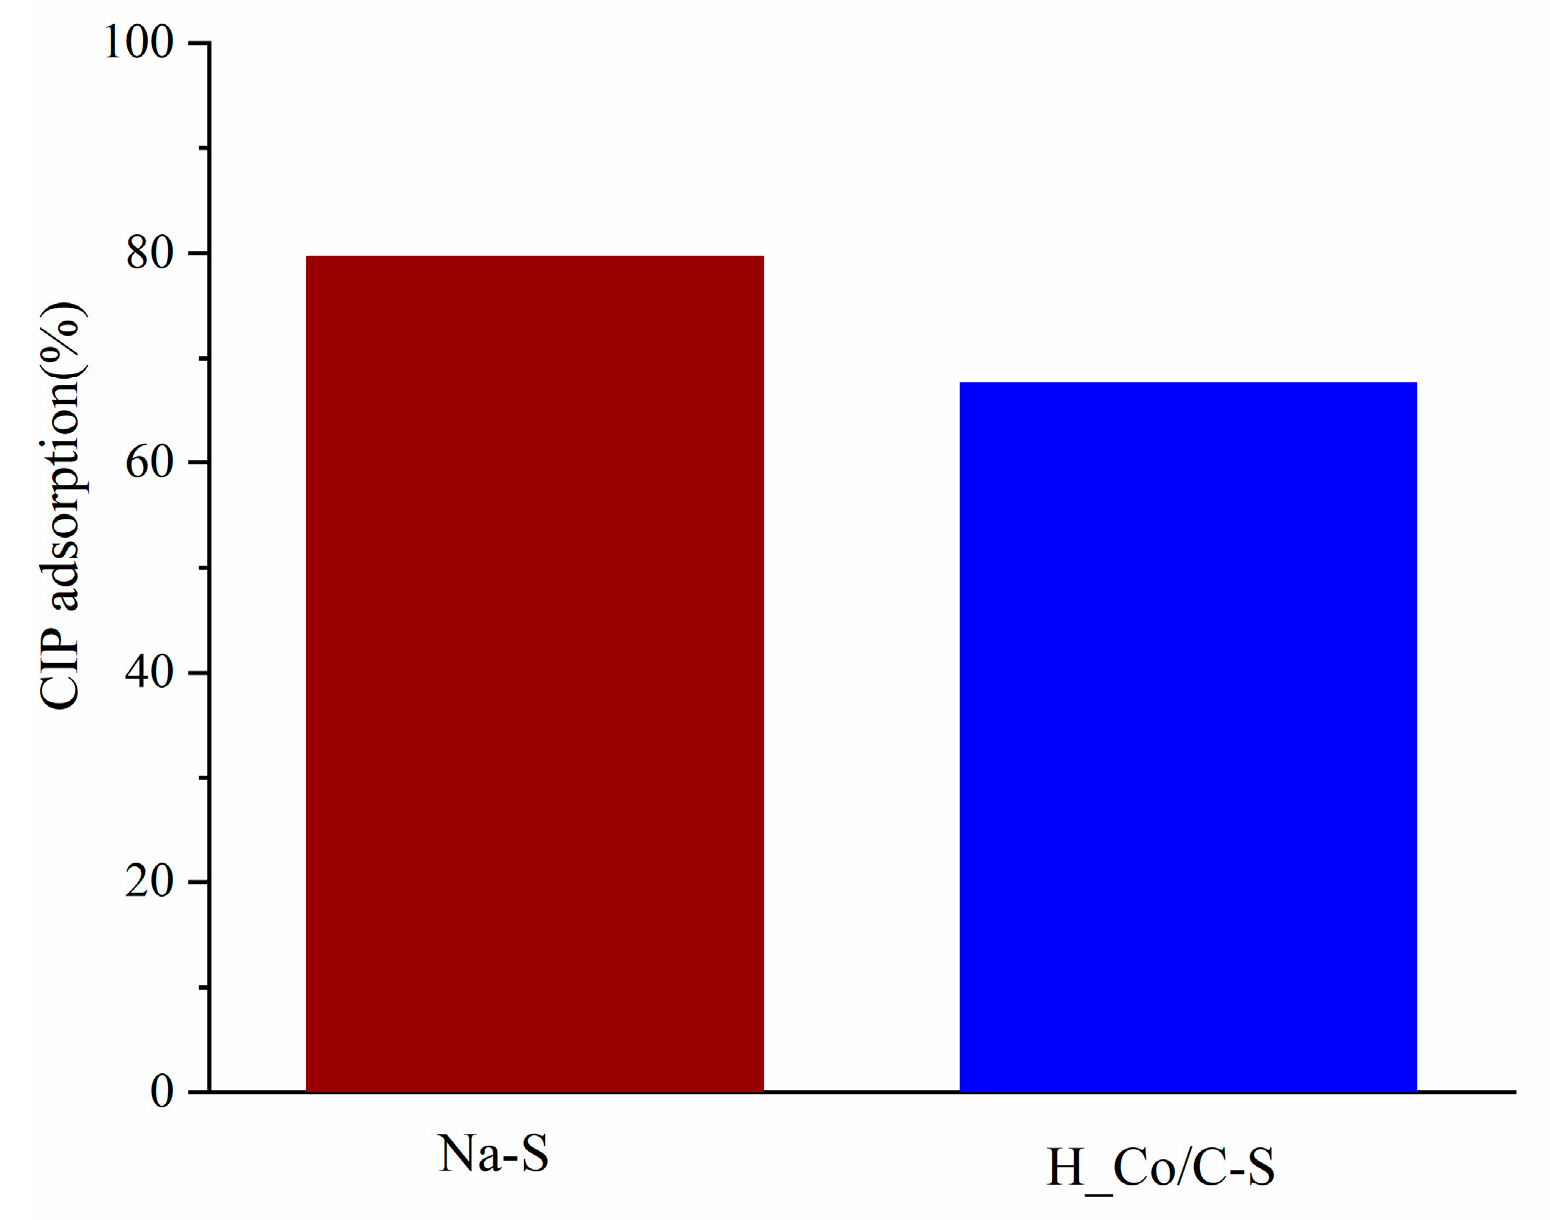
According to Fick et al. [67], the concentration of CIP in the effluent from the pharmaceutical plant was 14 mg L−1, while Bhagat et al. [68] stated that the highest CIP concentration in raw wastewater of the Indian subcontinent reached up to 30 mg L−1. It was decided to use an initial concentration of 20 mg L−1 CIP in the preliminary experiment, since the value is within the range of the CIP concentration in real wastewater. The adsorption efficiency of Na-S and H_Co/C-S was compared, and the percent of the removed CIP is given in Figure 5.
The results of the preliminary efficiency tests (Figure 5) revealed that H_Co/C-S showed slightly lower efficiency, reaching 85% of the efficiency of Na-S for the same adsorption time. Although the process of modification of the smectite surface by carbonaceous materials derived from chitosan resulted in a decrease in textural properties, the adsorption properties were retained to a large extent. Therefore, we assumed that the adsorption process of CIP was governed by the specific adsorption sites and was independent of the adsorbent textural properties. The results of the preliminary efficiency adsorption tests indicated that H_Co/C-S can be further investigated as an adsorbent for CIP.

3.2.2. The Effect of the Initial pH on CIP Adsorption

One of the crucial aspects of effective adsorption is finding the optimal pH value where the highest efficiency of investigated adsorbent is reached.
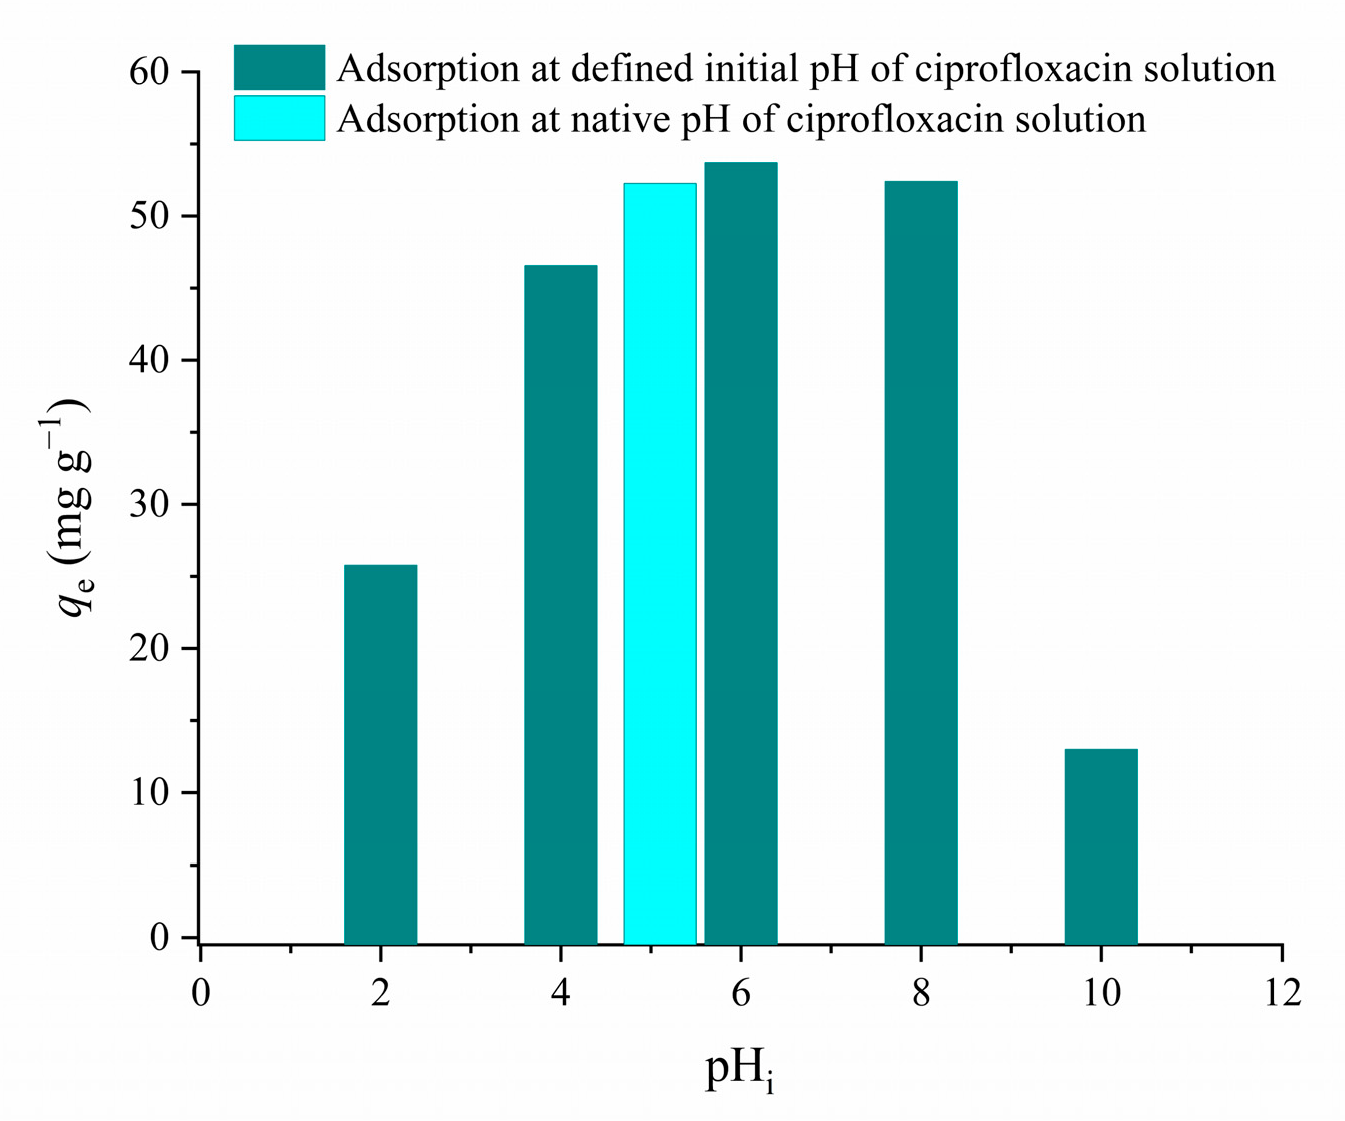
The effect of the initial pH value (pHi) on the amount of the removed CIP per mass of adsorbent is shown in Figure 6.
Figure 6 shows that the adsorption of CIP onto H_Co/C-S increased from the pH value of 2 to 6, then slightly decreased from pH 6 to pH 8. With further increases in pHi, a significant drop in qe is observed. This adsorption behavior of CIP can be explained by the electrostatic interaction between the CIP form present in the solution and the surface charge of H_Co/C-S. CIP exists in mono-cationic form when the pH is less than 5.9. In the pH range from 5.9 to 8.9, CIP is in form of a zwitterion, and at pH above 8.9, CIP is in an anionic form due to the ionization of the carboxylic group [69]. H_Co/C-S reached the highest efficiency toward CIP at pH 6 (pH slightly above the isoelectric point of pHPZC 5.3). At pH 6, the surface of H_Co/C-S becomes negatively charged and an electrostatic interaction occurs with the protonated cyclic amino group of the piperazine ring (present in both the cationic CIP form and the CIP zwitterion form). The rapid decrease in adsorption at pH 10 can be explained by the repulsive interaction between the negatively charged surface of the adsorbent and the anionic surface of CIP. Similar results regarding the effect of pH on CIP adsorption were found in the literature [70,71,72]. Below the point of zero charge of 5.3, at pH 4, the amount of adsorbed CIP was approximately 87% of the amount adsorbed at optimal pH. Since this pH is below the PZC value, the surface of the adsorbent and adsorbate are both positively charged, and the electrostatic interaction cannot be responsible for the CIP removal. This result suggests that an additional mechanism of CIP interaction with adsorbent surface exists that includes probable hydrogen bonding or complexation with the cobalt phase present at the H_Co/C-S surface. By further decreasing the pH to 2, the amount of the adsorbed CIP decreased, presumable due to more expressed repulsive interaction between adsorbent surface and the adsorbate. Finally, adsorption of CIP at the native pH of 5.1—obtained by CIP dissolution without additionally setting pH values—led to the amount of the adsorbed CIP of 52.26 mg g−1, which is 97% of the adsorbed pharmaceutic at optimal pH. Based on these results, further adsorption experiments were performed at the native pH of the CIP initial solution. However, despite the optimal pH being found to be around 6, adsorption in real adsorption systems can be performed in the broad range of initial pH values (4–8) with high efficiency.

3.2.3. The Effect of the Initial CIP Concentration and Kinetic of Adsorption Process

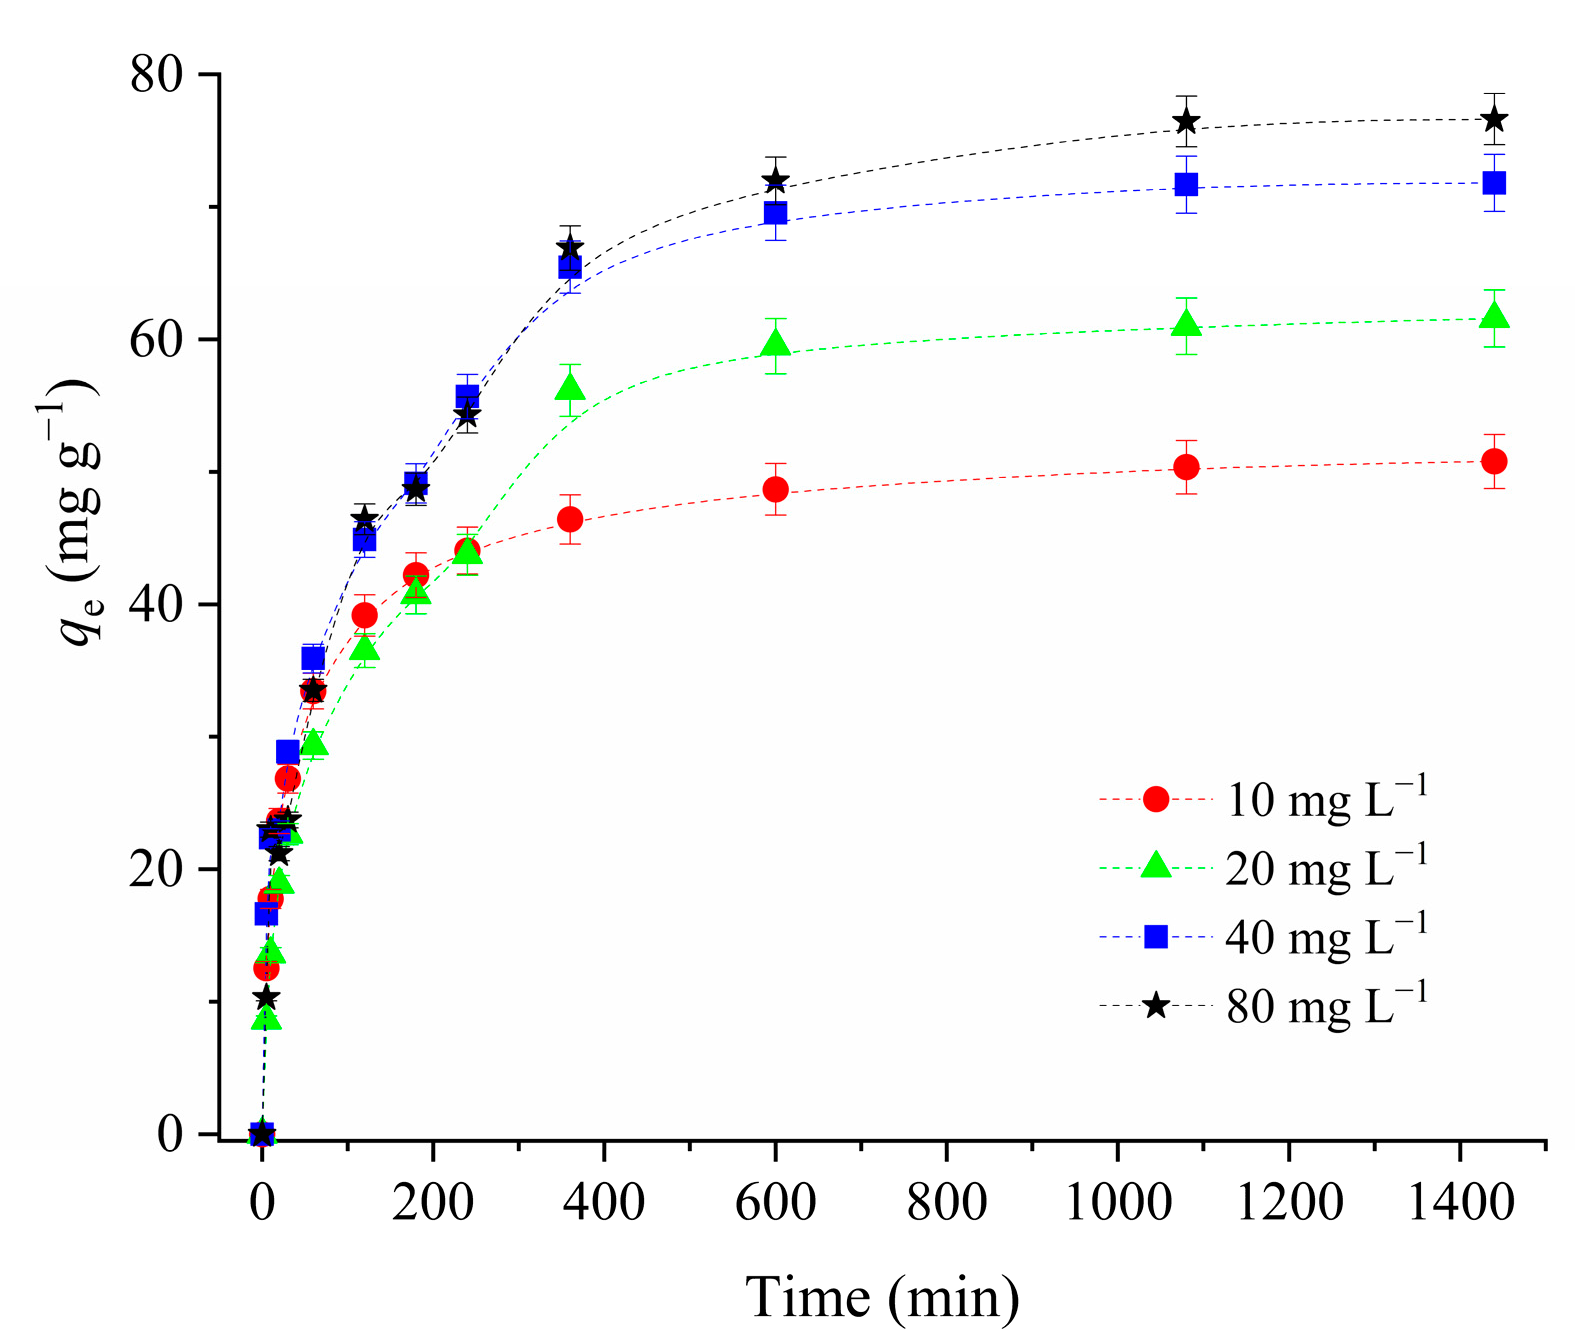
The effect of the initial CIP concentration on the amount of the adsorbed CIP with respect to the contact time is given in Figure 7.
Although the adsorption of the CIP was rapid in the first 60 min, the process slowly attained equilibrium, which was reached after 1440 min. However, for an adsorption time of 240 min, the percentages of adsorbed CIP for initial concentrations of 10 mg L−1, 20 mg L−1, 40 mg L−1, and 80 mg L−1, were 86.7%, 70.1%, 77.5%, and 70.9%, respectively. The investigated adsorption process became slow, and reaching the final state of equilibrium lasted longer, mainly due to the occupation of active adsorption sites over time.
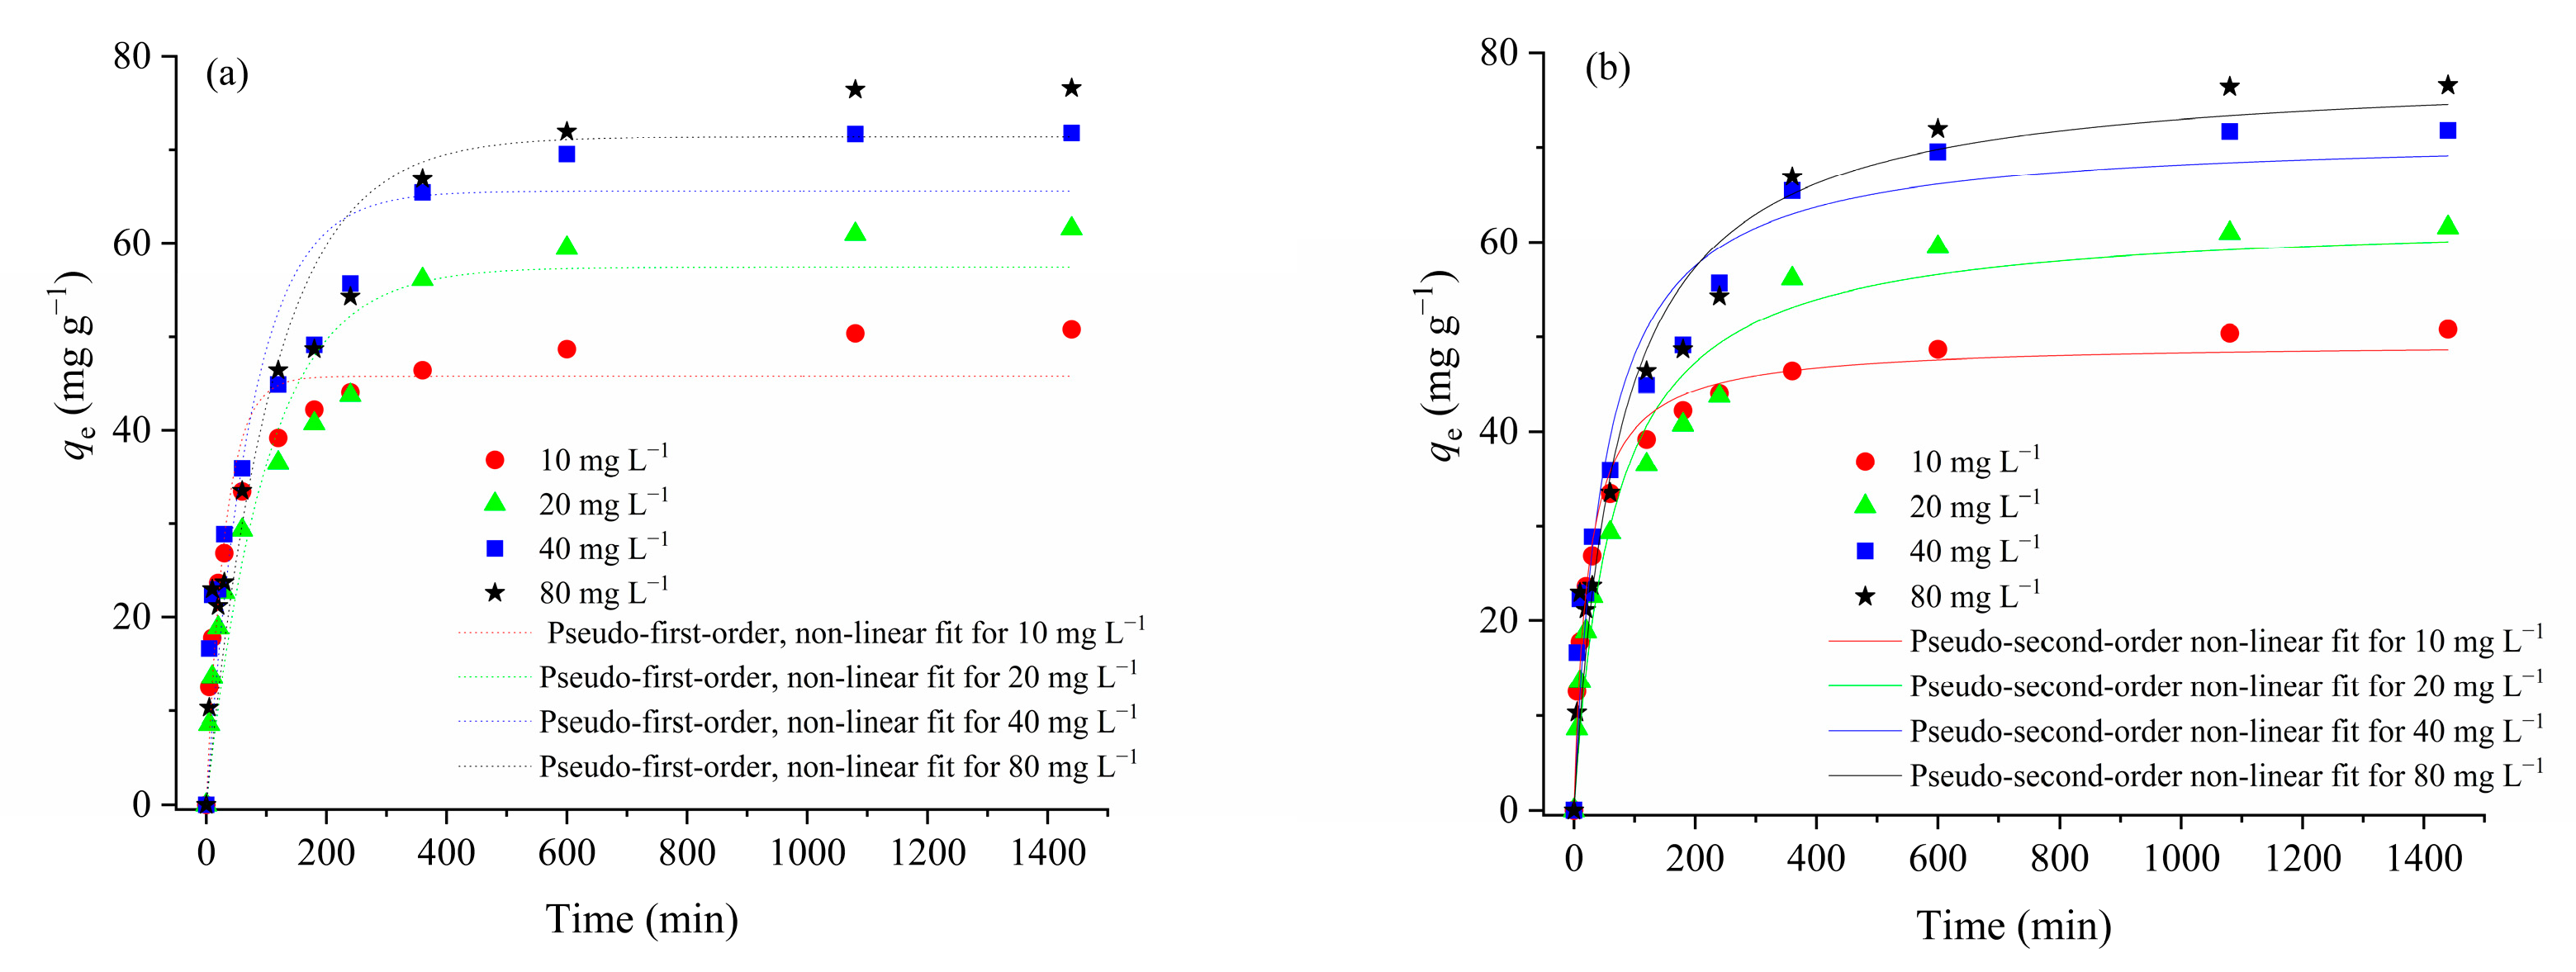
The non-linear plots of the pseudo-first-order and pseudo-second-order kinetic models for the adsorption of CIP onto H_Co/C-S are given in Figure 8, while calculated parameters of the investigated kinetic models are given in Table 2.
Based on the values of the parameters of the pseudo-first-order kinetic model (Table 2), the coefficients of determination R2 ranged from 0.873 to 0.937, whereas the calculated values of qe for the pseudo-first-order kinetic model were significantly lower than the experimental values (qeexp). However, the R2 values obtained for the pseudo-second-order kinetic model ranged from 0.941 to 0.984, indicating a better agreement between the experimental data and the applied model. Moreover, the calculated and experimental qe values were similar. Therefore, the pseudo-second-order kinetic model was suitable for describing the CIP adsorption onto H_Co/C-S. These results were in accordance with results presented in the literature regarding the adsorption of CIP onto carbon-based materials [73,74,75].

3.2.4. Adsorption Isotherm Analysis for CIP Removal

The adsorption behavior of CIP onto H_Co/C-S was described using several of the most commonly applied isotherm models.
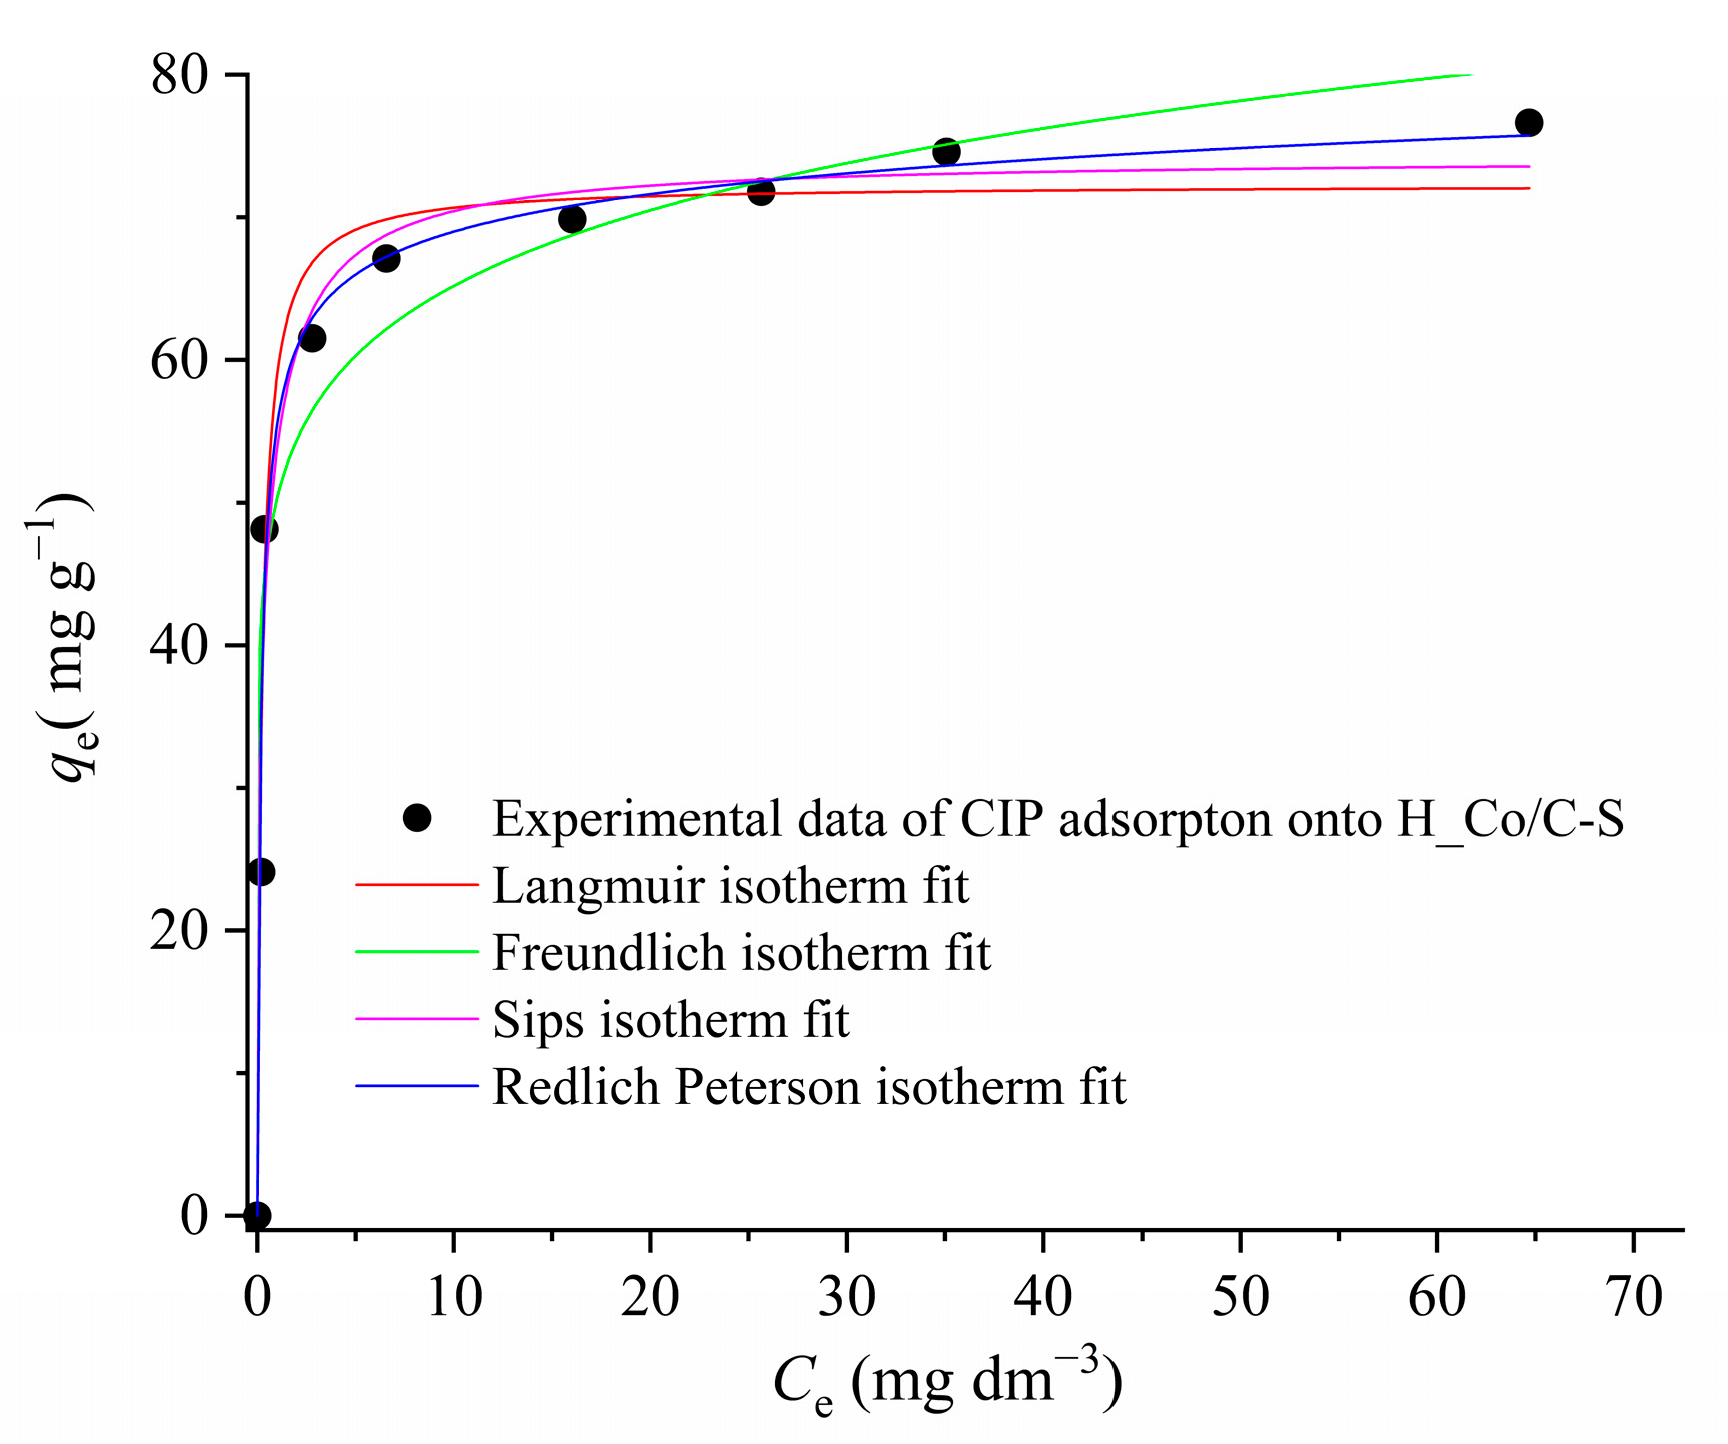
The fitting of the adsorption results of CIP adsorption onto H_Co/C-S by the described isotherm models is presented in Figure 9, while calculated isotherm parameters are presented in Table 3.
From the nonlinear fits of the applied isotherm models (Figure 9) and parameters presented in Table 3, it can be concluded that the adsorption of CIP onto H_Co/C-S is best described by the Redlich–Peterson isotherm model, since the value of the coefficient of determination for the non-linear fit of the isotherm equaled 0.985. According to the model interpretation, the factor nRP indicates heterogeneous adsorption if the value is less than 1, or homogeneous adsorption if the value of nRP is equal to 1. Since the calculated value of nRP for the adsorption of CIP has a value of 0.957, it can be assumed that the adsorption is a heterogenous process. Although the value of R2 for the Redlich–Peterson model showed the best fit with the experimental data, the models with R2 > 0.97 can also be considered as appropriate. Therefore, the value qmax obtained from the Langmuir adsorption model can be used for comparison with the literature data. According to the literature data presented in Table 4, the value of qmax = 72.3 mg g−1 is moderately high and classifies the adsorbent H_Co/C-S as efficient in the process of CIP removal.
A literature review of CIP adsorption capacity showed that smectite clay had the best adsorption properties. However, swelling properties of the layered aluminosilicates cause difficulties in the adsorbent separation process. For this reason, smectite clay is rarely applied in real wastewater systems.

3.2.5. The Effect of Temperature on CIP Adsorption onto H_Co/C-S and Thermodynamics of the Adsorption Process

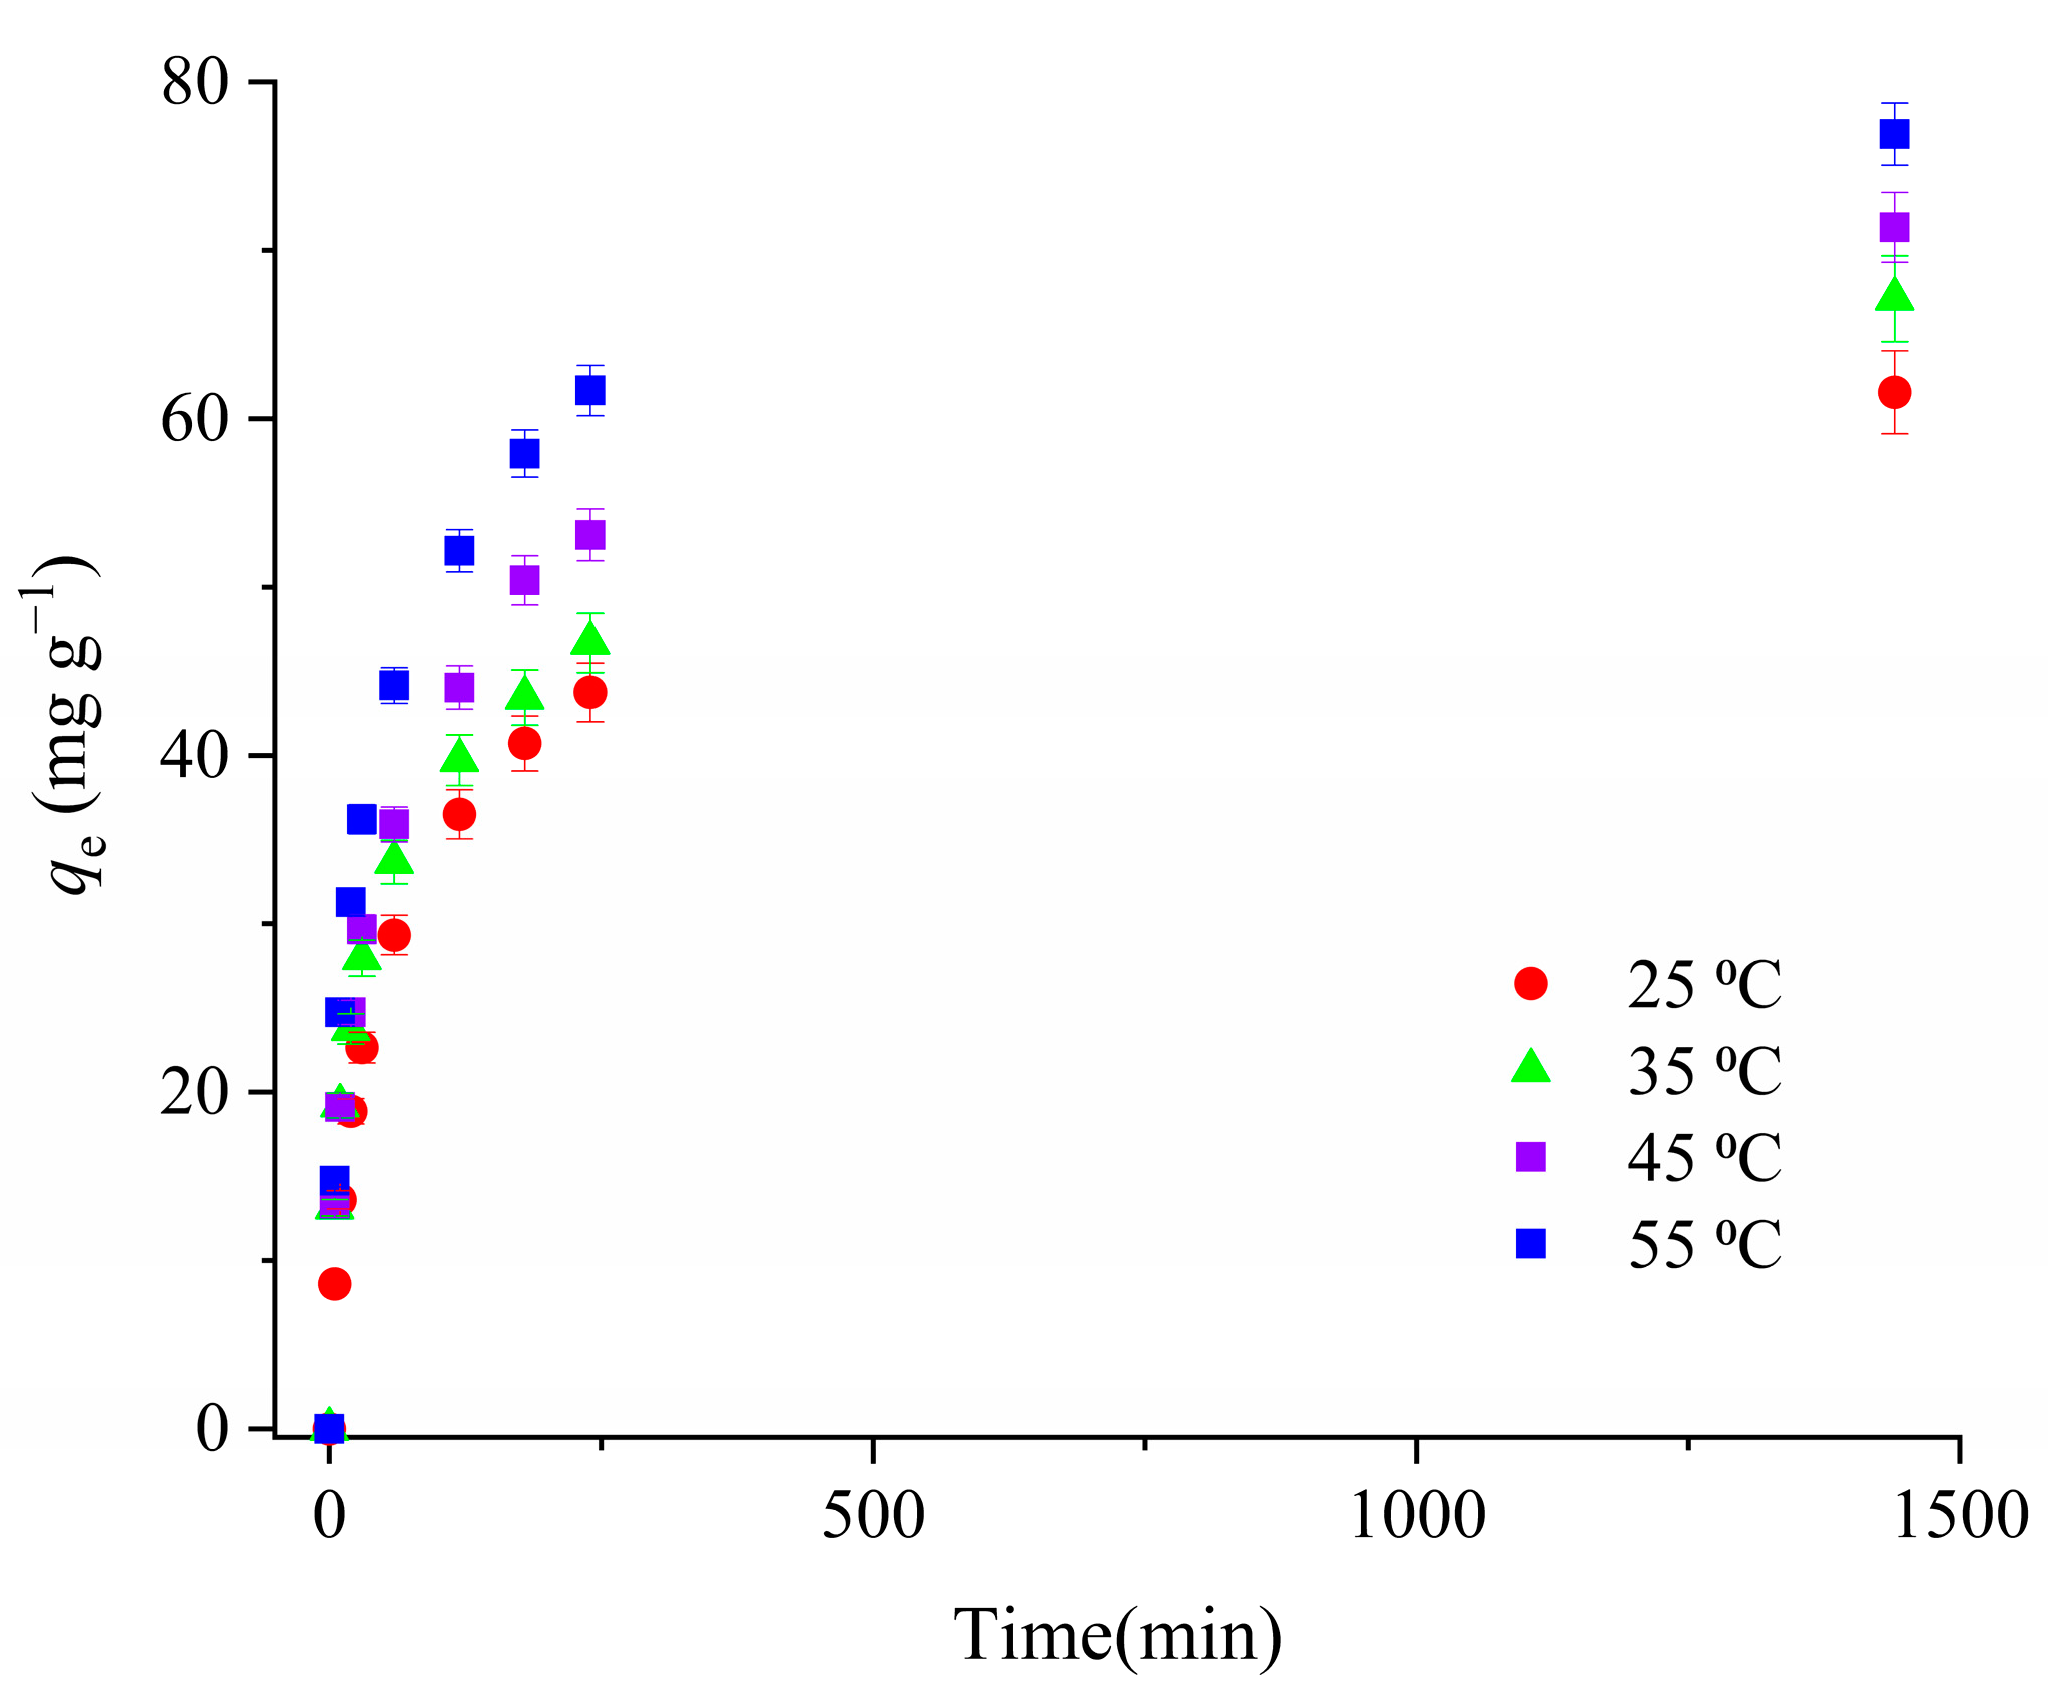
The effect of temperature on the CIP adsorption onto H_Co/C-S is given in Figure 10.
The results presented in Figure 10 revealed the beneficial effect of temperature on the amount of adsorbed CIP. The increase in temperature from 25 °C to 55 °C resulted in an increase in the equilibrium amount of adsorbed CIP of 20%.
The Van’t Hoff linear plot for the CIP adsorption is presented in Figure 11, while the calculated thermodynamic parameters are given in Table 5.
The values of ΔG0 (Table 5) were in the range from −5.16 kJ mol−1 to −7.66 kJ mol−1, suggesting that CIP adsorption onto H_Co/C-S was a spontaneous process at all investigated temperatures. The enthalpy value of 19.7 kJ mol−1 indicated that the adsorption process was endothermic, and that interactions between adsorbent and adsorbate could be classified as physicochemical [72,79].
The question of the usage of KD values with different units for appropriate thermodynamic studies has been raised in the literature [80]. Tran et al. suggest the usage of a dimensionless isotherm constant in order to preserve the consistency of the physical meaning. Their perspective has merit and should be applied in future analysis. However, in this manuscript, we have used the widely accepted equilibrium constant KD for calculating the thermodynamic data. This approach enables a comparison of the results obtained for our sample with the literature data. The obtained enthalpy value of 19.7 kJ mol−1 can be compared with the literature data obtained for CIP adsorption [48], indicating the endothermic nature of the process.

3.2.6. Results of Desorption Study

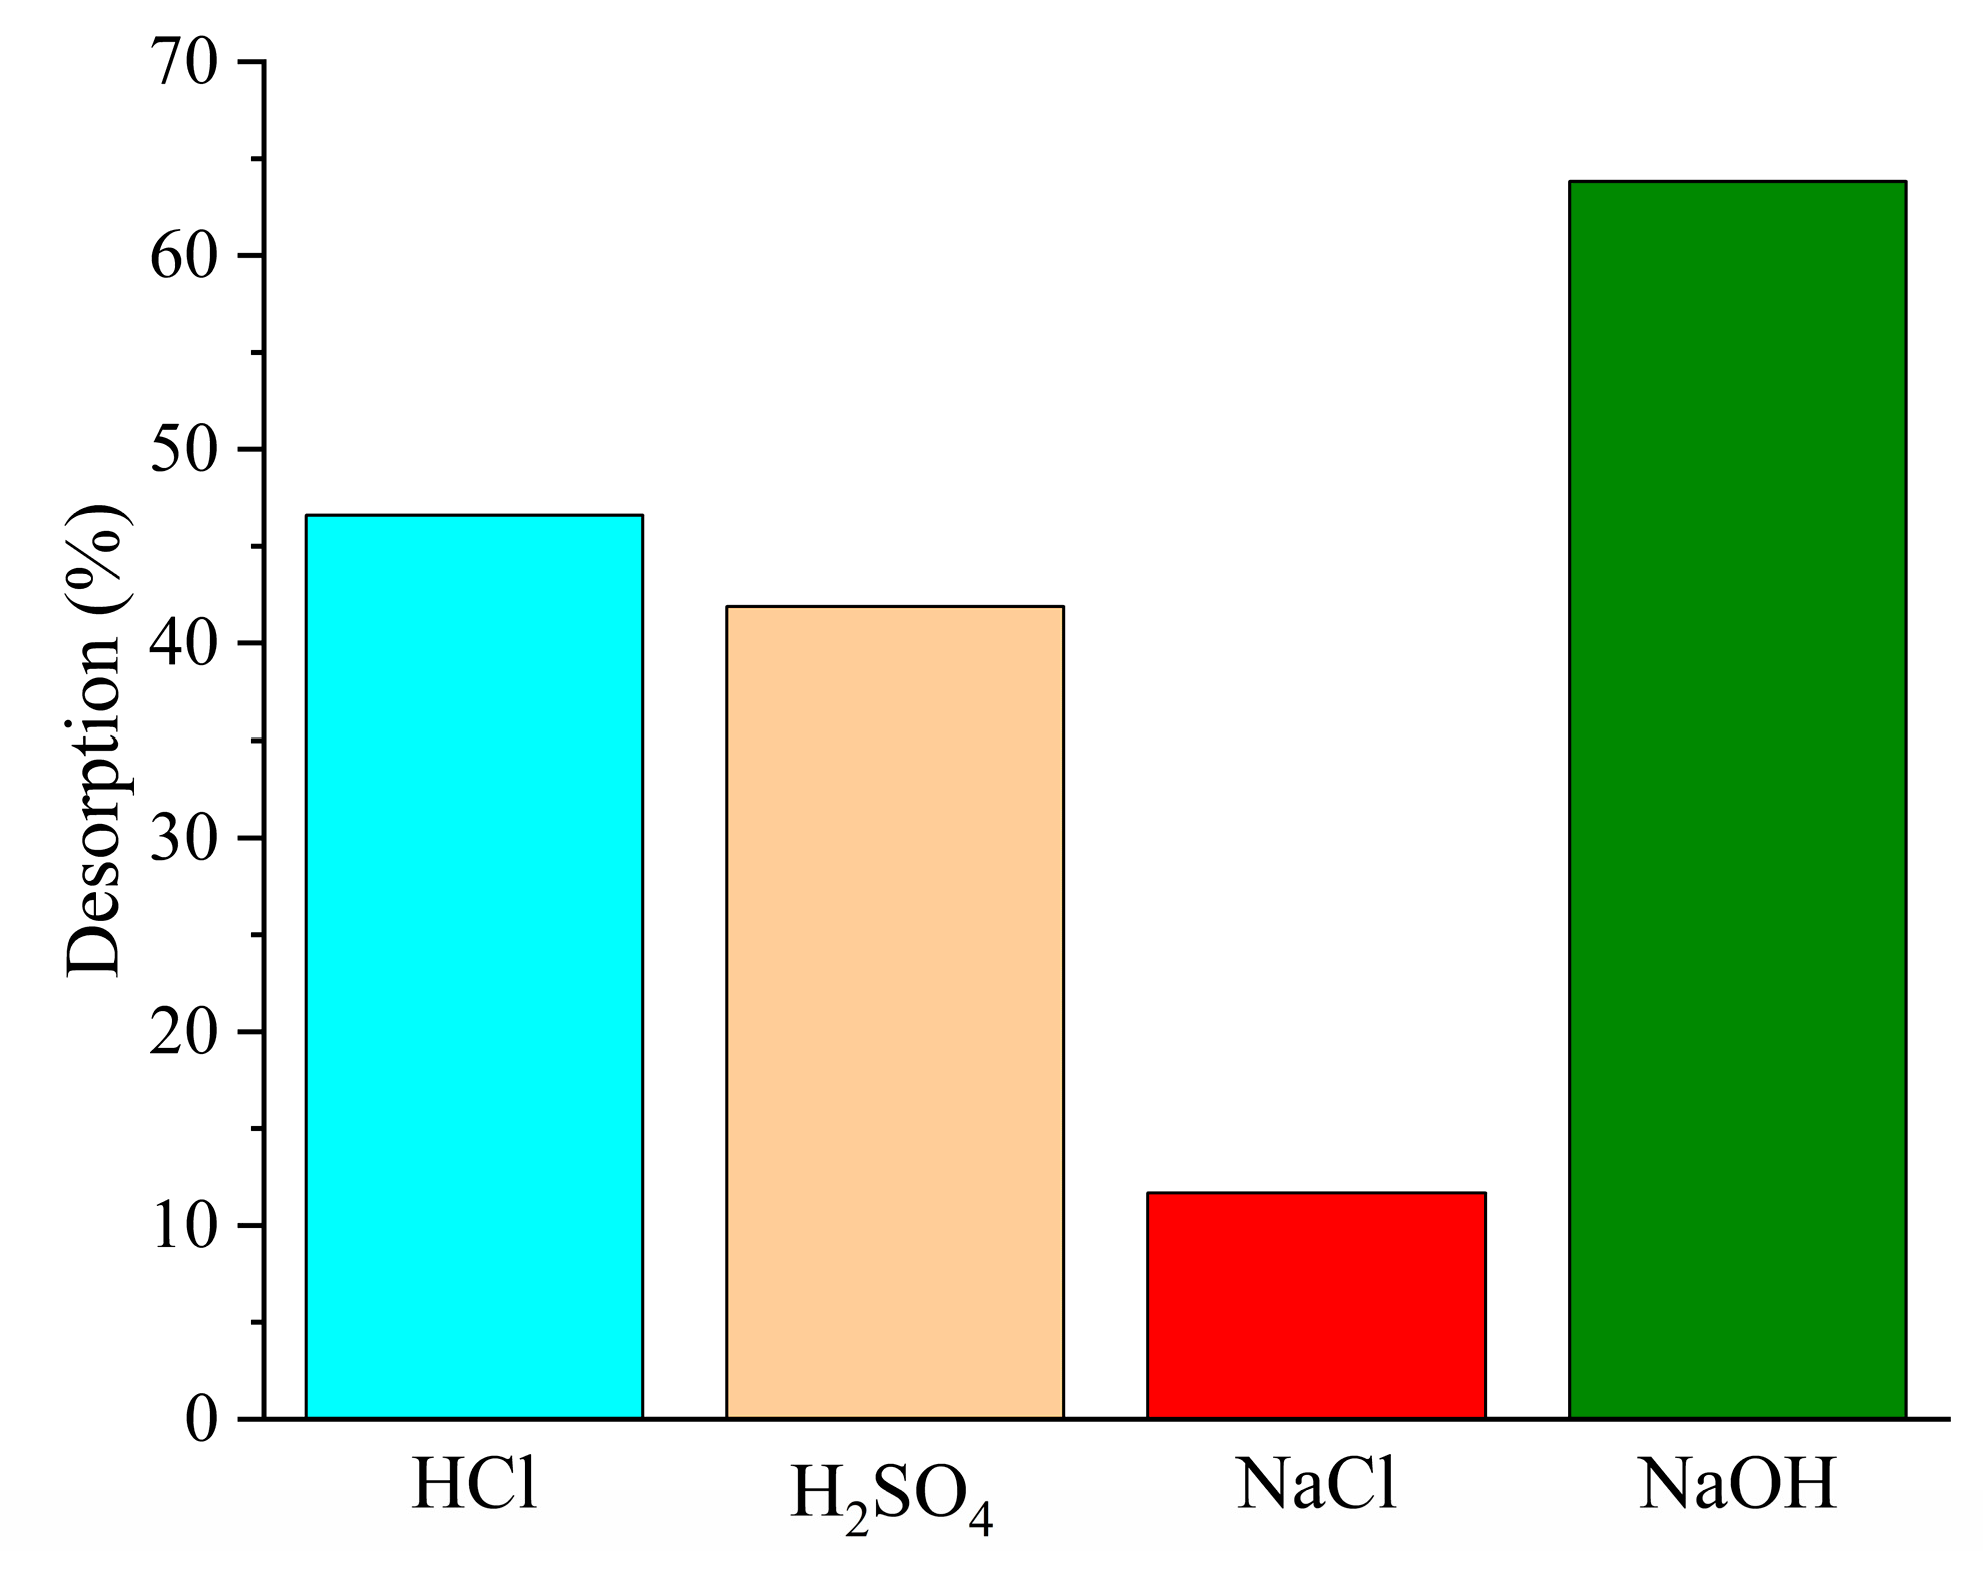
In order to examine the potential of regeneration of the H_Co/C-S loaded by CIP, desorption experiments were conducted, and the dependence of the desorption efficiency on the type of used eluent is shown in Figure 12.
According to the results of the desorption study, NaOH had better desorption performance (64%) compared with HCl (46.61%) and H2SO4 (41.89%) after 3 h. In the presence of NaOH, the surface charge of the adsorbent becomes negative, and CIP is present in its anionic form. Therefore, the presence of the NaOH led to the inhibited electrostatic interaction between H_Co/C-S and CIP, contributing to the highest amount of the desorbed CIP among the investigated eluents. Also, the OH in NaOH has a decomplexation effect on CIP, and hence CIP was successfully desorbed from the H_Co/C-S [81]. On the other hand, desorption of CIP with NaCl was only 11.67%. This result might suggest that CIP adsorption by ion exchange occurred to a very small extent.

3.2.7. FTIR Analysis of H_Co/C-S after Adsorption of CIP

To further examine the interaction of CIP with H_Co/C-S, the FTIR analysis of H_Co/C-S after adsorption was carried out, and the corresponding spectrum is presented in Figure 3. In the FTIR spectrum of H_Co/C-S after adsorption of CIP, differences are observed compared with the FTIR spectrum of H_Co/C-S, since new absorption bands originating from CIP are visible. In the wavelength area from 3648 cm−1 to 3423 cm−1, bands originating from the vibrations of various -OH groups present on both the adsorbent and adsorbate. Ciprofloxacin has a band at 3490 cm−1 originating from the O–H stretch vibration within the carboxylic group. New bands were identified at 2927 cm−1 and at 2850 cm−1 that originated from aliphatic C–H vibrations of the –CH2– group and N–C vibrations, respectively. The later band was shifted from the 2840 cm−1 characteristic of pure CIP (Al-Omar et al., 2005) to 2850 cm−1, which could be assigned to the interaction of the CIP with the H_Co/C-S. The intensity of the band at 1032 cm−1 ascribed to the stretching C–O–C vibrations in the organic phase decreased due to CIP adsorption. The band at 1696 cm−1 originating from the C=O vibration of the carboxylic group is present but at low intensity. The bands at 1480 cm−1 and 1435 cm−1 originating from C–N stretching vibrations [82] are also visible in the spectrum. A new strong band at 569 cm−1 was assigned to strong C–H bending vibrations [75], and this band partially covered the band at 525 cm−1 originally present in the FTIR spectra of Na-S and H_Co/C-S before adsorption.
Although the results of the pH study, FTIR analysis after the adsorption process, and the desorption study cannot provide a complete insight into the mechanism of CIP adsorption, it can be assumed that possible interactions between CIP and adsorbents can be those proposed in Figure 13.

4. Conclusions

In this study, a chitosan-derived carbon–smectite nanocomposite with cobalt (H_Co/C-S) was synthesized in a low-energy-consumption hydrothermal process. In this manner, the problem of separating the starting smectite clay due to swelling and the formation of a stabile colloid suspension was overcome. The XRPD analysis revealed that hydrothermal treatment led to the formation of a carbon monolayer within the smectite structure. The hydrothermal treatment resulted in reduced textural properties of the nanocomposite compared with smectite. However, the investigated nanocomposite showed a high adsorption efficiency toward ciprofloxacin (CIP), which is probably due to the presence of specific surface-active groups. The adsorption result showed that the removal efficiency of CIP by H_Co/C-S increased with the initial CIP concentration and temperature. The kinetic study revealed that the pseudo-second-order model was able to describe the adsorption kinetics of the investigated adsorption process. Moreover, the Redlich–Peterson adsorption isotherm best described the CIP adsorption process onto H_Co/C-S, indicating that the adsorption process was predominantly heterogeneous, with a maximum adsorption capacity of 72.3 mg g−1, according to the Langmuir model. The thermodynamic study revealed that the CIP adsorption onto H_Co/C-S was spontaneous and endothermic, with an enthalpy value of 19.7 kJ mol−1, indicating a physisorption mechanism. H_Co/C-S was found to be effective for CIP removal from aqueous solution. Based on these facts, further research can be focused on the adsorption from real wastewater.

Supplementary Materials

The following supporting information can be downloaded at: https://www.mdpi.com/article/10.3390/w15142608/s1, Figure S1: The pore-size distribution of (a) Na-S, and (b) H_Co/C-S.

Author Contributions

Conceptualization, investigation, analysis, methodology, writing original draft, and supervision—M.A.; Experimentation and characterization—G.S.; Writing original draft, analysis, and methodology—S.M.; Writing manuscript draft and analysis—Z.M.; Methodology, Resources—P.B.; FTIR Characterization—K.R.; Conceptualization, characterization, analysis, methodology, writing original draft, supervision, and editing—N.J.-J. All authors have read and agreed to the published version of the manuscript.

Funding

This work was financially supported by the Ministry of Science, Technological Development and Innovation of the Republic of Serbia (Grant No. 451-03-47/2023-01/200026).

Data Availability Statement

Data is available upon request.

Conflicts of Interest

The authors declare no conflict of interest.

References

  1. Akhil, D.; Lakshmi, D.; Senthil Kumar, P. Occurrence and removal of antibiotics from industrial wastewater. Environ. Chem. Lett. 2021, 19, 1477–1507. [Google Scholar] [CrossRef]
  2. Martinez, J.L. Environmental pollution by antibiotics and by antibiotic resistance determinants. Environ. Poll. 2009, 157, 2893–2902. [Google Scholar] [CrossRef] [PubMed]
  3. Sagaseta de Ilurdoz, M.; Jaime Sadhwani, J.; Vaswani Reboso, J. Antibiotic removal processes from water & wastewater for the protection of the aquatic environment—A review. J. Water Process Eng. 2022, 45, 102474. [Google Scholar]
  4. Kümmerer, K. Antibiotics in the aquatic environment—A review—Part I. Chemosphere 2009, 75, 417–434. [Google Scholar] [CrossRef] [PubMed]
  5. Borghi, A.A.; Alves Palma, M.S. Tetracycline: Production, waste treatment and environmental impact assessment. Braz. J. Pharm. Sci. 2014, 50, 25–40. [Google Scholar] [CrossRef] [Green Version]
  6. Huang, A.; Yan, M.; Lin, J.; Xu, L.; Gong, H.; Gong, H. A Review of Processes for Removing Antibiotics from Breeding Wastewater. Int. J. Environ. Res. Public Health 2021, 18, 4909. [Google Scholar] [CrossRef]
  7. Zhang, X.X.; Zhang, T.; Fang, H.H. Antibiotic resistance genes in water environment. Appl. Microbiol. Biotechnol. 2009, 82, 397–414. [Google Scholar] [CrossRef]
  8. Qalyoubi, L.; Al-Othman, A.; Al-Asheh, S. Removal of ciprofloxacin antibiotic pollutants from wastewater using nano-composite adsorptive membranes. Environ. Res. 2022, 215, 114182. [Google Scholar] [CrossRef]
  9. Al-Buriahia, A.K.; Al-Shaibania, M.M.; Radin Mohamed, R.M.S.; Al-Gheethi, A.A.; Sharmab, A.; Norli, I. Ciprofloxacin removal from non-clinical environment: A critical review of current methods and future trend prospects. J. Water Process Eng. 2022, 47, 102725. [Google Scholar] [CrossRef]
  10. Hacıosmanoglu, G.G.; Mejías, C.; Martín, J.; Santos, J.L.; Aparicio, I.; Alonso, E. Antibiotic adsorption by natural and modified clay minerals as designer adsorbents for wastewater treatment: A comprehensive review. J. Environ. Manag. 2022, 317, 115397. [Google Scholar] [CrossRef]
  11. Peng, B.; Chen, L.; Que, C.; Yang, K.; Deng, F.; Deng, X.; Shi, G.; Xu, G.; Wu, M. Adsorption of Antibiotics on Graphene and Biochar in Aqueous Solutions Induced by π-π Interactions. Sci. Rep. 2016, 6, 31920. [Google Scholar] [CrossRef] [PubMed] [Green Version]
  12. Chen, Z.; Ma, W.; Lu, G.; Meng, F.; Duan, S.; Zhang, Z.; Wei, L.; Pan, Y. Adsorption of levofloxacin onto mechanochemistry treated zeolite: Modeling and site energy distribution analysis. Sep. Purif. Technol. 2019, 222, 30–34. [Google Scholar] [CrossRef]
  13. Premarathna, K.; Rajapaksha, A.U.; Adassoriya, N.; Sarkar, B.; Sirimuthu, N.M.; Cooray, A.; Ok, Y.S.; Vithanage, M. Clay-biochar composites for sorptive removal of tetracycline antibiotic in aqueous media. J. Environ. Manag. 2019, 238, 315–322. [Google Scholar] [CrossRef]
  14. Wang, B.; Lv, X.L.; Feng, D.; Xie, L.H.; Zhang, J.; Li, M.; Xie, Y.; Li, J.R.; Zhou, H.C. Highly stable Zr(IV)-Based metal-organic frameworks for the detection and removal of antibiotics and organic explosives in water. J. Am. Chem. Soc. 2016, 138, 6204–6216. [Google Scholar] [CrossRef]
  15. Antonelli, R.; Malpass, G.R.P.; da Silva, M.G.C.; Vieira, M.G.A. Adsorption of ciprofloxacin onto thermally modified bentonite clay: Experimental design, characterization, and adsorbent regeneration. J. Environ. Chem. Eng. 2020, 8, 10455. [Google Scholar] [CrossRef]
  16. Ahrouch, M.; Gatica, J.M.; Draoui, K.; Vidal, H. Adding value to natural clays as low-cost adsorbents of methylene blue in polluted water through honeycomb monoliths manufacture. SN Appl. Sci. 2019, 1, 1595. [Google Scholar] [CrossRef] [Green Version]
  17. Chang, P.H.; Li, Z.; Jean, J.S.; Jiang, W.T.; Wang, C.J.; Lin, K.H. Adsorption of tetracycline on 2:1 layered non-swelling clay mineral illite. App. Clay Sci. 2012, 67–68, 158–163. [Google Scholar] [CrossRef]
  18. Zhou, J.; Sun, Q. Sodium Alginate/Modified Bentonite Composite Bead Adsorptive Removal of Norfloxacin: Static and Dynamic Adsorption. Polymers 2022, 14, 3984. [Google Scholar] [CrossRef]
  19. Zou, C.; Liang, J.; Jiang, W.; Guan, Y.; Zhang, Y. Adsorption behavior of magnetic bentonite for removing Hg(II) from aqueous solutions. RSC Adv. 2018, 8, 27587–27595. [Google Scholar] [CrossRef]
  20. Rytwo, G.G.; Kohavi, Y.; Botnick, I.; Gonen, Y. Use of CV- and TPP-montmorillonite for the removal of priority pollutants from water. Appl. Clay Sci. 2007, 36, 182–190. [Google Scholar] [CrossRef]
  21. Ruiz-Hitzky, E.; Aranda, P.; Darder, M.; Rytwob, G. Hybrid materials based on clays for environmental and biomedical applications. J. Mater. Chem. 2010, 20, 9306–9321. [Google Scholar] [CrossRef]
  22. Beall, G.W. The use of organo-clays in water treatment. Appl. Clay Sci. 2003, 24, 11–20. [Google Scholar] [CrossRef]
  23. Chang, M.Y.; Juang, R.S. Adsorption of tannic acid, humic acid, and dyes from water using the composite of chitosan and activated clay. J. Colloid Interface Sci. 2004, 278, 18–25. [Google Scholar] [CrossRef]
  24. Shen, Y.H. Phenol sorption by organoclays having different charge characteristics. Coll. Surf. A 2004, 232, 143–149. [Google Scholar] [CrossRef]
  25. Tanhaei, B.; Ayati, A.; Iakovleva, E.; Sillanpää, M. Efficient carbon interlayed magnetic chitosan adsorbent for anionic dye removal: Synthesis, characterization and adsorption study. Int. J. Biol. Macromol. 2020, 164, 3621–3631. [Google Scholar] [CrossRef] [PubMed]
  26. Kyzas, G.Z.; Bikiaris, D.N.; Mitropoulos, A.C. Chitosan adsorbents for dye removal: A review. Polym. Int. 2017, 66, 1800–1811. [Google Scholar] [CrossRef]
  27. Rinaudo, M. Chitin and chitosan: Properties and applications. Prog. Polym. Sci. 2006, 31, 603–632. [Google Scholar] [CrossRef]
  28. Francis, A.O.; Zaini, M.A.A.; Muhammad, I.M.; Abdulsalam, S.; El-Nafaty, U.A. Physicochemical modification of chitosan adsorbent: A perspective. Biomass Conv. Bioref. 2023, 13, 5557–5575. [Google Scholar] [CrossRef]
  29. da Silva Alves, D.C.; Healy, B.; Pinto, L.A.d.A.; Cadaval, T.R.S., Jr.; Breslin, C.B. Recent Developments in Chitosan-Based Adsorbents for the Removal of Pollutants from Aqueous Environments. Molecules 2021, 26, 594. [Google Scholar] [CrossRef]
  30. Chen, W.; Zhang, X.; Mamadiev, M.; Zhao, C.; Wang, Z.; Xu, H. Synthesis of interstratified graphene/montmorillonite composite material through organics-pillared, delamination and co-stacking and its application in hexavalent chromium removal from aqueous solution. Adv. Pow. Technol. 2017, 28, 521–533. [Google Scholar] [CrossRef]
  31. Hani Ababneh, H.; Hameed, B.H. Chitosan-derived hydrothermally carbonized materials and its applications: A review of recent literature. Int. J. Biol. Macromol. 2021, 186, 314–327. [Google Scholar] [CrossRef] [PubMed]
  32. Muñoz-Senmache, J.C.; Fernández-Reyes, B.; Hernández-Maldonado, A.J. Progress in the design of nanoporous adsorbent materials containing transition metals for the removal of contaminants of emerging concern. Env. Pollut. Bioavail. 2021, 33, 41–54. [Google Scholar] [CrossRef]
  33. King, C.J. Separation Processes Based on Reversible Chemical Complexation; Wiley: New York, NY, USA, 1987. [Google Scholar]
  34. Stevanović, G.; Jović-Jovičić, N.; Krstić, J.; Milutinović-Nikolić, A.; Banković, P.; Popović, A.; Ajduković, M. Nanocomposite Co-catalysts, based on smectite and biowaste-derived carbon, as peroxymonosulfate activators in degradation of tartrazine. Appl. Clay Sci. 2022, 230, 106718. [Google Scholar] [CrossRef]
  35. Prochaska, C.; Gallios, G. Nano-Adsorbents for Cobalt Removal from Wastewater: A Bibliometric Analysis of Research Articles Indexed in the Scopus Database. Processes 2021, 9, 1177. [Google Scholar] [CrossRef]
  36. Jović-Jovičić, N.; Milutinović-Nikolić, A.; Banković, P.; Mojović, Z.; Žunić, M.; Gržetić, I.; Jovanović, D. Organo-inorganic bentonite for simultaneous adsorption of Acid Orange 10 and lead ions. Appl. Clay Sci. 2010, 47, 452–456. [Google Scholar] [CrossRef]
  37. Rouquerol, J.; Rouquerol, F.; Ganteaume, M. Thermal decomposition of gibbsite under low pressures: I. Formation of the boehmitic phase. J. Catal. 1975, 36, 99–110. [Google Scholar] [CrossRef]
  38. Barrett, E.P.; Joyner, L.G.; Halenda, P.P. The Determination of Pore Volume and Area Distributions in Porous Substances. I. Computations from Nitrogen Isotherms. Am. Chem. Soc. 1951, 73, 373–380. [Google Scholar] [CrossRef]
  39. Lippens, B.C.; de Boer, J.H. Studies on pore systems in catalysts: V. The t method. J. Catal. 1965, 4, 319–323. [Google Scholar] [CrossRef]
  40. Marinović, S.; Milutinović-Nikolić, A.; Žunić, M.; Vuković, Z.; Maksin, D.; Nastasović, A.; Jovanović, D. Porous glycidyl methacrylate-bentonite composite. Russ. J. Phys. Chem. A 2011, 85, 2386–2391. [Google Scholar]
  41. Lagergren, S. About the theory of so-called adsorption of soluble substances. K. Sven. Vetenskapsakad. Handl. 1898, 24, 1–39. [Google Scholar]
  42. Blanchard, G.; Maunaye, M.; Martin, G. Removal of heavy metals from waters by means of natural zeolites. Water Res. 1984, 18, 1501–1507. [Google Scholar] [CrossRef]
  43. Wang, J.; Guo, X. Adsorption kinetic models: Physical meanings, applications, and solving methods. J. Hazard. Mater. 2020, 390, 122156. [Google Scholar] [CrossRef] [PubMed]
  44. Freundlich, H.; Heller, W. The Adsorption of Cis- and Trans-Azobenzene. J. Am. Chem. Soc. 1939, 61, 2228–2230. [Google Scholar] [CrossRef]
  45. Langmuir, I. The Adsorption of Gases on Plane Surfaces of Glass, Mica and Platinum. J. Am. Chem. Soc. 1918, 40, 1361–1403. [Google Scholar] [CrossRef] [Green Version]
  46. Sips, R. On the Structure of a Catalyst Surface. J. Chem. Phys. 1948, 16, 490–495. [Google Scholar] [CrossRef]
  47. Redlich, O.; Peterson, D.L. A Useful Adsorption Isotherm. J. Phys. Chem. 1959, 63, 1024. [Google Scholar] [CrossRef]
  48. Huang, R.; Zhu, Q.; Wang, W.; Hu, Y. Adsorptive removal of ciprofloxacin by a chitosan modified Fe pretreatment biochar composite from aqueous solution. New J. Chem. 2023, 47, 7910–7921. [Google Scholar] [CrossRef]
  49. Khankhasaeva, S.T.; Badmaeva, S.V.; Ukhinova, M.V. Adsorption of diclofenac onto Fe2O3-pillared montmorillonite: Equilibrium, kinetics and thermodynamic studies. J. Molec. Liq. 2023, 380, 121725. [Google Scholar] [CrossRef]
  50. JCPDS. International Center for Diffraction Data; Joint Committee on Powder Diffraction Standards (JCPDS): Swarthmore, PA, USA, 1990; p. 1990. [Google Scholar]
  51. Subotić, B.; Tonejc, A.M.; Bagović, D.; Čižmek, A.; Antonić, T. Zeolites and Related Microporous Materials: State of the Art; Weitkamp, J., Karge, H.G., Pfeifer, H., Eds.; Elsevier Science: Amsterdam, The Netherland, 1994; Volume 3. [Google Scholar]
  52. Hartati, H.; Purwaningsih, A.; Tjahjandarie, T.S.; Saputri, N.H.; Puspitasari, I.S.; Lamanele, C.N.; Saadah, A.A.; Haque, A.S.; Mardho, D.Z. Synthesis of amorphous aluminosilicate from impure Indonesian kaolin. Open Chem. 2020, 18, 295–302. [Google Scholar] [CrossRef]
  53. Christidis, G.E.; Scott, P.W.; Dunham, A.C. Acid activation and bleaching capacity of bentonites from the islands of Milos and Chios, Aegean, Greece. Appl. Clay Sci. 1997, 12, 329–347. [Google Scholar] [CrossRef]
  54. Jović-Jovičić, N.; Bajuk Bogdanović, D.; Novaković, T.; Banković, P.; Milutinović-Nikolić, A.; Mojović, Z. Electrochemical properties of carbonized bentonite. J. Serb. Chem. Soc. 2023, 88, 41–54. [Google Scholar] [CrossRef]
  55. Ruiz-García, C.; Perez-Carvajal, J.; Berenguer-Murci, A.; Darder, M.; Aranda, P.; Cazorla-Amoros, D.; Ruiz-Hitzky, E. Clay-supported graphene materials: Application to hydrogen storage. Phys. Chem. Chem. Phys. 2013, 15, 18635. [Google Scholar] [CrossRef] [Green Version]
  56. Sing, K.S.W.; Everett, D.H.; Haul, R.A.W.; Moscou, L.; Pieroti, R.A.; Rouquerol, J.; Siemieniewska, T. Reporting physisorption data for gas/solid systems with special reference to the determination of surface area and porosity. Pure Appl. Chem. 1985, 57, 603–619. [Google Scholar] [CrossRef]
  57. Rouquerol, F.; Rouquerol, J.; Sing, K. Adsorption by Powders and Porous Slides; Academic Press: San Diego, CA, USA, 1999. [Google Scholar]
  58. Leofanti, G.; Padovan, M.; Tozzola, G.; Venturelli, B. Surface area and pore texture of catalysts. Catal. Today 1998, 41, 207–219. [Google Scholar] [CrossRef]
  59. Vuković, Z.; Milutinović-Nikolić, A.; Krstić, J.; Abu-Rabi, S.; Novaković, T.; Jovanović, D. The Influence of Acid Treatment on the Nanostructure and Textural Properties of Bentonite Clays. Mater. Sci. Forum 2005, 494, 339–344. [Google Scholar] [CrossRef]
  60. Jović-Jovičić, N.; Milutinović-Nikolić, A.; Žunić, M.; Mojović, Z.; Banković, P.; Gržetić, I.; Jovanović, D. Synergic adsorption of Pb2+ and reactive dye—RB5 on two series of organomodified bentonites. J. Contam. Hydrol. 2013, 150, 1–11. [Google Scholar] [CrossRef]
  61. Ashiq, A.; Sarkar, B.; Adassooriya, N.; Walpita, J.; Rajapaksha, A.U.; Ok, Y.S.; Vithanage, M. Sorption process of municipal solid waste biochar-montmorillonite composite for ciprofloxacin removal in aqueous media. Chemosphere 2019, 236, 124384. [Google Scholar] [CrossRef]
  62. Madejová, J.; Komadel, P. Baseline Studies of the Clay Minerals Society Source Clays. Clays Clay Miner. 2001, 49, 410–432. [Google Scholar] [CrossRef]
  63. Madejová, J.; Pentrák, M.; Pálková, H.; Komadel, P. Near-infrared spectroscopy: A powerful tool in studies of acid-treated clay minerals. Vib. Spectrosc. 2009, 49, 211–218. [Google Scholar] [CrossRef]
  64. Vasilev, A.; Efimov, M.; Bondarenko, G.; Kozlov, V.; Dzidziguri, E.; Karpacheva, G. Thermal behavior of chitosan as a carbon material precursor under IR radiation. IOP Conf. Ser. Mater. Sci. Eng. 2019, 693, 012002. [Google Scholar] [CrossRef]
  65. Wang, G.; Xu, J.; Sun, Z.; Zheng, S. Surface Functionalization of Montmorillonite with Chitosan and the Role of Surface Properties on Its Adsorptive Performance: A Comparative Study on Mycotoxins Adsorption. Langmuir 2020, 36, 2601–2611. [Google Scholar] [CrossRef] [PubMed]
  66. Tang, C.W.; Wang, C.B.; Chien, S.H. Characterization of cobalt oxides studied by FT-IR, Raman, TPR and TG-MS. Thermochim. Acta 2008, 473, 68–73. [Google Scholar] [CrossRef]
  67. Fick, J.; Söderström, H.; Lindberg, R.H.; Phan, C.; Tysklind, M.; Larsson, D.G. Contamination of surface, ground, and drinking water from pharmaceutical production. Environ. Toxicol. Chem. 2009, 28, 2522–2527. [Google Scholar] [CrossRef]
  68. Bhagat, C.; Kumar, M.; Tyagi, V.K. Proclivities for prevalence and treatment of antibiotics in the ambient water: A review. Npj Clean Water 2020, 3, 42. [Google Scholar] [CrossRef]
  69. Pei, Z.G.; Shan, X.Q.; Kong, J.; Wen, B.; Owens, G. Coadsorption of ciprofloxacin and Cu (II) on montmorillonite and kaolinite as affected by solution pH. Environ. Sci. Technol. 2010, 44, 915–920. [Google Scholar] [CrossRef]
  70. Gulen, B.; Demircivi, P. Adsorption Properties of Flouroquinolone Type Antibiotic Ciprofloxacin into 2:1 Dioctahedral Clay Structure: Box-Behnken Experimental Design. J. Mol. Struct. 2020, 1206, 127659. [Google Scholar] [CrossRef]
  71. Wang, L.; Chen, G.; Ling, C.; Zhang, J.; Szerlag, K. Adsorption of Ciprofloxacin on to Bamboo Charcoal: Effects of PH, Salinity, Cations, and Phosphate. Environ. Prog. Sustain. Energy 2017, 36, 1108–1115. [Google Scholar] [CrossRef]
  72. Tran, Q.T.; Do, T.H.; Ha, X.L.; Nguyen, H.P.; Nguyen, A.T.; Ngo, T.C.Q.; Chau, H.D. Study of the Ciprofloxacin Adsorption of Activated Carbon Prepared from Mangosteen Peel. Appl. Sci. 2022, 12, 8770. [Google Scholar] [CrossRef]
  73. Balarak, D.; Baniasadi, M.; Lee, S.; Joon, M. Ciprofloxacin adsorption onto Azolla filiculoides activated carbon from aqueous solutions. Desalin. Water Treat. 2021, 218, 444–453. [Google Scholar] [CrossRef]
  74. Wakejo, W.K.; Meshasha, B.T.; Kang, J.W.; Chebude, Y. Enhanced Ciprofloxacin Removal from Aqueous Solution Using a Chemically Modified Biochar Derived from Bamboo Sawdust: Adsorption Process Optimization with Response Surface Methodology. Ads. Sci. Technol. 2023, 2022, 2699530. [Google Scholar] [CrossRef]
  75. Magesh, N.; Renita, A.A.; Siva, R.; Harirajan, N.; Santhosh, A. Adsorption behavior of fluoroquinolone(ciprofloxacin) using zinc oxide impregnated activated carbon prepared from jack fruit peel: Kinetics and isotherm studies. Chemosphere 2020, 290, 133227. [Google Scholar] [CrossRef]
  76. Ambrósio, N.; Vieira, M.; Silva, M. Cu(II) Adsorption on Modified Bentonitic Clays: Different Isotherm Behaviors in Static and Dynamic Systems. Mater. Res. 2012, 15, 114–124. [Google Scholar]
  77. Bizi, M.; El Bachra, F.E. Evaluation of the ciprofloxacin adsorption capacity of common industrial minerals and application to tap water treatment. Powder Technol. 2020, 362, 323–333. [Google Scholar] [CrossRef]
  78. García-Alonso, J.; Sulbaran, B.; Bandala, E.; Real, J.; Sulbarán-Rangel, B. Adsorption and kinetic studies of the removal of ciprofloxacin from aqueous solutions by diatomaceous earth. Desalin. Water Treat. 2019, 162, 331–340. [Google Scholar] [CrossRef]
  79. Abramian, L.; El-Rassy, H. Adsorption Kinetics and Thermodynamics of Azo-Dye Orange II onto Highly Porous Titania Aerogel. Chem. Eng. J. 2009, 150, 403–410. [Google Scholar] [CrossRef]
  80. Tran, H.N.; Lima, E.C.; Juang, R.-S.; Bollinger, J.-C.; Chao, H.-P. Thermodynamic parameters of liquid–phase adsorption process calculated from different equilibrium constants related to adsorption isotherms: A comparison study. J. Environ. Chem. Eng. 2021, 9, 106674. [Google Scholar] [CrossRef]
  81. Wang, Z.; Muhammad, Y.; Tang, R.; Lu, C.; Yu, S.; Song, R.; Tong, Z.; Han, B.; Zhang, H. Dually organic modified bentonite with enhanced adsorption and desorption of tetracycline and ciprofloxacine. Sep. Purif. Technol. 2021, 274, 119059. [Google Scholar] [CrossRef]
  82. Al-Omar, M.A. Ciprofloxacin: Physical Profile. In Profiles of Drug Substances, Excipients and Related Methodology; Brittain, H.G., Ed.; Academic Press: Cambridge, MA, USA, 2005; Volume 31, pp. 163–178. [Google Scholar]
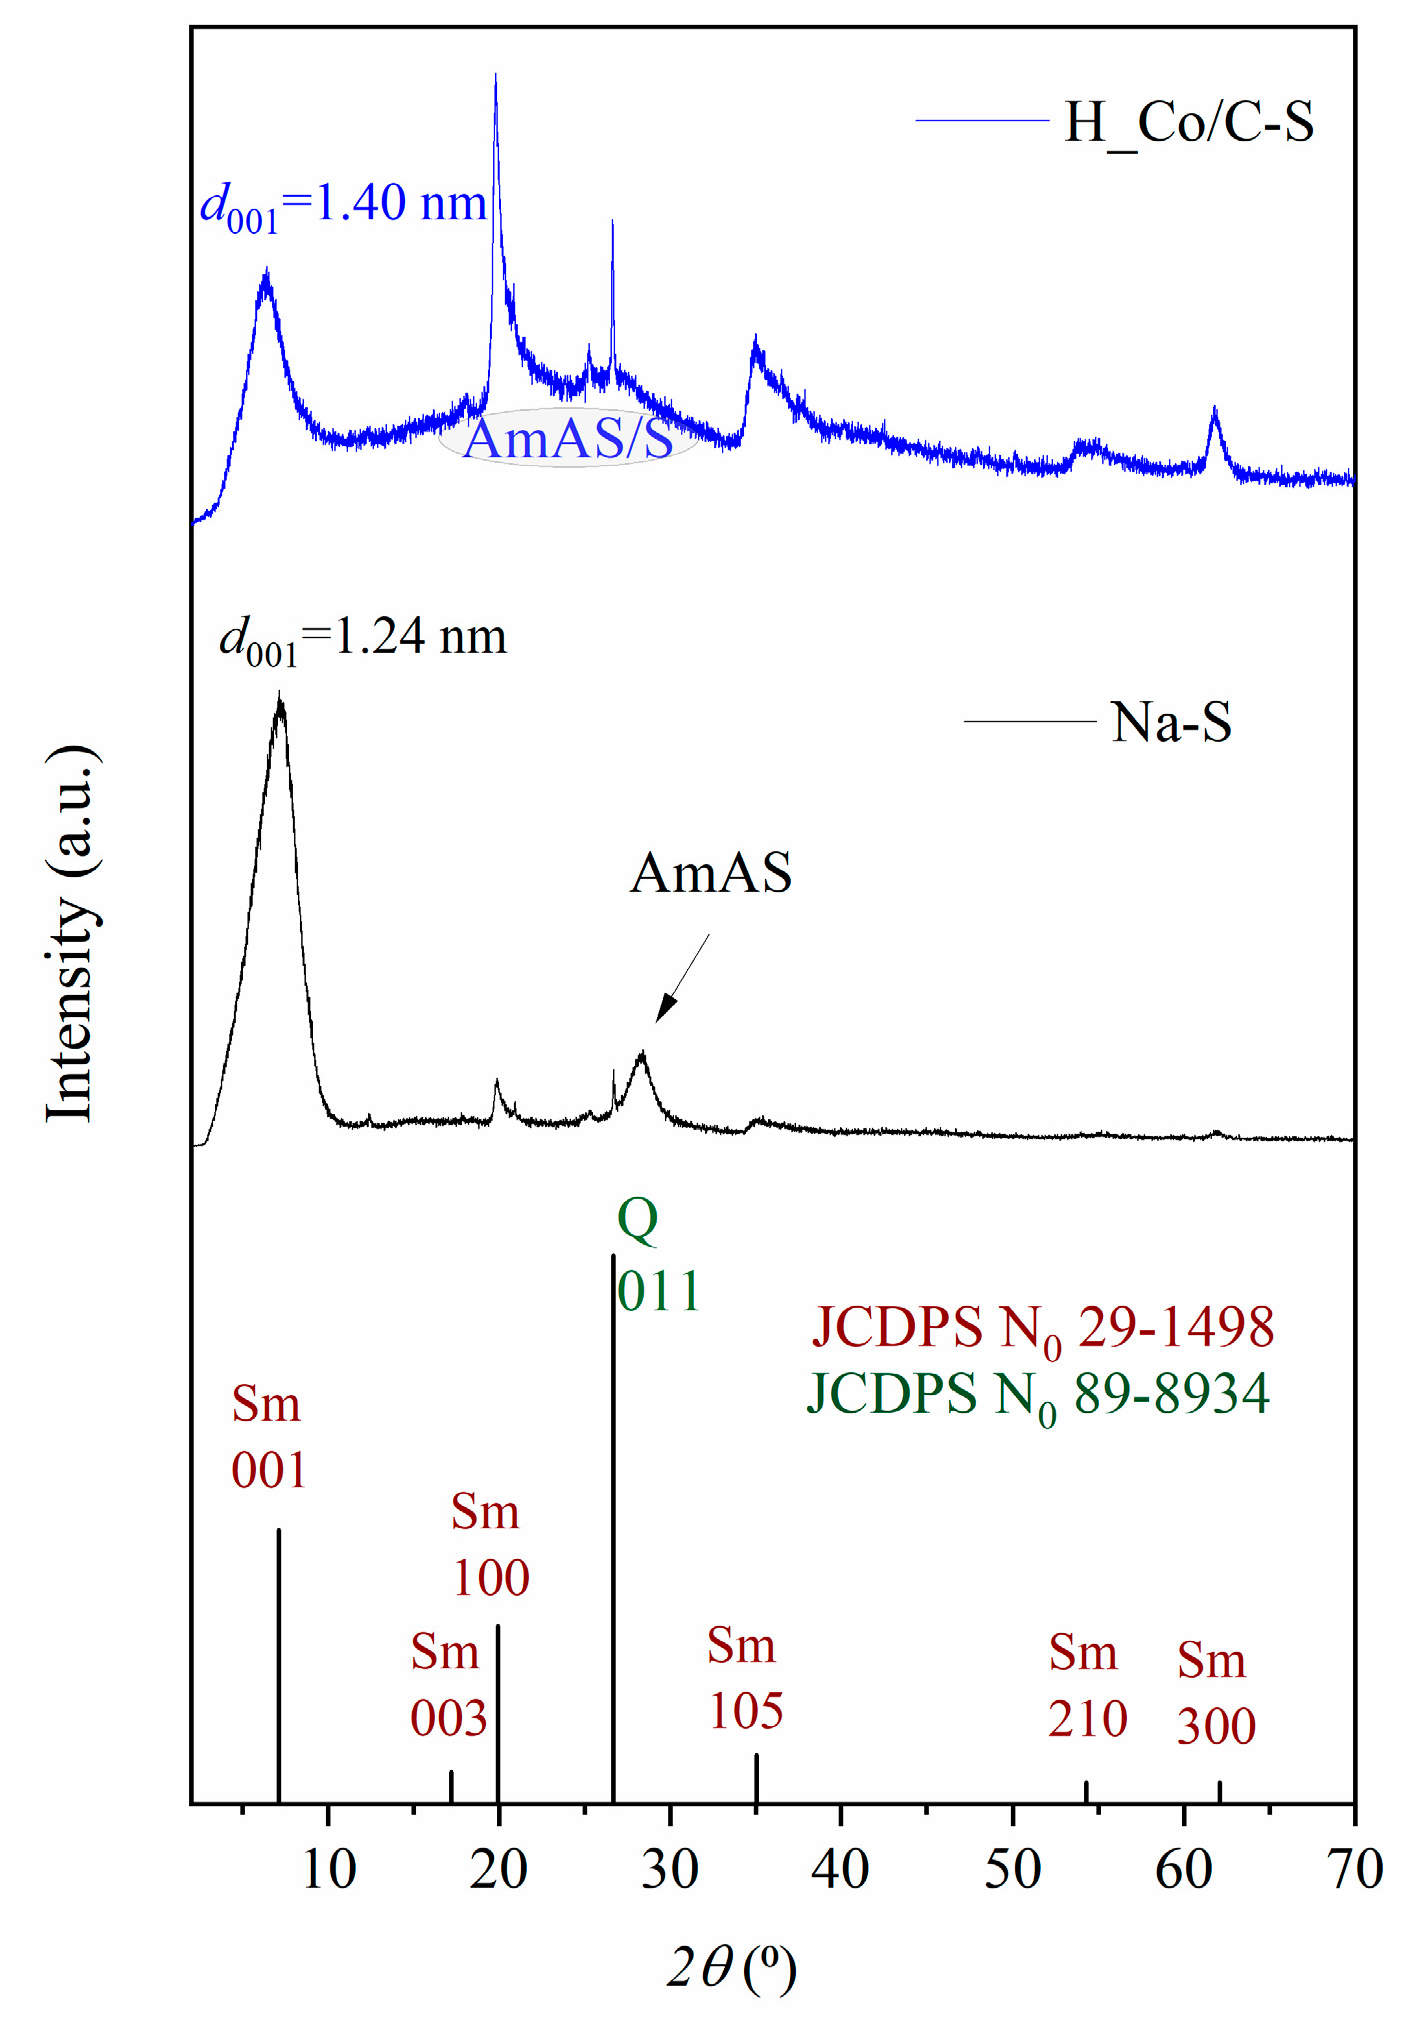
Figure 1. The XRPD spectra of Na-S and H_Co/C-S samples along with the appropriate reflections based on JCPDS data (Sm—smectite; Q—quartz; AmAS—amorphous phase of aluminosilicate; AmAS/S—amorphous phase of aluminosilicate and silicate).
Water 15 02608 g001
Figure 2. The adsorption–desorption isotherms of nitrogen at −196 °C of Na-S and H_Co/C-S.
Water 15 02608 g002
Figure 3. The FTIR spectra of Na-S, H_Co/C-S, and H_Co/C-S after CIP adsorption.
Water 15 02608 g003
Figure 4. The point of zero charge of the H_Co/C-S sample.
Water 15 02608 g004
Figure 5. The percent of removal of CIP by Na-S and H_Co/C-S (mads = 10 mg; V = 50 mL; C0(CIP) = 20 mg L−1; T = 25 °C; t = 1440 min).
Water 15 02608 g005
Figure 6. The effect of the initial pH of the CIP solution on adsorption onto H_Co/C-S (mads = 10 mg; V = 50 mL; C0(CIP) = 20 mg L−1; T = 25 °C; t = 180 min).
Water 15 02608 g006
Figure 7. The effect of initial CIP concentration on the amount of the adsorbed CIP (mads = 10 mg; V = 50 mL; T = 25 °C, pH 5.1).
Water 15 02608 g007
Figure 8. Non-linear plots of experimental data for CIP adsorption onto H_Co/C-S by (a) the pseudo-first-order kinetic model, and (b) the pseudo-second-order kinetic model.
Water 15 02608 g008
Figure 9. Adsorption isotherms for CIP adsorption onto H_Co/C-S (mads = 10 mg; CCIP = (5–80) mg g−1, V = 50 mL; t = 1440 min; T = 25 °C; pH 5.1).
Water 15 02608 g009
Figure 10. The effect of temperature on CIP adsorption onto H_Co/C-S (mads = 10 mg; V = 50 mL; C0(CIP) = 20 mg L−1; pH 5.1).
Water 15 02608 g010
Figure 11. Van’t Hoff linear plot of CIP adsorption onto H_Co/C-S.
Water 15 02608 g011
Figure 12. Desorption of CIP from H_Co/C-S using different eluents.
Water 15 02608 g012
Figure 13. Possible interactions in the adsorption process of CIP on the surface of the H_Co/C-S adsorbent.
Water 15 02608 g013
Table 1. Textural properties of Na-S and H_Co/C-S.
SampleSBET
(m2 g−1)
Vtot
(cm3 g−1)
Vmeso
(cm3 g−1)
Vmicro
(cm3 g−1)
DMED
(nm)
Dmax
(nm)
Na-S1190.1050.0740.0494.164.00
H_Co/C-S0.730.0120.019/13.813.0
SBET—specific surface area; Vtot—total pore volume; Vmeso—volume of mesopores; Vmicro—volume of micropores; DMED—median mesopore diameter; Dmax—the most abundant pore diameter.
Table 2. The calculated parameters for the pseudo-first-order and pseudo-second order kinetic models for CIP adsorption onto H_Co/C-S.
SampleH_Co/C-S
C0 (mg g−1)10204080
qeexp (mg g−1)50.861.671.876.6
Pseudo-first-order kinetic model
qecalc (mg g−1)45.857.465.671.4
k1·10−2 (min−1)3.211.001.350.910
R20.9370.9150.8730.906
Pseudo-second-order kinetic model
qecalc (mg g−1)49.462.871.578.2
k2·10−4 (g mg−1 min−1)8.922.432.881.75
R20.9840.9650.9410.954
C0—initial CIP concentration; qeexp—experimental values of amount of adsorbed CIP in equilibrium; qecalc—calculated value for the amount of adsorbed CIP in equilibrium; k1—pseudo-first-order rate constant; k2—pseudo-second-order rate constant; R2—coefficient of determination.
Table 3. Calculated isotherm parameters for CIP adsorption onto H_Co/C-S.
Adsorption ModelIsotherm Parameters
Freundlich equationKF (mg g−1(dm3 mg−1)1/n)nFR2
50.38.860.948
Langmuir equationKL (dm3 mg−1)qmax (mg g−1)RLR2
4.3872.30.0220.977
Sips equationK (dm3 mg−1)nqsat (mg g−1)bSR2
0.55274.20.3130.976
Redlich–Peterson equationKRP (dm3 g−1)aRP (L mg−1)nRPnRPR2
4316.780.9570.985
KF—Freundlich isotherm constant; nF—factor of heterogeneity of adsorption; KL—Langmuir isotherm constant; qmax—maximal value of adsorption capacity, RL—Langmuir parameter; KRP—Redlich–Peterson isotherm constants, aRP—Redlich–Peterson parameter; nRP—Redlich–Peterson exponent, R2—coefficient of determination.
Table 4. The literature review of CIP adsorption onto different adsorbents.
AdsorbentAdsorbent PropertiesAdsorption Capacity
(mg g−1)
References
Hydrothermally synthetized Co–carbon smectite (H_Co/C-S)SBET = 0.73 m2 g−1; Vmeso = 0.019 cm3 g−1, DMED = 13.9 nm
pHPZC 5.3
72.3This study
Activated carbon derived from mangosteen peelSBET = 419.9 m2 g−1
Vcap = 0.280 cm3 g−1, Dmean = 2.7 nm
pHPZC 5.34
29.8[72]
Calcined Verdelodo clay-packed fixed-bedSBET = 62.1 m2 g−1,
Vmeso = 0.019 cm3 g−1,
12.6[15,76]
Smectite claySBET = 87.7 m2 g−1
Vmeso = 0.09 cm3 g−1,
pHPZC 8.00
184[77]
Biochar derived from bamboo sawdustSBET = 1158 m2 g−1
pHPZC 6.5
78.4[74]
Activated carbon derived from Azolla filiculoidesSBET = 716.4 m2 g−1
Dmean = 41.3 nm
Vtot = 0.481 cm3 g−1
35.1[73]
Bamboo charcoalSBET = 1228 m2 g−1
pHPZC 6.5
36.0[71]
Surface-modified tamarind shellDmean ≤ 10 µm21.7 [75]
Diatomaceous earthSBET = 29.14 m2 g−1,
Dmean = 190 nm
19.4[78]
SBET—specific surface area (m2/g); Vtot, VmesoVcap—total pore volume, mesopore volume, and capillary volume, respectively (cm3/g); DMED—mean mesopore diameter (nm); Dmean—average pore diameter (nm), pHPZC—point of zero charge of adsorbent.
Table 5. Thermodynamic parameters for the CIP adsorption onto H_Co/C-S.
T (K)ΔG0 (kJ mol−1)ΔH0 (kJ mol−1)ΔS0 (J K−1 mol−1)
298−5.1619.783.5
308−5.99
318−6.83
328−7.66
Disclaimer/Publisher’s Note: The statements, opinions and data contained in all publications are solely those of the individual author(s) and contributor(s) and not of MDPI and/or the editor(s). MDPI and/or the editor(s) disclaim responsibility for any injury to people or property resulting from any ideas, methods, instructions or products referred to in the content.