Abstract
Currently, irrigation consumes approximately 84 per cent of the total available water in India and is predicted to remain the dominant water user. This study assessed the barriers to canal irrigation efficiency in Jharkhand State of India. Through an extensive review of the literature and expert consultation, the study classified the barriers into five primary categories: Resource System, Legal and Institutional, Financial Barriers, Capacity Building, and External Environment. This study applied an integrated approach using the Analytic Hierarchy Process (AHP), fuzzy Analytic Hierarchy Process, and decision-making trial and evaluation laboratory approach to assess the issues prevailing in canal irrigation efficiency. The experts were selected based on their expertise and knowledge, and they provided their preferences on the weighting of the models for applying the three methods. From the study, it can be inferred that more attention is needed to reduce Financial Barriers to improve the overall performance of irrigation projects. This necessitates adequate government funding and collection of water rates. The lack of government support/funding and low collection of water charges make WUAs financially unviable and unable to bear the Operation and Maintenance costs and incurs high maintenance costs, resulting in capital loss.
1. Introduction
Water is at the core of life on Earth. Sustainability and efficient management of this scarce resource has become a challenge in India. Population growth, increasing urbanisation, rapid industrialisation, and the need to increase agricultural production create competing demands for water. Irrigation currently consumes 84 per cent of the total available water in India and is projected to remain the dominant water user. Over the years, the share of canals in the net irrigated area declined from 40 per cent in 1950–1951 to approximately 22 per cent in 2020–2021, marking a significant change in the sources of irrigation [1]. The decrease in the share of canal irrigation is attributed to the unreliability and lower irrigation efficiency compared with groundwater irrigation. The unrestricted use of groundwater in tube wells has raised many sustainability issues. Problems in the canal irrigation sector in India include uncontrolled water delivery, water scarcity, low-cost recovery, low return on labour costs of irrigation projects through irrigation water charges, inadequate maintenance, deterioration of physical structures, seepage loss, siltation, waterlogging, soil salinity, and underutilisation of the created potential. This relates to the mismanagement of the established infrastructure and the inability to settle disputes between members and Water User Associations (WUAs). The general effect of these deficiencies in channel irrigation systems is poor irrigation efficiency.
Farmers’ participation in irrigation management is not new in India. However, under the restructured “Command Area Development & Water Management” (CADWM) Programme, more emphasis is given to the participatory approach with the implementation of the rules and regulations of the formal Water User Association (WUA). Another condition for accepting the completion of the CADWM is that the management and control of the irrigation system is handed over to the Water User Association (WUA). Approximately 1232 WUAs were formed in 2016–2017 in the States of Assam, Gujarat, J&K, Karnataka, Madhya Pradesh, Maharashtra, Odisha, and Punjab and 1370 WUAs in 2017–2018 in the States of, Rajasthan, Punjab, Odisha, Manipur, Maharashtra, Karnataka, Jharkhand, Gujarat, Chhattisgarh, Bihar, and Assam [2].
Numerous researchers in India have tried to assess various aspects of the effectiveness of WUAs. Based on such studies, it is challenging to draw broad conclusions regarding the effects of WUAs because of multiple variables, including their location and the degree of user interaction. Despite years of deployment and well-documented case studies, the overall proof of IMT/impact PIMs has received relatively little attention. According to [3] classification approaches, most cases (64%) are regarded as failures. Large-scale public irrigation systems require complex processes that are highly context-specific for cooperative action to be successful. The objective of this research is to prioritize the barriers to the issues related to the multidimensional problem of poor canal irrigation efficiency for better management of the created infrastructure. The current research attempts to find various barriers that Water User Associations face in the effective usage of canal irrigation and rank them. This would help policymakers and other stakeholders in identifying major issues related to canal efficiency. Various factors and sub-factors were identified, and Decision-Making Trial and Evaluation Laboratory (DEMATEL), the Analytical Hierarchy Process (AHP), and the Fuzzy Analytical Hierarchy Process (FAHP) were deployed based on feedback from experts. Section 2 discusses a literature review of canal irrigation and Water User Associations, followed by Section 3, which describes the methods and responses collected for the study. Section 4 details the analysis of the responses collected, followed by conclusions.
2. Literature Review
Much of the literature from 1990 emphasises the irrigation sector reforms by involving users and assigning responsibility. This is not for financial reasons but to harness the potential of agriculture through irrigation [4,5,6]. One of the reforms mentioned above is the emergence of Participatory Irrigation Management (PIM) where the end users are transformed from beneficiaries to partners in the water management and development of irrigation schemes. PIM’s basic philosophy and practices are detailed in [7,8]. Based on the studies, it was discovered that PIM was found to be effective towards irrigation management transfer. However, collaborative decision-making, transparency, and financial benefits were found to be some of the crucial elements in the process.
There have been some mixed outcomes of Participatory Irrigation Management (PIM) in various states in India. In the Indian state of Maharashtra, the PIM through Water User Associations (WUAs) improved water use efficiency, increased the irrigated area, and recovered after charges [9]. The irrigation-related conflicts were found to be resolved through PIM programs in the Gujarat state of India [10]. However, the state expenditure on irrigation was not mitigated due to the program’s implementation. Similarly, PIM did not progress much in Andhra Pradesh due to political interference [11]. Based on the comprehensive study of PIM in India by Mamata and Deepak [12], the WUA’s functional efficiency was unsatisfactory. From the study, the major issues were as follows: Caste, Class, the heterogeneity of farmers, commitment from local leaders, lack of bureaucratic support, lack of incentives, and inadequate capacity building. A methodology using the stakeholder’s approach is suggested for assessing IMT from a farmer’s perspective taking a case study in Maharashtra state of India as detailed in [13]. Results suggest that farmers prefer WUAs for better water supply, maintenance of canals, timely delivery, and better dispute resolution. In a similar study in [14], WUAs were found to come forward for better maintenance by joint efforts of farmers but collective representations and lobbying towards certain activities were not happening in the Karnataka and Rajasthan states of India. Greater autonomy and delegation of power to end users were found to be effective in IMT reforms based on a study in the Madhya Pradesh state of India as detailed in [15]. The need for greater autonomy for WUAs was necessitated, and minimal intervention of state government was brought forward in the study. In India, PIM implementation has brought mixed results based on the case studies discussed above. However, the studies in Assam and Bihar signify that PIM has brought the desired institutional framework and significant progress through WUAs [16].
The IMT and PIM models were experimented with in various parts of the world to achieve better irrigation goals. In Mexico, ideological and cultural insights played a crucial role in the success of IMT [17]. Cultural performance was found to be an integral part of improved management performance in water irrigation. In China, monetary incentives were a major factor for WUAs’ success in four Henan and Ningxia irrigation districts [18]. The irrigation performance was assessed based on the farmer’s perspective in Kyrgyzstan using the grounded theory approach in [19]. The results show that farmers believe that water delivery in a timely manner and irrigation infrastructure maintenance needs are important dimensions of water service for various WUAs. A similar study in Kazakhstan reveals that government support for IMT and WUAs has reduced over time, leaving local water management in jeopardy [20]. PIM and IMT remain to be the most prevailing policies by international funding agencies and governments [21]. The systematic review of the literature on impact assessments of IMT and PIM brings forth the need for better evaluations of PIM and IMT performance. The structural equation modelling method was used to understand the role of IMT Korean rural community corporation and local government in Korea [22]. The results from the study suggest that subsidies to farmers for their labour as incentives and the PIM concept was to be revived for successful IMT. Egypt successfully implemented PIM through water user organisations to resolve shortages in irrigated water and resolve water conflicts [23]. However, failures due to poor canal facilities and information disclosure were some obstacles encountered. A similar study in northwestern China for maise production using PIM through WUAs revealed that the impact was significantly low due to the lack of transparency [24]. Morocco also implemented PIM to deal with water scarcity where changes in irrigation practices were noted, despite collective action being absent in the process [25]. The empowerment of WUAs and allowing them to make their own decisions in canal water irrigation led to better-irrigated land in times of water scarcity as studied in Ethiopia [26].
The influence of training on WUAs’ performance was assessed in Southern Tajikistan for duties [27]. The results show that training has a positive impact during the early days of PIM adaptation, and the length of training was found to be an essential factor in institutional performance. In Pakistan, PIM’s institutional features are crucial in the performance assessment of respective areas’ water boards [28]. Adaptiveness, scale, objectives, and compliance were found to impact the performance of the area water boards. Despite PIM institutions being in the incipience stage, the designs of the institutions were crucial to their success. The moral obligation role in the PIM model and the impact of institutional constraints were explored in [29]. The results demonstrate the same positive impact of collective action; moreover, moral obligation was found to play a significant regulating role.
The Water User’s efficiency was explored for various groundwater users as discussed in [30]. DEA analysis was performed to rank various users, and the role of government was envisaged to check the equable distribution of groundwater among various users. The determinants of the contract choice model were also explored for groundwater markets in [31]. The results demonstrated the presence of price discrimination based on farm size.
Research Gap
Over the years, the performance of the Indian irrigation sector has been impending its sustainability [32,33]. The management of water for irrigation, the maintenance of irrigation infrastructure, the collection of water user charges, and the implementation of PIM/IMT towards better effectiveness are some of the major issues in the sector. However, there are research gaps in understanding the factors affecting the sustainable and effective role of WUAs towards better canal or surface irrigation [34]. From most of the studies in the literature, many issues regarding irrigation were analysed on a standalone basis and, thereby, a comprehensive study is needed, considering all the barriers and factors. Thereby, this study attempts to comprehensively identify all the barriers and factors and prioritise them based on rankings using various MCDM techniques.
3. Methods and Models
In this study, the methodology applied is the assessment of canal irrigation efficiency issues. The researchers investigated, identified, and finalised the canal irrigation issues through the following process: Conducting interviews and consulting a group of experts, stakeholders, and academicians, and conducting an extensive literature review. The assessment of identified issues was performed using pairwise comparison techniques. This study considered an integrated approach for the assessment by applying DEMATEL, AHP, and Fuzzy AHP methods.
An in-depth extensive exploration of the literature was conducted for the identification of the issues prevalent in canal irrigation efficiency. The literature was reviewed both from a global context and the Indian context for a better understanding of the Indian context, especially in Jharkhand state. To obtain feedback on barriers and issues, 19 experts were chosen from NGOs, the Water Resources Management Sector, Water User Associations, and the state government. Thereafter, based on a review of the literature and expert consultation, issues were segregated and categorised into five primary categories. The experts were also consulted to obtain their preferences on the weightage of the models for applying DEMATEL, AHP, and Fuzzy AHP. Experts were selected based on convenience sampling, depending on their expertise and knowledge. The experts were from all areas of WUAs, NGOs, and government department members, as detailed in Table 1. The experts were asked to rate the five elements deduced as the main issues in canal irrigation in terms of their influence and importance.

Table 1.
Details of experts consulted.
3.1. Identification of Barriers to Irrigation Efficiency in Jharkhand
To identify the barriers to canal irrigation efficiency, 19 experts, as detailed in Table 1, from the Command Area of Kanchi Irrigation Project of Jharkhand were asked to indicate various barriers and sub-barriers. Based on the responses, five key barriers to irrigation were identified, along with the sub-barriers. The details are given in Table 2.
Table 2.
List of barriers.
The assessment of the issues by ranking them in the order of influence or importance is performed using the DEMATEL, AHP, and FAHP methods. These methods were considered for the attainment of reliable results. The DEMATEL approach has been used to highlight the influence of an issue over other issues. Decision science uses the AHP method for problem-solving [35]. Both AHP and Fuzzy AHP were used in the study to analyse the hierarchy of the issues in canal irrigation. Fuzzy AHP was applied since the AHP method is said to suffer from unbalanced scales, uncertainty, biases, and, therefore, impreciseness. To overcome the impreciseness, Fuzzy AHP (FAHP) was also used, and then the AHP and FAHP ranking results were compared. Since both AHP and FAHP do not consider the cause–effect relationship between the issues, the DEMATEL approach was applied to analyse the influence of one issue over others in the form of a cause–effect relationship. Thus, the three techniques of MCDM (multi-criteria decision making) in combination can analyse the cause–effect relationship as well as the ranking of the issues for a more accurate analysis of the results.
The three methods used in this study have been applied in many studies, especially the AHP and FAHP methods. In addition, the DEMATEL method is also beneficial and simplistic in determining the cause-and-effect influence. Hence, the three methods are helpful and applicable methods for analysing the importance and influence of factors for effective decision-making and bringing improvements to the relevant fields.
3.2. DEMATEL
The causal relationship between the issues was assessed using the DEMATEL approach. It is a finished technique to provide the causal relationship between mind-boggling factors with the assistance of charts. The method can be summarised in the steps given below [36]:
Step 1—The comparison scale is used and presented in Table 3 to construct a direct relation matrix. The experts were consulted to assess the direct effect of each two-factor arrangement through the comparison scale. The xij notation represents the influence of factor i on factor j. For each expert, a non-negative matrix was attained as Xk = [xijk] with k being the number of experts Thus, we obtained from experts.
Table 3.
Comparison Scale for DEMATEL method.
Step 2—Based on values obtained from N respondents, the overall direct-relation matrix, D, is established. The average matrix can be attained from the equation .
Step 3—Normalised initial direct-relation matrix, , is obtained using the equation where . The value falling between 0 and 1 is compared with each element in the matrix .
Step 4—‘T’ is calculated using the equation where I is the identity matrix and T is the total relation matrix.
Step 5—The underlying constraints are determined using calculations: represents the row sum and indicates the col sum. The cause and effect are depicted.
Step 6—We employed the help of a dataset that includes the prominence (Pi) and the net effect (Ei), which are represented by the expressions:
The total effect that factor i had on the system is shown by the difference between and ). When it is positive, factor i is referred to as the net cause, whereas when it is negative, factor i is referred to as the net receiver.
3.3. AHP Method
The scale of relative importance is presented in Table 4. The method entails the following steps [37]:
Table 4.
Scale used for intensity of importance to construct the pairwise comparison matrix.
Step 1—Based on inputs from the 19 experts, the average of their responses was calculated to arrive at the final pairwise comparison matrix.
Step 2—The normalised pairwise comparison matrix was determined by applying the scale of relative importance.
Step 3—The coefficient vector for criteria weights for the criteria was then estimated after calculating geometric means, summation, and the corresponding reciprocal.
Step 4—The consistency index (CI) was calculated using the formula where is the average of the coefficient vector, and n is the number of categories.
Step 5—The Consistency Ratio (CR) was estimated using the formula where is the Random Index.
3.4. Fuzzy AHP
Because it depicts one criterion’s performance more accurately and logically than another, the fuzzy AHP method can address the AHP’s impreciseness. According to the experts, the triangular fuzzy scale used to represent the importance level is shown in Table 4. The steps followed in the FAHP method are given below:
Step 1—The pairwise comparison matrix determined in Step 1 of the AHP method was used here.
Step 2—The values were then replaced with the corresponding TFNs.
Step 3—Geometric means of the fuzzy weights were then estimated, and the results for the study are presented.
Step 4—Defuzzification was finished to show the relative non-fuzzy of each model () and, afterwards, normalised heaps of each standard () were assessed. On the basis of the values of , rankings were ascertained. was determined by considering the normalisation of fuzzy numbers and by utilising the non-fuzzy .
4. Results
4.1. Apply the AHP Method
Table 5 represents the normalised weights of the key criteria.
Table 5.
Normalised Weights of the key criteria (AHP).
The normalised weights for the main criteria were calculated and appropriately exhibited in Table 5. Table 6 also presents the rank for each criterion. For the key criteria, λ max was estimated to be 5.393, the Consistency Index (CI) was 0.098, and the Consistency Ratio (CR) was calculated to be 0.0807 from Table 5 and Table 6. As the value of CR is less than 0.10, the suitability of the data is indicated.
Table 6.
Criteria Weights and corresponding Ranks.
4.2. Apply FAHP Method
The fuzzy weights of geometric means for key criteria and sub-criteria have been calculated, as shown in Table 7. Based on the FAHP method analysis, the final ranking for the key criteria is FB > CB > LI > RS > EE. Table 8 shows a comparison of the ranks obtained through both AHP and FAHP methods. From Table 8 and Table 9, it can be observed that FB, that is, Financial Barriers, is the first priority and one of the major potential barriers to canal irrigation efficiency of irrigation potential, that is, ranked first by both AHP and FAHP methods. The barriers of Legal and Institutional (LI) and Capacity Building (CB) were ranked third and second, respectively, according to the analysis. It was observed that considering the lowest-priority issues, RS (Resource System) ranked fifth and fourth for the AHP method and the FAHP method, respectively, whereas EE (External Environment) ranked fourth for the FAHP method as shown in Table 8 and Table 9. In the same manner, it can be seen that the lowest priority should also be given to the barriers of External Environment (EE), ranking fourth and fifth for the AHP and FAHP methods, respectively.
Table 7.
Fuzzy Weights of Geometric Means and for key criteria and sub-criteria.
Table 8.
Criteria Weight Ranks for AHP and FAHP (comparison).
Table 9.
The Potential Criteria in Sequence.
The calculated rank correlation factor was observed to be 0.900 at the significance level (α) of 0.037 with p < 0.01 as shown in Table 10. It signifies that the relationship is significant. Both the AHP and FAHP applications complement each other. Along these lines, the ranking of the five components RS, LI, FB, CB, and EE considered in this investigation utilizing both AHP and FAHP methods are shown.
Table 10.
Rank Correlation with p-value.
The AHP method determined the relative importance of a criterion in decision-making. The AHP analysis provided a ranking of the key criteria based on their importance in decision-making. The Fuzzy AHP method addresses the impreciseness of the traditional AHP method. It provides a more accurate and logical representation of the importance levels of criteria by providing useful insight into the relative importance of each criterion and sub-criterion in the decision-making process. The results can inform the development of an appropriate decision-making model that considers the relative importance of each criterion and sub-criterion. Based on their ranks obtained from the AHP and FAHP analyses, the potential criteria in the sequence show that Financial Barriers (FB) is the most important criterion, followed by CB, LI, RS, and EE, in that order.
4.3. Sensitivity Analysis
The “Financial Barriers” (FB) criterion is the highest priority of the five key criteria categorised in this study. The rest of the categories may be affected by a small shift in the weight given to the highest-ranked category (see Table 11). Sensitivity analysis was used in this study to deal with variations between variables. As a result, the highly prioritised category weightage can be adjusted to 0.4577*0 and, 0.4577*0.8 instead of 0.4577(FB) and 0.4577*0.1, with four decimal places considered. We refer readers to Figure 1 for the awareness examination.
Table 11.
Sensitivity analysis of main criteria with “FB” criteria weight change from (0.4577*0.9 … 0.4577*0.1).
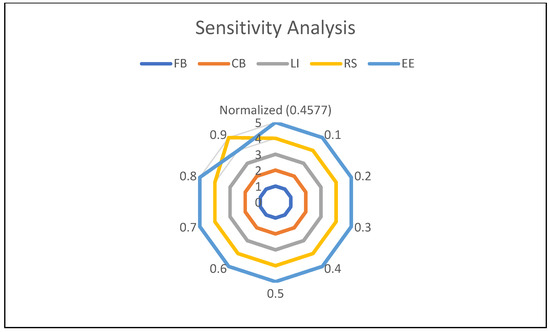
Figure 1.
Results of sensitivity analysis for criteria.
4.4. Applying the DEMATEL Method
The total relation matrix is presented in Table 12, where the row sums are represented by and the column sums by , and Table 13 exhibits the cause-and-effect relationship between the five key criteria (refer to Figure 2).
Table 12.
Total relation matrix.
Table 13.
Cause and Effect of Criteria.
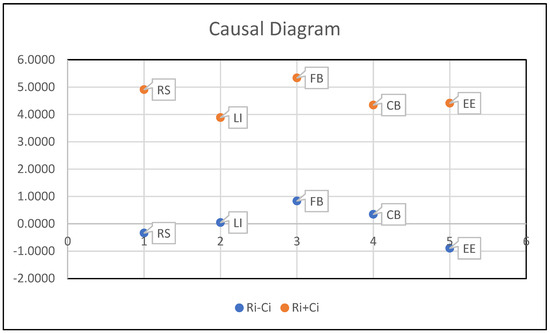
Figure 2.
Cause and effect—DEMATEL analysis.
The DEMATEL method was applied to analyse the cause-and-effect relationship of the five key criteria. Based on the analysis, the Financial Barriers (FB) criterion has the highest level of influence on the other criteria. Therefore, it is also categorised as a cause criterion, directly affecting the other criteria. The other cause criteria are Capacity Building (CB) and External Environment (EE). On the other hand, Resource Availability (RS) and Legal Implications (LI) are categorised as effect criteria, which means they are directly affected by the other criteria.
5. Conclusions
Numerous researchers in India and abroad have tried to assess various aspects of the effectiveness of WUAs, discussed at length in the earlier sections. Because of multiple variables, including their location and the degree of user interaction, it is challenging to draw broad conclusions regarding the effects of WUAs. The study identified five key barriers to irrigation efficiency along with the sub-barriers that Water User Associations face in the effective usage of canal irrigation and found a scientific approach to prioritising the barriers related to the multidimensional problem of poor irrigation efficiency for better management of created infrastructure. Addressing these barriers simultaneously will take more work requiring adequate human and financial resources. The resource system comprises the canal infrastructure requiring proper operation and maintenance. Different water needs under the same sluice are demanded due to current agronomic practices where farmers opt for diversified crops. Thus, it necessitates customising irrigation schedules, control, and measuring systems at the canal outlet heads and field outlets and making farmers adapt to measuring the quantum of water irrigated in the field. Agricultural advisory services are necessary for higher farm productivity due to a lack of quality seed/ planting materials and reduced rural livelihood opportunities. Though funding may not be the sole panacea, at the same time, a lack of Government funding and low collection of water charges /non-payment of water charges make WUAs financially unviable, resulting in their inability to afford the high maintenance costs, resulting in a capital loss. The main hurdle is prioritising and identifying the barriers to addressing them out of limited resources. The study has found that Financial Barriers, Capacity Building, and the Legal and Institutional setup are causal factors, and Resource Availability (RS) and the External Environment (EE) are the effect criteria influenced by the other criteria. Sensitivity analysis shows how changing the weight of the Financial Barriers (FB) criterion affects the ranking of the other criteria. Depending on the weight assigned to FB, the relative importance of the criteria changes. It can be inferred that in the context of irrigation projects in Jharkhand, more attention to reducing the Financial Barriers is needed to improve the overall performance of irrigation projects. This necessitates adequate government funding and the collection of water rates. A lack of government support/ funding and low collection of water charges makes WUAs financially unviable and unable to bear the Operation and Maintenance costs, resulting in a capital loss. Moreover, ensuring financial support should be supplemented by strengthening the Capacity Building criterion by training WUA members and other stakeholders in participatory irrigation management (PIM) covering Monitoring, Coordination, Leadership, Cooperation, and Dispute/Conflict resolution. The Legal and Institutional (LI) setupm clearly delineating the nature and extent of IMT, is also an important factor. Thus, government policy should be directed to ensure adequate financial resources by enabling an environment that strengthens WUAs to be capable of managing the project’s affairs and recovery of water charges. The methodology demonstrated in the paper could be applied in different contexts to provide valuable insights for policymakers and researchers to identify and address the issues of sustainable canal irrigation efficiency.
Author Contributions
Conceptualization, J.N.; Methodology, R.K.; Data Collection: J.N. and B.R.T.; Writing- original draft preparation, J.N., B.R.T. and R.K.; Writing-review and editing, J.N., B.R.T. and R.K. All authors have read and agreed to the published version of the manuscript.
Funding
This research received no external funding.
Data Availability Statement
Not applicable.
Conflicts of Interest
The authors declare no conflict of interest.
References
- Ayog, N. Raising Agricultural Productivity and Making Farming Remunerative for Farmers—An Ocassional Paper; NITI Aayog: New Delhi, India, 2015. [Google Scholar]
- Department of Agriculture, Cooperation & Farmers Welfare. Annual Report 2018–2019. Available online: https://agricoop.nic.in/sites/default/files/AR_2018-19_Final_for_Print.pdf (accessed on 15 January 2023).
- Mukherji, A.; Das, B.; Majumdar, N.; Nayak, N.C.; Sethi, R.R.; Sharma, B.R. Metering of agricultural power supply in West Bengal, India: Who gains and who loses? Energy Policy 2009, 37, 5530–5539. [Google Scholar] [CrossRef]
- Vaidyanathan, A. Transferring irrigation management to farmers. Econ. Political Wkly. 1994, 29, 2965–2967. [Google Scholar]
- Mitra, A.K. Irrigation sector reforms: Issues and approaches. Econ. Political Wkly. 1996, 31, A31–A37. [Google Scholar]
- Johnson, S.H. Irrigation Management Transfer: Decentralizing Public Irrigation in Mexico. Water Int. 1997, 22, 159–167. [Google Scholar] [CrossRef]
- Hamada, H.; Samad, M. Basic Principles for Sustainable Participatory Irrigation Management. JARQ 2011, 45, 371–376. [Google Scholar] [CrossRef]
- Von Korff, Y.; Daniell, K.A.; Moellenkamp, S.; Bots, P.; Bijlsma, R.M. Implementing Participatory Water Management: Recent Advances in Theory, Practice, and Evaluation. E&S 2012, 17, 30. [Google Scholar] [CrossRef]
- Pant, N. Impact of Irrigation Management Transfer in Maharashtra: An Assessment. Econ. Political Wkly. 1999, 34, A17–A26. [Google Scholar]
- Parthasarathy, R. Participatory Irrigation Management Programme in Gujarat: Institutional and Financial Issues. Econ. Political Wkly. 2000, 35, 3147–3154. [Google Scholar]
- Reddy, V.R.; Reddy, P.P. How Participatory Is Participatory Irrigation Management? Water Users’ Associa-tions in Andhra Pradesh. Econ. Political Wkly. 2005, 40, 5587–5595. [Google Scholar]
- Swain, M.; Das, D.K. Participatory Irrigation Management in India. J. Dev. Sustain. Agric. 2008, 3, 28–39. [Google Scholar] [CrossRef]
- Naik, G.; Kalro, A.H. A methodology for assessing impact of irrigation management transfer from farmers’ perspective. Water Policy 2000, 2, 445–460. [Google Scholar] [CrossRef]
- Meinzen-Dick, R.; Raju, K.; Gulati, A. What Affects Organization and Collective Action for Managing Resources? Evidence from Canal Irrigation Systems in India. World Dev. 2002, 30, 649–666. [Google Scholar] [CrossRef]
- Bassi, N.; Kumar, M.D. Can Sector Reforms Improve Efficiency? Insight from Irrigation Management Transfer in Central India. Int. J. Water Resour. Dev. 2011, 27, 709–721. [Google Scholar]
- Gandhi, V.P.; Johnson, N.; Neog, K.; Jain, D. Institutional Structure, Participation, and Devolution in Water Institutions of Eastern India. Water 2020, 12, 476. [Google Scholar] [CrossRef]
- Rap, E. The success of a policy model: Irrigation management transfer in Mexico. J. Dev. Stud. 2006, 42, 1301–1324. [Google Scholar] [CrossRef]
- Wang, J.; Xu, Z.; Huang, J.; Rozelle, S. Incentives to managers or participation of farmers in China’s irrigation systems: Which matters most for water savings, farmer income, and poverty? Agric. Econ. 2006, 34, 315–330. [Google Scholar] [CrossRef]
- Yakubov, M. Asessing irrigation performance from the farmers’ perspective: A qualitative study. Irrig. Drain. 2012, 61, 316–329. [Google Scholar] [CrossRef]
- Zinzani, A. Irrigation Management Transfer and WUAs’ dynamics: Evidence from the South-Kazakhstan Province. Env. Earth Sci. 2015, 73, 765–777. [Google Scholar] [CrossRef]
- Senanayake, N.; Mukherji, A.; Giordano, M. Re-visiting what we know about Irrigation Management Transfer: A review of the evidence. Agric. Water Manag. 2015, 149, 175–186. [Google Scholar] [CrossRef]
- Choi, S.-M.; Yoon, K.-S.; Kim, J.-S. Irrigation Management Transfer Between Public Organizations and the Role of Participatory Irrigation Management Under Public Irrigation Management in Korea. Irrig. Drain. 2016, 65, 69–75. [Google Scholar] [CrossRef]
- Shindo, S.; Yamamoto, K. Strengthening Water Users’ Organization targeting for Participatory Irrigation Management in Egypt. Paddy Water Env. 2017, 15, 773–785. [Google Scholar] [CrossRef]
- Zhou, Q.; Deng, X.; Wu, F.; Li, Z.; Song, W. Participatory Irrigation Management and Irrigation Water Use Efficiency in Maize Production: Evidence from Zhangye City, Northwestern China. Water 2017, 9, 822. [Google Scholar] [CrossRef]
- Azemzi, H.; Erraoui, E.H. Irrigation water management and collective action: Understanding the shift from community management to participatory management in Souss-Massa (Morocco). Euro Mediterr. J. Environ. Integr. 2021, 6, 1. [Google Scholar] [CrossRef]
- Yohannes, D.F.; Ritsema, C.J.; Solomon, H.; Froebrich, J.; van Dam, J.C. Irrigation water management: Farmers’ practices, perceptions and adaptations at Gumselassa irrigation scheme, North Ethiopia. Agric. Water Manag. 2017, 191, 16–28. [Google Scholar] [CrossRef]
- Balasubramanya, S.; Price, J.P.G.; Horbulyk, T.M. Impacts Assessments without True Baselines: Assessing the Relative Effects of Training on the Performance of Water User Associations in Southern Tajikistan. Water Econs. Policy 2018, 4, 1850007. [Google Scholar] [CrossRef]
- Ahmad, B.; Pham, H.D.; Ashfaq, M.; Memon, J.A.; Bano, R.; Dahri, Z.H.; Mustafa, R.N.; Baig, I.A.; Naseer, M.A.u.R. Impact of Institutional Features on the Overall Performance Assessment of Participatory Irrigation Management: Farmers’ Response from Pakistan. Water 2020, 12, 497. [Google Scholar] [CrossRef]
- Yang, L.; Ren, Y.; Tang, Z.; Zhu, Y. Impact of institutional constraints on participatory irrigation management: The regulating role of moral obligation. Irrig. Drain. 2021, 70, 1287–1297. [Google Scholar] [CrossRef]
- Razzaq, A.; Qing, P.; Naseer, M.A.u.R.; Abid, M.; Anwar, M.; Javed, I. Can the informal groundwater markets improve water use efficiency and equity? Evidence from a semi-arid region of Pakistan. Sci. Total Environ. 2019, 666, 849–857. [Google Scholar] [CrossRef] [PubMed]
- Razzaq, A.; Liu, H.; Zhou, Y.; Xiao, M.; Qing, P. The Competitiveness, Bargaining Power, and Contract Choice in Agricultural Water Markets in Pakistan: Implications for Price Discrimination and Environmental Sustainability. Front. Environ. Sci. 2022, 10, 917984. [Google Scholar] [CrossRef]
- Narayanamoorthy, A. Financial performance of India’s irrigation sector: A historical analysis. Int. J. Water Resour. Dev. 2018, 34, 116–131. [Google Scholar] [CrossRef]
- Jain, R.; Kishore, P.; Singh, D.K. Irrigation in India: Status, challenges and options. J. Soil Water Conserv. 2019, 18, 354. [Google Scholar] [CrossRef]
- Gupta, A.; Singh, R.k.; Kumar, M.; Sawant, C.P.; Gaikwad, B.B. On-farm irrigation water management in India: Challenges and research gaps. Irrig. Drain. 2022, 71, 3–22. [Google Scholar] [CrossRef]
- Hossain, M.K.; Thakur, V. Benchmarking health-care supply chain by implementing Industry 4.0: A fuzzy-AHP-DEMATEL approach. Benchmarking Int. J. 2021, 28, 556–581. [Google Scholar] [CrossRef]
- Bakir, S.; Khan, S.; Ahsan, K.; Rahman, S. Exploring the critical determinants of environmentally oriented public procurement using the DEMATEL method. J. Environ. Manag. 2018, 225, 325–335. [Google Scholar] [CrossRef] [PubMed]
- Saaty, T.L. The Analytic Hierarchy Process; McGraw-Hill: New York, NY, USA, 1980. [Google Scholar]
Disclaimer/Publisher’s Note: The statements, opinions and data contained in all publications are solely those of the individual author(s) and contributor(s) and not of MDPI and/or the editor(s). MDPI and/or the editor(s) disclaim responsibility for any injury to people or property resulting from any ideas, methods, instructions or products referred to in the content. |
© 2023 by the authors. Licensee MDPI, Basel, Switzerland. This article is an open access article distributed under the terms and conditions of the Creative Commons Attribution (CC BY) license (https://creativecommons.org/licenses/by/4.0/).