Article

Watershed Hydrological Responses to Land Cover Changes at Muger Watershed, Upper Blue Nile River Basin, Ethiopia

1
Institute of Environment and Sustainable Development in Agriculture (IEDA), Chinese Academy of Agricultural Sciences (CAAS), Beijing 100081, China
2
Oromia Agricultural Research Institute, Bako Agricultural Research Center, Bako P.O. Box 03, Ethiopia
3
Graduate School of Chinese Academy of Agricultural Sciences, Beijing 100081, China
4
Faculty of Agriculture and Environmental Sciences, University of Rostock, Satower Str. 48, 18051 Rostock, Germany
5
Wondo Genet College of Forestry and Natural Resources, Hawassa University, Shashemene P.O. Box 128, Ethiopia
6
Department of Hydraulic and Water Resources Engineering, Wolaita Sodo University, Waliata Sodo P.O. Box 138, Ethiopia
7
Department of Disaster Risk Management and Sustainable Development, Ambo University, Ambo P.O. Box 19, Ethiopia
8
Australian Rivers Institute and School of Engineering and Built Environment, Griffith University, Nathan, QLD 4111, Australia
*
Author to whom correspondence should be addressed.
Water 2023, 15(14), 2533; https://doi.org/10.3390/w15142533
Submission received: 13 February 2023 / Revised: 12 June 2023 / Accepted: 17 June 2023 / Published: 10 July 2023

Abstract

:
Changes in land cover (LC) are the major factors influencing the hydrological processes within a watershed. Understanding the impacts of LC on watershed hydrology is crucial for planning and predicting land resource utilization, water resources, and sustaining hydrological balance. This study assesses the hydrological responses of LC changes in the Muger watershed located in the Upper Blue Nile River Basin (UBNRB) from 1986 to 2020. We used the Soil and Water Assessment Tool (SWAT) hydrological model to investigate the effects of LC on the hydrological process. The simulations were driven by several datasets, such as watershed elevations, mean climatology, hydrology and soil datasets, and LC satellite maps for three time periods (i.e., satellite imagery taken in 1986, 2003, and 2020). We found that the key LC changes that affected hydrological parameters in the Muger watershed are changes in cultivation land, forest land, and settlement. The expansion of cultivation land and shrinkage of forest and shrub lands triggered surface runoff and a reduction in groundwater between 1986 and 2003. Additionally, settlement was identified as the primary factor contributing to increases in evapotranspiration (ET) and surface runoff. The LC changes that occurred between 1986 and 2020 reduced the average annual, wet season, and dry season streamflow. Between 2003 and 2020, surface runoff decreased by 3.71% due to the effect of land landscape restoration interventions. The outcome of the study can assist decision-makers and planners in preparing adaptable strategies under changing LC conditions within a watershed.

1. Introduction

Land cover (LC) variations considerably modify a watershed, which, depending on the type of environmental variable, has considerable effects on hydrological parameters by changing the quality, amount, dissemination, and timescale of streamflows, ultimately impacting the water resource management and operations [1]. Generally, LC changes influence the hydrological parameters of the basin by partitioning rainfall routes into the surface and subsurface runoff, as well as through ET. Similarly, LC variations have an adverse influence on catchments by changing infiltration, flood peaks, groundwater recharge, and sediment transport. Land cover changes have both short and long-term spatio-temporal effects on watershed hydrological components, impacting many fundamental features and processes [2,3,4].
In various parts of the world, modification of LC has affected hydrological systems [5]. To this end, studies on the relationships between LC change and hydrological components were carried out to analyze the impact of LC change on water resources [6]. Understanding and modeling hydrological responses to LC change is essential for optimizing water resource planning and management. Ethiopia, a developing country where agriculture is the mainstay of the economy, faces significant environmental concerns as a result of LC change [7]. The tremendous variability and seasonality of hydrology of Ethiopia’s major surface water resources are the primary water resource management challenges in the country. Additionally, the land has experienced environmental degradation, which contributes to desertification and reduces the potential productivity of the land as a result of competing interactions between historical and current land uses, socioeconomic interests, and ecological goals. To effectively manage LC and hydrology in a watershed, it is necessary to evaluate the impacts of LC dynamics in the watershed on hydrological parameters [7,8].
The study of the hydrological dynamics against LC change in a watershed necessitates the use of advanced hydrologic modeling, which has been a useful tool in the management of water resources for many years. It typically helps to examine the influence of LC change on hydrological processes by taking into account the spatio-temporal catchment characteristics for sustainable water resource management [9]. Physically-based and spatially distributed hydrological models have been utilized to quantify hydrological responses to LC change. The impact of LC change on hydrological processes is currently being simulated using a variety of hydrological models [8,10,11].
Accessibility, simulation of diverse hydrological components and long-term temporal scales at watershed and sub-watershed levels, user-friendly interface, minimal input data requirement, and its capacity to deliver continuous, long-term simulations from small to large watershed sizes are some of the important factors considered when selecting the proper model to meet the study’s objectives [8,11,12].
The SWAT model is a widely tested ‘semi-distributed’ hydrological model used worldwide [11,12,13,14]. It has been applied to large and small-scale river basins in Ethiopia with promising results [15,16]. As a result, for this study, the model was utilized to evaluate the implications of LC change in the Muger watershed. For many years, researchers have assessed the consequences of LC change on hydrological components [17]. Based on the change in LC, the hydrological processes of a watershed reveal a significant rise in surface runoff capacity and rainy season flow. The extent to which changes in LC impact variations in hydrological components, however, varies depending on the characteristics of the watershed [18]. Surface runoff increases due to agricultural land expansion, settlement, and loss of vegetation cover in different parts of the world [2,8,9,17,19,20,21,22,23,24,25,26].
The UBNRB is a significant river basin; it is the largest catchment in the region and the continent’s primary water resource. The Muger watershed is part of the UBNRB in the country’s central highlands. Excessive land degradation caused by increased human density within the watershed has resulted in economic, environmental, and social repercussions, all of which contribute to the degradation of the water in the basin. As far as the authors’ understanding, this is the first study concentrating on the impacts of historical LC change on hydrological responses in the Muger watershed. Previous research in many parts of the country, mainly in the UBNRB, has revealed significant LC dynamics due to natural and anthropogenic processes [2,27,28,29].

2. Materials and Methods

2.1. Study Area Description

The UBNRB is the primary stream of the Nile basin, located in western and central Ethiopia between 7°45′ N and 12°45′ N latitudes and between 34°05′ E and 39°45′ E Longitudes. The basin’s yearly rainfall ranges between 800 mm and 2000 mm. The Muger catchment is administratively located in Oromia regional state, approximately 32 km west of Addis Ababa, which is the capital city of the country. The catchment is a sub-watershed of the UBNRB covering 7246 km2 and joins the UBNRB at 37.93° E and 9.92° N. The Muger River is one of the largest tributaries that join the upper Blue Nile from the basin’s southeast [30,31].
The catchment is found geographically between 37°54′42.57″ E and 39°01′24.16″ E, longitudes and between 9°04′55.54″ N and 9°58′04.64″ N latitudes (Figure 1). The altitude of the Muger watershed varies between 953 and 3550 m above sea level (m.a.s.l.). The southern and eastern highlands of the sub-watershed are higher in altitude, ranging from 2600 m.a.s.l. to more than 3550 m.a.s.l. The Muger River’s lowlands are lower in elevation, at less than 1700 m.a.s.l. The mean yearly rainfall of the watershed ranges from 833 mm to 1326 mm. In the highlands of the sub-basin, relatively high rainfall has been observed. Around the river and in the lowlands, the mean yearly rainfall is between 833 mm and 1000 mm.
The watershed’s yearly maximum and minimum temperature range between 16 and 31.5 °C and between 3 and 16.5 °C, respectively. Lowlands that are hot to warm and moist are found in the watershed’s northwest. Rendzic Leptosols, Eutric Leptosols, Eutric Vertisols, and Chromic Luvisols are the predominant soil types in the basin. In the Muger watershed, small-scale subsistence farming is the main economic activity and the source of sustenance. Cultivation is very intensive in the rainy season.

2.2. Input Data

The inputs for the SWAT model are spatial data (i.e., digital elevation model land cover at different periods, soil) and temporal data (weather and streamflow data) from the catchment to simulate the hydrological parameters.

2.2.1. Topographic Factors

The digital elevation model (DEM) is among the crucial data required by the SWAT model. It is used to derive stream networks, watershed boundaries, and terrain slopes, among others. A DEM with a resolution of 30 m × 30 m was obtained from the Ministry of Water, Irrigation, and Energy (MoWIE) of Ethiopia. It was used to assess the hydrological parameters of the catchment. Five classes of slope were used in this study (Table 1 and Figure 2). The majority of the land in the catchment (32.48%) has a slope class between 15 and 30%, and the remaining land has the rest of the slope classes (Table 1).

2.2.2. Land Cover

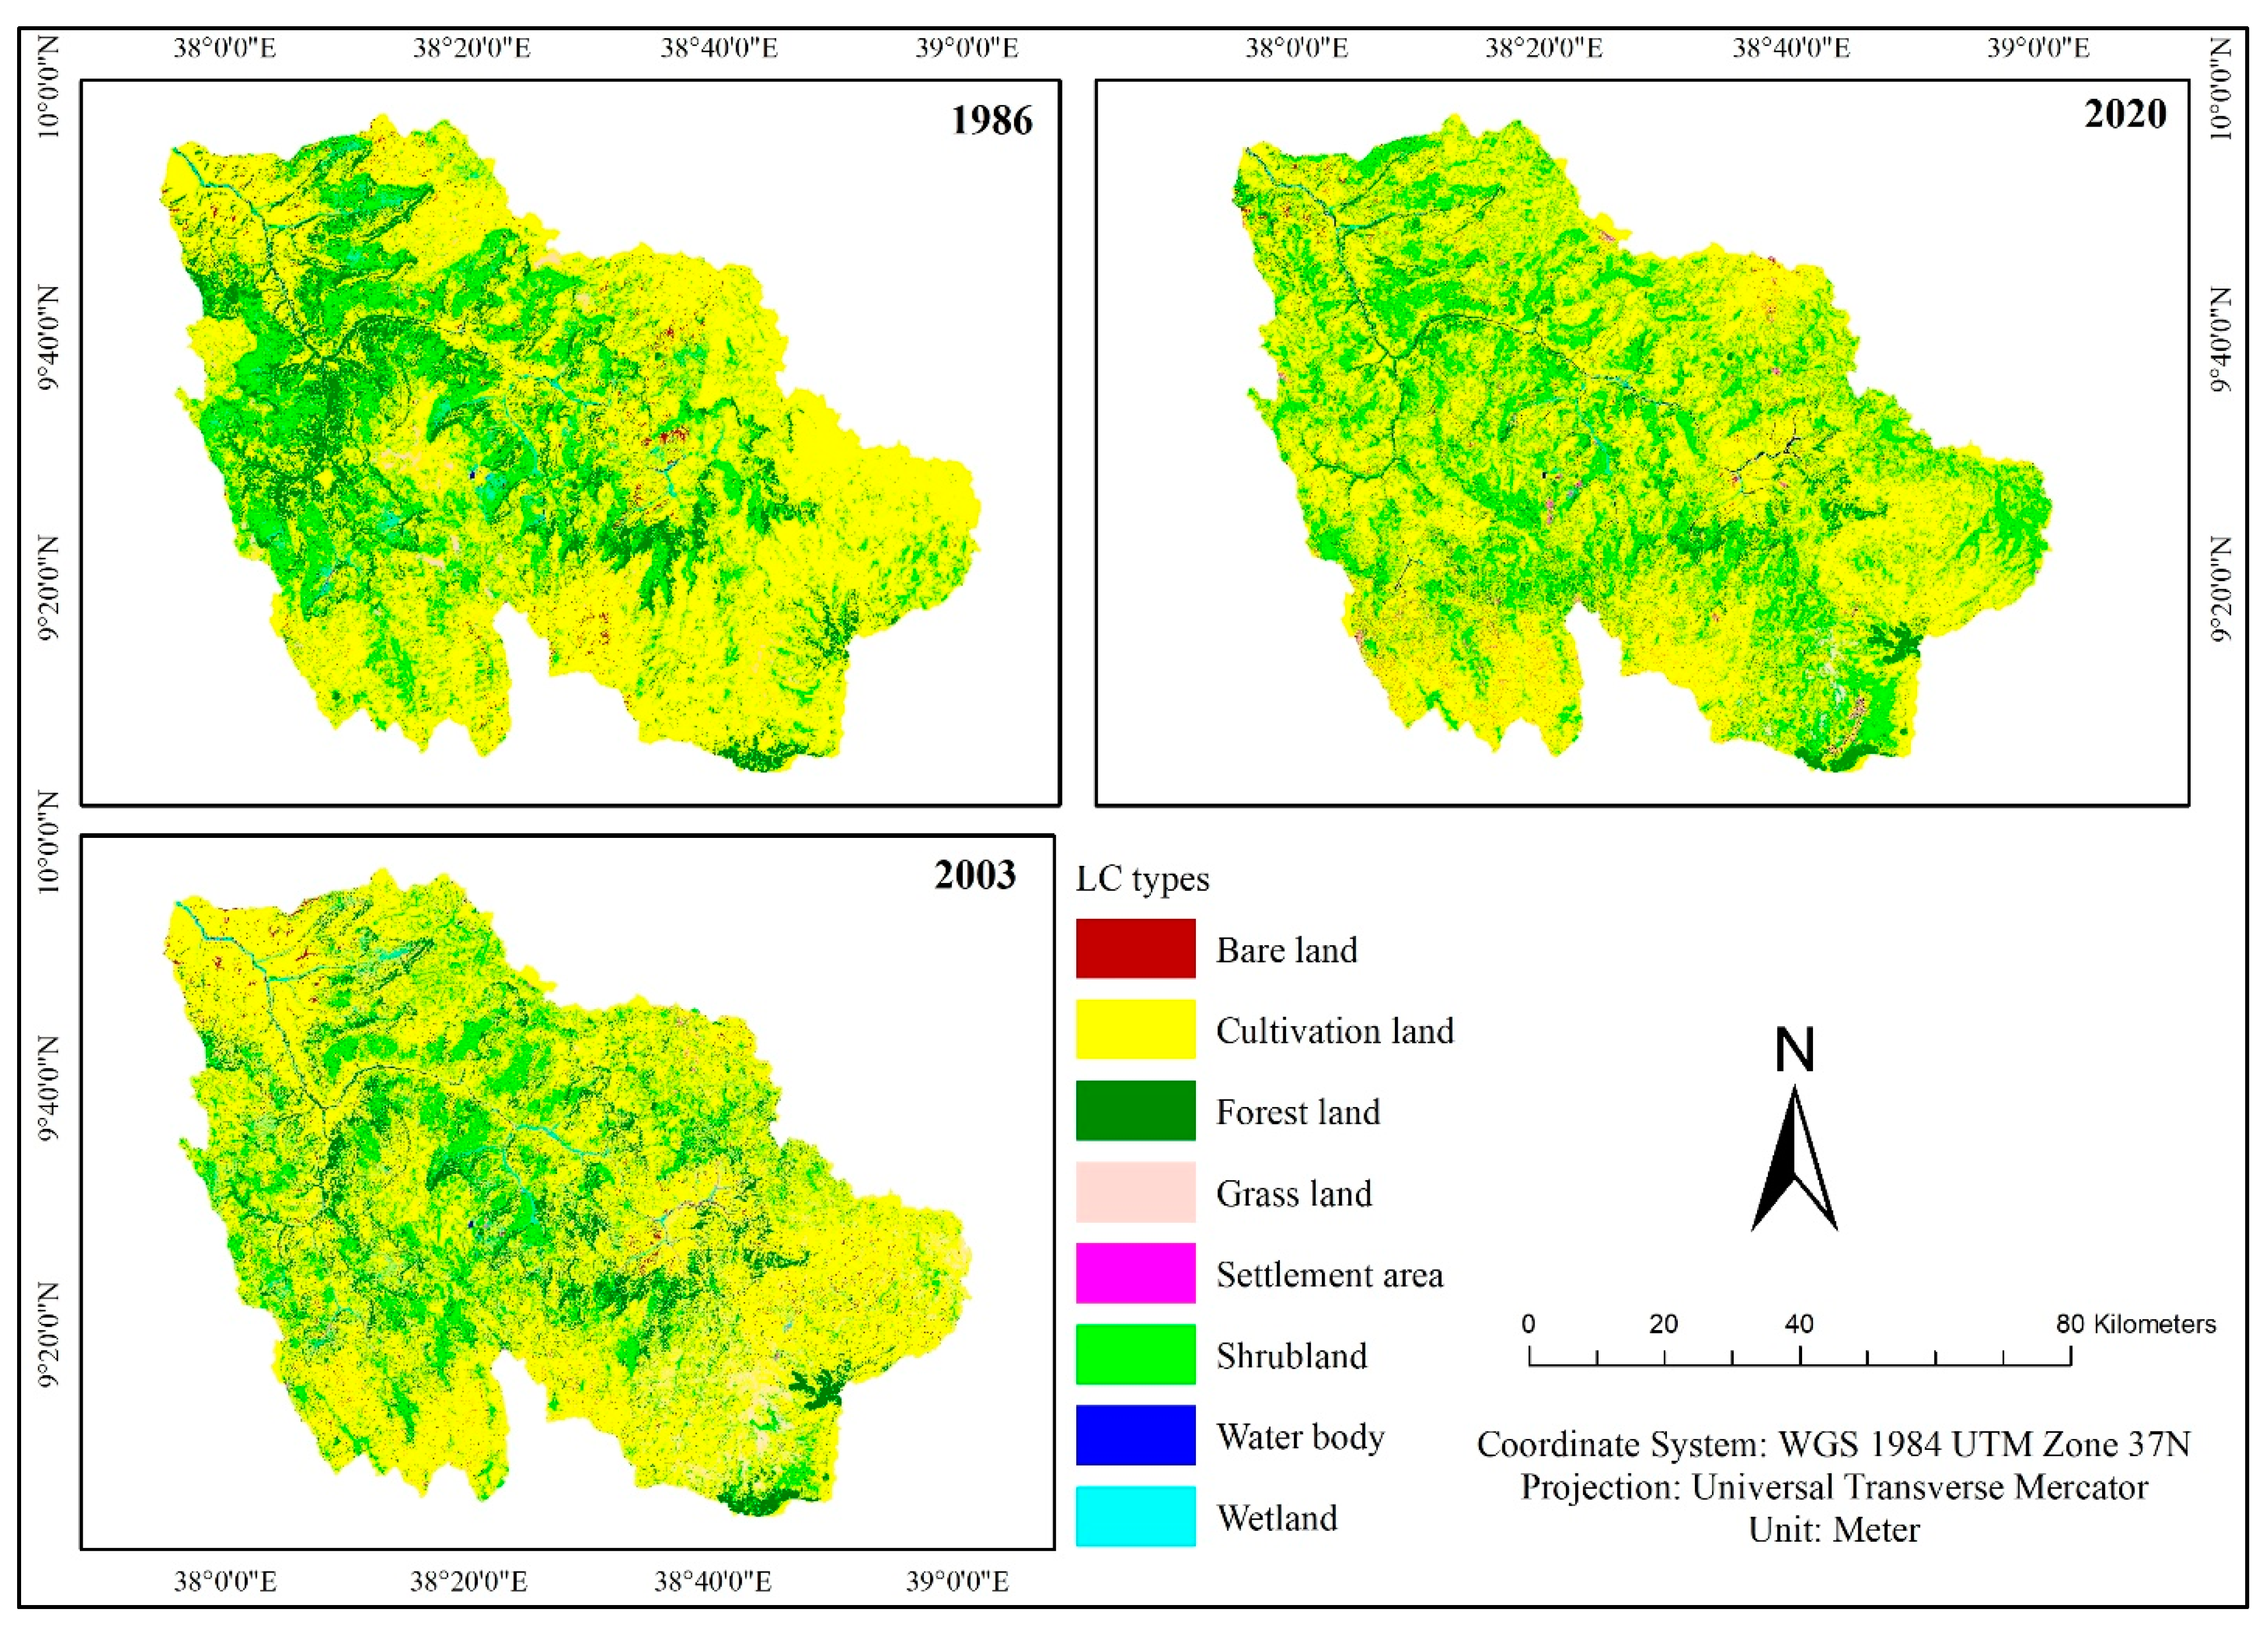
LC is input data used to determine the characteristics of a catchment and its impact on hydrological responses. The LC data used in this study are based on the study conducted by Teshome et al. [32] (Figure 3, Table 2). It is a crucial element influencing surface erosion, runoff, and ET, as well as describing the HRU in a given watershed [33,34].

2.2.3. Soils

For the SWAT model to simulate hydrological components for the different soil types, data on the basic physicochemical soil properties are essential. A soil map was obtained from the MoWIE, Ethiopia (Figure 4). The basic physicochemical characteristics of soils in the study area were obtained from FAO soil categorization. Nine types of soil were found in the watershed (Table 3; Figure 4). Rendzic Leptosols, Eutric Vertisols, and Humic Nitisols are the dominant soil types in the study watershed.

2.2.4. Meteorological Data

The daily meteorological data required for the SWAT model include rainfall, temperature, relative humidity, solar radiation, and wind speed. Nine meteorological stations (Table 4) were selected based on their quantity, quality, duration, consistency, homogeneity, and spatial distribution. The Ethiopian National Meteorological Agency provided data for the years from 1983 through 2020. Furthermore, the missing weather data for selected stations were filled with data from different nearby stations using both the method of arithmetic mean and the normal ratio. The double mass curve was used to analyze the homogeneity and consistency of the data, and it was found that the data were consistent.

2.2.5. Hydrological Data

The daily recorded hydrological (i.e., streamflow) data from the gauging stations for the period from 1983 to 2009 were used for the SWAT model calibration and validation. The streamflow data of the Muger watershed were obtained from MoWIE, Ethiopia. These data were collected from five gauging stations in the catchment, i.e., Muger, Deneba, Sibilu, Gerbi, and Gorfo. These are the only gauging stations in the catchment. Therefore, the streamflow data at the gauging stations were interpolated to predict streamflow values at ungauged locations. The description of the gauging stations is shown in Table 5.
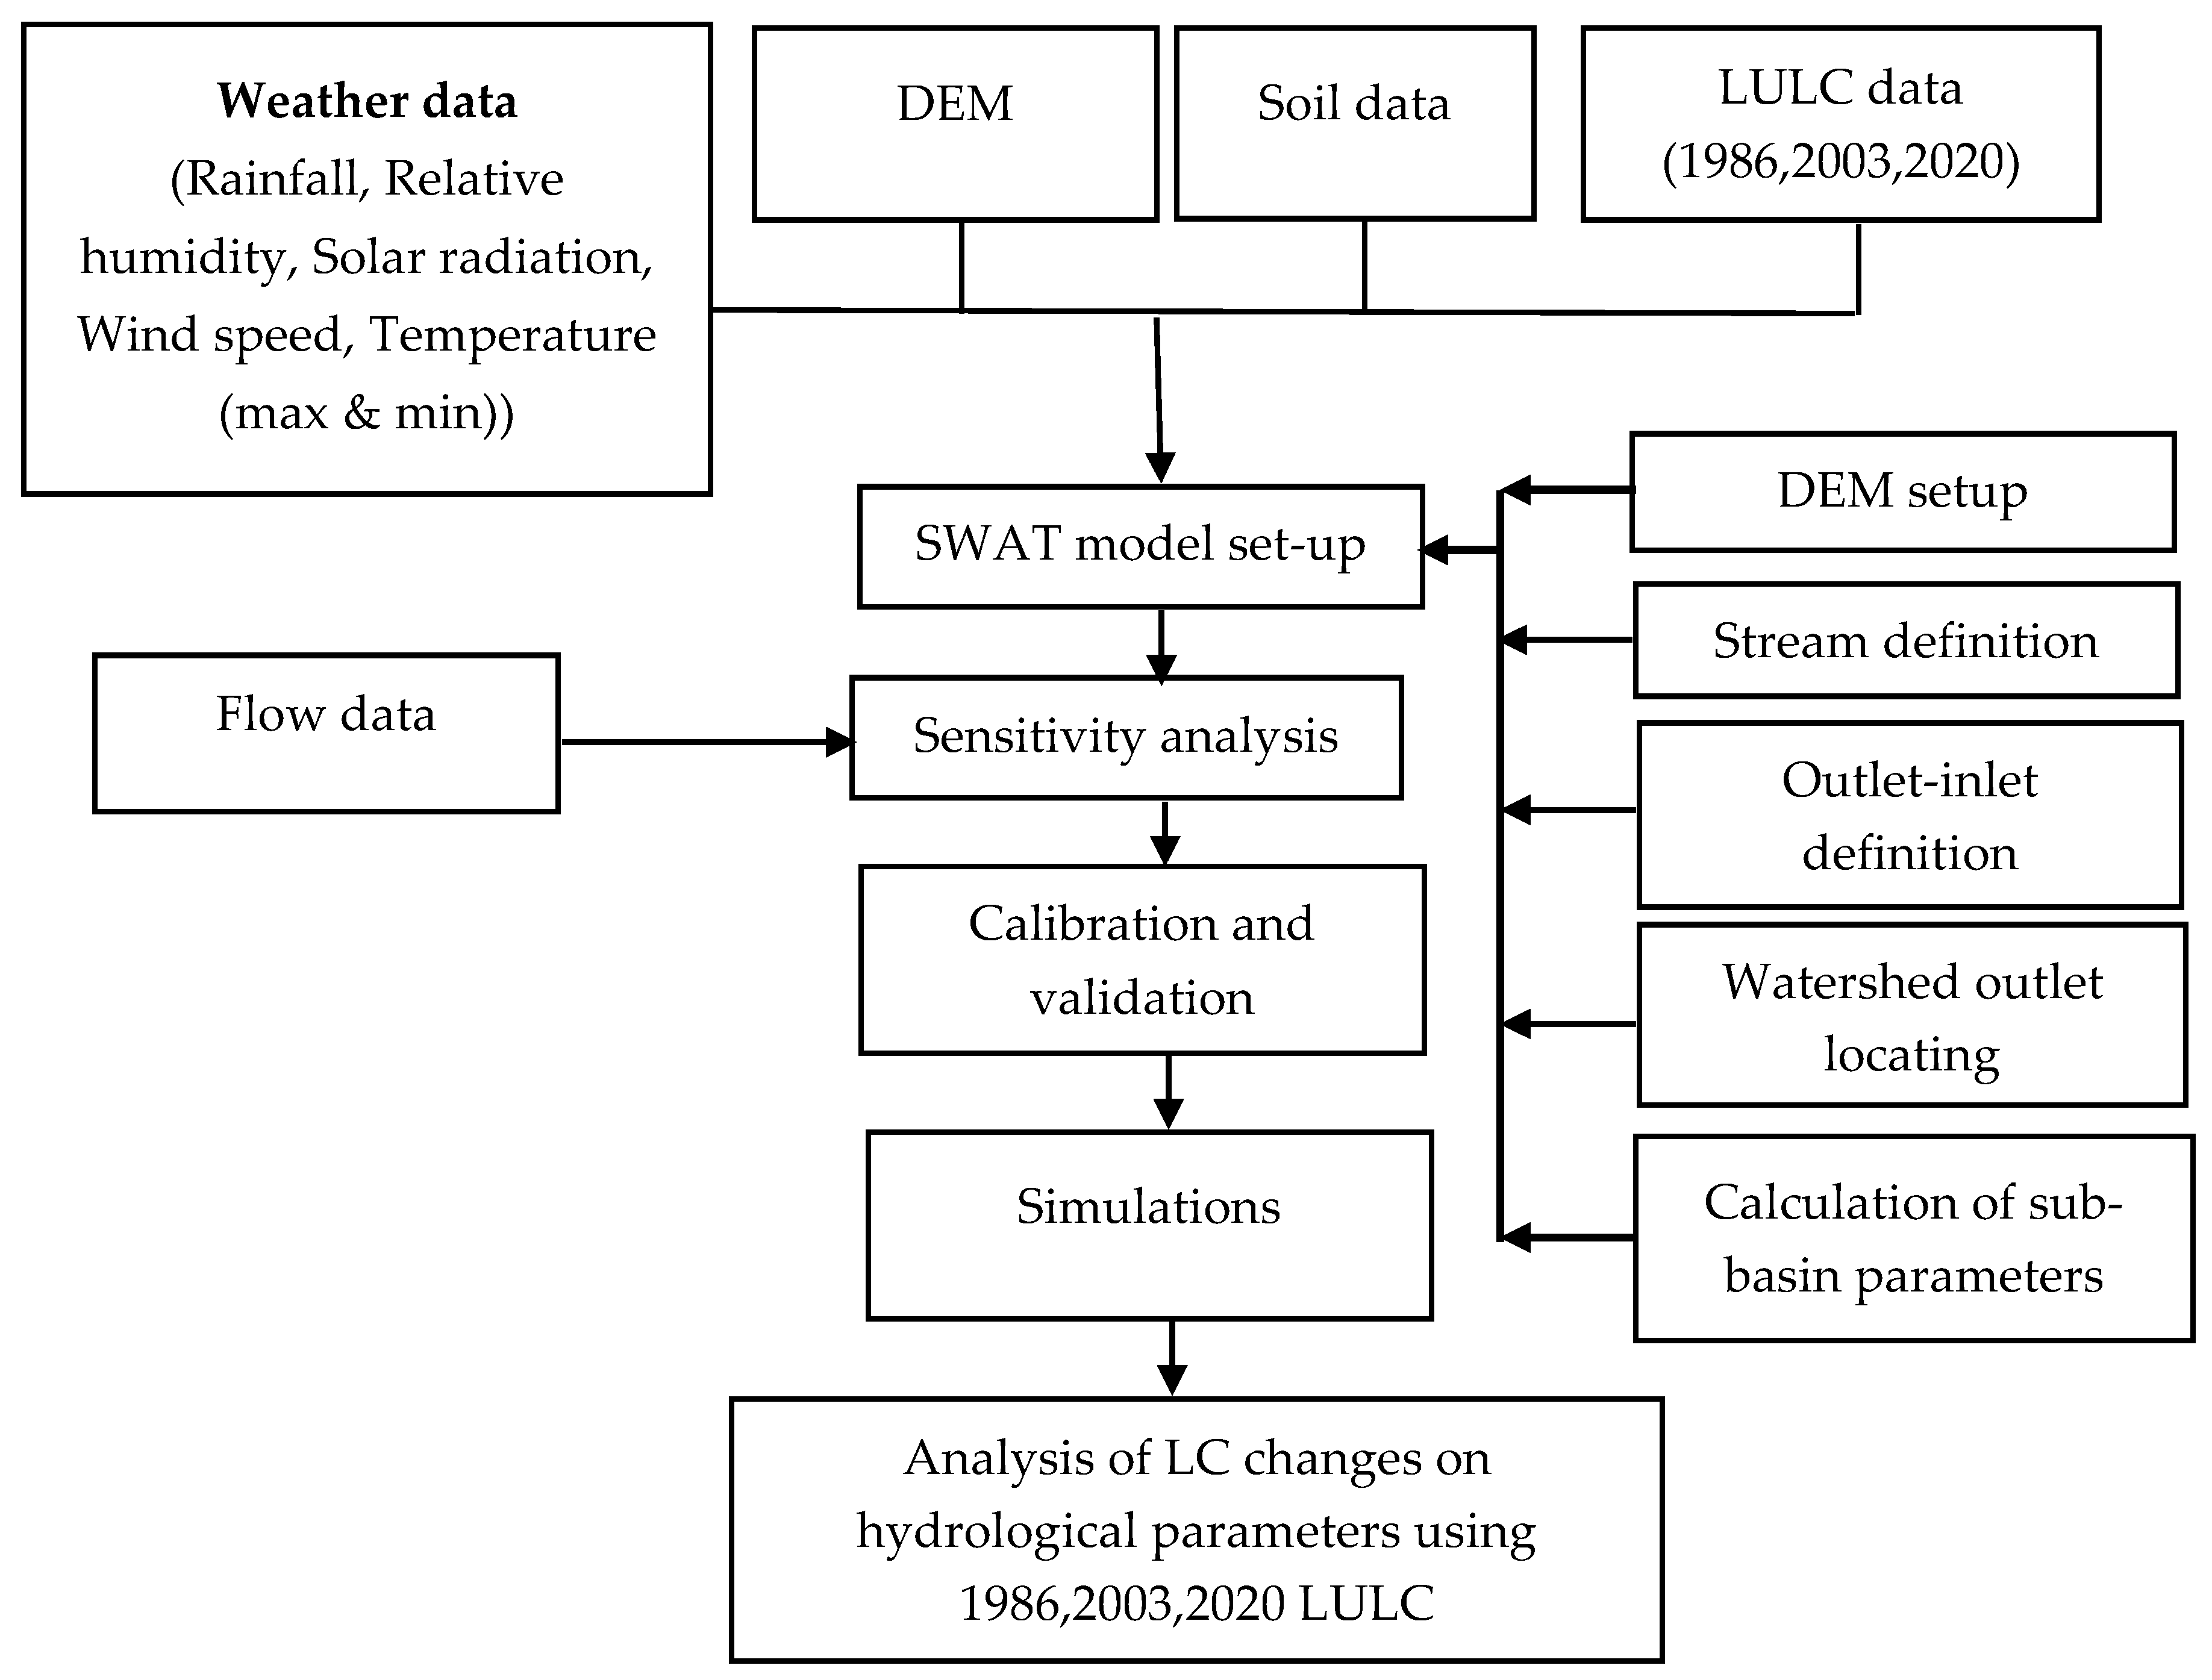
The general conceptual framework used for hydrological modeling and assessment of the impacts of land cover change on hydrological processes in the Muger watershed is shown in Figure 5.

2.3. Hydrological Modeling

The SWAT model has been used to evaluate the impacts of LC change on hydrological components in the Muger watershed [35]. The model has been used to examine hydrological parameters in large and small catchments around the world, including Ethiopia [12,15,16,35]. The SWAT model is a long-term, semi-distributed, continuous, deterministic, and effective hydrological model [12]. The fundamental attributes of the SWAT model for a given watershed are hydrology, weather, erosion/sedimentation, nutrients, pesticides, plant growth, agricultural management, routing of ponds and reservoirs, and channel routing [36].
In this study, the basin was divided into a number of sub-basins, which were then further divided into smaller areas known as HRUs (hydrological response units). In a sub-watershed, HRUs are parts of land that have non-spatial units and a unique combination of homogenous soil, land cover, slope, and management attributes [12,13]. The model uses DEM, soil type, LC, and slope to split the Muger catchment into 33 sub-catchments, which were then divided into 434, 435, and 451 HRUs for 1986, 2003, and 2020 LC data, respectively. The HRU has been defined based on a threshold of 10% for land cover, 20% for soil, and 10% for slope [35].

2.4. Sensitivity Analysis

The model’s statistics, including the t-statistic and p-value, provide an indication of the sensitivity of the model variables [37,38,39,40]. A larger t-stat in absolute values and a lower p-value suggest more sensitive factors [37].

2.5. Calibration and Validation

The process of determining model components by comparing simulated parameters with observed data is known as hydrological model calibration [41]. For calibration, the most delicate hydrologic parameters were utilized, and their values were iteratively modified within acceptable upper and lower ranges until satisfactory concordance among measured and simulated streamflow was achieved [12,40]. In this research, calibration and validation were performed using monthly observed streamflow data for 27 years (1983–2009). To this end, the model was calibrated between 1986 and 1999 and validated between 2000 and 2009 using 3 years (1983–1985) of the model spin-up period at Muger watershed gauging stations (Muger, Sibilu, Gorfo, Gerbi, and Deneba).

2.6. Performance Evaluation

An evaluation of the model performance is required to investigate the modeling representation process to the real biophysical circumstances [42,43]. The SWAT model performance for the goodness-of-fit test was carried out according to Moriasi et al. [41]. The various indices utilized to assess the model performance between observed and simulated values were NSE, PBIAS, and R2. The NSE value ranges from −∞ to 1, with a higher value indicating the model’s good performance [38,41,44]. The percent bias (PBIAS) measures how much the observed variable is underestimated or overestimated [41,45]. The coefficient of determination (R2), which ranges between 0 and 1, assesses the consistency of simulated and observed data. Equations (1)–(3) were used to determine R2, NSE, PBIAS, and RSR, respectively. Table 6 shows the overall model performance ratings and their key attributes.
N S E = 1 i = 1 n ( Q o i Q s i ) 2 i = 1 n ( Q o i Q o ) 2
P B I A S = 100     i = 1 n ( Q o i Q s i ) i = 1 n Q o i
R 2 = i = 1 n ( Q s i Q s ) ( Q o i Q o ) 2 i = 1 n ( Q s i Q s ) 2 i = 1 n ( Q o i Q o ) 2
where Qsi is the simulated stream, Qoi: is the observed streamflow value, Q o is the average observed streamflow, Q s is the mean simulated streamflow.

2.7. Model Application

The simulated results were used to analyze the impacts of LC change on hydrologic parameters at the catchment and sub-catchment scales, as well as to analyze the contribution of changes within individual LC categories. Therefore, to analyze the effects of LC on the hydrological parameters of the Muger catchment, the SWAT model was calibrated and validated depending on each of the classified LC inputs (1986, 2003, and 2020) while maintaining the DEM, meteorological variables, and soil data constant. A number of studies have used this approach in various parts of the world [19,24,45,46,47].

3. Results and Discussions

3.1. Performance Evaluation of the Hydrological Model

3.1.1. Sensitivity Analysis

The analysis of sensitivity of the Muger watershed was assessed using the SWAT-CUP at five gauging stations (Muger, Sibilu, Gorfo, Gerbi, and Deneba). As shown in Table 7, the 16 most influential sensitive parameters for the watershed were identified and graded based on how sensitive they are, then prioritized in the calibration process. In order to obtain good concordance between simulated and observed streamflow at each gauging station, the hydrological component values were iteratively modified within the permitted limitations [37,38,39,48]. However, the remaining parameters vary among stations. As a result, most delicate hydrological components were utilized in the processes of model calibration and validation [49].

3.1.2. SWAT Model Calibration and Validation

Niraula et al. [50] suggested that the hydrological model needs to be calibrated before determining the effects of LC change. Five gauging stations were used in the Muger watershed to calibrate and validate the model. The model calibration was conducted for the measured years from 1986 to 1999 and validated using measured data from 2000 to 2009 using monthly data at each gauging station. A model spin-up period was considered to have occurred during the first three years of simulation (1983–1985).
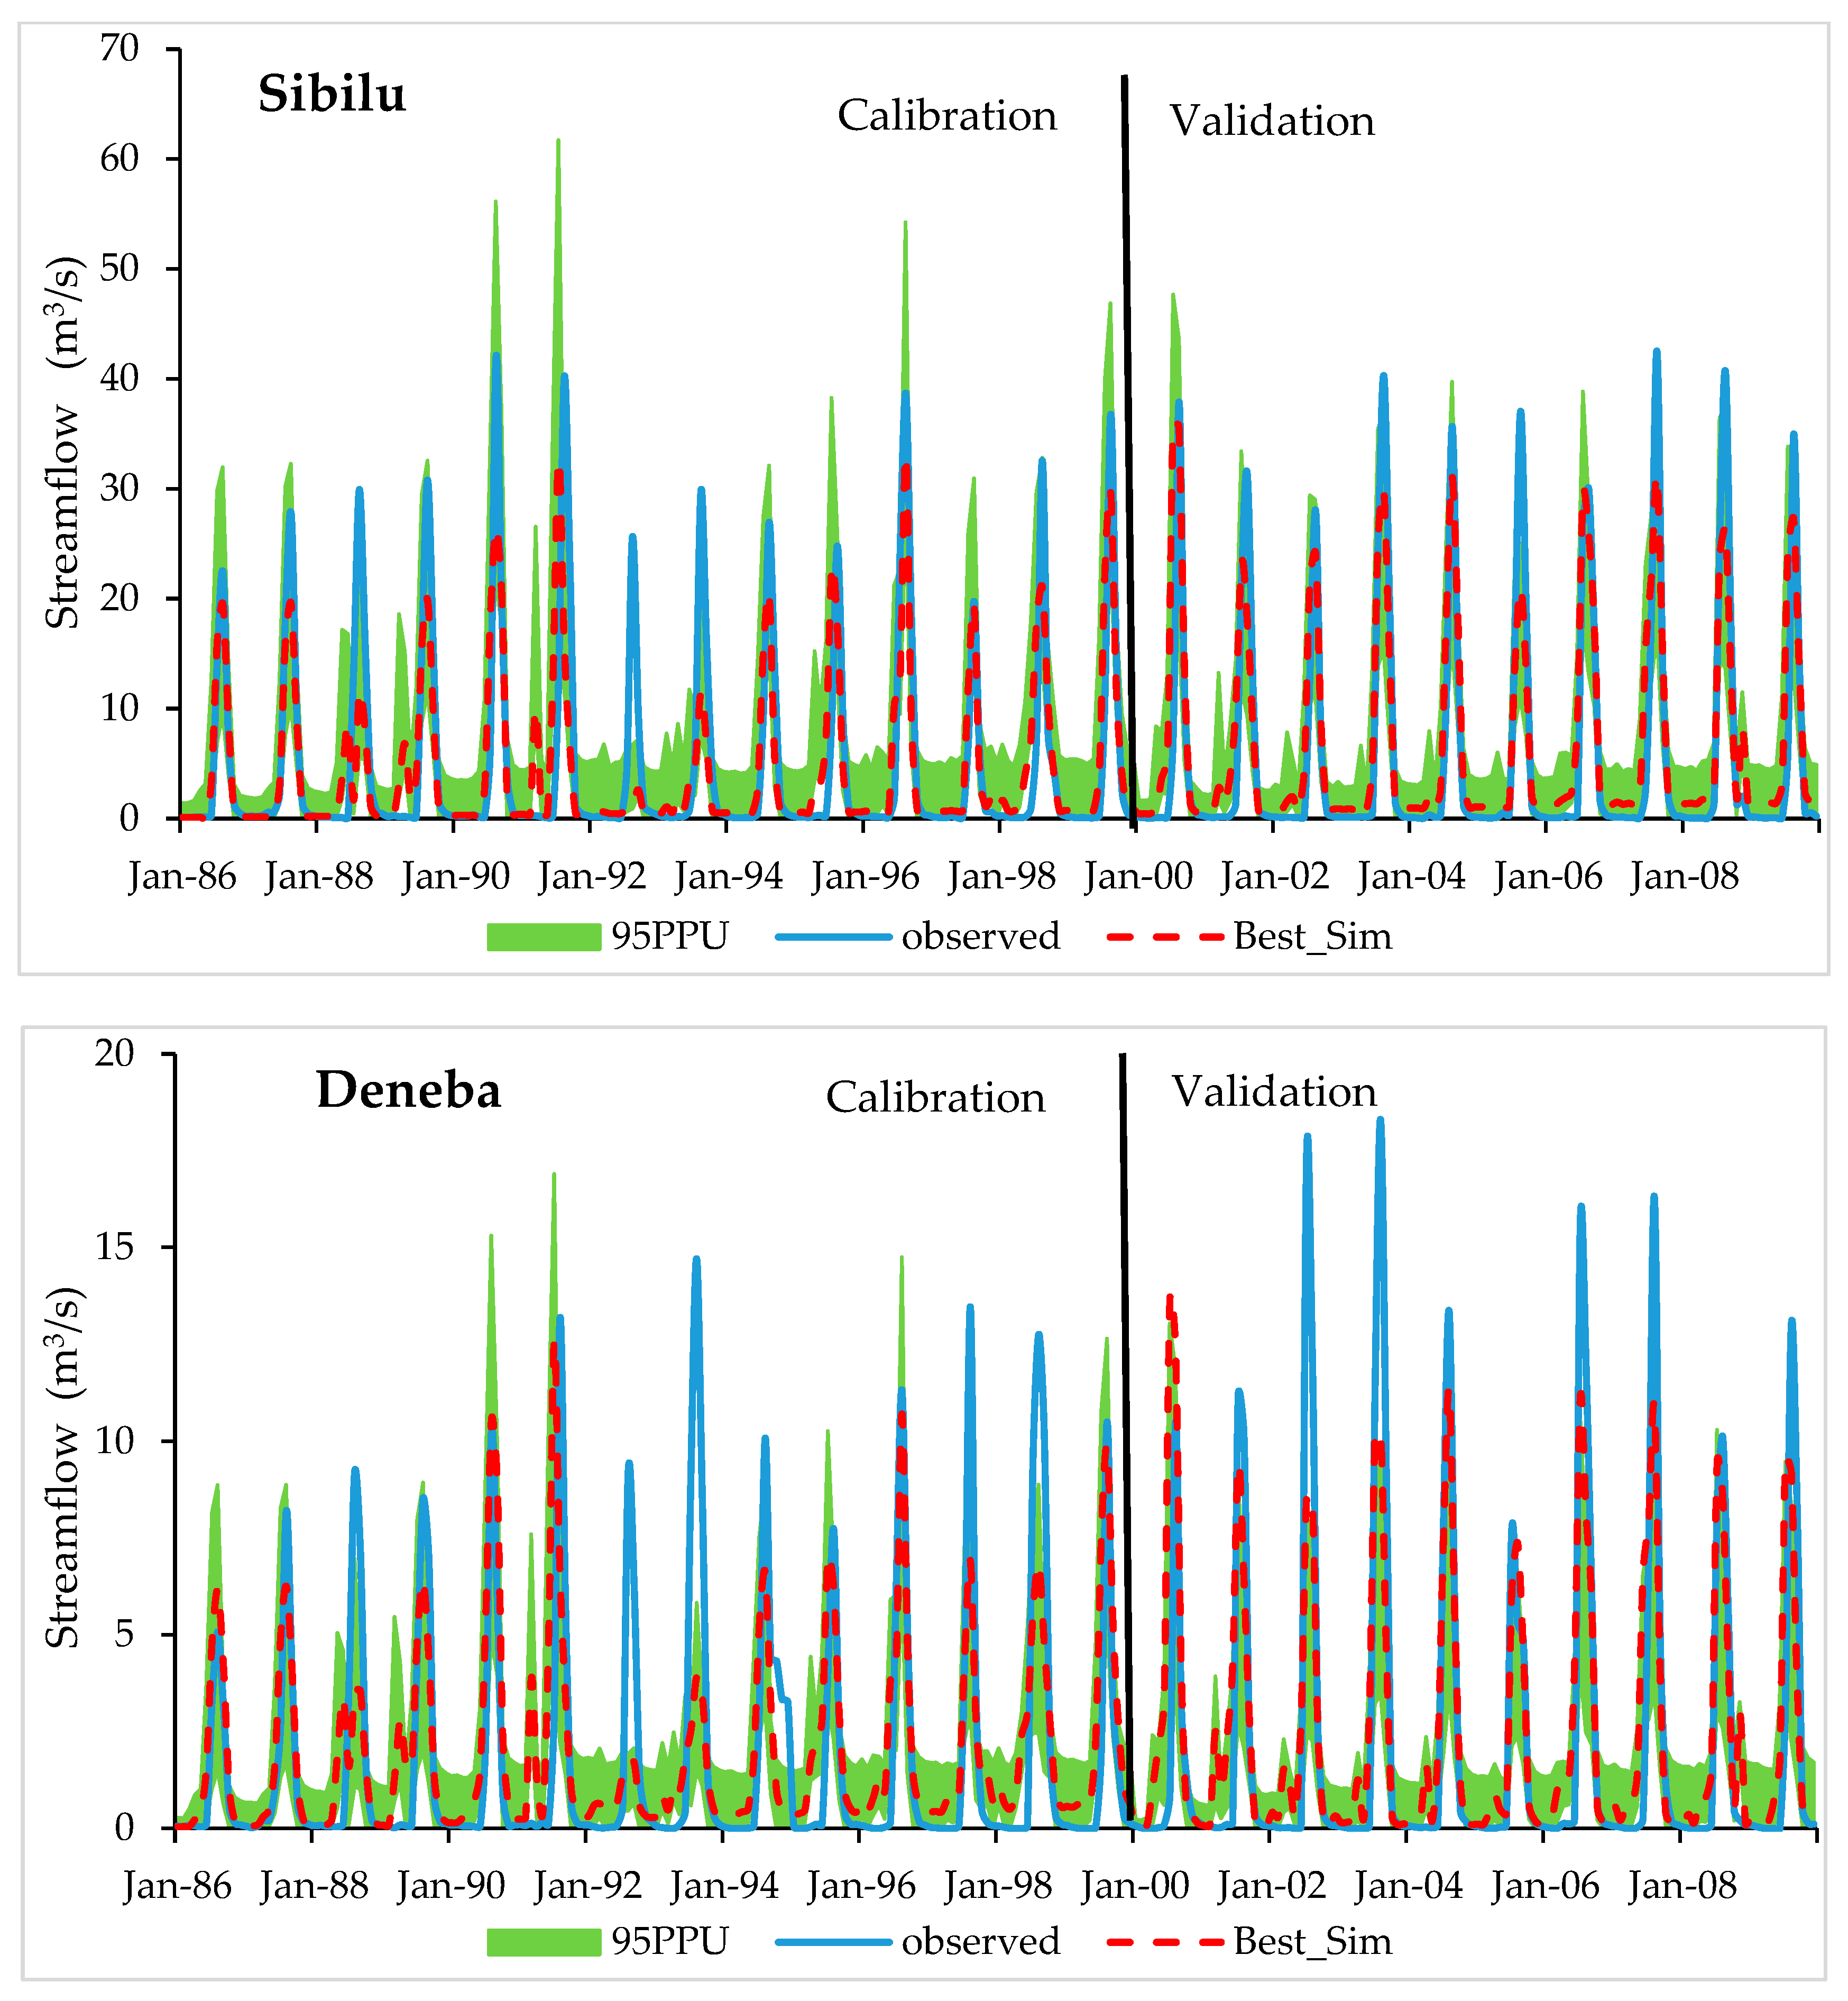
The statistical performance indicators presented in Table 8 demonstrate a good consistency between the simulated and observed streamflow data during the calibrated and validated periods [19,38,41,45]. A graphical comparison of the average monthly simulated and measured streamflow at all gauging stations revealed similar patterns (Figure 6).
The evaluation of the model during the calibration period showed that the SWAT model somewhat underestimated the mean streamflow at Sibilu station by 8.9%. On the other hand, the mean streamflow at Muger, Gorfo, Gerbi, and Deneba stations was overestimated by 4.5%, 20.3%, 13%, and 5.9%, respectively. The model slightly overestimated the mean streamflow at the Sibilu, Gorfo, and Gerbi stations, respectively, by 7.8%, 22.8%, and 17.7% during the validation period, while slightly underestimating it at the Muger and Deneba stations (Figure 6). This could be due to the input data quality, uncertainties, and a restriction of the SCS in the SWAT simulation because the model takes into account daily average rainfall depth rather than intensity and duration [48,51]. The sample size for streamflow data could contribute to the observed limitations in this study. Similarly, the SWAT model has the weakness of underestimating peak flow and sediment during extreme events.
The relative width of the 95PPU was slightly smaller, but it was still within the acceptable range predicted by the model [52]. The model performance is enough to simulate the streamflow in the Muger watershed, as evidenced by the simulated and observed hydrograph, which shows that the model successfully captured the trends of hydrological variations both during the validation and calibration phases. The simulation results revealed that during the calibration and validation stages, the SWAT model successfully replicated the observed streamflow in the investigated watersheds. These results were in line with earlier research conducted in the area [15].

3.2. Land Cover Change Impacts on Hydrological Parameters in the Watershed

The impact of LC change on the hydrological processes of the Muger catchment was evaluated using the LC classes of different periods. The effects of LC modification on the watershed’s hydrological parameters were simulated using the calibrated SWAT model while taking into account three alternative LC periods (i.e., 1986, 2003, and 2020). The impacts of LC modification on watershed hydrology were independently examined with LC change data while the remaining model calibration variables and other SWAT inputs remained constant. Therefore, LC was the sole factor considered responsible for the variations in hydrological parameters. According to the hydrological simulation results, changes in LC had a considerable effect on streamflow and hydrological parameters. The spatial and temporal effects of LC change on the hydrological components of the Muger catchment are presented in Table 9.
The simulation of monthly and seasonal hydrological parameters between 1986 and 2020, based on three historical LC change data, demonstrated great volatility. The mean annual surface runoff increased while groundwater recharge and water yield varied as a consequence of the variations in LC from 1986 to 2003 and from 1986 to 2020. The rate of change of hydrological components is depicted in Figure 7. Generally, the effects of the LC change were associated with the increase in the area of cropland together with a decline in vegetation cover. The results indicated that the expansion of cultivation land and the decline of forest cover from 1986 to 2003 were the key contributors to the increment in average annual surface runoff (Table 2 and Table 9). The amount of surface runoff changed from 319.91 mm in 1986 to 333.55 mm in 2003 as a consequence of the expansion of cultivated land and settlements and the decline in vegetation.
As the amount of cultivated land increases, soil infiltration capacity decreases due to the compaction of soil, which decreases lateral flow and increases surface runoff. In contrast, the surface runoff declined from 333.55 mm in 2003 to 321.61 mm in 2020 due to the gradual increment of shrubland as a result of the implementation of current soil conservation practices in the watershed. A decrease in lateral flow occurred during the 1986–2020 LC change, which caused a reduction in water yield despite an increase in surface runoff. This could be attributed to the poor infiltration of non-vegetated areas. Similar relationships between an increase in surface runoff and a commensurate decline in lateral flow were found by Baker and Miller [24]. In general, surface runoff increased by 4.09% in the first period (1986–2003) and decreased by 3.71% in the second period (2003–2020). Karamage et al. [22] found out that the increase in runoff could be caused by agricultural land expansion and urban sprawl at the expense of forest areas. Similar findings were presented by Teshome et al. [33], who found that soil loss occurs on cultivated steep slopes.
The ET increased gradually from 229.3 mm in 1986 to 229.8 mm in 2003. For the same time span, the increases in grassland and water bodies coincide with the increases in ET. Consequently, in 2020, the average annual ET was 230.6 mm. The reason for the slight increase in ET in the period 2003–2020 could be the improvement in shrubland cover as a result of area closure and regeneration practices of the watershed development and management initiatives put in place. The results of the land cover change analysis indicated that there was an increase in the area of shrubland from 2003 to 2020 (Table 2). This outcome is in line with a study conducted by Dias et al. [53], which found that watersheds with more vegetation tend to have higher ET. A high rate of ET was also reported by Leta et al. [8], which referred to it as the watershed’s largest water consumer. A continuous decline in lateral flow was detected in the watershed. Lateral flow decreased by 3.04%, 2.20%, and 5.31% for the LC change scenarios of 1986–2003, 2003–2020, and 1986–2020, respectively (Table 9).
In comparison to the LC baseline year (1986), the watershed’s average annual water yield increased in 2003 by 0.014% and decreased in 2020 by 0.05%. Similarly, the water yield gradually declined by 0.064% when the LC changed from 2003 to 2020. The annual average groundwater recharge declined by 1.50% between 1986 and 2003. However, in the second period, groundwater recharge increased by 2.01% as a result of the increase in shrubland in 2020 as compared to the 2003 LC (Table 2). In the first period, the annual streamflow of the watershed declined as urban area and cultivation land increased and forest cover, shrubland, and grassland declined. For all the change analysis periods, the watershed’s mean annual streamflow slightly decreased over time.
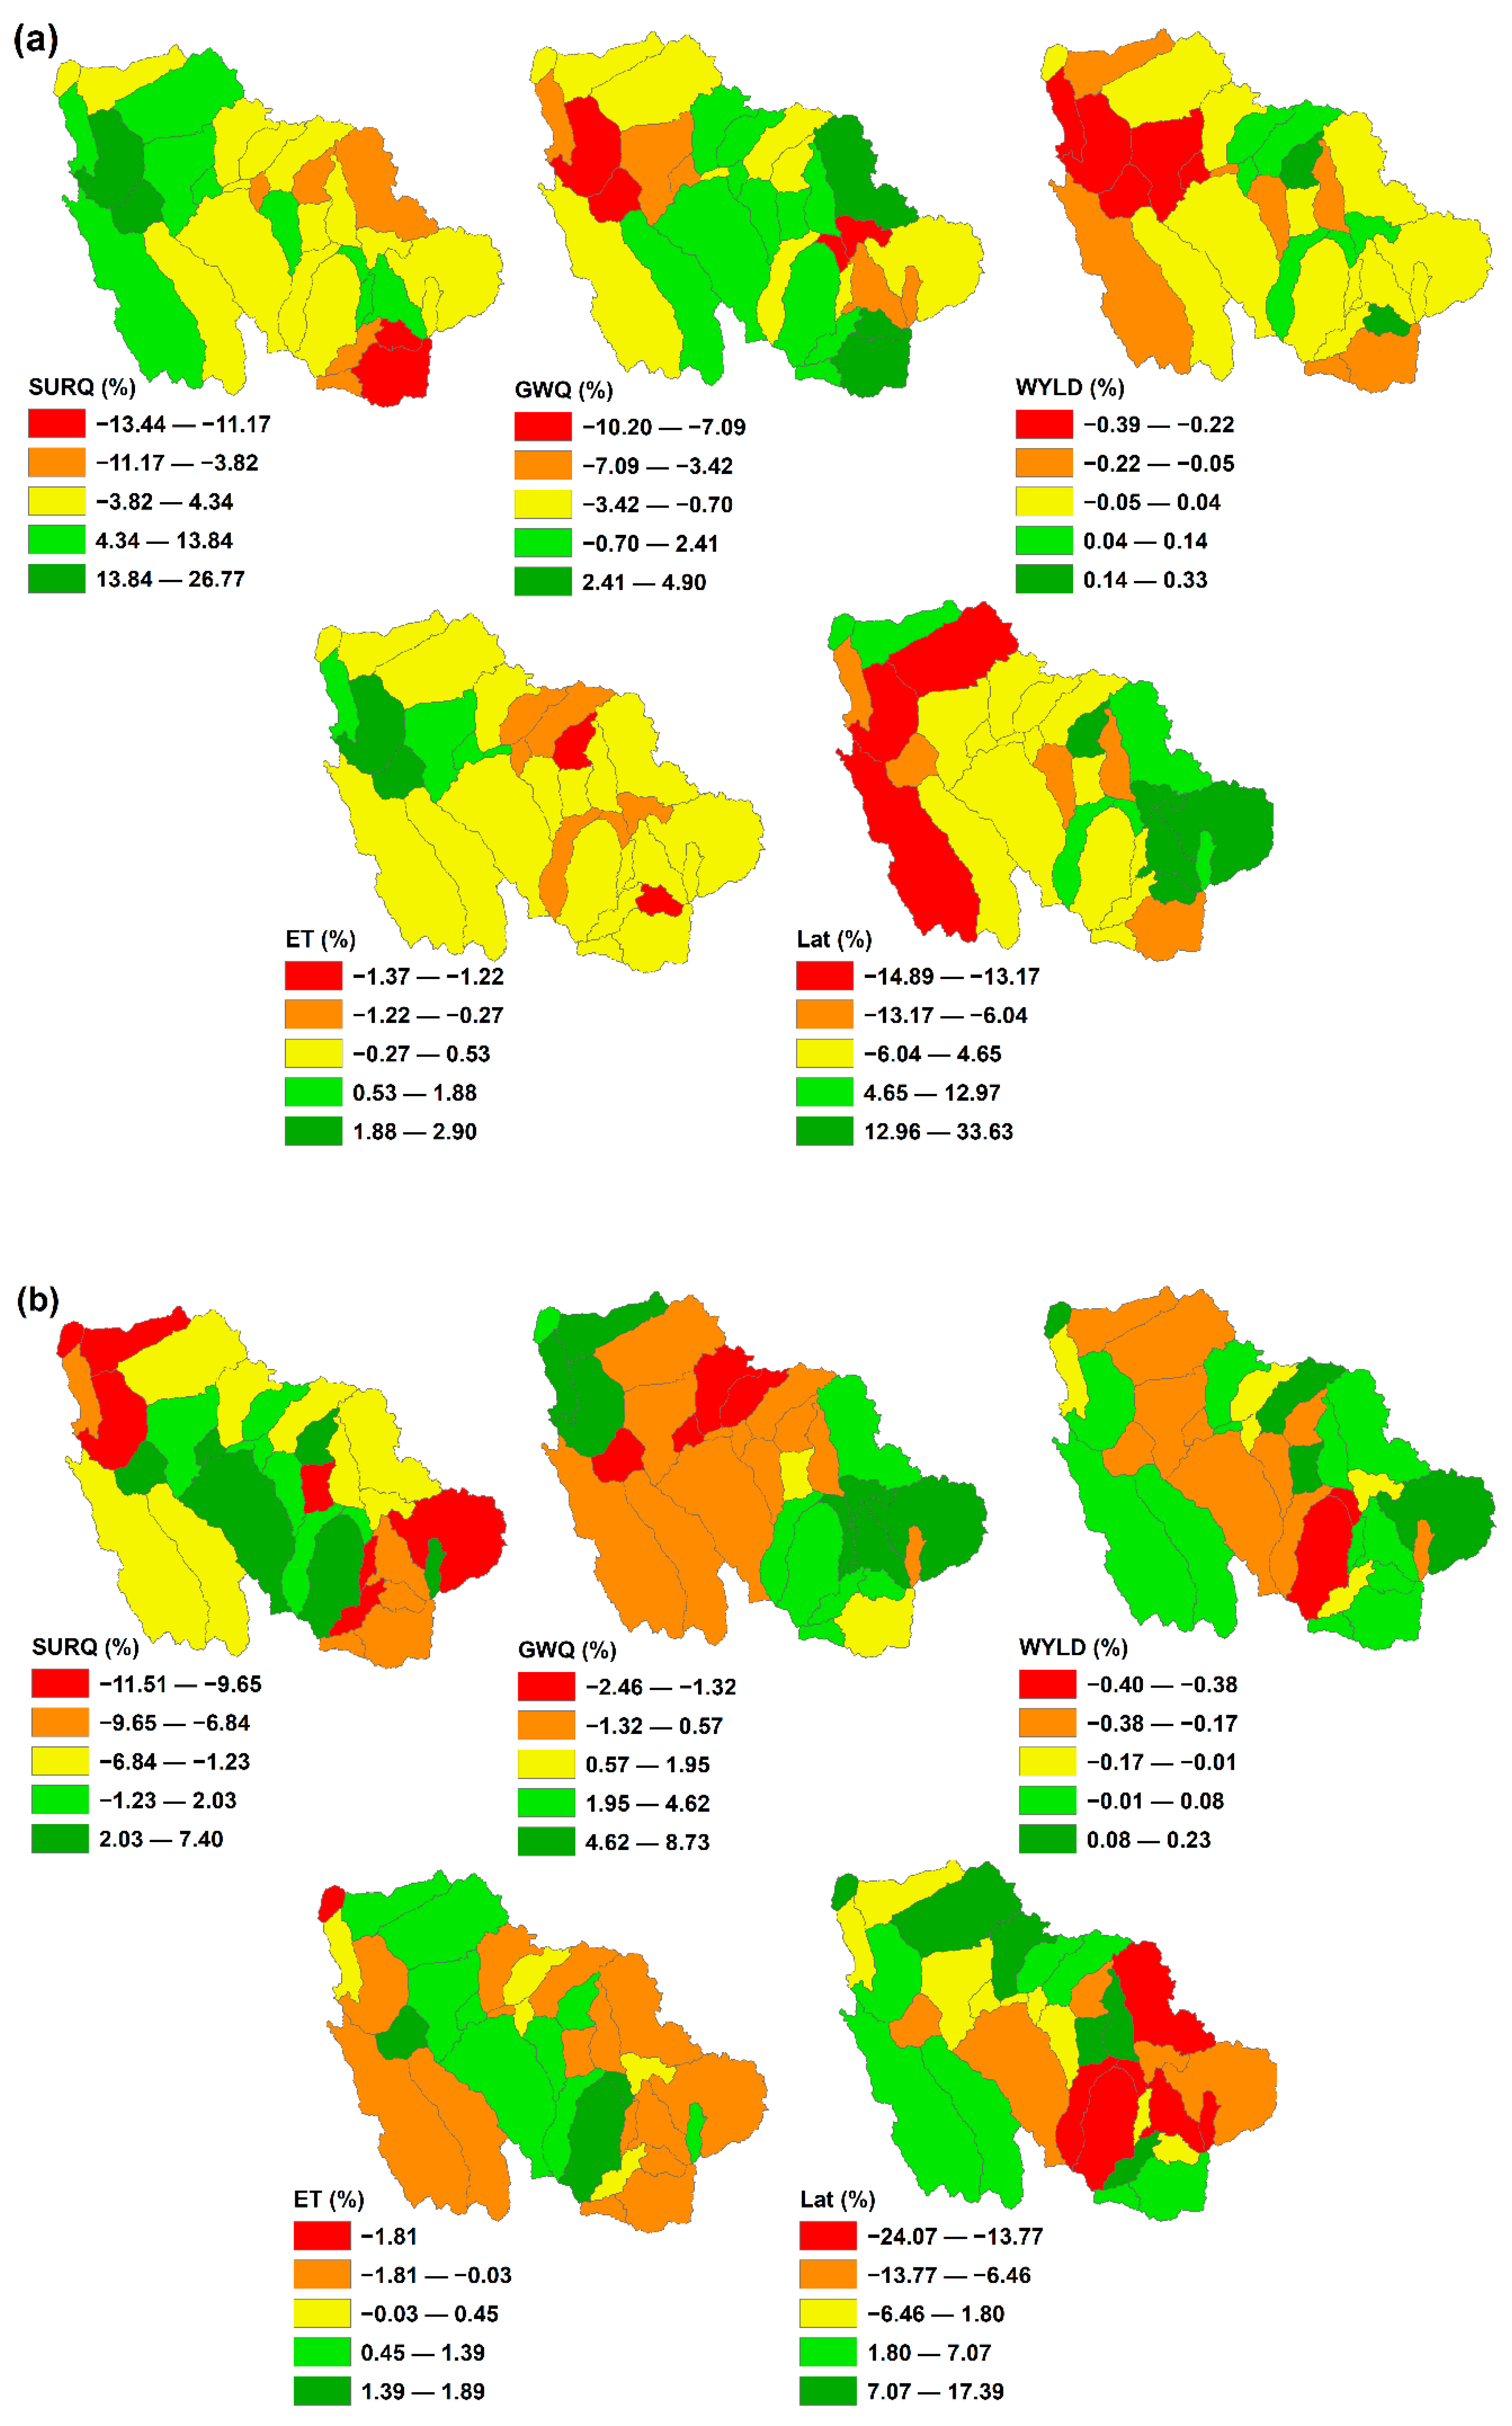
In addition, the hydrological components were simulated on a sub-basin scale to better comprehend the effect of LC changes. The spatial distribution of hydrological components by LC change from 1986 to 2020 is depicted in Figure 8a,b. The hydrological processes have different characteristics in each sub-watershed. The spatial distribution of increment in ET corresponds to areas that were identified as being covered by forest, grassland, water bodies, and shrubland. Similarly, sub-basins represented by cultivated land generate higher surface runoff. This is consistent with other research studies that indicated higher surface runoff and lower ET in cultivation areas [53,54].
As depicted in Figure 9, the impact of LC change on groundwater flow, surface runoff, lateral flow, water yield, and ET was assessed by comparing monthly mean values. Surface runoff increased from June to September from 1986 to 2020, but water yield increased from June to August and decreased for all other months. Similar conclusions were reached by other researchers [8,45,55]. Flooding may occur as a result of increased surface runoff during rainy seasons, and water scheme operations may be impacted by a decline during the dry season. However, from the graph, the LC change on average monthly water yield and ET was negligible. Similarly, the average monthly streamflow during the wet season decreased from 522.70 m3/s in 1986 to 522.05 m3/s in 2003 and to 521.33 m3/s in 2020. For the dry season (February–March), the mean monthly streamflow was 47.53 m3/s in 1986, 47.33 m3/s in 2003, and 47.31 m3/s in 2020.
The decline in vegetation cover and the increment in cultivation land and settlement decreased the dry season flow throughout the periods. The findings of this study concur with those of other investigations [26]. The alteration of forests to cultivation land from 1985 to 2011 increased the mean wet monthly flow while it decreased the mean dry monthly flow, according to a research finding in the Angereb watershed [23]. In the Quaternary catchment, South Africa, streamflow increased from 2004 to 2013 due to an increment in cultivation land and a decline in the grass and woodland areas (9.8%) [56]. In general, it is observed that groundwater and surface runoff are more sensitive to changes in LC than lateral flow.

4. Conclusions

This study examined the effects of LC change on hydrological components in the Muger watershed, UBNRB, Ethiopia, from 1986 to 2020. The study used the SWAT process-based hydrological model to identify the impacts of LC change on the hydrological processes of the watershed.
The effect of LC change on hydrological parameters was more highly pronounced at the sub-watershed scale than at the catchment level. The assessment of the impacts of LC change on the hydrologic processes was undertaken at the watershed and sub-watershed levels in order to identify the most severely impacted sections of the basin. The impacts of LC change on hydrological processes could be better studied if more uniform distribution of hydrological gauging stations were available.
The findings of the study demonstrated that from 1986 to 2020, ET increased, lateral flow decreased, and groundwater flow showed fluctuations. The LC change brought about more effects on surface runoff, groundwater, lateral flow, and ET, as indicated by the monthly and annual mean values. However, the impact of LC change is negligible on water yield, particularly when considering monthly average values. Due to its adverse impacts on surface runoff and water production, ET is a key factor in determining the availability of water. A slight change in ET brings about major changes in water availability. Therefore, future efforts should attempt to predict ET from different data types, including remotely sensed data.
The loss of forest directly affects the infiltration rate through an increment in surface runoff during the wet season and a decline during the dry season. The reduction in surface water could also have influenced the availability of water resources in the watershed and aggravated the downstream water shortage, especially between 2003 and 2020. As a result, managing and planning regional and local scale interventions in conservation strategies for water resources and land should be a priority. The findings of this study will be useful for policy-making and planning for the sustainable management of water resources and land in the Muger watershed. The findings from this study provide evidence for improving land and water resources management to ensure sustainable production and flow of water in the basin.
The methods used in this research have identified the impacts of LC change on hydrological parameters and are useful in predicting the hydrological repercussions of LC change in other basins. This approach has produced quantitative data that will help manage land and water resources effectively.

Author Contributions

Conceptualization, D.S.T. and S.Y.; methodology, D.S.T.; software, D.S.T. and A.M.; validation, D.S.T., M.K.L., H.T., A.M., T.T., G.T.A. and S.Y.; formal analysis, D.S.T.; investigation, D.S.T.; resources, D.S.T., M.K.L., H.T., A.M., T.T., G.T.A. and S.Y.; writing—original draft preparation, D.S.T.; writing—review and editing, D.S.T., M.K.L., H.T., A.M., T.T., G.T.A. and S.Y.; supervision, S.Y.; funding acquisition, S.Y. All authors have read and agreed to the published version of the manuscript.

Funding

This work was supported by the Ministry of Science and Technology (MOST) of China (grant number: 2017YFD0300400).

Data Availability Statement

The data used in this study can be made available by the authors on reasonable request.

Acknowledgments

The authors acknowledge the Ministry of Science and Technology (MOST) of China for financial support. The authors express their gratitude to the Ethiopian National Meteorological Service Agency and the Ministry of Water, Irrigation, and Energy for providing meteorological and hydrological data. Gebiaw T. Ayele acknowledges Griffith Graduate Research School, the Australian Rivers Institute and School of Engineering, Griffith University, Queensland, Australia.

Conflicts of Interest

The authors declare that there are no conflict of interest regarding the publication of this paper.

References

  1. Hyandye, C.B.; Worqul, A.; Martz, L.W.; Muzuka, A.N. The impact of future climate and land use/cover change on water resources in the Ndembera watershed and their mitigation and adaptation strategies. Environ. Syst. Res. 2018, 7, 1–24. [Google Scholar] [CrossRef] [Green Version]
  2. Gashaw, T.; Tulu, T.; Argaw, M.; Worqlul, A.W. Modeling the hydrological impacts of land use/land cover changes in the Andassa watershed, Blue Nile Basin, Ethiopia. Sci. Total Environ. 2018, 619, 1394–1408. [Google Scholar] [CrossRef]
  3. Marhaento, H.; Booij, M.J.; Rientjes, T.; Hoekstra, A.Y. Attribution of changes in the water balance of a tropical catchment to land use change using the SWAT model. Hydrol. Process. 2017, 31, 2029–2040. [Google Scholar] [CrossRef]
  4. Warburton, M.L.; Schulze, R.E.; Jewitt, G.P. Hydrological impacts of land use change in three diverse South African catchments. J. Hydrol. 2012, 414, 118–135. [Google Scholar] [CrossRef]
  5. Khare, D.; Patra, D.; Mondal, A.; Kundu, S. Impact of landuse/land cover change on run-off in the catchment of a hydro power project. Appl. Water Sci. 2017, 7, 787–800. [Google Scholar] [CrossRef]
  6. Maetens, W.; Vanmaercke, M.; Poesen, J.; Jankauskas, B.; Jankauskiene, G.; Ionita, I. Effects of land use on annual runoff and soil loss in Europe and the Mediterranean: A meta-analysis of plot data. Prog. Phys. Geogr. 2012, 36, 599–653. [Google Scholar] [CrossRef]
  7. Minta, M.; Kibret, K.; Thorne, P.; Nigussie, T.; Nigatu, L. Land use and land cover dynamics in Dendi-Jeldu hilly-mountainous areas in the central Ethiopian highlands. Geoderma 2018, 314, 27–36. [Google Scholar] [CrossRef]
  8. Leta, M.K.; Demissie, T.A.; Tränckner, J. Hydrological responses of watershed to historical and future land use land cover change dynamics of nashe watershed, ethiopia. Water 2021, 13, 2372. [Google Scholar] [CrossRef]
  9. Zhou, F.; Xu, Y.; Chen, Y.; Xu, C.-Y.; Gao, Y.; Du, J. Hydrological response to urbanization at different spatio-temporal scales simulated by coupling of CLUE-S and the SWAT model in the Yangtze River Delta region. J. Hydrol. 2013, 485, 113–125. [Google Scholar] [CrossRef]
  10. Tegegne, G.; Par, D.; Kim, Y. Comparison of hydrological models for the assessment of water resources in a data-scarce region, the Upper Blue Nile River Basin. J. Hydrol. Reg. Stud. 2017, 14, 49–66. [Google Scholar] [CrossRef]
  11. Waseem, M.; Kachholz, F.; Traenckner, J. Suitability of common models to estimate hydrology and diffuse water pollution in North-eastern German lowland catchments with intensive agricultural land use. Front. Agric. Sci. Eng. 2018, 5, 420–431. [Google Scholar] [CrossRef] [Green Version]
  12. Arnold, J.G.; Moriasi, D.N.; Gassman, P.W.; Abbaspour, K.C.; White, M.J.; Srinivasan, R.; Santhi, C.; Harmel, R.; Van Griensven, A.; Van Liew, M.W. SWAT: Model use, calibration, and validation. Trans. ASABE 2012, 55, 1491–1508. [Google Scholar] [CrossRef]
  13. Gassman, P.W.; Sadeghi, A.M.; Srinivasan, R. Applications of the SWAT model special section: Overview and insights. J. Environ. Qual. 2014, 43, 1–8. [Google Scholar] [CrossRef]
  14. Merga, D.D.; Adeba, D.; Regasa, M.S.; Leta, M.K. Evaluation of surface water resource availability under the impact of climate change in the Dhidhessa Sub-Basin, Ethiopia. Atmosphere 2022, 13, 1296. [Google Scholar] [CrossRef]
  15. Dile, Y.T.; Daggupati, P.; George, C.; Srinivasan, R.; Arnold, J. Introducing a new open source GIS user interface for the SWAT model. Environ. Model. Softw. 2016, 85, 129–138. [Google Scholar] [CrossRef]
  16. Fentaw, F.; Mekuria, B.; Arega, A. Impacts of climate change on the water resources of Guder Catchment, Upper Blue Nile, Ethiopia. Waters 2018, 1, 16. [Google Scholar] [CrossRef]
  17. Santos, R.M.B.; Sanches Fernandes, L.F.; Vitor Cortes, R.M.; Leal Pacheco, F.A. Hydrologic impacts of land use changes in the Sabor River Basin: A historical view and future perspectives. Water 2019, 11, 1464. [Google Scholar] [CrossRef] [Green Version]
  18. Mekonnen, D.F.; Duan, Z.; Rientjes, T.; Disse, M. Analysis of combined and isolated effects of land-use and land-cover changes and climate change on the upper Blue Nile River basin’s streamflow. Hydrol. Earth Syst. Sci. 2018, 22, 6187–6207. [Google Scholar] [CrossRef] [Green Version]
  19. Woldesenbet, T.A.; Elagib, N.A.; Ribbe, L.; Heinrich, J. Hydrological responses to land use/cover changes in the source region of the Upper Blue Nile Basin, Ethiopia. Sci. Total Environ. 2017, 575, 724–741. [Google Scholar] [CrossRef]
  20. Megersa, K.; Tamene, A.; Sifan, A. Impacts of land use land cover change on sediment yield and stream flow. Int. J. Sci. Technol. 2017, 6, 763–781. [Google Scholar]
  21. Galata, A.; Demissei, T.; Leta, M. Watershed hydrological responses to changes in land use and land cover at Hangar Watershed, Ethiopia. Iran. (Iran.) J. Energy Environ. 2020, 11, 1–7. [Google Scholar]
  22. Karamage, F.; Zhang, C.; Fang, X.; Liu, T.; Ndayisaba, F.; Nahayo, L.; Kayiranga, A.; Nsengiyumva, J.B. Modeling rainfall-runoff response to land use and land cover change in Rwanda (1990–2016). Water 2017, 9, 147. [Google Scholar] [CrossRef] [Green Version]
  23. Getachew, H.E.; Melesse, A.M. The impact of land use change on the hydrology of the Angereb Watershed, Ethiopia. Int. J. Water Sci. 2012, 1, 1–7. [Google Scholar] [CrossRef]
  24. Baker, T.J.; Miller, S.N. Using the Soil and Water Assessment Tool (SWAT) to assess land use impact on water resources in an East African watershed. J. Hydrol. 2013, 486, 100–111. [Google Scholar] [CrossRef]
  25. Hishe, S.; Bewket, W.; Nyssen, J.; Lyimo, J. Analysing past land use land cover change and CA-Markov-based future modelling in the Middle Suluh Valley, Northern Ethiopia. Geocarto Int. 2020, 35, 225–255. [Google Scholar] [CrossRef]
  26. Kidane, M.; Tolessa, T.; Bezie, A.; Kessete, N.; Endrias, M. Evaluating the impacts of climate and land use/land cover (LU/LC) dynamics on the Hydrological Responses of the Upper Blue Nile in the Central Highlands of Ethiopia. Spat. Inf. Res. 2019, 27, 151–167. [Google Scholar] [CrossRef]
  27. Gebrehiwot, S.G.; Bewket, W.; Gärdenäs, A.I.; Bishop, K. Forest cover change over four decades in the Blue Nile Basin, Ethiopia: Comparison of three watersheds. Reg. Environ. Chang. 2014, 14, 253–266. [Google Scholar] [CrossRef]
  28. Leta, M.K.; Demissie, T.A.; Tränckner, J. Modeling and prediction of land use land cover change dynamics based on land change modeler (Lcm) in nashe watershed, upper blue nile basin, Ethiopia. Sustainability 2021, 13, 3740. [Google Scholar] [CrossRef]
  29. Regasa, M.S.; Nones, M. Past and Future Land Use/Land Cover Changes in the Ethiopian Fincha Sub-Basin. Land 2022, 11, 1239. [Google Scholar] [CrossRef]
  30. Denekew, A.; Bekele, S. Characterization and Atlas of the Blue Nile Basin and Its Sub-Basins; International Water Management Institute: Addis Ababa, Ethiopia, 2009. [Google Scholar]
  31. Amare, A.; Simane, B. Climate change induced vulnerability of smallholder farmers: Agroecology-based analysis in the Muger sub-basin of the upper Blue-Nile basin of Ethiopia. Am. J. Clim. Change 2017, 6, 668–693. [Google Scholar] [CrossRef] [Green Version]
  32. Teshome, D.S.; Taddese, H.; Tolessa, T.; Kidane, M.; You, S. Drivers and Implications of Land Cover Dynamics in Muger Sub-Basin, Abay Basin, Ethiopia. Sustainability 2022, 14, 11241. [Google Scholar] [CrossRef]
  33. Teshome, D.S.; Moisa, M.B.; Gemeda, D.O.; You, S. Effect of Land Use-Land Cover Change on Soil Erosion and Sediment Yield in Muger Sub-Basin, Upper Blue Nile Basin, Ethiopia. Land 2022, 11, 2173. [Google Scholar] [CrossRef]
  34. Ali, M.G.; Ali, S.; Arshad, R.H.; Nazeer, A.; Waqas, M.M.; Waseem, M.; Aslam, R.A.; Cheema, M.J.M.; Leta, M.K.; Shauket, I. Estimation of potential soil erosion and sediment yield: A case study of the transboundary Chenab River Catchment. Water 2021, 13, 3647. [Google Scholar] [CrossRef]
  35. Neitsch, S.L.; Arnold, J.G.; Kiniry, J.R.; Williams, J.R. Soil and Water Assessment Tool Theoretical Documentation Version 2009; Texas United State Water Resources Institute: College Station, TX, USA, 2011. [Google Scholar]
  36. Abe, C.A.; Lobo, F.d.L.; Dibike, Y.B.; Costa, M.P.d.F.; Dos Santos, V.; Novo, E.M.L. Modelling the effects of historical and future land cover changes on the hydrology of an Amazonian basin. Water 2018, 10, 932. [Google Scholar] [CrossRef] [Green Version]
  37. Narsimlu, B.; Gosain, A.K.; Chahar, B.R.; Singh, S.K.; Srivastava, P.K. SWAT model calibration and uncertainty analysis for streamflow prediction in the Kunwari River Basin, India, using sequential uncertainty fitting. Environ. Process. 2015, 2, 79–95. [Google Scholar] [CrossRef]
  38. Chaibou Begou, J.; Jomaa, S.; Benabdallah, S.; Bazie, P.; Afouda, A.; Rode, M. Multi-site validation of the SWAT model on the Bani catchment: Model performance and predictive uncertainty. Water 2016, 8, 178. [Google Scholar] [CrossRef]
  39. Khalid, K.; Ali, M.F.; Abd Rahman, N.F.; Mispan, M.R.; Haron, S.H.; Othman, Z.; Bachok, M.F. Sensitivity analysis in watershed model using SUFI-2 algorithm. Procedia Eng. 2016, 162, 441–447. [Google Scholar] [CrossRef] [Green Version]
  40. Vilaysane, B.; Takara, K.; Luo, P.; Akkharath, I.; Duan, W. Hydrological stream flow modelling for calibration and uncertainty analysis using SWAT model in the Xedone river basin, Lao PDR. Procedia Environ. Sci. 2015, 28, 380–390. [Google Scholar] [CrossRef] [Green Version]
  41. Moriasi, D.N.; Arnold, J.G.; Van Liew, M.W.; Bingner, R.L.; Harmel, R.D.; Veith, T.L. Model evaluation guidelines for systematic quantification of accuracy in watershed simulations. Trans. ASABE 2007, 50, 885–900. [Google Scholar]
  42. Moriasi, D.N.; Gitau, M.W.; Pai, N.; Daggupati, P. Hydrologic and water quality models: Performance measures and evaluation criteria. Trans. ASABE 2015, 58, 1763–1785. [Google Scholar]
  43. Sao, D.; Kato, T.; Tu, L.H.; Thouk, P.; Fitriyah, A.; Oeurng, C. Evaluation of different objective functions used in the sufi-2 calibration process of swat-cup on water balance analysis: A case study of the Pursat river basin, Cambodia. Water 2020, 12, 2901. [Google Scholar] [CrossRef]
  44. Abbaspour, K. The fallacy in the use of the “best-fit” solution in hydrologic modeling. Sci. Total Environ. 2022, 802, 149713. [Google Scholar] [CrossRef]
  45. Gyamfi, C.; Ndambuki, J.M.; Salim, R.W. Hydrological responses to land use/cover changes in the Olifants Basin, South Africa. Water 2016, 8, 588. [Google Scholar] [CrossRef] [Green Version]
  46. Yan, B.; Fang, N.; Zhang, P.; Shi, Z. Impacts of land use change on watershed streamflow and sediment yield: An assessment using hydrologic modelling and partial least squares regression. J. Hydrol. 2013, 484, 26–37. [Google Scholar] [CrossRef]
  47. Tankpa, V.; Wang, L.; Awotwi, A.; Singh, L.; Thapa, S.; Atanga, R.A.; Guo, X. Modeling the effects of historical and future land use/land cover change dynamics on the hydrological response of Ashi watershed, northeastern China. Environ. Dev. Sustain. 2021, 23, 7883–7912. [Google Scholar] [CrossRef]
  48. Abbaspour, K.C. SWAT-CUP: SWAT Calibration and Uncertainty Programs—A User Manual; Eawag: Dübendorf, Switzerland, 2015; pp. 16–70. [Google Scholar]
  49. Leta, M.K.; Ebsa, D.G.; Regasa, M.S. Parameter Uncertainty Analysis for Streamflow Simulation Using SWAT Model in Nashe Watershed, Blue Nile River Basin, Ethiopia. Appl. Environ. Soil Sci. 2022, 2022, 1826942. [Google Scholar] [CrossRef]
  50. Niraula, R.; Meixner, T.; Norman, L.M. Determining the importance of model calibration for forecasting absolute/relative changes in streamflow from LULC and climate changes. J. Hydrol. 2015, 522, 439–451. [Google Scholar] [CrossRef]
  51. Nie, W.; Yuan, Y.; Kepner, W.; Nash, M.S.; Jackson, M.; Erickson, C. Assessing impacts of Landuse and Landcover changes on hydrology for the upper San Pedro watershed. J. Hydrol. 2011, 407, 105–114. [Google Scholar] [CrossRef]
  52. Abbaspour, K.C.; Vaghefi, S.A.; Srinivasan, R. A guideline for successful calibration and uncertainty analysis for soil and water assessment: A review of papers from the 2016 international SWAT conference. Water 2017, 10, 6. [Google Scholar] [CrossRef] [Green Version]
  53. Dias, L.C.P.; Macedo, M.N.; Costa, M.H.; Coe, M.T.; Neill, C. Effects of land cover change on evapotranspiration and streamflow of small catchments in the Upper Xingu River Basin, Central Brazil. J. Hydrol. Reg. Stud. 2015, 4, 108–122. [Google Scholar] [CrossRef] [Green Version]
  54. Panday, P.K.; Coe, M.T.; Macedo, M.N.; Lefebvre, P.; de Almeida Castanho, A.D. Deforestation offsets water balance changes due to climate variability in the Xingu River in eastern Amazonia. J. Hydrol. 2015, 523, 822–829. [Google Scholar] [CrossRef]
  55. Gebremicael, T.; Mohamed, Y.; Betrie, G.; Van der Zaag, P.; Teferi, E. Trend analysis of runoff and sediment fluxes in the Upper Blue Nile basin: A combined analysis of statistical tests, physically-based models and landuse maps. J. Hydrol. 2013, 482, 57–68. [Google Scholar] [CrossRef]
  56. Gwate, O.; Woyessa, Y.E.; Wiberg, D. Dynamics of land cover and impact on streamflow in the Modder River Basin of South Africa: Case study of a Quaternary catchment. Int. J. Environ. Prot. Policy 2015, 3, 31–38. [Google Scholar]
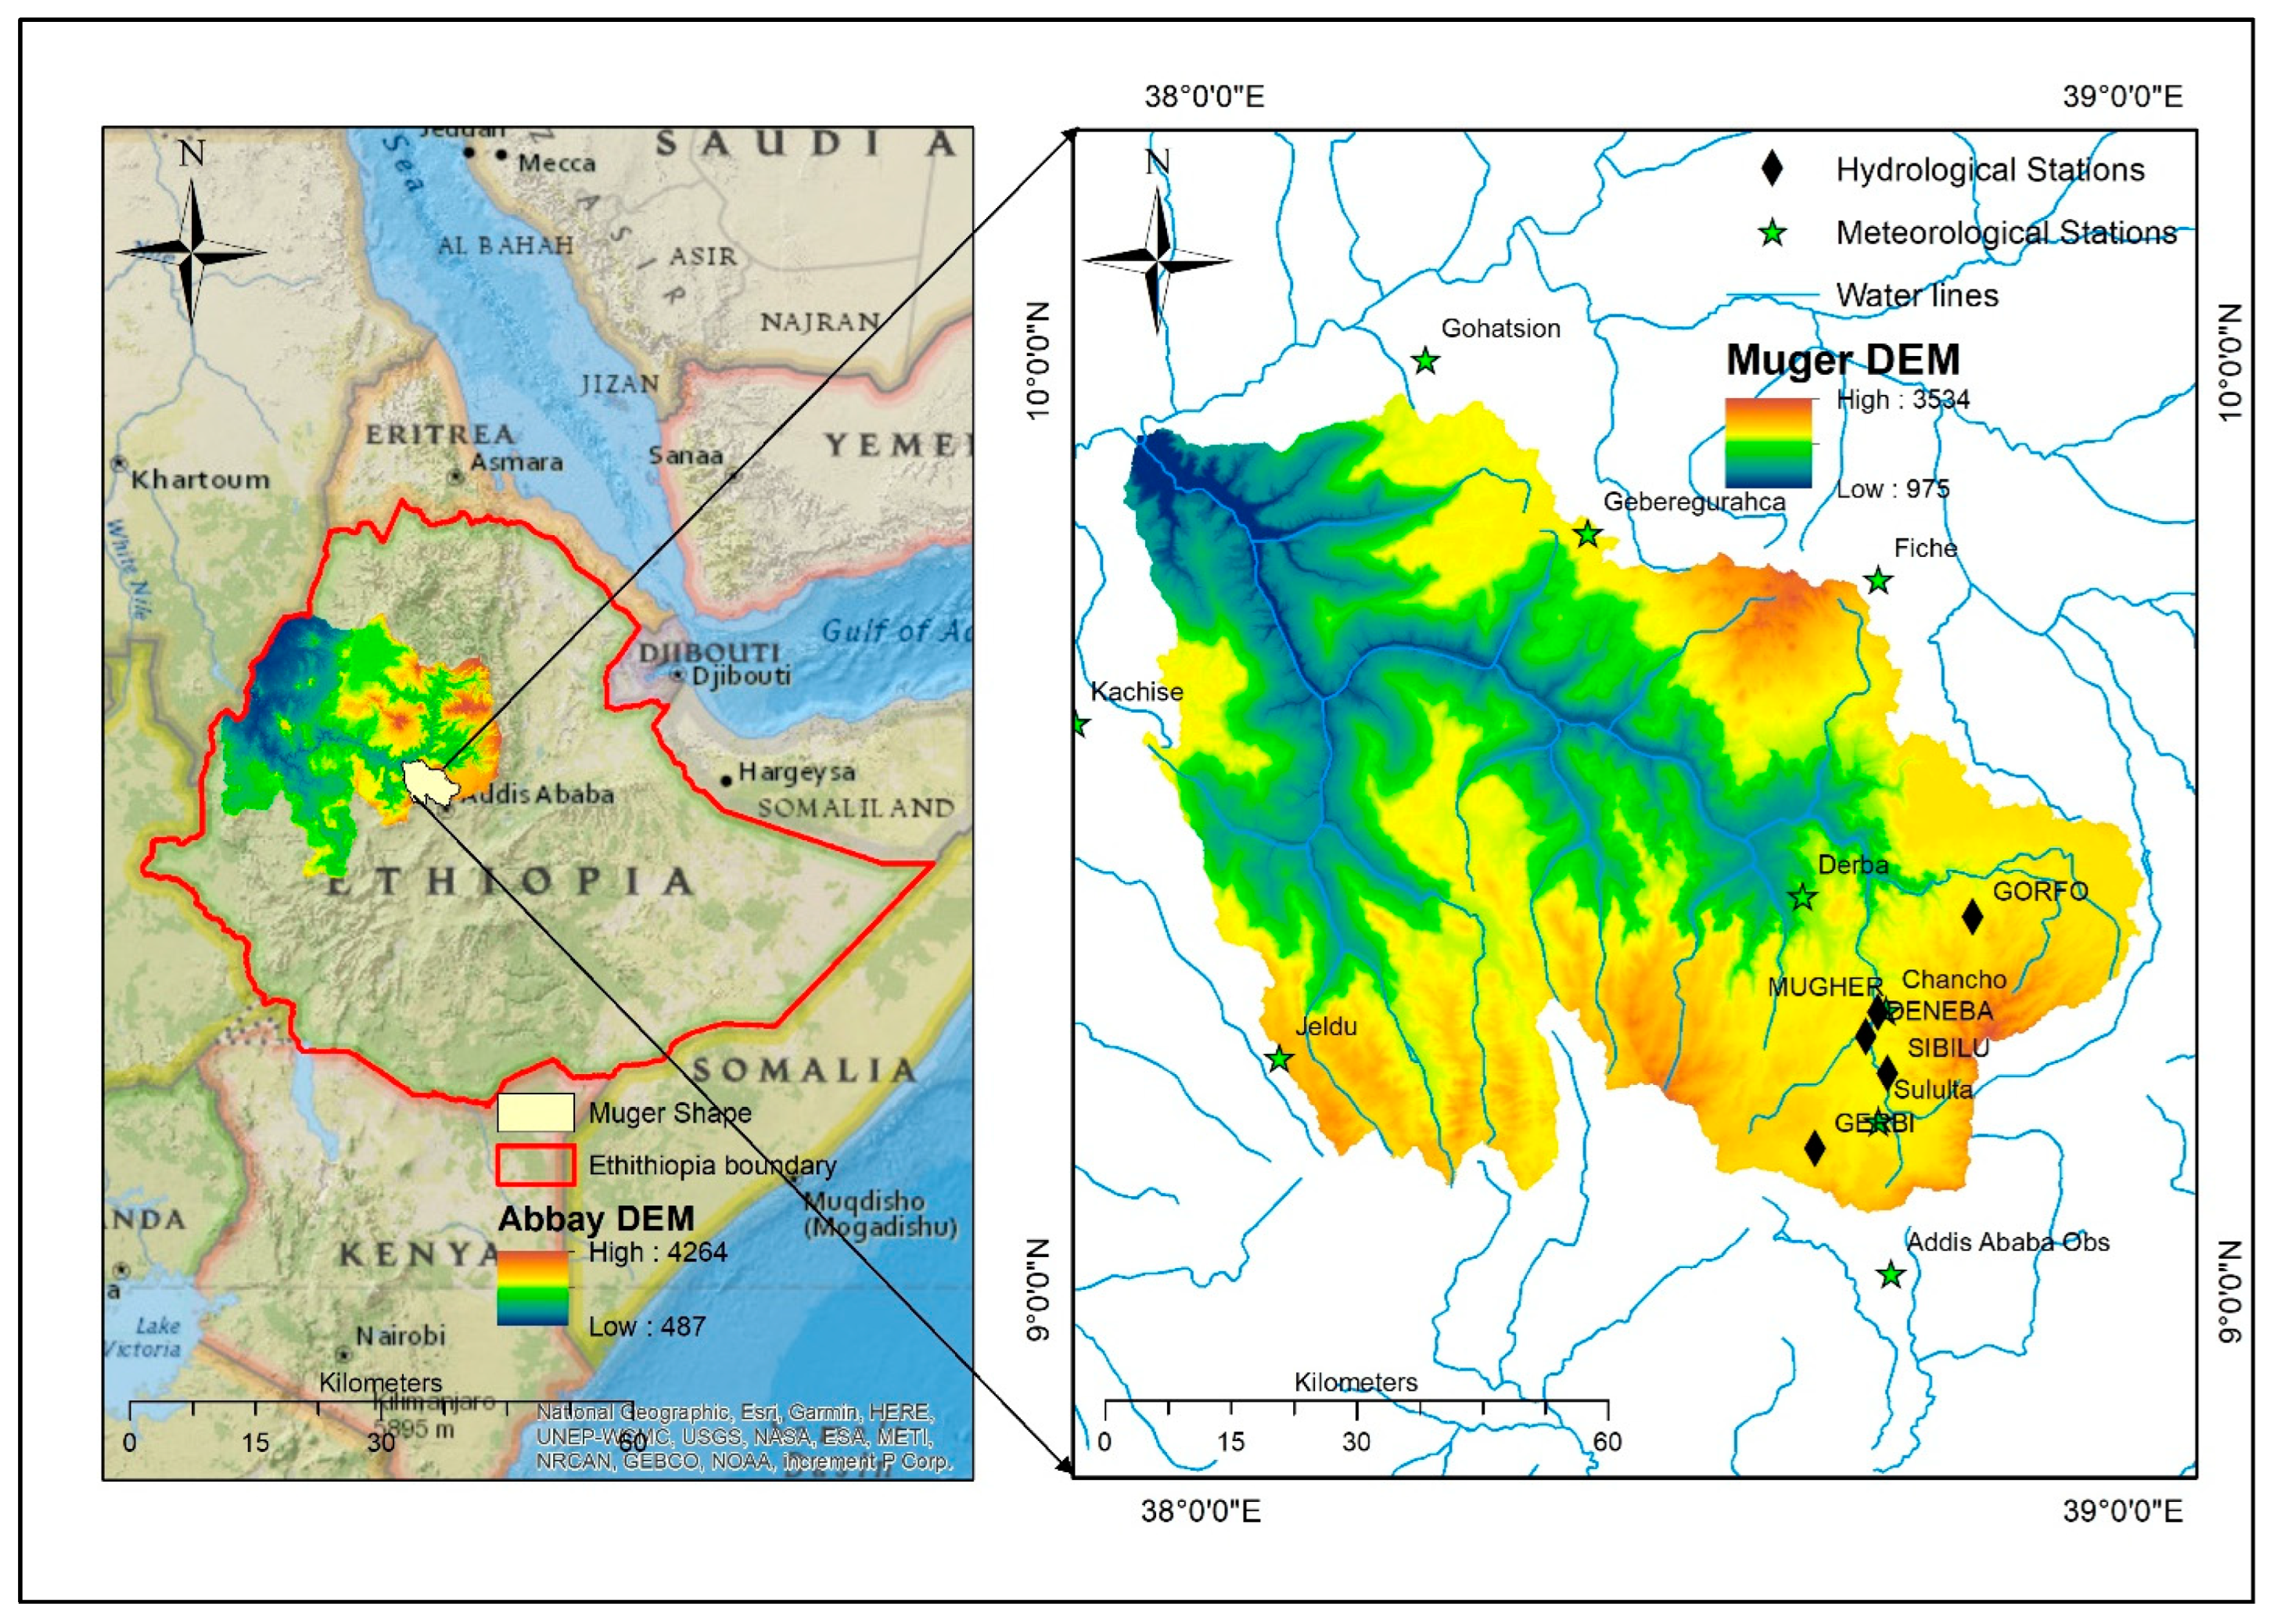
Figure 1. Location of the Muger catchment.
Water 15 02533 g001
Figure 2. Spatial patterns of slope of the Muger watershed.
Water 15 02533 g002
Figure 3. Land cover of the study watershed.
Water 15 02533 g003
Figure 4. Soil types of the Muger watershed.
Water 15 02533 g004
Figure 5. General conceptual methodology used for assessing the effect of LC change on hydrology in the Muger watershed.
Water 15 02533 g005
Figure 6. Average monthly streamflow for Calibration and Validation.
Water 15 02533 g006aWater 15 02533 g006b
Figure 7. Rate of change of parameter values of the hydrological components across temporal intervals.
Water 15 02533 g007
Figure 8. The spatial patterns of changes in hydrological parameters at the watershed level during the study periods (a) 1986–2003 and (b) 2003–2020.
Water 15 02533 g008
Figure 9. Average monthly change of hydrological components of LC of the Muger catchment.
Water 15 02533 g009
Table 1. Slope classes of the Muger catchment.
Slope (%)Area Coverage (km2)% of Area Coverage
0–51203.1716.6
5–101401.5919.34
10–151044.0314.41
15–302353.2932.48
>301243.9217.17
Table 2. Land cover changes of the study watershed across 1986, 2003, and 2020.
LC Type198620032020Rate of Change (%)
Area (km2)Area (%)Area (km2)Area (%)Area (km2)Area (%)1986–20032003–2020
Bare soil84.231.1663.930.8838.230.53−31.74−67.25
Cultivation5007.3069.105210.2971.915135.8370.883.90−1.45
Forest775.1910.70661.889.14370.785.12−17.12−78.51
Grass covered114.621.58252.903.4933.070.4654.68−64.85
Settlement2.250.0350.790.70112.781.5695.5754.97
Shrubland1093.9915.10884.4812.211496.8620.66−23.6940.91
Waterbody168.422.32121.721.6858.470.81−39.5114.20
Total7246.00100.007246.00100.007246.00100.00
Table 3. Soil types of the study area and their area coverage.
Soil TypesArea (km2)Area Proportion (%)
Chromic Luvisols588.888.13
Eutric Cambisols14.780.20
Eutric Vertisols1231.9317.00
Haplic Luvisols304.694.20
Haplic Nitisols184.742.55
Humic Nitisols1071.7114.79
Lithic Leptosols158.962.19
Rendzic Leptosols2920.1440.30
Vertic Cambisols770.1710.63
Total7246.00100.00
Table 4. Basic meteorological data of the stations in the vicinity of the study area.
StationLatitude (°N)Longitude (°E)PCPT-MaxT-minSSH WNDHMD
Addis Ababa 9.0238.75
Kachise9.6137.86
Fiche 9.7738.73
Gohatsion10.0038.24 NANANA
Gebre guracha9.8238.42 NANANA
Derba9.4338.65 NANANA
Chancho9.3038.74 NANANA
Sululta9.1838.73 NANANA
Jeldu9.2538.08 NANANA
Note: NA—Not available.
Table 5. Characteristics of streamflow gauging stations used in this study.
No.Station NameLatitude LongitudeArea (km2)
1Muger9.3038.73489
2Deneba9.2738.7286
3Sibilu9.2338.74380
4Gerbi9.1538.6788.6
5Gorfo9.4038.8449.2
Table 6. Rates of performance evaluation metrics of a streamflow simulation.
Performance RateNSEPBIASR2
UnsatisfactoryNSE ≤ 0.5PBIAS ≥ ±25R2 < 0.50
Satisfactory0.5 < NSE ≤ 0.65±15 ≤ PBIAS < ±250.50 < R2 < 0.70
Good0.65 < NSE ≤ 0.75±10 ≤ PBIAS < ±150.70 < R2 < 0.80
Very good0.75 < NSE ≤ 1PBIAS < ±10>0.80
Table 7. Sensitive flow parameters with their fitted value and rank.
Parameter NameMugerSibiluGorfoGerbiDeneba
RankFitted ValueRankFitted ValueRankFitted ValueRankFitted ValueRankFitted Value
R__CN2.mgt1−0.12451−0.13961−0.12451−0.17751−0.1785
R__SOL_K (..).sol21.288931.6599101.288981.324341.8907
V__ALPHA_BF.gw30.00006950.0000720.0000720.00025110.000241
R__SLSUBBSN.hru4−0.11926−0.119214−0.11925−0.38489−0.2216
R__CH_N2.rte56.262546.7500136.262560.075552.1455
V__CH_K2.rte64.165216.660054.165090.375074.205
R__HRU_SLP.hru75.4775.4700115.470074.930027.01
R__SOL_AWC (..).sol81.97481.974041.9740132.286060.618
V__GW_DELAY.gw93.7651087.650033.765040.585082.03500
V__ESCO.hru100.981190.9055120.9811110.9227100.9101
R__OV_N.hru11−0.546412−0.54647−0.546412−0.396012−0.636
V__GWQMN.gw122867152867.0092867.000152913.00132001.000
R__SOL_Z (..).sol132.2605132.260562.260532.415532.3485
V__RCHRG_DP.gw140.000225160.00023150.00023140.00037150.000049
V__REVAPMN.gw150.147110.147080.1470100.9050140.98500
V__GW_REVAP.gw160.1453140.1453160.1453160.1447160.1239
Table 8. Model calibration and validation performance values for Muger watershed.
IndexCalibration (1986–1999)Validation (2000–2009)
MugerSibiluGorfoGerbiDenebaMugerSibiluGorfoGerbiDeneba
R20.620.640.840.610.630.670.810.670.680.62
NSE0.620.640.830.60.630.670.80.60.670.67
PBIAS−4.58.9−20.3−13−5.97.8−15.5−20.1−17.722.8
p-factor0.740.790.770.740.740.760.720.740.780.73
r-factor1.040.840.950.91.140.690.680.720.821.29
Table 9. Average annual hydrological parameters (mm) and their percentage changes for the different periods of LC change in the Muger catchment.
Water Balance Components198620032020Rate of Change in %
1986–20032003–20201986–2020
Surface runoff319.91333.55321.614.09−3.710.53
Evapotranspiration229.3229.8230.60.220.350.56
Lateral flow133.76129.81127.02−3.04−2.20−5.31
Groundwater691.94681.69695.67−1.502.010.54
Water yield1144.891145.051144.320.014−0.064−0.05
Disclaimer/Publisher’s Note: The statements, opinions and data contained in all publications are solely those of the individual author(s) and contributor(s) and not of MDPI and/or the editor(s). MDPI and/or the editor(s) disclaim responsibility for any injury to people or property resulting from any ideas, methods, instructions or products referred to in the content.