Nitrate Migration and Transformation in Low Permeability Sediments: Laboratory Experiments and Modeling
Abstract
:1. Introduction
2. Materials and Methods
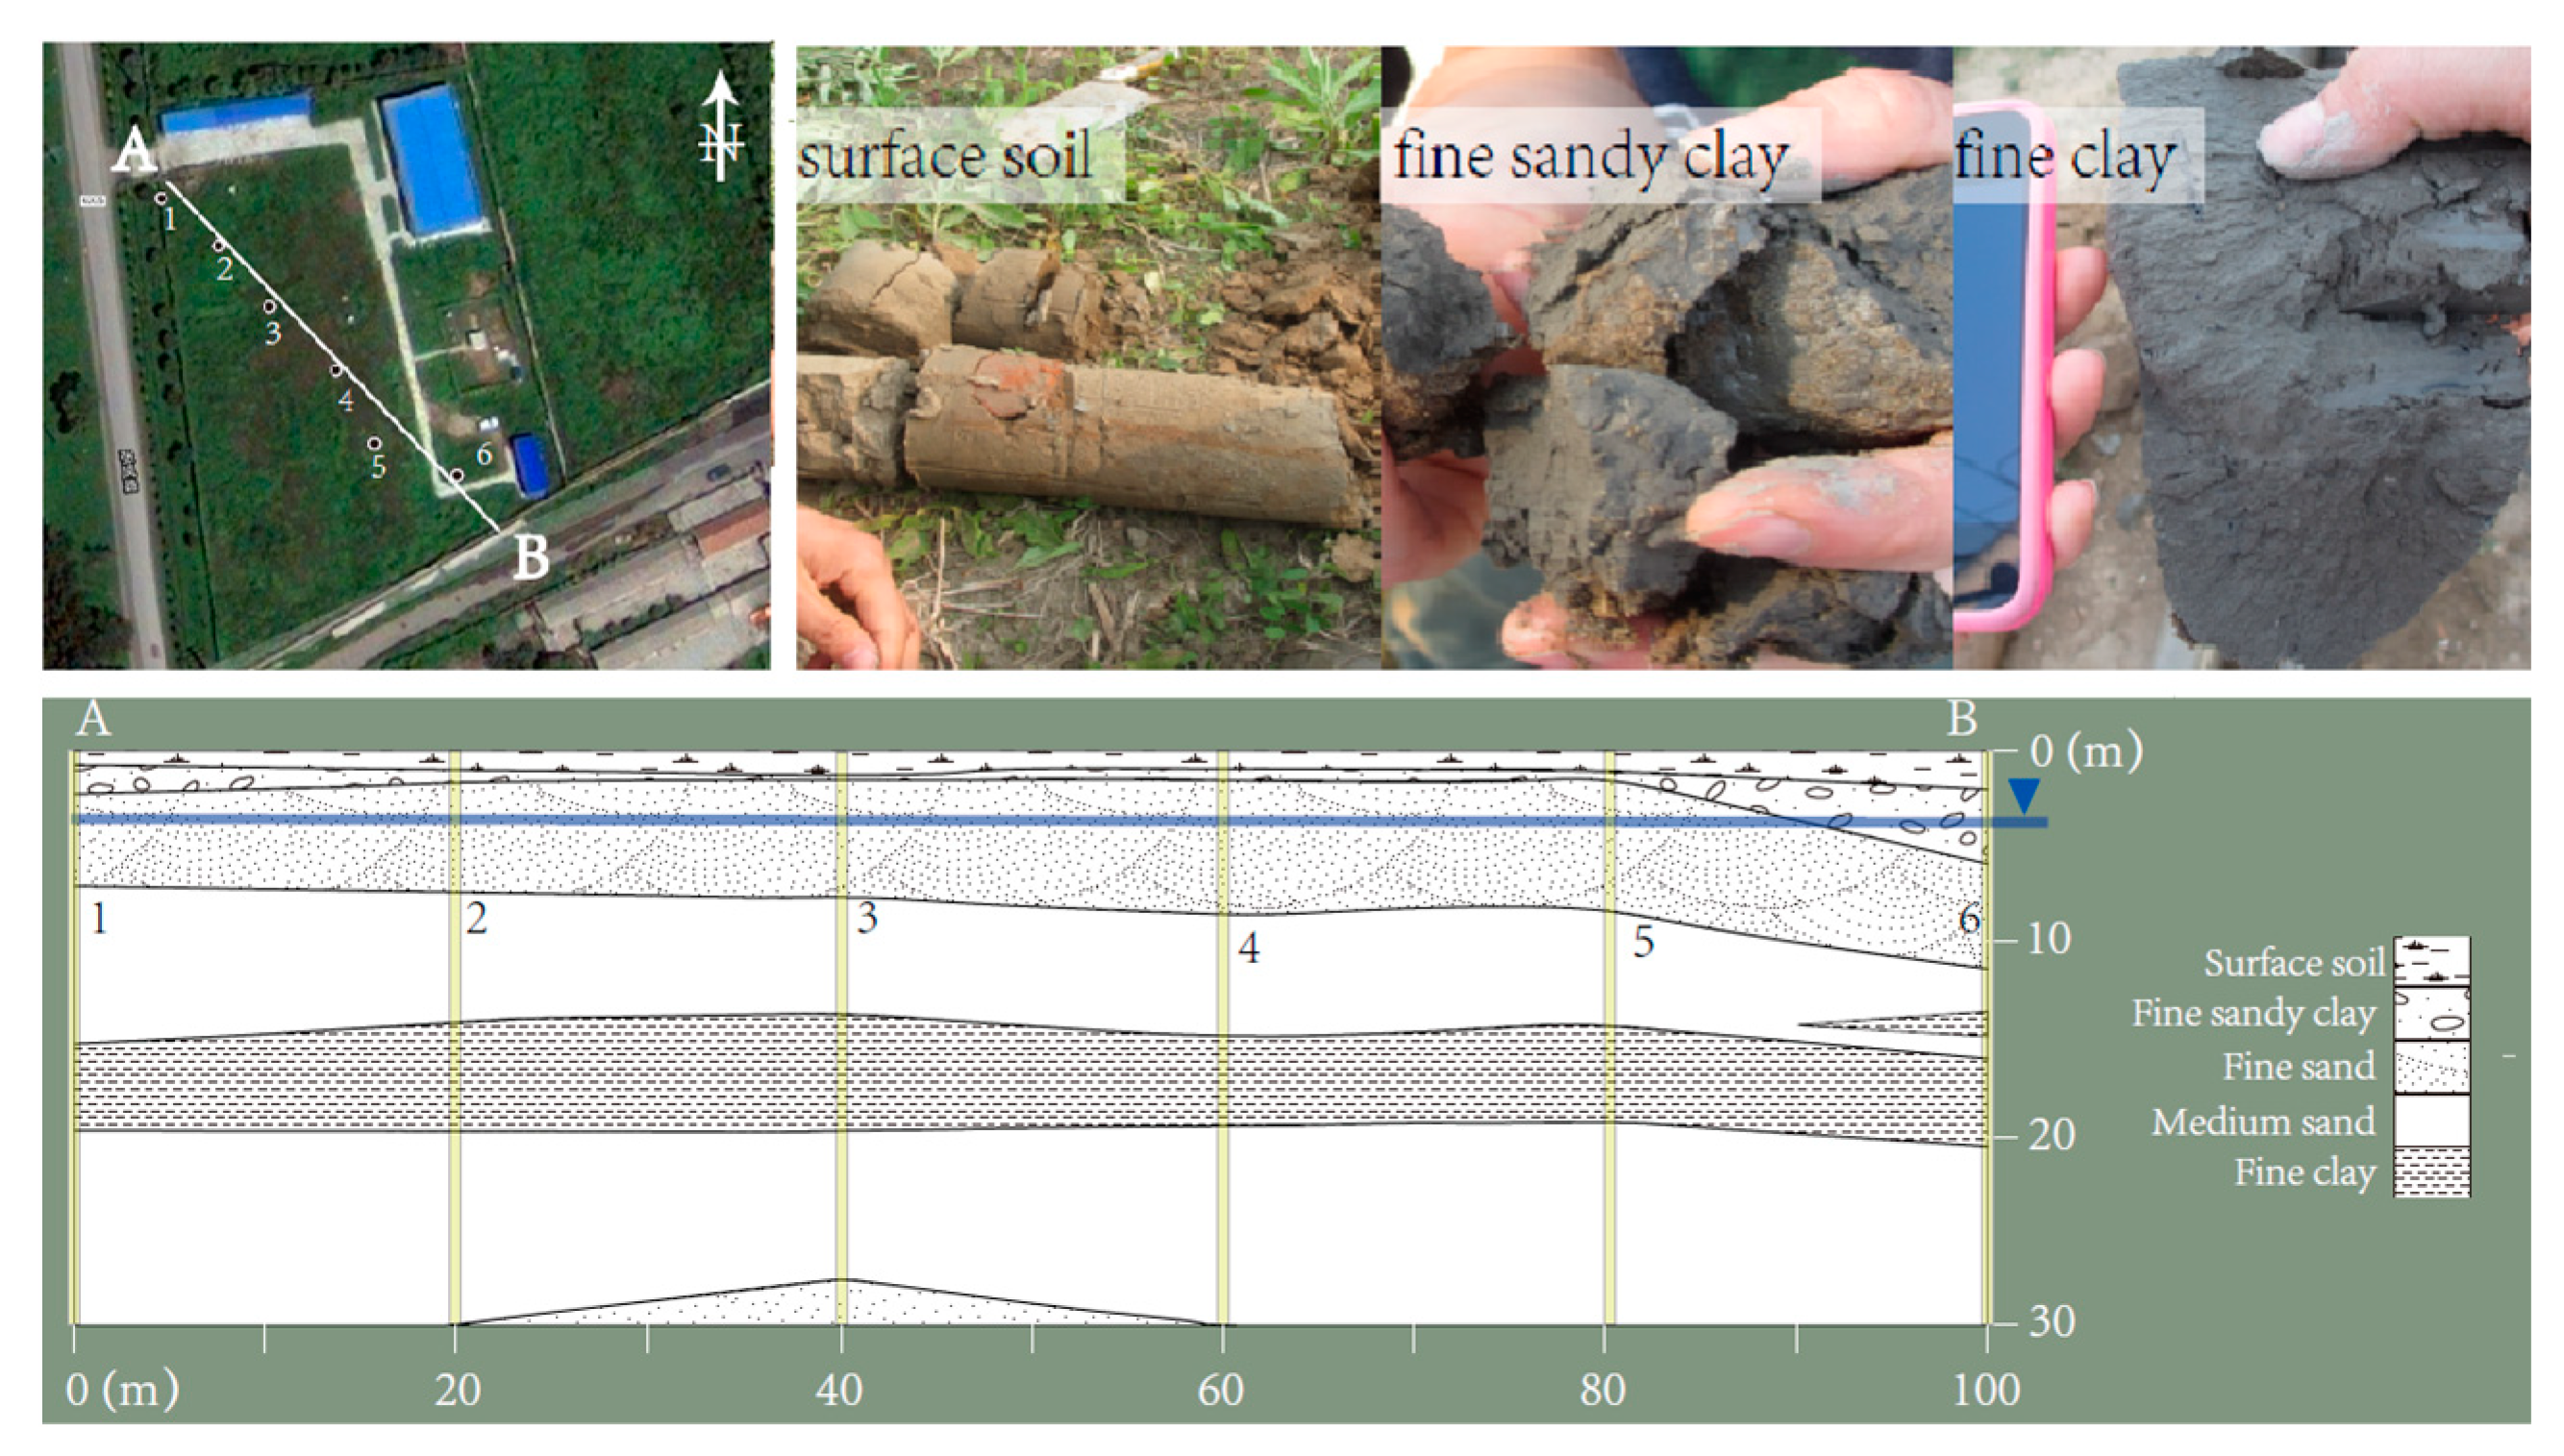
2.1. Sediment Preparation
2.2. Experimental Setup
- Group 1: different concentrations (100 mg/L and 50 mg/L).
- Group 2: different pH values.
- Group 3: different Darcy’s velocity.
- Group 4: intermittent experiment.
- Group 5: sediment of different textures.
2.3. Transformation Modeling
3. Results and Discussion
3.1. Soil Properties
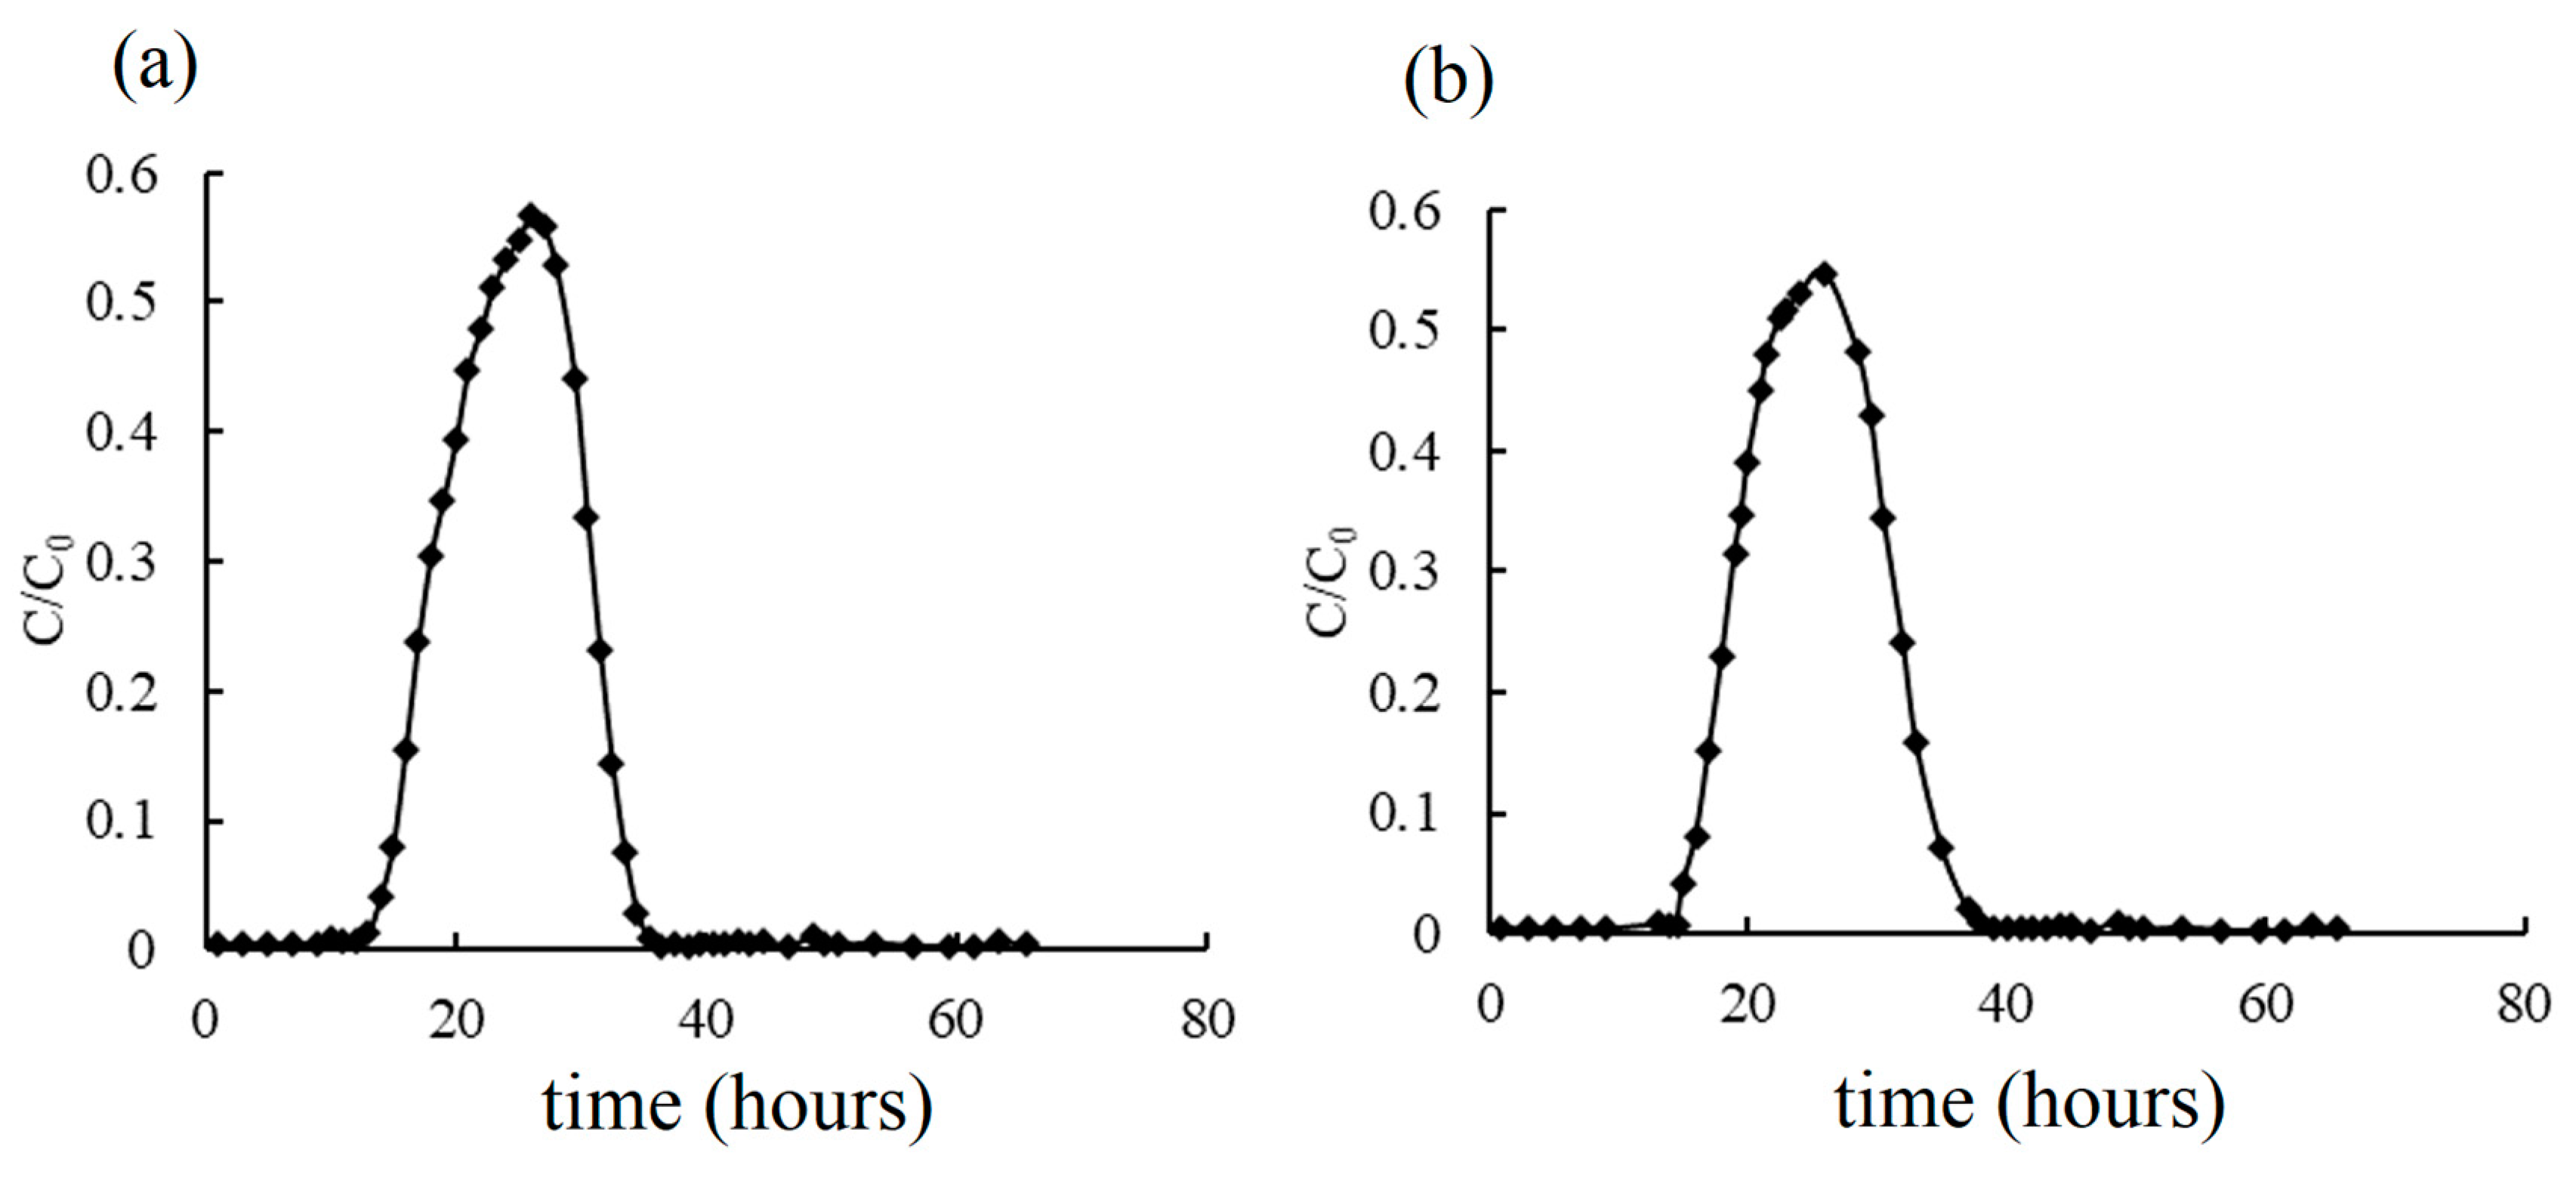
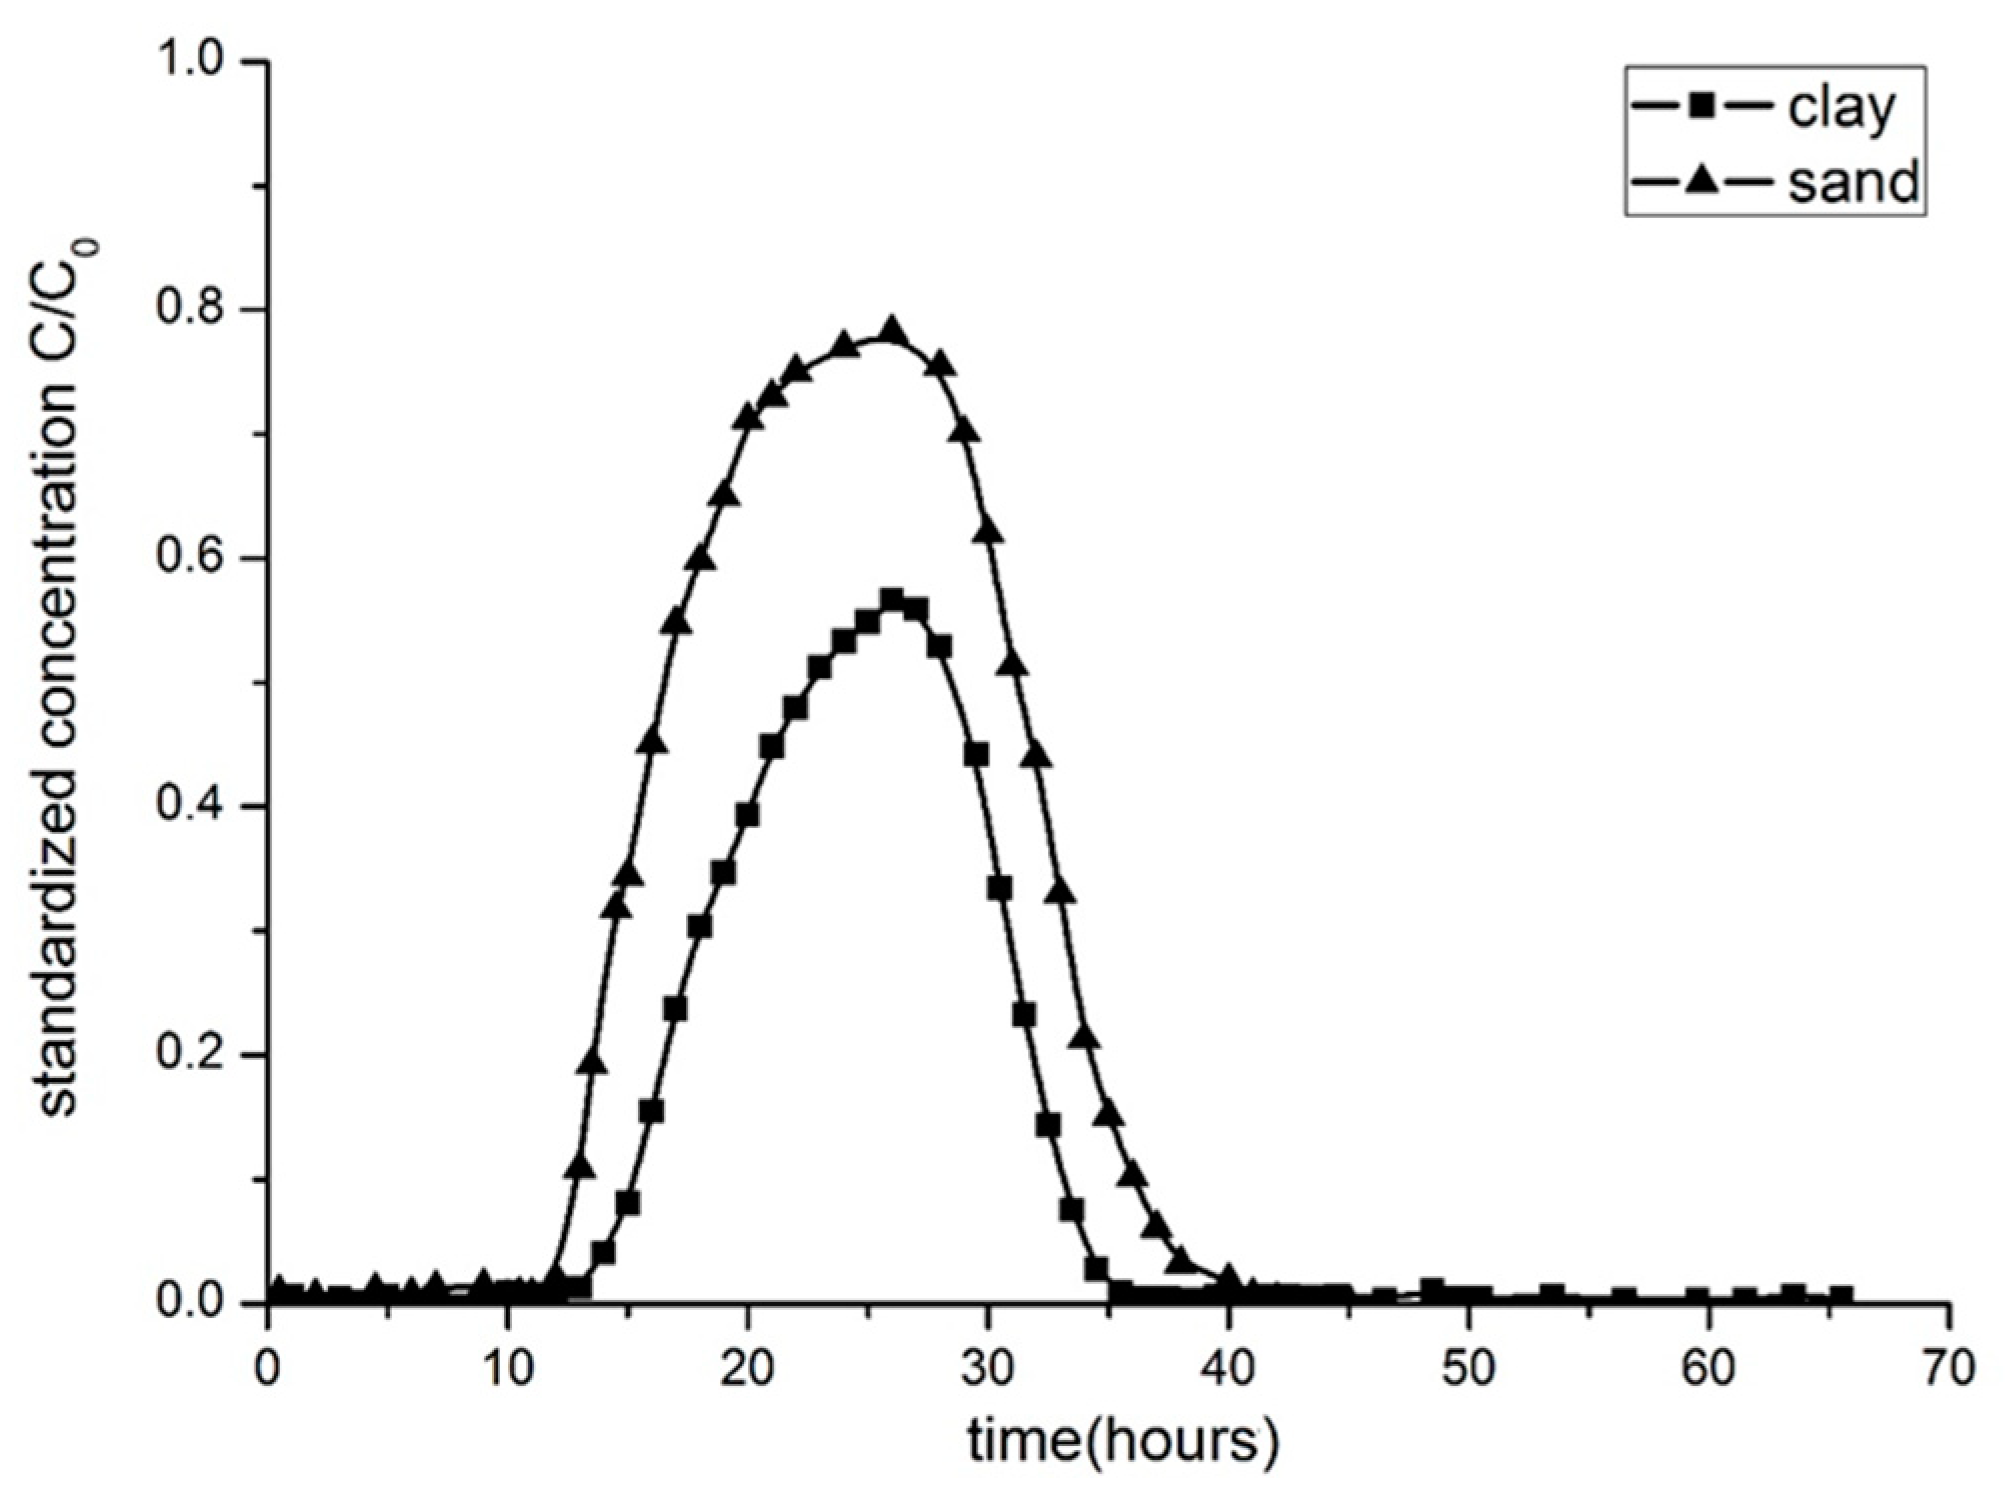
3.2. Breakthrough Curves by Experimentation
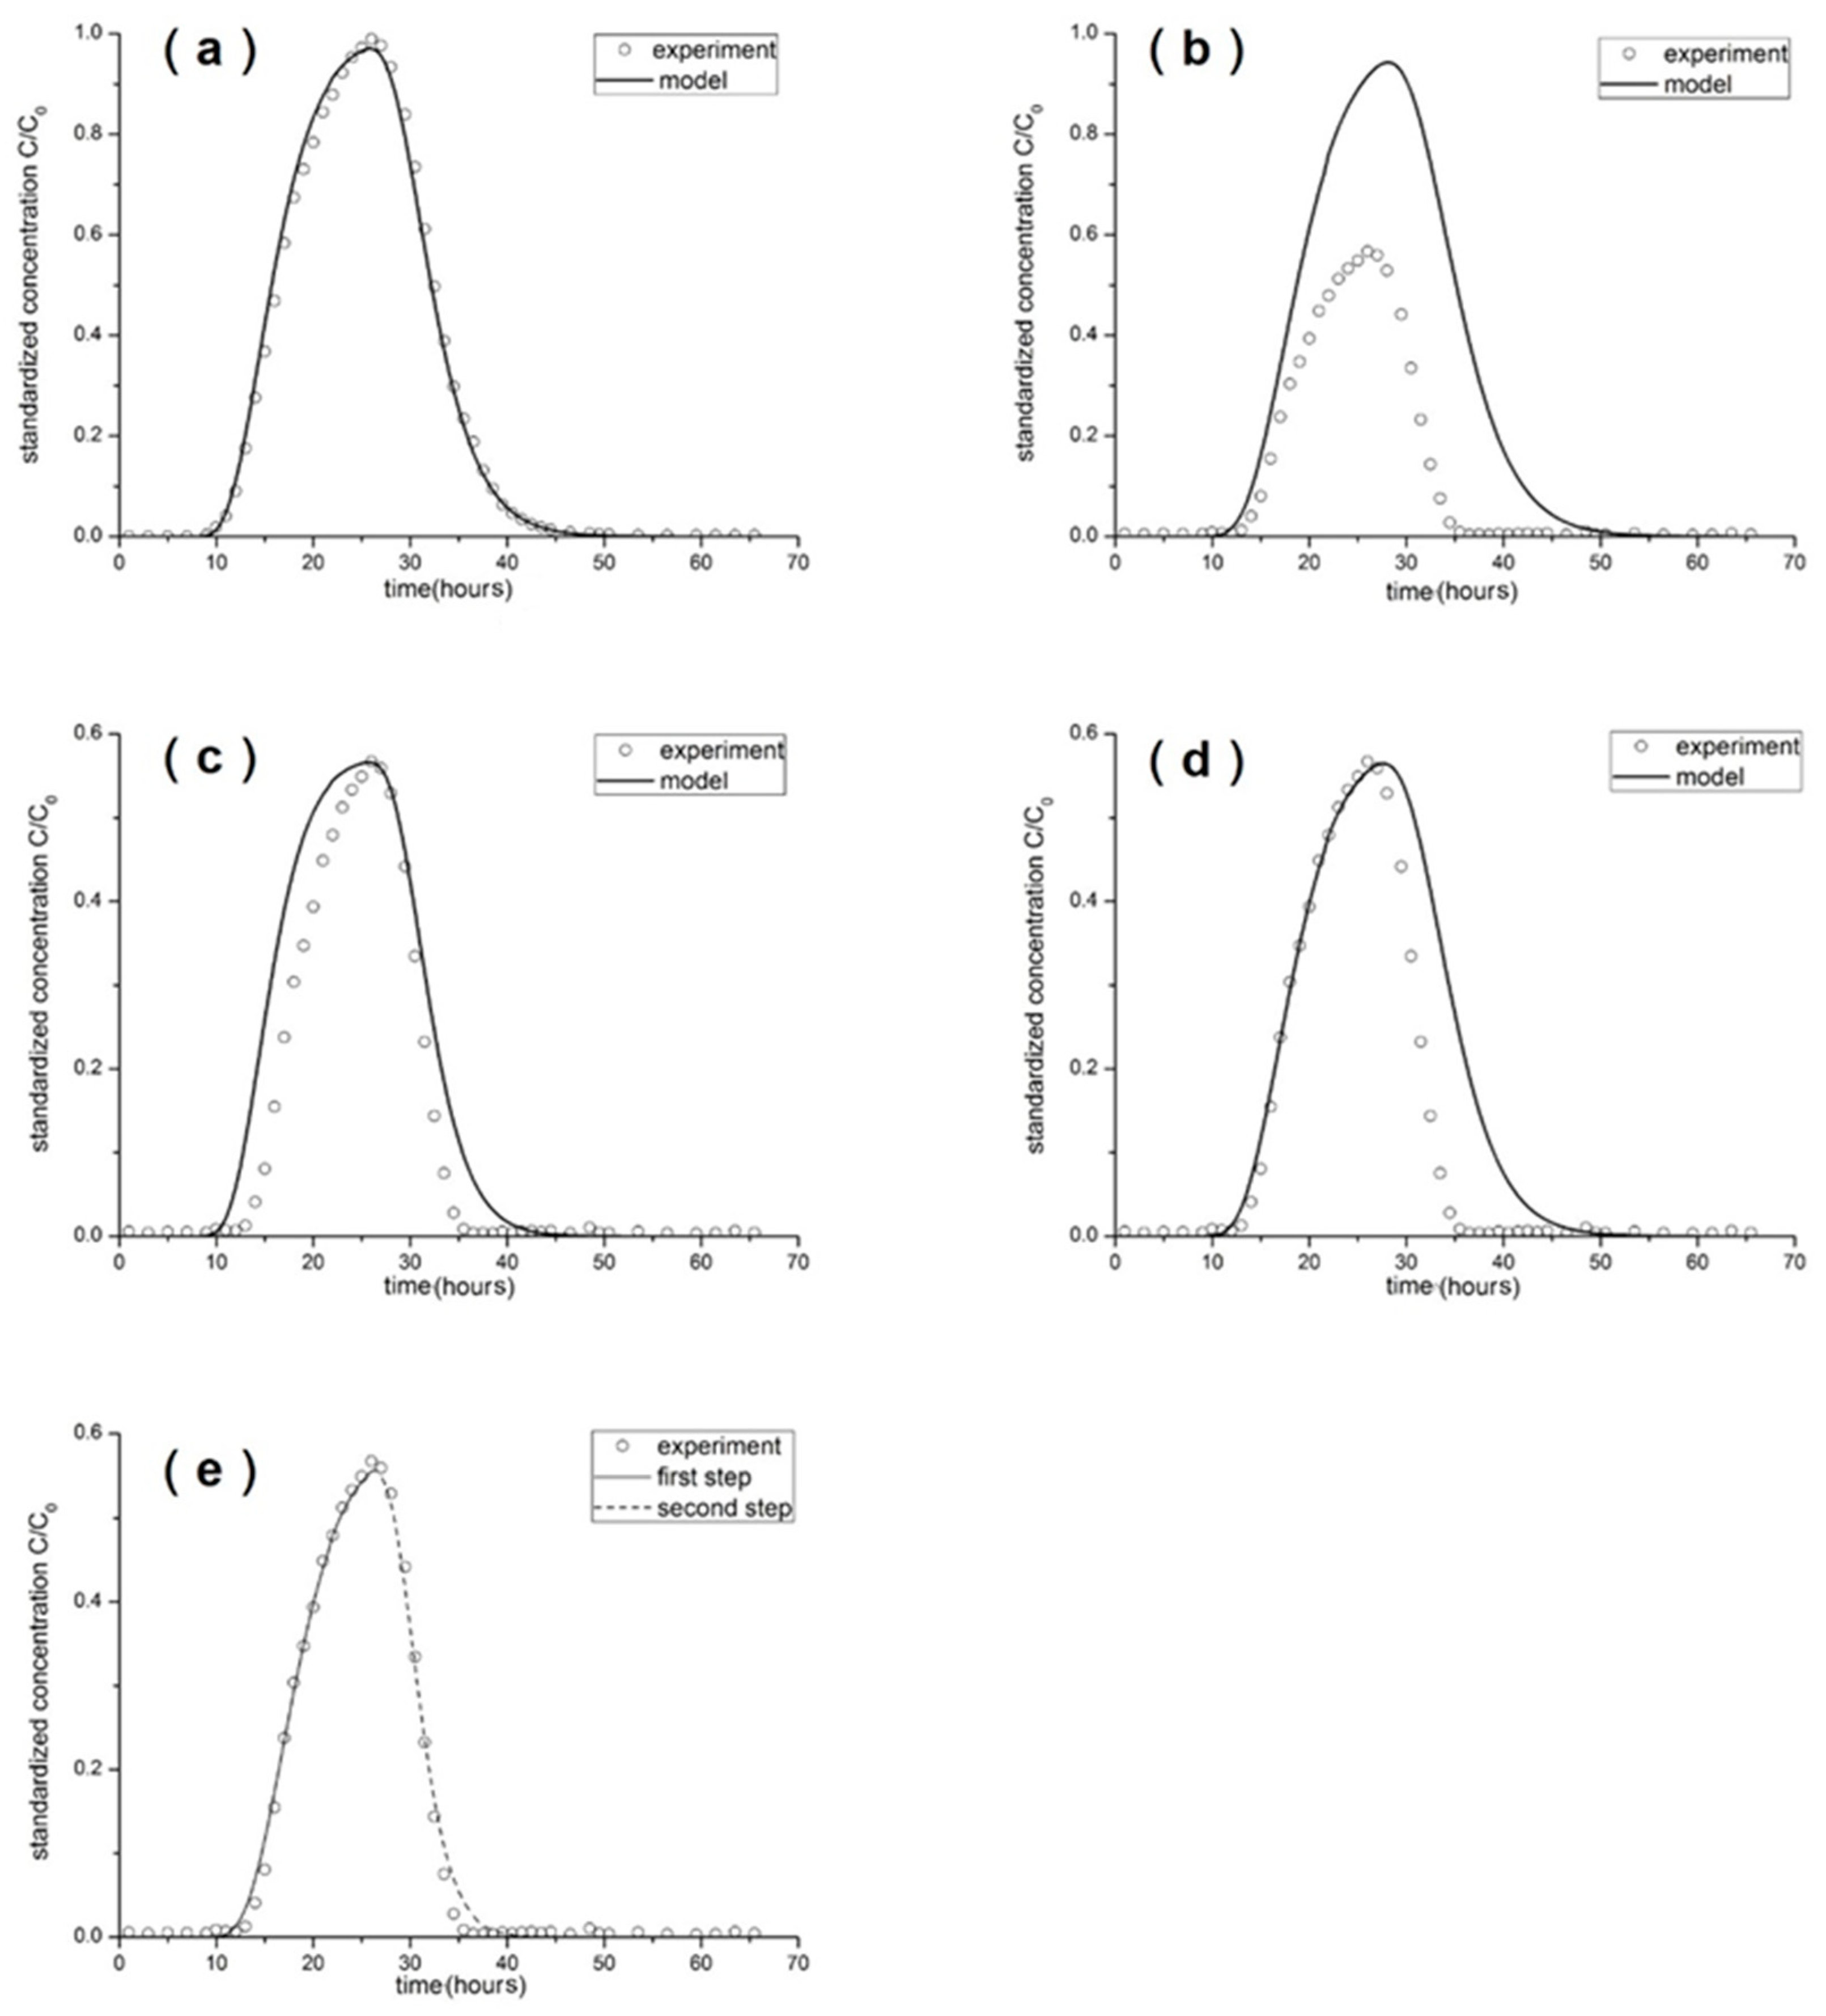
3.3. Breakthrough Curves by Simulation
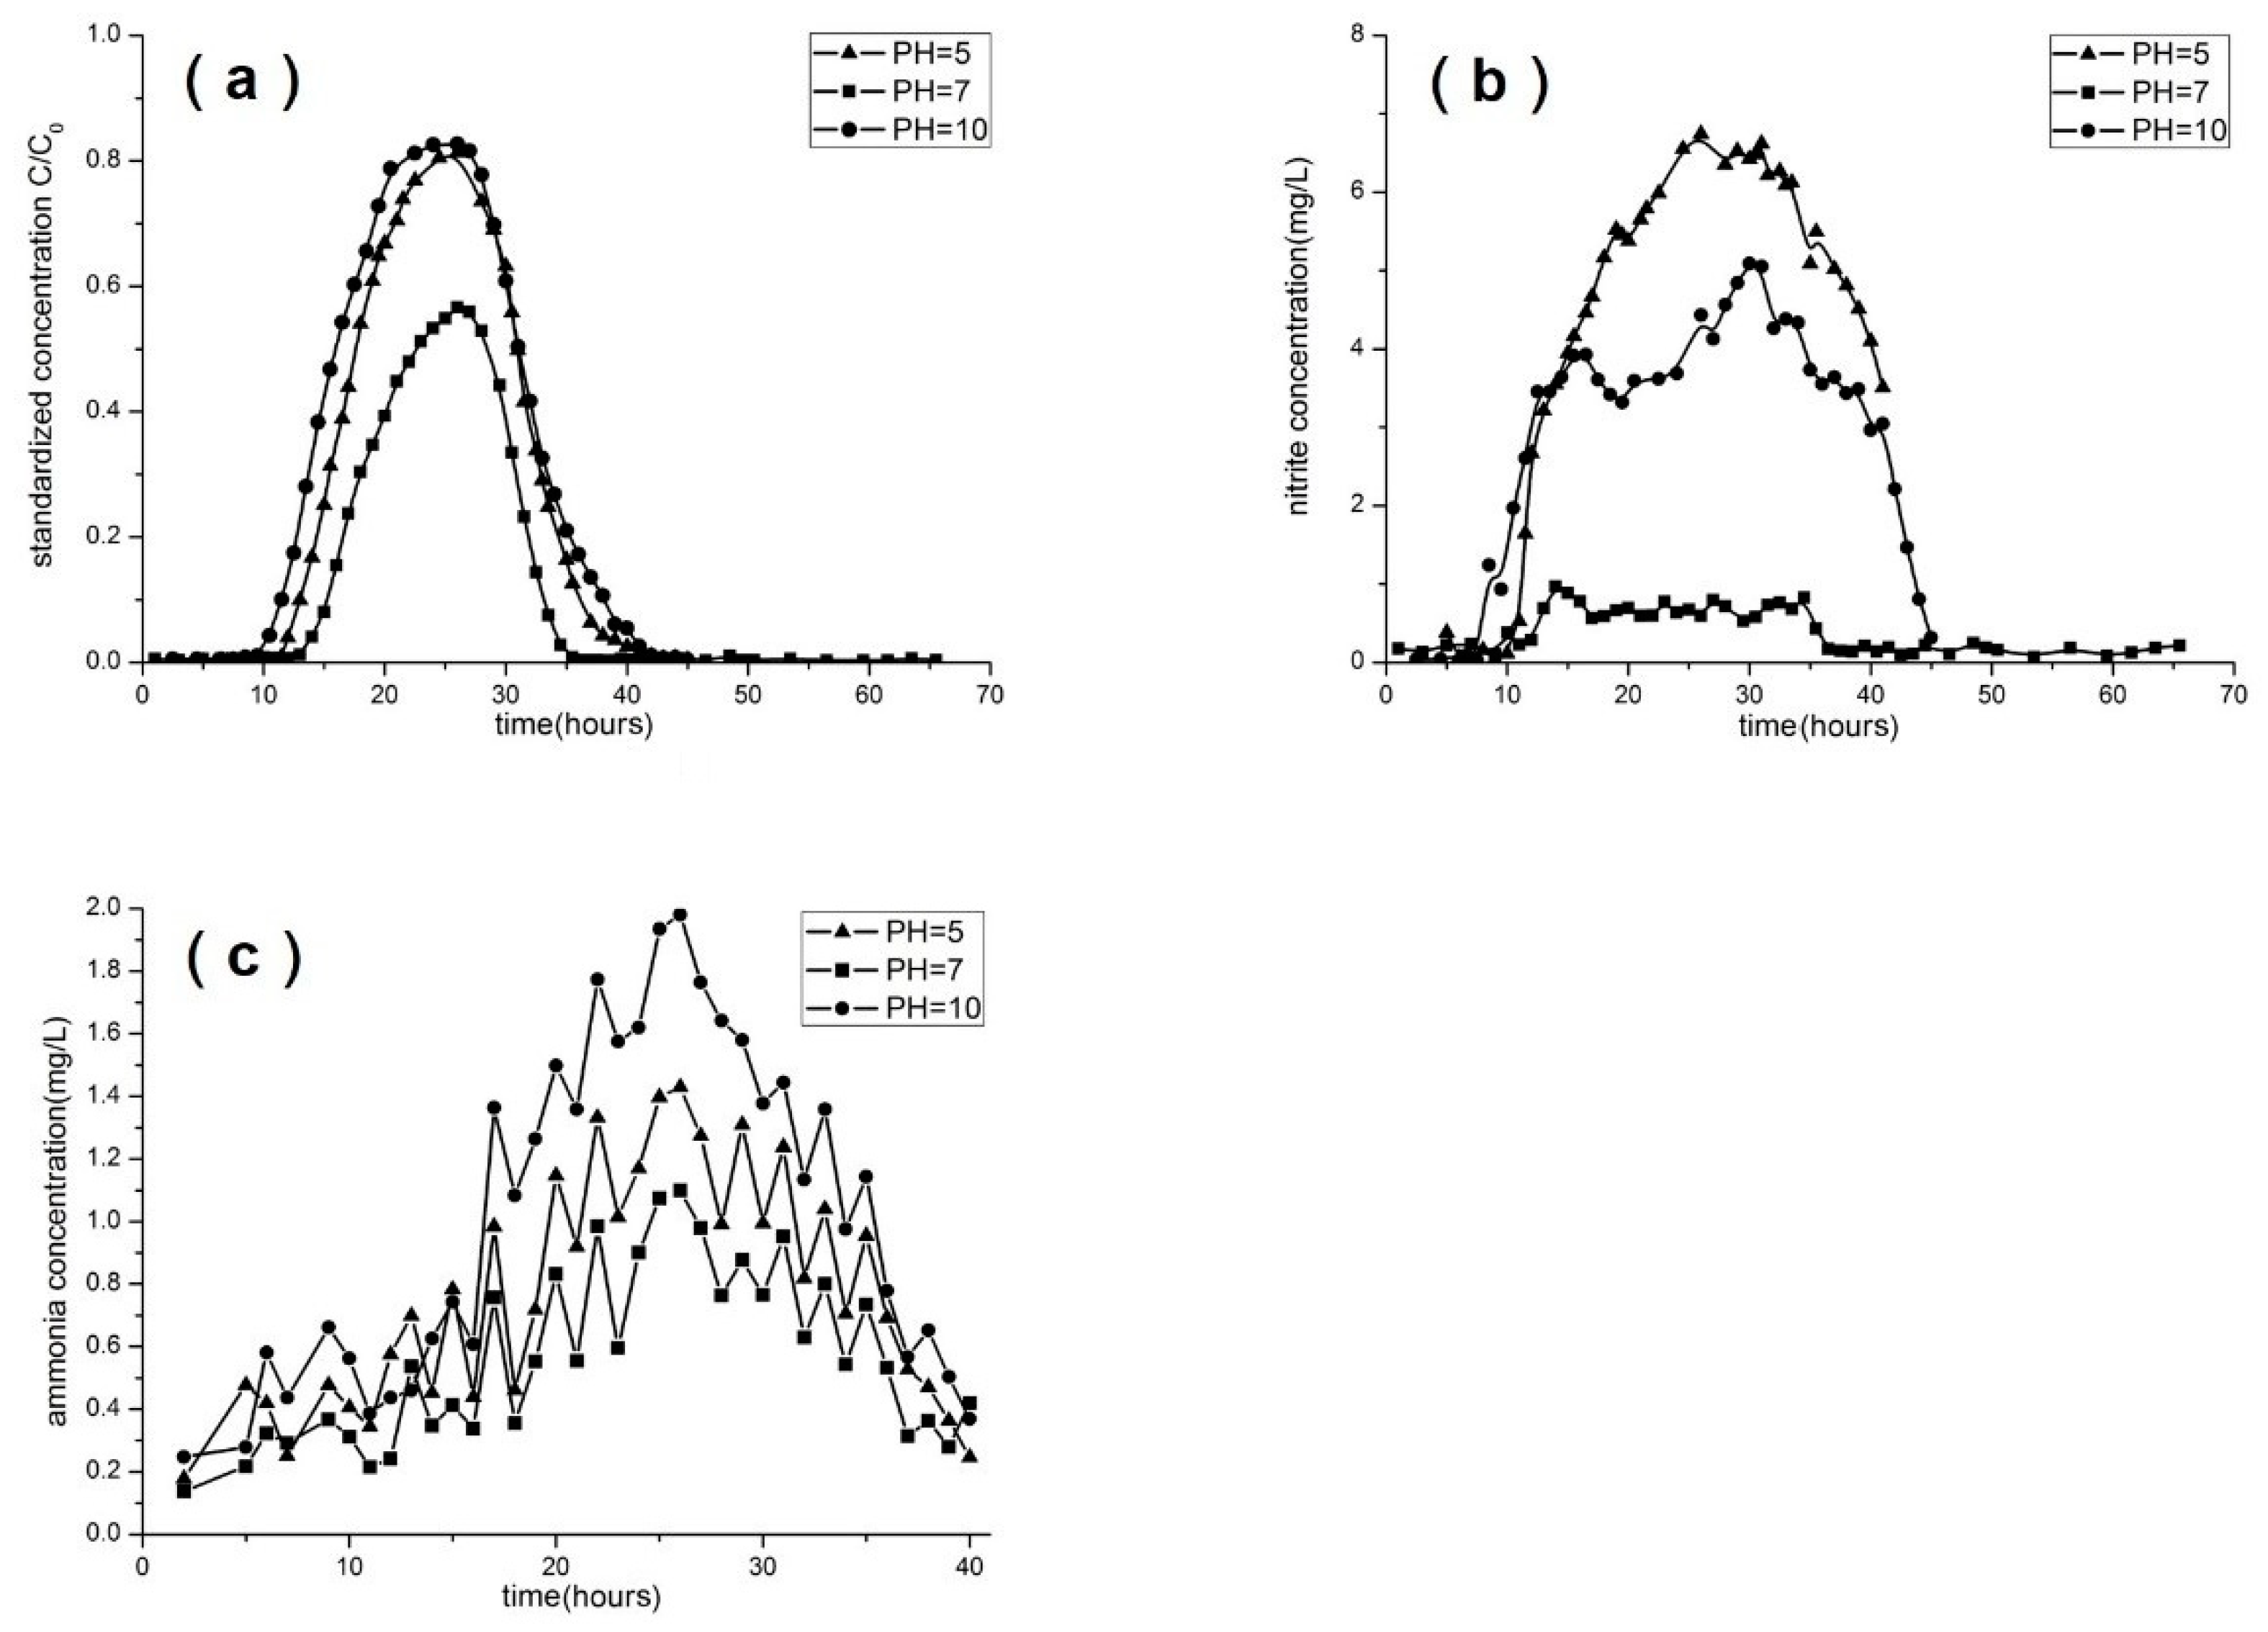
3.4. Effect of Concentration, pH, Flow Rate, and Soil Type
4. Conclusions
Author Contributions
Funding
Data Availability Statement
Acknowledgments
Conflicts of Interest
References
- Comly, H.H. Cyanosis in infants caused by nitrates in well water. JAMA 1945, 129, 112–116. [Google Scholar] [CrossRef]
- Naranjo, R.C.; Welborn, T.L.; Rosen, M.R. The Distribution and Modeling of Nitrate Transport in the Carson Valley Alluvial Aquifer, Douglas County, Nevada; U.S. Geological Survey Scientific Investigations Report 2013–5136, 51p; US Geological Survey: Reston, VA, USA, 2013; 51p. [Google Scholar]
- Van Der Hoek, J.P.; Klapwijk, A. Nitrate removal from ground water. Water Res. 1987, 21, 989–997. [Google Scholar] [CrossRef]
- Knowles, R. Denitrification. Microbiol. Rev. 1982, 46, 43. [Google Scholar] [CrossRef] [PubMed]
- Rivett, M.O.; Buss, S.R.; Morgan, P. Nitrate attenuation in groundwater: A review of biogeochemical controlling processes. Water Res. 2008, 42, 4215–4232. [Google Scholar] [CrossRef] [PubMed]
- Stanford, G.; Vander Pol, R.A.; Dzienia, S. Denitrification Rates in Relation to Total and Extractable Soil Carbon 1. Soil Sci. Soc. Am. J. 1975, 39, 284–289. [Google Scholar] [CrossRef]
- Šimek, M.; Jíšová, L.; Hopkins, D.W. What is the so-called optimum pH for denitrification in soil? Soil Biol. Biochem. 2002, 34, 1227–1234. [Google Scholar] [CrossRef]
- Kessler, A.J.; Glud, R.N.; Bayani Cardenas, M.; Larsen, M.; Bourke, M.F.; Cook, P.L. Quantifying denitrification in rippled permeable sands through combined flume experiments and modeling. Limnol. Ocean. 2012, 57, 1217. [Google Scholar] [CrossRef]
- Hamlin, H.J.; Michaels, J.T.; Beaulaton, C.M. Comparing denitrification rates and carbon sources in commercial scale upflow denitrification biological filters in aquaculture. Aquac. Eng. 2008, 38, 79–92. [Google Scholar] [CrossRef]
- Boudreau, B.P. Diagenetic Models and Their Implementation; Springer: Berlin, Germany, 1997; pp. 152–155. [Google Scholar]
- Šimůnek, J.; Jarvis, N.J.; Van Genuchten, M.T. Review and comparison of models for describing non-equilibrium and preferential flow and transport in the vadose zone. J. Hydrol. 2003, 272, 14–35. [Google Scholar] [CrossRef]
- Hanson, B.R.; Šimůnek, J.; Hopmans, J.W. Evaluation of urea–ammonium–nitrate fertigation with drip irrigation using numerical modeling. Agric. Water Manag. 2006, 86, 102–113. [Google Scholar] [CrossRef]
- Spall, S.A.; Richards, K.J. A numerical model of mesoscale frontal instabilities and plankton dynamics—I. Model formulation and initial experiments. Deep Sea Res. Part I Oceanogr. Res. Pap. 2000, 47, 1261–1301. [Google Scholar] [CrossRef]
- Li, J.; Zhang, J.; Rao, M. Modeling of water flow and nitrate transport under surface drip fertigation. Trans. ASAE 2005, 48, 627–637. [Google Scholar] [CrossRef]
- Gärdenäs, A.I.; Hopmans, J.W.; Hanson, B.R. Two-dimensional modeling of nitrate leaching for various fertigation scenarios under micro-irrigation. Agric. Water Manag. 2005, 74, 219–242. [Google Scholar] [CrossRef]
- Heatwole, K.K.; McCray, J.E. Modeling potential vadose-zone transport of nitrogen from onsite wastewater systems at the development scale. J. Contam. Hydrol. 2007, 91, 184–201. [Google Scholar] [CrossRef] [PubMed]
- Chen, D.J.Z.; MacQuarrie, K.T.B. Numerical simulation of organic carbon, nitrate, and nitrogen isotope behavior during denitrification in a riparian zone. J. Hydrol. 2004, 293, 235–254. [Google Scholar] [CrossRef]
- Tesoriero, A.J.; Liebscher, H.; Cox, S.E. Mechanism and rate of denitrification in an agricultural watershed: Electron and mass balance along groundwater flow paths. Water Resour. Res. 2000, 36, 1545–1559. [Google Scholar] [CrossRef]
- Harbaugh, A.W. MODFLOW-2005, the US Geological Survey Modular Ground-Water Model: The Ground-Water Flow Process; US Department of the Interior, US Geological Survey: Reston, VA, USA, 2005. [Google Scholar]
- Zheng, C.; Weaver, J.; Tonkin, M. MT3DMS, a Modular Three-Dimensional Multispecies Transport Model—User Guide to the Hydrocarbon Spill Source (HSS) Package; US Environmental Protection Agency: Athens, Georgia, 2010. [Google Scholar]
- Clay, D.E.; Zheng, Z.; Liu, Z. Bromide and nitrate movement through undisturbed soil columns. J. Environ. Qual. 2004, 33, 338–342. [Google Scholar] [CrossRef] [PubMed]



| Group | Concentration (mg/L) | pH | Velocity (mL/min) | Intermittent | Soil Type |
|---|---|---|---|---|---|
| 1 | 100, 50 | 7 | 0.1 | none | silty clay |
| 2 | 100 | 5, 7, 10 | 0.1 | none | silty clay |
| 3 | 100 | 7 | 0.1, 0.2 | none | silty clay |
| 4 | 100 | 7 | 0.1 | 48 h | silty clay |
| 5 | 100 | 7 | 0.1 | none | silty clay, fine sand |
| Particle size | 2–0.05 mm | 0.05–0.002 mm | <0.002 mm |
| Percentage | 5.58% | 52.78% | 41.64% |
| Properties | Values |
|---|---|
| pH value | 7.68 |
| Available nitrogen (mg/kg) | 57.7 |
| Ammonia–nitrogen (mg/kg) | 45.7 |
| Nitrite–nitrogen (mg/kg) | 54.2 |
| Nitrate–nitrogen (mg/kg) | 104.6 |
| Total nitrogen (%) | 0.073 |
| Organic matter (g/kg) | 7.03 |
| Total dissolved solids (g/kg) | 1.47 |
| Cation exchange capacity (cmol/kg) | 28.1 |
| Mineral Component | Percentage |
|---|---|
| Quartz | 41% |
| Microcline | 4% |
| Albite | 19% |
| Clinochlore | 9% |
| Muscovite | 4% |
| Calcite | 16% |
| Dolomite | 5% |
| pyrite | 2% |
| Parameter | Value |
|---|---|
| Diameter | 3.5 cm |
| Length | 15 cm |
| Hydraulic conductivity | 5.8 × 10⁻⁷ cm/s |
| Dispersivity | 0.8 cm |
| Porosity | 40% |
| Flow rate | 0.1 mL/min |
| Parameter | Value |
|---|---|
| Diameter | 3.5 cm |
| Length | 15 cm |
| Hydraulic conductivity | 1.23 × 10⁻⁵ cm/s |
| Dispersivity | 0.53 cm |
| Porosity | 35% |
| Flow rate | 0.1 mL/min |
Disclaimer/Publisher’s Note: The statements, opinions and data contained in all publications are solely those of the individual author(s) and contributor(s) and not of MDPI and/or the editor(s). MDPI and/or the editor(s) disclaim responsibility for any injury to people or property resulting from any ideas, methods, instructions or products referred to in the content. |
© 2023 by the authors. Licensee MDPI, Basel, Switzerland. This article is an open access article distributed under the terms and conditions of the Creative Commons Attribution (CC BY) license (https://creativecommons.org/licenses/by/4.0/).
Share and Cite
Wang, S.; Wu, B.; Wang, Y.; Wang, X. Nitrate Migration and Transformation in Low Permeability Sediments: Laboratory Experiments and Modeling. Water 2023, 15, 2528. https://doi.org/10.3390/w15142528
Wang S, Wu B, Wang Y, Wang X. Nitrate Migration and Transformation in Low Permeability Sediments: Laboratory Experiments and Modeling. Water. 2023; 15(14):2528. https://doi.org/10.3390/w15142528
Chicago/Turabian StyleWang, Sai, Bin Wu, Yating Wang, and Xiaoyan Wang. 2023. "Nitrate Migration and Transformation in Low Permeability Sediments: Laboratory Experiments and Modeling" Water 15, no. 14: 2528. https://doi.org/10.3390/w15142528
APA StyleWang, S., Wu, B., Wang, Y., & Wang, X. (2023). Nitrate Migration and Transformation in Low Permeability Sediments: Laboratory Experiments and Modeling. Water, 15(14), 2528. https://doi.org/10.3390/w15142528


