Article

Nitrate Migration and Transformation in Low Permeability Sediments: Laboratory Experiments and Modeling

1
Hydrogeology and Environmental Geology Survey Center, China Geological Survey, Baoding 071051, China
2
College of Engineering, Peking University, Beijing 100871, China
*
Author to whom correspondence should be addressed.
Water 2023, 15(14), 2528; https://doi.org/10.3390/w15142528
Submission received: 20 June 2023 / Revised: 6 July 2023 / Accepted: 8 July 2023 / Published: 10 July 2023

Abstract

:
The excessive application of fertilizers and the uncontrolled discharge of untreated wastewater on land contribute to the nitrogen pollution of groundwater. Low permeability sediment plays an important role in slowing down the migration of nitrate in groundwater systems. This study focuses on the mechanisms that affect nitrate transport in the low permeability layer. A soil column experiment was conducted and an MT3D transport model (a modular three-dimensional multispecies transport model) of nitrate was proposed. The results show that a low permeation layer could act as a strong barrier to nitrate migration and transportation, as demonstrated by the column soil experiment. The denitrification rates were controlled by many other factors, including nitrate concentration, flow rate, pH values and sediment particle characteristics. This indicated that denitrification is the most important factor in the attenuation of nitrate in low permeability sediments. This study clarified the law of migration and transformation of nitrate in low permeability soils and the factors that influence these processes. The results not only provide a basis for large-scale nitrate simulations, but also provide a reference for nitrate treatment in low permeability layers.

1. Introduction

Since the 1970s, nitrogen pollutants have penetrated into aquifers because of excessive fertilizer use and uncontrolled land treatment. Nitrate contamination has become a global environmental problem. The high level of nitrate concentration threatens human health, causing many diseases such as infant methemoglobinemia, in which hemoglobin is unable to carry oxygen [1], and adult stomach cancer. Nitrate contamination is an issue in both developed and developing countries. Many countries and organizations have set up a Maximum Concentration Level (MCL) of nitrate. The MCL for nitrate was set to 50 mg/L of nitrate in drinking water by the World Health Organization (WHO), whereas this value was set to 10 mg/L by the US environmental Protection Agency (USEPA) as a result of the risk of methemoglobinemia, and 20 mg/L in China. According to an investigation conducted by the USGS [2], the concentration of nitrate in drinking water in most parts of the United States has increased year by year, with an average annual increase of 0.8 mg/L. Additionally, nearly 1/4 of water pollution cases are attributed to excessive nitrate nitrogen. In China, 80% of the samples exhibited an increasing trend in nitrate concentration from 1998 to 2013.
The over exploitation of deep groundwater has led to a decline in hydraulic head and increased vertical hydraulic gradient, resulting in a greater risk of nitrate pollution in deep groundwater. The nitrate in shallow groundwater migrates through the low permeability sediment layer, leading to pollution in the deep groundwater. Therefore, it is important to study the migration and transformation processes of nitrate in the low permeability sediment layer. Previous studies have always focused on high permeation aquifers; however, to the best of our knowledge, this is the first investigation quantifying the denitrification process in low permeability sediments. In fact, the low permeability sediment contains mass clay with higher porosity and denitrification bacteria. These sediments provide a suitable environment for the denitrification process, characterized by the complete reduction of nitrate.
Many methods have been used for nitrate removal, including the bioretention method, the microbe method, ion exchange, reverse osmosis, electrodialysis, etc. [3]. The microbe method and the denitrification process were considered in this research. Denitrification is the main section in the nitrogen cycle. It turns nitrate into nitrogen gas via a chain of microbial reduction reactions [4,5]. Denitrification processes in groundwater are controlled by the local biogeochemical and physical conditions, such as the pH values, the groundwater flux rate, the dissolved oxygen concentration, etc. [6,7,8,9]. Such conditions are spatially distributed, temporal, and variable.
The development of a numerical model of nitrate transport is a prerequisite for addressing nitrate pollution. The implementation of a numerical model of nitrate transport requires fundamental knowledge of the transport processes and reaction kinetics involved in the decomposition of organic matter [10]. In addition, the field experiment is a tool to ensure the accuracy of the model. Many examples of the establishment and validation of nitrate models have been investigated around the world [11,12,13,14,15,16,17]; however, there are few studies investigating low permeability conditions, especially when it comes to experimental data that can support the model.
Column experiments are a commonly used method to comprehend solution transport and migration mechanics. Nitrate reduction can be termed as a half equation that illustrates the role of electron (e) transfer during the process [5,18], as follows:
2 N O 3 + 12 H + + 10 e N 2 + 6 H 2 O
Equation (1) can be divided into four steps. In the first step, nitrate is reduced to nitrite under the control of nitrate reductase. In the second step, nitrite is reduced to nitric under the control of nitrite reductase (NiR). In the third step, nitric oxide is reduced to nitrous oxide under the control of NO oxidoreductase (NoR). In the last step, nitrous oxide is reduced to nitrogen under the control of nitrous oxide reductase (N2OR). This process can be terminated at any of the intermediate stages, although denitrification has a stable endpoint with the production of nitrogen gas. The intermediates can be nitrite, nitric oxide, or nitrous in the denitrification process [5,18]. Energy is needed in each step. Denitrification bacteria obtain energy, such as optical energy and chemical energy, through many different ways. Some photosynthetic bacteria can grow heterotrophically under light and oxygen-free conditions. Simple organic matter acts as electron donor. Some denitrification bacteria use inorganic materials as an energy source to control the denitrification reaction. The equation can be expressed as follows:
5 S + 6 K N O 3 + 2 H 2 O K 2 S O 4 + 3 N 2 + 4 K H S O 4
Most denitrification bacteria are heterotrophic, using organic matter as an energy source, such as methanol. The equation can be expressed as follows:
6 N O 3 + 5 C H 3 O H 5 C O 2 + 3 N 2 + 7 H 2 O + 6 O H
In this study, the fate of denitrification in low permeability sediment layers and the influence of controlling factors, such as pH values, nitrate concentration, flow rate, and sediment particle size, were studied. A nitrate transport model through the silty clay was developed to provide a basis for understanding nitrate migration under natural conditions. The main objectives of this study were to: (1) recognize nitrate transport in low permeation layers; (2) recognize the influence of the factors controlling the reduction of nitrate in low permeation layers; (3) discuss the coefficients used in numerical nitrate transport models in low permeation layers, considering not only laboratory experiments but also their application in in situ and regional-scale scenarios for nitrate pollution abatement.

2. Materials and Methods

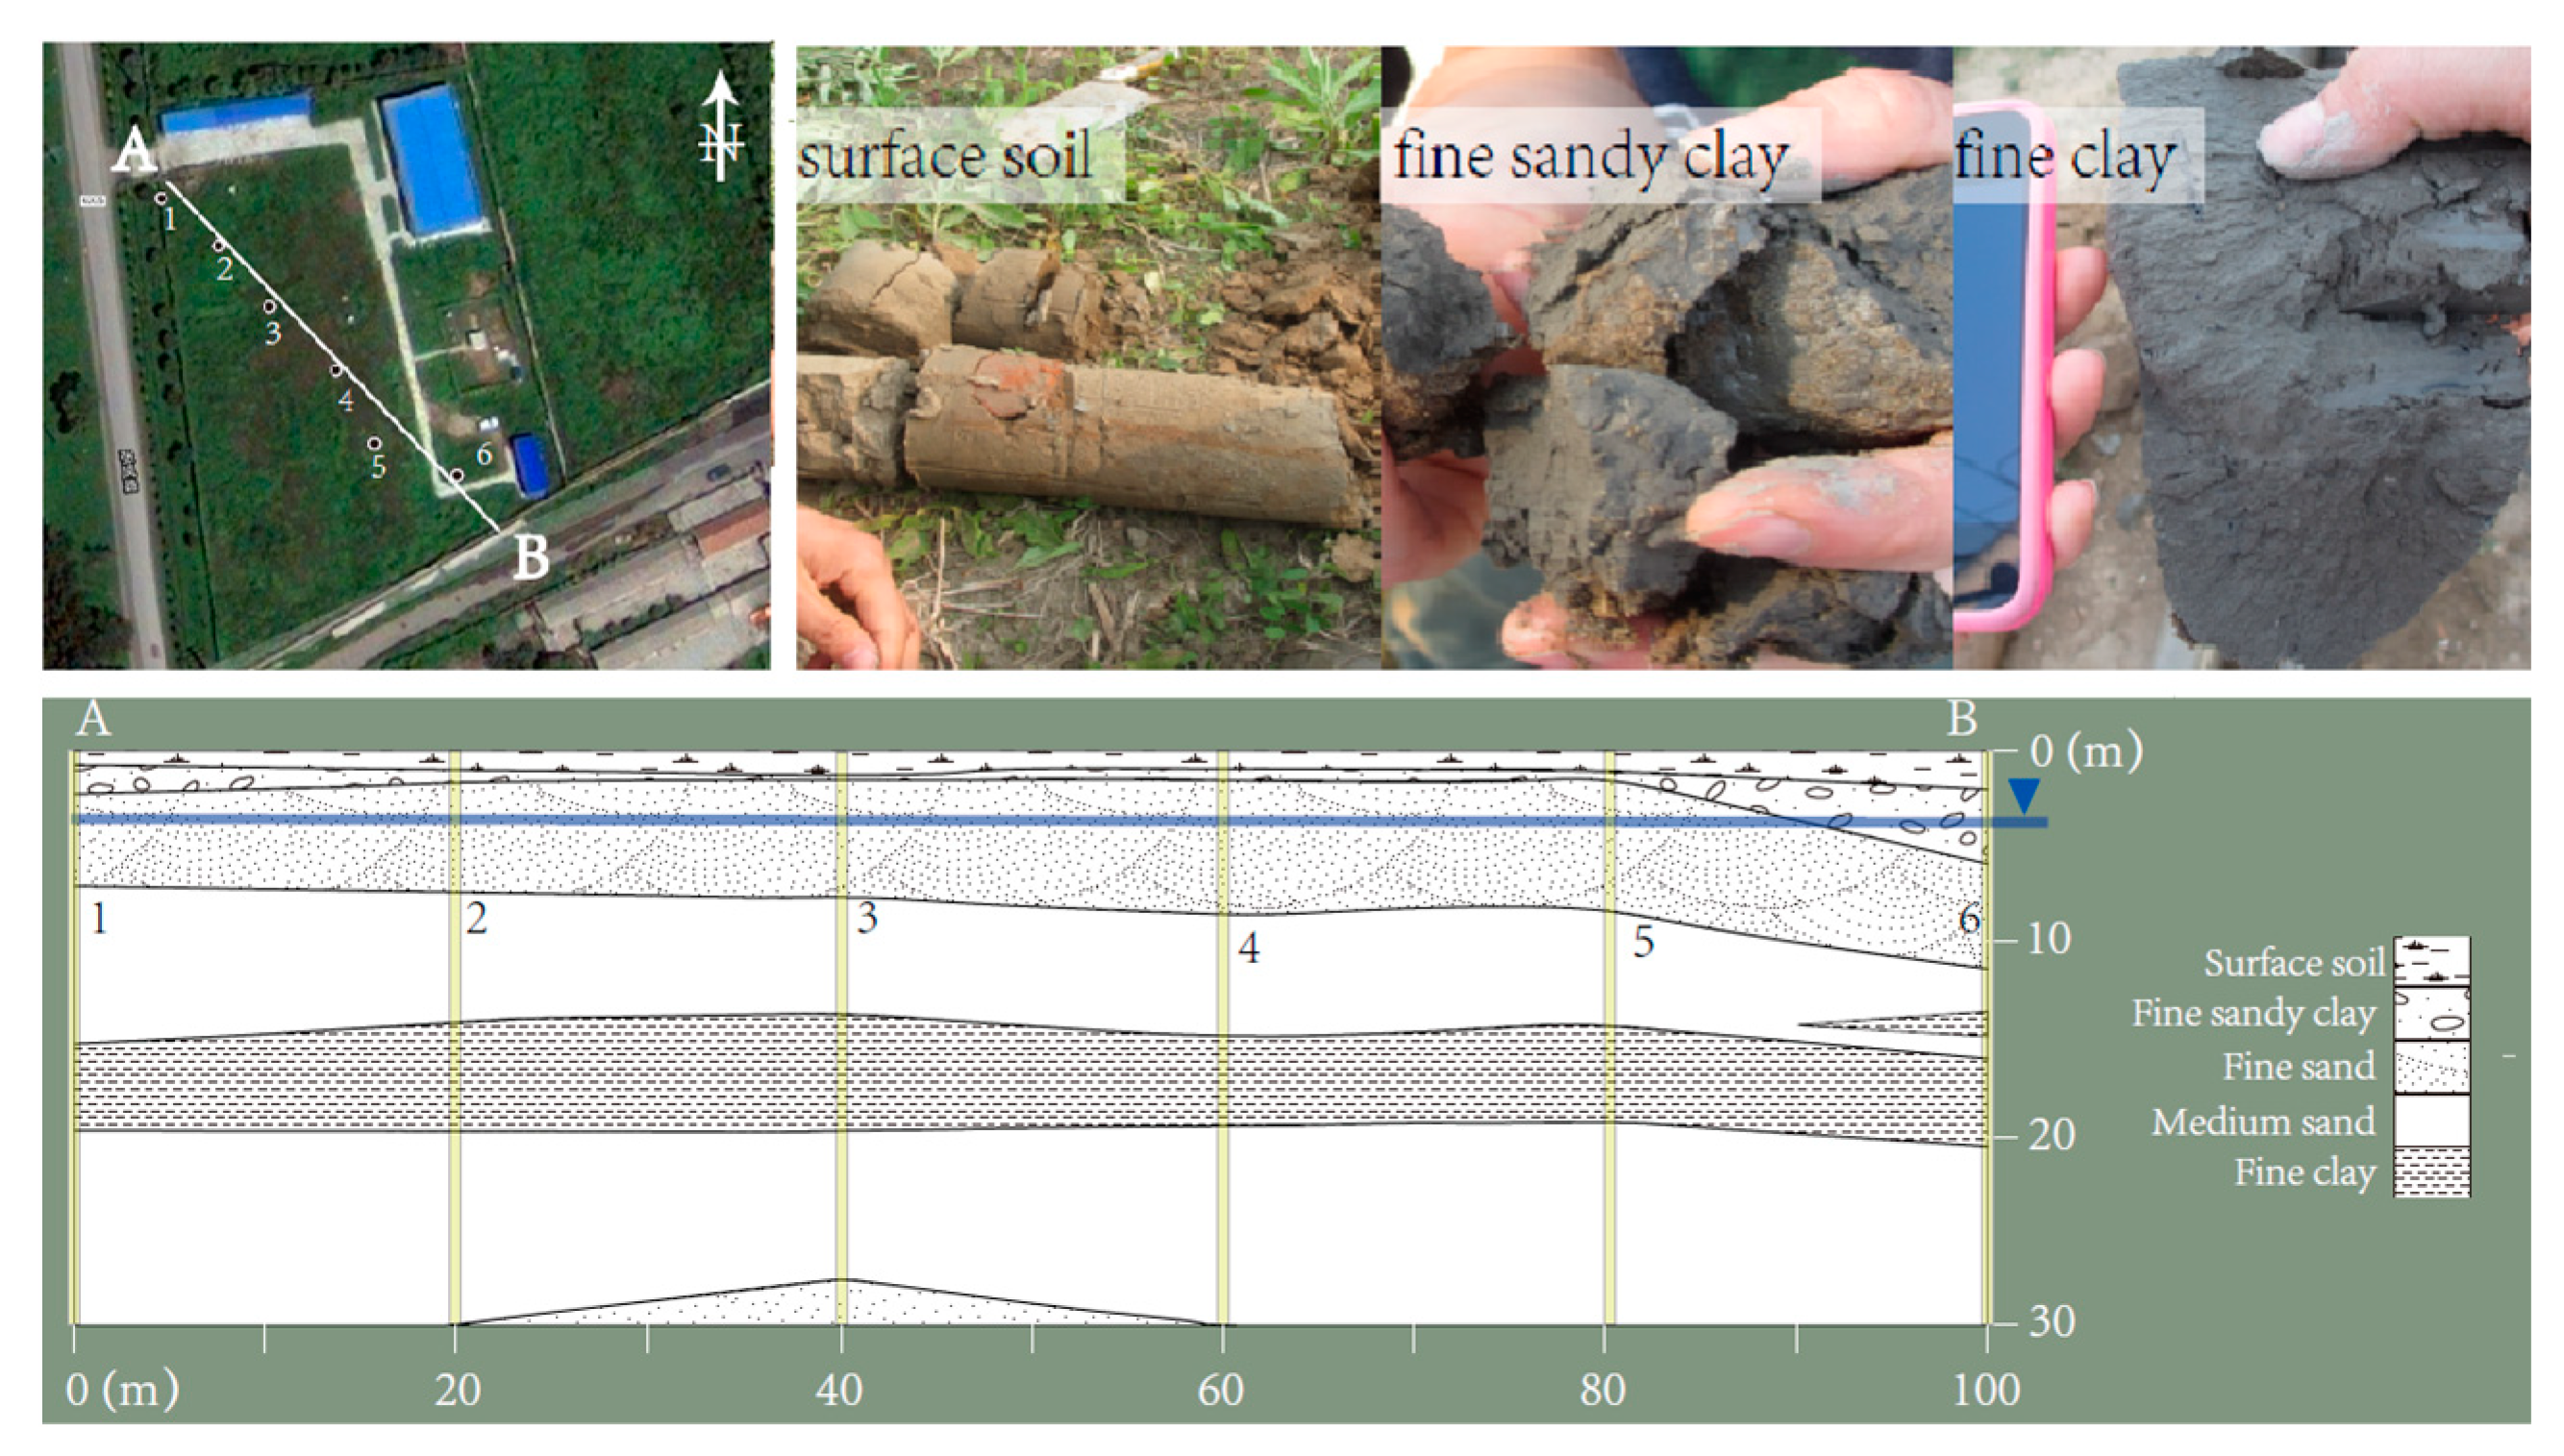
2.1. Sediment Preparation

The sediments used in this study were collected from the Tongzhou Site in Beijing (Figure 1). The red line in Figure 1b was the outlet of groundwater. Before 2003, the Tongzhou Site was characterized as typical agricultural land. Soil nitrate pollution has become a serious issue at this site due to excessive fertilization. Groundwater pollution affects people’s lives and has become an urgent environmental problem. The site was selected to be a scientific research station in November in 2003. The Ministry of Land and Resources (MLR) of the People’s Republic of China set up a subsidence observation station and an unsaturated zone experimental observation station at the Tongzhou Site from 2004 to 2008. A series of hydrology investigations were conducted in the winter of 2010. In May 2012, five geology wells were drilled. Silty clay was sampled at a depth from 18.2 m to 18.4 m, representing a low permeability soil type. One of the typical geological sections is shown in Figure 2. The sediments were sieved through mesh with holes that were 2 mm in size in order to remove large blocks, fauna, and shell debris. After air drying, the sediment was ground and then filled into a column using a wet method. The total amount of sediment that filled in the column was 216 g.

2.2. Experimental Setup

A stainless-steel cylindrical column was used in this experiment. The column’s inner diameter and length were 3.5 cm and 15 cm, respectively. The inner surface was smeared with Vaseline to prevent bypass flow. In order to stop the flow scouring the sediment, a layer of 2.5 cm thick quartz was uniformly distributed on the top and bottom surfaces of the column. Then, a 0.22 μm filter was placed on the top surface to prevent the medium from going into subsequent equipment. To keep the soil column saturated, an HPLC pump was used to inject deionized water into the soil column from the bottom before the experiment. This process lasted for over 50 h, continuing until no nitrate was detected in the outflow. The influence of nitrate in the soil was removed in this step. A total of 100 mL of a mixture of KNO3 and KBr was injected into the column after saturating and leaching, and the fraction collector took aqueous samples from the top of the soil column. Nitrate, nitrite bromide, and ammonia concentrations in the samples were measured. The nitrate, nitrite, and bromide concentrations were determined using Ion Chromatography and ammonia was determined using ultraviolet spectrophotometry.
Five groups of various experimental conditions were set up:
  • Group 1: different concentrations (100 mg/L and 50 mg/L).
The flow rate was 0.1 mL/min. The sediment in the column was silty clay.
  • Group 2: different pH values.
The pH values were 5, 7, and 10. The nitrate concentration was 100 mg/L. The solution was a mixture of HCI, KBr, and KNO3. H2SO4 and NaOH were used to regulate the pH.
  • Group 3: different Darcy’s velocity.
The flow rate was 0.1 mL/min or 0.2 mL/min. The nitrate concentration was 100 mg/L. The sediment in the column was silty clay.
  • Group 4: intermittent experiment.
A total of 100 mg/L of a nitrate and bromide mixture solution was injected into the column for 17 h at a rate of 0.1 mL/min. The injection was stopped for 48 h. Then, the mixture solution continued to be injected until the bromide concentration in the outflow reached its initial concentration. Deionized water was then injected into the column. The sediment in the column was silty clay.
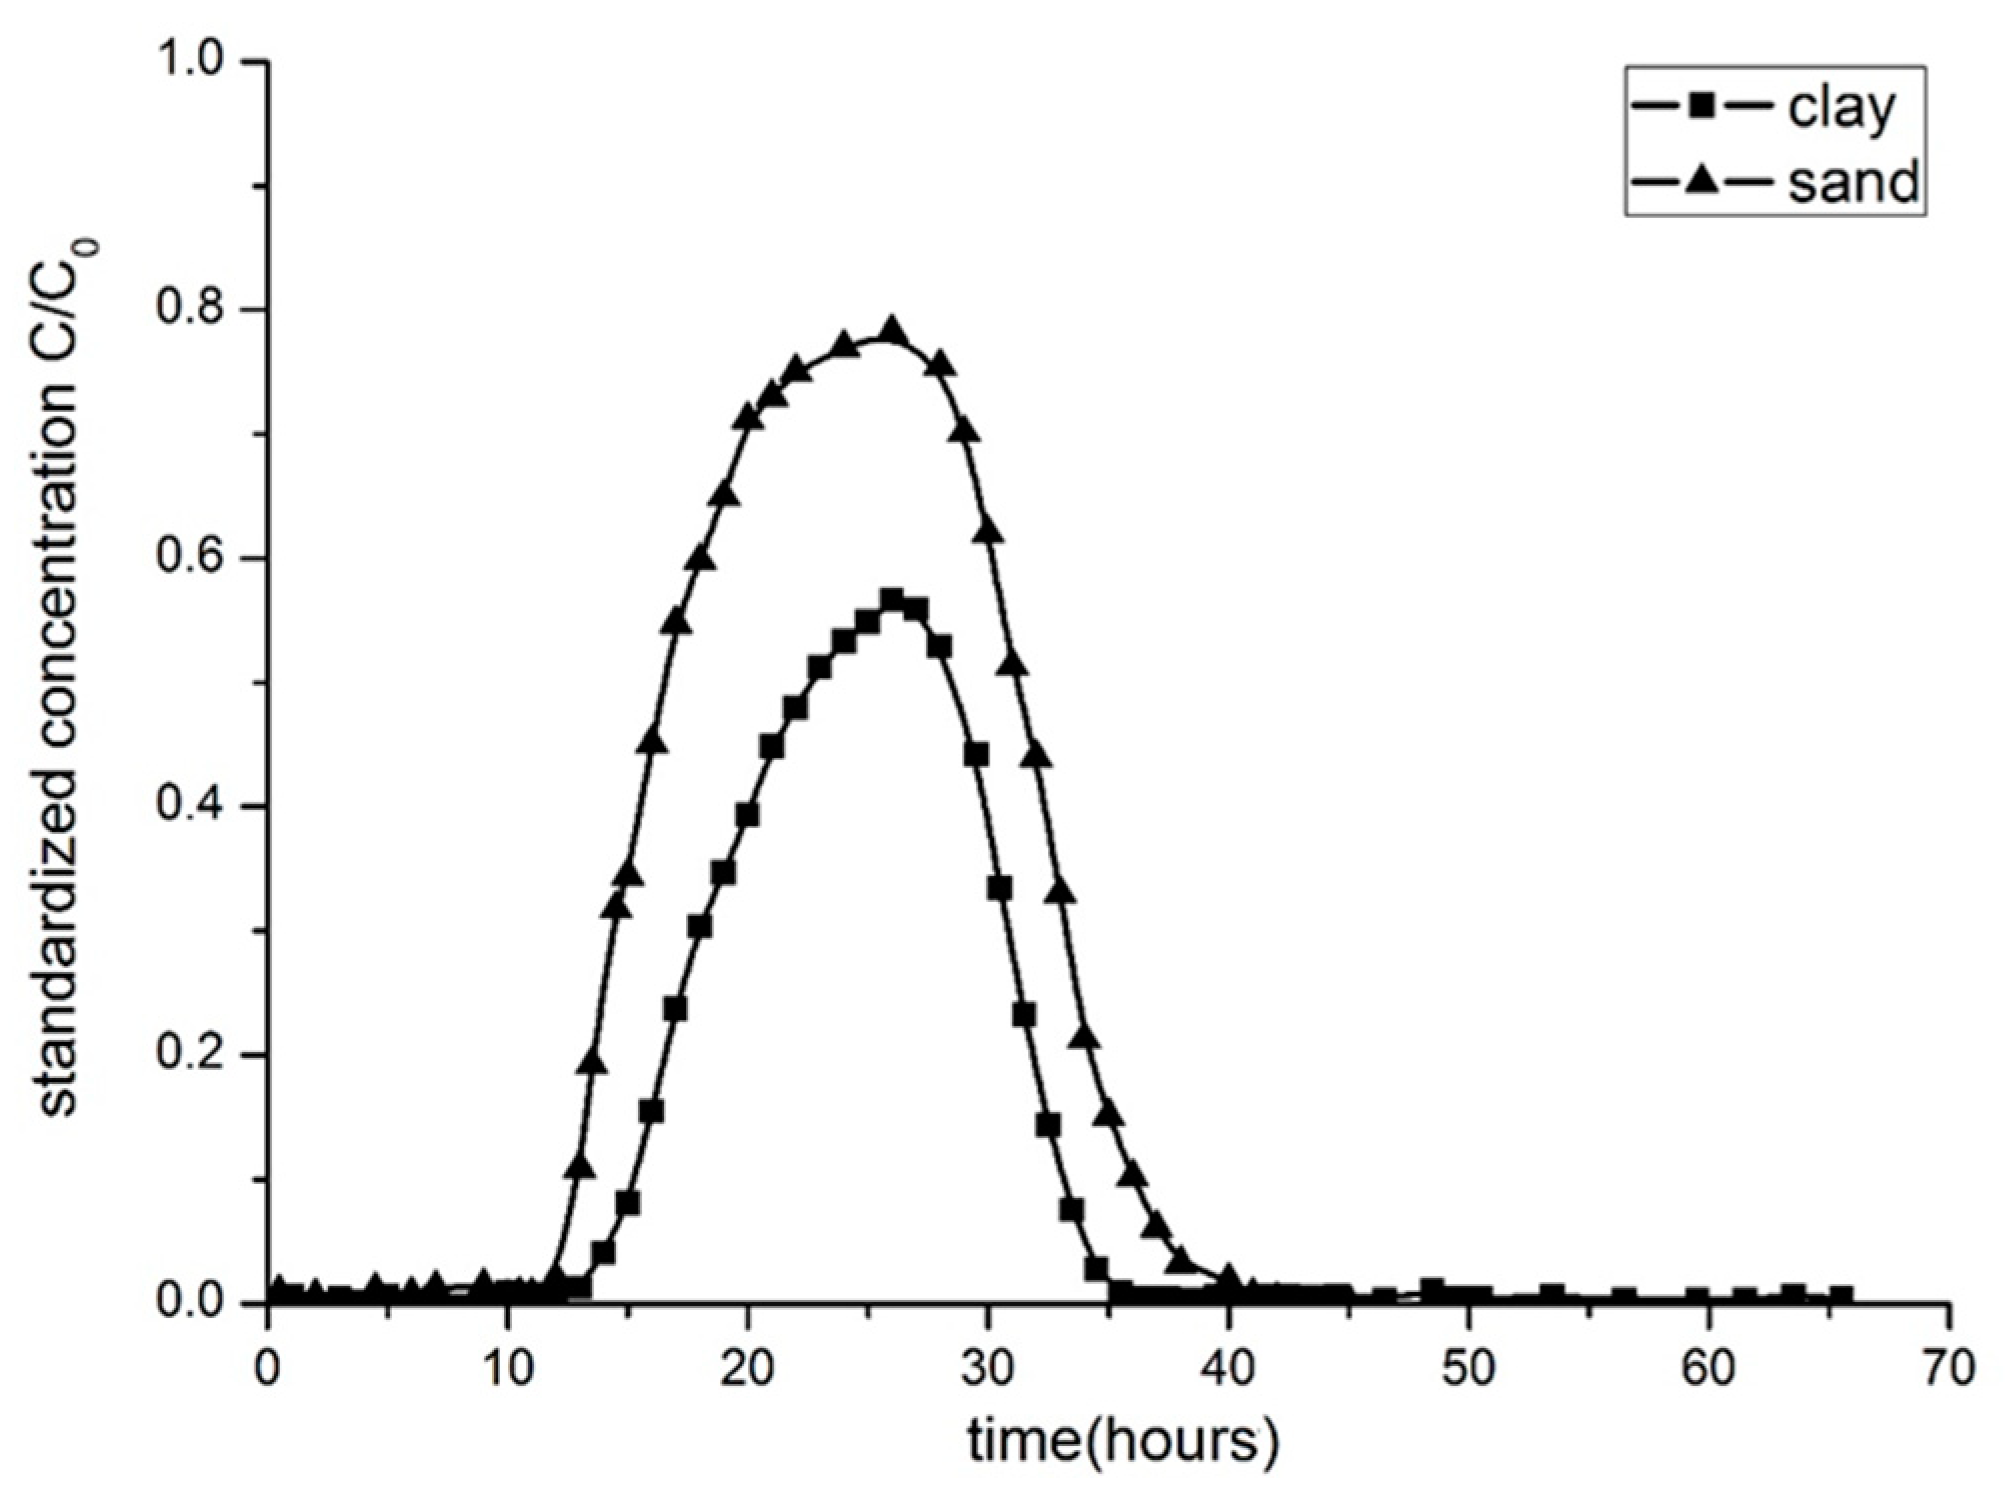
  • Group 5: sediment of different textures.
Silty clay and fine sand filled in the column. A total of 100 mg/L of a nitrate and bromide mixture solution was injected into the column at a rate of 0.1 mL/min.
The five groups of experimental conditions are listed in Table 1.

2.3. Transformation Modeling

In order to quantify denitrification in the low permeation layer, a one-dimensional nitrate transport model was developed by MODFLOW and MT3D. MODFLOW was developed by USGS [19] and MT3D was developed by Zheng in 1993 [20]. MT3D is a transport model based on MODFLOW. The water inlet was defined as a fixed flux boundary in the transport model, and the water outlet was defined as a constant head boundary. We speculated that adsorption and denitrification reactions occurred in the soil. Adsorption was defined as a liner action and denitrification was defined as a first depth decay action. The governing equation is as follows:
𝜕 C 𝜕 t = D L 𝜕 2 C 𝜕 x 2 v x 𝜕 C 𝜕 x B d θ 𝜕 C * 𝜕 t + 𝜕 C 𝜕 t r x n
C * = K d C
𝜕 C 𝜕 t r x n = K C
The initial condition is as follows:
C x , 0 = 0 ,   x ( 0 , L ]
The boundary conditions are as follows:
C 0 , t = C 0 ,   t [ 0 , t 0 )
C 0 , t = 0 ,   t [ t 0 , )
where C is the dissolved concentration of nitrate, t is time, t0 is the injection time of a solution, DL is the vertical hydrodynamic dispersion coefficient tensor, L is the length of the column, vx is the velocity of groundwater flux, K is the coefficient of the first depth of the denitrification reaction, Kd is the adsorption distribution coefficient, θ is the porosity of the sediment in the column, and C* is the nitrate concentration of the soil.
The porosity was determined in the laboratory and the dispersion coefficient was calculated according to the results of bromide. The experimental equation used to calculate the dispersion coefficient can be expressed as follows:
D L = V 2 8 t 0.5 ( t _ 0.8413 t _ 0.1587 ) 2
In this study, the concentration solution column experiment was combined to calculate the dispersivity.

3. Results and Discussion

3.1. Soil Properties

The type of soil used in this study was silty clay. A soil micro-aggregate composition analysis was conducted to determine the soil particle diameter properties. The results are shown in Table 2. The physical and chemical properties of the soil are listed in Table 3.
The Tongzhou Site was used as farmland. Fertilizer and manure were widely used. Thus, the nitrate concentration was especially higher than normal sediments. An X-ray diffraction analysis was used to analyze the mineral components of the sediment. The results are shown in Table 4.

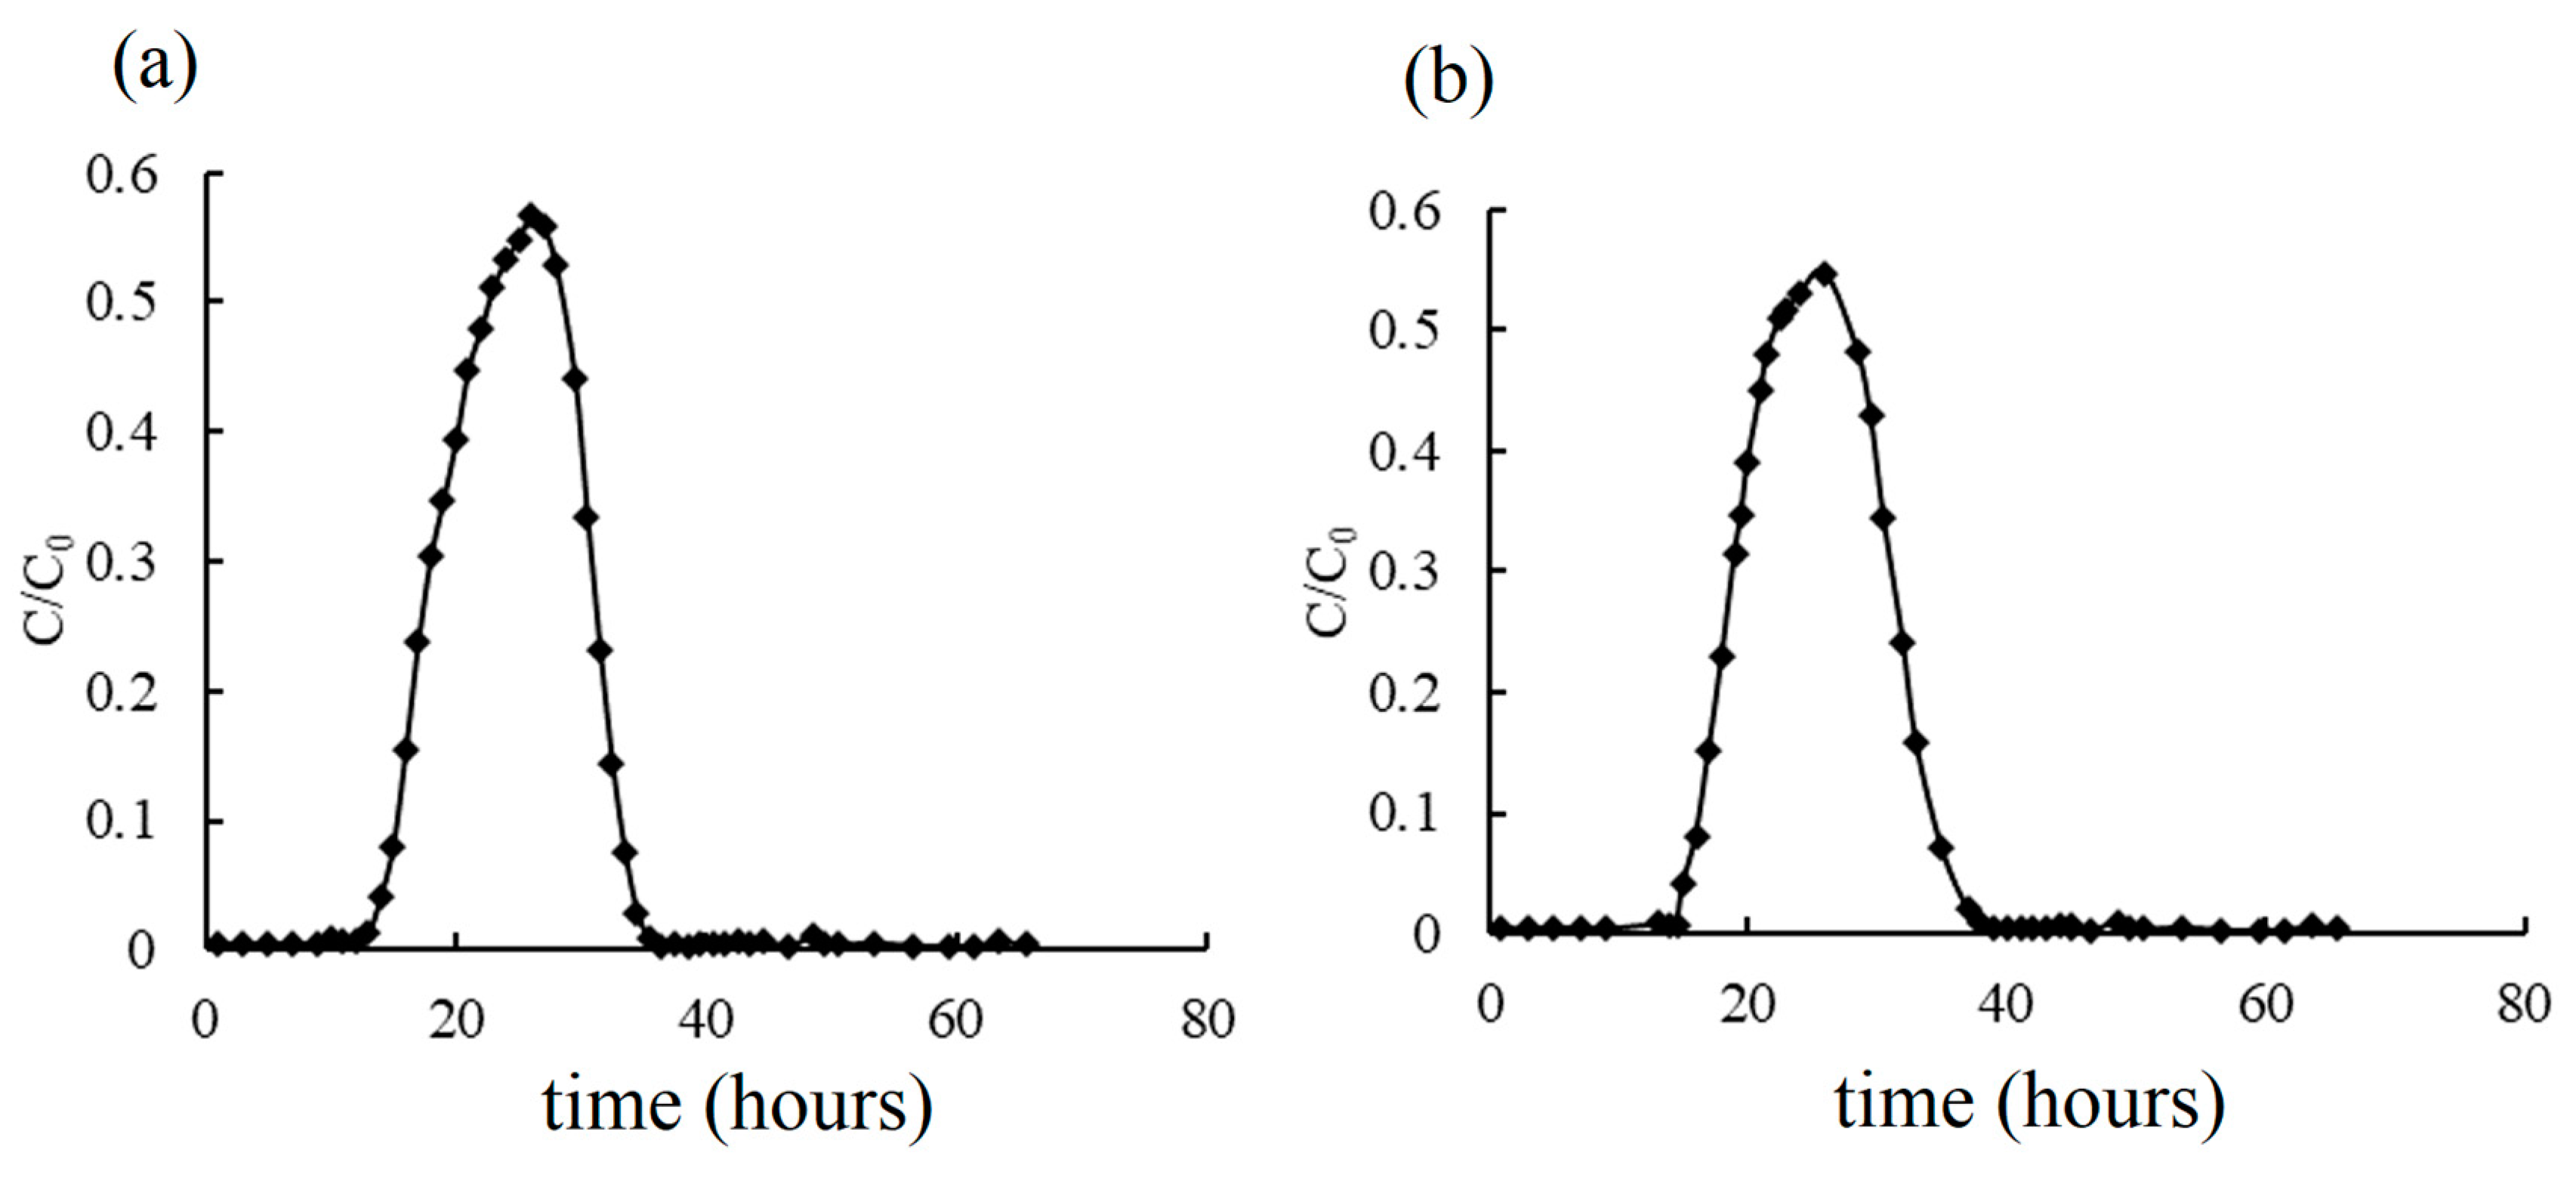
3.2. Breakthrough Curves by Experimentation

Column experiments have often been applied to measure potential denitrification rates. Experimental conditions can easily be controlled and simulated. A bromide solution is usually used as a conservative tracer to estimate the parameters of migration numerical models. It cannot be adsorbed and it cannot react in the sediment. Figure 3 shows the results of the migration of bromine and nitrate solutions in the column experiments. The initial transport time was defined as the initial breakthrough time when the solution front first reached the column boundary. The complete transport time was defined as the breakthrough time when the column boundary outflow concentration was stable. It can be noted in Figure 3 that the bromine breakthrough curve has a wide distribution and a high peak, and the nitrate breakthrough curve has a narrow distribution and a low peak. The nitrate initial breakthrough time was nearly 2 h later than bromine, whereas the nitrate breakthrough time was shorter than bromine. The peak ratio of bromide was close to 1, and the nitrate peak ratio reached a maximum value of only 0.56.
In Clay’s experiment [21], bromide transports faster than nitrate in the unsaturated zone. Clay concluded that the more rapid transport of bromide compared to nitrate was due to the lower adsorption of bromide compared to nitrate. Our experiments were applied in the saturated zone. The possible origin is the reaction. For nitrate, the physical, biological, and chemical reactions occurred in the column, and the nitrate concentration decreased. For bromide, no reaction in the conservative solute was achieved. The low peak values of nitrate were attributed to the denitrification reaction. The denitrification reaction was a complex biochemical reaction. It is very difficult to describe this reaction, but it can be concluded that the low permeation layer strongly decreased the concentration of nitrate. The aquifer medium contained abundant denitrification processes. The following experiment of this study aimed to summarize some factors that affect denitrification reactions.

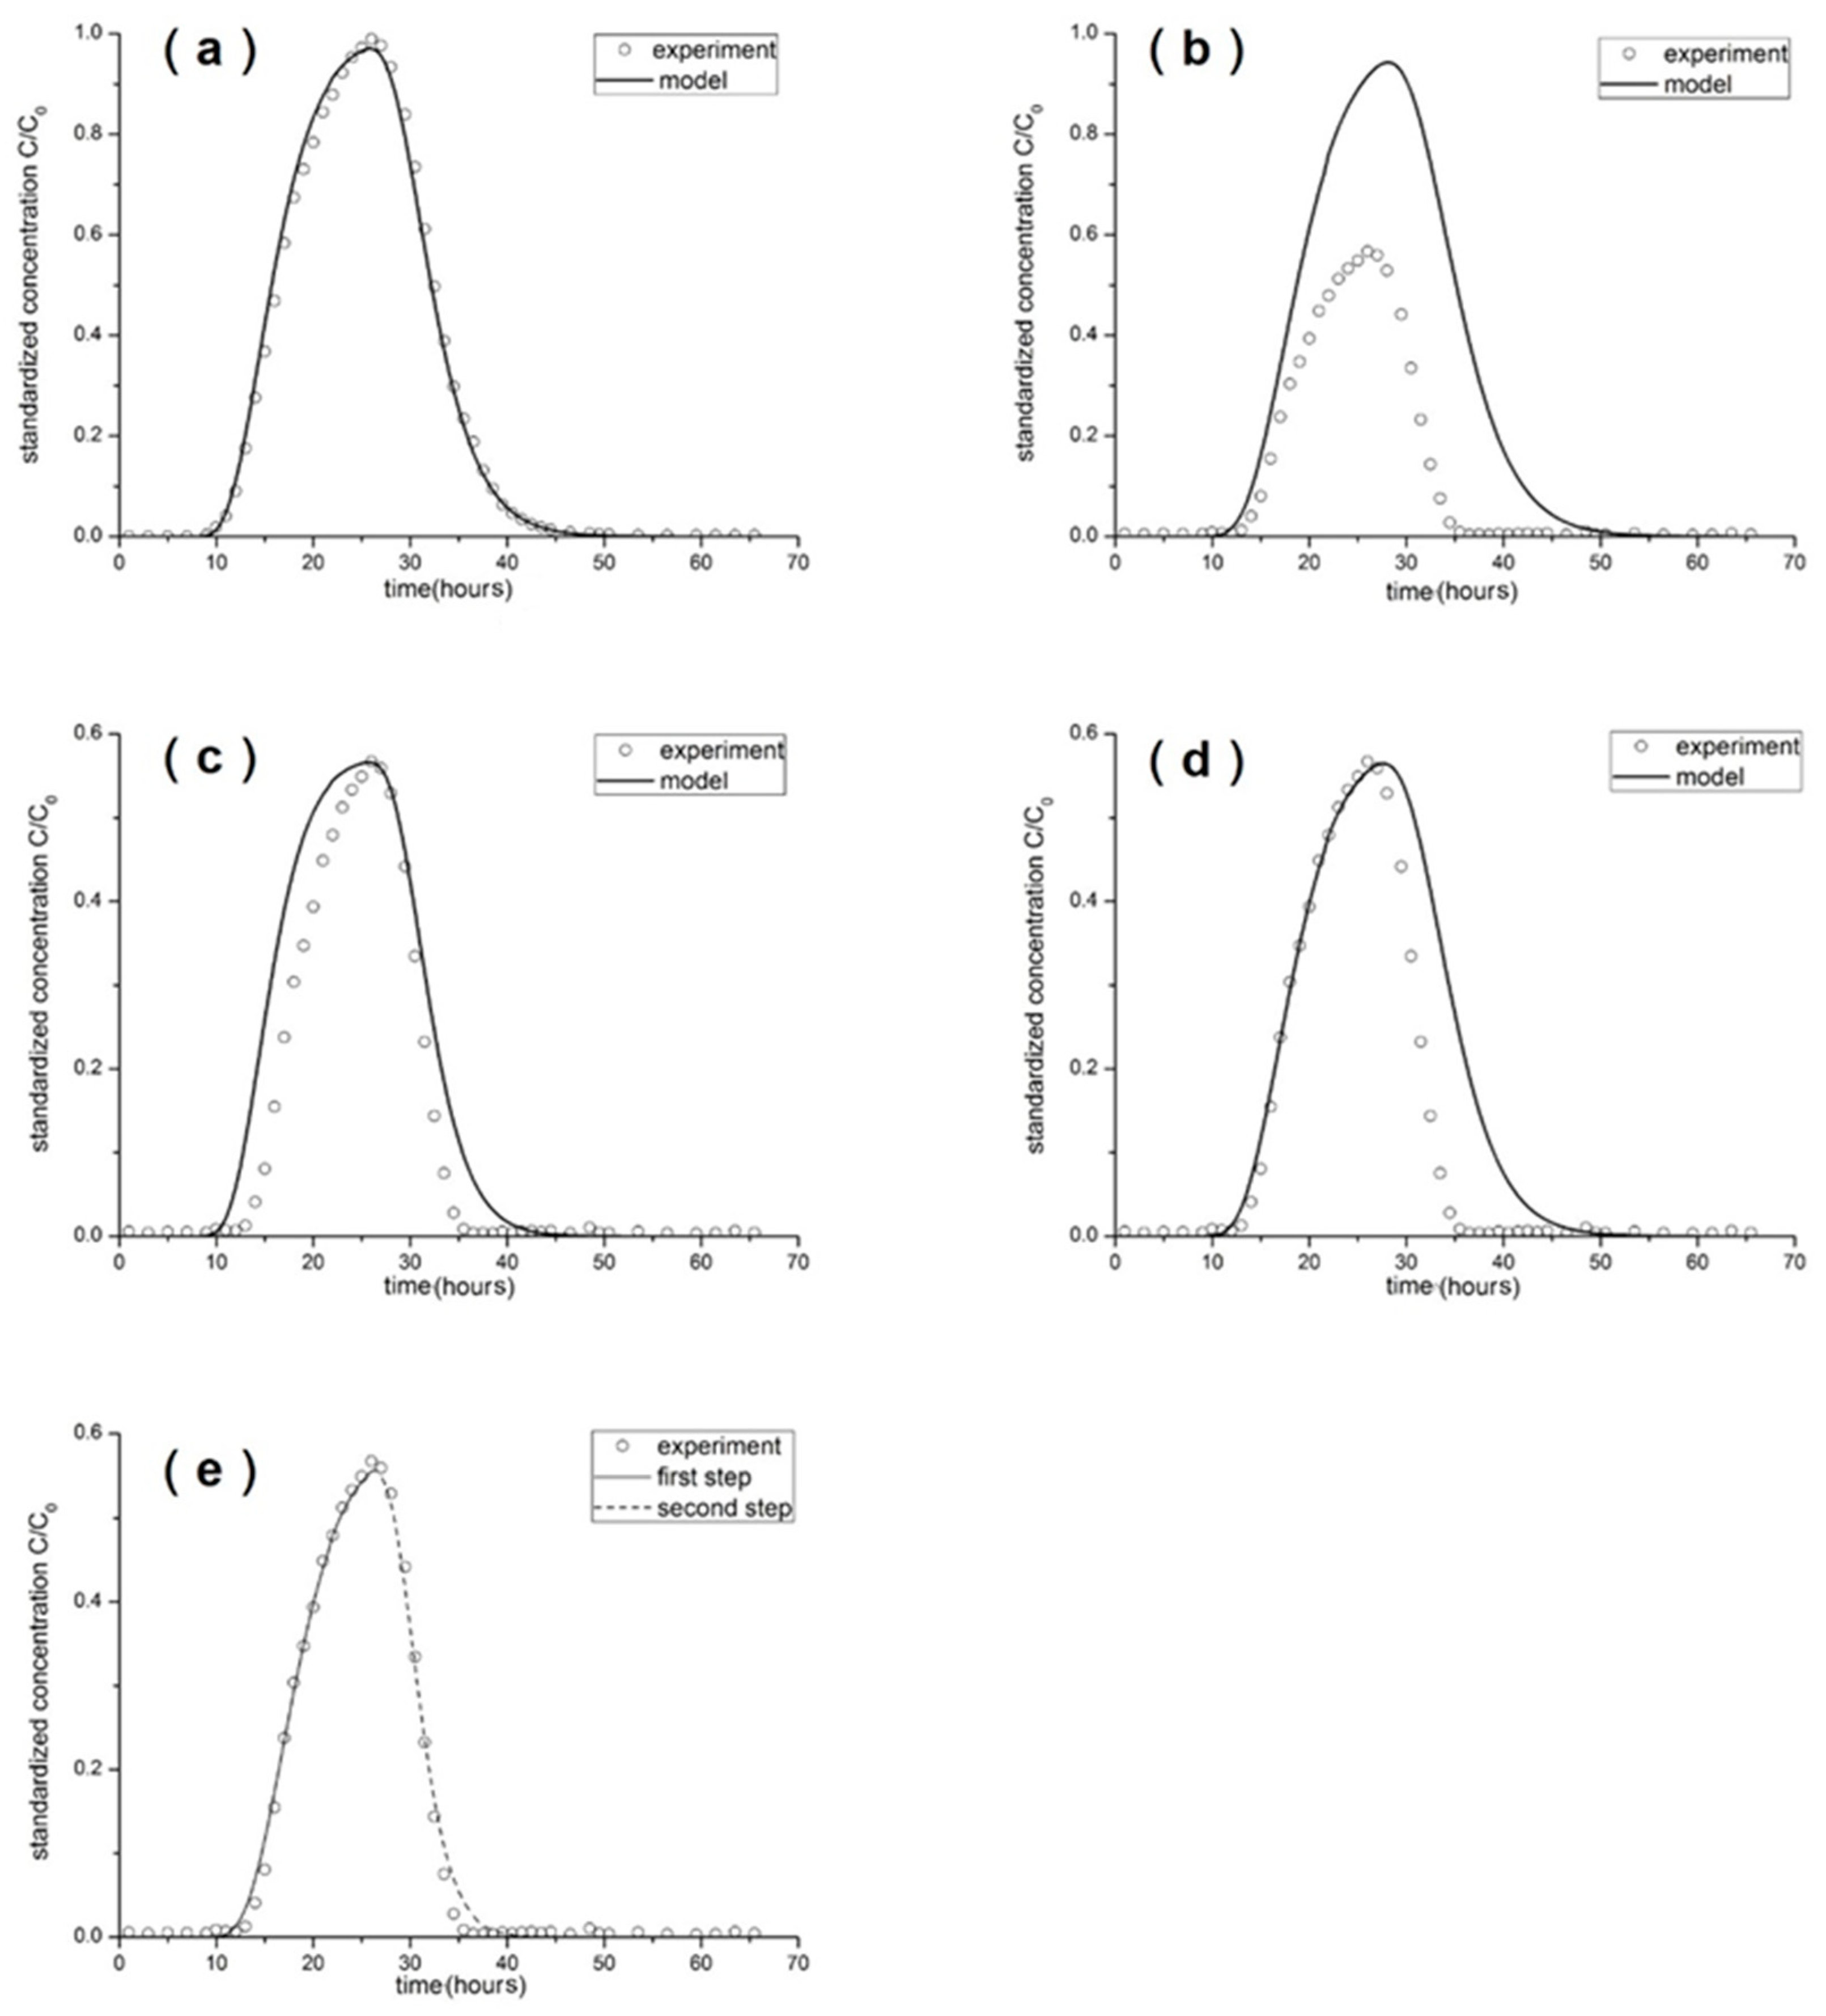
3.3. Breakthrough Curves by Simulation

In order to study the migration and transformation mechanisms of nitrate ions in the aquitard, the penetration curve of nitrate ions in the aquitard was simulated. An MT3D model was developed to fit the results of the column experiment. Bromide was used as a conservation solute to estimate the coefficients for developing the numerical solution transport model. The adsorption reaction items can be removed from the transport equation, and the governing equation can be expressed as follows:
𝜕 C 𝜕 t = D L 𝜕 2 C 𝜕 x 2 v x 𝜕 C 𝜕 x
Dispersivity can be calculated by combining the results of the bromide column experiment. The dispersion coefficient and dispersivity were calculated to be 1.25 and 0.8 cm, respectively.
The transport model coefficient is shown in Table 5. Porosity was determined in the lab.
The simulation results are shown in Figure 4a.
According to Figure 4a, the bromine stimulation results fit well to the column experimental results. Thus, the parameters were creditable. The coefficient was used in the nitrate transport model.
Figure 4b shows the model results of nitrate transport, considering adsorption only. The peak value was close to 1, which was much higher than the results of the column experiments. The nitrate ion has relatively weak adsorption in soil, making it a less adsorbed ion. As a result, the nitrate ion exhibits relatively fast migration in soil and is more prone to entering water bodies. Therefore, the following stimulations (Figure 4c–e) considered the reaction items.
Figure 4c shows the model results of nitrate transport, considering denitrification only. In most research and in our former work, denitrification was a first-order kinetics reaction.
In our previous research, the K value was calculated to equal 1.19/day. It can be noted in Figure 4c that the peak value was much closer to the experimental results; however, the initial time was earlier than for the experimental results and the concentration was higher than the experimental results. Furthermore, for the entire rising process of the breakthrough curve, the experimental data lag for the simulation and the delay time were quite similar. In other words, the slope of the experimental breakthrough curve was roughly equivalent to that of the simulated breakthrough curve. This is consistent with the hindering effect caused by adsorption. Therefore, it can be concluded that during the migration of nitrate in the low permeability layer, both the denitrification and adsorption of nitrate occur. However, throughout the process, denitrification is the main reason for the reduction of nitrate.
Figure 4d shows the model results of nitrate transport, considering both adsorption and the denitrification reaction. The K and Kd values were estimated to be 0.907/day and 5 × 10⁻⁵ L/kg, respectively. It can be noted that the simulation fit the experimental results very well from the initial time to the peak values, considering both adsorption and denitrification. However, the experimental concentration decreased faster than the simulation after the peak values. The simulation concentration was higher than the experimental results. It is likely that the increased activity of denitrifying bacteria in the soil column after a certain period of cultivation leads to a higher denitrification rate. As a result, the denitrification process of nitrate is stronger in the later stages. Therefore, it is necessary to simulate the denitrification process in stages to account for these variations.
The process was divided into two steps in the next simulation. In the first step, a first order decay coefficient was set up. According to Figure 4d, the model fit the experimental results well before the peak value. The simulation values were higher than the experimental values after reaching the peak value of boundary concentration. Then, the experimental concentration decreased faster. This result is consistent with the distribution of the bromine breakthrough curve (BRT), being wider than the nitrate BRT at the same concentration, and the peak values were larger than nitrate. This result was in accordance with our denitrification kinetic experimental results. Two days of culture were needed for the denitrification bacteria. The denitrification tense significantly increased following the peak value. The process was divided into two steps: the first twenty-six hours and the rest of the time. The denitrification rate was a constant value during the first step, and a higher constant value was obtained during the second step. The model results are shown in Figure 4e. The denitrification rate of the first step was 0.907/day and the dentrification rate of the second step was 1.296/day. The denitrification rate increased by nearly 43% in the second step compared to the first step. It can be noted that the model results fit the experiment results much better. The Kd value was kept constant at 5 × 10⁻⁵ L/kg. Generally, culturing denitrification bacteria costs time and, in this experiment, bacterial activity affected the denitrification rate. Therefore, the denitrification rate in the second step was set to be larger than the former step. The adsorption of nitrate in low permeation layers is a hotspot issue. The adsorption really exists in our simulation and cannot be ignored, although this adsorption is not significant.

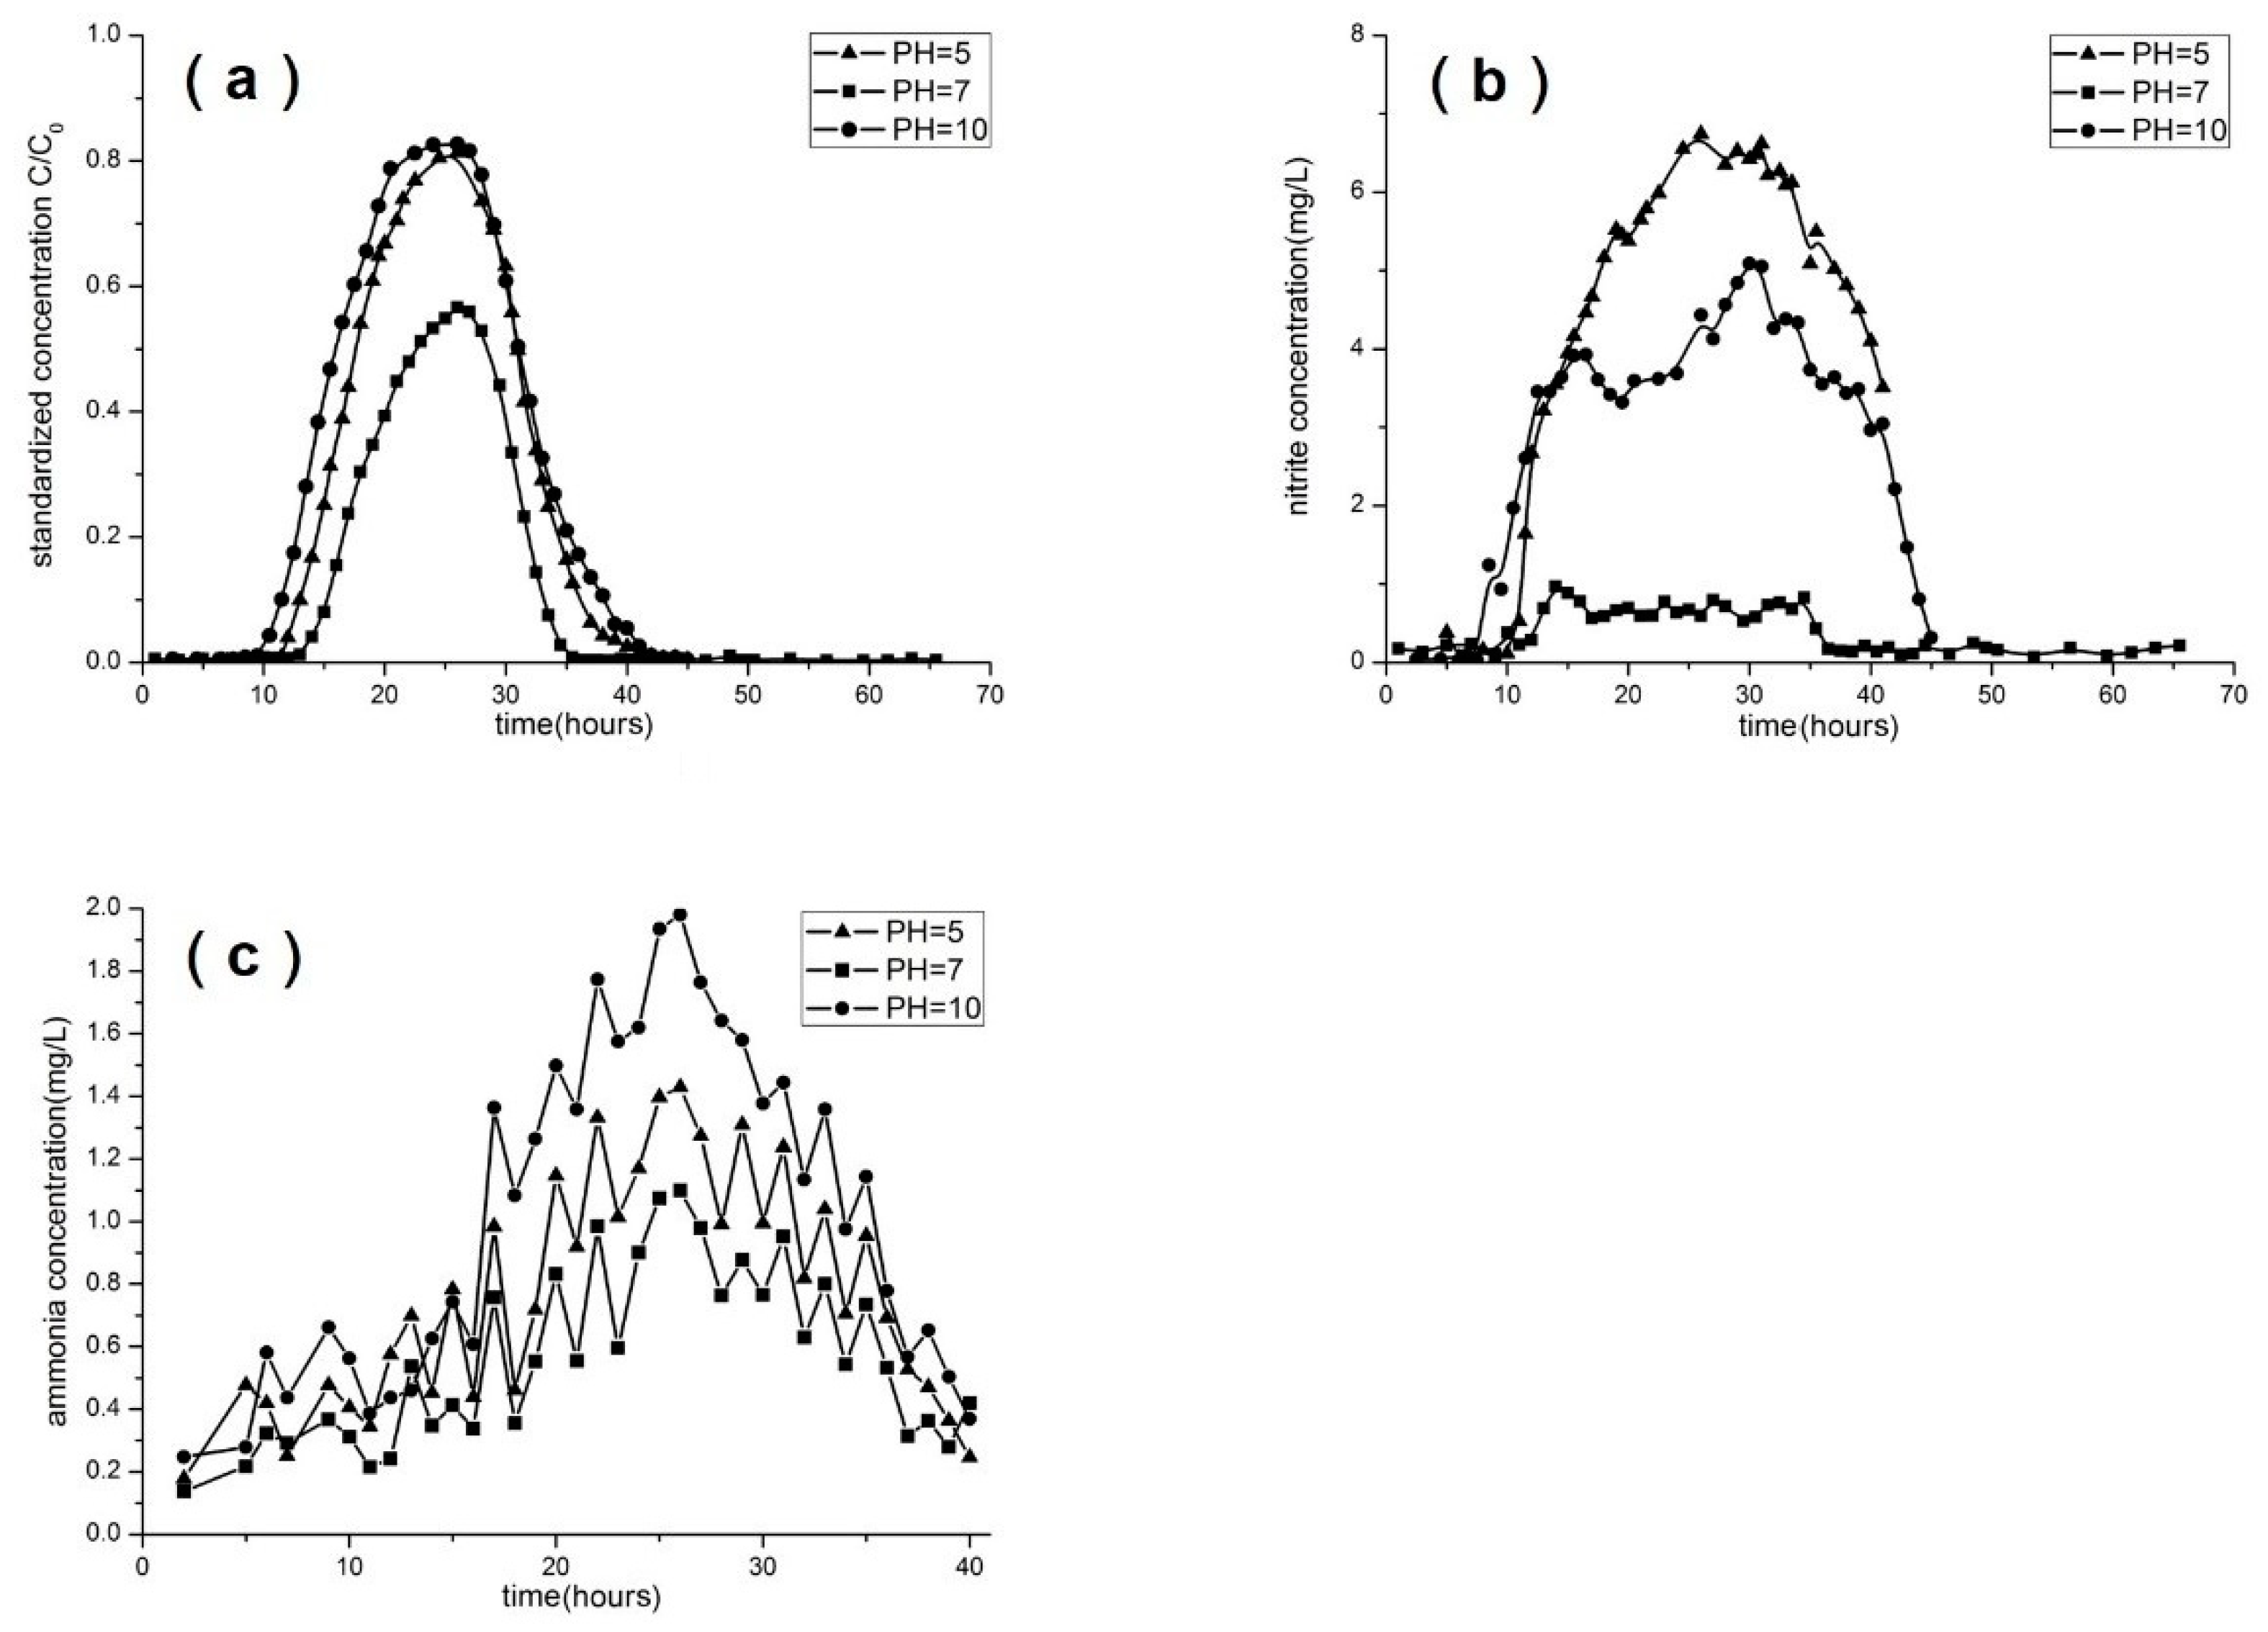
3.4. Effect of Concentration, pH, Flow Rate, and Soil Type

Figure 5 shows the transport of nitrate at different concentrations in the column experiments. It can be noted that the nitrate BRTs were almost the same under different nitrate concentrations. As a result, nitrate concentration did not affect the denitrification rate between the concentrations of 50 mg/L and 100 mg/L. The outflow concentration was higher under high concentration conditions, although the denitrification rate was almost the same. In field conditions, the leaching of high concentrations of nitrate can lead to the infiltration of high levels of nitrate into groundwater, resulting in groundwater pollution. This type of pollution can have negative impacts on drinking water and ecosystems.
Figure 6 shows the results of nitrate transport under different pH values. It can be noted in Figure 6a that nitrate has a strong transport ability under acidic and alkaline conditions. The peak value of the standardized concentration was boosted up to 0.8, whereas the peak value was only 0.56 under neutral conditions. This shows that under acidic or alkaline conditions, the ability of the low permeation layer to intercept nitrate ions is greatly reduced, and the denitrification and adsorption of nitrate are greatly reduced. Figure 6b shows that the concentration of nitrite is extremely high under acidic and alkaline conditions. This indicates that acidity and alkalinity can inhibit nitrate and nitrite reductase, reduce nitrate removal, and stimulate nitrite accumulation.
The concentration of ammonia under alkaline conditions was much higher than that under neutral and acidic conditions, as shown in Figure 6c. The pH value is considered the master variable of soil [7]. The relationship between pH and the denitrification rate has been studied since the 1950s. It is widely agreed that the optimum pH for denitrification bacteria is 7.0–8.1 [7]. The findings demonstrated that alkalinity stimulated the process of dissimilatory nitrate reduction to ammonia, resulting in an increase in ammonia concentration. Under acidic conditions, the ammonia concentration was a little higher than that under neutral conditions. This may be because the adsorption capacity of the low permeation layer decreased under acidic condition. As the pH value decreases, the hydrolytic equilibrium shifts in the opposite direction, leading to an increase in ammonia concentration.
Figure 7 shows the results of nitrate transport under different flow rates. According to Figure 7a, the breakthrough time was shorter for high velocity compared to low velocity, and the process reached the peak value faster. At a double-speed flow rate, the peak value of the standardized concentration was up to 0.8. The peak value equaled 0.56 at the normal-speed flow rate. This indicates that different velocities have a strong effect on nitrate adsorption and denitrification. A higher velocity resulted in decreased nitrate adsorption and a decreased denitrification rate. As Darcy’s velocity increases, nitrate cannot sufficiently come into contact with sediments, resulting in a decrease in both adsorption and the denitrification rate. This leads to an increase in the outflow concentration.
On the contrary, based on the results shown in Figure 7b,c, the changes in the breakthrough curves of nitrite and ammonium are not so obvious. If you ignore the shock and only look at the trend, there is no difference between the two curves. This indicates that flow rate has little effect on the absolute values of denitrification and ammonification. The effect of flow rate on denitrification and ammonification is shown in relative values.
When the solution was introduced for 17 h, followed by a 48 h period without inflow and solution collection, and then resuming with an additional 8 h of solution introduction before switching to deionized water pumping, a breakthrough curve was obtained (Figure 7d). It was observed that during the 48 h period of no operation, the denitrification and adsorption rates were significantly higher compared to the other two stages. This further illustrates the important influence of velocity on the migration and transformation of nitrate ions in the low permeability layer. When the flow velocity is zero, the denitrification and adsorption rates of nitrate ions increase significantly. The higher denitrification rate observed in the third stage, compared to the first stage, also indicates an increase in the denitrification rate due to the significant proliferation of microorganisms over time.
Figure 8 shows the results of nitrate transport in silty clay and fine sand. It can be noted from the results that the breakthrough time of nitrate was shorter in fine sand and the nitrate peak value was close to 0.8, which is higher than the peak value of silty clay. This indicates that fine sand is less effective than silty clay in acting as a barrier to nitrate transport. Different particle sizes have different porosities and hydraulic conductivities, thus leading to different reaction rates. Table 6 presents the parameters obtained through the simulation of nitrate transport in the fine sand column.
The denitrification rate of fine sand (K) was 0.518/day, which is almost 50% lower than that of silty clay.
The Kd value was 2.5 × 10⁻⁵ L/kg, which is 50% lower than that of silty clay. It can be concluded from the results that that sediment particle size had a significant effect on nitrate transport. Smaller grain content was found to have a weaker ability to remove nitrate. The higher the clay content, the higher the organic matter content. Consequently, the denitrification process of nitrate became stronger, and the soil exhibited a greater inhibitory effect on nitrate. As a result, the adsorption and denitrification rates of nitrate ions were higher when passing through the low permeability layer.

4. Conclusions

This study focused on the mechanisms that affect nitrate transport in the low permeability layer. The low permeability layer plays an important role in slowing down the migration of nitrate in the groundwater system. A column soil experiment was designed and an MT3D transport model of nitrate was developed in order to understand the mechanism of nitrate migration in a low permeability system. This study aimed to establish a foundation for simulating the migration of nitrate pollution from shallow groundwater to deep groundwater through lateral flow under field conditions. The conclusions of this study are as follows:
Nitrate concentration can decrease dramatically in the low permeation layer. When nitrate passes through a low permeability layer, it undergoes processes such as adsorption and denitrification. Among these processes, denitrification is the primary factor, and it is enhanced with the progression of microbial reactions. Additionally, the low permeability layer exhibits a weak adsorption capacity for nitrate ions.
The concentration of nitrate has little influence on its migration and transformation in low permeability layers. The rate of denitrification remains almost the same. However, high concentrations of nitrate can inhibit nitrite reductase and promote the reduction of nitrate to ammonium, resulting in the accumulation of nitrite and ammonium.
Under acidic or alkaline conditions, both the denitrification and adsorption of nitrate in low permeability layers are greatly reduced. At a pH of 5 or a pH of 10, the denitrification rate of nitrate decreased by approximately 70% and the adsorption rate decreased by approximately 90%. Acidic or alkaline conditions inhibit nitrite reductase, leading to the accumulation of nitrite. Alkaline conditions promote the reduction of nitrate to ammonium, resulting in an increase in ammonium.
Different velocities had a strong effect on nitrate adsorption and denitrification. A higher velocity resulted in a decrease in nitrate adsorption and the denitrification rate. When the velocity was doubled, the denitrification rate of nitrate decreased by approximately 30% and the adsorption rate decreased by approximately 90%.
The sediment particle had a significant effect on nitrate transport, and smaller grain content had a weaker ability to remove nitrate. The adsorption rate and denitrification rate of nitrate in fine sand were only 50% of those in the low permeability layer.
The model results can be used to explain the experimental phenomena and verify the theory. In turn, the experimental results can also verify the validity of the model, contributing to modifications in the structure of the model. In our experiments, the model results were validated. Although this study focused on a one-dimensional soil column, the conclusions drawn from this study can be considered universal. Future investigations can study three-dimensional solute transport and promote the application of the model in managing actual nitrogen pollution.
A one-dimensional model was chosen for this study due to the typically thin nature of the low permeability layer. The level of the horizontal migration of pollutants in actual observations can be ignored. This study clarified the laws of migration and transformation of nitrate in low permeability soils, as well as the factors that influence these processes. The results not only provide a basis for conducting larger-scale nitrate simulations, but also provide a reference for the treatment of nitrate in low permeability layers.

Author Contributions

Conceptualization, S.W. and X.W.; methodology, S.W.; Software, S.W.; validation, B.W.; formal analysis, B.W.; investigation, B.W.; resources, S.W. and B.W.; data curation, Y.W.; writing—original draft preparation, S.W.; writing—review and editing, B.W.; visualization, X.W.; supervision, X.W.; project administration, S.W.; funding acquisition, S.W. and B.W. All authors have read and agreed to the published version of the manuscript.

Funding

This research was funded by the Geological survey projects of China Geological Survey (DD20230077 and DD20221754) and National Natural Science Foundation of China (41702280).

Data Availability Statement

The data presented in this study are available on request from the corresponding author. The data are not publicly available due to our need for further analysis.

Acknowledgments

We thank the Institute of Water Resources Research Center, Peking University for their assistance with the laboratory experiments.

Conflicts of Interest

The authors declare no conflict of interest.

References

  1. Comly, H.H. Cyanosis in infants caused by nitrates in well water. JAMA 1945, 129, 112–116. [Google Scholar] [CrossRef]
  2. Naranjo, R.C.; Welborn, T.L.; Rosen, M.R. The Distribution and Modeling of Nitrate Transport in the Carson Valley Alluvial Aquifer, Douglas County, Nevada; U.S. Geological Survey Scientific Investigations Report 2013–5136, 51p; US Geological Survey: Reston, VA, USA, 2013; 51p. [Google Scholar]
  3. Van Der Hoek, J.P.; Klapwijk, A. Nitrate removal from ground water. Water Res. 1987, 21, 989–997. [Google Scholar] [CrossRef]
  4. Knowles, R. Denitrification. Microbiol. Rev. 1982, 46, 43. [Google Scholar] [CrossRef] [PubMed]
  5. Rivett, M.O.; Buss, S.R.; Morgan, P. Nitrate attenuation in groundwater: A review of biogeochemical controlling processes. Water Res. 2008, 42, 4215–4232. [Google Scholar] [CrossRef] [PubMed]
  6. Stanford, G.; Vander Pol, R.A.; Dzienia, S. Denitrification Rates in Relation to Total and Extractable Soil Carbon 1. Soil Sci. Soc. Am. J. 1975, 39, 284–289. [Google Scholar] [CrossRef]
  7. Šimek, M.; Jíšová, L.; Hopkins, D.W. What is the so-called optimum pH for denitrification in soil? Soil Biol. Biochem. 2002, 34, 1227–1234. [Google Scholar] [CrossRef]
  8. Kessler, A.J.; Glud, R.N.; Bayani Cardenas, M.; Larsen, M.; Bourke, M.F.; Cook, P.L. Quantifying denitrification in rippled permeable sands through combined flume experiments and modeling. Limnol. Ocean. 2012, 57, 1217. [Google Scholar] [CrossRef]
  9. Hamlin, H.J.; Michaels, J.T.; Beaulaton, C.M. Comparing denitrification rates and carbon sources in commercial scale upflow denitrification biological filters in aquaculture. Aquac. Eng. 2008, 38, 79–92. [Google Scholar] [CrossRef]
  10. Boudreau, B.P. Diagenetic Models and Their Implementation; Springer: Berlin, Germany, 1997; pp. 152–155. [Google Scholar]
  11. Šimůnek, J.; Jarvis, N.J.; Van Genuchten, M.T. Review and comparison of models for describing non-equilibrium and preferential flow and transport in the vadose zone. J. Hydrol. 2003, 272, 14–35. [Google Scholar] [CrossRef]
  12. Hanson, B.R.; Šimůnek, J.; Hopmans, J.W. Evaluation of urea–ammonium–nitrate fertigation with drip irrigation using numerical modeling. Agric. Water Manag. 2006, 86, 102–113. [Google Scholar] [CrossRef]
  13. Spall, S.A.; Richards, K.J. A numerical model of mesoscale frontal instabilities and plankton dynamics—I. Model formulation and initial experiments. Deep Sea Res. Part I Oceanogr. Res. Pap. 2000, 47, 1261–1301. [Google Scholar] [CrossRef]
  14. Li, J.; Zhang, J.; Rao, M. Modeling of water flow and nitrate transport under surface drip fertigation. Trans. ASAE 2005, 48, 627–637. [Google Scholar] [CrossRef]
  15. Gärdenäs, A.I.; Hopmans, J.W.; Hanson, B.R. Two-dimensional modeling of nitrate leaching for various fertigation scenarios under micro-irrigation. Agric. Water Manag. 2005, 74, 219–242. [Google Scholar] [CrossRef]
  16. Heatwole, K.K.; McCray, J.E. Modeling potential vadose-zone transport of nitrogen from onsite wastewater systems at the development scale. J. Contam. Hydrol. 2007, 91, 184–201. [Google Scholar] [CrossRef] [PubMed]
  17. Chen, D.J.Z.; MacQuarrie, K.T.B. Numerical simulation of organic carbon, nitrate, and nitrogen isotope behavior during denitrification in a riparian zone. J. Hydrol. 2004, 293, 235–254. [Google Scholar] [CrossRef]
  18. Tesoriero, A.J.; Liebscher, H.; Cox, S.E. Mechanism and rate of denitrification in an agricultural watershed: Electron and mass balance along groundwater flow paths. Water Resour. Res. 2000, 36, 1545–1559. [Google Scholar] [CrossRef]
  19. Harbaugh, A.W. MODFLOW-2005, the US Geological Survey Modular Ground-Water Model: The Ground-Water Flow Process; US Department of the Interior, US Geological Survey: Reston, VA, USA, 2005. [Google Scholar]
  20. Zheng, C.; Weaver, J.; Tonkin, M. MT3DMS, a Modular Three-Dimensional Multispecies Transport Model—User Guide to the Hydrocarbon Spill Source (HSS) Package; US Environmental Protection Agency: Athens, Georgia, 2010. [Google Scholar]
  21. Clay, D.E.; Zheng, Z.; Liu, Z. Bromide and nitrate movement through undisturbed soil columns. J. Environ. Qual. 2004, 33, 338–342. [Google Scholar] [CrossRef] [PubMed]
Figure 1. Location and images of the Tongzhou Field Site. (a) Location and terrain of Beijing; (b) Aerial view of Tongzhou Site; (c) Real scene of Tongzhou site.
Water 15 02528 g001
Figure 2. A typical geological section in the Tongzhou Field Site. Data from the core logs of well points 1–6 were extrapolated to construct the transect AB, as shown in cross-section below. Sandy units contain occasional shell fragments and small gravel. Upper sandy clay units contain mica fragments, as well as fine clay lenses throughout. Clay-bearing units contain Fe, Mn, and some organics.
Water 15 02528 g002
Figure 3. The results of the bromine and nitrate column experiments.
Water 15 02528 g003
Figure 4. The results of the solute transport simulations. (a) Simulating bromine transport; (b) simulating nitrate transport, considering adsorption only; (c) simulating nitrate transport, considering denitrification only; (d) simulating nitrate transport, considering adsorption and denitrification; and (e) simulating nitrate transport, considering adsorption and two-step denitrification.
Water 15 02528 g004
Figure 5. Nitrate transport at different concentrations in the column experiments. (a) 100 mg/L; (b) 50 mg/L.
Water 15 02528 g005
Figure 6. Results of the nitrate transport column experiments under different pH values: (a) nitrate, (b) nitrite, and (c) ammonia concentrations were measured.
Water 15 02528 g006
Figure 7. Results of the nitrate transport experiment with different values of Darcy’s velocity. Nitrate (a), nitrite (b), and ammonia (c) concentrations were measured. An intermittent time of 48 h was applied (d).
Water 15 02528 g007
Figure 8. Results of nitrate transport in the column experiment with different sediment particles.
Water 15 02528 g008
Table 1. Five groups of experimental conditions.
GroupConcentration (mg/L)pHVelocity (mL/min)IntermittentSoil Type
1100, 5070.1nonesilty clay
21005, 7, 100.1nonesilty clay
310070.1, 0.2nonesilty clay
410070.148 hsilty clay
510070.1nonesilty clay, fine sand
Table 2. Soil particle analysis.
Particle size2–0.05 mm0.05–0.002 mm<0.002 mm
Percentage5.58%52.78%41.64%
Table 3. Physical and chemical properties of the soil.
PropertiesValues
pH value7.68
Available nitrogen (mg/kg)57.7
Ammonia–nitrogen (mg/kg)45.7
Nitrite–nitrogen (mg/kg)54.2
Nitrate–nitrogen (mg/kg)104.6
Total nitrogen (%)0.073
Organic matter (g/kg)7.03
Total dissolved solids (g/kg)1.47
Cation exchange capacity (cmol/kg)28.1
Table 4. Soil mineral components.
Mineral ComponentPercentage
Quartz41%
Microcline4%
Albite19%
Clinochlore9%
Muscovite4%
Calcite16%
Dolomite5%
pyrite2%
Table 5. Parameters of the transport model.
ParameterValue
Diameter3.5 cm
Length15 cm
Hydraulic conductivity5.8 × 10−7 cm/s
Dispersivity0.8 cm
Porosity40%
Flow rate0.1 mL/min
Table 6. Parameters of nitrate transport in the fine sand column.
ParameterValue
Diameter3.5 cm
Length15 cm
Hydraulic conductivity1.23 × 10−5 cm/s
Dispersivity0.53 cm
Porosity35%
Flow rate0.1 mL/min
Disclaimer/Publisher’s Note: The statements, opinions and data contained in all publications are solely those of the individual author(s) and contributor(s) and not of MDPI and/or the editor(s). MDPI and/or the editor(s) disclaim responsibility for any injury to people or property resulting from any ideas, methods, instructions or products referred to in the content.

