Article

‘Dual Purpose’ Surface Flow Constructed Treatment Wetlands Support Native Biodiversity in Intensified Agricultural Landscapes

by
Brandon C. Goeller
1,*,
James P. S. Sukias
2,
Simon J. R. Woodward
2,3 and
Beverley R. Clarkson
4
1
National Institute of Water and Atmospheric Research (NIWA), 217 Akersten Street, Nelson 7010, New Zealand
2
National Institute of Water and Atmospheric Research (NIWA), P.O. Box 11115, Hamilton 3216, New Zealand
3
DairyNZ, Private Bag 3221, Hamilton 3240, New Zealand
4
Manaaki Whenua—Landcare Research, Private Bag 3127, Hamilton 3240, New Zealand
*
Author to whom correspondence should be addressed.
Water 2023, 15(14), 2526; https://doi.org/10.3390/w15142526
Submission received: 17 May 2023 / Revised: 27 June 2023 / Accepted: 3 July 2023 / Published: 10 July 2023
(This article belongs to the Special Issue Advances in Engineered Wetlands for Treating Agricultural Runoff)

Abstract

:
In agricultural landscapes, free-water surface flow wetlands (FWS) are constructed mainly to improve water quality; however, their contribution to biodiversity conservation is increasingly recognised. To inform biodiversity management in FWS treating agricultural runoff, we surveyed the vegetation and fauna assemblages in five established FWS in a lowland, pastoral landscape in the central North Island, New Zealand. The FWS had been established for between 3 and 19 years, planted with a restricted range of native plant species, and fenced to exclude livestock access. Larger wetlands hosted significantly more plant and mammal species. However, other than wetland size, we found few other significant relationships between wetland habitat, landscape characteristics, and measures of biodiversity (total species, proportion of native species, number of wetland specialists, or threatened species). We recorded one-hundred and thirteen plant, twenty bird, five mammal, eighty-five terrestrial invertebrates, forty-seven aquatic invertebrates, six fish, and two amphibian species inhabiting the FWS. Native species comprised 96% of the total aquatic invertebrate fauna identified. For other taxa, native flora and fauna accounted for half or less than half of all species identified: 53% terrestrial invertebrates, 50% fish, 45% birds, 32% plants, and 0% amphibian and mammal species. Few wetland specialists (aquatic or wetland-adapted) or threatened native species were detected, probably reflecting the limited range of wetland plant species in initial plantings and the difficulties native taxa face when colonising new habitat where potential reservoirs of colonist species are also depauperate or too distant. FWS support native biodiversity, but further enhancements may require active management of exotic and pest species to minimise competition or predation on native species.

1. Introduction

Wetlands are some of the most valuable ecosystems on the planet, by virtue of their role in sustaining ecosystem services [1]. These include maintaining water quality and supply, regulating climate, protecting shorelines, sustaining native biodiversity, flood mitigation, and providing cultural, recreational, and educational resources [2]. However, on a global scale, wetlands have increasingly been destroyed and converted to other land uses [3]. The extent of wetland loss ranges from minor losses in boreal region countries to >90% losses in parts of Europe [4] and New Zealand [5]. This reduction in wetlands, which animals rely on for foraging, breeding, and nesting habitat [6,7], combined with increasing nutrient inputs from agricultural land use, has resulted in major eutrophication and biodiversity loss [8]. Conversely, restoring natural wetlands and establishing constructed treatment wetlands can provide environmental benefits, including buffering runoff, reducing erosion, attenuating nutrients and other contaminants, and mitigating biodiversity loss [9,10].
In agricultural landscapes, constructing free water surface flow wetlands (FWS; a type of constructed treatment wetlands) as a series of small, densely vegetated, shallow ponds is one of the most common and cost-effective ecological engineering practices to improve water quality [11,12,13]. FWS location within a catchment, size of ponded areas, water depths, and planted vegetation species and coverage are usually optimised to maximise the attenuation of diffuse source pollutants [14,15]. Therefore, most environmental monitoring of agricultural FWS has focused on water quality performance aspects such as water storage, nutrient transformation, and sediment capture [11,16]. However, FWS planted with native vegetation across a range of inundated zones, surrounding embankments, and terrestrial buffers can provide species and habitat diversity that have otherwise been lost or degraded due to wetland drainage and land clearance to support agricultural land use [8,17]. Therefore, FWS are increasingly referred to as ‘dual purpose’, with the expectation that they improve water quality as well as enhance biodiversity [8,17]. However, the habitat available to flora and fauna in FWS can vary substantially from restored wetlands or ‘integrated’ constructed wetlands, which are designed to attenuate pollutants from wastewater while providing habitat for wetland-dependent species, as design in FWS rarely takes into account biodiversity outcomes [18,19].
The biodiversity of constructed treatment wetlands has been reviewed by Wiegleb et al. [20] and Zhang et al. [19], who concluded that these offer sub-optimal habitats yet support wetland-dependent species. However, these reviews generalise across treatment wetlands constructed with different hydrological designs and treatment wetlands constructed in contrasting land-uses and environmental contexts (e.g., municipal wastewater, stormwater, and agricultural runoff systems), making it difficult to ascertain clear biodiversity outcomes specifically for agricultural settings. Conversely, published biodiversity evaluations of dual-purpose FWS in agricultural landscapes have mostly focused on aquatic invertebrates [17,21,22,23], with fewer studies on plants, birds, and amphibians [8,24,25,26]. Positive biodiversity benefits of wetlands constructed in agricultural areas include establishment of native hydrophyte vegetation [24,27] and colonisation by aquatic and terrestrial invertebrates [8,21]. These in turn provide habitat and food resources for amphibians, water birds, mammals, and fish [25,27,28]. However, constructed wetlands may serve as ‘ecological traps’ (i.e., a preferred habitat but of poorer quality) and may also provide habitat for pest species, thereby reducing the survival and reproduction of native species [19]. Analogous to natural wetlands, the biodiversity supported by FWS likely depends on regional species pools, habitat suitability within the wetland, and the wetland’s connectivity or isolation within the surrounding landscape [29]. Gaining a clearer understanding of the biodiversity supported by agricultural FWS and the factors that influence it can help landowners develop farm environmental management plans that integrate water quality and native biodiversity into agroecosystems, thereby increasing farm sustainability and resilience [30].

Study Aims

We surveyed five previously established FWS in an intensified, agricultural landscape in the central North Island, New Zealand. Our first aim was to observe what flora and fauna inhabit these FWS, which were primarily designed to intercept and treat pastoral runoff with high nutrient and sediment loads. Our second aim was to identify habitat and landscape-scale factors influencing biodiversity. Outcomes from our study could guide adaptive management in existing FWS, temper expectations for restoration outcomes, and inform the design of future ‘dual purpose’ or ‘integrated’ constructed wetlands to provide multiple environmental benefits, including enhancing native biodiversity.

2. Methods

2.1. Study Region and FWS Description

We surveyed the biodiversity in five FWS in the central Waikato Region, North Island, New Zealand (37.8 S, 175.2 E), which has a temperate maritime climate and receives approximately 1200 mm of annual rainfall (Figure S1). The five FWS were chosen to represent a range of sizes, inundated zones, and vegetation representative of CTW in New Zealand pastoral landscapes while allowing comparison within the same bioregion (Figure 1). The FWS were located on poorly draining mineral and organic soils surrounded by grazed dairy pasture in flat, low-lying areas where historic wetlands had been drained and converted to farmland. All FWS, including a fenced terrestrial buffer to exclude livestock, were constructed a minimum of three years prior to our survey. The FWS were permanently or intermittently inundated by a combination of surface and/or subsurface agricultural drainage water, received high nutrient loads, and were relatively small (<0.5 ha area and <1 to 4% of their contributing surface catchment areas). A drying class was assigned to each FWS based on local hydrological knowledge and observations of the wetlands in years prior to our survey (1 = never/rarely drying, 2 = occasionally, and 3 = annually).

2.2. Characterising the FWS and the Surrounding Landscape

Aerial mapping of wetland vegetated areas and habitat was conducted in late summer 2019. Aerial photos were used to delineate the area (ha) of total fenced reserve, constructed wetland, and terrestrial buffer, as well as the number of wetland cells, islands, and surface water channels larger than 0.5 m wetted width connected to FWS inlets and outlets. The fenced reserve area was calculated as the sum of the seasonally or permanently wet FWS area plus the terrestrial buffer area located around the saturated wetland zone. Constructed wetland areas were further subdivided to calculate the areas of shallow water (<0.6 m) zones covered with emergent or submergent vegetation that extends through the entire water column, deep (>1 m) open water zones without emergent macrophyte growth, and terrestrial islands. These data were used to calculate the ratio of shallow zones with emergent vegetation. Landscape factors, including the number of waterbodies, forest fragments, and shelterbelts >0.05 ha located within a 1 km buffer of each FWS, were quantified in ArcMap 10.6 using 2017 aerial imagery sourced from the LINZ Data Service, NZ—Imagery. A buffer distance of 1 km around wetlands was chosen based on results from Findlay and Houlahan [31], who found significant distance effects of reduced forest cover and road density on species richness for multiple species within 0.5–2 km around 30 natural wetlands. Two other landscape factors were also measured in ArcMap 10.6: the Euclidean distances to the nearest permanently wet or flowing waterbody larger than 0.05 ha and the forested riparian buffer, forest patch, or shelter belt larger than 0.05 ha.

2.3. Vegetation Survey

Lists of vascular plant species were compiled from surveys of the vegetation within the fenced wetland areas conducted in late summer 2019. Vegetation types were determined based on drone photographs, and representative plots of 2 m × 2 m were established therein using a randomly generated compass bearing [32,33], with the constraint of a minimum spacing of 30 m between plots. The 2 m × 2 m plot selection follows recommendations of Clarkson et al. [34] as satisfying minimal area sample requirements for relatively short (<2 m) and/or homogeneous vegetation. The number of vegetation plots per site varied from 6 to 18, according to the wetland area and complexity of the vegetation, and totalled 64, including eight plots that crossed over the edges of the wetlands into adjoining drains, waterways, or paddocks. Within each plot, percent covers of plant species, dead plant material, litter, bare ground, and open water were recorded, along with the maximum and average height of the vegetation canopy. Plant species nomenclature and biostatus (native or exotic) followed Ngā Tipa o Aotearoa [35]. New Zealand wetland indicator status ratings were used to assign the hydrophytic plant classification for each species [36]. At the wetland scale, wetland plant species classifications were grouped as ‘aquatic’ (obligate), ‘wetland margin’ (facultative wetland and facultative), and ‘terrestrial buffer’ (upland and facultative upland). At the 4 m2 plot scale, the Prevalence Index (PI) was calculated as an indirect measure of the hydrology of each vegetation plot following Clarkson et al. [37] (Supplement S1). PI scores can be between 1 and 5, with a score ≤ 3 indicating that a plot is dominated by hydrophytic (wetland) vegetation.

2.4. Fauna Survey

Terrestrial invertebrates were surveyed using pitfall traps deployed in the wetland margins and terrestrial buffers over a month in summer 2020, coinciding with peak plant biomass [38]. Each trap was deployed in the same location as a previously surveyed vegetation plot to ensure that at least one trap was located in each vegetation type present at a site. The number of pitfall traps deployed per site varied from five to twelve to maintain a consistent sampling effort per area of wetland across sites and totalled 45 traps. Captured invertebrates were counted and identified to species level or the nearest practicable taxonomic unit in the laboratory [38] (Supplement S1).
Birds were surveyed twice at each site (once each in autumn and spring) using an acoustic recorder to record the dawn bird chorus from one hour before sunrise to two hours after sunrise. (Supplement S1). A five minute period following one hour after sunrise was used to identify species present at each wetland using RavenPro software (Cornell Lab of Ornithology, Ithaca, NY, USA) [39]. For the spring survey only, the entire three hour recording was screened to detect the presence of the critically endangered Australasian bittern (Botaurus poicilloptilus).
Introduced mammal species belonging to the families Erinaceidae (hedgehogs), Muridae (rats and mice), Mustelidae (stoats and weasels), and Phalangeridae (possums) were surveyed using tracking tunnels and baited camera traps deployed for 24 h in autumn and spring (Supplement S1). Between five and fourteen tracking tunnels were deployed per site to ensure a consistent sampling effort, with a minimum spacing of 30 m between individual traps. A total of 46 tracking tunnels were deployed across the sites. Either one or two cameras (Reconyx, USA) were deployed for 24 h, depending on the size of the FWS, following standard methods [40]. Species were identified from camera trap photos or by inked footprints from tracking tunnel cards, except for rats, which were identified as Rattus sp. [41]. Tracking tunnel detection rates were calculated for mice only as a coarse measure of abundance (e.g., low 25%, < medium 50%, and < high 75%).
Fish were sampled during the spring using a combination of fyke nets and Gee minnow traps deployed for 24 h [42]. A minimum of one and a maximum of up to three ponds were sampled per wetland with a single-wing, coarse-mesh fyke net (8 m long and 4 mm mesh) and three Gee minnow traps (3 mm mesh). A total of 45 Gee minnow traps were deployed along the shoreline of ponds and left partially exposed above the water surface to not drown air-gulping fish or amphibians captured. Additional Gee minnow traps were deployed along the shoreline of ponds without fyke nets at three sites with more than three ponds to ensure that sampling effort was scaled to the potential habitat size, with a minimum of one fyke net and four Gee minnow traps at the smallest site and three fyke nets and fourteen Gee minnow traps at site 2, with the most ponded wetland area [42]. Captured fish were collected after 24 h, identified by species (except for Gobiomorphus sp.), counted, and released (Supplement S1).
Aquatic macroinvertebrates were sampled in the spring using a hand net with 0.5 mm mesh. Two to three ponds were sampled per site, ensuring that all unique shorelines, hanging vegetation, and shallow benthic habitats (e.g., submerged wood and sediment <1 m deep) were sampled. Each sample consisted of multiple net sweeps taken over 30 s [43]. Invertebrates were counted and identified to species level or the nearest practicable taxonomic unit in the laboratory [44]. Invertebrate conservation status [45] and physiological traits [46] were matched to individual species or the nearest higher classification.

2.5. Statistical Analysis

2.5.1. Whole-Wetland Scale

For each wetland and each taxon group (vascular plants, terrestrial and aquatic insects, birds, mammals, fish, and amphibians), species richness was calculated as the total number of species and unique taxa distinguished at higher taxonomic levels (genus, family, or order). The proportion of native species to total species was also calculated for each taxon group at each wetland. For plants, both species richness and the proportion of native species were evaluated separately for the different wetland zones (i.e., terrestrial buffer, wetland margin, and aquatic). For birds, the proportion of waterbirds to total bird species within sites was also calculated.
All wetland-scale data analyses were performed in R 4.0.2 [47]. Measures of biodiversity were treated as dependent variables, and landscape and wetland habitat features (Table S1) were treated as independent variables. All variables were tested for the assumption of a normal distribution using Shapiro–Wilk normality tests using (shapiro.test) and examining quantile–quantile plots in base R. The corrplot package was used to explore significant correlations among biodiversity, habitat, and landscape variables, with alpha specified at 0.05 [48]. Significant correlations between wetland habitat and landscape parameters (independent variables) and biodiversity measures (dependent variables) were further examined using linear regression with the lmtest package in base R. The Breush–Pagan test of heteroskedasticity was performed to ensure that model residuals were normally distributed using bptest from the lmtest package [49].

2.5.2. Sub-Wetland/Plot Scale

Within the wetlands, we examined relationships between plot-scale habitat characteristics and biotic community composition for vegetation, terrestrial invertebrates (pitfall traps located within 4 m2 vegetation plots), and aquatic invertebrates (pond samples). Percentage covers for 39 plant species recorded in 56 of the 64 vegetation plots were analysed using classification (cluster analysis) and ordination techniques to identify vegetation types and determine ecological gradients. Rare species, defined as having less than 1% total cover, and plots that did not fall entirely within the fenced wetland reserve area were omitted. The programmes used were FUSE (Agglomerative Hierarchical Fusion) and SSH (Semi-Strong-Hybrid Multidimensional Scaling), respectively, within the PATN multivariate analysis package [50]. The SSH hybrid scaling technique applies an improved version of hybrid scaling, which has advantages over other ordination techniques by being more flexible and fitting output distances to input distances rather than to the square of these distances [50]. In all analyses, we used the flexible Unweighted Pair-Group Method using Arithmetic averages (UPGMA) clustering method (with β = −0.1), where equal weight is given to objects, not groups, and the Bray and Curtis association measure, which consistently performed well in previous ecological data testing [51]. The environmental and habitat variables and plot ordination scores were then analysed using a vector-fitting approach to examine species–environment responses. We used Principal Coordinate Correlation (PCC) within PATN, a multiple-linear regression programme designed to see how well a set of environmental attributes can be fitted into an ordination space. The environmental and habitat variables included site size, vegetation structure, open water, litter cover, dead (but still attached) plant cover, litter maximum depth, litter mean depth, canopy maximum height, canopy mean height, total species richness, native species richness, total species cover, and PI. Vectors were plotted on the two-dimensional plot to indicate the direction of best fit for each of the environmental variables and the correlation in that direction.
Relationships between invertebrate community composition (relative abundances of 39 invertebrate taxa) and habitat characteristics at 38 pitfall trap locations, ranging from 3 to 13 traps per wetland, were similarly analysed using FUSE cluster analysis and SSH ordination techniques. Individuals belonging to the ubiquitous orders Acari and Collembola and traps with no invertebrates caught were omitted from analysis. The same variables were used as for the vegetation NMDS, with the addition of total invertebrate species richness, native invertebrate species richness, and total invertebrate individuals. The terrestrial invertebrate ordinations yielded high stress values (two-dimensional = 0.3004 and three-dimensional = 0.2242), indicating no clear invertebrate patterns, and thus are not considered further.
Ordination of the aquatic invertebrates in the wetland ponds was analysed using non-metric multidimensional scaling (NMDS) via the metaMDS function from the “vegan” package in R with the Bray–Curtis dissimilarity index [47,52]. In this case, individual taxon counts, physiological traits [46], and wetland site were used as variables. Microcrustaceans (Copepoda, Cladocera, and Ostracoda) were not included in the ordination since they numerically dominated samples. The resulting two-dimensional ordination had a stress value of 0.15, so it was regarded as a good summary of the data.

3. Results

3.1. Landscape and Wetland Habitat

A summary of the landscape- and wetland-scale habitat features is provided in Table S1. Wetlands were located near at least two forest patches or shelterbelts >0.05 ha containing shrubs and trees within an average distance of 0.36 km (Table S1). Site one was the only wetland without a permanently flowing or standing waterbody >0.05 ha located within a 1 km radius. Sites two and four were located adjacent to 15 ha and 12 ha peat lakes, respectively. The peat lakes were surrounded by riparian planting with native trees, shrubs, and sedges. All wetland inlets and/or outlets had flowing surface water intermittently from autumn to spring. The permanently- to ephemerally-saturated wetland areas ranged from 0.03 ha at site five to 0.34 ha at site two (Table S1). Open water areas deeper than 1 m ranged from 0 to 24% across sites, occupying an average of 9% of the saturated wetland area (Table S1). The study coincided with a summer drought, and consequently, site four was the only wetland that received continuous inflows and maintained zones of open water >1 m deep.
Wetland size and construction age, a proxy for wetland establishment, were negatively correlated (n = 5, R2 = 0.73, and p < 0.05), but this was a spurious correlation. Construction age was not significantly related to any other variables. The size of constructed wetlands was positively correlated with plant and mammal richness (plants: n = 5, R2 = 0.85, and p < 0.05; mammals: n = 5, R2 = 0.84, and p < 0.05; Figure 2). Overall, there were few strong relationships detected among landscape and wetland habitat features (e.g., wetland size, wetland age, and number and distance to the nearest terrestrial and aquatic habitat >0.05 ha within a 1 km buffer) and wetland biodiversity (e.g., species richness, ratio of native species, wetland specialist species, and threatened species).

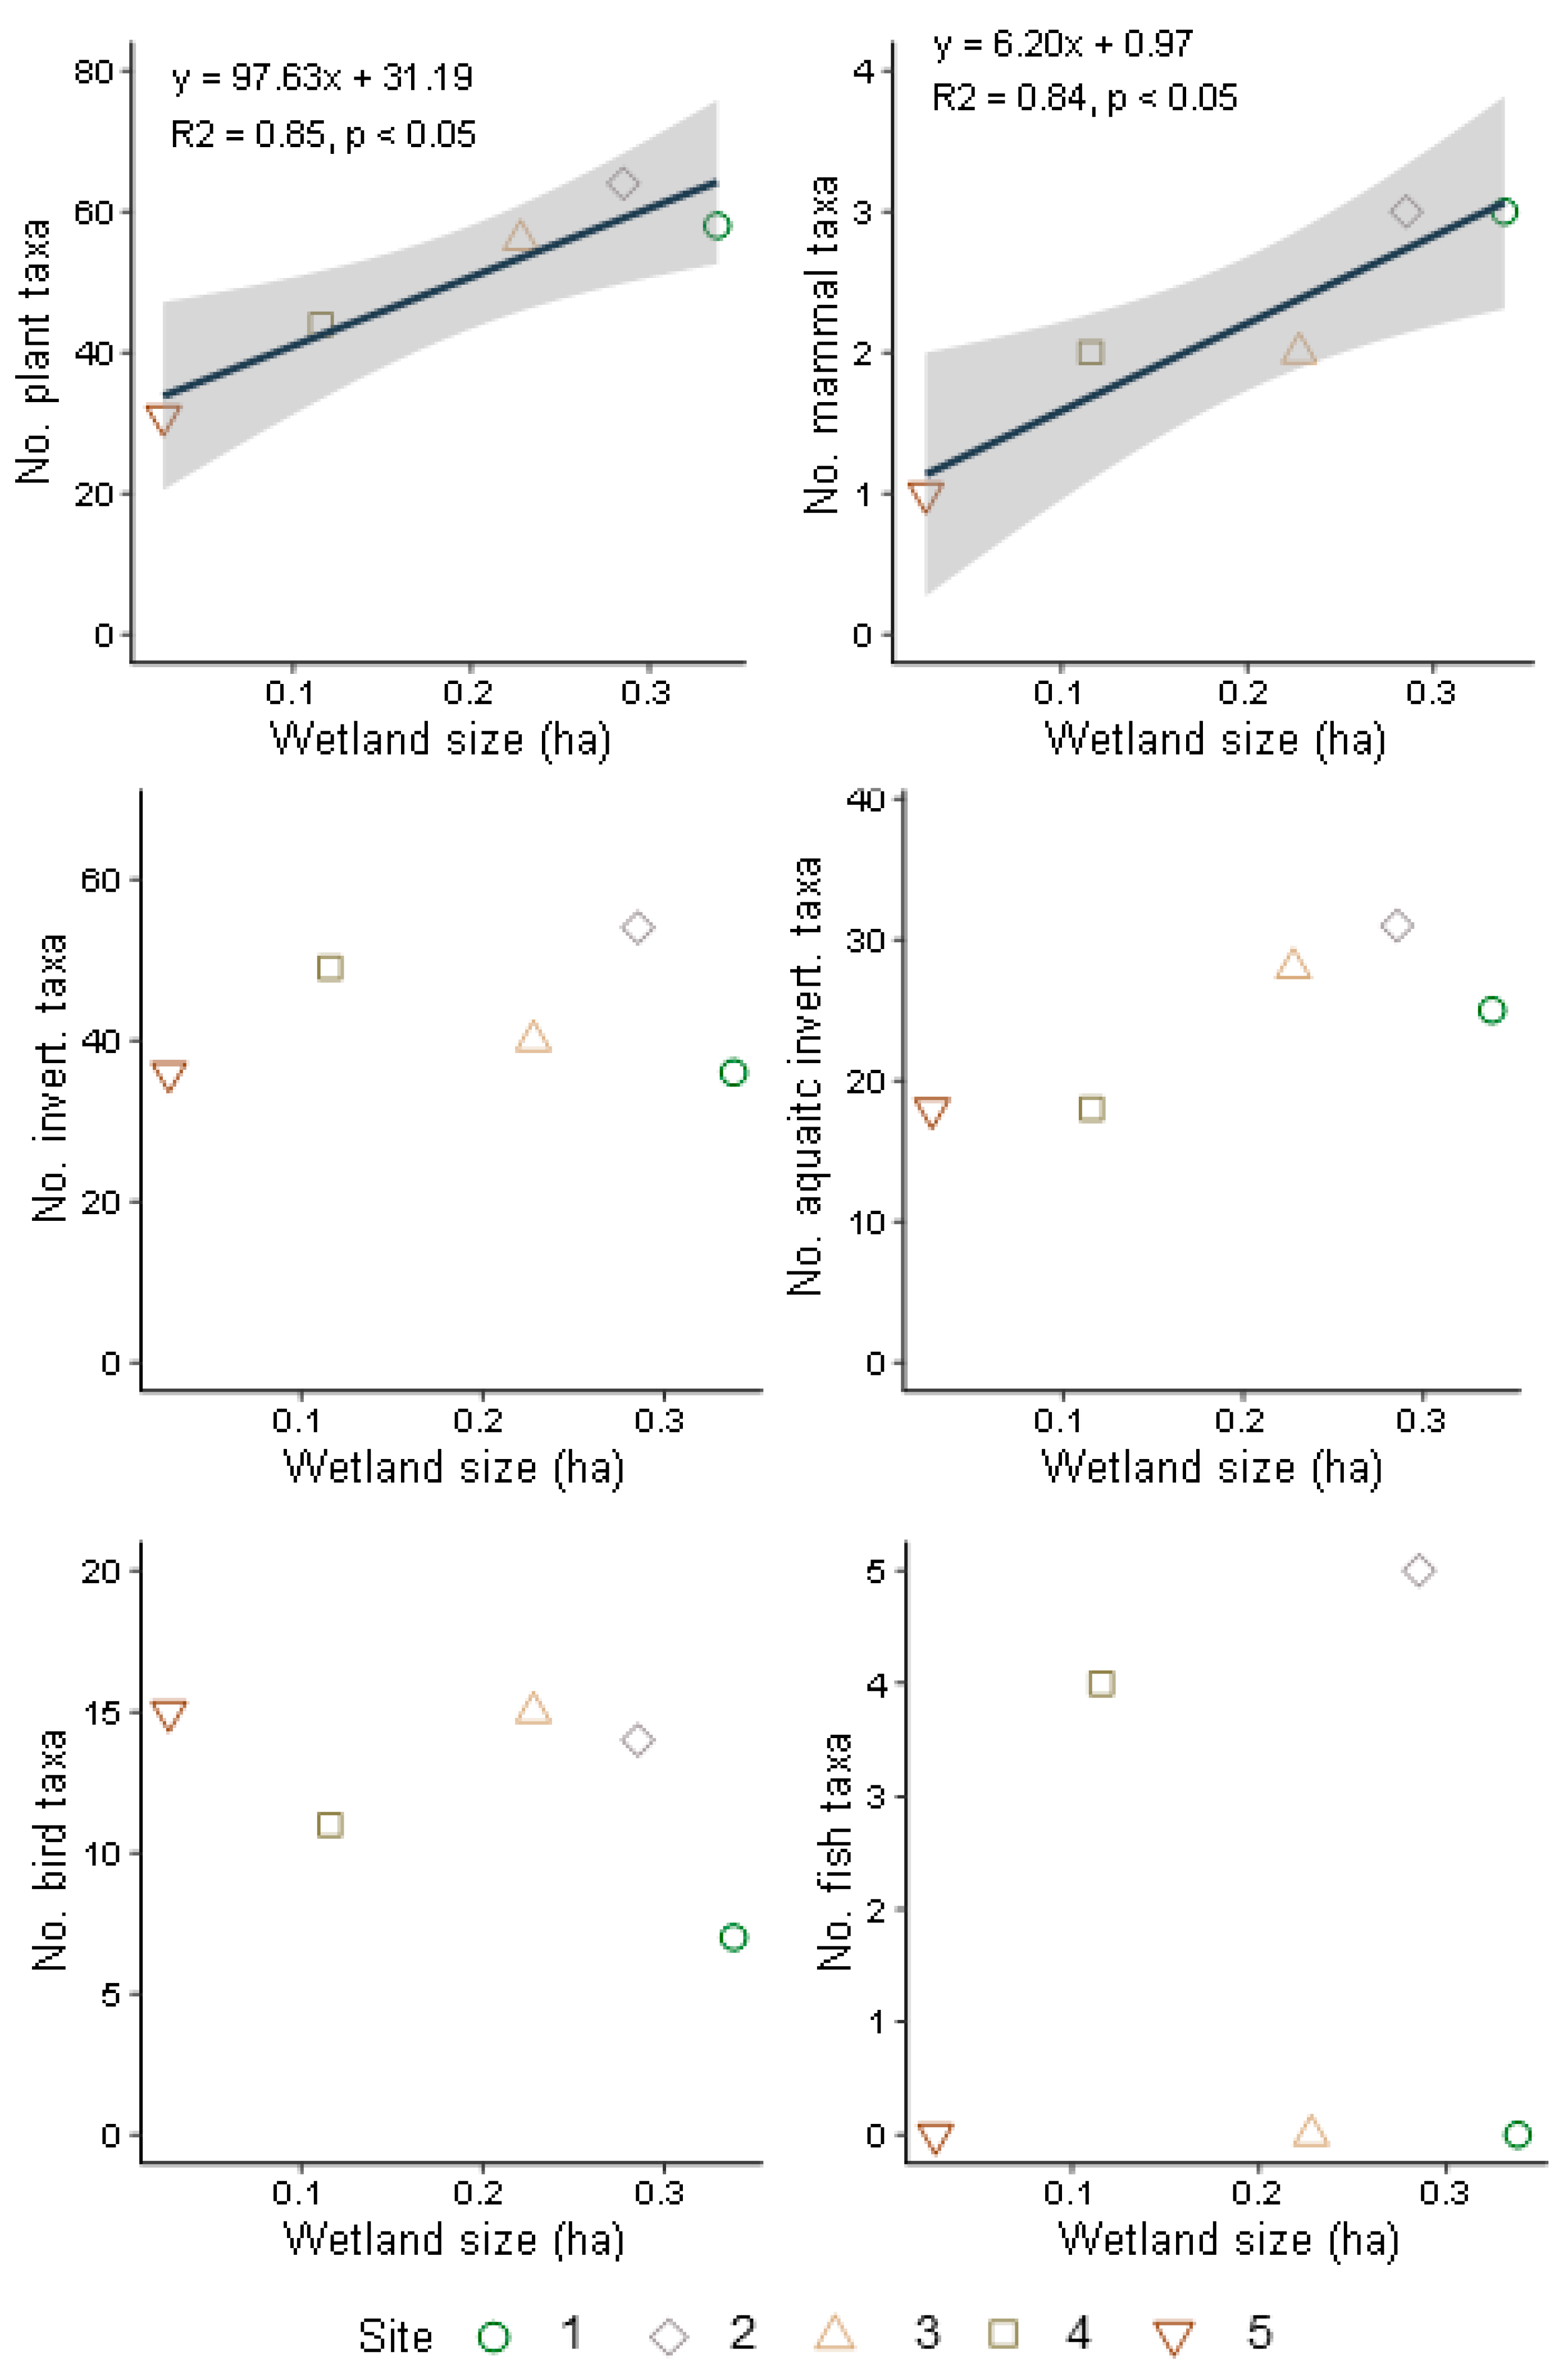
3.2. Vegetation Diversity

A total of 113 plant species were identified across all the sites, and the majority of plants were exotic grass and weed species that were also present in the adjacent pasture (Table S2). The lowest number of species identified at any one site was 31, at the smallest wetland, whereas twice as many species (64) were found at the largest wetland (Figure 2). Native vegetation made up an average of 32% of the total species identified at all sites, ranging from a minimum of 26% at site five to a maximum of 39% at site one (Table 1). Aquatic vegetation averaged 15% of total plant species and ranged from 9 to 25% of total species within sites (Table 1). Wetland margin species averaged 44% and ranged from 34 to 52% of total species within sites (Table 1). Terrestrial riparian species averaged 43% and ranged from 34 to 52% of all species across sites (Table 1). Plant richness was positively correlated with the number of terrestrial buffer species and the number of exotic plant species (terrestrial buffer species: n = 5, R2 = 0.85, and p < 0.05; exotic plants: n = 5, R2 = 0.87, and p < 0.05). No threatened plant species were recorded.
Figure 2. Relationship between wetland size (ha) and species richness for constructed wetland flora and fauna at the wetland-scale surveyed in five surface flow constructed wetlands designed to treat agricultural runoff in the Waikato Region, New Zealand. Site numbers correspond to wetlands in decreasing order of their saturated area (1 largest to 5 smallest).
Water 15 02526 g002
Six obligate hydrophytes were recorded across three of the five sites, including the native sedges (Carex secta) and (Carex virgata) and the bulrush Typha orientalis, as well as the three exotic species: pond water starwort (Callitriche stagnalis), gypsywort (Lycopus europaeus), and flowering primrose (Ludwigia palustris). Vegetation coverage of the ephemerally to permanently saturated wetland areas averaged 56%, but this was highly variable across sites and ranged from 14% at site five to 100% at site one (Table 1). Overall, a range of native canopy-forming species were found in wetlands, wetland margins, and terrestrial buffer areas, providing structurally diverse vegetated areas for wetland fauna to inhabit.
Six ecologically interpretable groups, defined by the FUSE classification, were selected to characterise the vegetation at the five FWS (Table 2). The groups were named according to the characteristic species composition and vegetation structure following Atkinson [53] and were ordered to match the dominant wet-dry environmental gradient, as reflected by the PI.
Group A, Typha orientalis reedland, comprised a small group of three plots from two sites with high water tables and having only obligate (hydrophyte) species. It had the lowest PI (1), the highest maximum canopy height, mean canopy height, and total species cover, and the lowest species richness. Group B, mixed sedgeland, was a medium-sized group (nine plots and three sites) with a variety of obligate and facultative wetland sedges, including Bolboschoenus fluviatilis, Carex geminata, Machaerina articulata, and Cyperus ustulatus. This group had the second lowest PI (1.39), reflecting high water tables, and the lowest maximum canopy height and total species cover. Group C, Carex secta sedgeland (seven plots and three sites), also had a low PI (1.51) mainly due to the dominance of the obligate C. secta, but several facultative species were also present, including Ranunculus repens and Leptospermum scoparium. Group D, Phormium tenax flaxland (nine plots, four sites, and PI = 2.34), comprised mainly tall Phormium tenax overtop a variety of herbs, rushes, and grasses in the ground cover, e.g., Ranunculus repens, Juncus effusus, and Holcus lanatus. This group had the highest total species richness and native species richness. The largest group E, mixed grassland (eighteen plots and four sites), comprised a variety of grasses, herbs, sedges, and other species; however, grasses dominated overall, particularly Holcus lanatus and Paspalum distichum. This group had the second-highest PI (2.62) and the second-lowest native species richness. Group F, Ranunculus repens herbfield (ten plots and four sites), had the highest PI (2.91) and the lowest canopy mean height and native species richness.
Both the two-dimensional and three-dimensional (3D) ordinations had high stress values (0.2688 and 0.2070, respectively; not shown), reflecting high variability in vegetation patterns within and between the plots. The PCC evaluation revealed variables that were significantly correlated (p < 0.05) with the 3D ordination, which included: PI, dead plant cover, total species richness, canopy mean height, vegetation structure category, litter cover, and canopy maximum height.

3.3. Terrestrial and Aquatic Invertebrate Diversity

A total of 1897 terrestrial invertebrates, comprising 85 taxa (henceforth ‘species’), 45 families, and 22 orders, were identified from the pitfall traps, excluding individuals belonging to the families Acari and Collembola, because they were ubiquitous and numerically dominated samples. Almost 90% of the total invertebrate fauna captured belonged to the orders Coleoptera (34%), Diptera (18%), Hymenoptera (18%), Amphipoda (9%), Orthoptera (5%), and Hemiptera (5%). An average of 45 species were identified across sites, with a minimum of 36 species present at site one and a maximum of 54 species at site two (Figure 2). Approximately half of all identified species were native, ranging from a minimum of 44% native species at site five to a maximum of 58% native species at site three (Table 1). The terrestrial invertebrate fauna composition in the wetlands was characteristic of the surrounding pastoral landscape, with no environmentally sensitive or threatened invertebrate species detected (Stephen Thorpe, personal communication).
Five terrestrial invertebrate fauna groups were defined by the FUSE classification (Table 3); group one was the largest group, comprising 21 samples from four FWS, with the most frequently occurring species being the beetles Coleoptera Latridiidae Cartodere sp., and Coleoptera Corylophidae Sericoderus sp. Additionally, typically present was the ant Hymenoptera Formicidae Austroponera sp. (mean occurrence 2.2), which was not recorded in the other groups. The total number of individuals and the mean and maximum litter layers were the lowest of all five groups. Group two (five samples and two FWS) was dominated by landhoppers, Amphipoda Talitridae genus sp., with the dung fly Diptera Sphaeroceridae genus sp. also being common. This group had the lowest canopy mean and maximum height, and the typical vegetation structure was herbfield. Group three was the smallest group (two samples and one FWS), being flaxland with the highest mean and maximum canopy, the highest litter mean and maximum layers, and the greatest count of invertebrate individuals. Group four (five samples and three FWS) had a range of vegetation structures, including flaxland and shrubland, with other variables typically in the middle ranges. Group five (five samples and two FWS) was mainly shrubland, with the second highest canopy mean, maximum, and litter mean.
A total of 44,199 aquatic invertebrates were identified from the wetland ponds, which included 47 distinctive taxa representing 15 orders and 37 families. The fewest number of species (18) were found at the smallest wetland, whereas species richness was greatest (31 species) at the largest wetland (Figure 2). An average of 74% of species identified at a site were native, ranging from a minimum of 61% native species at site 3 to a maximum of 82% native species at site 3 (Table 1). Samples were numerically dominated by the microcrustaceans Cladocera, Copepoda, and Ostracoda, which accounted for 70% of the total catch (an average of 67% of the total catch per site, ranging from 22% at site two to 85% at site four). Excluding microcrustaceans, the majority (73%) of all invertebrates belonged to the orders Diptera (41%) and Oligochaeta (32%). The remainder of the catch was made up of Nematoda (5%), Hemiptera (5%), Coleoptera (3%), Mollusca (3%), Hydridae (3%), Odonata (2%), Trichoptera (2%), and Platyhelminthes (2%), with less than 1% each of Acarina, Hexapoda, Nemertea, Hirudenea, and crustacea. The exotic snails Physa acuta and Pseudosuccinea columella were detected at all sites except site one and accounted for 38% of all snails. There were no threatened or at-risk aquatic (or terrestrial) invertebrate species detected in any of the wetlands, and none of the identified species were listed as ‘conservation dependent (i.e., no taxon was likely to move to a higher threat category if current management were to cease). Ordination of aquatic invertebrate communities revealed that community composition (excluding the microcrustaceans Cladocera, Copepoda, and Ostracoda) was strongly determined by wetland site (Figure 3). The community composition of the samples was typical of the New Zealand wetland aquatic invertebrate fauna, as characterised by predominantly pollution-tolerant species with highly mobile adult life stages (Brian Smith, personal communication).

3.4. Bird and Mammal Diversity

Across autumn and spring point counts, 20 bird species were detected, with an average of 13 bird species at each wetland. Half as many species (seven) were detected at site one as compared to the maximum of fifteen species detected at site three (Figure 2). A total of nine native bird species and five waterbird species were detected, and these comprised 45% and 25% of the total species detected across sites, respectively (Table 1). Waterbirds were detected at all sites and accounted for 18–43% (average 25%) of total species, including: fernbird (Bowdleria punctata), mallard (Anas platyrhynchos), paradise shelduck (Tadorna variegata), pukeko (Porphyrio melanotus), and white-faced heron (Egretta novaeholandiae). Fernbirds are an endemic wetland specialist classified as at risk/declining on the North Island, and these were detected only at site three.
Across autumn and spring mammal surveys, a total of five introduced mammal species were detected in the wetlands. The house mouse (Mus musculus) was the only species present at all sites, and they were detected in low to medium abundance in the tracking tunnels (<15% at sites three, four, and five; 37 and 40% at site one and site two). Rats (Rattus sp.) and brushtail possums (Trichosurus vulpecula) were detected by a combination of tracking tunnels and camera traps at sites one and two and sites four and five, respectively. Hedgehogs (Erinaceus europaeus occidentalis) and feral cats (Felis catus) were detected by camera traps at sites three and one, respectively.

3.5. Fish and Amphibian Diversity

Fish were present at sites two and four, which were the only two wetlands with permanently flowing surface water inlets and outlets (Figure 1 and Figure 2; Table 1). The wetlands with fish present were directly connected to agricultural drainage ditches and adjacent peat lakes, with no impediments to fish movement among these habitats. A total of 374 individuals representing six fish species were caught, including three native species: bully (Gobiomorphus sp.), longfin eel (Anguilla dieffenbachii), and shortfin eel (Anguilla australis), and three exotic pest species: brown bullhead (Ameiurus nebulosus), goldfish (Carassius auratus), and mosquitofish (Gambusia affinis). Invasive fish accounted for 92% of the total catch at sites two and four, owing to the high number of mosquitofish at each of these sites. Mosquitofish made up 91% and 86% of the total catch at sites four and two, respectively. Only two native species were captured at each site: bully and shortfin eel at site two, and shortfin eel and longfin eel at site four. Introduced green and golden bell frogs (Litoria aurea) and southern bell frogs (Litoria raniformis) were captured at site one. Bell frogs were seen but not caught at site three while deploying fish sampling gear. Neither of the sites where frogs were detected had fish present, and both wetlands were only intermittently connected to surface water outlets during the winter drainage season.

4. Discussion

The five ‘dual purpose’ FWS we surveyed supported native flora and fauna that have lost most of their natural habitats within the highly intensified agricultural landscape. However, exotic species also thrived in constructed wetlands, as evidenced by their high proportions of the total species detected and their high relative abundances within communities. Constructing FWS wetlands can be costly, and there is increasing demand for ecological engineering practices that incorporate native vegetation and biodiversity to improve water quality along with a fuller suite of ecosystem services [54]. We discuss the importance of addressing landscape constraints and wetland-specific habitat, as well as managing exotic pest species, to support native biodiversity in FWS.

4.1. Wetland Size, Habitat Connectivity, and Biodiversity

We found that FWS were good for ‘kick starting’ the ecosystem by providing habitat for wetland and aquatic species expected in a highly modified and fertile agricultural landscape. Overall, there were few significant relationships among the wetland habitat, landscape characteristics, and biodiversity attributes of the FWS. FWS are typically placed within the landscape to maximise their diffuse pollution interception and treatment efficacy [15]. However, Thiere et al. [17] recommend more a priori consideration of FWS spatial location in the landscape context in relation to aquatic invertebrate biodiversity as influenced by wetland design, such as proximity to streams and rivers and distance to potential source populations. The low degree of connectivity of FWS to larger areas of forest reflected the character of the intensified pastoral landscape we surveyed. FWS biodiversity (species richness, ratio of native species, and presence of wetland specialists or threatened species) was not influenced by wetland proximity to forests or waterbodies at the scales that we measured. In contrast, several studies of constructed and restored wetlands in agricultural landscapes have shown how the landscape context is important. Alsfeld et al. [24] surveyed depressional wetlands constructed in a predominantly agricultural landscape and showed that bird species richness and diversity increased with increasing forest area within a 1 km radius of the wetlands. Thus, considering the constraints of the surrounding landscape and habitat within FWS will be important to temper management expectations around biodiversity enhancement in dual-purpose FWS. However, defining ecologically meaningful thresholds of landscape connectivity and habitat size and quality may require a region- or catchment-specific approach.
The wetlands we surveyed were typical of FWS in other agricultural landscapes, which are sized to occupy 1–5% of their contributing catchments (e.g., 100–500 m2 of wetland per ha) [11]. Our FWS were initially planted with a low diversity of hardy wetland plant species suited for high nutrient processing, typical of ‘swamp’ type wetlands, which tend to have generalist species. The mean area of emergent vegetation averaged 0.1 ha, and the size of the total saturated wetland areas averaged 0.2 ha. Although they were small, the structural enhancements provided by wetland and riparian habitats were likely rapidly colonised by the highly mobile invertebrates, mammals, birds, and fish we detected. Small, shallow ponds that lack connectivity to larger or permanently flowing surface waters decrease the chance for fish populations to dominate, thereby boosting aquatic invertebrate diversity [55]. However, the wetland vegetation plantings combined with the relatively young age of the FWS mean there is likely insufficient time for natural successional processes to develop more diverse hydrophyte vegetation. Additionally, threatened freshwater fish and invertebrate taxa were not detected in our study, likely owing to the absence of local source populations rather than wetland age or our restricted sampling effort. Colonisation of FWS by aquatic species can occur within two years post-establishment [22], and at least four years may be needed to achieve maximum richness of aquatic invertebrate species [8].
FWS size was positively correlated with higher overall plant and mammal species richness; however, this manifested as greater terrestrial buffer species and a higher number of exotic plant and pest mammal species. Findlay and Houlahan [31] surveyed natural wetlands in an agriculturally dominated landscape in south-eastern Ontario and found strong, positive relationships between wetland area and species richness of birds, mammals, reptiles, amphibians, and plants. Increasing the overall area of shallow FWS planted with aquatic vegetation has been recommended to support greater waterbird and aquatic invertebrate species [8,21,28]. However, Hansson et al. [8] showed that these species respond differently to habitat factors such as wetland area, age, and the complexity of shallow vegetated zones.
Habitat heterogeneity in FWS can influence biological community composition. Wetland-scale analysis of biodiversity revealed no clear drivers of species richness or proportion of native and wetland specialist species across the taxa we studied other than wetland size and plant and mammal species richness. Although cluster analysis of plot-scale data revealed six ecologically distinctive vegetation groups, we found weak relationships between wetland vegetation characteristics and terrestrial invertebrate communities. However, differences in aquatic invertebrate communities were more distinct across wetlands (Figure 3). Large shallow wetlands with high shoreline complexity and plant species richness can support greater bird species richness and higher nitrogen processing, whereas small, deep wetlands can be more efficient in trapping sediment and phosphorus but less valuable for biodiversity [8]. Including sedimentation forebays and deeper, open-water habitats isolated from sediment inputs is recommended to minimise the adverse effects of sedimentation and promote greater invertebrate diversity [23]. Spieles and Mitsch [56] found that aquatic invertebrate diversity improved towards the middle and final ponds within a multi-cell FWS due to improved water quality, and at these locations, aquatic invertebrate diversity was statistically similar to sites in river-fed wetlands. Thus, improving the design of FWS to enhance biodiversity requires a clear understanding of what specific species are targeted for enhancement, how and where suitable habitat can be created, and any potential trade-offs with wetland design and location.

4.2. Supporting Native Biodiversity by Managing Exotic Species

The prevalence of invasive, pest-plant, mammal, and fish species within the surrounding landscape favoured the colonisation of the FWS we surveyed and the dominance of exotic species. Similarly to natural wetlands, FWS are vulnerable to edge effects, including colonisation by native and exotic species from regional species pools, and these habitats may be used as ‘stepping stones’ for species dispersal in the landscape [57]. Thiere et al. [17] concluded that the biodiversity in newly created wetlands was highly dependent on existing habitat heterogeneity and regional species pools. Strand and Weisner [25] demonstrated that wetland birds and amphibians colonised FWS, which enhanced species numbers and population sizes at local and regional scales. Highly mobile invertebrates, birds, and fish can colonise newly created wetlands as soon as a suitable wetland hydrological regime is established [58]. Active intervention may be required to establish native wetland species with slow or limited dispersal capabilities as well as to manage exotic pest species, especially where these may potentially outcompete and/or predate native species.
Dominance by exotic species increases competition and limits the colonisation and fitness of native species (ecosystem resilience). The possums, rats, stoats, and feral cats found at our wetlands are regarded as pests in New Zealand since they compete with native birdlife for food and habitat as well as predate the eggs and young [59]. We also found the invasive freshwater snails Physa acuta and Pseudosuccinea columella at four of the five sites we surveyed. These snails are prolific breeders, are widespread in New Zealand, and could potentially alter invertebrate community composition by displacing native species and/or predating on eggs [60]. However, the negative impacts on native aquatic fauna are likely more negatively impacted by the presence of the three non-native, invasive fish species: goldfish (Carassius auratus), brown bullhead (Ameiurus nebulosus), and mosquitofish (Gambusia affinis). These fish species are legally classified as pests in New Zealand due to their detrimental impacts on habitat quality and trophic status [61,62]. The invasion of FWS by exotic species that are present in the surrounding landscape requires active management to minimise adverse effects on native species.

4.3. Conclusions and Future Research

‘Dual purpose’ FWS can support native biodiversity, potentially serving as ‘stepping-stones’ for native species to access and colonise other aquatic habitats in agricultural landscapes. However, further enhancing native biodiversity in agricultural FWS likely requires on-going management and control of invasive and pest species, particularly where these are ubiquitous in the surrounding environment. Moreover, colonisation of FWS by wetland-adapted species with slow or low dispersal abilities, small or fragmented sink populations, and/or poor habitat connectivity may also require active relocation or much longer intervals to naturally colonise FWS post-construction. To minimise the risk that FWS become ‘ecological traps’, managers should consider species-specific habitat suitability as well as the potential for invasive taxa to out-compete or predate newly introduced species. Future research should investigate how the design of agricultural FWS, including their position in the catchment/landscape and habitat (e.g., pond shape, number and size of ponds, distribution of shallow vegetated versus deep open water areas, and planted wetland species diversity), can be optimised to enhance biodiversity while also attenuating diffuse source pollution. Additionally, understanding the sequence of biological invasion of native and invasive species alike is needed to provide managers with timeframes for adaptive management of biodiversity.

Supplementary Materials

The following supporting information can be downloaded at: https://www.mdpi.com/article/10.3390/w15142526/s1, Figure S1: Locations of the surface flow constructed wetlands; Table S1: Summary of the immediate landscape and habitat characteristics; Table S2: Plant species list, biostatus, and ratings. References [37,38,63,64,65,66,67] are cited in the supplementary materials.

Author Contributions

Conceptualisation, B.C.G., J.P.S.S. and B.R.C.; data curation, B.C.G. and B.R.C.; formal analysis, B.C.G., S.J.R.W. and B.R.C.; funding acquisition, B.R.C.; investigation, B.C.G., J.P.S.S. and B.R.C.; methodology, B.C.G., J.P.S.S. and B.R.C.; visualisation, B.C.G. and S.J.R.W.; writing—original draft, B.C.G.; writing—review and editing, B.C.G., J.P.S.S., S.J.R.W. and B.R.C. All authors have read and agreed to the published version of the manuscript.

Funding

This research was funded by the New Zealand Ministry of Business, Innovation, and Employment via the Manaaki Whenua—Landcare Research Wetlands MBIE Programme (Contract C09X1002) and Strategic Science Investment Fund. The APC was funded by the New Zealand Ministry of Business, Innovation, and Employment via the National Institute of Water and Atmospheric Research Doubling On-farm Diffuse Pollution Mitigation MBIE Programme (Contract C01X1818).

Data Availability Statement

The data presented in this study are available on request from the corresponding author. The data are not publicly available due to privacy restrictions.

Acknowledgments

The authors thank the landowners for granting access to the wetlands. Chris Tanner (NIWA) and Norman Mason (MW-LR) contributed to initial discussions on site selection and survey design. Emily Rutherford-Jones (Toi Ohomai Institute of Technology), Suzie Elcock, Louis Skovsholt, Inigo Zabarte-Maeztu (NIWA), and Suzanne Lambie (MW-LR) provided valuable assistance with field work. Many specialists provided recommendations for sampling methods and taxonomic identification, including: Brian Smith (NIWA) for aquatic invertebrate identification, Peter Williams (NIWA) for fish sampling, Stephen Thorpe for terrestrial invertebrate identification, John Innes (MW-LR) for mammal sampling and identification, Corrine Watts (MW-LR) for pitfall trapping, and Neil Fitzgerald (MW-LR), Emily Rutherford-Jones, and Archie MacFarlane (Department of Conservation) for bird sampling and bird call analysis. We thank Lisa Denmead and five anonymous reviewers for helpful comments on the manuscript.

Conflicts of Interest

The authors declare no conflict of interest. The funders had no role in the design of the study; in the collection, analyses, or interpretation of data; in the writing of the manuscript; or in the decision to publish the results.

References

  1. Mitsch, W.J.; Bernal, B.; Hernandez, M.E. Ecosystem Services of Wetlands. Int. J. Biodivers. Sci. Ecosyst. Serv. Manag. 2015, 11, 1–4. [Google Scholar] [CrossRef] [Green Version]
  2. Millennium Ecosystem Assessment. Ecosystems and Human Well-Being: Health Synthesis; Corvalán, C., Hales, S., McMichael, A.J., Millennium Ecosystem Assessment (Program), World Health Organization, Eds.; Millennium Ecosystem Assessment; World Health Organization: Geneva, Switzerland, 2005; ISBN 92-4-156309-5. [Google Scholar]
  3. Zedler, J.B.; Kercher, S. Wetland Resources: Status, Trends, Ecosystem Services, and Restorability. Annu. Rev. Environ. Resour. 2005, 30, 39–74. [Google Scholar] [CrossRef] [Green Version]
  4. Mitsch, W.J.; Gosselink, J.G. (Eds.) Wetlands, 5th ed.; John Wiley & Sons, Inc.: Hoboken, NJ, USA, 2015. [Google Scholar]
  5. Myers, S.C.; Clarkson, B.R.; Reeves, P.N.; Clarkson, B.D. Wetland Management in New Zealand: Are Current Approaches and Policies Sustaining Wetland Ecosystems in Agricultural Landscapes? Ecol. Eng. 2013, 56, 107–120. [Google Scholar] [CrossRef]
  6. Gibbs, J.P. Wetland Loss and Biodiversity Conservation. Conserv. Biol. 2000, 14, 314–317. [Google Scholar] [CrossRef] [Green Version]
  7. Murillo-Pacheco, J.; López-Iborra, G.M.; Escobar, F.; Bonilla-Rojas, W.F.; Verdú, J.R. The Value of Small, Natural and Man-Made Wetlands for Bird Diversity in the East Colombian Piedmont. Aquat. Conserv. Mar. Freshw. Ecosyst. 2018, 28, 87–97. [Google Scholar] [CrossRef]
  8. Hansson, L.-A.; Bronmark, C.; Anders Nilsson, P.; Abjornsson, K. Conflicting Demands on Wetland Ecosystem Services: Nutrient Retention, Biodiversity or Both? Freshw. Biol. 2005, 50, 705–714. [Google Scholar] [CrossRef]
  9. Blankenberg, A.-G.B.; Haarstad, K.; Paruch, A.M. Agricultural Runoff in Norway: The Problem, the Regulations, and the Role of Wetlands. In The Role of Natural and Constructed Wetlands in Nutrient Cycling and Retention on the Landscape; Vymazal, J., Ed.; Springer International Publishing: Cham, Switzerland, 2015; pp. 137–147. ISBN 978-3-319-08177-9. [Google Scholar]
  10. Mitchell, M.E.; Newcomer-Johnson, T.; Christensen, J.; Crumpton, W.; Richmond, S.; Dyson, B.; Canfield, T.J.; Helmers, M.; Lemke, D.; Lechtenberg, M.; et al. Potential of Water Quality Wetlands to Mitigate Habitat Losses from Agricultural Drainage Modernization. Sci. Total Environ. 2022, 838, 156358. [Google Scholar] [CrossRef] [PubMed]
  11. Carstensen, M.V.; Hashemi, F.; Hoffmann, C.C.; Zak, D.; Audet, J.; Kronvang, B. Efficiency of Mitigation Measures Targeting Nutrient Losses from Agricultural Drainage Systems: A Review. Ambio 2020, 49, 1820–1837. [Google Scholar] [CrossRef]
  12. Kadlec, R.H.; Wallace, S.D. Treatment Wetlands, 2nd ed.; CRC Press: Boca Raton, FL, USA, 2009; ISBN 978-1-56670-526-4. [Google Scholar]
  13. Tanner, C.C.; Depree, C.; Sukias, J.P.S.; Wright-Stow, A.E.; Burger, D.F.; Goeller, B.C. Constructed Wetland Practitioner Guide: Design and Performance Estimates; DaryNZ/NIWA: Hamilton, New Zealand, 2022; p. 40. [Google Scholar]
  14. Hefting, M.M.; van den Heuvel, R.N.; Verhoeven, J.T.A. Wetlands in Agricultural Landscapes for Nitrogen Attenuation and Biodiversity Enhancement: Opportunities and Limitations. Ecol. Eng. 2013, 56, 5–13. [Google Scholar] [CrossRef]
  15. Mander, Ü.; Tournebize, J.; Tonderski, K.; Verhoeven, J.T.A.; Mitsch, W.J. Planning and Establishment Principles for Constructed Wetlands and Riparian Buffer Zones in Agricultural Catchments. Ecol. Eng. 2017, 103, 296–300. [Google Scholar] [CrossRef]
  16. Land, M.; Granéli, W.; Grimvall, A.; Hoffmann, C.C.; Mitsch, W.J.; Tonderski, K.S.; Verhoeven, J.T.A. How Effective Are Created or Restored Freshwater Wetlands for Nitrogen and Phosphorus Removal? A Systematic Review. Environ. Evid. 2016, 5, 1–26. [Google Scholar] [CrossRef] [Green Version]
  17. Thiere, G.; Milenkovski, S.; Lindgren, P.-E.; Sahlén, G.; Berglund, O.; Weisner, S.E.B. Wetland Creation in Agricultural Landscapes: Biodiversity Benefits on Local and Regional Scales. Biol. Conserv. 2009, 142, 964–973. [Google Scholar] [CrossRef]
  18. Spieles, D.J. Wetland Construction, Restoration, and Integration: A Comparative Review. Land 2022, 11, 554. [Google Scholar] [CrossRef]
  19. Zhang, C.; Wen, L.; Wang, Y.; Liu, C.; Zhou, Y.; Lei, G. Can Constructed Wetlands Be Wildlife Refuges? A Review of Their Potential Biodiversity Conservation Value. Sustainability 2020, 12, 1442. [Google Scholar] [CrossRef] [Green Version]
  20. Wiegleb, G.; Dahms, H.-U.; Byeon, W.I.; Choi, G. To What Extent Can Constructed Wetlands Enhance Biodiversity? Int. J. Environ. Sci. Technol. 2017, 8, 561–569. [Google Scholar] [CrossRef] [Green Version]
  21. Becerra-Jurado, G.; Harrington, R.; Kelly-Quinn, M. A Review of the Potential of Surface Flow Constructed Wetlands to Enhance Macroinvertebrate Diversity in Agricultural Landscapes with Particular Reference to Integrated Constructed Wetlands (ICWs). Hydrobiologia 2012, 692, 121–130. [Google Scholar] [CrossRef]
  22. Boets, P.; Michels, E.; Meers, E.; Lock, K.; Tack, F.M.G.; Goethals, P.L.M. Integrated Constructed Wetlands (ICW): Ecological Cevelopment in Constructed Wetlands for Manure Treatment. Wetlands 2011, 31, 763–771. [Google Scholar] [CrossRef]
  23. Eivers, R.S.; Duggan, I.C.; Hamilton, D.P.; Quinn, J.M. Constructed Treatment Wetlands Provide Habitat for Zooplankton Communities in Agricultural Peat Lake Catchments. Wetlands 2018, 38, 95–108. [Google Scholar] [CrossRef]
  24. Alsfeld, A.J.; Bowman, J.L.; Deller-Jacobs, A. The Influence of Landscape Composition on the Biotic Community of Constructed Depressional Wetlands. Restor. Ecol. 2010, 18, 370–378. [Google Scholar] [CrossRef]
  25. Strand, J.A.; Weisner, S.E.B. Effects of Wetland Construction on Nitrogen Transport and Species Richness in the Agricultural Landscape—Experiences from Sweden. Ecol. Eng. 2013, 56, 14–25. [Google Scholar] [CrossRef]
  26. Weisner, S.E.B.; Thiere, G. Effects of Vegetation State on Biodiversity and Nitrogen Retention in Created Wetlands: A Test of the Biodiversity–Ecosystem Functioning Hypothesis. Freshw. Biol. 2010, 55, 387–396. [Google Scholar] [CrossRef]
  27. Zak, D.; Stutter, M.; Jensen, H.S.; Egemose, S.; Carstensen, M.V.; Audet, J.; Strand, J.A.; Feuerbach, P.; Hoffmann, C.C.; Christen, B.; et al. An Assessment of the Multifunctionality of Integrated Buffer Zones in Northwestern Europe. J. Environ. Qual. 2019, 48, 362–375. [Google Scholar] [CrossRef] [PubMed] [Green Version]
  28. Garrett-Walker, J.; Collier, K.J.; Daniel, A.; Hicks, B.J.; Klee, D. Design Features of Constructed Floodplain Ponds Influence Waterbird and Fish Communities in Northern New Zealand. Freshw. Biol. 2020, 65, 2066–2080. [Google Scholar] [CrossRef]
  29. Moreno-Mateos, D.; Comin, F.A. Integrating Objectives and Scales for Planning and Implementing Wetland Restoration and Creation in Agricultural Landscapes. J. Environ. Manag. 2010, 91, 2087–2095. [Google Scholar] [CrossRef] [PubMed]
  30. Maseyk, F.J.; Dominati, E.J.; Mackay, A.D. More than a’nice to Have’: Integrating Indigenous Biodiversity into Agroecosystems in New Zealand. N. Z. J. Ecol. 2019, 43, 1–12. [Google Scholar]
  31. Findlay, C.S.; Houlahan, J. Anthropogenic Correlates of Species Richness in Southeastern Ontario Wetlands. Conserv. Biol. 1997, 11, 1000–1009. [Google Scholar] [CrossRef]
  32. Croft, M.V.; Chow-Fraser, P. Non-Random Sampling and Its Role in Habitat Conservation: A Comparison of Three Wetland Macrophyte Sampling Protocols. Biodivers Conserv. 2009, 18, 2283–2306. [Google Scholar] [CrossRef]
  33. Hughes, J.M.R.; Clarkson, B.R.; Castro-Castellon, A.T.; Hess, L.L. Wetland Plants and Aquatic Macrophytes. In Freshwater Ecology and Conservation; Oxford University Press: Oxford, UK, 2019; pp. 173–207. ISBN 978-0-19-876638-4. [Google Scholar]
  34. Clarkson, B.R.; Sorrell, B.K.; Reeves, P.N.; Champion, P.D.; Partridge, T.R.; Clarkson, B.D. Handbook for Monitoring Wetland Condition; Coordinated Monitoring of New Zealand Wetlands: Ministry for the Environment Sustainable Management Fund Project 5105; Ministry for the Environment: Wellington, New Zealand, 2004; Volume 74, p. 35.
  35. Ngā Tipa o Aotearoa New Zealand Plants Database. Available online: https://nzflora.landcareresearch.co.nz/ (accessed on 24 November 2020).
  36. Clarkson, B.R.; Fitzgerald, N.B.; Champion, P.D.; Forester, L.; Rance, B.D. New Zealand Wetland Plant List 2021; Manaaki Whenua-Landcare Research: Hamilton, New Zealand, 2021; p. 66. [Google Scholar]
  37. Clarkson, B.; Sorrell, B.K. New Zealand Wetland Condition Monitoring. In Wetland and Stream Rapid Assessment: Development, Validation, and Application; Dorney, J., Savage, R., Tiner, R., Adamus, P., Eds.; Elesvier: Cambridge, MA, USA, 2018; ISBN 978-0-12-805091-0. [Google Scholar]
  38. Sherley, G.; Stringer, I. DOCCM-248862 Invertebrates: Pitfall Trapping v1. 0. Dep. Conserv. Te Papa Atawhai Wellingt. 2016, 1, 1–30. [Google Scholar]
  39. Hartley, L.; Greene, T. Birds: Incomplete Counts—Five-Minute Bird Counts v1.0; Inventory and Monitoring Toolbox: Birds; Department of Conservation, Science & Capability Group: Hamilton, New Zealand, 2012; p. 22.
  40. Gillies, C. Interim DOC Trail Camera Guide v1.0.2: Using Camera Traps to Monitor Feral Cats and Mustelids; Department of Conservation, Science & Capability Group: Hamilton, New Zealand, 2018; p. 9.
  41. Gillies, C.; Williams, D. DOC Tracking Tunnel Guide v2.5.2: Using Tracking Tunnels to Monitor Rodents and Mustelids; Department of Conservation, Science & Capability Group: Hamilton, New Zealand, 2013; p. 14.
  42. Joy, M.; David, B.; Lake, M.D.; Massey University; Institute of Natural Resources; Ecology Group. New Zealand Freshwater Fish Sampling Protocols; Massey University: Palmerston North, New Zealand, 2013; ISBN 978-0-473-23437-9. [Google Scholar]
  43. Oertli, B.; Biggs, J.; Céréghino, R.; Grillas, P.; Joly, P.; Lachavanne, J.-B. Conservation and Monitoring of Pond Biodiversity: Introduction. Aquat. Conserv. Mar. Freshw. Ecosyst. 2005, 15, 535–540. [Google Scholar] [CrossRef]
  44. Winterbourn, M.J.; Gregson, K.L.; Dolphin, C.H. Guide to the Aquatic Insects of New Zealand; Entomological Society of New Zealand: Auckland, New Zealand, 1989; Volume 9. [Google Scholar]
  45. Grainger, N.; Harding, J.S.; Drinan, T.; Collier, K.J.; Smith, B.J.; Death, R.; Makan, T.; Rolfe, J.R. Conservation Status of New Zealand Freshwater Invertebrates, 2018; Publishing Team, Department of Conservation: Wellington, New Zealand, 2018. [Google Scholar]
  46. Phillips, N.; Smith, B. New Zealand Freshwater Macroinvertebrate Trait Database; NIWA National Institute of Water & Atmospheric Research: Hamilton, New Zealand, 2018; p. 25. [Google Scholar]
  47. R Core Team. R: A Language and Environment for Statistical Computing; R Core Team: Vienna, Austria, 2020. [Google Scholar]
  48. Wei, T.; Simko, V. R Package “Corrplot”: Visualization of a Correlation Matrix (Version 0.84). Statistician 2017, 56, e24. [Google Scholar]
  49. Zeileis, A.; Hothorn, T. Diagnostic Checking in Regression Relationships. R News 2002, 2, 7–10. [Google Scholar]
  50. Belbin, L. PATN: Pattern Analysis Package: Technical Reference; Division of Wildlife and Ecology, CSIRO: Canberra, Australia, 1995. [Google Scholar]
  51. Faith, D.P.; Minchin, P.R.; Belbin, L. Compositional Dissimilarity as a Robust Measure of Ecological Distance. Vegetatio 1987, 69, 57–68. [Google Scholar] [CrossRef]
  52. Oksanen, J.; Simpson, G.L.; Blanchet, F.G.; Kindt, R.; Legendre, P.; Minchin, P.R.; O’Hara, R.B.; Solymos, P.; Stevens, M.H.H.; Szoecs, E.; et al. Vegan: Community Ecology Package 2022. Computer Software Manual. Available online: https://www.researchgate.net/publication/360782912_vegan_community_ecology_package_version_26-2_April_2022. (accessed on 6 July 2023).
  53. Atkinson, I.A.E. Derivation of Vegetation Mapping Units for an Ecological Survey of Tongariro National North Island, New Zealand. N. Z. J. Bot. 1985, 23, 361–378. [Google Scholar] [CrossRef]
  54. Tanner, C.C.; Tomer, M.D.; Goeller, B.C. A Framework for Selecting and Applying Interceptive Agricultural Diffuse Pollution Mitigations. N. Z. J. Agric. Res. 2023; in-prep. [Google Scholar]
  55. Scheffer, M.; Geest, G.J.V.; Zimmer, K.; Jeppesen, E.; Søndergaard, M.; Butler, M.G.; Hanson, M.A.; Declerck, S.; Meester, L.D. Small Habitat Size and Isolation Can Promote Species Richness: Second-Order Effects on Biodiversity in Shallow Lakes and Ponds. Oikos 2006, 112, 227–231. [Google Scholar] [CrossRef]
  56. Spieles, D.J.; Mitsch, W.J. Macroinvertebrate Community Structure in High-and Low-Nutrient Constructed Wetlands. Wetlands 2000, 20, 716–729. [Google Scholar] [CrossRef]
  57. Briers, R.A.; Biggs, J. Spatial Patterns in Pond Invertebrate Communities: Separating Environmental and Distance Effects. Aquat. Conserv. Mar. Freshw. Ecosyst. 2005, 15, 549–557. [Google Scholar] [CrossRef]
  58. Moreno-Mateos, D.; Meli, P.; Vara-Rodríguez, M.I.; Aronson, J. Ecosystem Response to Interventions: Lessons from Restored and Created Wetland Ecosystems. J. Appl. Ecol. 2015, 52, 1528–1537. [Google Scholar] [CrossRef]
  59. Innes, J.; King, C.; Bartlam, S.; Forrester, G.; Howitt, R. Predator Control Improves Nesting Success in Waikato Forest Fragments. N. Z. J. Ecol. 2015, 39, 245–253. [Google Scholar]
  60. Smith, B.J.; Reid, D.J. Silent Assassins: Predation of Native New Zealand Trichopteran Eggs by Non-Native Freshwater Gastropods. Aquat. Insects 2016, 37, 293–302. [Google Scholar] [CrossRef]
  61. Angeler, D.G.; Álvarez-Cobelas, M.; Sánchez-Carrillo, S.; Rodrigo, M.A. Assessment of Exotic Fish Impacts on Water Quality and Zooplankton in a Degraded Semi-Arid Floodplain Wetland. Aquat. Sci. 2002, 64, 76–86. [Google Scholar] [CrossRef]
  62. Collier, K.J.; Grainger, N. New Zealand Invasive Fish Species. In New Zealand Invasive Fish Handbook; Lake Ecosystem Restoration New Zealand (LERNZ): Hamilton, New Zealand, 2015; pp. 8–22. [Google Scholar]
  63. Chappel, P.R. The Climate and Weather of Waikato. NIWA Sci. Technol. ND 2011, 61, 1–40. [Google Scholar]
  64. Shearer, J.C. Natural and Anthropogenic Influences on Peat Development in Waikato/Hauraki Plains Restiad Bogs. J. R. Soc. N. Z. 1997, 27, 295–313. [Google Scholar] [CrossRef]
  65. Ministry for the Environment; Stats New Zealand. New Zealand’s Environmental Reporting Series: Environment Aotearoa; Ministry for the Environment and Stats New Zealand: Wellington, New Zealand, 2019; p. 128.
  66. Beard, C.M. Wetlands and Lowland Floodplains. In Waters Waikato: Ecology of New Zealand’s Longest River; Collier, K.J., Hamilt, D.P., Vant, W.N., Howard-Williams, C., Eds.; Environment Waikato and the Centre for Biodiversity and Ecology Research University of Waikato: Hamilton, New Zealand, 2010; pp. 265–279. [Google Scholar]
  67. McGlone, M.S. Postglacial History of New Zealand Wetlands and Implications for Their Conservation. N. Z. J. Ecol. 2009, 33, 23. [Google Scholar]
Figure 1. Dual-purpose, surface-flow constructed wetlands designed for agricultural runoff treatment and surveyed for biodiversity in the Waikato Region, New Zealand. Photos were taken in May 2019. Panel numbers are also the wetland identities, which correspond to sites in decreasing order of their saturated area (1 largest to 5 smallest).
Water 15 02526 g001
Figure 3. Nonmetric multidimensional scaling (NMDS) ordination plot showing aquatic invertebrate community composition (taxa relative abundances and excluding microcrustaceans) for five surface-flow constructed wetlands designed to treat agricultural runoff in the Waikato Region, New Zealand. Site numbers correspond to wetlands in decreasing order of their saturated area (1 largest to 5 smallest). Coloured symbols correspond to different wetlands, and each point represents a composite sample from a different pond within each wetland. Communities that are more similar are plotted closer together, and those that are less similar are further apart.
Water 15 02526 g003
Table 1. Summary of flora and fauna biodiversity measures surveyed across five surface flow constructed wetlands designed to treat agricultural runoff in the Waikato Region, New Zealand. Site numbers correspond to wetlands in decreasing order of their saturated area (1 largest to 5 smallest). The total number of species for each group is noted in parenthesis.
Site 1Site 2Site 3Site 4Site 5MeanMedianSDMin.Max.
Vegetation (113 species)
No. plots131814136
No. species586456443150.6056.0013.1431.0064.00
Ratio native species0.280.390.350.340.260.320.340.060.260.39
Ratio obligate hydrophyte species a0.100.220.250.090.100.150.100.080.090.25
Ratio facultative hydrophyte species a0.430.340.380.520.520.440.430.080.340.52
Ratio terrestrial species a0.450.380.380.360.390.390.380.030.360.45
Terrestrial invertebrates (85 species)
No. 1 month traps1012995
No. species365440493645.7849.007.4836.0054.00
Ratio native species b0.560.570.580.550.440.310.440.280.000.58
Ratio native individuals b0.550.460.490.330.550.500.490.090.330.67
Aquatic invertebrates (47 species)
No. pooled samples33222
No. species253128181825.5025.005.0018.0031.00
Ratio native species0.800.740.820.670.610.740.740.070.610.82
Ratio native individuals c0.280.780.200.150.260.400.280.260.150.78
Birds (20 species)
No. dawn point counts22222
No. species71415111513.1614.002.657.0015.00
Ratio native species0.430.430.530.270.530.450.430.100.270.53
Ratio waterbird species0.430.210.330.180.200.260.210.080.180.43
Mammals (five species)
No. tracking tunnel nights2028161810
No. camera trap nights46442
No. species332212.383.000.691.003.00
Ratio native species0.000.000.000.000.000.000.000.000.000.00
Fish (six species)
No. overnight net sets23221
No. overnight trap sets10147104
No. species05040NANANANANA
Ratio native species0.000.600.000.500.00NANANANANA
Ratio native individuals0.000.080.000.080.00NANANANANA
Notes: a vegetation classification aggregated from Clarkson et al. [36] as obligate hydrophytes (obligate), facultative hydrophytes (facultative, facultative wetland), and terrestrial (upland, facultative upland). b The orders Acari and Collembola were noted as present or absent but not enumerated. c excluding microcrustacean individuals from the families Cladocera, Copepoda, and Ostracoda.
Table 2. Summary of the plot-scale vegetation characteristics of the classification groups surveyed in five surface flow-constructed wetlands designed to treat agricultural runoff in the Waikato Region, New Zealand. Means (per 4 m2 plots) are listed in decreasing order of significance for partitioning across the groups using the Kruskal–Wallis statistic (KW), a non-parametric version of the F-ratio. The higher the KW, the better the variable is at discriminating between the groups.
GroupKWVegetation Classification Groups
ABCDEF
Vegetation type Typha orientalis reedlandMixed sedgelandCarex secta sedgelandPhormium tenax flaxlandMixed grasslandRanunculus repens herbfield
No. plots 39791810
Species (cover %)
Ranunculus repens35.800.115.117.313.467.2
Phormium tenax21.600.330600.395
Carex secta18.401.175.60.602
Holcus lanatus11.600.21.36.113.25.1
Typha orientalis8.486.700000
Plot variables
Prevalence Index35.111.391.512.342.622.91
Canopy maximum height (cm)18.72536216023113786
Canopy mean height (cm)18.419358751257237
Total species richness (n)15.72.32.74.67.15.45.8
Total species cover (%)11112501081118896
Native species richness (n)9.41.711.71.80.90.7
Table 3. Summary of the terrestrial invertebrate community compositions of the five classification groups surveyed from five surface flow-constructed wetlands designed to treat agricultural runoff in the Waikato Region, New Zealand. Sample means are provided for the dominant invertebrate taxa (the lowest practicable taxonomic unit) in the classification groups. The Kruskal–Wallis statistic (KW) for the variables has been presented to inform discrimination between the groups; the higher the KW, the better the variable is at discriminating between groups.
GroupKWInvertebrate Classification Groups
12345
No. samples 215255
Taxa (mean count)
Coleoptera Latridiidae Cartodere sp. 4.01.07.05.627.8
Coleoptera Corylophidae Sericoderus sp. 2.60.63.02.22.0
Amphipoda Talitdirdae Genus sp. 1.822.05.00.60.6
Diptera Sphaeroceridae Genus sp. 2.111.60.500.8
Diptera Phoridae
Metopina sp.
1.73.856.50.60.2
Orthoptera Gryllidae
Genus sp.
0.42.20.510.40
Hymenoptera Formicidae Chelaner sp. 0.1006.20
Sample variables
Canopy mean height (cm)13.3684116584150
Total individuals (n)10.829.566.28844.442.2
Vegetation structure a10.2sedgeland-herbfieldherbfieldflaxlandflaxland-shrublandshrubland
Canopy maximum height (cm)7.7143.473.8290167.4219
Litter depth mean (cm)7.62.85.46.55.25.6
Litter depth maximum (cm)7.35.711.614.58.611.4
Notes: a vegetation structure group names were assigned according to the characteristic species composition and vegetation structure following Atkinson [53].
Disclaimer/Publisher’s Note: The statements, opinions and data contained in all publications are solely those of the individual author(s) and contributor(s) and not of MDPI and/or the editor(s). MDPI and/or the editor(s) disclaim responsibility for any injury to people or property resulting from any ideas, methods, instructions or products referred to in the content.

