Article

Optimizing Solution in Decision Supporting System for River Basin Management Consisting of a Reservoir System

by
Ratsuda Ngamsert
1,
Rapeepat Techarungruengsakul
1,
Siwa Kaewplang
1,
Rattana Hormwichian
1,
Haris Prasanchum
2,
Ounla Sivanpheng
3 and
Anongrit Kangrang
1,*
1
Faculty of Engineering, Mahasarakham University, Kantharawichai District, Maha Sarakham 44150, Thailand
2
Faculty of Engineering, Rajamangala University of Technology, Isan Khon Kaen Campus, Muang, Khon Kaen 40000, Thailand
3
Faculty of Water Resources, National University of Laos, Vientiane 01020, Laos
*
Author to whom correspondence should be addressed.
Water 2023, 15(14), 2510; https://doi.org/10.3390/w15142510
Submission received: 30 May 2023 / Revised: 27 June 2023 / Accepted: 6 July 2023 / Published: 9 July 2023
(This article belongs to the Section Water Resources Management, Policy and Governance)

Abstract

:
Decision support systems tackle problems and require systematic planning. They consider physical data, hydrological data, and sediment levels to achieve efficiency and adaptability in various situations. Therefore, this research aims to identify alternative engineering choices for the management of a river basin with a single reservoir system. Optimization techniques, including marine predator algorithm (MPA), genetic algorithm (GA), genetic programming (GP), tabu search (TS), and flower pollination algorithm (FPA), were applied to find the optimal reservoir rule curves using a reservoir simulation model. The study focused on the Ubolratana Reservoir in Thailand’s Khon Kaen Province, considering historic inflow data, water demand, hydrologic and physical data, and sedimentation volume. Four scenarios were considered: normal water scarcity, high water scarcity, normal excess water, and high excess water. The optimal rule curves derived from the reservoir simulation model, incorporating sedimentation and hedging rule (HR) criteria, were found to be the best engineering choices. In the normal and high water scarcity scenarios, they minimized the average water shortage to 95.558 MCM/year, with the lowest maximum water shortage 693.000 MCM/year. Similarly, in the normal and high excess water scenarios, the optimal rule curves minimized the average excess water, resulting in a minimum overflow of 1087.810 MCM/year and the lowest maximum overflow 4105.660 MCM/year. These findings highlight the effectiveness of integrating optimization techniques and a reservoir simulation model to obtain the optimal rule curves. By considering sedimentation and incorporating HR criteria, the selected engineering alternatives demonstrated their ability to minimize water shortage and excess water. This contributes to improved water resource management and decision-making in situations of scarcity and excess.

1. Introduction

Water resources planning and administration for different systems are quite complicated, especially the system of natural resources as a result of the fact that it is both utilized for life and changes due to environmental circumstances. This has a significant effect, particularly on water resources. Currently, water resources are deteriorating in both quantity and quality [1,2,3,4]. Therefore, planning and administration are important tools in supporting effective management solutions, as well as choosing the right solution to the right problem or situation. A decision support system is a combination of technology and decision-making, for example, the development of three systems at the same time, including the database management system, model-based management system, and dialog generation and management system. Therefore, the implementation of the decision support system in a work will increase efficiency. It is important to choose the right approach to solve a problem in terms of qualitative decision-making in solving the problem and using it in the field of water management [5,6,7].
Water resource management is planning, operating, monitoring, evaluating, and analyzing work plans. Although project objectives might be achieved in the current situation, future crises might result in failure. Therefore, the current water resource management focuses on economic water management, efficient social justice, and environmental sustainability for maximum efficiency [8]. In addition, water resource management without construction must also consider the time, budget, acceptance, or impact of other related resources [9,10]. Thus, water management is economical and has the least impact on other aspects and is also a way for the government to encourage all sectors to participate in the management, such as increasing the water cost potential, the water supply model, canal dredging, watershed forest conservation, finding the right cultivation form, irrigation efficiency estimation, and management of reservoirs.
Reservoir management is one of the more effective measures for the development of integrated water resource management. Step storage, allocation, flood, and drought are all controlled under reservoir operation in order to accomplish the reservoir’s goals by combining the supply side and demand side management methods. Advance planning for the operation of the reservoir is an important tool. The basis for reservoir management is the reservoir rule curves, which are the water release criteria developed from the model base from important data, such as the demand for water at the end of the basin, the amount of rainfall, the amount of runoff that flows into the basin, the physical characteristics of the basin, etc. However, these data should always be validated for accuracy before being included in the analysis. This is a model developed for simulating a reservoir operating system under various conditions in order to plan or improve future reservoir management efficiency. Thus, the reservoir operating rule curves can be considered as another set of answers or alternatives to decide on the water management system, and they are important and fundamental tools for improving reservoir operations [11,12,13].
The reservoir operating rule curves or the rule curves, which are generated from the analysis of historical hydrological data that have different conditions, with the water demand displayed in the form of water level rule curves in a reservoir. Consisting of two graph lines, the upper rule curve (URC) is intended for use in the rainy season to provide an adequate flooded area and water retention for all activities each month. It is also the cost of water in the next year. In the dry season, lower rule curves (LRC) are used to decide on releasing or reserving the water volume between the lower control water level and the lowest storage water level for the growing season. The proper implementation of rule curves also relies on this graph as a tool to avoid retaining too much water, as this may be dangerous to the dam, whereas too little water may cause water shortages in the future. It is obvious that the upper rule curve and lower rule curve borders are where the reservoir’s water level management is most tightly constrained. However, in order to improve the accuracy of water management and lower the overall risk, the rule curves for water management must be flexible and consistent in every circumstance when employing the current year data [14,15]. Therefore, water management using the upper and lower graphs should not be fixed; rather, there should be a graph that allows flexibility in water management. However, the rule curves still have the basic principle of applying in the management of water resources; they use the standard water discharge criteria in both normal and critical water situations.
Discharge criteria are conditions for controlling the release or storage of water for the operation of a reservoir. The standard operating policy (SOP) discharge criteria are to release as much water as the reservoir can supply to meet the target [16,17]. The hedging rule (HR) has been used to reduce the risk and damage caused by severe water scarcity in the future [18,19,20]. The SOP water release threshold has drawn interest, having been established and applied in many different contexts. However, because of the shift in the volume of water flowing into the reservoir, the SOP water release threshold results in a single, severe water shortage. Therefore, in order to reduce the current and future impacts, HR water release criteria have been developed for reservoir operations during the dry season under various conditions that use the high release principle [21,22,23,24]. HR water release criteria have been used to solve single-phase water shortage and effectively reduce water shortage, thereby alleviating drought. In addition, when considering the allocation of water demands for agriculture under the effects of climate change, HR water release criteria can greatly mitigate current and future droughts and are also suitable to be used in conjunction with reservoir control curves. For managing a critical reservoir with both flood and drought situations like the Ubolratana Reservoir in Khon Kaen, the problem of precipitation resulted in the amount of storage. In addition, reservoir sedimentation is a major problem for the management of reservoirs in many areas [25,26]. This may be exacerbated by changes in the use of water storage areas [27]. The reservoir capacity decreasing over time directly results from finding rule curves for use as a discharge criterion [28,29,30,31,32].
In the past, reservoir rule curve determination relied on trial-and-error methods, suitable for less complex systems based on past performance calculations. However, for managing intricate reservoirs, these methods may be insufficient [33,34,35]. To overcome this limitation, metaheuristic algorithms like genetic algorithms (GA) [36,37], genetic programming (GP) [38,39], tabu search (TA) [40], Harris Hawks optimization (HHO) [41], wind-driven optimization (WDO) [42], firefly algorithm (FA) [43], flower pollination algorithm (FPA) [44,45], gray wolf optimizer [46], marine predator algorithm (MPA) [47], and others have been employed. These algorithms effectively locate the global optimum, offering diverse solutions. Optimizing reservoirs using these algorithms is crucial for maximizing efficiency, enhancing production, and enabling informed decision-making for the sustainable management of valuable water resources [48,49]. Developing rule curves based on various water discharge criteria would significantly improve single reservoir basin management, providing decision-makers with flexible options aligned with their engineering preferences. This facilitates more effective solutions for water storage and related challenges. Integrating optimal rule curves with other considerations such as economics, the environment, and society allows for comprehensive and effective decisions encompassing all aspects. This approach ensures the efficient and sustainable management of valuable water resources.
Decision support systems are processes, methods, or approaches to dealing with problems. Events that influence water resources also affect people, animals, and plants and require systematic planning. The system is required to consider many elements of information, such as physical data, hydrological data, and the amount of sediment in the area, as well as the participation of stakeholders, to achieve the highest efficiency and be suitable for various situations [50,51,52,53]. The decision supporting system in water resources management directly involves many factors, such as social factors, environmental factors, economic factors, and engineering factors, as well as reservoir management. The decision support system is a system developed from many areas of knowledge. This includes the body of knowledge of each discipline that has been applied. Previous research has revealed that reservoir management relates to a wide range of factors. To increase the qualitative efficiency of decision-making in the problem-solving of water resources management, optimization techniques are required to include the system, thereby creating alternatives for the decision-making system.
Therefore, this research aims to create alternative engineering choices to support decision-making systems for single reservoir management by making choices according to different situations by applying optimization techniques. The optimization techniques marine predator algorithm (MPA), genetic algorithm (GA), genetic programming (GP), tabu search (TS), and flower pollination algorithm (FPA) were applied to link with the reservoir simulation model. The release criteria of the hedging rule (HR) and standard operating policy (SOP) were used in the reservoir simulation model. The Ubolratana Reservoir, located in Khon Kaen Province in the northeast of Thailand, was considered in this study.

2. Materials and Methods

2.1. Study Area

The proposed model was applied to the Ubolratana Reservoir, located at 102°37′06.0″ E; 16°46′31.4″ N in Khon Kaen Province in the northeast of Thailand. It has a total water intake area of around 12,000 km2 covering the three provinces of Nong Bua Lamphu, Chaiyaphum, and Khon Kaen. The Ubolratana Reservoir, despite its intended purpose of managing water for flood and drought control in the Chi River Basin, still suffers from flooding, drought, and reduced water storage areas due to sedimentation issues. A schematic diagram of the reservoir is shown in Figure 1.

2.2. The Conceptual Model of DSS for a Single Reservoir Operation in a Basin

The information utilized in this study was gathered from many academic journals and organized into a database [5,6,7]. The information was also utilized to establish the parameters in reservoir simulation models and optimization techniques. The conceptual model of DSS for a single reservoir consists of 5 parts: the data base, model base, scenario, alternative choices, and evaluation, as shown in Figure 2. The details of each part will be described below.

2.2.1. Data Base

  • Inflow data and water demands
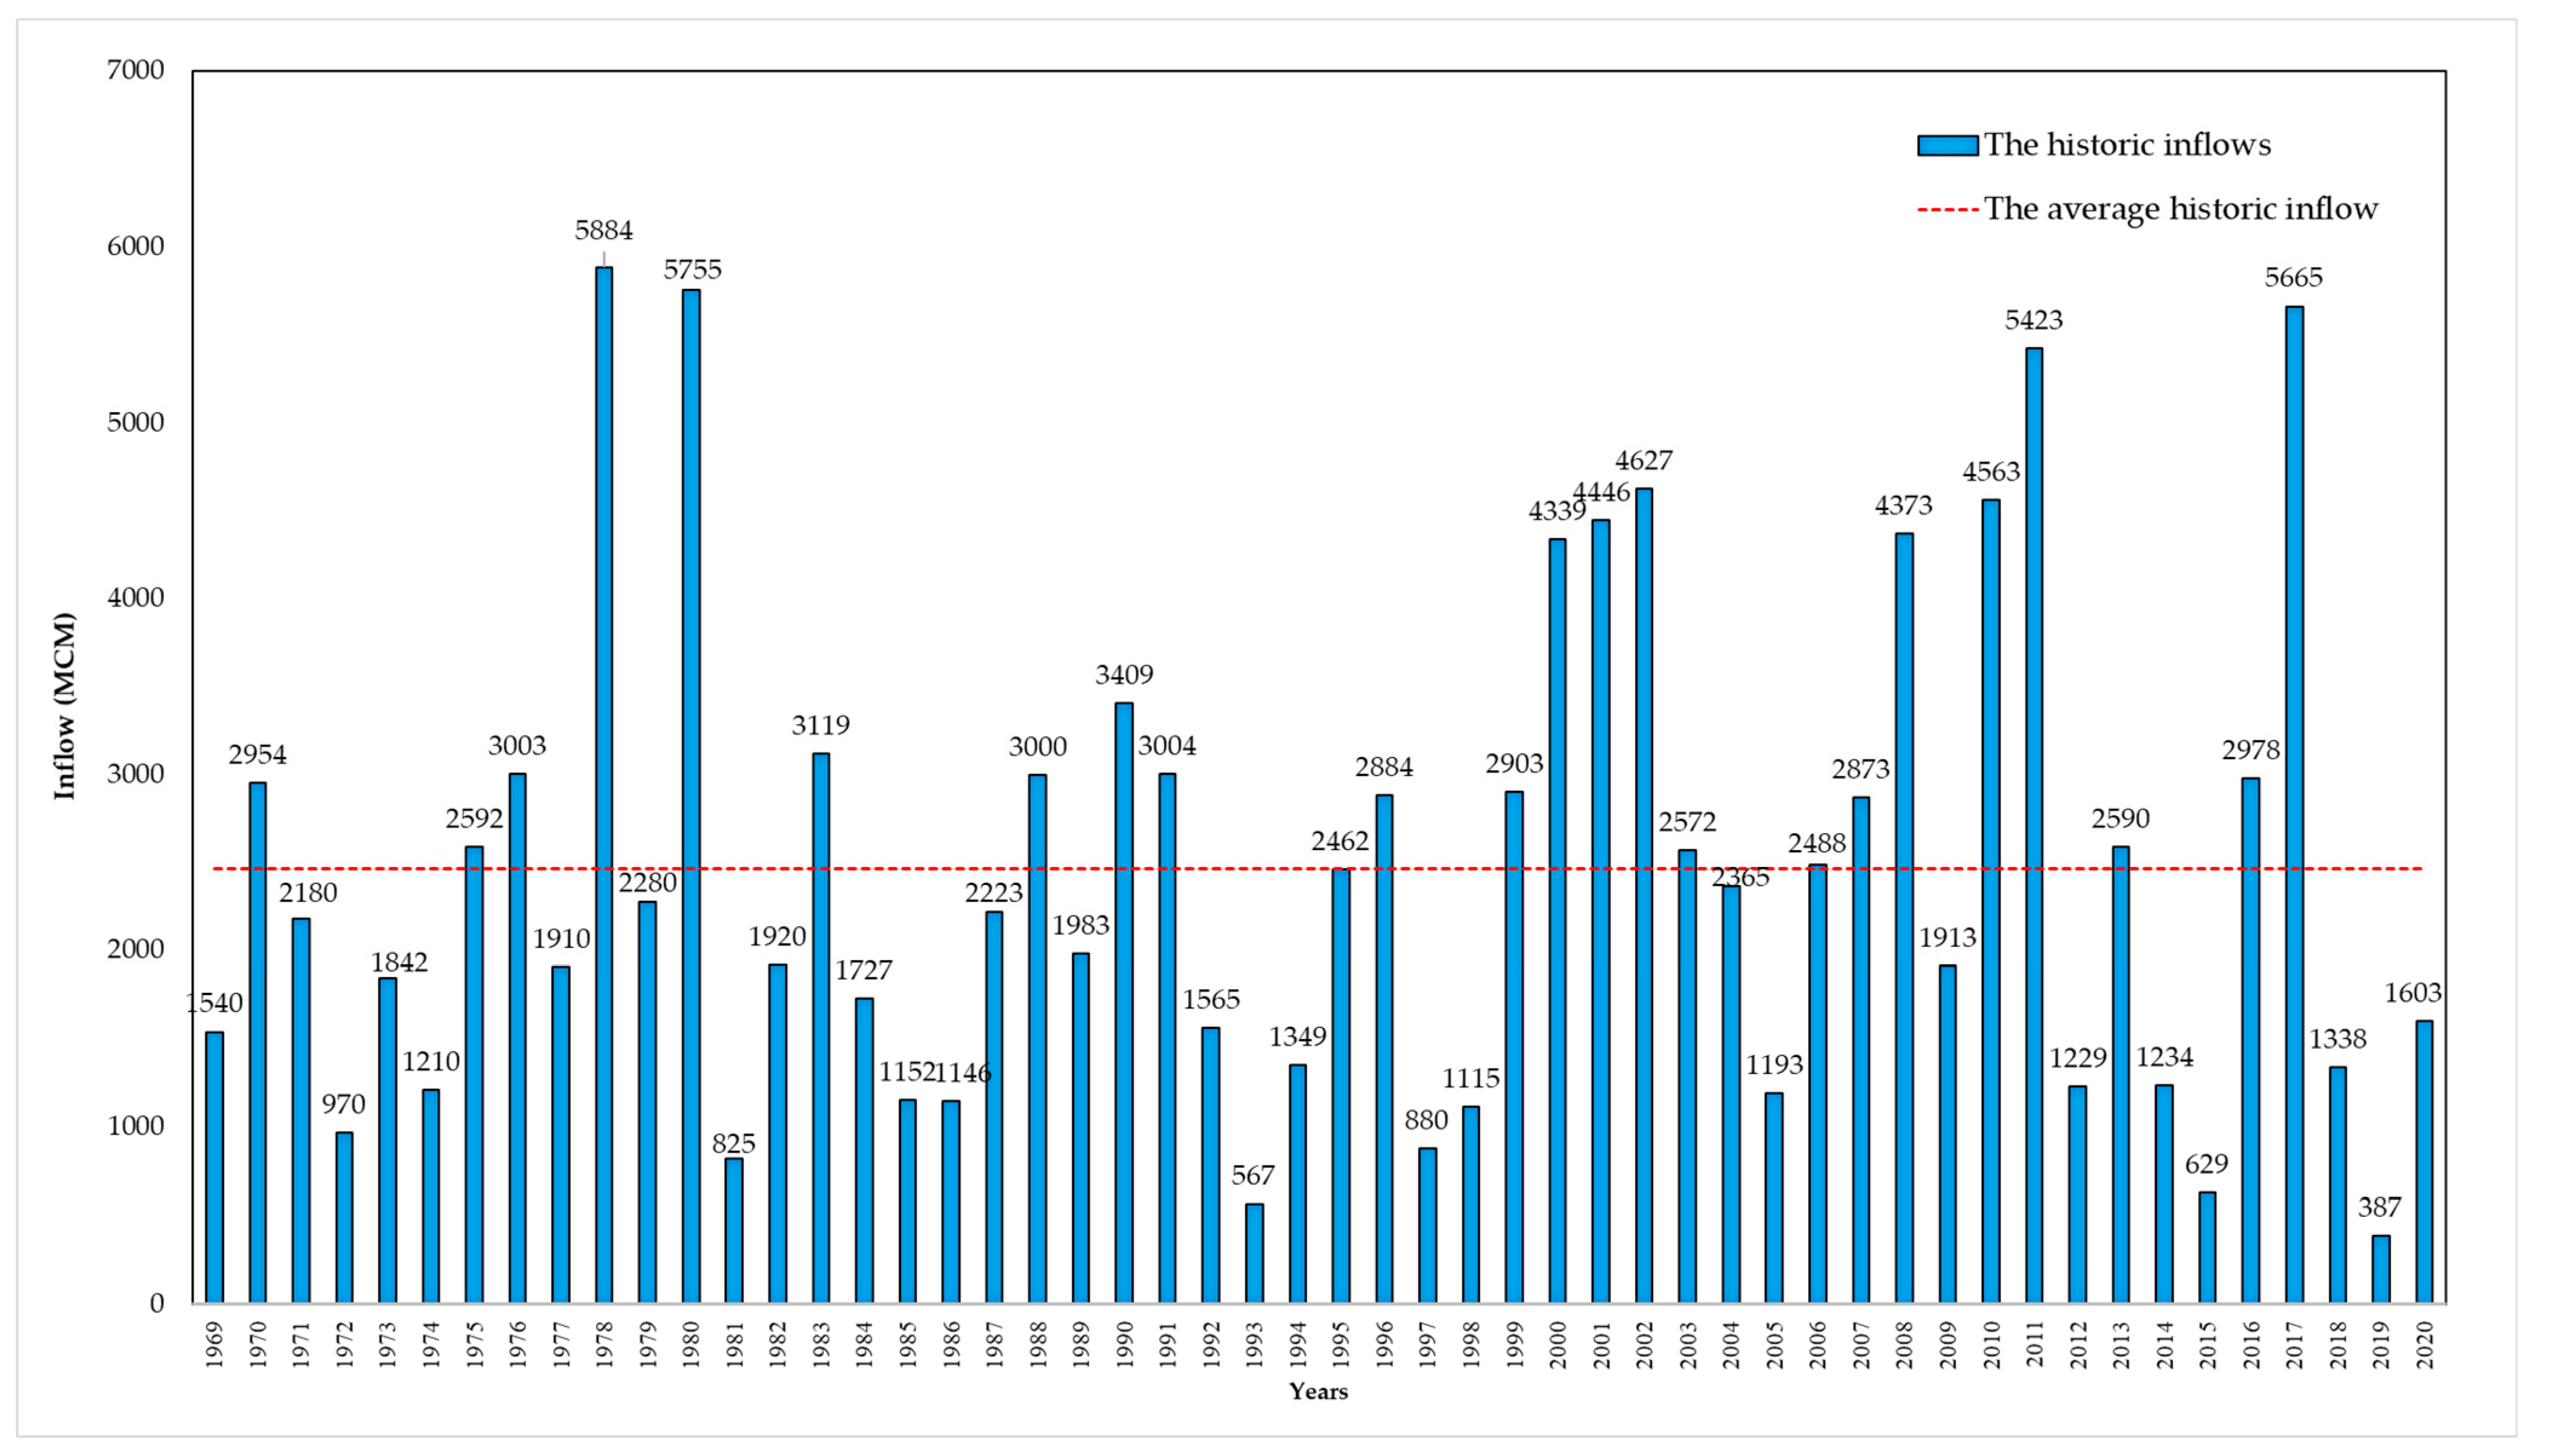
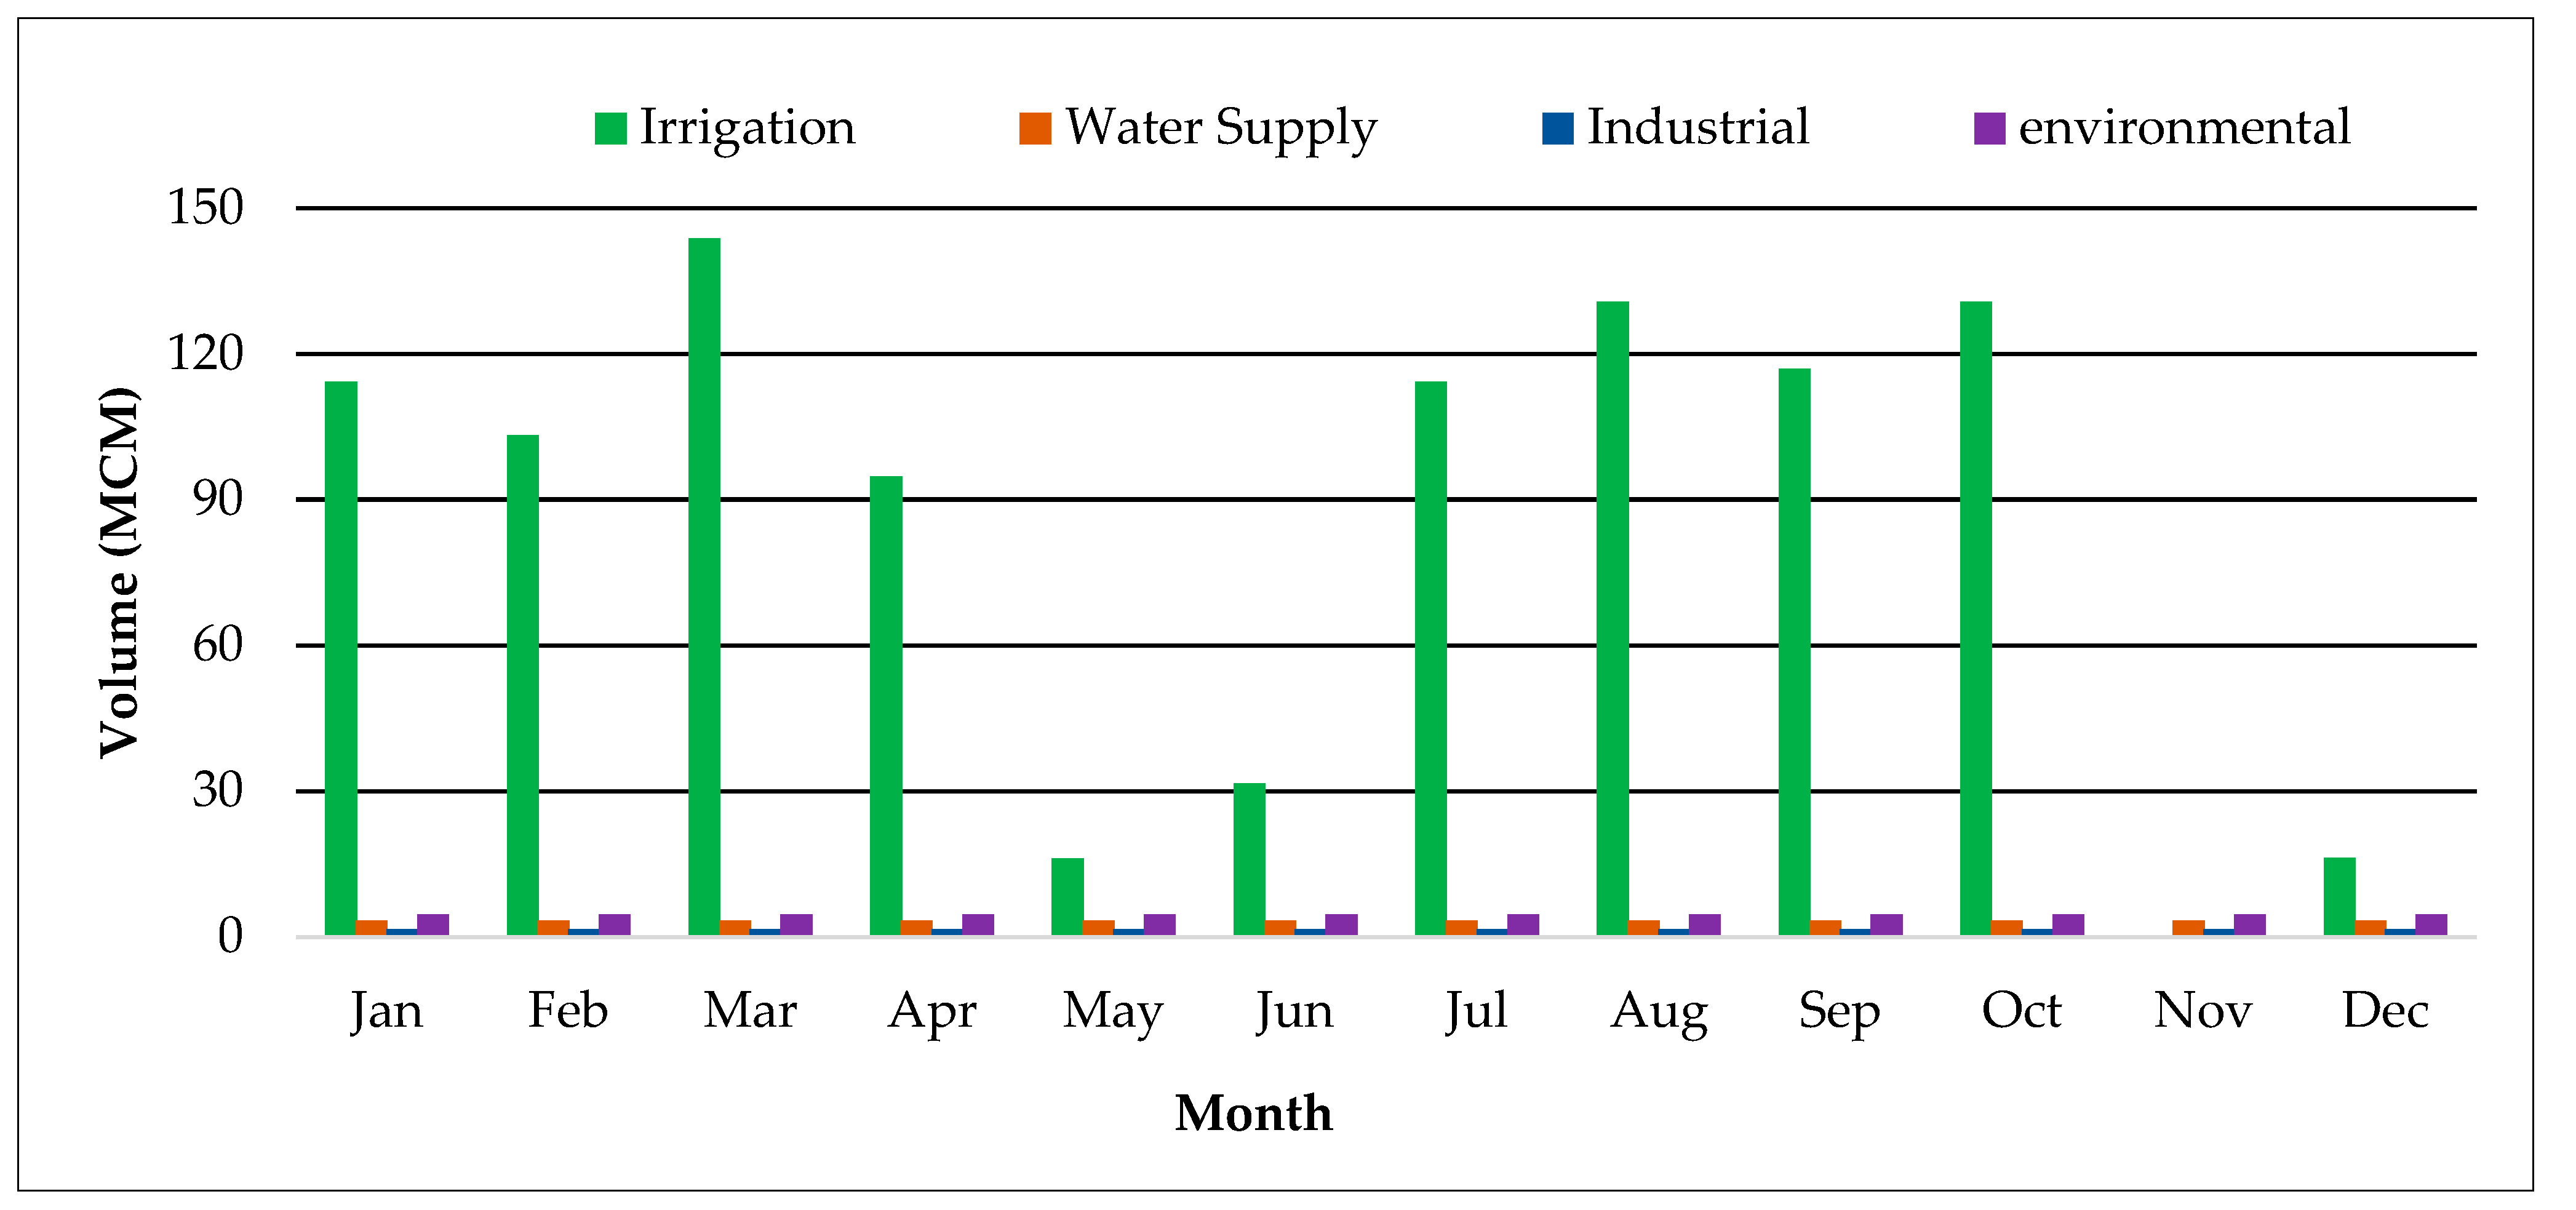
The Ubolratana Dam Reservoir is an important source of surface runoff. The historical annual inflow data spanning 52 years (from 1971 to 2020) and the average reservoir inflow of 2465 MCM/year are shown in Figure 3. The nominal storage capacity and dead storage capacity are reported as 2431 MCM and 581.67 MCM, respectively. The water surface area at normal storage is 137.90 km2. The downstream water demands from the reservoir are electricity generation, irrigation, flood control, industrial demand, domestic water supply, and environmental conservation. The monthly water demands from the reservoir are shown in Figure 4, which indicates that the largest requirement is for irrigation and the least is industrial demand.
  • Sediment load assessment at Ubolratana Reservoir
The Ubolratana Reservoir was built in 1966, with the water surface area and capacity curves being created at that time. To compute the storage and sedimentation, the water surface area and storage capacity curves were employed. These curves were revised in 2019 to estimate the storage capacity and sedimentation build-up using remote sensing data and used a 2009 study that evaluated the decline in capacity at each water height. The capacity of the Ubolratana Reservoir had diminished after ten years [54]. This data was used in the current analysis of situations that included sedimentation in the reservoir.

2.2.2. Model Bases

  • Reservoir simulation model
Reservoir operation was carried out using the reservoir simulation model, which employs the water balance equation while taking the reservoir rule curves and release criteria into account. The available water was found by calculating the water balance concept during the year ν and month τ, as described in Equation (1). Next, in this study, the release criteria were considered to consist of the HR and the SOP, the performance of which was evaluated as shown in Figure 5.
W ν , τ = S ν , τ 1 + Q ν , τ R ν , τ E τ
where
  • W ν , τ = the available water during a month τ;
  • S ν , τ 1 = the stored water at the end of a month τ − 1;
  • Q τ = the inflow to the reservoir during a month τ;
  • E τ = the average value of the evaporation loss during s month τ.
Figure 5. The hedging rule and the standard operating policy.
Water 15 02510 g005
  • Optimization techniques
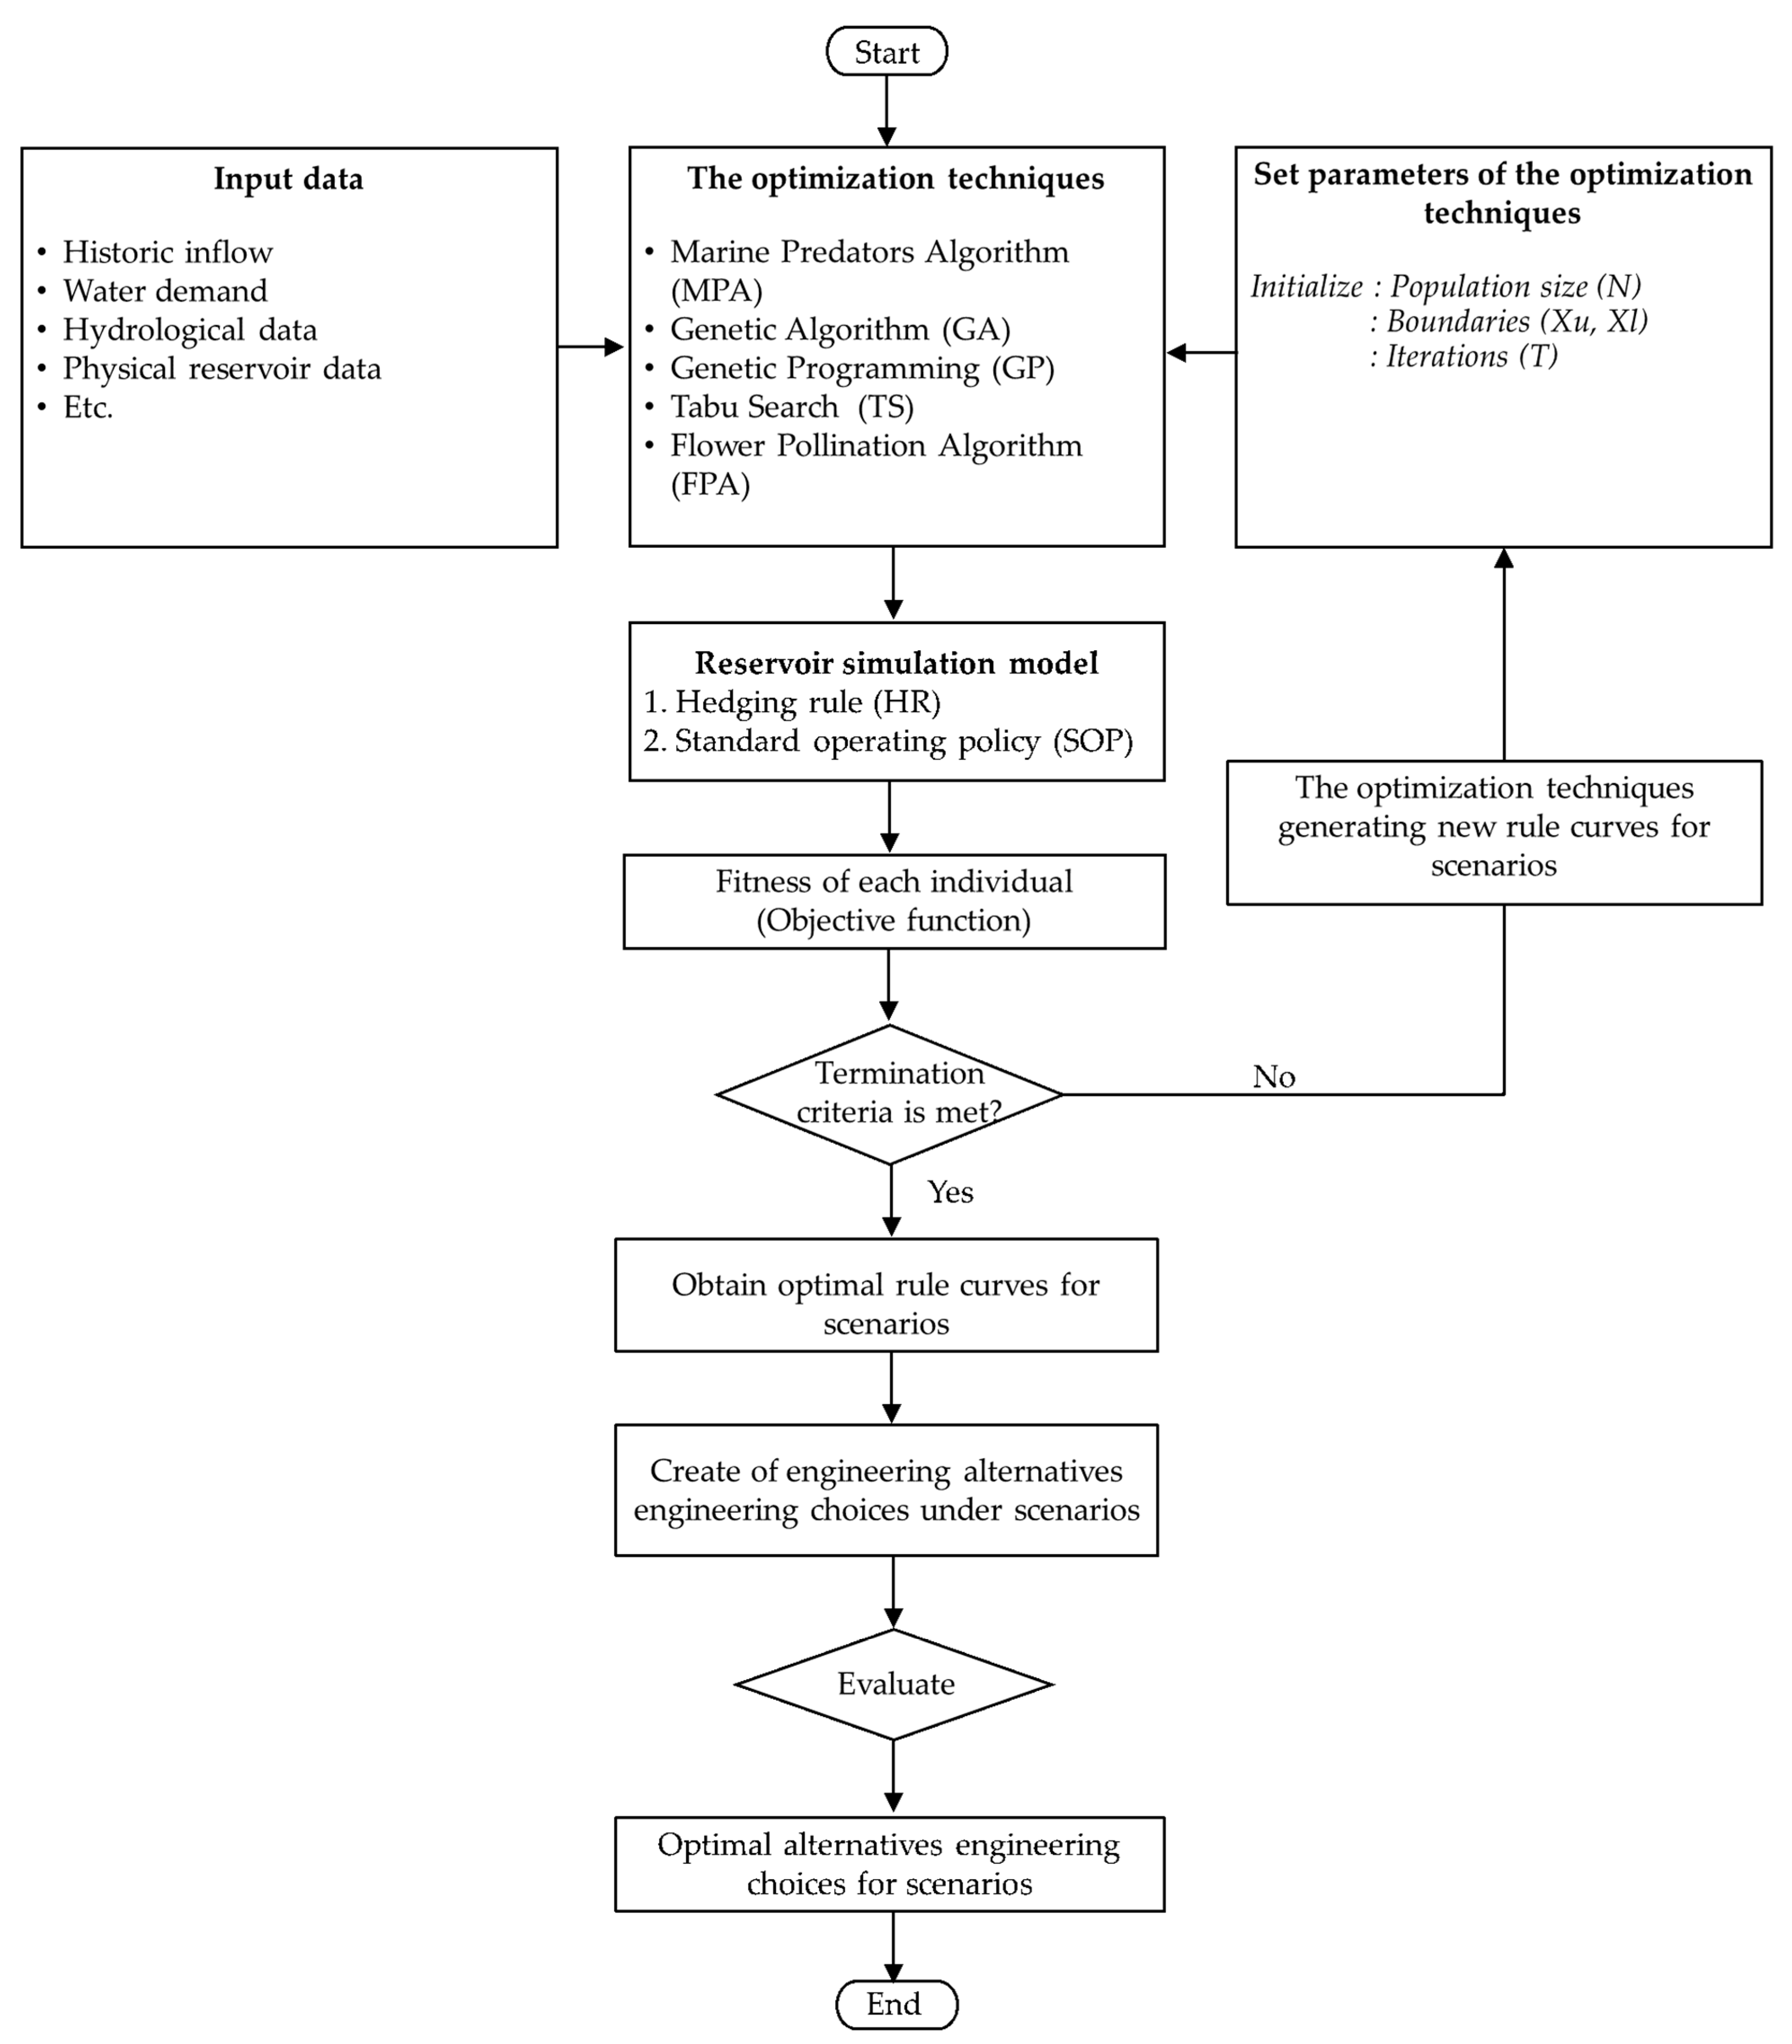
Optimization techniques have been developed and applied in a wide variety of applications in solving numerical and engineering problems. In this study, optimization techniques of the MPA, GA, GP, TS, and FPA were applied to find the optimal rule curves for creating alternative choices in various situations. The objective functions of the search procedure in this study were the minimal average water shortage as described in Equation (2) and the minimal average excess water per year in Equation (3). The model bases within the reservoir simulation model for single reservoir operations were as shown in Figure 6.
The minimal average water shortage per year
M i n H ( a v r ) = 1 n v = 1 n S h V
The minimal average excess water per year
M i n P ( a v r ) = 1 n v = 1 n S p V
where
  • H(avr) = the minimal average water shortage per year;
  • P(avr) = the minimal average excess water per year;
  • Shv = the water shortage during the year v (year in which releases are less than the target demand);
  • Spv = the excess released water during the year v (year in which releases are more than the target demand);
  • n = the whole magnitude of the examined years.

2.2.3. Scenarios to Consider

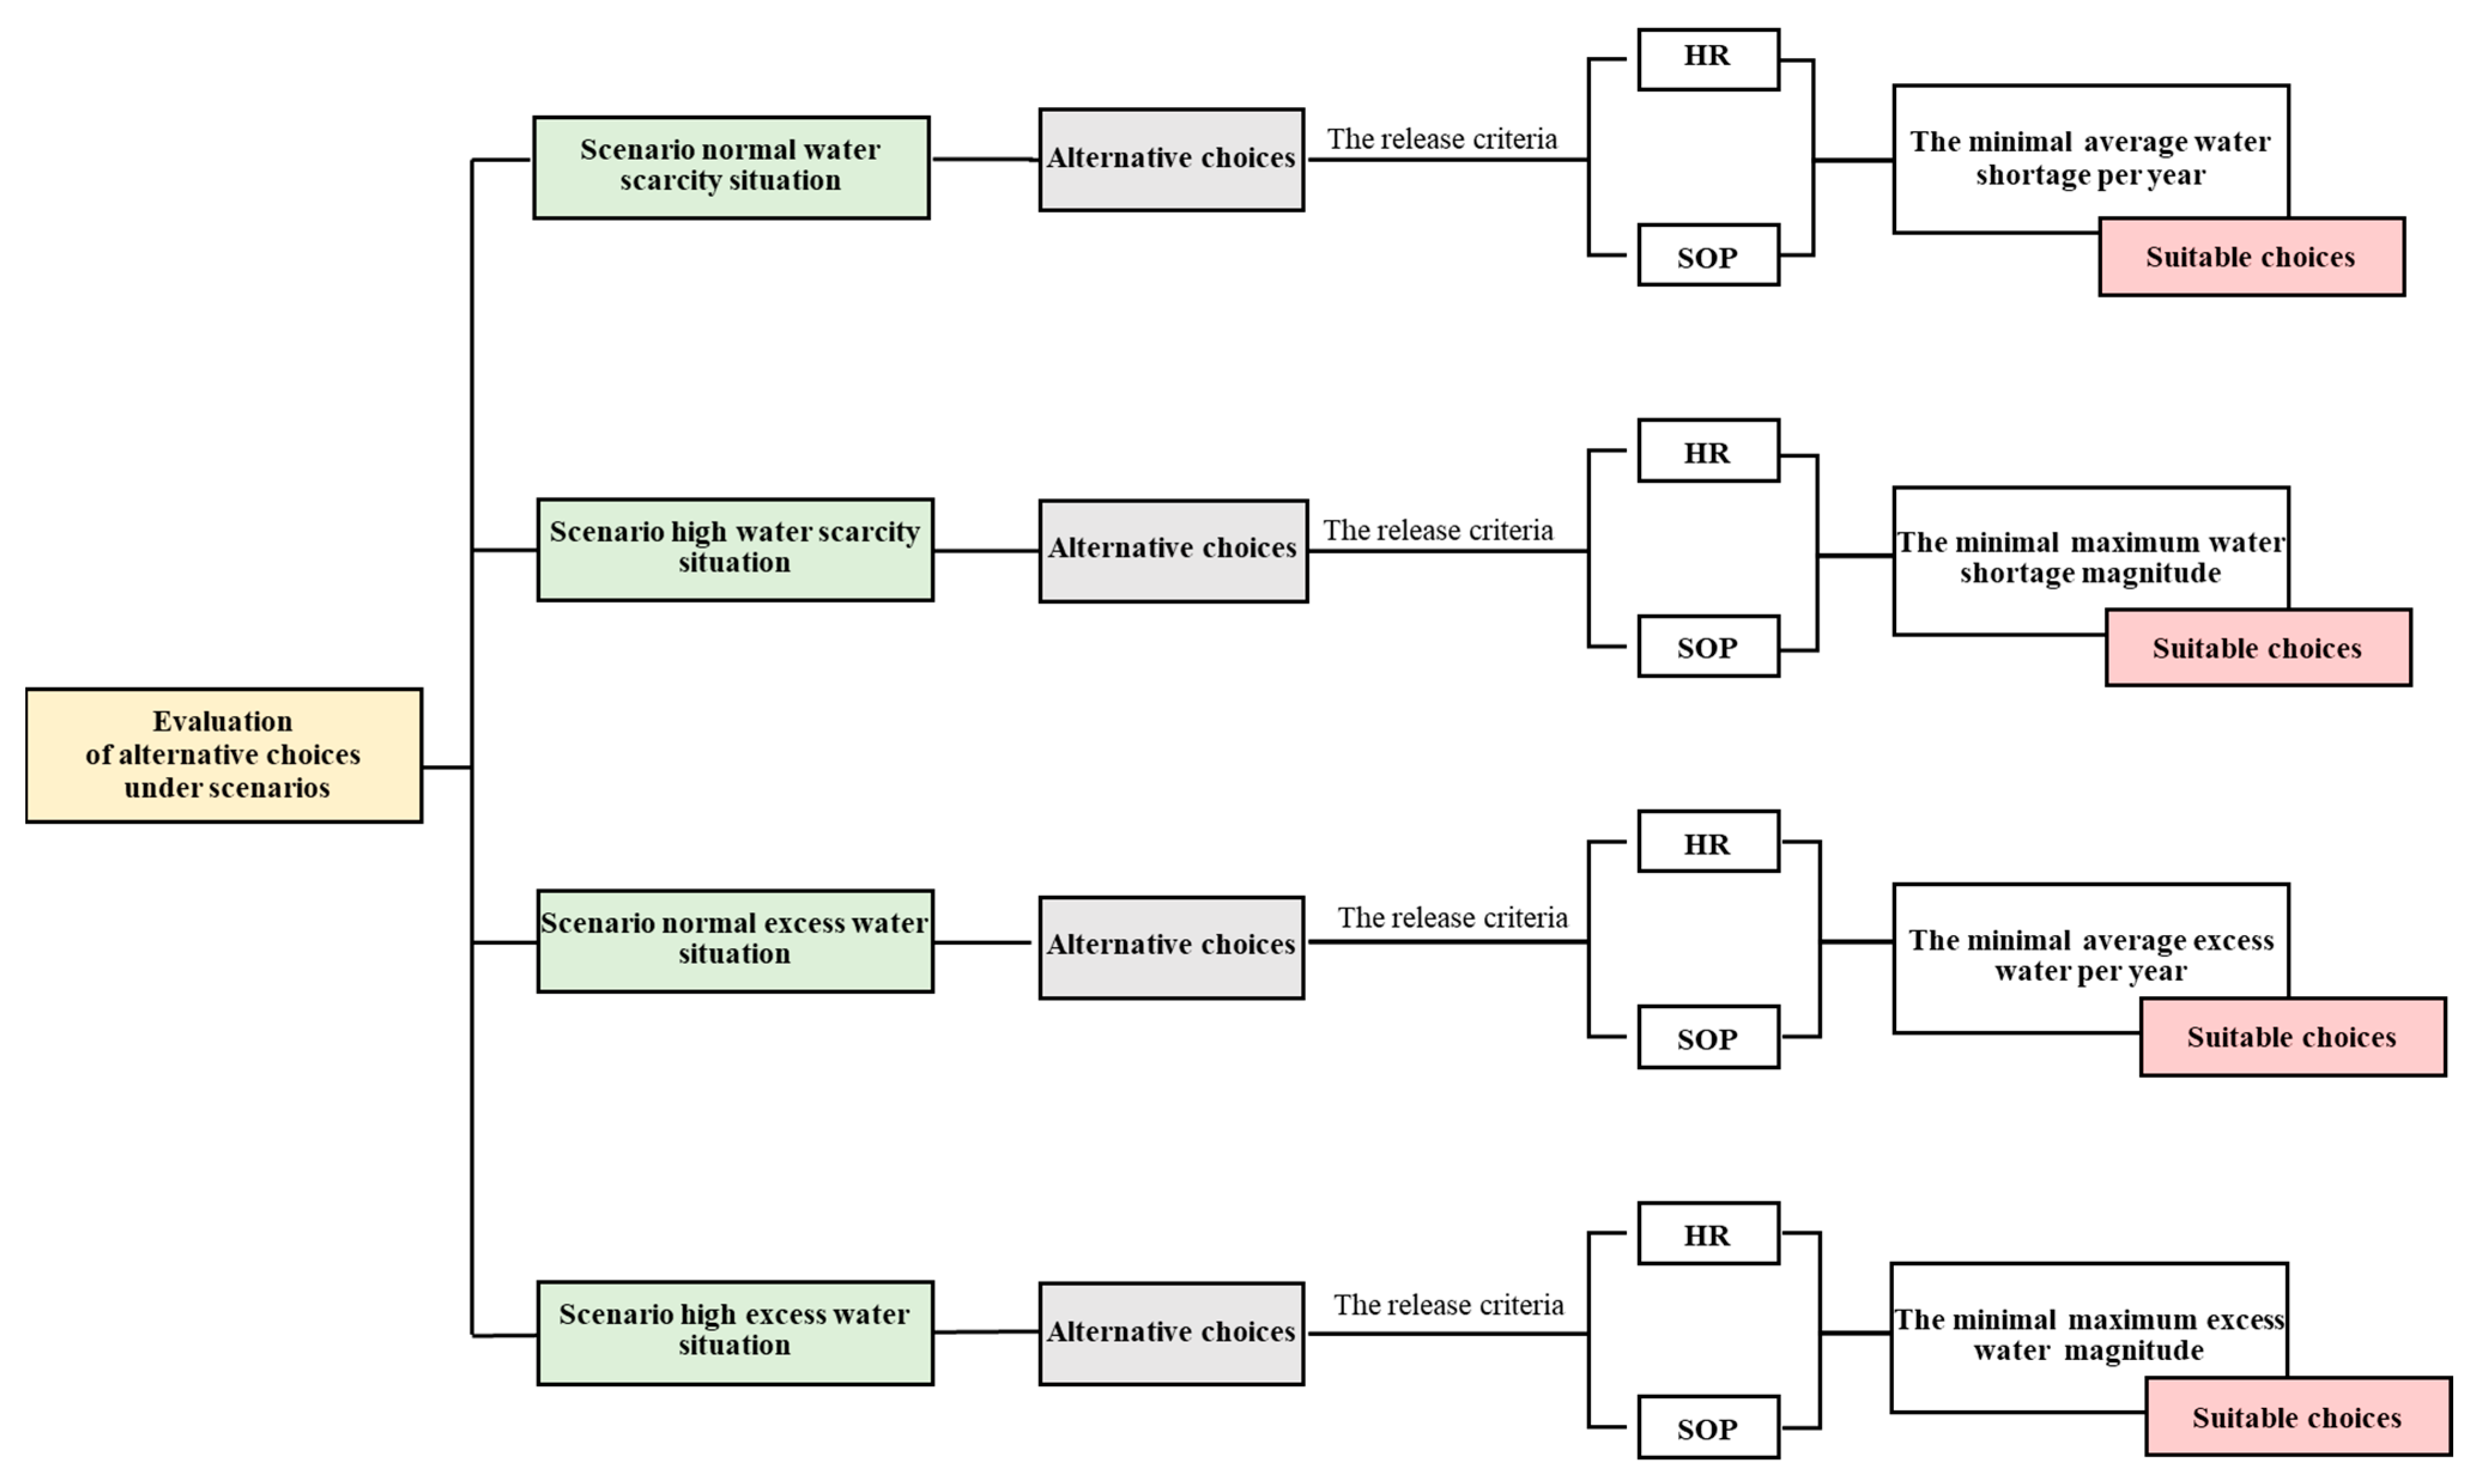
The Ubolratana Reservoir is a large single reservoir used as a tool to manage water for the protection and alleviation of flood and drought problems in the Chi River Basin. However, the reservoir still suffers from flooding and drought, as well as decreasing water storage areas, due to sediment problems in the reservoir. Thus, engineering choices are created from 4 scenarios: a normal water scarcity situation, a high water scarcity situation, a normal excess water situation, and a high excess water situation covering severe events in the river basin. These 4 scenarios were analyzed to evaluate all alternative choices. The results of the evaluation are presented in terms of water shortage and water excess according to the context of the reservoir and basin. The most suitable choice was selected from each scenario. Therefore, all suitable choices were represented for each scenario, as shown in Figure 7.

2.2.4. Alternative Evaluation

The obtained rule curves from all the optimization techniques were used to evaluate all scenarios. The searching rule curves of all the optimization techniques under the same conditions provided similarly optimal rule curves. Therefore, these optimal rule curves were used to evaluate only one set of the obtained rule curves. The alternative engineering options were evaluated under 4 scenarios, which were a normal water scarcity situation, a high water scarcity situation, a normal excess water situation, and a high excess water situation. These alternative options were assessed by using the release criteria of the HR and SOP with historic inflow data for 52 years, as shown in Figure 8. The efficiency of the engineering choices was indicated by the average water shortage, maximum water shortage, average excess water, and maximum excess water.

3. Results and Discussion

3.1. The Alternative Engineering Choice of Each Scenario

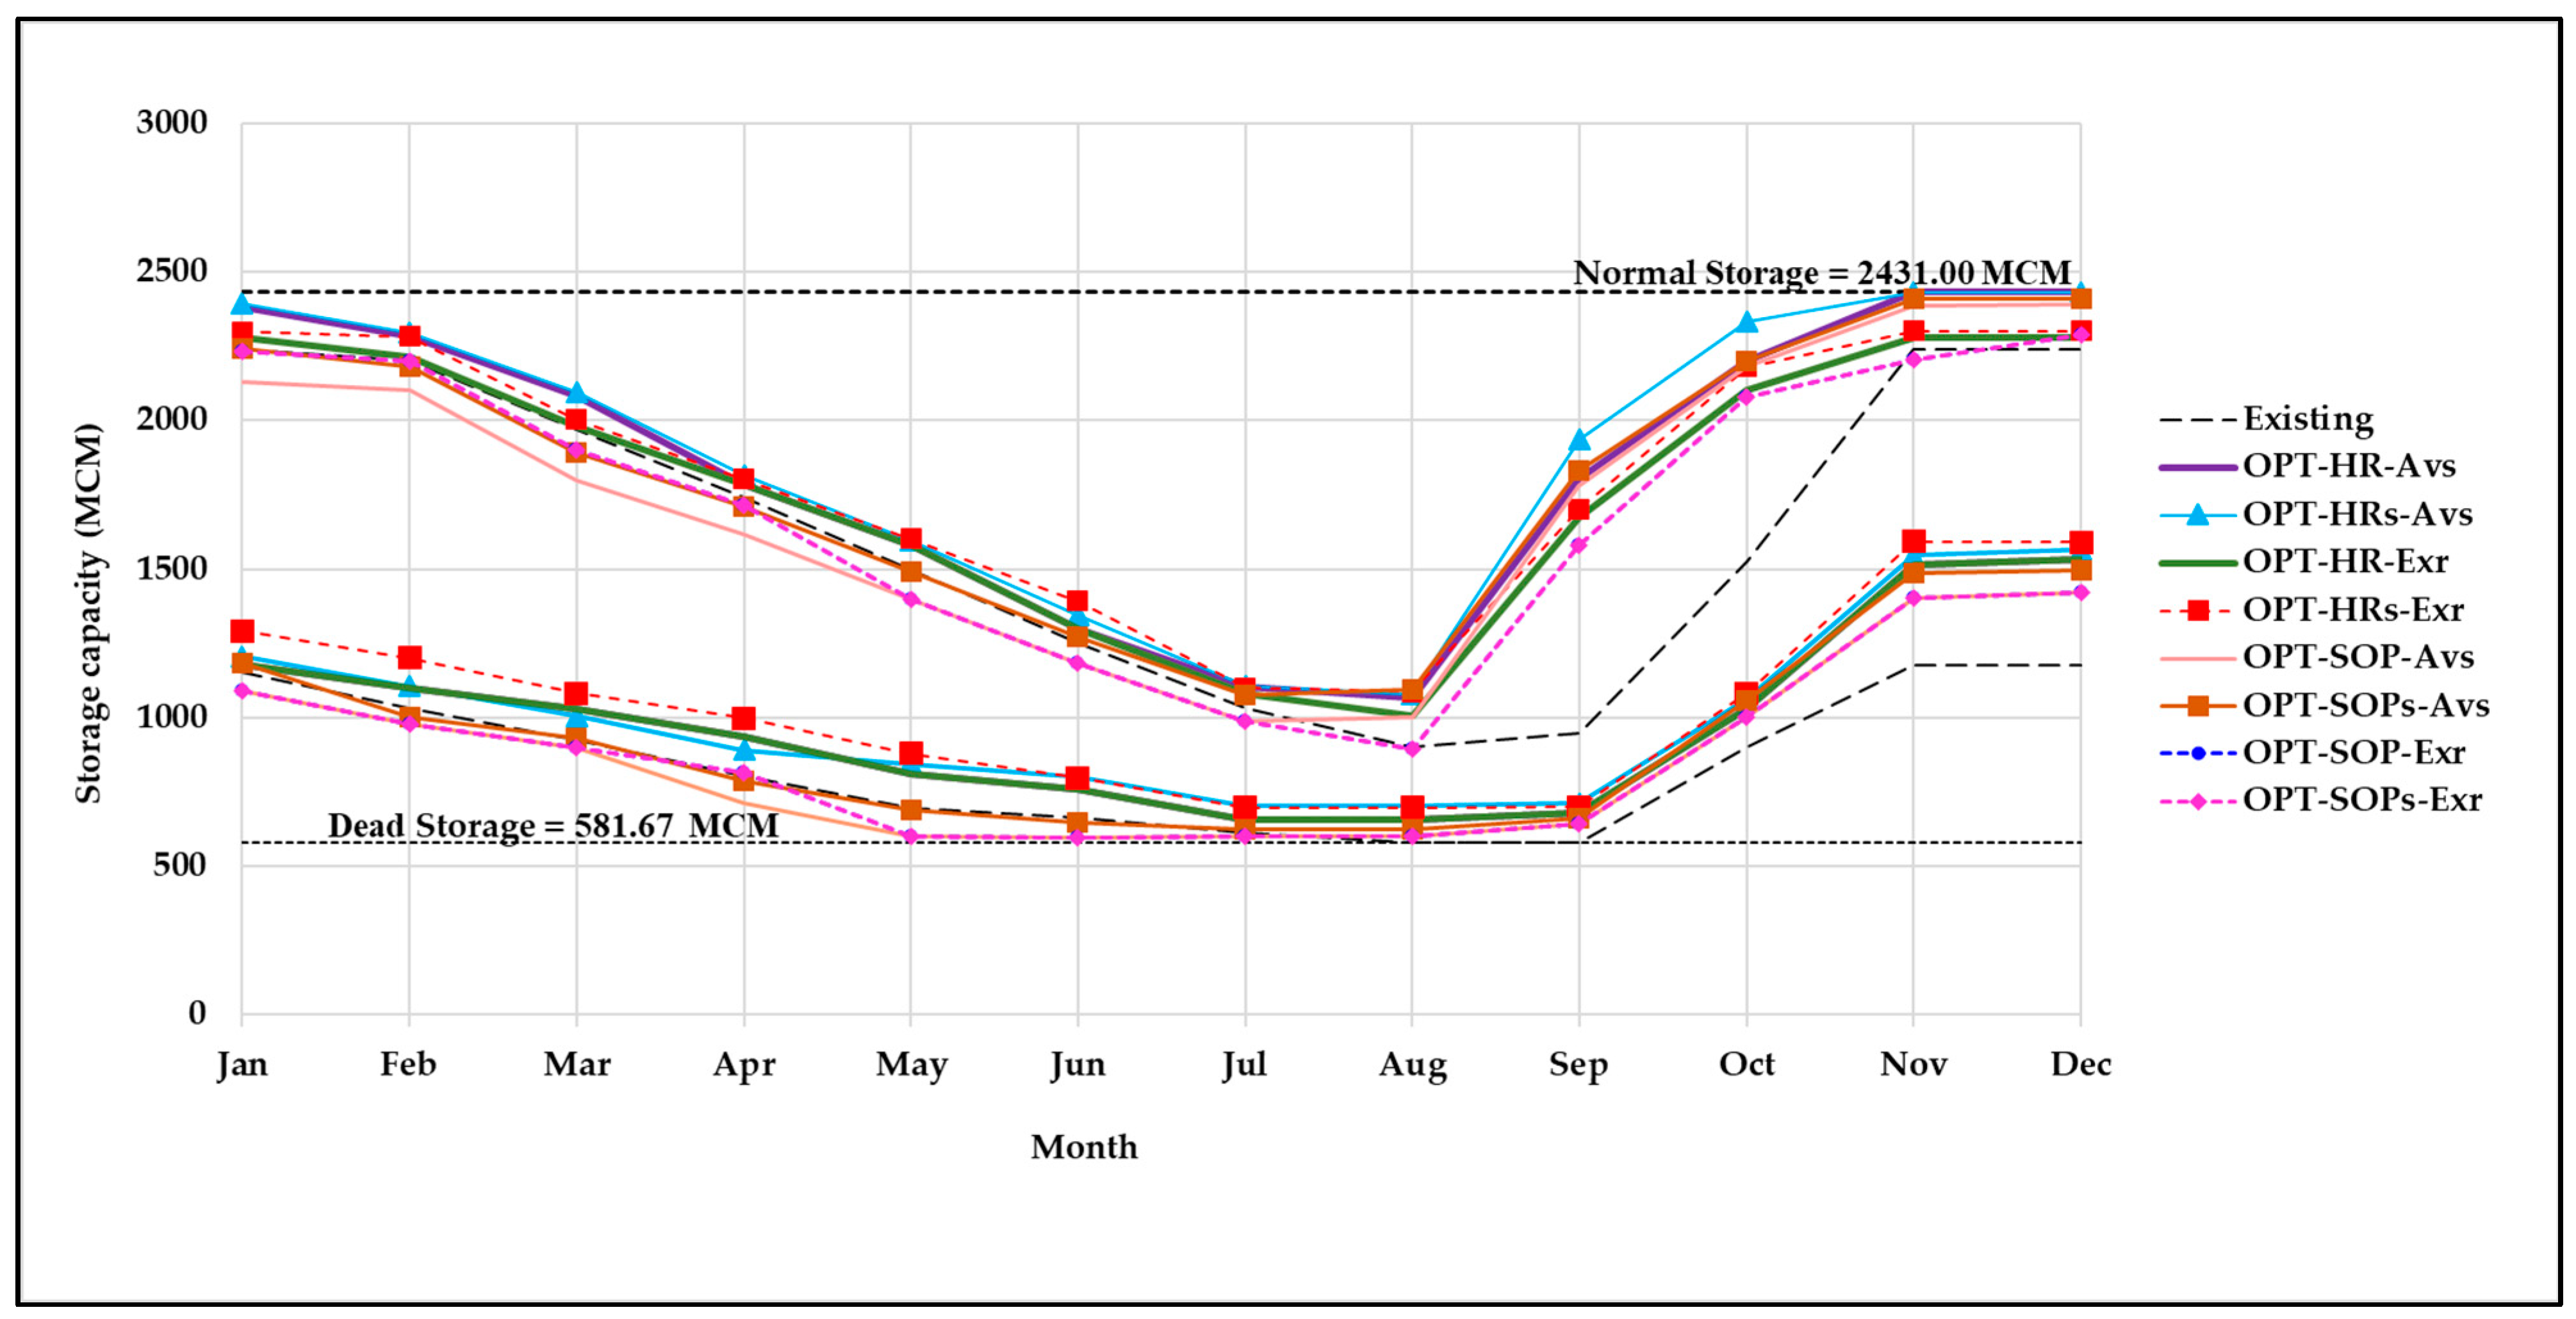
It was found that the patterns of the new rule curves from the optimization techniques and the exiting rule curves were similar because of the seasonal inflow effect and the same conditions as expressed in Figure 9. Furthermore, the optimal obtained rule curves of all the optimization techniques were also similar, because all the techniques provided near-optimum values. For this reason, Figure 9 shows only an example of the results using just one technique. This indicates that the most appropriate decision option was proposed for dealing with water shortage and excess water situations. As shown in the details in Figure 10, there were four scenarios that might satisfy decision makers’ requirements for reservoir management using the obtained rule curves from the HR and SOP criteria. The objective functions of the minimal average water shortage per year, minimal of the maximum water shortage, minimal average excess water per year, and minimal of the maximum excess water per year were applied to find the optimal rule curves for each scenario. Eight different choices were obtained for each scenario. There are 32 different choices for all four scenarios. Then, these alternative choices were evaluated following the conditions of each scenario. The most suitable choice was selected from each scenario. This was an example of a set of responses for one optimization technique.

3.2. The Suitable Alternative Engineering Choices

3.2.1. Scenario of Normal Water Scarcity Situation

The efficiency of alternative engineering choices for situations of normal water scarcity was evaluated by reservoir simulation considering the historic inflow over 52 years using optimal rule curves from optimization techniques considering the sedimentation from the HR and SOP criteria. A situation of water shortage for the normal water scenario is presented in Figure 11. It can be seen that the alternative engineering choices in situations of the optimal rule curves considering sedimentation and using HR criteria with the objective function of the minimal average (OPT-HRs-Avs) provided the least average shortage of 95.558 MCM/year. Therefore, the suitable engineering choice for the normal water scarcity situation is using optimization techniques considering sedimentation under HR with an objective function search of the average water shortage per year. This implies that the HR criteria have limited control over water release in order to save water to alleviate the water deficit during the next dry season [20,21,22,23]. However, the SOP criteria controls the release of water to meet the target demand for all considered duration times, according to previous studies [16,17]. Hence, the SOP criteria are less suitable than the HR criteria for reservoirs with a high frequency of drought problems.

3.2.2. Scenario of the High Water Shortage Situation

The efficiency of the alternative engineering choices for situations of high water shortage is presented in Figure 12. In addition, the alternative engineering choice situations of the optimal rule curves considering sedimentation and using HR criteria with the objective function of the minimal average (OPT-HRs-Avs) provided a least maximum water shortage of 693.000 MCM/year. For this reason, the suitable engineering choice for a crisis scarcity situation is using optimization techniques that consider sedimentation under HR with an objective function search of the average water shortage per year. This means that the HR criterion attempts to store water by reducing its release during the dry season when the reservoir storage capacity is sufficient to meet the water demand. Hence, the SOP criteria are less suitable than the HR criteria for reservoirs with a high water shortage situation associated with drought problems [20,21,22,23].

3.2.3. Scenario of Normal Excess Water Situation

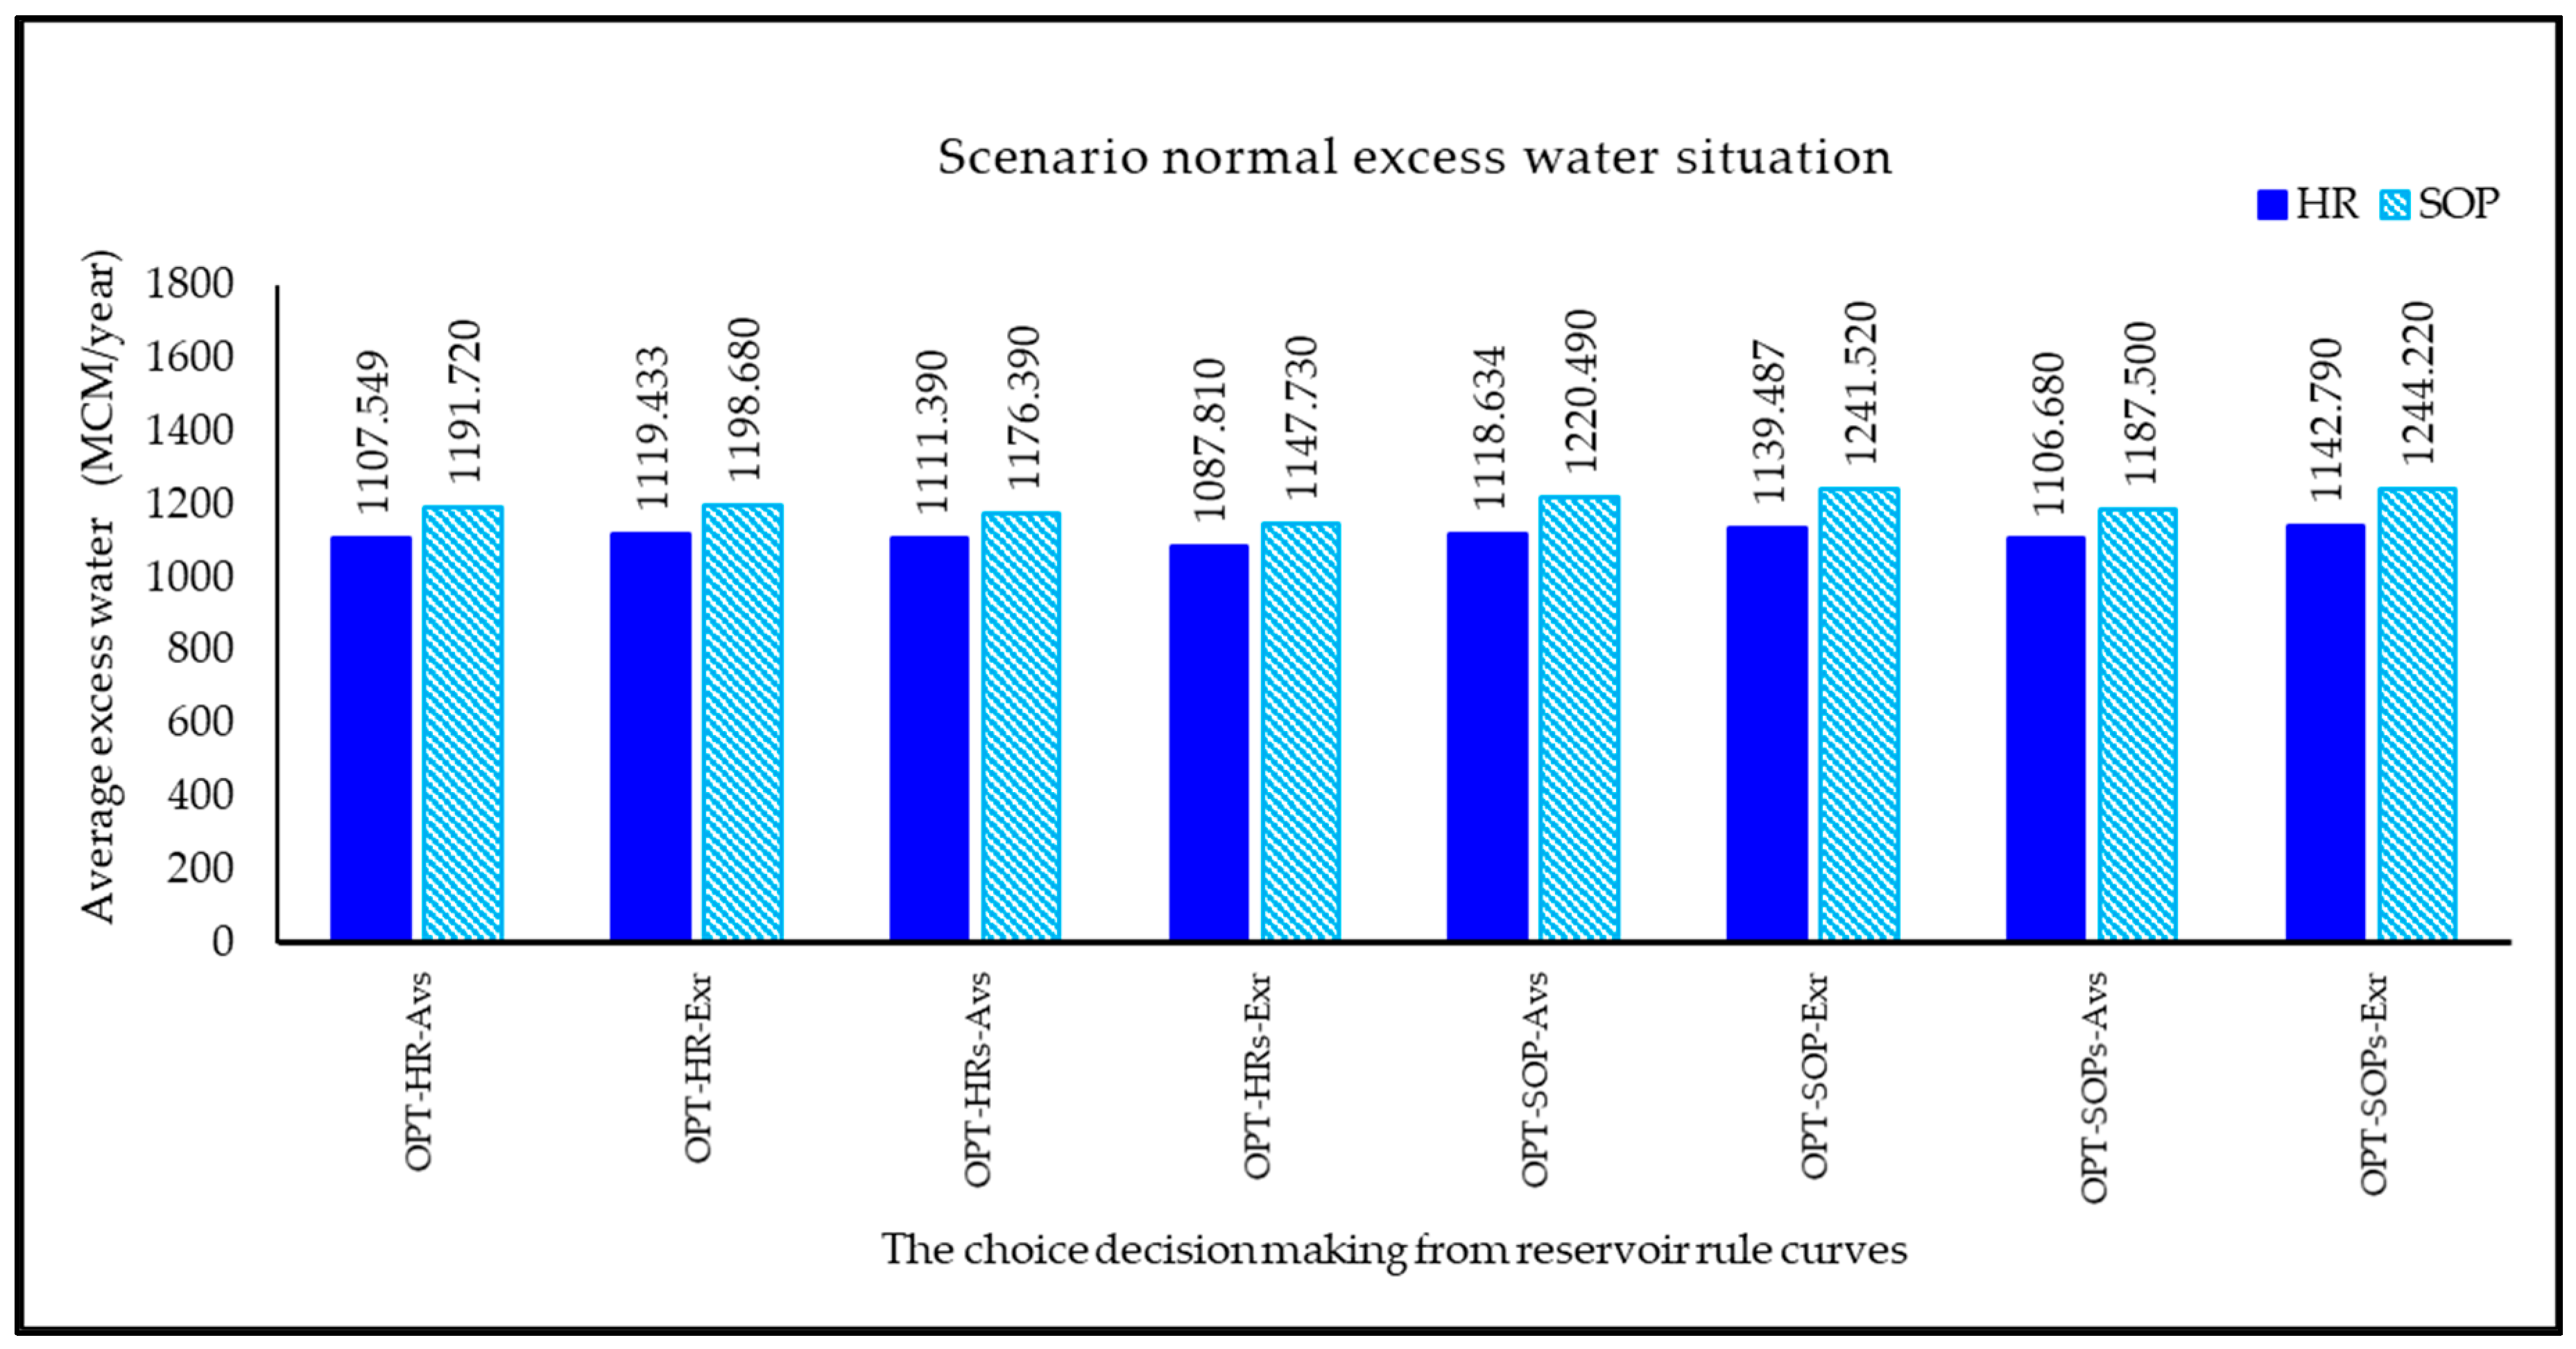
Figure 13 shows the situation of excess water for the normal excess water scenario. It indicates that the circumstances of excess water of the optimal rule curves from optimization techniques linked with a reservoir simulation model considering sedimentation and using HR criteria with the objective function of the minimal average excess water per year (OPT-HRs-Exr) provided the least average excess water of 1087.810 MCM/year. It can be concluded that optimization techniques linked with a reservoir simulation model considering sedimentation and using HR can be used to provide alternative engineering choices effectively in the normal excess water scenario.

3.2.4. Scenario of High Excess Water Situation

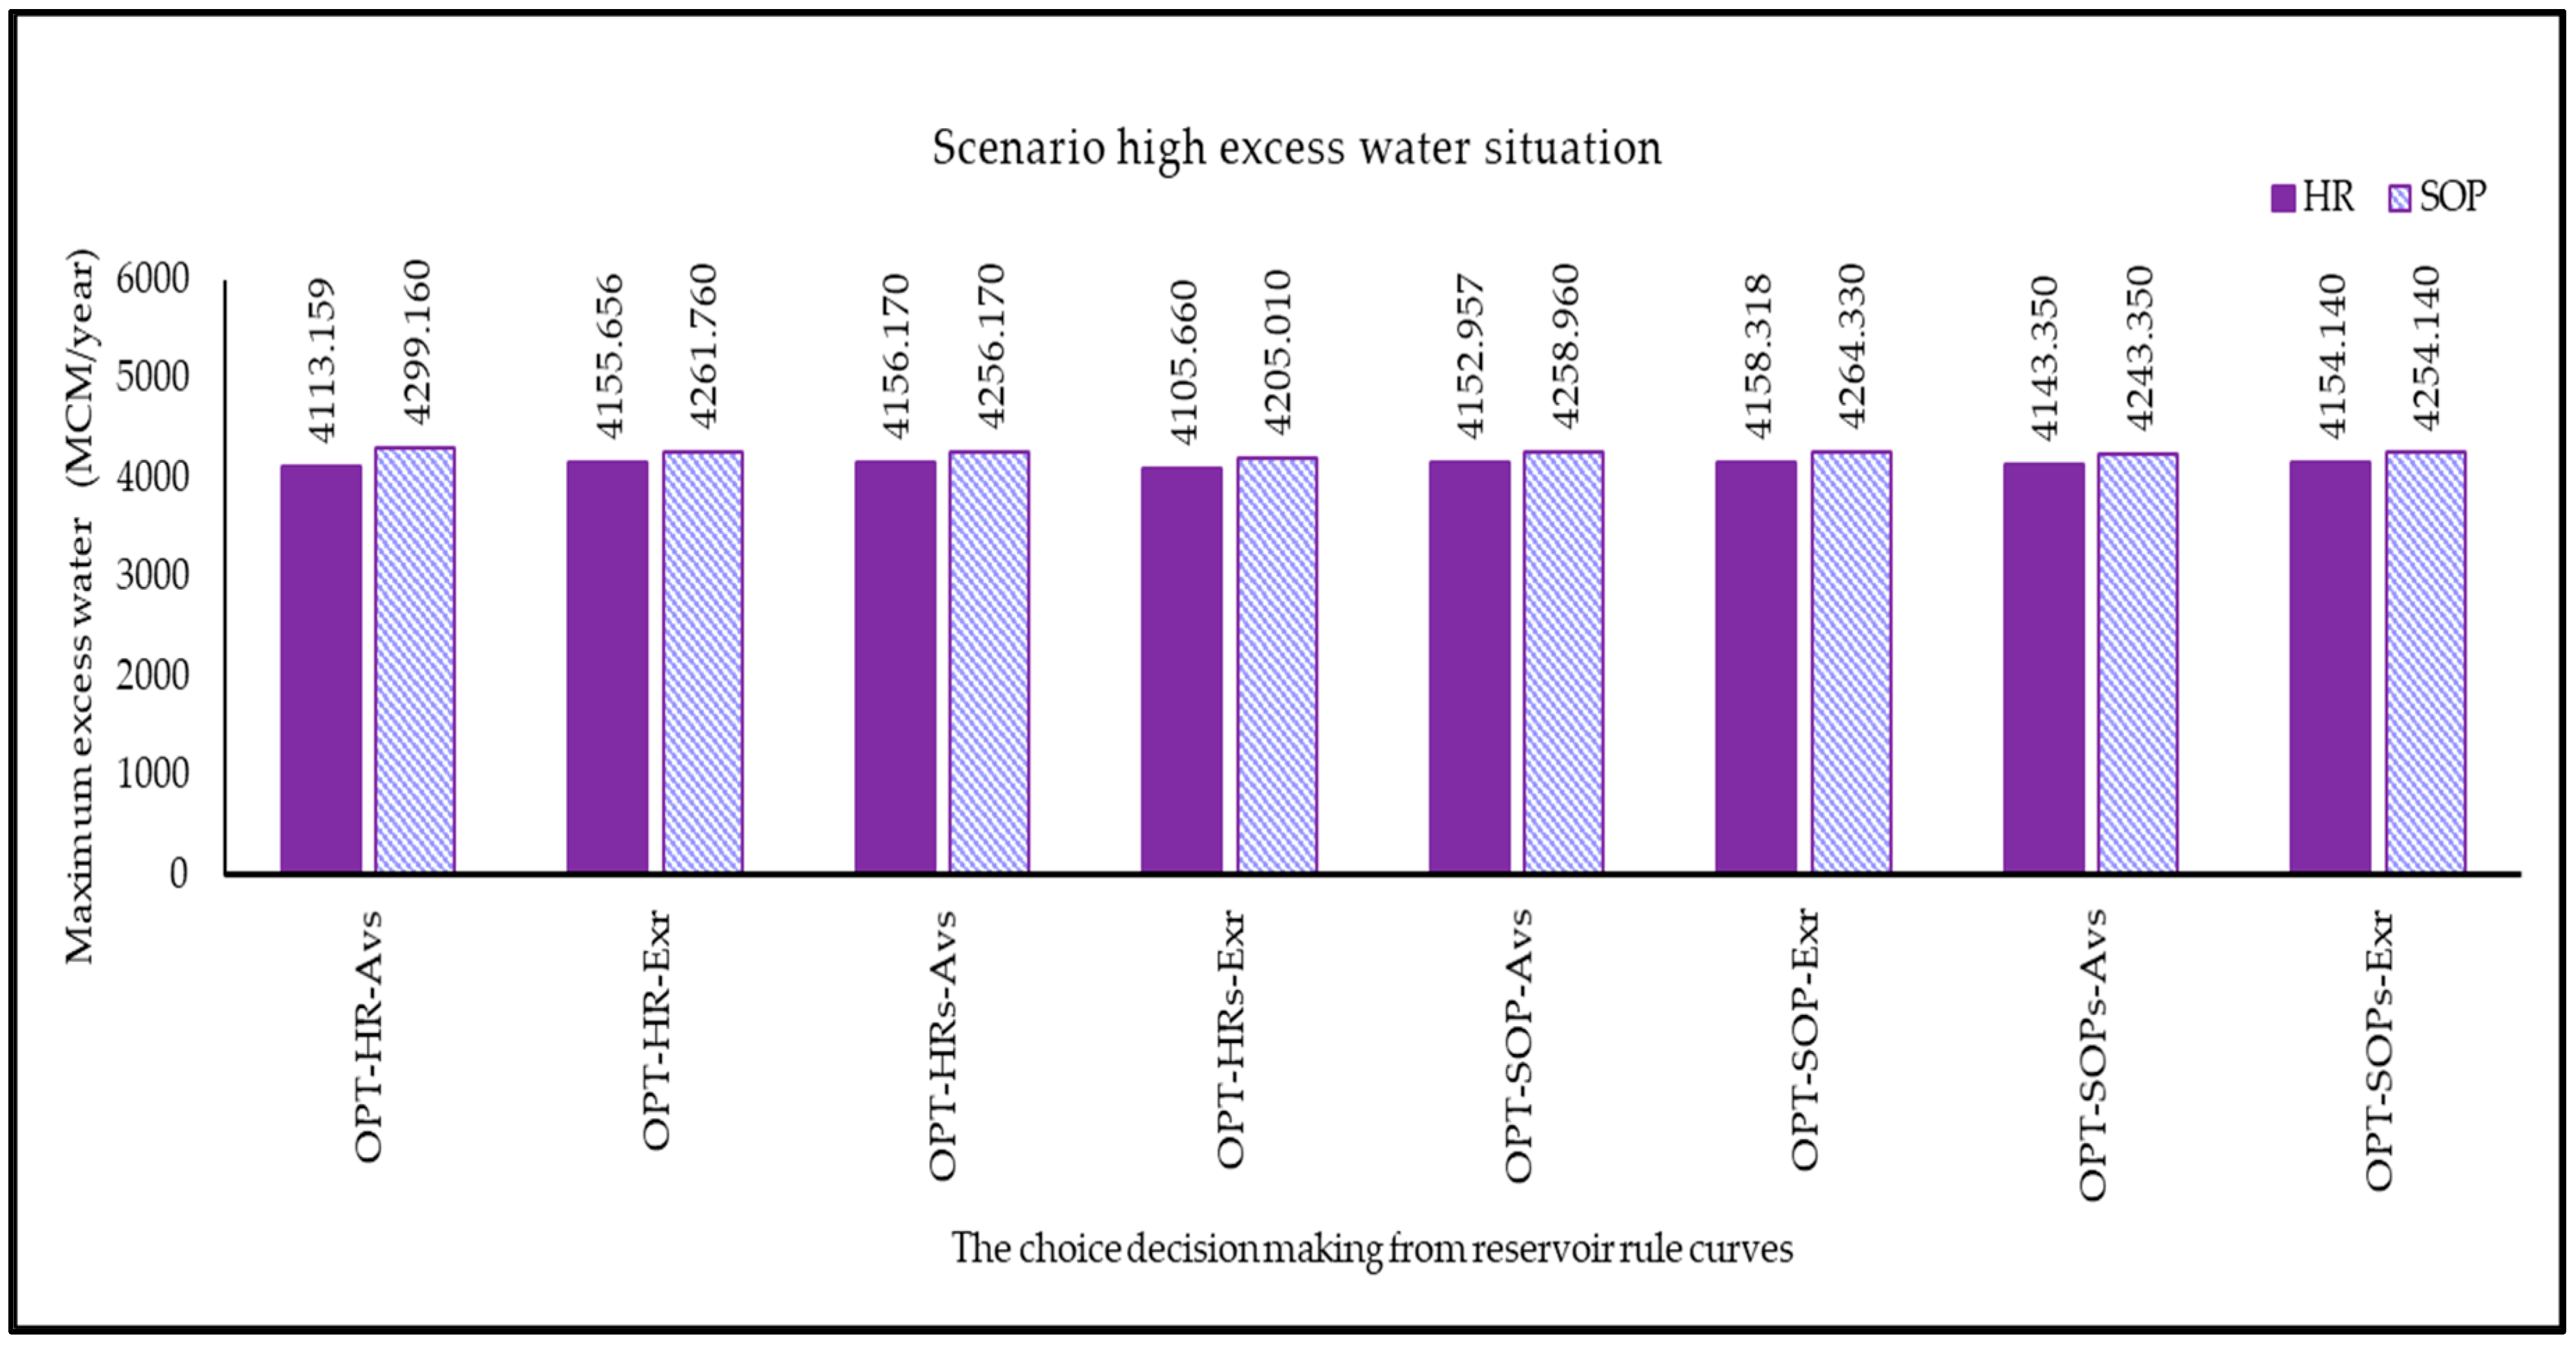
The efficiency of alternatives engineering choices for the high water excess scenario is shown in Figure 14. The results indicate that the circumstances of excess water when using optimal rule curves from optimization techniques linked with the reservoir simulation model considering HR and sedimentation with the objective function of the minimal average excess water per year (OPT-HRs-Exr) provided the least maximum excess water of 4105.660 MCM/year. The results also showed that, when the HR water discharge criteria were applied to identify the rule curves in conjunction with the appropriate goal function, the severe peak overflow could be reduced. It could also be shown that both the water discharge requirements could be set when the reservoir was suffering significant overflow. When the rule curves created by the HR threshold are used in conjunction with the HR criteria, the reservoir operation using the rule curves becomes more efficient and manageable.
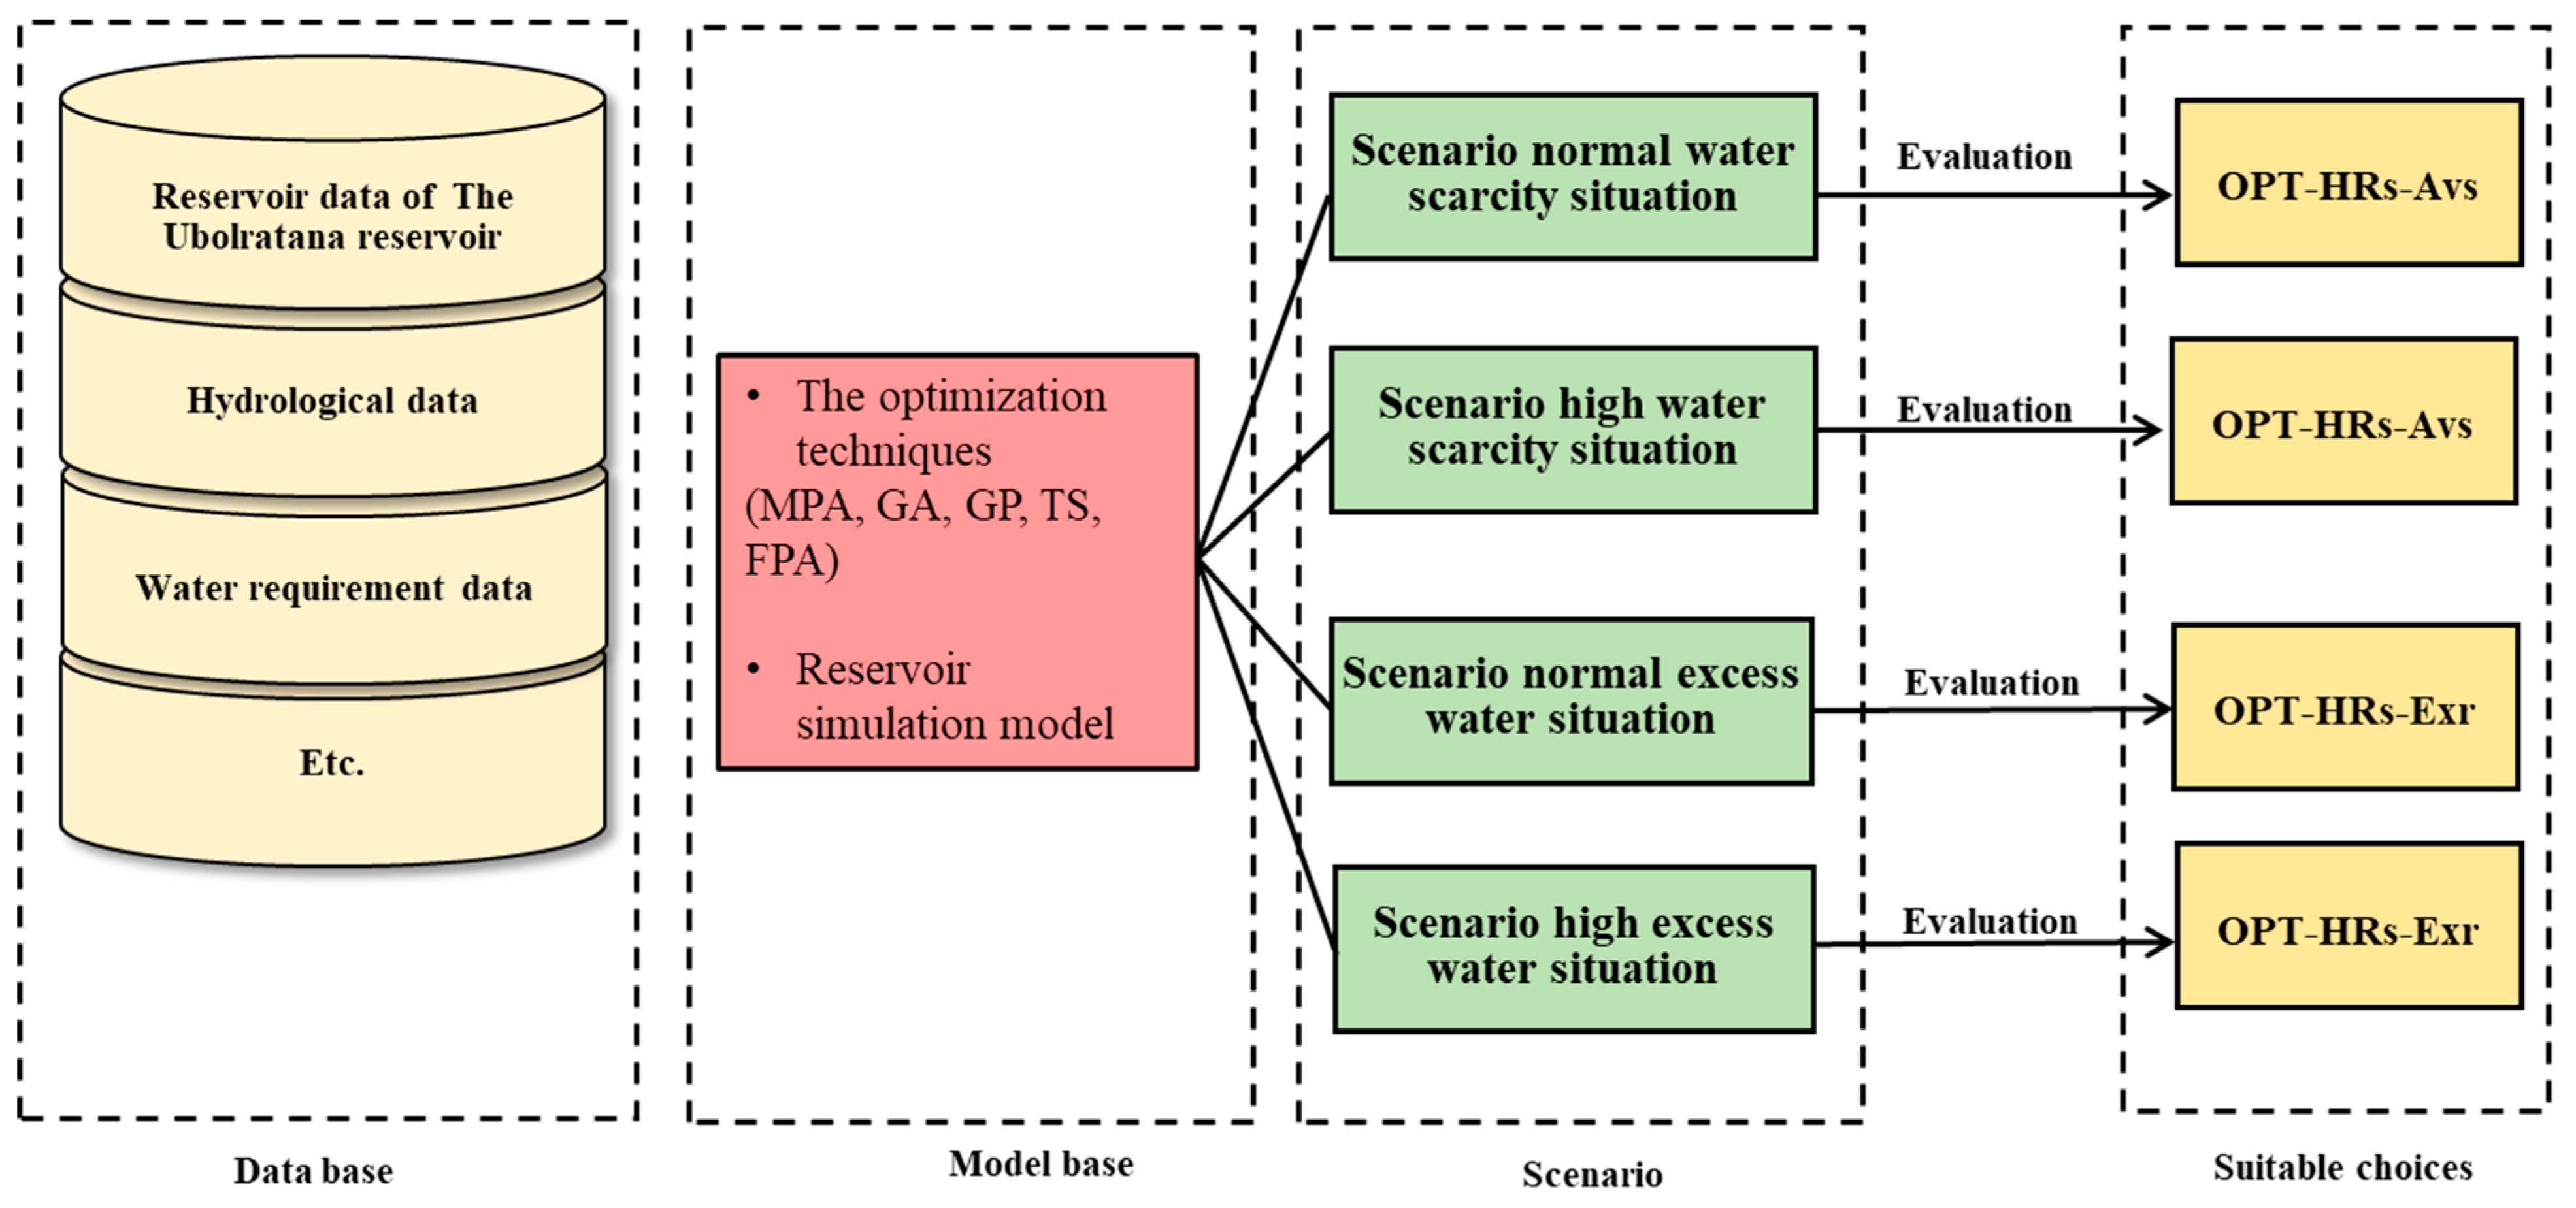
As shown in Figure 11, Figure 12, Figure 13 and Figure 14, it can be concluded that the suitable engineering choice for the normal water scarcity and the high water scarcity scenarios was using the optimal rule curves from the optimization techniques linked with a reservoir simulation model considering sedimentation under HR with an objective function search of the average water shortage per year (OPT-HRs-Exr). The most suitable alternative engineering choice for the normal excess water and high excess water scenarios was using the optimal rule curves from the optimization techniques linked with the reservoir simulation model considering sedimentation and considering HR criteria with the objective function of the minimal average excess water per year (OPT-HRs-Exr). These suitable choices are schematically presented in Figure 15.

4. Conclusions

The purpose of this research was to create alternative engineering choices for supporting decision-making systems in river basin management. The alternative engineering choices were created from different situations applying optimization techniques with a reservoir simulation model considering both the hedging rule (HR) and standard operating policy (SOP) criteria, as well as considering the amount of sedimentation in the reservoir. The optimization techniques of the marine predator algorithm (MPA), genetic algorithm (GA), genetic programming (GP), tabu search (TS), and flower pollination algorithm (FPA) were applied to link with the reservoir simulation model. The results found that the optimal rule curves of all the optimization techniques under the same conditions were similar. Therefore, these optimal rule curves were used to evaluate only one set of the obtained rule curves.
The results indicated that the newly obtained rule curves using the HR criteria could alleviate water scarcity and overflow situations better than the obtained rule curves with water release criteria SOP in terms of the decrease in the average amount of water shortage, average excess water, the highest water, and the maximum excess water. Consequently, the different engineering choices of 32 options were created from four situations (normal water scarcity situation, high water scarcity situation, normal excess water situation, and high excess water situation). The suitable engineering choice for the normal water scarcity and the high water scarcity scenarios was using the optimal rule curves from the optimization techniques linked with the reservoir simulation model considering sedimentation under HR with an objective function search of the average water shortage per year. The suitable alternative engineering choice for the normal excess water and high excess water scenarios was using the optimal rule curves from the optimization techniques linked with the reservoir simulation model considering sedimentation and considering HR criteria with the objective function of the minimal average excess water per year. These alternative choices were evaluated for use in the decision support system of water resources management within the river basin. The optimal choices were accepted for use in planning and setting policies, as well as solving critical situations. Therefore, it can be concluded that the creation of engineering alternatives is an important tool in the decision support system of water resource management. Reservoir management will help support appropriate choices and increase efficiency in decision-making for various situations that arise to effectively alleviate drought or flooding, as well as according to the context and management policy of the reservoir. Future studies on alternative decision-making approaches should focus on the strategic planning and operation of reservoirs in the basin. This is important to ensure the sustainable and efficient use of water resources. These studies should also consider various factors that affect reservoir management, such as predicting future runoff, water consumption, water quality, economics, society, stakeholder participation, and legal and regulatory frameworks. These factors are interconnected and require continuous monitoring, analysis, and adaptive management strategies. The goal is to ensure that alternative decision-making approaches for reservoir management in the basin are both sustainable and efficient.

Author Contributions

Conceptualization, R.N., R.T., S.K., R.H., H.P., O.S. and A.K.; methodology, R.N., R.T., S.K., R.H., H.P., O.S. and A.K.; validation, R.N., R.T. and A.K.; formal analysis, R.N., R.T. and A.K.; investigation, R.N., R.T. and A.K.; writing—original draft preparation, R.N., R.T. and A.K.; supervision, R.N., R.T. and A.K.; and writing—review and editing, R.N., R.T. and A.K. All authors have read and agreed to the published version of the manuscript.

Funding

This research was financially supported by Mahasarakham University.

Data Availability Statement

The data used to support the findings of this study are available from the corresponding author upon request.

Acknowledgments

The author would like to appreciate Mahasarakham University for supporting tools and research unit.

Conflicts of Interest

The authors declare that there are no conflicts of interest regarding the publication of this paper.

References

  1. Unnisa, Z.; Govind, A.; Lasserre, B.; Marchetti, M. Water Balance Trends along Climatic Variations in the Mediterranean Basin over the Past Decades. Water 2023, 15, 1889. [Google Scholar] [CrossRef]
  2. Sambou, M.H.A.; Liersch, S.; Koch, H.; Vissin, E.W.; Albergel, J.; Sane, M.L. Synergies and Trade-Offs in Water Resources Management in the Bafing Watershed under Climate Change. Water 2023, 15, 2067. [Google Scholar] [CrossRef]
  3. Kangrang, A.; Prasanchum, H.; Hormwichian, H.; Ngamsert, R.; Techarungruengsakul, R.; Phookinghin, N. Improvement of Water Management Project by Correcting Irrigation Water Requirement in Farmer Participation and Optimization. Bulg. J. Agric. Sci. 2019, 25, 852–863. [Google Scholar]
  4. Li, L.; Yang, Y.; Cui, T.; Li, R.; Zheng, H. Land Use, Climate, and Socioeconomic Factors Determine the Variation in Hydrologic-Related Ecosystem Services in the Ecological Conservation Zone, Beijing, China. Water 2023, 15, 2022. [Google Scholar] [CrossRef]
  5. Aliyari, H.; Kholghi, M.; Zahedi, S.; Momeni, M. Providing Decision Support System in Groundwater Resources Management for the Purpose of Sustainable Development. J. Water Supply Res. Technol. Aqua 2018, 67, 423–437. [Google Scholar] [CrossRef]
  6. Amorim, S.; Bezerra, J.M.B.; Marques, S.d.T.M.; Silva, M.M. Multicriteria Decision Support for Selection of Alternatives Directed to Integrated Urban Water Management. Water Resour. Manag. 2020, 34, 4253–4269. [Google Scholar] [CrossRef]
  7. Shahryar, K.A.; Faisal, H. A Web-Based Decision Support System for Smart Dam Operations Using Weather Forecasts. J. Hydroinform. 2019, 21, 687–707. [Google Scholar]
  8. Kojiri, T.; Hamaguchi, T.; Ode, M. Assessment of Global Warming Impacts on Water Resources and Ecology of a River Basin in Japan. J. Hydro-Environ. Res. 2008, 1, 164–175. [Google Scholar] [CrossRef]
  9. Guo, Y.; Huang, S.; Huang, Q.; Wang, H.; Fang, W.; Yang, Y.; Wang, L. Assessing Socioeconomic Drought Based on an Improved Multivariate Standardized Reliability and Resilience Index. J. Hydrol. 2019, 568, 904–918. [Google Scholar] [CrossRef]
  10. Mehran, A.; Mazdiyasni, O.; AghaKouchak, A. A Hybrid Framework for Assessing Socioeconomic Drought: Linking Climate Variability, Local Resilience, and Demand. J. Geophys. Res. Atmos. 2015, 120, 7520–7533. [Google Scholar] [CrossRef]
  11. Zhou, Y.; Guo, S. Incorporating Ecological Requirement into Multipurpose Reservoir Operating Rule Curves for Adaptation to Climate Change. J. Hydrol. 2013, 498, 153–164. [Google Scholar] [CrossRef] [Green Version]
  12. Zhao, G.; Gao, H.; Naz, B.S.; Kao, S.C.; Voisin, N. Integrating a Reservoir Regulation Scheme into a Spatially Distributed Hydrological Model. Adv. Water Resour. 2016, 98, 16–31. [Google Scholar] [CrossRef] [Green Version]
  13. Daus, M.; Koberger, K.; Koca, K.; Beckers, F.; Encinas Fernández, J.; Weisbrod, B.; Dietrich, D.; Gerbersdorf, S.U.; Glaser, R.; Haun, S.; et al. Interdisciplinary Reservoir Management—A Tool for Sustainable Water Resources Management. Sustainability 2021, 13, 4498. [Google Scholar] [CrossRef]
  14. Zhu, Y.; Lin, Z.; Wang, J.; Zhao, Y.; He, F. Impacts of Climate Changes on Water Resources in Yellow River Basin, China. Procedia Eng. 2016, 154, 687–695. [Google Scholar] [CrossRef] [Green Version]
  15. Mensik, P.; Marton, D. Hybrid Optimization Method for Strategic Control of Water Withdrawal from Water Reservoir with Using Support Vector Machines. Procedia Eng. 2017, 186, 491–498. [Google Scholar] [CrossRef]
  16. Chaleeraktrakoon, C.; Kangrang, A. Dynamic Programming with the Principle of Progressive Optimality for Searching Rule Curves. Can. J. Civ. Eng. 2007, 34, 170–176. [Google Scholar] [CrossRef]
  17. Chiamsathit, C.; Adeloye, A.J.; Soundharajan, B.S. Assessing Competing Policies at Ubonratana Reservoir, Thailand. Proc. Inst. Civ. Eng. Water Manag. 2014, 167, 551–560. [Google Scholar] [CrossRef]
  18. Zhao, T.; Zhao, J. Optimizing Operation of Water Supply Reservoir: The Role of Constraints. Math. Probl. Eng. 2014, 2014, 853186. [Google Scholar] [CrossRef] [Green Version]
  19. Heydari, M.; Othman, F.; Qaderi, K. Developing Optimal Reservoir Operation for Multiple and Multipurpose Reservoirs Using Mathematical Programming. Math. Probl. Eng. 2015, 2015, 435752. [Google Scholar] [CrossRef] [Green Version]
  20. Sasireka, K.; Neelakantan, T.R. Optimization of Hedging Rules for Hydropower Reservoir Operation. Sci. Iran. 2017, 24, 2242–2252. [Google Scholar] [CrossRef] [Green Version]
  21. Liu, Y.; Zhao, J.; Zheng, H. Piecewise-Linear Hedging Rules for Reservoir Operation with Economic and Ecologic Objectives. Water 2018, 10, 865. [Google Scholar] [CrossRef] [Green Version]
  22. Jamshidi, J.; Shourian, M. Hedging Rules-Based Optimal Reservoir Operation Using Bat Algorithm. Water Resour. Manag. 2019, 33, 4525–4538. [Google Scholar] [CrossRef]
  23. Men, B.; Wu, Z.; Li, Y.; Liu, H. Reservoir Operation Policy Based on Joint Hedging Rules. Water 2019, 11, 419. [Google Scholar] [CrossRef] [Green Version]
  24. Li, Z.; Huang, B.; Yang, Z.; Qiu, J.; Zhao, B.; Cai, Y. Mitigating Drought Conditions under Climate and Land Use Changes by Applying Hedging Rules for the Multi-Reservoir System. Water 2021, 13, 21. [Google Scholar] [CrossRef]
  25. Pessenlehner, S.; Liedermann, M.; Holzapfel, P.; Skrame, K.; Habersack, H.; Hauer, C. Evaluation of Hydropower Projects in Balkan Rivers Based on Direct Sediment Transport Measurements: Challenges, Limits, and Possible Data Interpretation—Case Study Vjosa River/Albania. River Res. Appl. 2022, 38, 1014–1030. [Google Scholar] [CrossRef]
  26. Mat Desa, S.; Jamal, M.H.; Mohd, M.S.F.; Samion, M.K.H.; Rahim, N.S.; Muda, R.S.; Sa’ari, R.; Kasiman, E.H.; Mustaffar, M.; Ishak, D.S.M.; et al. Numerical Modelling on Physical Model of Ringlet Reservoir, Cameron Highland, Malaysia: How Flow Conditions Affect the Hydrodynamics. Water 2023, 15, 1883. [Google Scholar] [CrossRef]
  27. Imanshoar, F.; Jahangirzadeh, A.; Basser, H.; Akib, S.; Kamali, B.; Tabatabaei, M.R.; Kakouei, M. Reservoir Sedimentation Based on Uncertainty Analysis. Abstr. Appl. Anal. 2014, 2014, 367627. [Google Scholar] [CrossRef] [Green Version]
  28. Viseras, C.; Fernández, J.; García-García, F.; Soria, J.M.; Calvache, M.L.; Jáuregui, P. Dynamics of Sedimentary Environments in the Accelerated Siltation of a Reservoir: The Case of Alhama de Granada, Southern Spain. Environ. Geol. 2009, 56, 1353–1369. [Google Scholar] [CrossRef]
  29. Weiming, W.; Wang, S.Y.; Yafei, J. Nonuniform Sediment Transport in Alluvial Rivers. J. Hydraul. Res. 2000, 38, 427–434. [Google Scholar]
  30. Ahmed, K.B.; Sanchez, M. A Study of the Factors and Processes Involved in the Sedimentation of Tarbela Reservoir, Pakistan. Environ. Earth Sci. 2011, 62, 927–933. [Google Scholar] [CrossRef]
  31. Chao, Y.C.; Hsieh, T.-C.; Chen, C.-W.; Cheng, C.-T.; Li, H.-C.; Yeh, K.-C.; Chen, Y.-M. Impact Assessment of Reservoir Desiltation Measures for Downstream Riverbed Migration in Climate Change: A Case Study in Northern Taiwan. J. Hydro-Environ. Res. 2021, 37, 67–81. [Google Scholar] [CrossRef]
  32. Iradukunda, P.; Nyadawa, M.O. Impact of Sedimentation on Water Seepage Capacity in Lake Nakuru, Kenya. Appl. Environ. Soil Sci. 2021, 2021, 8889189. [Google Scholar] [CrossRef]
  33. Jain, S.K.; Goel, M.K.; Agarwal, P.K. Reservoir Operation Studies of Sabarmati System, India. J. Water Resour. Plan. Manag. 1998, 124, 31–37. [Google Scholar] [CrossRef]
  34. Chaleeraktrakoon, C.; Chinsomboon, Y. Dynamic Rule Curves for Flood Control of a Multipurpose Dam. J. Hydro-Environ. Res. 2015, 9, 133–144. [Google Scholar] [CrossRef]
  35. Chaleeraktrakoon, C.; Worawiwat, A. Dynamic Rule Curves for Multipurpose Reservoir Operation for Different Floods. J. Water Clim. Chang. 2020, 11, 1001–1008. [Google Scholar] [CrossRef]
  36. Tayebiyan, A.; Mohammed Ali, T.A.; Ghazali, A.H.; Malek, M.A. Optimization of Exclusive Release Policies for Hydropower Reservoir Operation by Using Genetic Algorithm. Water Resour. Manag. 2016, 30, 1203–1216. [Google Scholar] [CrossRef]
  37. Ngoc, T.A.; Hiramatsu, K.; Harada, M. Optimizing the Rule Curves of Multi-Use Reservoir Operation Using a Genetic Algorithm with a Penalty Strategy. Paddy Water Environ. 2014, 12, 125–137. [Google Scholar] [CrossRef]
  38. Ashofteh, P.S.; Bozorg Haddad, O.; Akbari-Alashti, H.; Mariño, M.A. Determination of Irrigation Allocation Policy under Climate Change by Genetic Programming. J. Hydrol. Eng. 2014, 141, 04014059. [Google Scholar] [CrossRef] [Green Version]
  39. Moeini, R.; Nasiri, K. Hybridizing ANN-NSGA-II Model with Genetic Programming Method for Reservoir Operation Rule Curve Determination (Case Study Zayandehroud Dam Reservoir). Soft Comput. 2021, 25, 14081–14108. [Google Scholar] [CrossRef]
  40. Thongwan, T.; Kangrang, A.; Prasanchum, H. Multi-Objective Future Rule Curves Using Conditional Tabu Search Algorithm and Conditional Genetic Algorithm for Reservoir Operation. Heliyon 2019, 5, e02401. [Google Scholar] [CrossRef]
  41. Techarungruengsakul, R.; Kangrang, A. Application of Harris Hawks Optimization with Reservoir Simulation Model Considering Hedging Rule for Network Reservoir System. Sustainability 2022, 14, 4913. [Google Scholar] [CrossRef]
  42. Kangrang, A.; Techarungruengsakul, R.; Hormwichian, R.; Sriwanpheng, O. Alternative Approach of Wind Driven Optimization for Flood Control Rule Curves. J. Eng. Appl. Sci. 2019, 14, 8026–8033. [Google Scholar] [CrossRef] [Green Version]
  43. Kangrang, A.; Srikamol, N.; Hormwichia, R.; Prasanchum, H.; Sriwanphen, O. Alternative Approach of Firefly Algorithm for Flood Control Rule Curves. Asian J. Sci. Res. 2019, 12, 431–439. [Google Scholar] [CrossRef]
  44. Abdel-Basset, M.; Mohamed, R.; Saber, S.; Askar, S.S.; Abouhawwash, M. Modified Flower Pollination Algorithm for Global Optimization. Mathematics 2021, 9, 1661. [Google Scholar] [CrossRef]
  45. Bozorg-Haddad, O.; Azad, M.; Fallah-Mehdipour, E.; Delpasand, M.; Chu, X. Verification of FPA and PSO Algorithms for Rule Curve Extraction and Optimization of Single- and Multi-Reservoir Systems’ Operations Considering Their Specific Purposes. Water Sci. Technol. Water Supply 2021, 21, 166–188. [Google Scholar] [CrossRef]
  46. Sinthuchai, N.; Kangrang, A. Improvement of Reservoir Rule Curves using Grey Wolf Optimizer. J. Eng. Appl. Sci. 2019, 14, 9847–9856. [Google Scholar] [CrossRef] [Green Version]
  47. Ngamsert, R.; Kangrang, A. Applying of Marine Predators Algorithm Linked with Reservoir Simulation Model Considering Sedimentation for Reservoir Operation. Adv. Civ. Eng. 2020, 2022, 1631914. [Google Scholar] [CrossRef]
  48. Bertani, R.; Negulescu, C.; Fuchs, S. A Review of Risk and Vulnerability Assessment Frameworks for Natural Hazards and Their Applicability to Urban Water Systems. Nat. Hazards 2022, 110, 677–699. [Google Scholar]
  49. Smith, J.A.; Johnson, L.K.; Anderson, R.M. Water Scarcity Impacts on Agricultural Productivity: A Review. Agric. Water Manag. 2022, 267, 107948. [Google Scholar]
  50. Phumiphan, A.; Kangrang, A. Development of Decision-Making Support Tools for Future Reservoir Management Under Climate and Land Cover Variability: A Case Study. Int. Rev. Civ. Eng. (IRECE) 2021, 12, 271. [Google Scholar] [CrossRef]
  51. Pagano, A.; Giordano, R.; Vurro, M. A Decision Support System Based on AHP for Ranking Strategies to Manage Emergencies on Drinking Water Supply Systems. Water Resour. Manag. 2021, 35, 613–628. [Google Scholar] [CrossRef]
  52. Zamani, A.A.; Abbasi, H.R.; Alipour, V.; Peyravi, M.; Shojaei, P.; Goli, A.; Mohammadinia, L. Alternative Water Resources Selection to Supply Drinking Water in Flood Disasters by Multicriteria Decision-Making Techniques (DANP and VIKOR). J. Environ. Public Health 2022, 2022, 5445786. [Google Scholar] [CrossRef] [PubMed]
  53. Techarungruengsakul, R.; Ngamsert, R.; Thongwan, T.; Hormwichian, R.; Kuntiyawichai, K.; Ashrafi, S.M.; Kangrang, A. Optimal Choices in Decision Supporting System for Network Reservoir Operation. Water 2022, 14, 4090. [Google Scholar] [CrossRef]
  54. Philin, K. Evaluation Water Indices for Estimation Capacity of Ubolratana Reservoir Using Remote Sensing. Master’s Thesis, Mahasarakham University, Kham Riang, Thailand, 2021; pp. 25–35. [Google Scholar]
Figure 1. The location and schematic diagram of Ubolratana Reservoir.
Water 15 02510 g001
Figure 2. Conceptual model of DSS for the river basin.
Water 15 02510 g002
Figure 3. The yearly historic inflows into Ubolratana Reservoir.
Water 15 02510 g003
Figure 4. Downstream water demands from Ubolratana Reservoir.
Water 15 02510 g004
Figure 6. The model bases within the reservoir simulation model for single reservoir operation.
Water 15 02510 g006
Figure 7. The decision-making process for the management options of single reservoir operation.
Water 15 02510 g007
Figure 8. The DSS alternative evaluation process for the management options of single reservoir operation.
Water 15 02510 g008
Figure 9. Optimal rule curves of the Ubolratana Reservoir from optimization techniques.
Water 15 02510 g009
Figure 10. The alternative choices for each scenario.
Water 15 02510 g010
Figure 11. The situation of water shortage for the normal water scenario.
Water 15 02510 g011
Figure 12. The situation of water shortage for the high water scarcity scenario.
Water 15 02510 g012
Figure 13. The situation of excess water for the normal excess water scenario.
Water 15 02510 g013
Figure 14. The situation of excess water for the high excess water scenario.
Water 15 02510 g014
Figure 15. The suitable alternative engineering choices.
Water 15 02510 g015
Disclaimer/Publisher’s Note: The statements, opinions and data contained in all publications are solely those of the individual author(s) and contributor(s) and not of MDPI and/or the editor(s). MDPI and/or the editor(s) disclaim responsibility for any injury to people or property resulting from any ideas, methods, instructions or products referred to in the content.