Article

First Estimation of the Annual Biosynthetic Calorie Production by Phytoplankton in the Yellow Sea, South Sea of Korea, East China Sea, and East Sea

1
Department of Oceanography, Pusan National University, Busan 46241, Republic of Korea
2
Oceanic Climate and Ecology Research Division, National Institute of Fisheries Science, Busan 46083, Republic of Korea
3
South Sea Fisheries Research Institute, National Institute of Fisheries Science, Yeosu 59780, Republic of Korea
4
Department of Ecology and Conservation, Marine Biodiversity Institute of Korea, Seocheon 33662, Republic of Korea
5
Horn Point Laboratory, University of Maryland Center for Environmental Science, Cambridge, MD 21613, USA
*
Author to whom correspondence should be addressed.
Water 2023, 15(13), 2489; https://doi.org/10.3390/w15132489
Submission received: 5 May 2023 / Revised: 30 June 2023 / Accepted: 5 July 2023 / Published: 6 July 2023
(This article belongs to the Section Oceans and Coastal Zones)

Abstract

:
We investigated the spatio-temporal variations in three key biomolecular compounds (carbohydrates, proteins, and lipids) in particulate organic matter (POM) in the Yellow Sea (YS), South Sea of Korea (SS), East China Sea (ECS), and East Sea (Sea of Japan; ES) in order to estimate the regional annual calorie production rates based on the seasonal data obtained in each region. Carbohydrates were found to be most dominant, followed by lipids across all seas. The euphotic-integral calorie contents of POM during the study period were determined as 53.5 ± 12.6 Kcal m−2 in the YS; 54.2 ± 7.5 Kcal m−2 in the SS; 35.7 ± 9.2 Kcal m−2 in the ECS; and 58.7 ± 6.2 Kcal m−2 in the ES. Utilizing seasonal carbon conversion factors and primary production rates, we estimated the annual calorie productions, which were highest in the ES (1705 Kcal m−2 y−1) and lowest in the ECS (403 Kcal m−2 y−1). This can be attributed to the significantly higher energy efficiency of phytoplankton and faster turnover rate of calorie content. However, caution must be taken when comparing these estimates regionally, considering potential variations in developmental phases among the four regions during the sampling period in 2018. The calorie production rates in this study provide valuable insights into the physiological condition of phytoplankton within specific regions.

1. Introduction

Phytoplankton utilize inorganic carbon and nutrients to synthesize various biomolecular compounds such as carbohydrates, proteins, and lipids via the photosynthetic process [1,2,3,4]. Each compound plays different roles in their growth and survival and, consequently, essential ecological roles via trophic levels within marine ecosystems.
Generally, carbohydrates and lipids play crucial roles as the principal components of cell membranes and energy reservoirs whereas proteins are essential for forming a cellular nitrogen pool [4,5,6,7,8]. However, the relative abundance of these biochemical organic compounds (i.e., biomolecular compositions) within phytoplankton cells varies based on species, the physiological conditions of phytoplankton [1,2,3,9], and various environmental conditions [4,10,11,12]. For instance, marine diatoms are known to produce relatively higher carbohydrate content among the three biomolecular compounds [13,14,15]. In the East Sea (Sea of Japan; hereafter East Sea), previous studies by Kang et al. [16] and Jo et al. [17] have noted that when diatoms were the dominant phytoplankton species, relatively high proportions of carbohydrates were observed. Conversely, when non-diatom phytoplankton—smaller than 2 µm—prevailed, the relatively dominant lipid composition was observed [16]. Additionally, phytoplankton with high growth rates tend to have higher protein levels, while lipid compositions increase during stationary growth phases [5,18]. Environmental factors such as water temperature [19], light conditions [20,21,22], and nutrient availability [10,11,23] play significant roles in shaping the photosynthetic biochemical composition of phytoplankton. For example, phytoplankton can increase non-nitrogenous storage compounds such as lipids and carbohydrates, causing a decline in the cellular protein contents in a nitrogen-deficient environment but enhancing protein accumulation under nitrogen-sufficient conditions [24,25,26,27,28,29]. These variations in biochemical compositions in phytoplankton have implications for the quality of their food source for grazers and consumers at higher trophic levels [17,30,31]. Strong correlations between the biochemical compositions of phytoplankton and zooplankton have been observed in the Arctic Ocean and the East Sea [24,25]. Specifically, the lipid compositions of phytoplankton have shown positive correlations with the protein compositions of zooplankton in the Arctic Ocean [30]. Similarly, in the East Sea, the lipid compositions of phytoplankton have been strongly linked to the lipid compositions of zooplankton [17]. Thus, the biomolecular composition (carbohydrates, proteins, and lipids) of particulate organic matter (POM) produced by phytoplankton can serve as an important indicator of their physiological states and nutritional quality for higher-trophic-level consumers [4,32].
In the context of energy flow within marine ecosystems, several studies have focused on quantifying the caloric content of phytoplankton in various oceans [4,33,34,35,36]. Previous research has suggested that estimating the energy efficiency of primary production can be achieved by considering the caloric content of the organic carbon material produced by phytoplankton [33]; furthermore, investigations into the calorie content per unit of chlorophyll a concentration, an indicator of phytoplankton biomass, have been conducted to understand the chemical energy content and efficiencies of different cell-sized phytoplankton. In the northern East Sea, Kang et al. [16] found a significantly higher calorie content per unit of chlorophyll a concentration in small-sized (<2 µm) phytoplankton compared to large-sized (>2 µm) phytoplankton; however, Kang et al. [36] reported the opposite result in the western East Sea, where large-sized phytoplankton exhibited a higher calorie content per unit of chlorophyll a concentration than small-sized phytoplankton. This inconsistency suggests that the energy efficiency of different-sized phytoplankton may vary spatially and temporally, potentially influencing the nutritional quality of the consumers at higher trophic levels [4,36].
This study aims to investigate regional biochemical compositions of POM in the Yellow Sea (YS), South Sea of Korea (SS), East China Sea (ECS), and East Sea (ES) surrounding Korea. Additionally, we aim to quantify the annual calorie production attributed primarily to photosynthetic phytoplankton, which has not been estimated or previously determined.

2. Materials and Methods

2.1. Water Sampling and Analysis for Concentrations of Chlorophyll a, Particulate Organic Carbon (POC), and Macromolecules

Seasonal cruise surveys managed by the National Institute of Fisheries Science (NIFS) in Korea were carried out in the YS, SS, ECS, and ES from February to October 2018 (Figure 1). Four seasonal sampling cruises were from 1 February to 4 March (winter), 4 April to 1 May (spring), 2 August to 5 September (summer), and 10 October to 16 November (fall) in 2018.
Using an SBE9/11 CTD (Sea-Bird Electronics, Bellevue, WA, USA)/rosette sampler fitted with 8 L-Niskin bottles, water samples for chlorophyll a concentration, POC, and biochemical compositions were obtained from 100, 30, and 1% light depths within the euphotic zone determined using a Secchi disk. In order to determine different light depths, we specifically selected mid-morning stations for water samplings in conjunction with primary productivity measurements as our parallel study [37]. Sampling during daytime was essential for assessing light conditions at various depths. Samples for POC determination and each macromolecule analysis were obtained in triplicate.
For the chlorophyll a concentration, the water sample (0.1–0.4 L) was filtered using 25-mm GF/F filters (Whatman, 0.7 μm pore size) at low vacuum pressure (<150 mmHg). The filtered samples were placed in a conical tube (15 mL) and instantly stored in a freezer (–20 °C) for further pigment extraction within a month in our laboratory at the Pusan National University. In the laboratory, the filters were extracted with 90% acetone in a fridge (ca 4 °C) for 20–24 h and centrifuged at 4000 rpm for approximately 20 min based on the protocol by Parsons et al. [38]. Subsequently, the supernatant was transferred to borosilicate glass test tube (13 mm × 100 mm), and chlorophyll a concentrations were measured using a fluorometric method (Turner Designs, 10-AU, San Jose, CA, USA). The chlorophyll a data for the YS, SS, and ES from Jang et al. [37] were used for comparison.
The water samples (0.1–0.3 L) for determining POC content were filtered through pre-combusted (450 °C) GF/F filters (ø = 25 mm) at low vacuum pressure (<150 mmHg). The filtered samples placed in a conical tube (15 mL) were kept in a freezer (–20 °C) for preparation at the home laboratory of the Pusan National University. The POC concentration was analyzed using a Finnigan Deltaplus XL mass spectrometer (Thermo Fisher Scientific Inc., Waltham, MA, USA) at the Alaska Stable Isotope Facility (University of Alaska Fairbanks). The uncertainty for the POC measurement is ±5.1 %.
The water sample (1 L) was filtered using a 47-mm GF/F filter (Whatman, 0.7 μm pore size) for determining the concentrations of carbohydrates, proteins, and lipids. The filters were immediately stored at –80 °C until further extraction analysis within a month. The extraction processes for carbohydrates, proteins, and lipids from the filters were executed following the protocol by Bhavya et al. [32] and Lee et al. [39]. Briefly, the sample filter was cut into small pieces in a polypropylene vial for carbohydrate extraction based on the protocol by Dubois et al. [40]. After an ultrasonicated extraction for 20 min from the sample with 1 mL deionized water, 1 mL of phenol reagent (5%) was added into a vial and kept at room temperature for approximately 40 min. Then, 5 mL of sulfuric acid was added and the vial was kept at room temperature for 10 min for the final carbohydrate extraction process. For protein extraction, the colorimetric peptide-detecting assays were performed by following Lowry et al. [41] and Fiset et al. [42]. The sampling filter was cut into pieces in a centrifuge tube. After the ultrasonicated extraction with 1 mL of deionized water was conducted for 20 min, alkaline copper solution (5 mL) was added into the tube, kept at room temperature for 10 min, and mixed using a vortex mixer (MaXshakeTM VM30, Daihan Scientific Co., Ltd., Wonju, Gangwon-do, Republic of Korea). Finally, a volume of 0.5 mL of diluted Folin–Ciocalteu phenol reagent was added to the sampling tube for the protein extraction. Lipid extraction was performed based on the methods by Bligh and Dyer [43] and Marsh and Weinstein [44]. Chloroform–methanol mixture (3 mL) was added into the amber vial with small pieces of the sampling filter, and the extraction was performed via ultrasonication for 20 min. The supernatant was transferred into a new glass vial when extraction process—such as storing in the refrigerator (4 °C for 1 h) and centrifugation—was completed. The above extraction process was repeated once with the mixture of residue. In the sample vial, after the lower phase (a mixture of chloroform and lipids) was dried in a dry oven at 40 °C for 48 h, the vial was placed in a heating block with an addition of 2 mL deionized water at 200 °C for 15 min and cooled at room temperature. Then, the solvent with an additional 3 mL of deionized water in the vial was mixed with a vortex mixer and allowed to stand for 10 min for the final lipid extraction process.
Following each extraction procedure, the concentrations of each biochemical component were quantified using a UV spectrophotometer (Hitachi-UH5300, Hitachi, Tokyo, Japan). Glucose solution, bovine serum albumin, and tripalmitin solution were used as standards for quantifying the concentrations of carbohydrates, proteins, and lipids, respectively [9]. The measurement uncertainties for carbohydrates, proteins, and lipid concentrations were ±4.3, ±8.5, and ±5.6%, respectively.
In this study, each concentration of carbohydrates, proteins, and lipids was vertically integrated from three light depths at each station for determining the total biochemical composition and the annual biosynthetic energy production within euphotic water columns in the YS, the SS, the ECS, and the ES. The trapezoidal rule was applied for the integrated values from 100 to 1% light depths.

2.2. Calorie Content of POM

The total biochemical concentrations of POM were the sum of each concentration of carbohydrates, proteins, and lipids. The caloric value for the POM was calculated based on the Winberg [45] equation (Kcal g−1 = 0.041 × Carbohydrate% + 0.055 × protein% + 0.095 × lipid%). The calorie content (Kcal m−3) of POM was derived by caloric value (Kcal g−1) × total biochemical concentration of POM (g m−3) at each light depth [34]. Euphotic water column-integrated calorie content (Kcal m−2) of POM was calculated using the trapezoidal rule.

2.3. Calorie Production Rate of Phytoplankton

The caloric equivalents synthesized by phytoplankton can be estimated based on the conversion factor and the primary production rate at a given location. The calorie content (Kcal m−2) obtained from each macromolecular component was divided by POC concentration (g C m−2) at each station for a conversion factor from carbon to caloric units. The current primary production measurements using stable or radiocarbon isotope techniques provide the amount of organic carbon produced per unit of time [33]. Based on four different seasonal measurements, seasonal calorie production rates can be estimated in a given location based on seasonal conversion factors and seasonal-averaged daily primary production rates. The annual calorie production rates can be derived by summing the seasonal calorie production rates regionally in the YS, SS, ECS, and ES.
The turnover rate (day) of calorie contents was calculated by dividing calorie contents (Kcal m−2) by daily calorie production (Kcal m−2 d−1) integrated within the euphotic depth from 100 to 1% light depth.

2.4. Statistical Analysis

In this study, statistical analyses were performed using SPSS (version 12.0, SPSS Inc., Chicago, IL, USA). To investigate significant differences among variables, t-tests or one-way analysis of variance (one-way ANOVA) with post hoc tests were conducted. Levene’s test was used to assess the homogeneity of variances among the variable groups in both the t-tests and the one-way ANOVA. The post hoc tests, such as Bonferroni’s test (for homogeneity) or Games-Howell’s test (for heteroscedasticity), were employed to examine pairwise differences among the variables, assuming the homogeneity of variances. Statistical values with a p-value less than 0.05 were considered to indicate significant results.

3. Results and Discussion

3.1. Seasonal Variation in Chlorophyll a Concentrations in the YS, SS, ECS, and ES

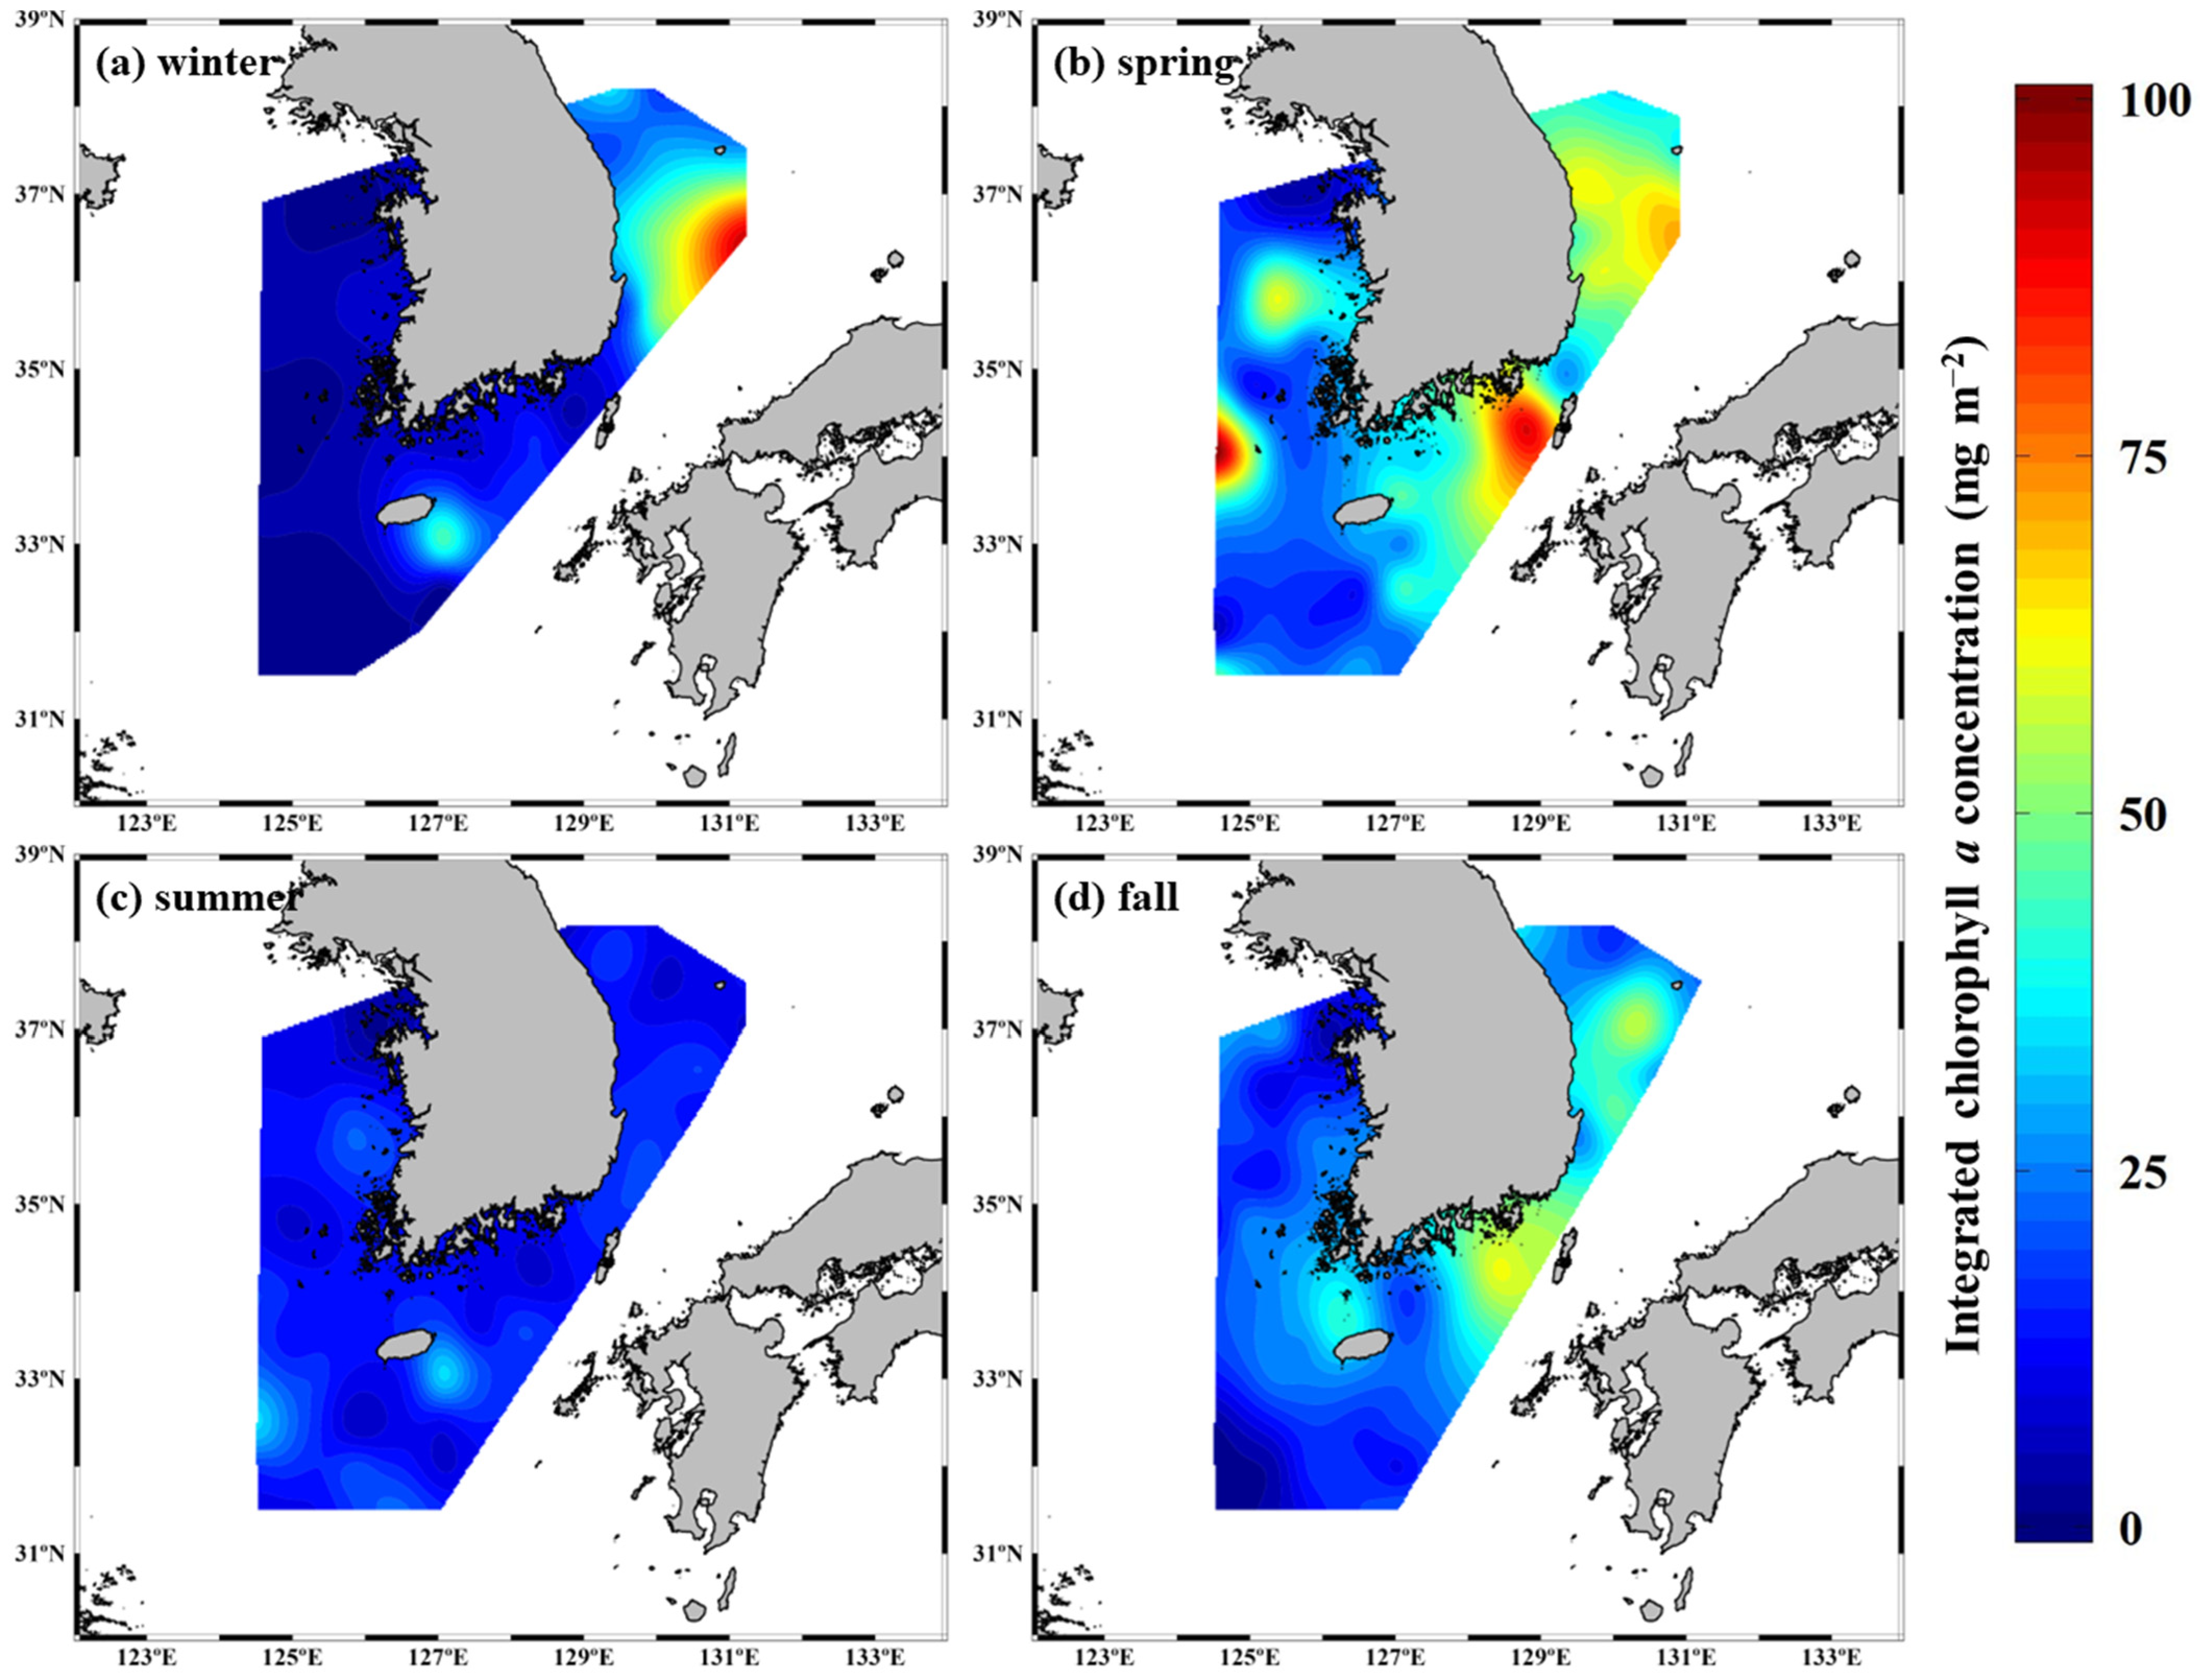
The chlorophyll a concentration, integrated from 100 to 1% light depth (euphotic water column-integrated chlorophyll a concentrations), at each station are summarized in Tables S1–S4. The integrated chlorophyll a concentration displayed distinct seasonal variations across the observed periods, as shown in Figure 2. Specifically, the seasonal patterns of integrated chlorophyll a concentration in the YS, SS, and ES were consistent with the typical bimodal seasonal cycle observed in phytoplankton biomass within temperate regions, as previously reported [37,46,47,48,49,50]. Typically, these regions exhibit higher chlorophyll a concentration during the spring bloom, followed by a decline in the nutrient-depleted summer with strong stratification, and a subsequent second bloom in the fall [37,46,47,48,49,50]. In our observation period, the concentrations of major inorganic nutrients exhibited significant variability during winter but remained relatively low in summer [37]. A noteworthy feature was the high chlorophyll a concentration observed in the ES during winter, which might be related to the unusually warm condition of sea surface temperature, especially in the ES during 2018 [51]; however, this relationship between chlorophyll a concentration and heat waves should be validated in the future.
In the SS, during the spring season, the chlorophyll a concentration was relatively higher in the eastern part compared to the western part. This difference in chlorophyll a concentrations may have been influenced by inputs from the Nakdong River, specifically in the eastern part of the SS. Notably, the euphotic water column-integrated chlorophyll a concentration was relatively higher in the ES compared to the YS and SS. While the statistical analysis did not reveal significant differences among the different regions—except for the ECS due to the wide geographical ranges of the chlorophyll a concentration—the integrated chlorophyll a concentration was significantly (t-test, p < 0.01) higher in the ES compared to the ECS across all seasons, except for summer when chlorophyll a concentration was low in all four seas.

3.2. Seasonal Variations in the Macromolecular Compositions of POM in the YS, SS, ECS, and ES

Tables S1–S2 provide a summary of the concentration of each biochemical component of POM, integrated within the euphotic water column from 100 to 1% light depth, in the YS, SS, ECS, and ES throughout the observation period.
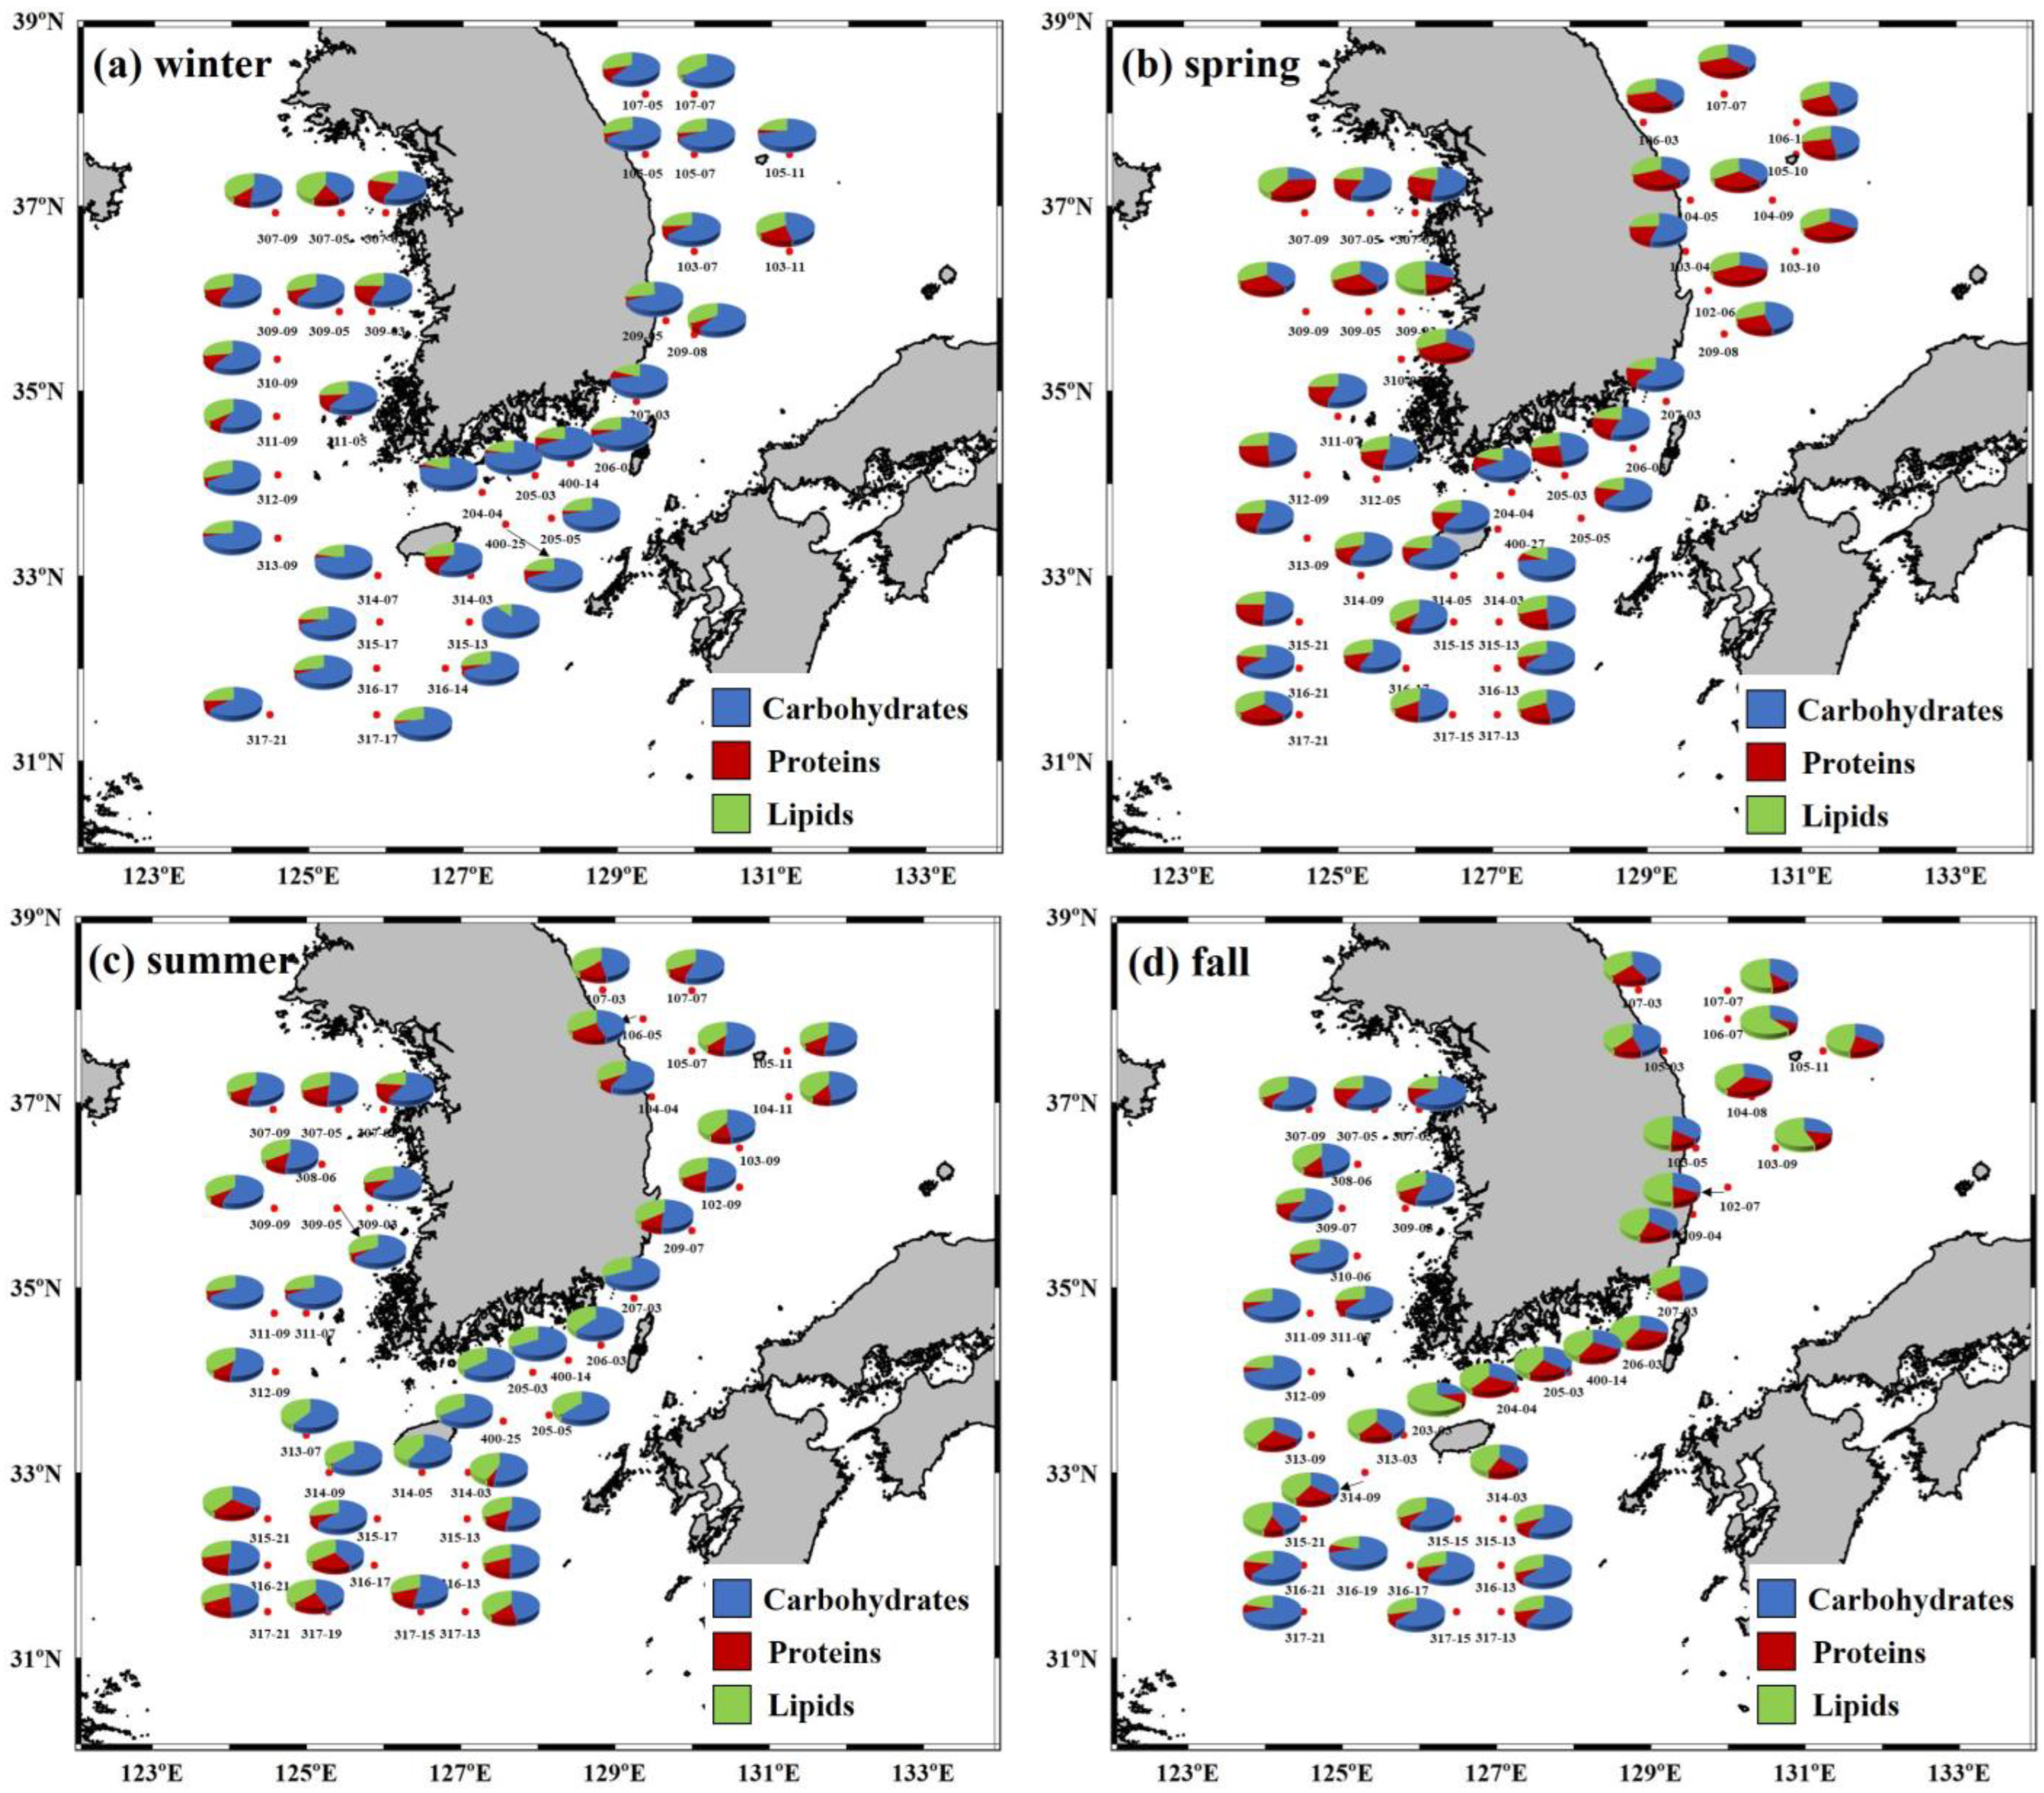
The spatial distributions of the macromolecular compositions during each season based on these component concentrations are shown in Figure 3. The majority of the stations within each region displayed similar seasonal compositions. In the YS, the overall macromolecular composition was 54.2 ± 9.7% carbohydrates, 15.2 ± 7.5% proteins, and 30.6 ± 6.5% lipids (Figure 3). Similarly, the SS exhibited compositions of 56.5 ± 13.9% carbohydrates, 11.5 ± 8.7% proteins, and 32.0 ± 10.4% lipids. In the ECS, the respective compositions were 56.5 ± 10.7, 13.3 ± 6.0, and 30.2 ± 6.7%, while in the ES, they were 47.1 ± 11.6, 16.4 ± 8.8, and 36.5 ± 8.5%.
Although no distinct regional variations in the biochemical compositions were observed among the stations during each season, noticeable seasonal variations were evident within each region (Figure 3). The SS and ES displayed prominent seasonal changes, with the higher lipid composition observed from winter to fall. Conversely, the YS exhibited less pronounced variations, except for spring. The ECS showed similarities between winter and fall but differed from spring and summer. Overall, carbohydrates were the dominant macromolecule throughout the season, except for fall with lipids being dominant in the SS and ES (Tables S1–S4 and Figure 3). Carbohydrates primarily act as a carbon pool in cell membranes and as energy reserves for further protein synthesis in phytoplankton [4,7,8], while lipids are energy-rich biomolecules typically accumulated under nitrogen-deficient conditions, or stagnant growth conditions [5,6]. They served as major storage products during stressful or stagnant periods ([52]; references therein). Under prolonged nitrogen-deficient conditions, phytoplankton allocate cellular carbon toward lipid formation rather than carbohydrates [53]. Proteins, on the other hand, play important roles in enzymatic processes and phytoplankton growth [4,7,8], with higher concentrations synthesized under nitrogen-rich conditions [28,54,55]. The dominance of carbohydrates in macromolecular compositions was commonly observed at various sites in South Korea, except for Gwangyang Bay, where protein content exceeded those of other biomolecules (Table 1). This protein dominance in Gwangyang Bay is attributed to inputs of dissolved inorganic nitrogen from the Seomjin River [11]. Contrastingly, in the eastern part of the SS, where there could be a potential influence of Nakdong River inputs, we did not observe any distinct dominance of proteins in macromolecular compositions. This suggests that the sampling stations in the eastern part of the SS were located outside of the plume of the Nakdong River (Figure 1), as indicated by salinity characteristics in a parallel study [37]. Therefore, in this study, we do not expect significant effects from large riverine nutrient inputs on the compositions in that specific area. Indeed, previous studies by Moon and Choi [56] showed that the major nutrient concentrations in the Nakdong River estuary rapidly decrease to background levels when moving from the upper to lower regions. This suggests that the nutrient inputs from the Nakdong River into the eastern part of the SS may not have a substantial influence on the nutrient concentrations observed in our study.
In the southwestern ES, carbohydrates were the most dominant (53.2 ± 12.5%; Table S4), likely influenced by the prevalence of diatoms and nutrient-depleted water conditions [17]. Diatoms, as the dominant group in the ES, tend to exhibit higher carbohydrate concentrations in the form of storage polysaccharides [14,57]. The relative contributions of diatoms to the phytoplankton community in the ES varied seasonally during the study period, with higher dominance in winter and fall (39.0 and 52.1%, respectively), and lower in spring and summer (23.1 and 25.4%, respectively) [58]. Thus, factors other than diatom compositions likely influence the predominant carbohydrate compositions observed in this study. Although some seasonal phosphate or nitrogen limitations were observed in each region [37], their consistent association with carbohydrate dominance throughout the study period could not be established. The major factors driving seasonal variations in these macromolecules remain inconclusive, as strong relationships with other physical and chemical environmental conditions were not found. Future studies should aim to further validate these relationships.
Based on previous studies [5,6], our findings suggest that phytoplankton in the YS, SS, ECS, and ES experienced stagnant growth conditions, as indicated by the dominance of carbohydrates during the study period. Relatively higher lipid proportions in the SS and the ES during the fall season physiologically indicate prolonged stagnant growth conditions.
In this study, the seasonal patterns of the total amount of the three macromolecules (FM) [59,60] were relatively different in the YS, SS, ECS, and ES (Tables S1–S4), unlike the bimodal seasonal cycle observed in integrated chlorophyll a concentration (Figure 2). Notably, FM was not significantly related to chlorophyll a concentration in all seas, except for the ECS (r = 0.80, p < 0.01). The highest FM content was observed in the ES during winter, where riverine-organic matter inputs were expected to be low due to the absence of large rivers from the Korean and Japanese islands. While chlorophyll a concentration is conventionally used as an indicator of phytoplankton biomass, it can greatly vary (and therefore not correspond to the biomass) depending on the physiological conditions of phytoplankton [61,62,63]. In this study, the seasonal differences in chlorophyll a concentrations were considerably larger than those of FM across all four seas (Tables S1–S4), particularly in the ES where the difference in chlorophyll a concentrations between winter and spring exceeded those of FM (Table S4). While chlorophyll a concentration is commonly used as a measure of phytoplankton biomass, whether FM can serve as an alternative measure of phytoplankton biomass in various marine ecosystems should be validated in the future.

3.3. Seasonal Calorie Contents and Annual Calorie Productions of POM in the YS, SS, ECS, and ES

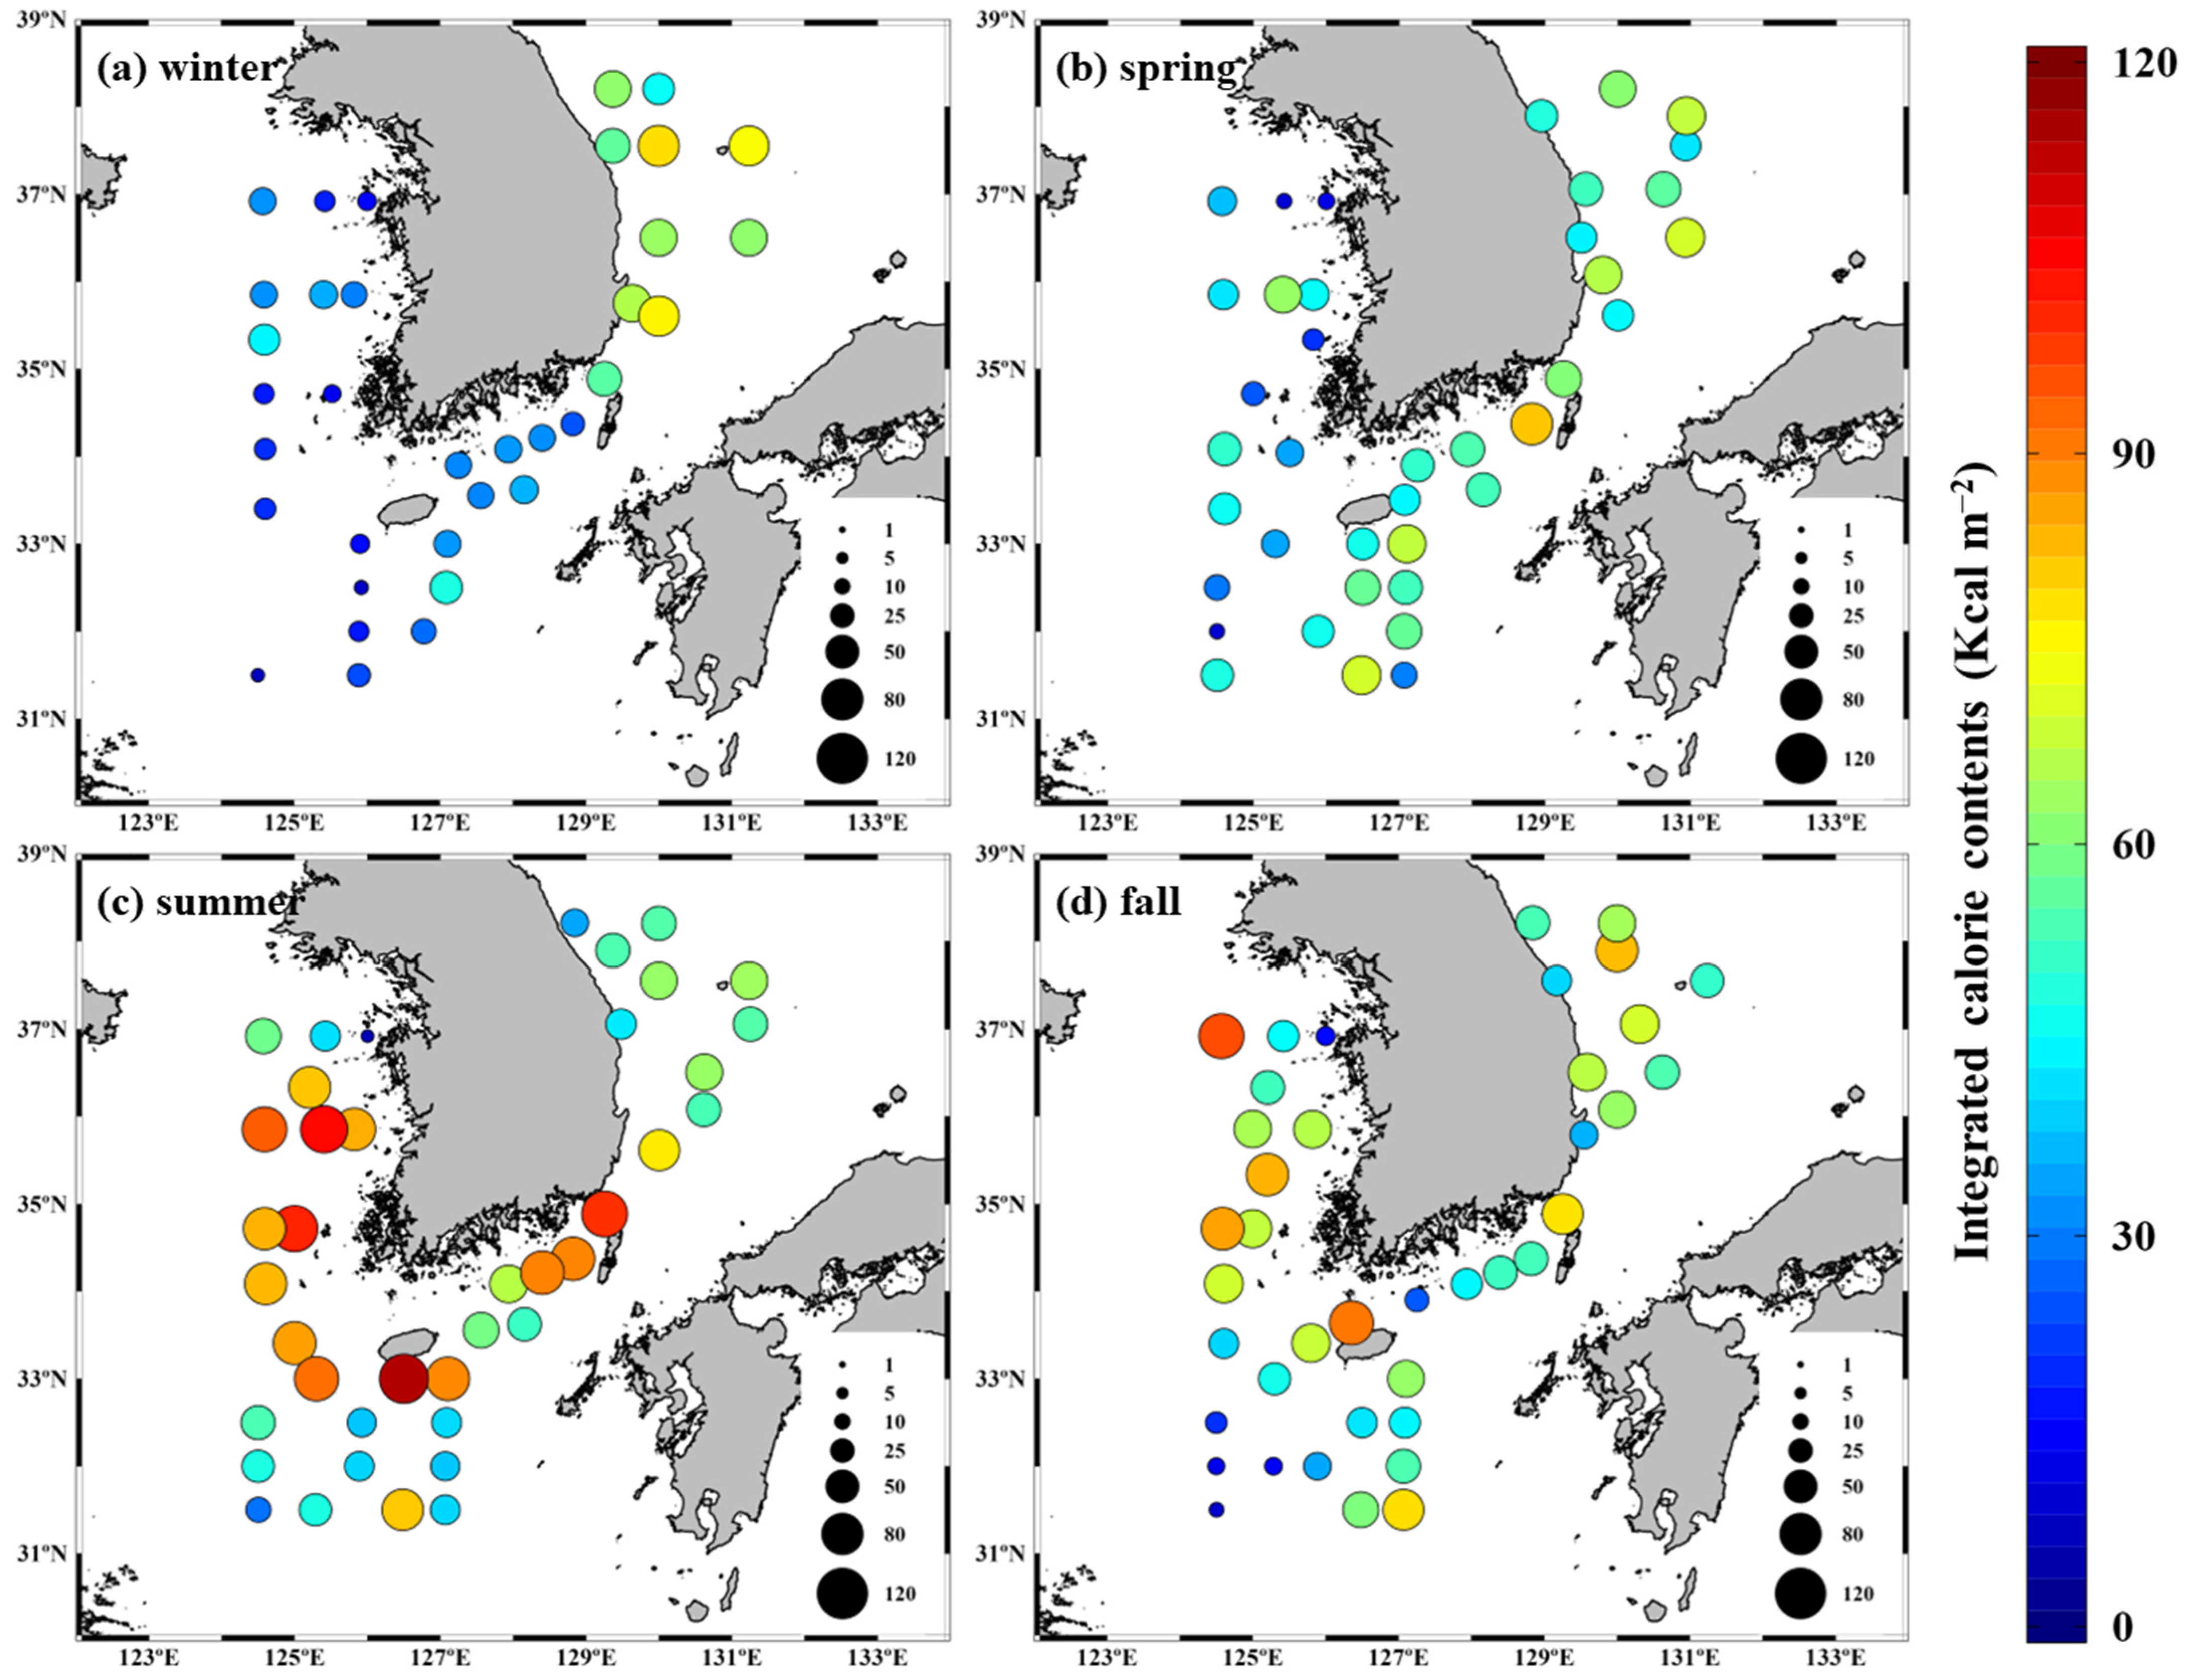
The seasonal calorie contents of POM, integrated from 100 to 1% light depth (euphotic water column-integrated calorie contents) in the YS, SS, ECS, and ES are presented in Figure 4. The YS and the SS exhibited seasonal variations in euphotic water column-integrated calorie contents, with the highest values occurring in summer, followed by fall. In contrast, the ECS displayed different seasonal patterns, with the highest values observed in spring and summer, while the ES had the highest value in winter. In the ES, among the three macromolecules, carbohydrate concentrations were significantly (t-test, p < 0.01) higher in winter compared to other seasons (Table S4) leading to higher FM and, consequently, higher calorie contents in winter. Hence, a significant positive relationship between FM and calorie content was observed across all the observations in this study (r = 0.98, p < 0.01).
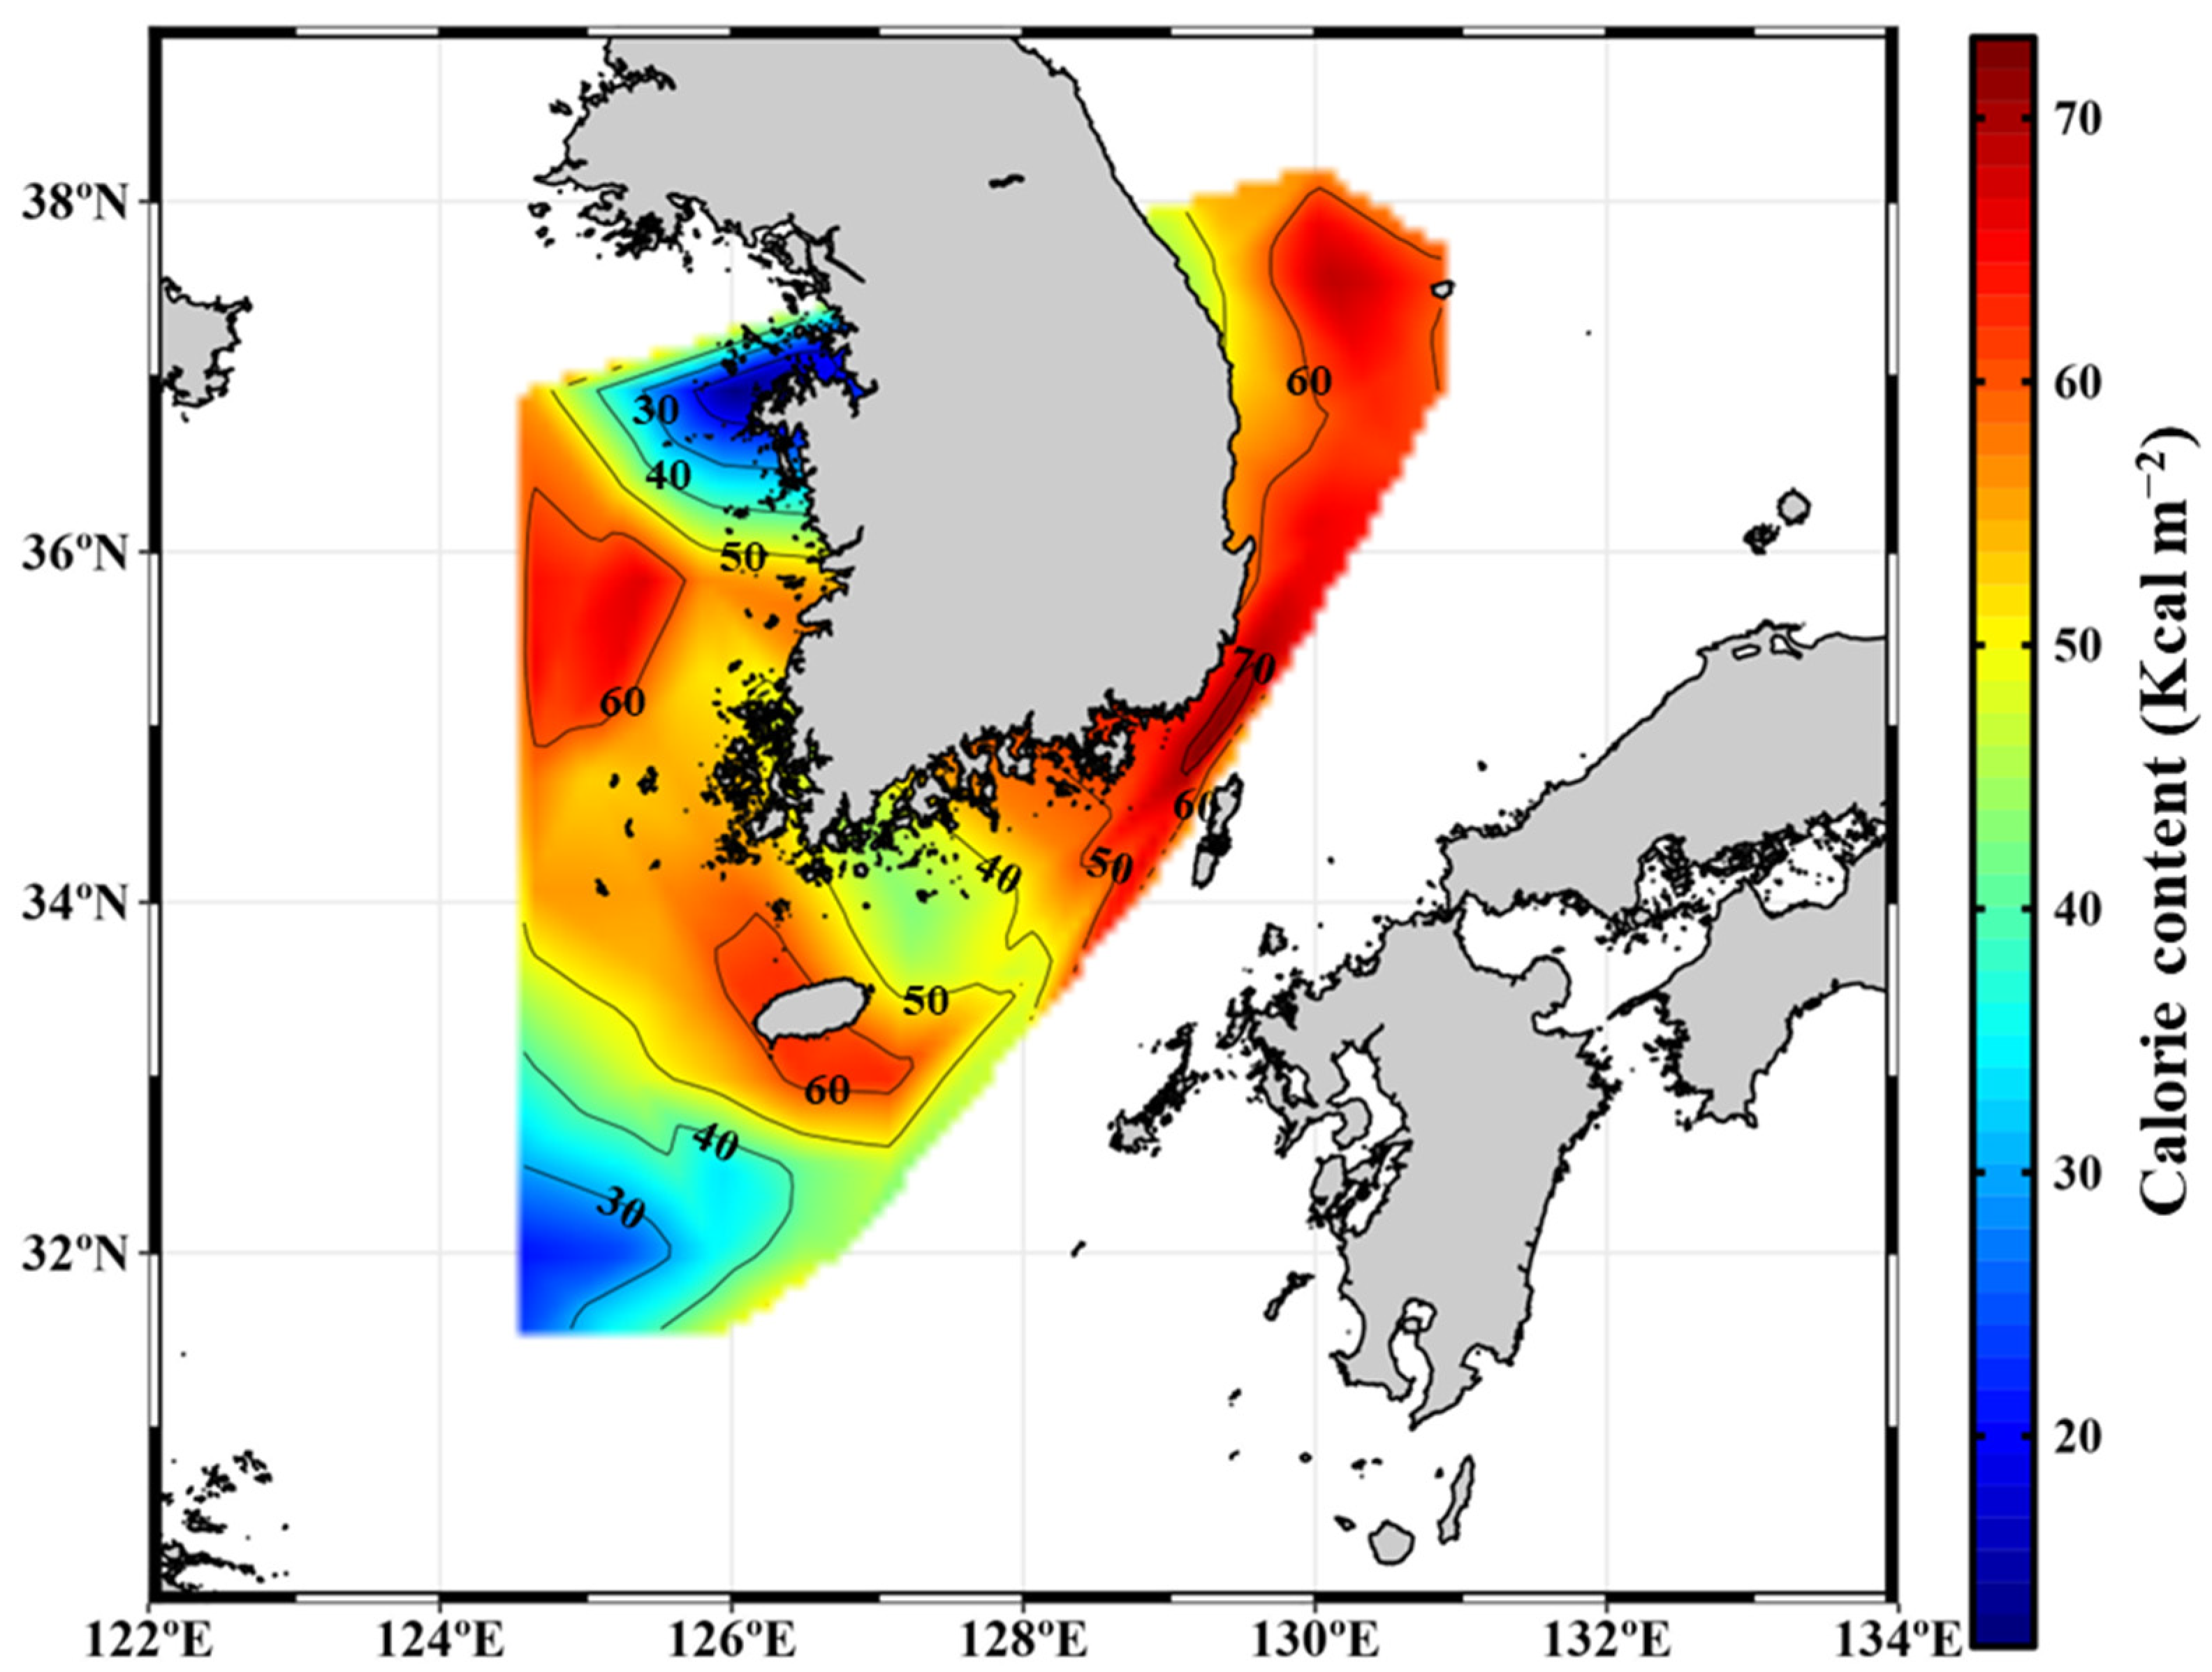
The integrated calorie content averaged annually across the four different seasons is shown in Figure 5, based on different macromolecular concentrations and their associated calories. Lower calorie contents were observed in the northern coastal areas of the YS and the western part of the ECS (Figure 5), where relatively lower chlorophyll a concentrations were found (Figure 2). However, no significant relationship was found between the calorie content and chlorophyll a concentration in this study. The regional-averaged calorie contents per square meter were 53.5 ± 12.6, 54.2 ± 7.5, 35.7 ± 9.2, and 58.7 ± 6.2 Kcal m−2 in the YS, SS, ECS, and ES, respectively. While the regional-averaged calorie contents were similar in the YS, SS, and ES, they were significantly lower in the ECS compared to the other regions (one-way ANOVA, p < 0.01).
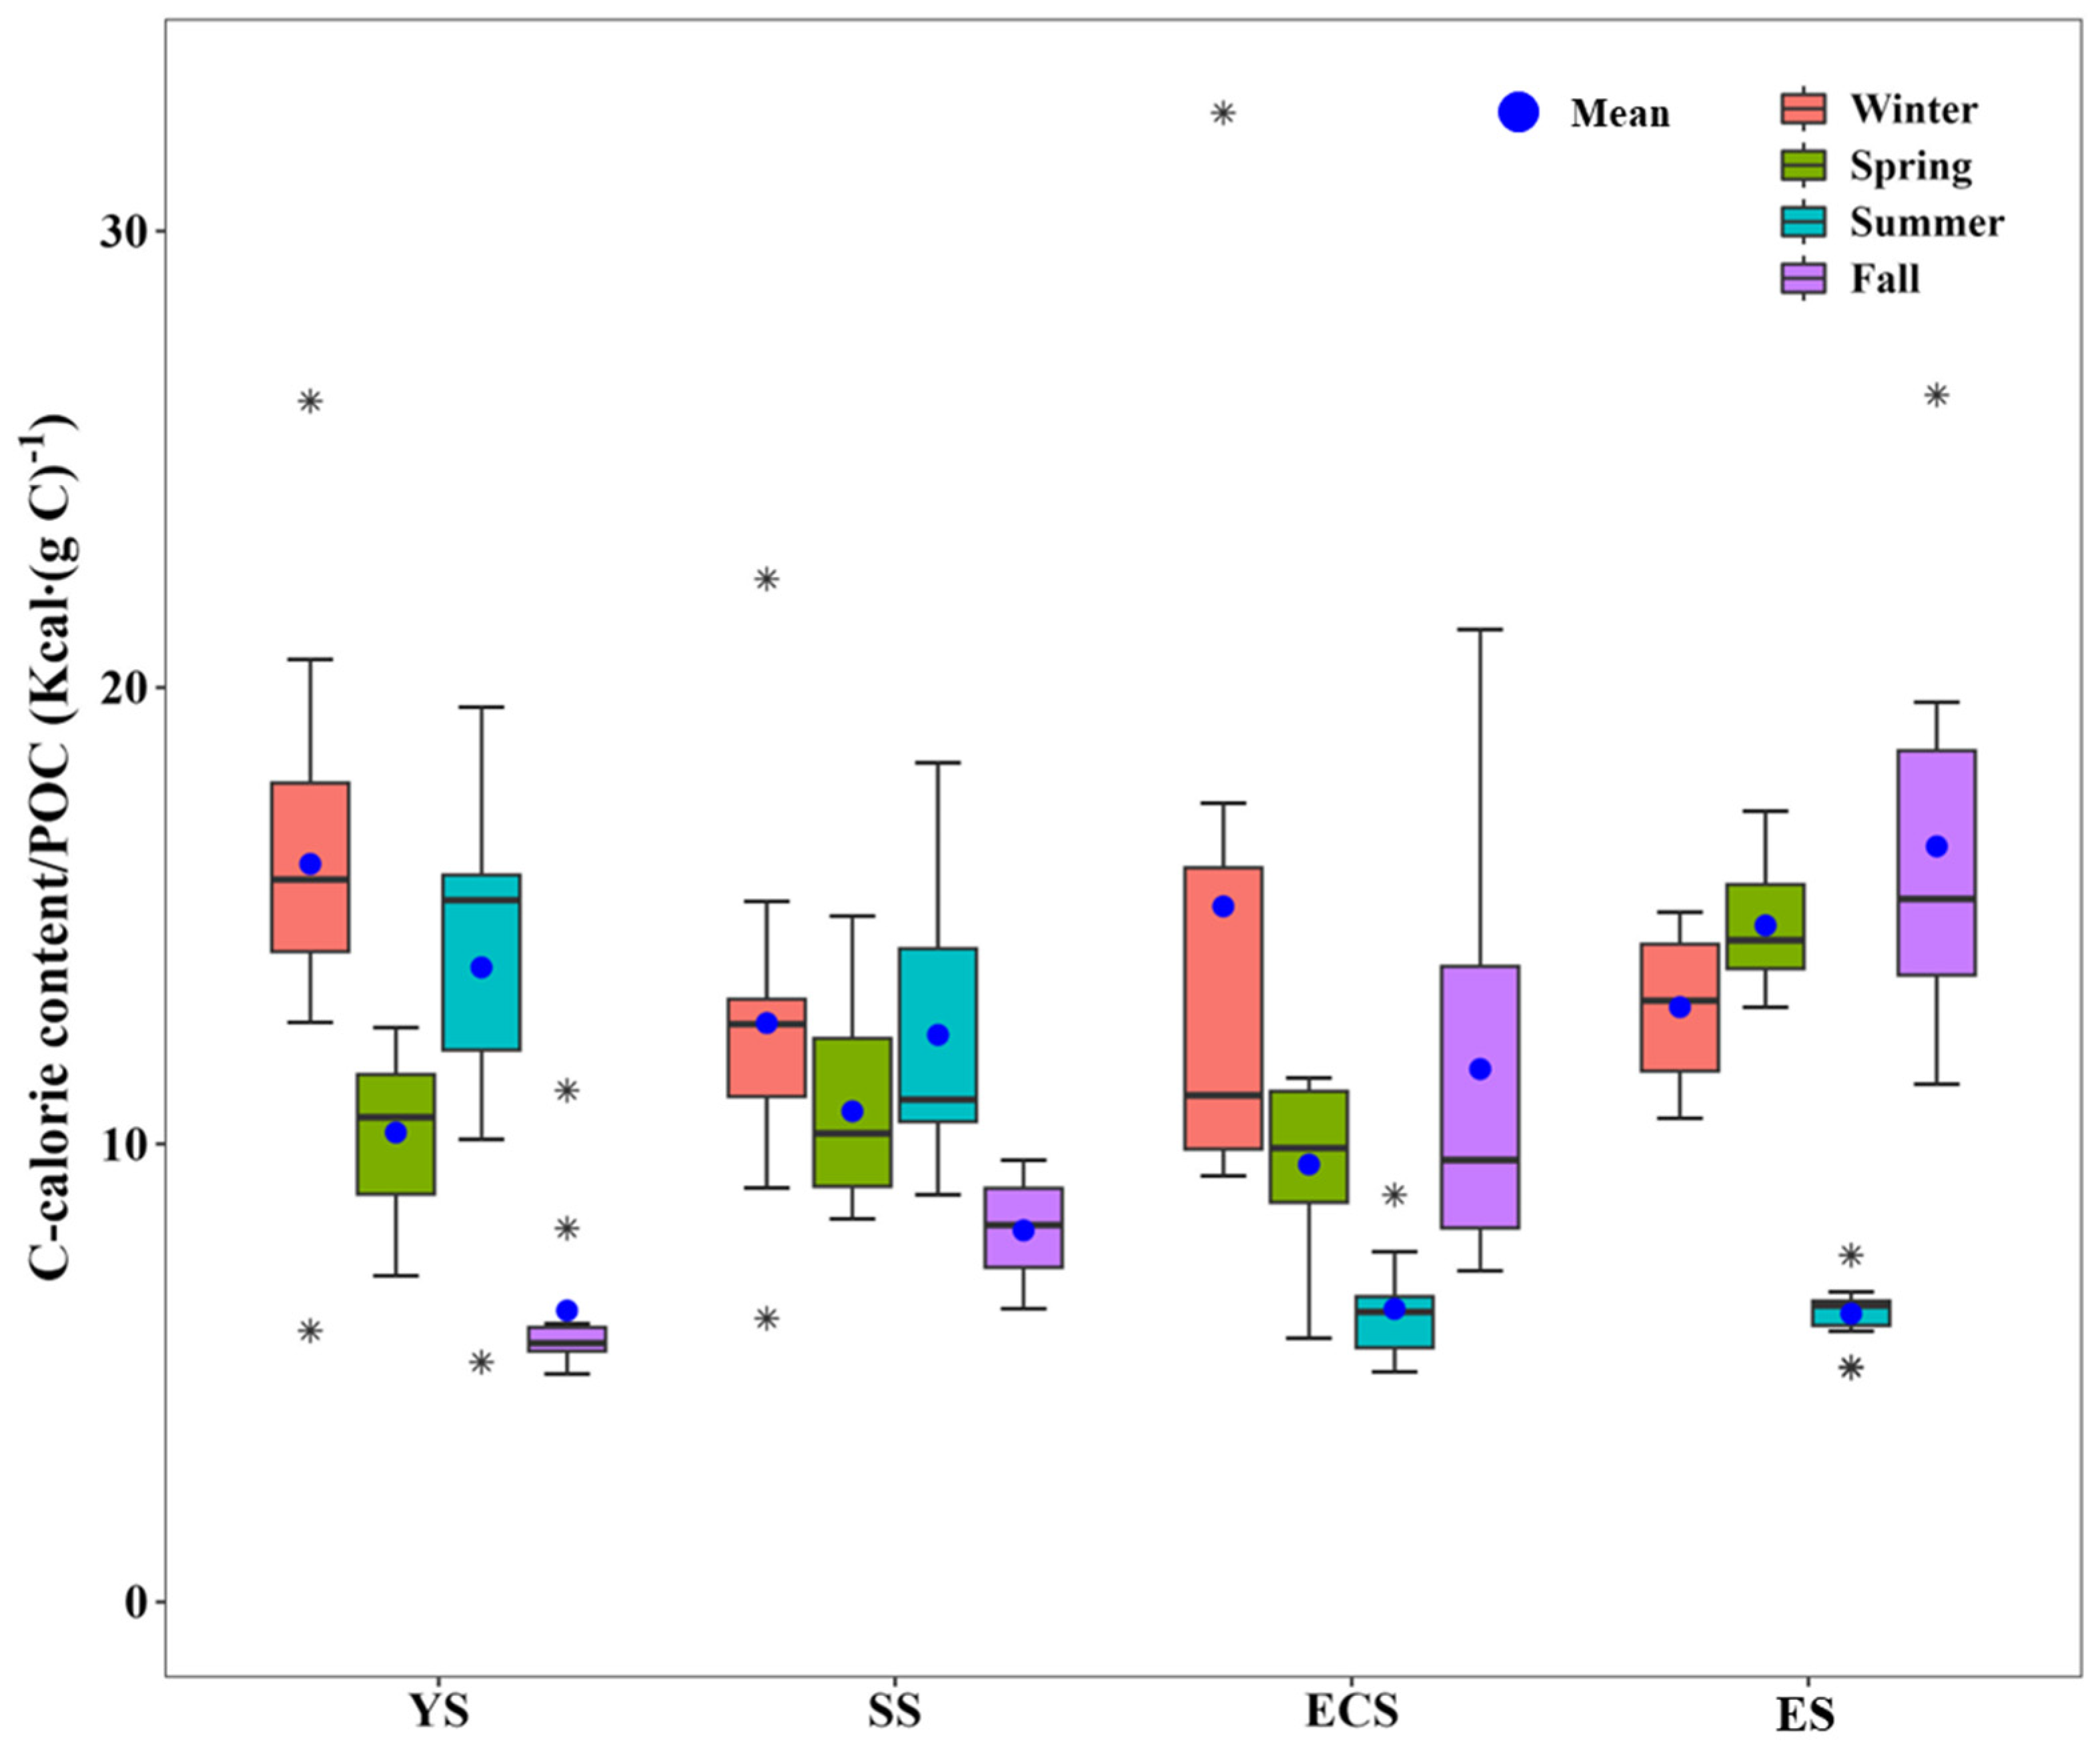
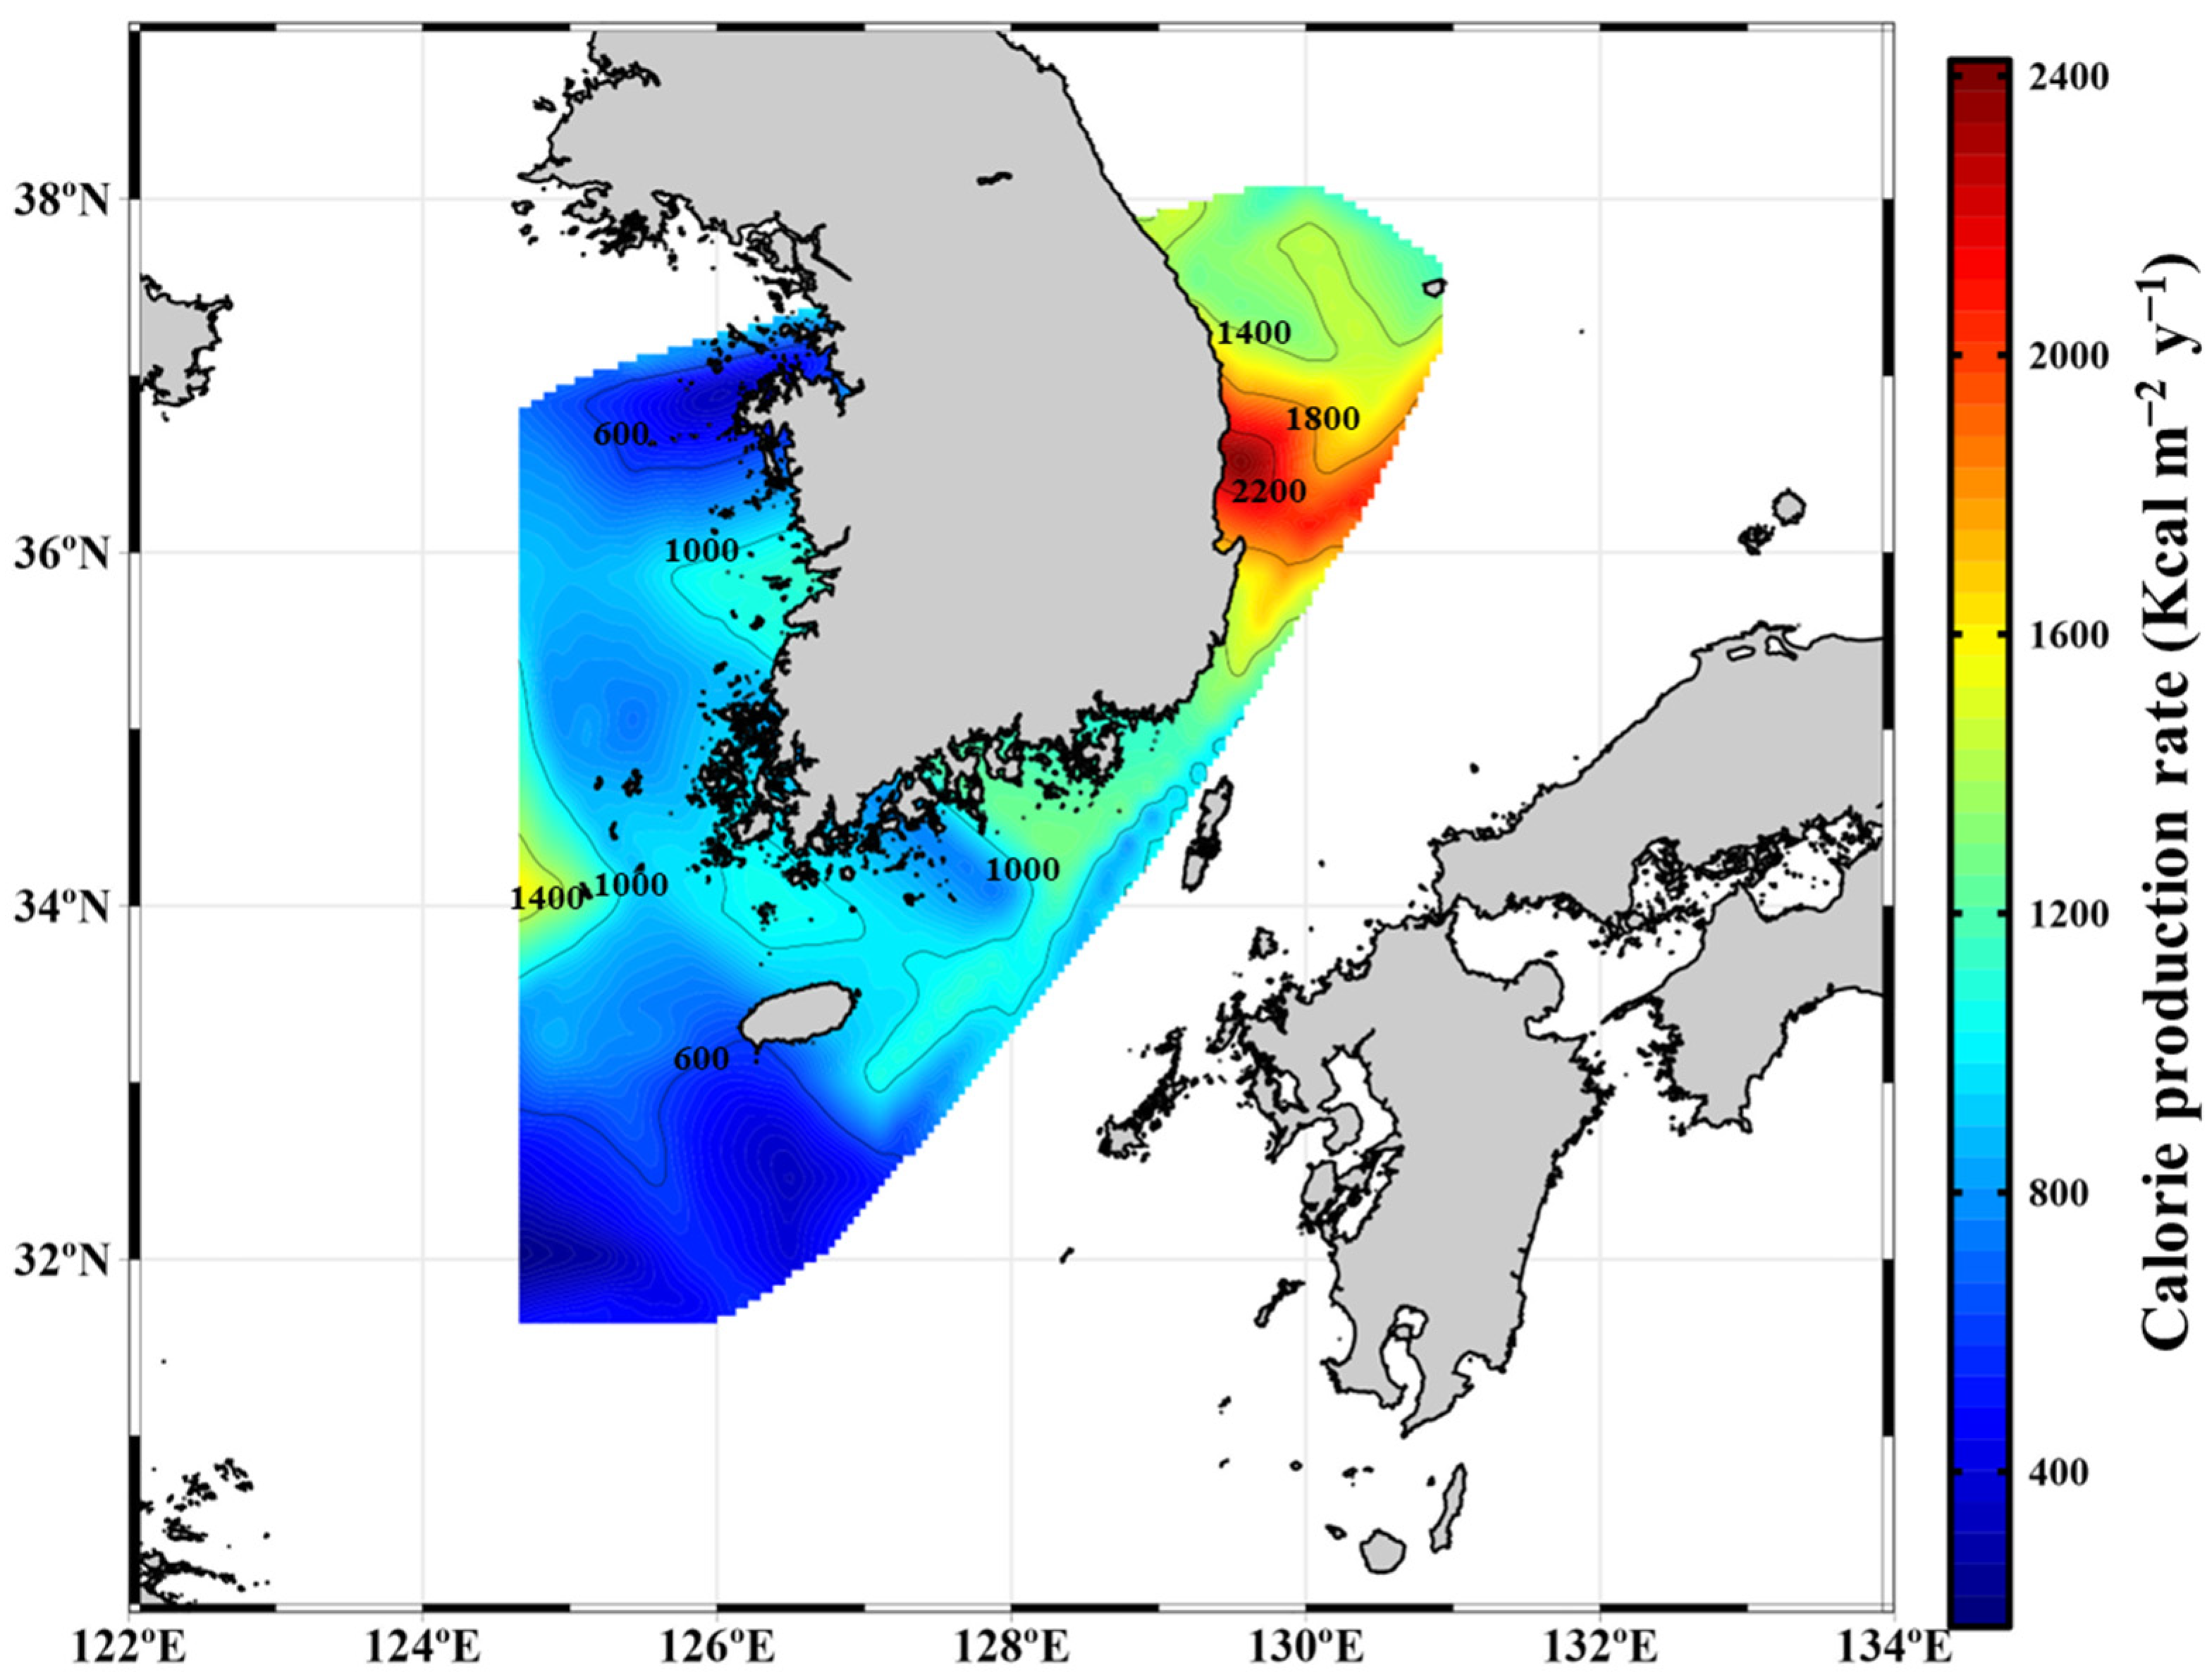
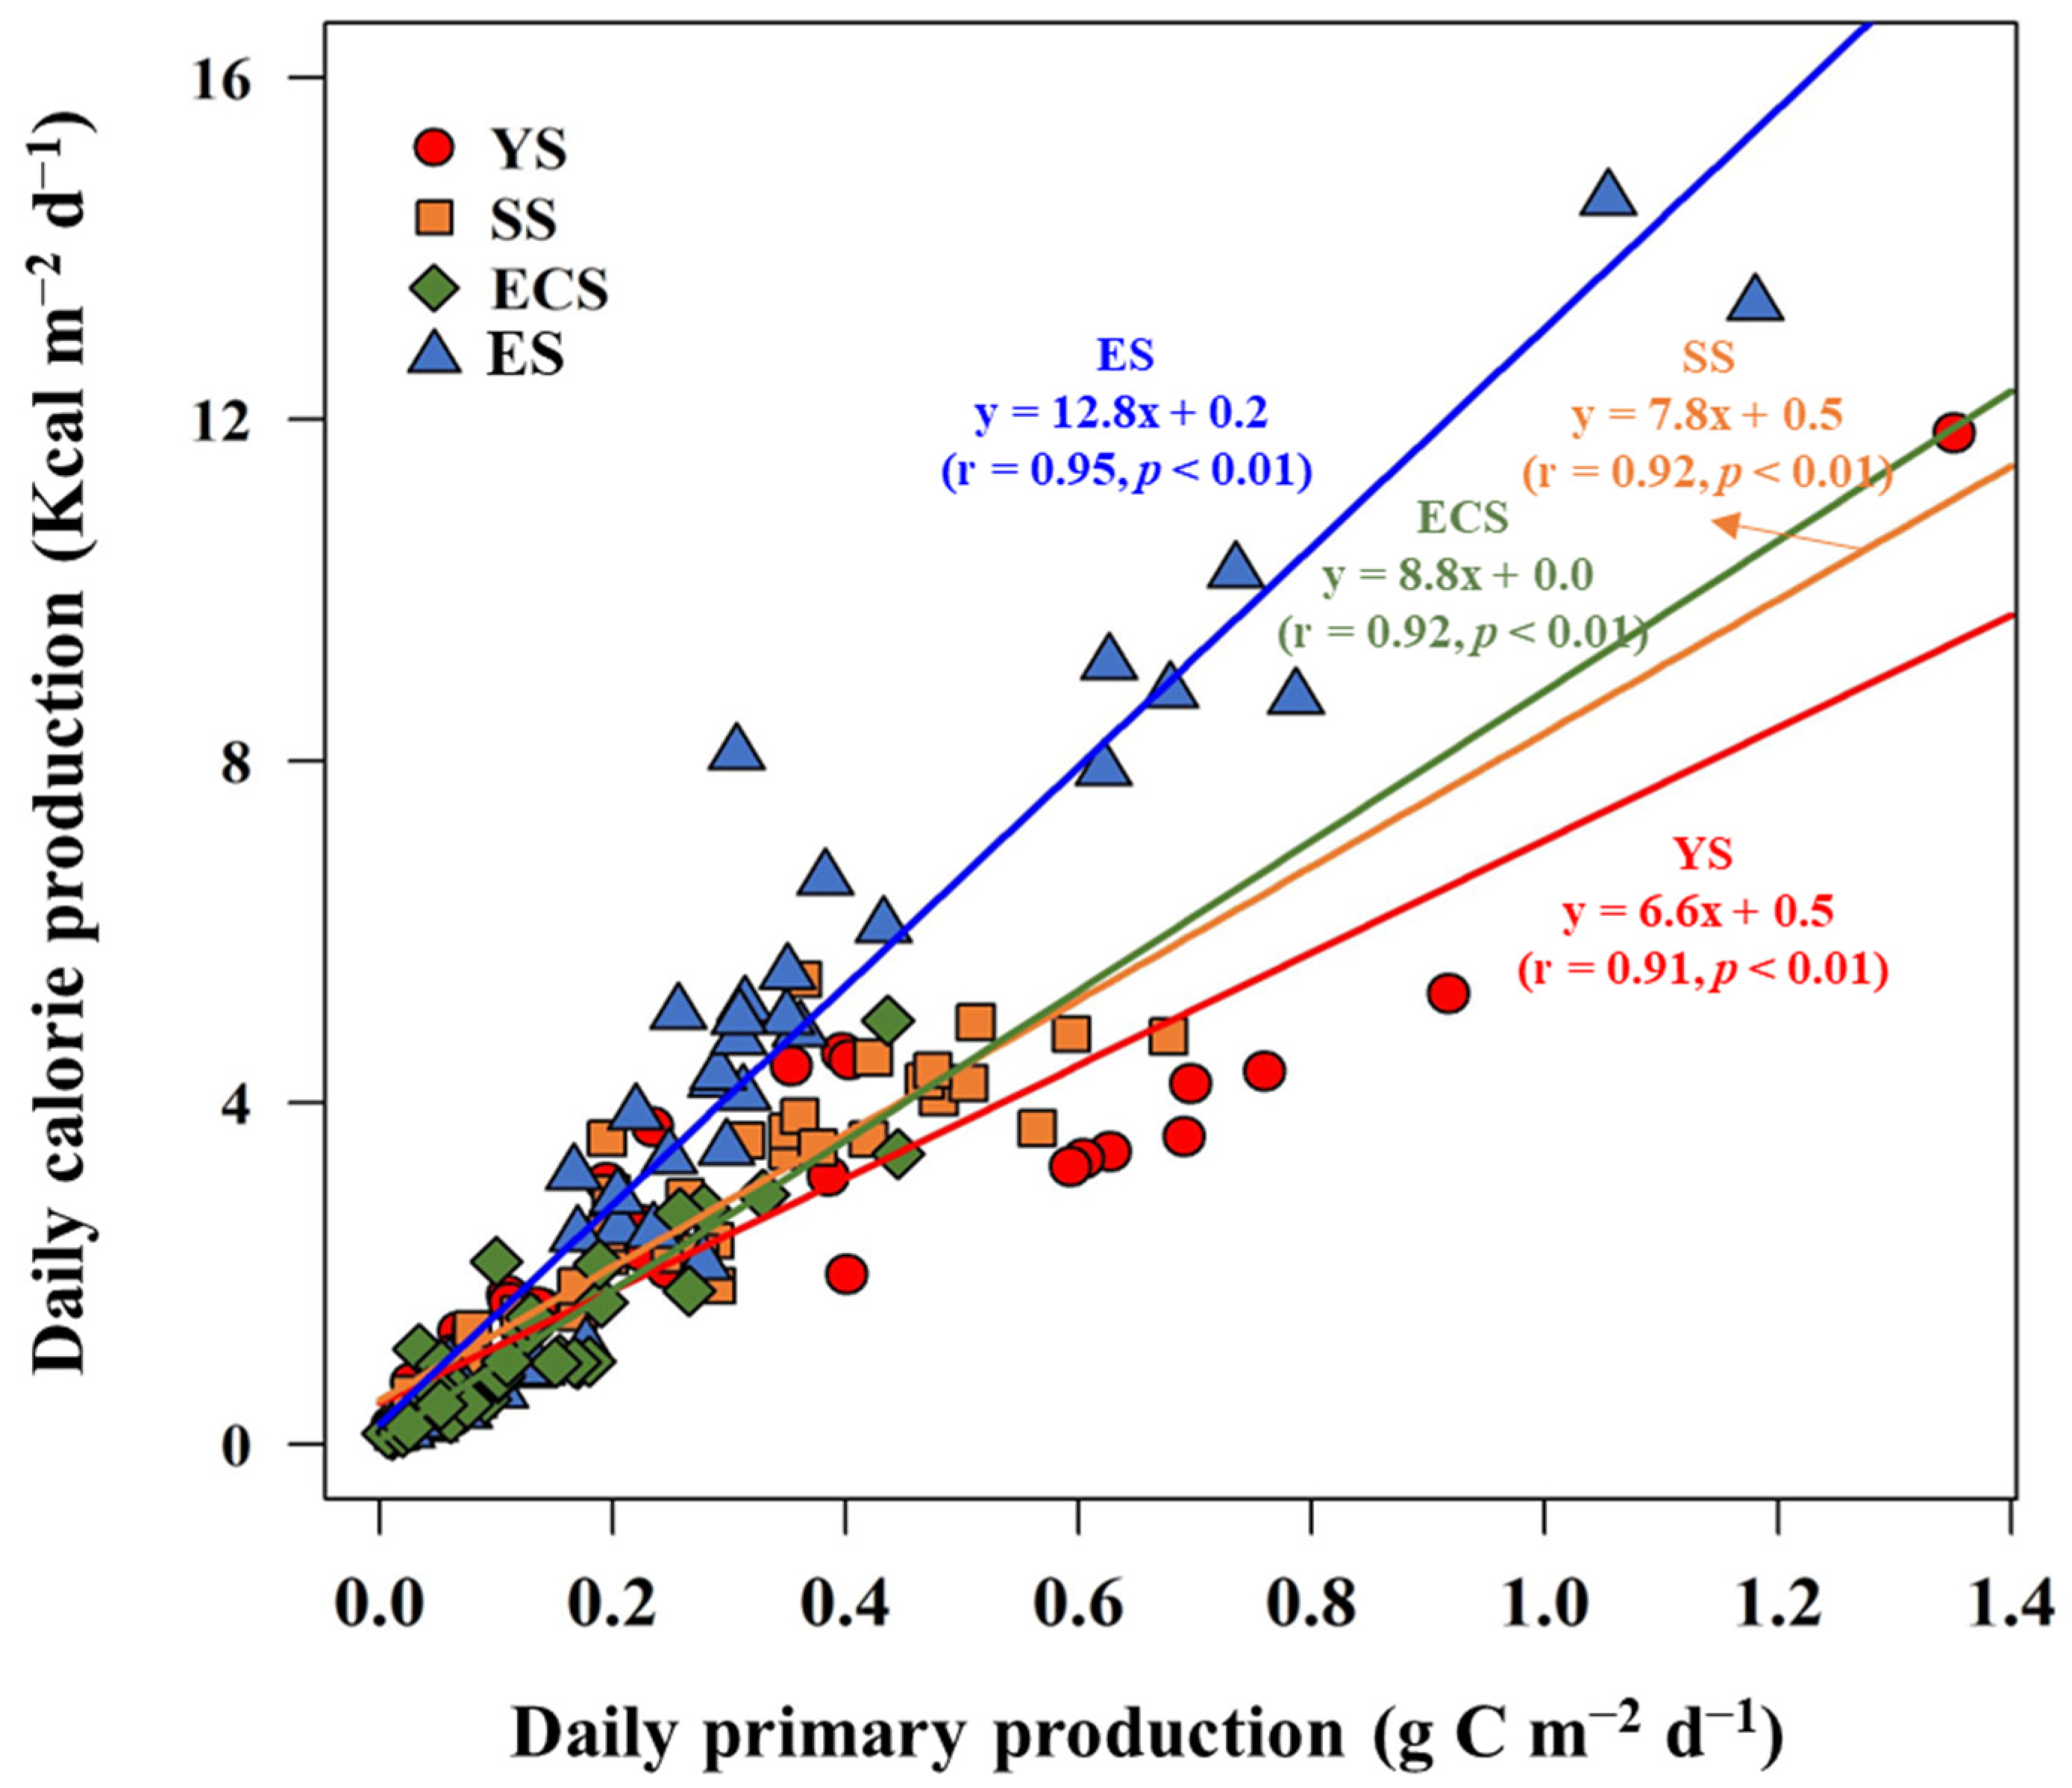
The seasonal conversion factors from carbon to caloric units for the calorie production rate of phytoplankton were determined in the YS, SS, ECS, and ES (Figure 6). These conversion factors exhibited seasonal variations without general patterns among the four seas; however, the seasonally averaged conversion factors were not significantly different among the four seas, although they were slightly higher in the ES (12.6 ± 4.6) compared to the other regions (11.1 ± 3.2). These values were comparable to that of the conversion factor previously reported for St. Margaret’s Bay, Nova Scotia (11.4) [33]. By applying the seasonal conversion factor from this study and the corresponding primary production rates reported by [37], the seasonally averaged calorie production rates were estimated as 2.3, 2.6, 1.1, and 4.7 Kcal m−2 d−1 in the YS, SS, ECS, and ES, respectively. The general regional trend (lower in the ECS and higher in the ES) of the seasonally averaged calorie production rates somewhat corresponded to the primary production rate reported by [37]. Using the seasonally averaged calorie production rates, the annual calorie production rates (the sum of the four seasonal values of calorie production rates) were estimated for the first time in the YS, SS, ECS, and ES (Figure 7). The spatial patterns of the annual calorie production rates differed from those of chlorophyll a concentrations (Figure 2) and the calorie contents in the four seas (Figure 5). Notably, a significantly high-calorie production rate was observed in the southwestern part of the ES, specifically in the Ulleung Basin (UB). The UB is known as a biological hotspot in the ES, characterized by high primary productivity in the water column [64] and active biogeochemical processes in the sediment [65]. The overall annual calorie production rates were estimated at 843, 964, 403, and 1705 Kcal m−2 y−1 in the YS, SS, ECS, and ES, respectively. These values represent the number of calories produced by phytoplankton per square meter through photosynthesis within the euphotic layers in each region on an annual basis. The annual calorie production rate was significantly lower in the ECS compared to the other three seas (one-way ANOVA, p < 0.01), while it was substantially higher in the ES compared to the other three seas, considering that the annual primary production in the ES was slightly higher than in the other three seas [37]. To assess the energy efficiencies of phytoplankton among the four seas, the relationships between daily primary production and daily calorie production were compared (Figure 8). A significantly higher energy efficiency of phytoplankton was observed in the ES compared to the other three seas (one-way ANOVA, p < 0.01), as supported by previous studies. The ES is known for its high productivity sustained by dynamic physical environments such as coastal upwellings, eddies, and sub-polar fronts ([66]; references therein) Phytoplankton in the ES demonstrated the ability to produce more calories per carbon compared to the other seas, indicating greater energy efficiency. The turnover rates of calorie contents, which reflect the rate at which energy is recycled within phytoplankton, were found to be significantly faster in the ES (13.3 days) compared to the YS (24.3 days), SS (20.9 days), and ECS (29.8 days) (one-way ANOVA, p < 0.01). This faster turnover rate in the ES could explain the higher energy efficiency observed in its phytoplankton community; however, some caution should be considered when comparing the regional calorie production rates due to several factors. The measurements in this study were conducted in a single year, 2018, and the estimated annual calorie production rates in the YS, SS, ECS, and ES from this study may be lower than those in other years due to lower annual primary productivity in 2018 [37]. Furthermore, the phytoplankton communities in each region may have been in different developmental phases during sampling. Therefore, any regional comparison of the annual calorie production rates derived from this study should be approached with caution. Overall, this study highlights the higher energy efficiency of phytoplankton in the ES and emphasizes the need to consider various factors, such as turnover rates and temporal variations, when comparing calorie production rates across different marine regions.

4. Summary and Conclusions

In this study, we investigated spatio-temporal variations in chlorophyll a concentrations, macromolecular compositions, and calorie contents in the YS, SS, ECS, and ES. We estimated the daily and annual calorie production rates in these regions based on our findings.
The seasonal patterns of chlorophyll a concentration and FM varied among the seas during the study period. A noteworthy characteristic was the highest FM observed in the ES during winter, which requires further investigation.
Carbohydrates were identified as the dominant biomolecular compound throughout the seasons followed by lipids consistently across all seas. This finding aligns with previous studies in Korean environments. However, the dominance of carbohydrates cannot be solely attributed to a single factor such as diatom composition or nutrient conditions.
The regional calorie contents were significantly lower in the ECS but similar in the other three regions. In contrast, the annual calorie production rates exhibited a different pattern with notably higher rates in the ES and lower rates in the ECS compared to the other seas. The higher energy efficiency of phytoplankton and faster turnover rate of calorie content likely contribute to the higher annual calorie production rate in the ES.
The seasonal variation in the total primary production of phytoplankton is primarily influenced by their biomass, particularly the contribution of micro phytoplankton in each region. Under warming climate scenarios, pico phytoplankton (<2 µm) could become dominant [67,68]. Recent studies have shown that small phytoplankton play a significant role in the primary production and phytoplankton communities in the YS and ES [36,66,69,70]. The shift in dominant phytoplankton species, such as from diatoms to small-sized non-diatoms in the YS under the phosphate-limited conditions [37,70,71,72,73], further highlights the need to study energy budget and calorie production rates in shifting phytoplankton communities.
Traditionally, the primary productivity of phytoplankton has been used to assess the amount of organic carbon available as a food source and indicates the trophic status and physiological condition of the phytoplankton in marine ecosystems [61,74,75,76,77]. In this study, we introduce a new approach for estimating calorie production rates via photosynthesis, considering calorie-based energy rather than carbon-based ones. This approach provides valuable insights into the potential energy available for grazers at a given location; furthermore, the energy efficiency of phytoplankton—based on calorie production rates (fixing calories) and primary production (synthesizing organic carbon)—can serve as an alternative indicator for assessing phytoplankton physiology and the trophic condition of marine ecosystems.

Supplementary Materials

The following supporting information can be downloaded at: https://www.mdpi.com/article/10.3390/w15132489/s1, Table S1: Biochemical concentration integrated within euphotic water column at each station in the Yellow Sea, 2018; Table S2: Biochemical concentration integrated within euphotic water column at each station in the South Sea of Korea, 2018; Table S3: Biochemical concentration integrated within euphotic water column at each station in the East China Sea, 2018; Table S4: Biochemical concentration integrated within euphotic water column at each station in the East Sea, 2018.

Author Contributions

Conceptualization, H.-K.J., S.-H.Y., H.J. and S.-H.L.; methodology, H.-K.J., J.-J.K. and S.P.; validation, H.-K.J., S.-H.Y. and S.-H.L.; formal analysis, H.-K.J.; investigation, H.-K.J., J.-J.K., J.-H.L., D.L., N.J., Y.K., K.K., M.-J.K., J.K. (Jaehong Kim) and J.K. (Jaesoon Kim); data curation, H.-K.J.; writing—original draft preparation, H.-K.J.; writing—review and editing, J.-J.K., S.-H.A. and S.-H.L.; visualization, H.-K.J.; supervision, S.-H.L.; project administration, S.-H.Y. and H.J.; funding acquisition, S.-H.Y. and S.-H.L. All authors have read and agreed to the published version of the manuscript.

Funding

This research was supported by the “Development of assessment technology on the structure variations in marine ecosystem (R2023056)” from the National Institute of Fisheries Science (NIFS) funded by the Ministry of Oceans and Fisheries, Republic of Korea. This research was also partly supported by Korea Institute of Marine Science & Technology (KIMST) funded by the Ministry of Oceans and Fisheries (RS-2023-00256330, Development of risk managing technology tackling ocean and fisheries crisis around Korean Peninsula by Kuroshio Current).

Data Availability Statement

Not applicable.

Acknowledgments

We appreciate the captains and crew of R/V Tamgu three and eight for their assistance in collecting our samples. We would also like to thank the researchers in the NIFS for their assistance with sample analysis. Especially, we also would like to express our sincere gratitude to the anonymous reviewers for their invaluable comments and suggestions on the previous version of this paper.

Conflicts of Interest

The authors declare no conflict of interest.

References

  1. Liebezeit, G. Particulate carbohydrates in relation to phytoplankton in the euphotic zone of the Bransfield Strait. Polar Biol. 1984, 2, 225–228. [Google Scholar] [CrossRef]
  2. Moal, J.; Martin-Jezequel, V.; Harris, R.P.; Samain, J.F.; Poulet, S.A. Interspecific and intraspecific variability of the chemical composition of marine phytoplankton. Oceanol. Acta 1987, 10, 339–346. [Google Scholar]
  3. Fernández-Reiriz, M.J.; Perez-Camacho, A.; Ferreiro, M.J.; Blanco, J.; Planas, M.; Campos, M.J.; Labarta, U. Biomass production and variation in the biochemical profile (total protein, carbohydrates, RNA, lipids and fatty acids) of seven species of marine microalgae. Aquaculture 1989, 83, 17–37. [Google Scholar] [CrossRef]
  4. Finkel, Z.V.; Follows, M.J.; Liefer, J.D.; Brown, C.M.; Benner, I.; Irwin, A.J. Phylogenetic diversity in the macromolecular composition of microalgae. PLoS ONE 2016, 11, e0155977. [Google Scholar] [CrossRef] [Green Version]
  5. Morris, I. Photosynthetic products, physiological state, and phytoplankton growth. Can. Bull. Fish. Aquat. Sci. 1981, 210, 83–102. [Google Scholar]
  6. Parrish, C.C. Time series of particulate and dissolved lipid classes during spring phytoplankton blooms in Bedford Basin, a marine inlet. Mar. Ecol. Prog. Ser. 1987, 35, 129–139. [Google Scholar] [CrossRef]
  7. Van Oijen, T.; Van Leeuwe, M.A.; Gieskes, W.W.C.; De Baar, H.J.W. Effects of iron limitation on photosynthesis and carbohydrate metabolism in the Antarctic diatom Chaetoceros brevis (Bacillariophyceae). Eur. J. Phycol. 2004, 39, 161–171. [Google Scholar] [CrossRef] [Green Version]
  8. Duncan, R.J.; Petrou, K. Biomolecular composition of sea ice microalgae and its influence on marine biogeochemical cycling and carbon Transfer through polar marine food webs. Geoscience 2022, 12, 38. [Google Scholar] [CrossRef]
  9. Kim, B.K.; Lee, S.H.; Ha, S.Y.; Jung, J.; Kim, T.W.; Yang, E.J.; Jo, N.; Lim, Y.J.; Park, J.; Lee, S.H. Vertical distributions of macromolecular composition of particulate organic matter in the water column of the Amundsen Sea Polynya during the summer in 2014. J. Geophys. Res. Ocean 2018, 123, 1393–1405. [Google Scholar] [CrossRef]
  10. Lee, S.H.; Whitledge, T.E.; Kang, S.-H. Carbon uptake rates of sea ice algae and phytoplankton under different light intensities in a landfast sea ice zone, Barrow, Alaska. Arctic 2008, 61, 281–291. [Google Scholar] [CrossRef] [Green Version]
  11. Lee, J.H.; Lee, D.; Kang, J.J.; Joo, H.T.; Lee, J.H.; Lee, H.W.; Ahn, S.H.; Kang, C.K.; Lee, S.H. The effects of different environmental factors on the biochemical composition of particulate organic matter in Gwangyang Bay, South Korea. Biogeosciences 2017, 14, 1903–1917. [Google Scholar] [CrossRef] [Green Version]
  12. Lee, J.H.; Kang, J.J.; Jang, H.K.; Jo, N.; Lee, D.; Yun, M.S.; Lee, S.H. Major controlling factors for spatio-temporal variations in the macromolecular composition and primary production by phytoplankton in Garolim and Asan Bays in the Yellow Sea. Reg. Stud. Mar. Sci. 2020, 36, 101269. [Google Scholar] [CrossRef]
  13. Tanoue, E.; Handa, N. Monosaccharide composition of marine particles and sediments from the Bering Sea and northern North Pacific. Oceanol. Acta 1987, 10, 91–99. [Google Scholar]
  14. Bhosle, N.B.; Wagh, A.B. Particulate carbohydrates in the Arabian Sea. Oceanol. Acta. 1989, 12, 57–63. [Google Scholar]
  15. Myklestad, S.; Holm-Hansen, O.; Vårum, K.M.; Volcani, B.E. Rate of release of extracellular amino acids and carbohydrates from the marine diatom Chaetoceros affinis. J. Plankton Res. 1989, 11, 763–773. [Google Scholar] [CrossRef]
  16. Kang, J.J.; Joo, H.T.; Lee, J.H.; Lee, J.H.; Lee, H.W.; Lee, D.; Kang, C.K.; Yun, M.S.; Lee, S.H. Comparison of biochemical compositions of phytoplankton during spring and fall seasons in the northern East/Japan Sea. Deep. Res. Part II Top. Stud. Oceanogr. 2017, 143, 73–81. [Google Scholar] [CrossRef]
  17. Jo, N.; Kang, J.J.; Park, W.G.; Lee, B.R.; Yun, M.S.; Lee, J.H.; Kim, S.M.; Lee, D.; Joo, H.T.; Lee, J.H.; et al. Seasonal variation in the biochemical compositions of phytoplankton and zooplankton communities in the southwestern East/Japan Sea. Deep Res. Part II Top. Stud. Oceanogr. 2017, 143, 82–90. [Google Scholar] [CrossRef]
  18. Ríos, A.F.; Fraga, F.; Pérez, F.F.; Figueiras, F.G. Chemical composition of phytoplankton and particulate organic matter in the Ría de Vigo (NW Spain). Sci. Mar. 1998, 62, 257–271. [Google Scholar] [CrossRef]
  19. Mortensen, S.H.; Børsheim, K.Y.; Rainuzzo, J.; Knutsen, G. Fatty acid and elemental composition of the marine diatom Chaetoceros gracilis Schütt. Effects of silicate deprivation, temperature and light intensity. J. Exp. Mar. Biol. Ecol. 1988, 122, 173–185. [Google Scholar] [CrossRef]
  20. Morris, I.; Glover, H.E.; Yentsch, C.S. Products of photosynthesis by marine phytoplankton: The effect of environmental factors on the relative rates of protein synthesis. Mar. Biol. 1974, 27, 1–9. [Google Scholar] [CrossRef]
  21. Kowallik, W. Blue light effects on carbohydrate and protein metabolism. In Blue Light Responses: Phenomena and Occurrence in Plants; Senger, H., Ed.; CRC Press: Boca Raton, FL, USA, 1978; Volume 1, pp. 8–13. [Google Scholar]
  22. Suárez, I.; Marañón, E. Photosynthate allocation in a temperate sea over an annual cycle: The relationship between protein synthesis and phytoplankton physiological state. J. Sea Res. 2003, 50, 285–299. [Google Scholar] [CrossRef]
  23. Kilham, S.S.; Kreeger, D.A.; Goulden, C.E.; Lynn, S.G. Effects of nutrient limitation on biochemical constituents of An-kistrodesmus falcatus. Freshw. Biol. 1997, 38, 591–596. [Google Scholar] [CrossRef]
  24. Harrison, P.J.; Thompson, P.A.; Calderwood, G.S. Effects of nutrient and light limitation on the biochemical composition of phytoplankton. J. Appl. Phycol. 1990, 2, 45–56. [Google Scholar] [CrossRef]
  25. Berdalet, E.; Latasa, M.; Estrada, M. Effects of nitrogen and phosphorus starvation on nucleic acid and protein content of Heterocapsa sp. J. Plankton Res. 1994, 16, 303–316. [Google Scholar] [CrossRef] [Green Version]
  26. Chu, W.L.; Phang, S.M.; Goh, S.H. Environmental effects on growth and biochemical composition of Nitzschia inconspicua Grunow. J. Appl. Phycol. 1996, 8, 389–396. [Google Scholar] [CrossRef]
  27. Biddanda, B.; Benner, R. Carbon, nitrogen, and carbohydrate fluxes during the production of particulate and dissolved organic matter by marine phytoplankton. Limnol. Oceanogr. 1997, 42, 506–518. [Google Scholar] [CrossRef] [Green Version]
  28. Lee, S.H.; Kim, H.J.; Whitledge, T.E. High incorporation of carbon into proteins by the phytoplankton of the Bering Strait and Chukchi Sea. Cont. Shelf Res. 2009, 29, 1689–1696. [Google Scholar] [CrossRef]
  29. Kim, B.K.; Lee, J.H.; Yun, M.S.; Joo, H.T.; Song, H.J.; Yang, E.J.; Chung, K.H.; Kang, S.H.; Lee, S.H. High lipid composition of particulate organic matter in the northern Chukchi Sea, 2011. Deep. Res. Part II Top. Stud. Oceanogr. 2015, 120, 72–81. [Google Scholar] [CrossRef]
  30. Yun, M.S.; Lee, D.B.; Kim, B.K.; Kang, J.J.; Lee, J.H.; Yang, E.J.; Park, W.G.; Chung, K.H.; Lee, S.H. Comparison of phytoplankton macromolecular compositions and zooplankton proximate compositions in the northern Chukchi Sea. Deep. Res. Part II Top. Stud. Oceanogr. 2015, 120, 82–90. [Google Scholar] [CrossRef]
  31. Jo, N.; La, H.S.; Kim, J.H.; Kim, K.; Kim, B.K.; Kim, M.J.; Son, W.; Lee, S.H. Different biochemical compositions of particulate organic matter driven by major phytoplankton communities in the northwestern Ross Sea. Front. Microbiol. 2021, 12, 623600. [Google Scholar] [CrossRef]
  32. Bhavya, P.S.; Kim, B.K.; Jo, N.; Kim, K.; Kang, J.J.; Lee, J.H.; Lee, D.; Lee, J.H.; Joo, H.T.; Ahn, S.H.; et al. A review on the macromolecular compositions of phytoplankton and the implications for aquatic biogeochemistry. Ocean Sci. J. 2019, 54, 1–14. [Google Scholar] [CrossRef]
  33. Platt, T.; Irwin, B. Caloric content of phytoplankton. Limnol. Oceanogr. 1973, 18, 306–310. [Google Scholar] [CrossRef]
  34. Fabiano, M.; Povero, P.; Danovaro, R. Distribution and composition of particulate organic matter in the Ross Sea (Antarctica). Polar Biol. 1993, 3, 525–533. [Google Scholar] [CrossRef]
  35. Danovaro, R.; Fabiano, M. Seasonal changes in quality and quantity of food available for benthic suspension-feeders in the Golfo Marconi (North-western Mediterranean). Estuar. Coast. Shelf Sci. 1997, 44, 723–736. [Google Scholar] [CrossRef]
  36. Kang, J.J.; Jang, H.K.; Lim, J.H.; Lee, D.; Lee, J.H.; Bae, H.; Lee, C.H.; Kang, C.K.; Lee, S.H. Characteristics of different size phytoplankton for primary production and biochemical compositions in the western East/Japan Sea. Front. Microbiol. 2020, 11, 560102. [Google Scholar] [CrossRef]
  37. Jang, H.K.; Youn, S.H.; Joo, H.; Kim, Y.; Kang, J.J.; Lee, D.; Jo, N.; Kim, K.; Kim, M.J.; Kim, S.; et al. First concurrent measurement of primary production in the Yellow Sea, the South Sea of Korea, and the East/Japan Sea, 2018. J. Mar. Sci. Eng. 2021, 9, 1237. [Google Scholar] [CrossRef]
  38. Parsons, T.R.; Maita, Y.; Lalli, C.M. A manual of chemical & biological methods for seawater analysis. Mar. Pollut. Bull. 1984, 15, 419–420. [Google Scholar]
  39. Lee, J.H.; Lee, W.C.; Kim, H.C.; Jo, N.; Kim, K.; Lee, D.; Kang, J.J.; Sim, B.R.; Kwon, J., II; Lee, S.H. Temporal and spatial variations of the biochemical composition of phytoplankton and potential food material (FM) in Jaran Bay, South Korea. Water 2020, 12, 3093. [Google Scholar] [CrossRef]
  40. Dubois, M.; Gilles, K.A.; Hamilton, J.K.; Rebers, P.A.; Smith, F. Colorimetric method for determination of sugars and related substances. Anal. Chem. 1956, 28, 350–356. [Google Scholar] [CrossRef]
  41. Lowry, O.H.; Roserough, N.J.; Farr, A.L.; Randall, R.J. Protein measurement with the Folin phenol reagent. J. Biol. Chem. 1951, 193, 265–275. [Google Scholar] [CrossRef]
  42. Fiset, C.; Liefer, J.; Irwin, A.J.; Finkel, Z.V. Methodological biases in estimates of macroalgal macromolecular composition. Limnol. Oceanogr. Methods 2017, 15, 618–630. [Google Scholar] [CrossRef]
  43. Bligh, E.G.; Dyer, W.J. A rapid method of total lipid extraction and purification. Can. J. Biochem. Physiol. 1959, 37, 911–917. [Google Scholar] [CrossRef] [PubMed]
  44. Marsh, J.B.; Weinstein, D.B. Simple charring method for determination of lipids. J. Lipid Res. 1966, 7, 574–576. [Google Scholar] [CrossRef]
  45. Winberg, G.G. Symbols, Units and Conversion Factors in Study of Fresh Waters Productivity; International Biological Programme: London, UK, 1971; p. 23. [Google Scholar]
  46. Yamada, K.; Ishizaka, J.; Yoo, S.; Kim, H.-C.; Chiba, S. Seasonal and interannual variability of sea surface chlorophyll a con-centration in the Japan/East Sea (JES). Prog. Oceanogr. 2004, 61, 193–211. [Google Scholar] [CrossRef]
  47. Lee, S.H.; Son, S.; Dahms, H.-U.; Park, J.W.; Lim, J.-H.; Noh, J.H.; Joo, H.T.; Jeong, J.Y.; Kang, C.K. Decadal changes of phytoplankton chlorophyll-a in the East Sea/Sea of Japan. Oceanology 2014, 54, 771–779. [Google Scholar] [CrossRef]
  48. Chang, K.I.; Zhang, C.I.; Park, C.; Kang, D.J.; Ju, S.J.; Lee, S.H.; Wimbush, M. (Eds.) Oceanography of the East Sea (Japan Sea); Springer International Publishing: Cham, Switzerland, 2016; ISBN 978-3-319-22719-1. [Google Scholar]
  49. Wang, Y.; Gao, Z. Contrasting chlorophyll-a seasonal patterns between nearshore and offshore waters in the Bohai and Yellow Seas, China: A new analysis using improved satellite data. Cont. Shelf Res. 2020, 203, 104173. [Google Scholar] [CrossRef]
  50. Kim, Y.; Youn, S.H.; Oh, H.J.; Joo, H.; Jang, H.K.; Kang, J.J.; Lee, D.; Jo, N.; Kim, K.; Park, S.; et al. Seasonal compositions of size-fractionated surface phytoplankton communities in the Yellow Sea. J. Mar. Sci. Eng. 2022, 10, 1087. [Google Scholar] [CrossRef]
  51. Wie, J.; Moon, B.-K.; Hyun, Y.-K.; Lee, J. Impact of local atmospheric circulation and sea surface temperature of the East Sea (Sea of Japan) on heat waves over the Korean Peninsula. Theor. Appl. Climatol. 2021, 144, 431–446. [Google Scholar] [CrossRef]
  52. Ahn, S.H.; Whitledge, T.E.; Stockwell, D.A.; Lee, J.H.; Lee, H.W.; Lee, S.H. The biochemical composition of phytoplankton in the Laptev and East Siberian seas during the summer of 2013. Polar Biol. 2019, 42, 133–148. [Google Scholar] [CrossRef]
  53. Fogg, G.E.; Thake, B. Algal Cultures and Phytoplankton Ecology; University of Wisconsin Press: Madison, WI, USA, 1987. [Google Scholar]
  54. DiTullio, G.R.; Laws, E.A. Diel periodicity of nitrogen and carbon assimilation in five species of marine phytoplankton: Accuracy of methodology for predicting N-assimilation rates and N/C composition ratios. Mar. Ecol. Prog. Ser. 1986, 32, 123–132. [Google Scholar] [CrossRef]
  55. Palmisano, A.C.; Lizotte, M.P.; Smith, G.A.; Nichols, P.D.; White, D.C.; Sullivan, C.W. Changes in photosynthetic carbon assimilation in Antarctic sea-ice diatoms during spring bloom: Variation in synthesis of lipid classes. J. Exp. Mar. Biol. Ecol. 1988, 116, 1–13. [Google Scholar] [CrossRef]
  56. Moon, C.-H.; Choi, H.-J. Studies on the environmental characteristics and phytoplankton community in the Nakdong River estuary. J. Oceanogr Soc. Korea 1991, 26, 144–154. [Google Scholar]
  57. Myklestad, S. Production of carbohydrates by marine planktonic diatoms. I. Comparison of nine different species in culture. J. Exp. Mar. Bio. Ecol. 1974, 15, 261–274. [Google Scholar] [CrossRef]
  58. Jo, N.; Youn, S.H.; Joo, H.T.; Jang, H.K.; Kim, Y.; Park, S.; Kim, J.; Kim, K.; Kang, J.J.; Lee, S.H. Seasonal variations in biochemical (biomolecular and amino Acid) compositions and protein quality of particulate organic matter in the southwestern East/Japan Sea. Front. Mar. Sci. 2022, 9, 979137. [Google Scholar] [CrossRef]
  59. Navarro, J.M.; Clasing, E.; Urrutia, G.; Asencio, G.; Stead, R.; Herrera, C. Biochemical composition and nutritive value of suspended particulate matter over a tidal flat of southern Chile. Estuar. Coast. Shelf Sci. 1993, 37, 59–73. [Google Scholar] [CrossRef]
  60. Danovaro, R.; Dell’anno, A.; Pusceddu, A.; Marrale, D.; Croce, N.D.; Fabiano, M.; Tselepides, A. Biochemical composition of pico-, nano- and micro-particulate organic matter and bacterioplankton biomass in the oligotrophic Cretan Sea (NE Mediterranean). Prog. Oceanogr. 2000, 46, 279–310. [Google Scholar] [CrossRef]
  61. Lee, S.H.; Yun, M.S.; Kim, B.K.; Joo, H.; Kang, S.H.; Kang, C.K.; Whitledge, T.E. Contribution of small phytoplankton to total primary production in the Chukchi Sea. Cont. Shelf Res. 2013, 68, 43–50. [Google Scholar] [CrossRef]
  62. Lim, Y.J.; Kim, T.W.; Lee, S.; Lee, D.; Park, J.; Kim, B.K.; Kim, K.; Jang, H.K.; Bhavya, P.S.; Lee, S.H. Seasonal variations in the small phytoplankton contribution to the total primary production in the Amundsen Sea, Antarctica. J. Geophys. Res. Oceans 2019, 124, 8324–8341. [Google Scholar] [CrossRef]
  63. Lee, S.H.; Yun, M.S.; Jang, H.K.; Kang, J.J.; Kim, K.; Lee, D.; Jo, N.; Park, S.H.; Lee, J.H.; Ahn, S.H.; et al. Size-differential photosynthetic traits of phytoplankton in the Chukchi Sea. Cont. Shelf Res. 2023, 255, 104933. [Google Scholar] [CrossRef]
  64. Joo, H.; Park, J.W.; Son, S.; Noh, J.H.; Jeong, J.Y.; Kwak, J.H.; Saux-Picart, S.; Choi, J.H.; Kang, C.-K.; Lee, S.H. Long-term annual primary production in the Ulleung Basin as a biological hot spot in the East/Japan Sea. J. Geophys. Res. Oceans. 2014, 119, 3002–3011. [Google Scholar] [CrossRef]
  65. Hyun, J.H.; Kim, S.H.; Mok, J.S.; Cho, H.; Lee, T.; Vandieken, V.; Thamdrup, B. Manganese and iron reduction dominate organic carbon oxidation in surface sediments of the deep Ulleung Basin, East Sea. Biogeoscience 2017, 14, 941–958. [Google Scholar] [CrossRef] [Green Version]
  66. Lee, S.H.; Joo, H.T.; Lee, J.H.; Lee, J.H.; Kang, J.J.; Lee, H.W.; Lee, D.; Kang, C.K. Seasonal carbon uptake rates of phytoplankton in the northern East/Japan Sea. Deep. Res. Part II Top. Stud. Oceanogr. 2017, 143, 45–53. [Google Scholar] [CrossRef]
  67. Morán, X.A.G.; López-Urrutia, Á.; Calvo-Díaz, A.; LI, W.K.W. Increasing importance of small phytoplankton in a warmer ocean. Glob. Chang. Biol. 2010, 16, 1137–1144. [Google Scholar] [CrossRef]
  68. Mousing, E.A.; Ellegaard, M.; Richardson, K. Global patterns in phytoplankton community size structure-evidence for a direct temperature effect. Mar. Ecol. Prog. Ser. 2014, 497, 25–38. [Google Scholar] [CrossRef] [Green Version]
  69. Joo, H.T.; Son, S.H.; Park, J.-W.; Kang, J.J.; Jeong, J.-Y.; Kwon, J.-I.; Kang, C.-K.; Lee, S.H. Small phytoplankton contribution to the total primary production in the highly productive Ulleung Basin in the East/Japan Sea. Deep. Res. Part II Top. Stud. Oceanogr. 2017, 143, 54–61. [Google Scholar] [CrossRef]
  70. Jang, H.K.; Kang, J.J.; Lee, J.H.; Kim, M.; Ahn, S.H.; Jeong, J.-Y.; Yun, M.S.; Han, I.-S.; Lee, S.H. Recent primary production and small phytoplankton contribution in the Yellow Sea during the summer in 2016. Ocean Sci. 2018, 53, 509–519. [Google Scholar] [CrossRef]
  71. Lin, C.; Ning, X.; Su, J.; Lin, Y.; Xu, B. Environmental changes and the responses of the ecosystems of the Yellow Sea during 1976–2000. J. Mar. Syst. 2005, 55, 223–234. [Google Scholar] [CrossRef]
  72. Fang, T.; Li, D.; Yu, L.; Gao, L.; Zhang, L. Effects of irradiance and phosphate on growth of nanophytoplankton and picophytoplankton. Acta Ecol. Sin. 2006, 26, 2783–2789. [Google Scholar] [CrossRef]
  73. Jin, J.; Liu, S.M.; Ren, J.L.; Liu, C.G.; Zhang, J.; Zhang, G.L. Nutrient dynamics and coupling with phytoplankton species composition during the spring blooms in the Yellow Sea. Deep. Res. Part II Top. Stud. Oceanogr. 2013, 97, 16–32. [Google Scholar] [CrossRef]
  74. Taniguchi, A. Geographical variation of primary production in the Western Pacific Ocean and adjacent seas with reference to the inter-relations between various parameters of primary production. Mem. Fac. Fish. Hokkaido Univ. 1972, 19, 1–33. [Google Scholar]
  75. Kwak, J.H.; Hwang, J.; Choy, E.J.; Park, H.J.; Kang, D.J.; Lee, T.; Chang, K.-I.; Kim, K.-R.; Kang, C.-K. High primary productivity and f-ratio in summer in the Ulleung Basin of the East/Japan Sea. Deep Sea Res. Part I Oceanogr. Res. Pap. 2013, 79, 74–85. [Google Scholar] [CrossRef]
  76. Lee, S.H.; Yun, M.S.; Kim, B.K.; Saitoh, S.I.; Kang, C.K.; Kang, S.-H.; Whitledge, T. Latitudinal carbon productivity in the Bering and Chukchi Seas during the summer in 2007. Cont. Shelf Res. 2013, 59, 28–36. [Google Scholar] [CrossRef]
  77. Kim, B.K.; Joo, H.; Song, H.J.; Yang, E.J.; Lee, S.H.; Hahm, D.; Rhee, T.S.; Lee, S.H. Large seasonal variation in phytoplankton production in the Amundsen Sea. Polar Biol. 2014, 38, 319–331. [Google Scholar] [CrossRef]
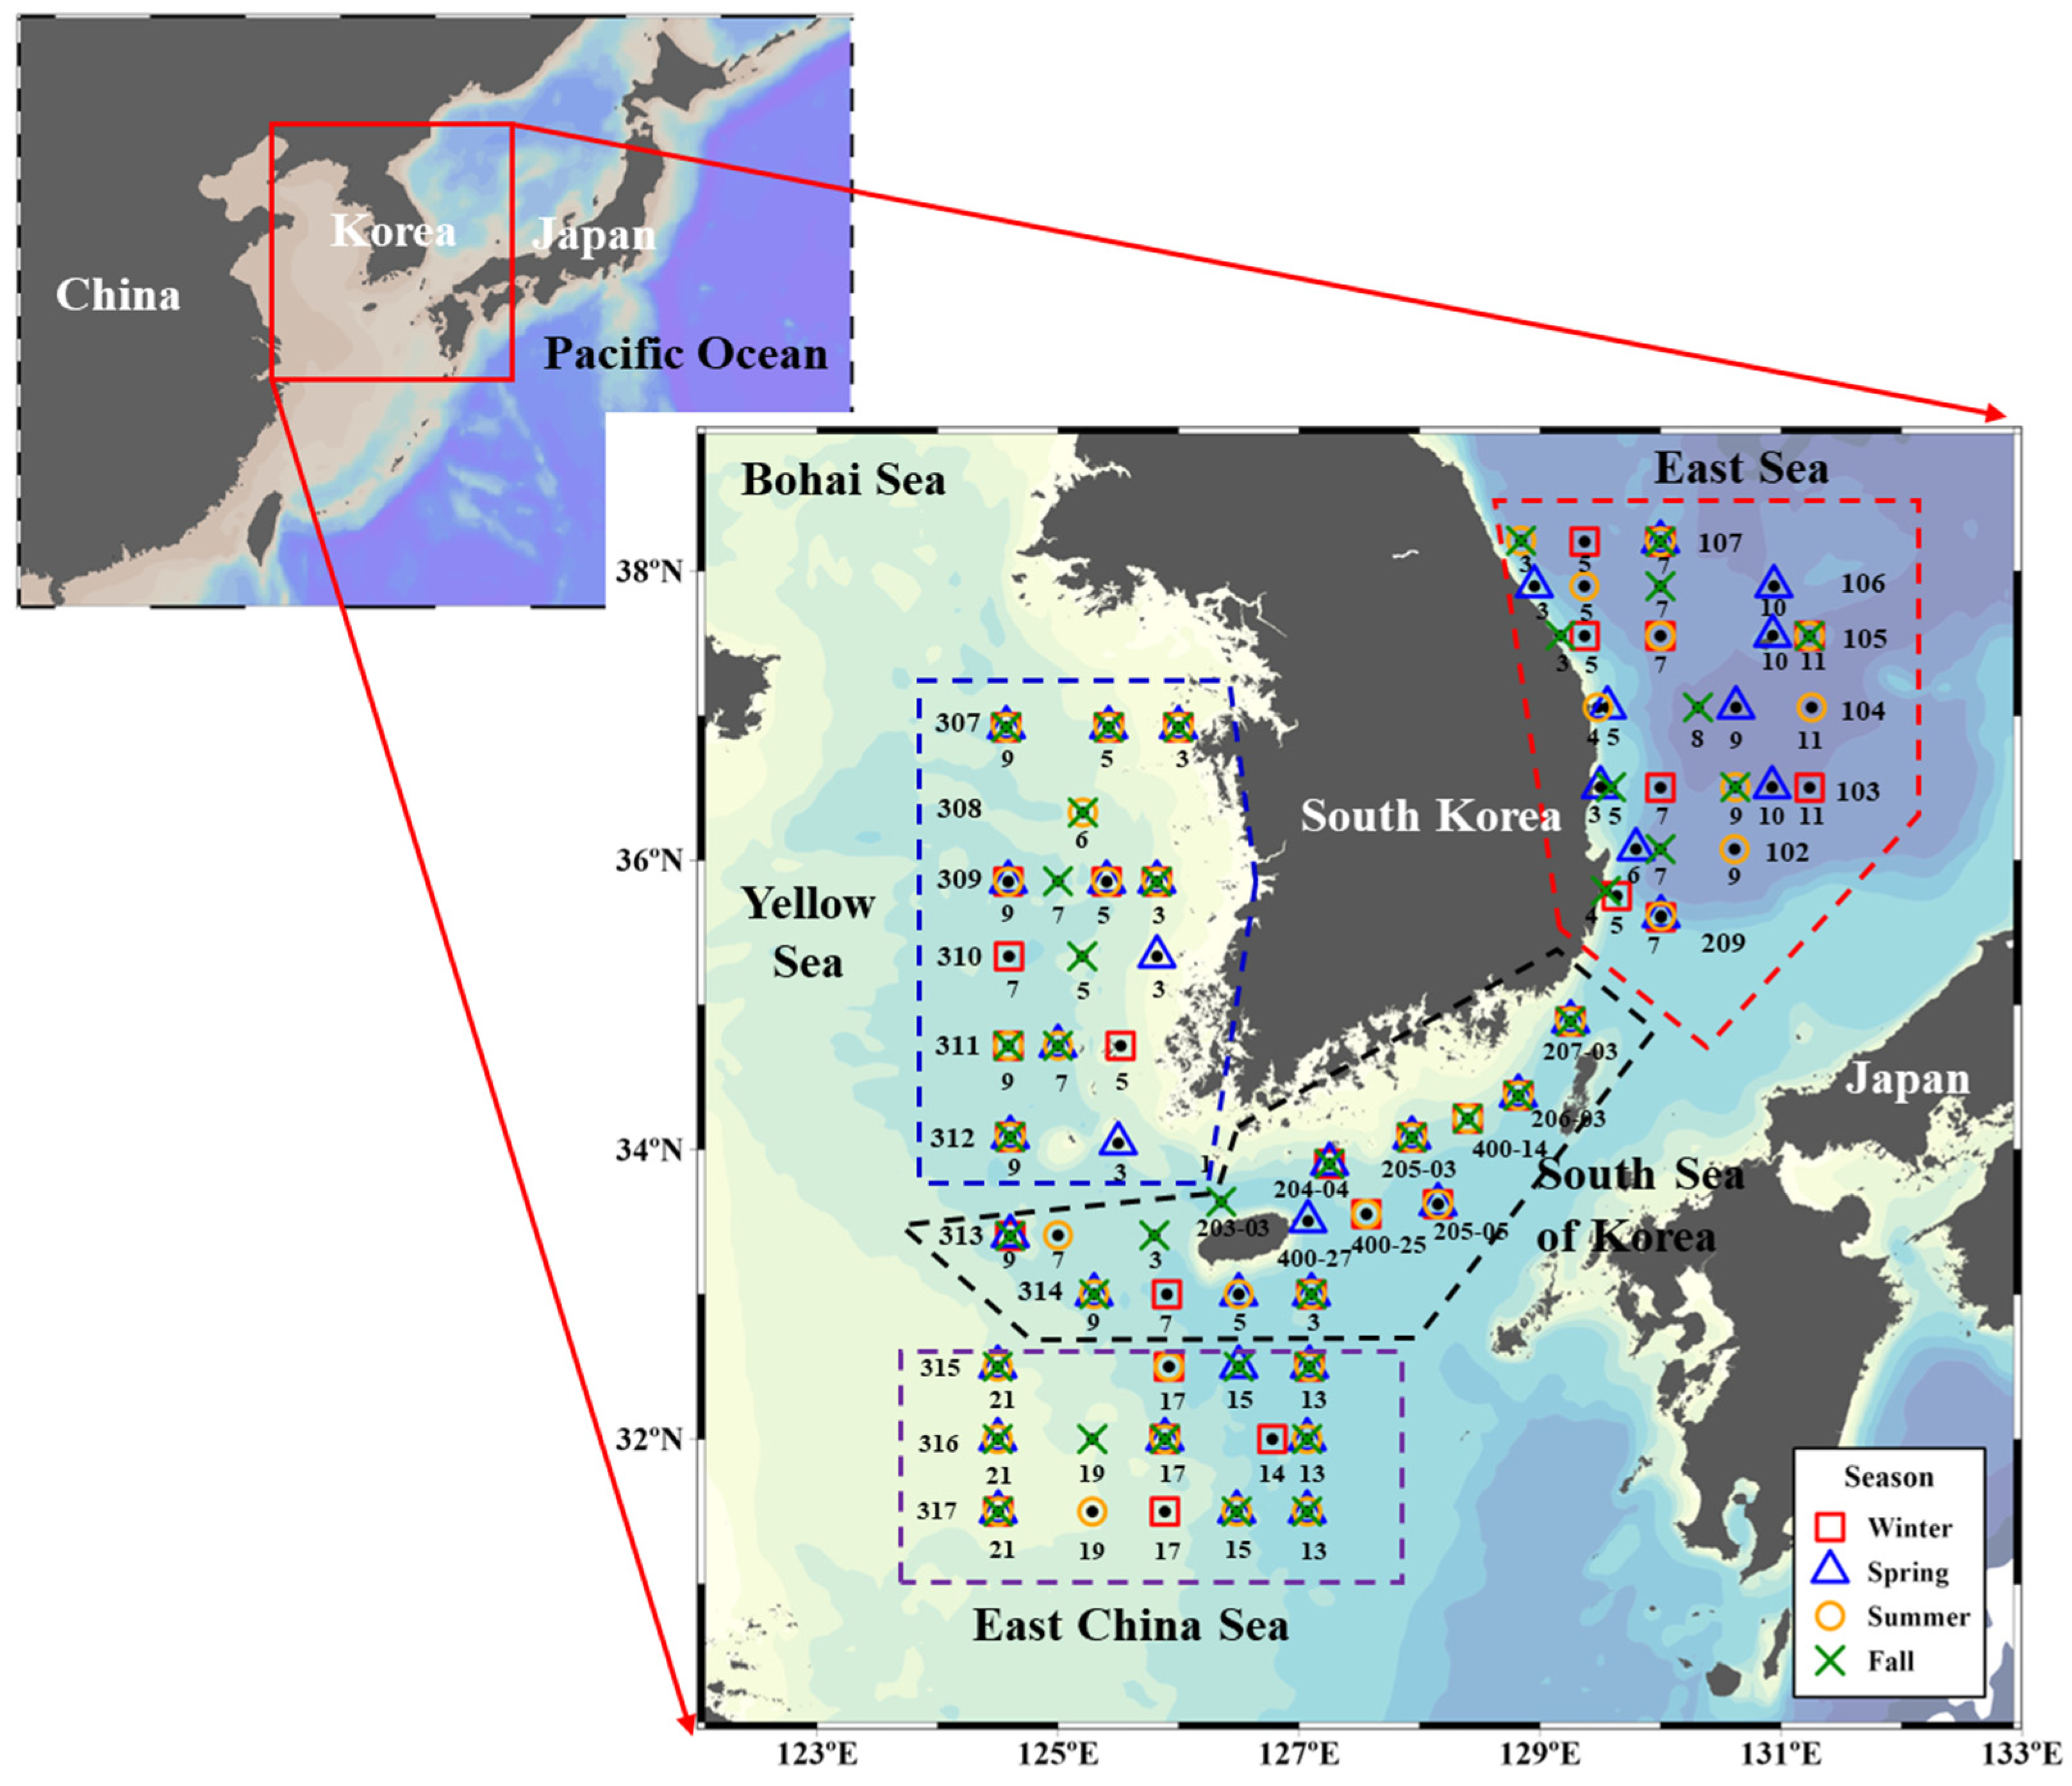
Figure 1. Sampling regions in the Yellow Sea (YS), South Sea of Korea (SS), East China Sea (ECS), and East Sea (ES), 2018. Different marks indicate actual samplings conducted seasonally at the stations.
Water 15 02489 g001
Figure 2. Euphotic water column-integrated chlorophyll a concentrations from 100% to 1% light depths in the Yellow Sea (YS), South Sea of Korea (SS), East China Sea (ECS), and East Sea (ES), 2018. The chlorophyll a data in the YS, SS, and ES are from Jang et al. [37].
Water 15 02489 g002
Figure 3. Seasonal and spatial distributions of three macromolecular compositions within euphotic water column from 100% to 1% light depths in the Yellow Sea (YS), South Sea of Korea (SS), East China Sea (ECS), and East Sea (ES), 2018.
Water 15 02489 g003
Figure 4. Seasonal distribution of euphotic water column-integrated calorie contents in the Yellow Sea (YS), South Sea of Korea (SS), East China Sea (ECS), and East Sea (ES), 2018.
Water 15 02489 g004
Figure 5. Spatial variation in annually averaged calorie contents in the Yellow Sea (YS), South Sea of Korea (SS), East China Sea (ECS), and East Sea (ES), 2018.
Water 15 02489 g005
Figure 6. Regional comparison of seasonal calorie content per unit of particulate organic carbon (POC) in the Yellow Sea (YS), South Sea of Korea (SS), East China Sea (ECS), and East Sea (ES) in 2018. Asterisk symbols (*) represent outliers.
Water 15 02489 g006
Figure 7. Spatial distribution of annual calorie production rates in the Yellow Sea (YS), South Sea of Korea (SS), East China Sea (ECS), and East Sea (ES) in 2018.
Water 15 02489 g007
Figure 8. Correlations between daily primary production rates and daily calorie production rates in the Yellow Sea (YS), South Sea of Korea (SS), East China Sea (ECS), and East Sea (ES) in 2018.
Water 15 02489 g008
Table 1. Regional comparison of biochemical concentrations, FM, and calorie contents in Korean seas and bays. FM represents the sum of carbohydrates, proteins, and lipids.
LocationPeriodCarbohydrates
(mg m−3)
Proteins
(mg m−3)
Lipids
(mg m−3)
FM
(mg m−3)
Calorie Content (Kcal m−3)References
East SeaSouthwestern part2014
(Apr.–Nov.)
199 ± 9385 ± 5990 ± 36 [17]
Northern part2012
(Oct.)
41–86
(67 ± 16)
40–122
(66 ± 23)
80–136
(95 ± 17)
170–340
(230 ± 50)
1–2
(2 ± 0.3)
[16]
2015
(May)
97–313
(150 ± 64)
52–106
(75 ± 18)
38–125
(60 ± 27)
194–542
(284 ± 98)
1–3
(2 ± 0.5)
Ulleung Basin2016
(Apr.)
72–215
(151 ± 54)
41–92
(66 ± 18)
91–189
(123 ± 33)
232–401
(340 ± 61)
1.6–2.4
(2 ± 0.3)
[36]
Northwestern part89–191
(139 ± 34)
42–143
(80 ± 31)
92–284
(203 ± 56)
309–594
(422 ± 81)
2–4
(3 ± 1)
Korean BayGwangyang bay2012 (Apr.)–2013 (Apr.)14–412
(130 ± 87)
23–382
(155 ± 73)
21–401
(155 ± 79)
171–916
(435 ± 176)
1–6
(3 ± 1)
[11]
Garolim and Asan bay2015 (Apr.)–2016 (Nov.)232–703
(455 ± 134)
11–379
(150 ± 87)
42–457
(177 ± 103)
351–1270
(781 ± 238)
2–8
(4 ± 2)
[12]
Jaran bay2016 (Monthly)145–269
(210 ± 42)
41–202
(90 ± 50)
85–158
(111 ± 24)
297–630
(111 ± 24)
1.7–3.7
(2.4 ± 0.5)
[39]
Korean SeasYellow Sea2018
(Feb., Apr., Aug., and Oct.)
73–522
(201 ± 77)
17–212
(59 ± 43)
77–244
(111 ± 36)
266–923
(372 ± 128)
2–5(2 ± 0.7)This study
South Sea67–401
(162 ± 76)
0–98
(34 ± 29)
36–230
(88 ± 33)
173–549
(284 ± 96)
1–3
(2 ± 0.5)
East Sea60–254
(112 ± 38)
3–147
(44 ± 35)
44–158
(88 ± 30)
131–472
(244 ± 78)
1–3
(2 ± 0.5)
East China Sea2018
(Feb., May, Aug., and Nov.)
78–499
(164 ± 77)
1–138
(40 ± 29)
41–194
(85 ± 33)
144–552
(288 ± 101)
1–4
(2 ± 0.6)
Disclaimer/Publisher’s Note: The statements, opinions and data contained in all publications are solely those of the individual author(s) and contributor(s) and not of MDPI and/or the editor(s). MDPI and/or the editor(s) disclaim responsibility for any injury to people or property resulting from any ideas, methods, instructions or products referred to in the content.