Abstract
The potable water in residential hydraulic networks is measured using volumetric meters. However, when the water carries air bubbles or pockets through the pipes, the accuracy of the meter readings is reduced, which can negatively impact the billing that users pay for their water consumption. A check valve accessory exists that reduces the size of these air bubbles to correct the meter readings and improve the service experience. However, the device has only been tested for networks with relative pressures higher than 275.79 kPa. This research proposes to characterize the hydraulic behavior of the accessory through an experimental procedure in which the operating conditions are similar to those found in water networks in Latin America, where the networks have relative pressures lower than 275.79 kPa. The study found that the accessory significantly reduces the coefficient of loss for velocities greater than 1 m/s. The use of the device is suggested in flow regimes with Reynolds numbers close to 20,000 for operating conditions of temperatures close to 25 °C and residential pipes with an internal diameter of 20.9 mm and a flow velocity between 1.3 m/s and 1.78 m/s. This condition allows it to operate with minimal local energy loss and a low coefficient of loss, providing an improved service experience.
1. Introduction
The supply of water has been decisive for the cultural and economic development of human societies [1]. The correct measurement of drinking water consumption is important for both the client and the provider from the point of view of the service experience and the evaluation of leaks in the networks [2,3]. The measuring instrument used to read residential water consumption is of the volumetric meter type [4,5]. However, this equipment loses precision in the readings if there are bubbles and air pockets in the pipes [6]. A reliable way to avoid these inherent effects in the distribution of drinking water is through the incorporation of a check valve that reduces the size of the air bubbles that pass through the meter and that tend to impact the water supply utility billing. This component has been studied computationally and through statistical experimentation techniques [7,8]. It has been reported that its benefit in correcting the measurement of water consumption tends to be significant for networks with relative pressures higher than 275.79 kPa [9]. Due to the existing benefits, it is thought that by hydraulically characterizing this equipment there would be possibilities for contemplating adaptation alternatives in drinking water distribution networks in developing countries, where residential water distribution pressures are low [10,11]. With this alternative, it would be expected that customers have a chance to pay bills for water consumption according to their actual consumption and not the consumption that the volumetric meter registers when water and air flow through the pipes [12]. An analysis that could be used to characterize this hydraulic accessory would be to estimate the pressure drop and its coefficient of loss [13,14] with working gauge pressures not exceeding 275.79 kPa. In this way, if the loss coefficient could be known for a range of home flows in low-pressure networks, this information could serve as technical input for planning urban water infrastructure projects with low-pressure networks such as those located in developing countries and thus adapt these devices in future housing constructions such as those supported by smart city models [15,16]. Therefore, estimating the loss coefficient could be useful to project the energy requirement of pumping systems capable of supplying the precious liquid to home networks with this adapted system. Various studies have been carried out to analyze the energy loss and pressure drop of valves used in pipe hydraulics by computational, experimental, or theoretical–experimental means to establish improvements in their operation. Zhao et al. [17] modeled, using computational fluid dynamics tools and experimental studies, the effect of cavitation over a flow-regulating valve. Their studies defined correlations such as pressure drop, opening percentage, cavitation influence percentage, and discharge coefficient. Gan et al. [18] evaluated the pressure drop of a labyrinth valve by computational means to reduce its noise generation depending on the quality of the mesh, the type of mesh, and the flow rate, consequently, Go et al. validated the results of Gan et al. with an experimental approach [19]. Santos et al. [20] studied, using computational tools, the effect of a valve on the airflow in the intake system of a diesel engine. In this study, they related flow speeds with the generation of vortices and how this hydraulic phenomenon influences the mobility of the valve inside the equipment. Benbella [21] experimentally studied the loss coefficient of a relief valve used in a nuclear power plant for gas–liquid two-phase flow. In this study, the Darcy equation and the collection of experimental data were used to estimate, through correlations, the coefficient of loss and the pressure drop of the flow. Iravani and Toghraie [22] designed a high-pressure test to investigate the performance of a ball valve used in compressible flow. The impact of the flow rate and valve opening percentage on the flow coefficient and loss coefficient was studied. In their conclusions, they highlighted the inverse relationship between the valve pressure drop and the loss coefficient of this device. Yu et al. [23] used theoretical–experimental studies to characterize and improve the behavior of a ball valve considering the hydraulic and structural aspects of the component. Regarding its pressure drop, a decrease in this indicator was observed as the percentage of opening in the ball valve increased. Zhao et al. [24] studied, through numerical simulation and experimental tests, the pressure drops in the section of a hydraulic oscillator valve. The hydraulic behavior of the valve was compared as a function of the position of the hydraulic oscillator and a study was carried out in a transitory state on the behavior of the pressure drop of the device as a function of time. The experimental investigations reported in the literature for estimating the loss coefficient in hydraulic elements suggest using curve fittings of experimental data through correlations between the loss factor or pressure drop and the fluid flow velocity [25,26,27]. Khayat and Afarideh [28] studied, with CFD tools, the behavior of a venturi tube as a flow meter in applications for the transport of liquid and gaseous non-Newtonian fluids. The results suggest that the discharge coefficient of this device increases with increasing flow velocity and decreases with the volume fraction of gas. The pressure drop of the equipment strongly depends on the viscosity and rheological conditions of the liquid. The main objective of this study is to characterize, by experimental means, the behavior of this hydraulic accessory for network gauge pressures below 275.79 kPa by measuring variables such as flow velocity, minor losses in the accessory, and the pressure drop in bench flows with and without this studied valve. This equipment has proven its effectiveness in correcting the reading of volumetric meters for network gauge pressures greater than 275.79 kPa. The novelty proposed in this research is in the data taken from equipment operating under simulated conditions of the relative pressures of water distribution in developing countries. It is expected that these results can be considered a starting point in the redesign of this equipment for low-pressure residential hydraulic networks commonly found in Latin America, and users can finally receive these benefits in their drinking water consumption bills. With this hydraulic characterization, it is expected to establish the trends of the coefficient of losses and their respective pressure drops from a range of velocities found in pipe networks with low pressures. The laboratory-scale simulation of the hydraulics of this check valve is carried out only with water. The impact of the air trapped in the pipe is not considered in this investigation because what is desired is to analyze how this device responds during its operation while water flows through it, which is the public service that customers access through the network pipeline. The structure of the article is as follows: Section 2 describes the methodology and planning of the experiment design, Section 3 presents the results and discussion of this research, and Section 4 contains the main conclusions of this work.
2. Materials and Methods
Figure 1 proposes a scheme to measure the loss coefficient of the check valve considering the approach of similar studies to evaluate this characteristic in valves of another type or hydraulic accessories for the control and transport of fluids [17,23,29]. Considering that the flow circulates between points 1 and 2, the hydraulic energy loss that the fluid current would have in that area is
where:
- : One-dimensional energy loss in a check valve (m).
- : Pressure measured by a manometer upstream of the valve (kPa).
- : Pressure measured by a manometer downstream of the valve (kPa).
- : Specific weight of the fluid flowing through the valve (kN/m3).
The energy loss of a hydraulic accessory is related to the coefficient of resistance. As suggested by Crane [29], Gabl [30], and Jianhua [31], for the analysis of pressure drops and the estimation of loss coefficients in valves, the energy loss related to the length of the pipe that connects the pressure measurement points with the accessory must be considered, as shown in Figure 1.

Figure 1.
A diagram to measure pressure drops in the check valve.
The estimated values of friction losses were considered in the region where the valve was located. For this reason, the Darcy equation was included in this study and the hydraulic loss in the bank is:
the friction or major head loss is calculated by
Therefore, the energetic losses in the pipe and check valve between points 1 and 2, are:
where
- : Local coefficient of loss of pipe fitting.
- : Flow stream velocity (m/s).
- : Gravity (m/s2).
- : Darcy friction factor.
- : Pipe length before and after the valve position between the pressure measurement points (m).
- : Internal diameter of the pipe (m).
- : Pipe cross-sectional area (m2).
- : Minor head loss (m).
- : Major head loss (m).
Considering the continuity equation for an incompressible fluid flowing through a cross-section of a pipe:
The pipe cross-sectional area as a function of the internal diameter of the pipe is:
Subsequently, by equating Equation (1) with (4) and rewriting the velocity expression as a function of Equation (5) [29,32], we obtain:
Solving for the local coefficient of valve losses [33,34,35], Equation (7), results in
The friction factor was estimated through the Swamee–Jain equation for the turbulent flow regime:
The Reynolds number was calculated for circular pipe sections as
where:
- : Absolute roughness;
- Re: Reynolds number;
- : Kinematic viscosity of water (m/s2).
2.1. Experimental Planning
Figure 2a presents the check valve of the present study through an exploded view where the components that comprise it are detailed. Figure 2b presents a scheme for the pressure readings at the points of interest in Figure 1, while Figure 2c is the experimental setup of this experiment. According to Equation (8), the loss coefficient of any hydraulic accessory located between points 1 and 2 of Figure 2b is sensitive to pressure changes generated by the device. The quadratic effects of area and discharge are related to flow dynamics. This check valve is made of ABS material for residential applications, so its absolute roughness could be considered a drawn tube for hydraulic applications. The commercial diameter of this accessory is adaptable for ϕ3/4" SCH40 nominal pipes. Since the cross-section is constant for this study, the variables that could be measured experimentally according to Equation (8) would be the pressure before and after the valve and the circulation flow rate. The section length L in Figure 2b is specified as 10 cm according to the construction of the experimental equipment. The length of the hose connecting the hydraulic bench to the system where the pressure measurements were taken before and after the check valve is 3.8 m. The coefficient of loss of the check valve is estimated through the measurement of the pressure drop and the flow rate of this device in a hydraulic bench [29,36]. For this, incremental flow and pressure measurements were made before and after the position of the check valve in the assembly of Figure 2b,c. The range of flows evaluated for the characterization of the check device was chosen based on the suggested velocities for water pipes in domestic networks in Colombia [10]. The working pressure of the system was adjusted with the help of a control valve located in the hydraulic bench so that the working pressures before the entrance to the check valve did not exceed 147 kPa to comply with the regulated home network pressures by resolution 0330 of 2017 of Colombia. The hydraulic bank used for the recirculation of water is an ARMFIELD reference F1-10. This control valve allows for regulating the water flow as a percentage, through the number of turns made by the stem of this valve. Since this experimental setup has a Blue-White industry F-2000 digital flowmeter to measure the flows, it was considered through the number of turns of the stem, the respective flow that circulated through the hydraulic bank, for the position of the valve stem. The flowmeter range is 1-760LPM, which covers the suggested flows for low-pressure potable water distribution for residential applications found in developing countries in Latin America such as Colombia, ranging from 12 LPM to 30 LPM [10,37]. The connections between the bench and the ϕ3/4″ SCH40 PVC pipe are made with a transparent hose of the same nominal diameter. To measure the pressure, two Winters brand glycerin manometers, reference PFQ903R1R11, with a range of 0–413.68 kPa (0–60 PSI) and 1.5% of the accuracy of full scale, were placed before and after the valve position. This suggests that since the maximum value of the range is 413.68 kPa (60 psi), the pressure gauge can have an accuracy of 6.2 kPa (0.9 psi) at any point on the scale. The present study reports that the output of the hydraulic bench is free to discharge in all evaluated experimental runs. Therefore, the manometer downstream (point 2, in Figure 2b) of the check valve is at a value of zero for all the observed data, considering the short stretch between the position of the manometer and the discharge of the water flow, which does not exceed 30 cm. The water was operated at a temperature of 25 °C inside the hydraulic bench. Finally, the data were collected and analyzed through the EES and Statgraphics programs to evaluate the correlation and behavior of the variables studied in this research. The data collected and the technical information of the experimental set-up can be consulted in the supplementary material of this work.
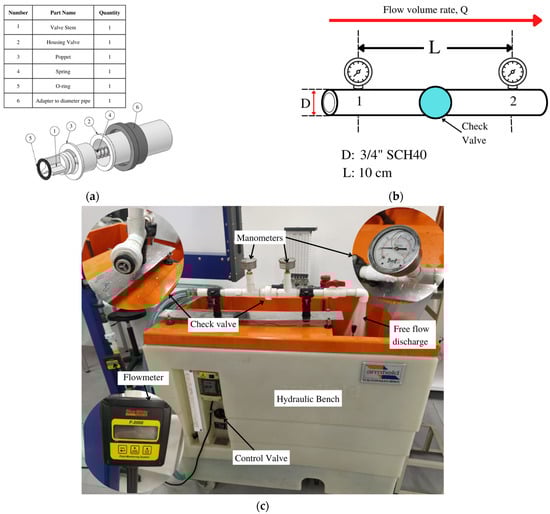
Figure 2.
Bench proposal to measure the K coefficient in the check valve. (a) Check valve components. (b) valve positioning concerning pressure gauge reading. (c) Experimental setup.
2.2. Terms of Theoretical Error
According to Gabl et al. [30], it is possible to incorporate the errors associated with pressure measurements into the equations derived in this study for the hydraulic characterization of the check valve. Thus, the term for theoretical error is added to Equation (8) for each measured value and its influence on the equations dependent on this measurement. This error term is related to the precision of the measurement and is considered equal to the one provided by the manufacturer of the measuring equipment. The term is added to the pressure measurements at points 1 and 2 in Figure 2b and is defined as
The partial local loss coefficient of the check valve is then considered as . The difference between and K defines the precision of the measurement between the pressures at points 1 and 2. For this, it is considered that is independent and constant. Therefore, we have:
Given that,
The change associated with the loss coefficient due to the error in pressure measurement is
This factor is considered to mark the range of values for the minor loss of the fitting according to Equation (2) due to the precision of the pressure gauge and disregarding the frictional effect of the pipe. This approach can be used to analyze any additional variable that depends on the pressure gauge readings to proceed with the hydraulic characterization of that check valve.
3. Results
Table 1 presents the measurements of flow velocity, pressure drop, and the numerical estimates with Equations (1), (5) and (7) of the local loss in the fitting and coefficient of loss of the check valve. The flow velocities were selected to obtain the hydraulic characterization of the check valve according to the self-cleaning criteria that residential drinking water pipes in Colombia should have as a design condition [10]. Figure 3 presents a comparison between the major and minor losses of the system, between the points where the pressure measurement was placed before and after the location of the check valve, and for different Reynolds numbers. For the Reynolds numbers evaluated in this work where the temperature was 25 °C and the inside diameter of the pipe was 20.9 mm, the frictional energy loss obtained by Darcy’s formula for the pipe length L is small compared to the minor losses caused by the check valve. The frictional loss estimation for Figure 3 was calculated using Equations (3), (5), (6), (9) and (10). According to Table 1, it can be considered that the effects of frictional loss for a straight section are negligible in the assembly of this hydraulic bench, including the length of the hose of the experimental setup. This could be justified because both the length and the absolute roughness possess values that contribute to making this factor minimal, and therefore it is expected that the contribution of the major head losses is negligible. Consequently, when comparing the major and minor head loss values in Figure 3, the significant effect of the pressure drop in the water stream would be in the passage of this fluid through the interior of the check valve. The supplementary materials of this research are given in the link given at the end of this manuscript. It contains images of the experimental setup, dataset and the technical information about the instruments used to collect the data.

Table 1.
Results of the experimental runs. All data were collected with an inside diameter of 20.9 mm and a water temperature of 25 °C.
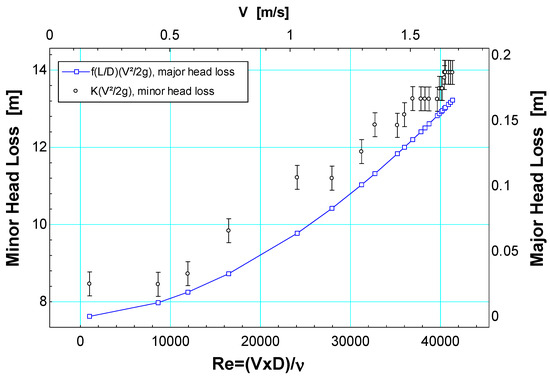
Figure 3.
Comparison of hydraulic losses of fitting and pipe length in the test bench.
Figure 4 is an adjusted linear model that represents the correlation between the flow velocity and the pressure drop of the check valve, represented by the black line in Figure 4, and considers the range of recommended flow values for the design of conduction pipes for domestic pipes in Colombia. The blue lines are the lower and upper prediction limits for new observations. These extreme limits describe how much it would be possible to predict where a new observation might be positioned for the correlation between velocity and pressure drop. Regardless of sample size, new observations could vary around the black line based on the estimated standard deviation. The pressure drop in the valve is directly proportional to the flow velocity that circulates through the device and tends to produce pressure drops with less dispersion for velocity values between 1.4 m/s and 1.8 m/s. This could be because, for these velocity values, the fluid would be completely developed. In this sense, the pressure drop and the flow velocity are directly proportional with an adjusted correlation coefficient of 98.13 [29].
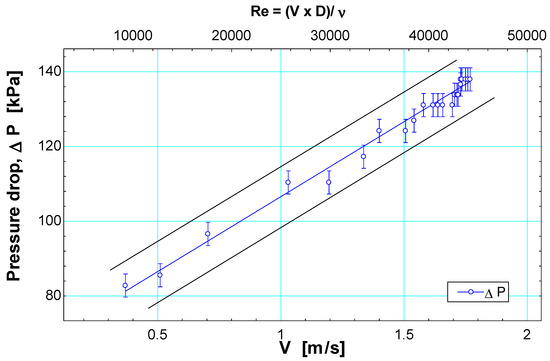
Figure 4.
Relationship of pressure drop concerning flow velocity in the check valve.
Figure 5 describes the behavior of the loss coefficient K of the valve with the flow velocity in the pipeline. For the range of flow velocities studied, any velocity greater than 1 m/s significantly reduces the coefficient of loss of the check valve. It is observed that for speeds between 1.6 m/s and 1.8 m/s, the value of the loss coefficient tends to be constant and close to a value of 90. This trend reinforces what was found in Figure 4 for the fully developed flow in the check valve and what has been reported in the literature on the coefficient of loss in hydraulic fittings, which tends to be constant under these fluid movement conditions [38]. For velocity values between 0.5 m/s and 1.4 m/s, the loss coefficient shows varied values depending on the flow regime that conditions the passage of the fluid through the check valve. The tendency to decrease the value of the coefficient K in Figure 5 and Table 1 for the increase in flow velocity could be due to an effect of the amount of movement of the current as the velocity of the fluid increases. When the flow hits the stem, it generates a force that deforms the compression spring of the valve in Figure 2a and generates more available space in the device for the fluid to flow through it with less resistance [7]. The check valve reaches an opening limit and a constant resistance that adjusts the free discharge of the fluid, downstream of the experimental assembly of Figure 2 [25,38].
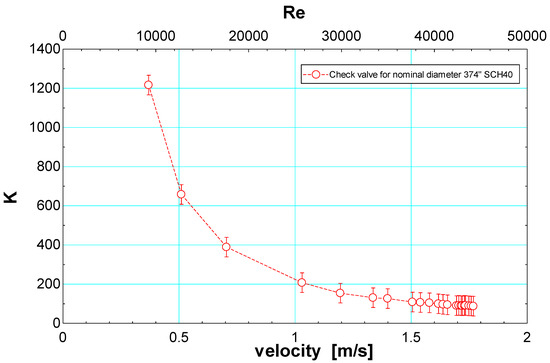
Figure 5.
The loss coefficient of the check valve respects the velocity of flow in the pipe.
Based on the previous results of this study, a nonlinear regression model was developed using the Statgraphics software to predict the coefficient K. For this, the profile of the curve of Figure 5 was observed, which has exponential correlation tendencies, showing high values of K for small magnitudes of flow velocity. The formulation is:
where Equations (16) and (17) present the nonlinear regression model for the check valve:
Table 2 presents the values of a and b as statistically significant to represent the coefficient of loss of the check valve according to the model of Equation (16). This could be because, for the intercept and slope, the P-tests of the nonlinear regression analysis are less than 0.05. This occurs under a 95% confidence level. The adjusted correlation coefficient of this model is close to 96.2% [25,39].
Table 2.
Nonlinear regression parameters between loss coefficient and flow velocity in a check valve.
Figure 6 presents a relationship between the coefficient of loss of the check valve and the local loss of the accessory concerning the Reynolds number, which was estimated to have an inside diameter of 20.9 mm and a water temperature of 25 °C. As the flow rate increases, the loss coefficient decreases inside the device. This trend is similar to the one presented by the check valve concerning the flow velocity of Figure 5, which could be related because the Reynolds number and the velocity of flow in the pipe are directly proportional. On the other hand, the energy loss of the device increases as the Reynolds number is greater. The inverse behaviors between the loss coefficient and the minor loss concerning the Reynolds number could be due to the condition of fully developed flow in the valve for values of flow velocities between 1.4 m/s and 1.8 m/s according to Figure 4 and Figure 5, respectively. Therefore, according to the point of convergence between these variables, it is believed that a Reynolds number close to 20,000 could minimize both the effect of the energy loss of this check valve and the loss coefficient, K [21].
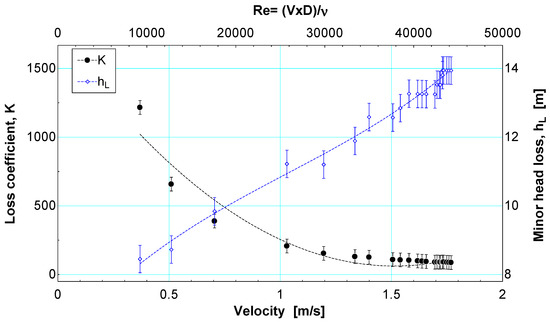
Figure 6.
Comparison between the loss coefficient and the check valve energy loss for various Reynolds numbers.
Figure 7 shows the behavior of the flow that circulates through the hydraulic bench under study when the recirculation flow was measured with and without a check valve under the stipulated working relative pressures below 147 kPa. The bank control valve was gradually opened while the operating flow was recorded with the flowmeter. It is observed that for opening percentages lower than 25%, the hydraulic bench behaved in a very similar way with and without a check valve. The check valve set the recirculation flow for values above 30% to an approximate value of 36 LPM. This could be due to the fully developed flow condition when maximum deformation is achieved in the internal spring of the check valve.
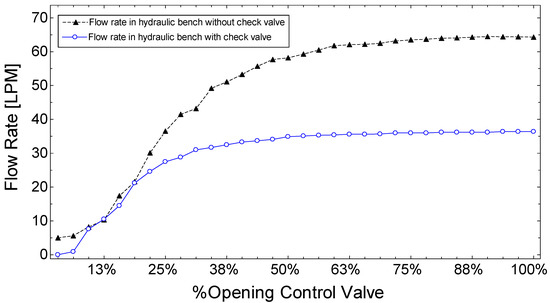
Figure 7.
Hydraulic behavior of the experimental setup with and without the check valve.
The behavior of the hydraulic bank without the check valve installed shows a greater volume of water per unit of time for the same percentages of the opening of the control valve. The difference between the flow with and without a check valve ranges from 18 LPM to 28 LPM for opening percentages in the bank control valve greater than 38%. This reduction in the recirculation flow could explain why this device should be redesigned for relative pressures below 275.79 kPa since placing it directly on low-pressure potable water distribution networks would affect the flow in customers’ residential pipes and, therefore, would affect the drinking water service. The supply could be affected in the residential units if, during peak hours, the demand for water from the network increases and, consequently, the pressures in the network decrease.
4. Discussion
The methodological approach of this research is quantitative. This is because a relationship was investigated between the measured variables such as the flow rate and the pressure difference before and after the passage of the fluid through the valve to know the hydraulic behavior of this device concerning the pressure drop, the flow velocity, the flow regime, the loss coefficient, and the frictional losses of the hydraulic bank. This approach is widely used in research related to the hydraulic characterization of pipe fittings because, with the help of experimentation, it is possible to validate the hydraulic flow theories of these devices through the observation of their behavior under controlled operating conditions. This is the case for the experimental study related to the pressure characteristics and flow coefficient of a butterfly valve carried out by Quang et al. [39]. In this investigation, the phenomenon of aeration and its influence on pressure readings and other disadvantages in piping systems was evaluated. The investigation used an experiment to analyze the behavior of a butterfly valve concerning measurable variables such as the opening percentage, the flow rate, and the pressure at various points in the pipeline. The study carried out by Quang et al. is similar to the results of the present investigation because it deduces a parametric equation that allows for predicting the behavior of the valve based on the conditions measured in the process. The present study considered the frictional loss effect negligible due to the magnitudes of the energy losses obtained by the valve compared to those calculated by Equations (2)–(8) and reported in Table 1. This aspect has been employed in other studies related to the analysis of frictional losses in fittings, as in the case of Gabl et al. [30]. These authors used a similar mathematical approach to the one presented in this work in Equation (8) to estimate the energy loss of a fitting with an asymmetric orifice based on the measurement of the pressure drop upstream and downstream of it. By comparing the theoretical values of the frictional loss with the precision of the pressure gauges, the approach is considered reliable for the range of values studied in this experimental setup. According to the trend described in Figure 3, A similar result was obtained by Kwon [40] for the estimation of major and minor losses in a hydraulic assembly to estimate the load losses in some studied pipe fittings. Comparisons between the major and minor frictional losses of a hydraulic line contribute to defining the influence of each of these effects inherent to the transport of the fluid through closed conduction elements and thus establish under which flow regime they can be considered significant or negligible. For Figure 4 and the relationship between pressure drop and flow velocity in the pipeline, these trends have a behavior similar to those reported by CRANE [29] for the characterization of valves or pipe accessories. The results show a directly proportional relationship between the variables analyzed experimentally. The results of Figure 5 are in line with the trend reported by de Moraes et al. [25] and Wen et al. [41] when comparing the coefficient of loss of a hydraulic fitting to the velocity of the fluid. In their results, the tendency of the loss coefficient to decrease and later stabilize with the increase in the flow velocity of the current is noted. Al Washali et al. [42] proposed a non-linear regression model of the exponential type to describe the coefficient of loss, concerning the available head of a reservoir, in volumetric meters to measure water consumption in residential applications. In a study carried out to estimate the coefficient of loss of a tee fitting for the transport of bulk material, De Morais et al. [25] performed a curve fit of some experimental data between the loss coefficient and the flow velocity. In this sense, it is confirmed that the loss coefficient is generally expressed using a mathematical function from a correlation analysis between this indicator and a hydraulic variable. Benbella [21] carried out an experimental study that used Darcy’s equations and an experimental setup to estimate a correlation that defined the pressure drop and its loss coefficient in a relief valve that controls the passage of a gas–liquid mixture to preserve safety in a nuclear plant. In his study, he analyzed the influence of the Reynolds number on the accuracy of his experimental model for the practice and safe design of nuclear power plants. In this sense, the assembly carried out in this research and its methodology is based on hydraulic principles and experimentation like those proposed by Benbella in the search to characterize the energy loss in a pipe accessory. This document has characterized the hydraulic behavior of a check valve based on experimental measurements made with two manometers upstream and downstream of the location of this accessory in an experimental bench at a laboratory scale. The reading of variables based on experimental measurements has uncertainties related to the range where this measurement could be found due to the use of sensors that are implemented to explain the physical phenomenon [30]. The accuracy of these instruments was considered for the propagation of the uncertainty in the search for variables calculated based on the equations. As shown in Figure 1 and Figure 2c, the pressure gauge located just after the check valve marked a value of zero because it was close to the free discharge of the recirculating water jet from the hydraulic bench. This behavior is like what could be found in the reading of a differential manometer linked to a pressure transducer. A differential pressure gauge transducer tends to be more accurate than those employed in this research for pressure reading. The use of electronic devices instead of analog ones for data reading based on pressure measurement may potentially improve interpretations of the relationship between the studied variables to hydraulically characterize this check valve in potable water distribution networks. The accuracy of analog manometers and pressure transducers has been compared [43,44], and the results were analyzed based on various uncertainty conditions such as repetition, resolution, hysteresis, or zero drift. The implementation of a pressure transducer to hydraulically characterize this valve could be a potential improvement in future research related to the implementation of this device in drinking water hydraulic networks with low network pressures. However, as suggested by Gilbert [43], the precision of these pressure transducers will depend on the materials from which the equipment is made. This can also be affected by temperature effects, linearity, and repeatability. With the results of this research and their respective measurement limitations for the hydraulic characterization of a check valve, a starting point is proposed for the implementation of this device in future low-pressure potable water distribution network projects, such as those found in Latin America. It is expected that these types of accessories can be used to correct the reading of volumetric water meters in residential applications.
5. Conclusions
The present study carried out a hydraulic characterization of a check valve used to correct the reading of volumetric water meters operating at low hydraulic pressures and studying variables such as flow velocity, loss coefficient, pressure drop, loss load energy of the device, and the recirculation flow in the hydraulic bench with and without the check valve. the effect of this check valve on the hydraulics of a pipe with low network pressures reduces the flow in the pipes since the coefficient of loss increases for low flow velocities. In this sense, it is recommended to use it for flow velocities greater than 1 m/s since its loss coefficient begins to decrease significantly from this value. The behavior between the loss coefficient and the flow velocity was correlated with a non-linear regression model with an adjusted correlation coefficient greater than 96% and with an exponential trend. A direct proportionality was observed between flow velocity and check valve pressure drop. The results on the energy loss of the fluid presented here are considered negligible for the condition of major losses by the assembly of the hydraulic bench compared to the minor loss measured by the check valve. Implementing this check valve in residential potable water distribution networks with low pressures and without any adaptation or redesign could affect the customers’ water service given the difference between the flows when the check valve is installed or not. An alternative that does not affect the experience of the water service and at the same time does not modify the original conformation of the check valve would be to provide water re-pumping units to the residential networks to consider the energy loss estimated in this study. In this case, it is proposed to use this device for a flow regime with a Reynolds number close to 20,000 to operate with a minimum value of the loss coefficient K and a small pressure drop. The value of the Reynolds number would be obtained for pipes with an internal diameter of 20.9 mm and a water temperature of 25 °C. For future studies of this check valve, it suggests will consider the behavior of the fluid with respect to the dissolved oxygen in the water when this device operates in pipes and the implementation of visualization flow techniques such as the shadowgraph method. In this way, it could be estimated how much air could travel in the flow stream for a range of pressures stipulated for residential low-pressure distribution networks. Finally, this study can be improved if a DAQ powered by the signals sent by pressure transducers and a flowmeter connected to this hydraulic bench is implemented.
Supplementary Materials
The following supporting information can be downloaded at: https://universidaddelacosta-my.sharepoint.com/:f:/g/personal/jcarpint3_cuc_edu_co/EtSte3TbqX1Fpj1SEVFO-dAB-8IE7zEMaGT6K0O4jyKxWA?e=JWcbhS (accessed on 2 July 2023).
Author Contributions
Conceptualization, J.C. and B.M.; methodology, J.C.; software, J.C. and J.F.; validation, J.C. and B.M.; formal analysis, F.A.C.; investigation, J.C.; resources, J.P. and F.A.C.; data curation, J.P.; writing—original draft preparation, J.C.; writing—review and editing, J.F.; visualization, J.C.; supervision, F.A.C.; project administration, J.C. All authors have read and agreed to the published version of the manuscript.
Funding
This research received no external funding.
Data Availability Statement
The data used in this research can be consulted in the supplementary material. The authors declare no conflict of interest with the use of this information.
Acknowledgments
The authors of this paper thank the Universidad de la Costa for their support in providing equipment and infrastructure for the development of this research.
Conflicts of Interest
The authors declare no conflict of interest.
References
- Villegas, J.F.; Carpintero, J.; Díaz Cantillo, Á.; Fábregas Villegas, J.; Durango, J.C. Numerical Simulation of the Air Content of a Two-Phase Flow in a Non-Return Valve for the Correction of Billing Measures in Domestic Drinking Water Networks. Technol. Rep. Kansai Univ. 2020, 62, 2589–2594. [Google Scholar]
- Brandt, M.J.; Johnson, K.M.; Elphinston, A.J.; Ratnayaka, D.D. Chapter 18—Valves and Meters. In Twort’s Water Supply, 7th ed.; Butterworth-Heinemann: Boston, MA, USA, 2017; pp. 743–775. ISBN 978-0-08-100025-0. [Google Scholar]
- Ali, F.; Saidi, M.F.H. Water Leakage Detection Based on Automatic Meter Reading. In Proceedings of the 2021 15th International Conference on Ubiquitous Information Management and Communication (IMCOM), Seoul, Republic of Korea, 4–6 January 2021; pp. 1–7. [Google Scholar]
- Pietrosanto, A.; Carratù, M.; Liguori, C. Sensitivity of Water Meters to Small Leakage. Measurement 2021, 168, 108479. [Google Scholar] [CrossRef]
- DiCarlo, M.F.; Berglund, E.Z. Using Advanced Metering Infrastructure Data to Evaluate Consumer Compliance with Water Advisories during a Water Service Interruption. Water Res. 2022, 221, 118802. [Google Scholar] [CrossRef]
- Pothof, I.W.M.; Clemens, F.H.L.R. Experimental Study of Air-Water Flow in Downward Sloping Pipes. Int. J. Multiph. Flow 2011, 37, 278–292. [Google Scholar] [CrossRef]
- Carpintero, J.; Canales, F.A.; Fábregas, J.; Ávila, J. Factors and Interactions That Influence the Pressure Drop Across An Air Volume Reducing Device on Low—Pressure Water Distribution Networks. Iran. J. Sci. Technol. Trans. Civ. Eng. 2021, 46, 1433–1443. [Google Scholar] [CrossRef]
- Carpintero, J.; Fabregas, J.; Pérez, S.; Pacheco, J.; Villa, J.; Fontalvo, C. Ingeniería Inversa Sobre Un Dispositivo Ahorrador de Consumo de Agua Para Su Potencial Aplicación En Ciudades Con Presiones Hidráulicas Por Debajo de 40 PSIg. Rev. Gest. Compet. Innov. 2018, 68–78. [Google Scholar]
- Ecowa México S.A.P.I. de C.V. Ecowa Air Retention. Available online: https://ecowa.com.mx/ (accessed on 2 July 2023).
- Ministerio de Vivienda Ciudad y Territorio Resolución 0330 de 2017: “Por La Cual Se Adopta el Reglamento Técnico Para el Sector de Agua Potable y Saneamiento Básico-RAS-y Se Derogan las Resoluciones 1096 de 2000, 0424 de 2001, 0668 de 2003, 1459 de 2005, 1447 de 2005 y 2320 de 2009; Ministerio de Vivienda, Ciudad y Territorio: Bogotá, Colombia, 2017; p. 182.
- Comisión Nacional del Agua. Manual Para el Diseño de Sistemas de Agua Potable y Alcantarillado Sanitario—Diseño de Redes de Distribución de Agua Potable; Comisión Nacional del Agua: México, Mexico, 2007. [Google Scholar]
- Nguyen, Q.K.; Jung, K.H.; Lee, G.N.; Park, H.J.; To, P.; Suh, S.B.; Lee, J. Bubble Formation in Globe Valve and Flow Characteristics of Partially Filled Pipe Water Flow. Int. J. Nav. Archit. Ocean. Eng. 2021, 13, 554–565. [Google Scholar] [CrossRef]
- Mott, R.; Utener, J. Applied Fluids Mechanics, 7th ed.; Pearson: London, UK, 2015; Volume 1, ISBN 978-0-13-255892-1. [Google Scholar]
- Meniconi, S.; Brunone, B.; Mazzetti, E.; Laucelli, D.B.; Borta, G. Pressure Reducing Valve Characterization for Pipe System Management. Procedia Eng. 2016, 162, 455–462. [Google Scholar] [CrossRef]
- Amankwaa, G.; Heeks, R.; Browne, A.L. Smartening up: User Experience with Smart Water Metering Infrastructure in an African City. Util. Policy 2023, 80, 101478. [Google Scholar] [CrossRef]
- Oberascher, M.; Rauch, W.; Sitzenfrei, R. Towards a Smart Water City: A Comprehensive Review of Applications, Data Requirements, and Communication Technologies for Integrated Management. Sustain. Cities Soc. 2022, 76, 103442. [Google Scholar] [CrossRef]
- Zhao, L.; Wu, J.Y.; Jin, Z.J.; Qian, J.Y. Cavitation Effect on Flow Resistance of Sleeve Regulating Valve. Flow Meas. Instrum. 2022, 88, 102259. [Google Scholar] [CrossRef]
- Gan, R.; Li, B.; Liu, S.; Wu, Z.; Peng, Y.; Yang, G. Multi Structural Parameter Analysis Based on the Labyrinth Valve Design with High Pressure Drop and Low Noise. Flow Meas. Instrum. 2023, 89, 102301. [Google Scholar] [CrossRef]
- Go, T.-S.; Kim, K. The Effect of Divergence Angle on the Control Valve Trim Characteristics. J. Fluid Mach. 2013, 16, 32–39. [Google Scholar] [CrossRef]
- Forero, D. CFD Analysis of the Airflow Behavior in the Intake System of a Low-Displacement Diesel Engine. INGE CUC 2020, 16, 285–298. [Google Scholar]
- Benbella, S. Mixture Loss Coefficient of Safety Valves Used in Nuclear Plants. Nucl. Eng. Des. 2009, 239, 1779–1788. [Google Scholar] [CrossRef]
- Iravani, M.; Toghraie, D. Design a High-Pressure Test System to Investigate the Performance Characteristics of Ball Valves in a Compressible Choked Flow. Measurement 2020, 151, 107200. [Google Scholar] [CrossRef]
- Yu, R.; Wu, Y.; Chen, X.; Wu, X. Study on the Design of Ball Valve Based on Elastic Ring Valve Seat Structure and Fluid Characteristics and Fatigue Strength. Flow Meas. Instrum. 2023, 89, 102302. [Google Scholar] [CrossRef]
- Zhao, Y.; Wang, P.; Sun, Q.; Feng, D.; Tu, Y. Modeling and Experiment of Pressure Drop on Valve Section of Hydraulic Oscillator. J. Pet. Sci. Eng. 2022, 208, 109294. [Google Scholar] [CrossRef]
- de Moraes, M.S.; Torneiros, D.L.M.; da Silva Rosa, V.; Higa, J.S.; De Castro, Y.R.; Santos, A.R.; de Almeida Coelho, N.M.; de Moraes Júnior, D. Experimental Quantification of the Head Loss Coefficient K for Fittings and Semi-Industrial Pipe Cross Section Solid Concentration Profile in Pneumatic Conveying of Polypropylene Pellets in Dilute Phase. Powder Technol. 2017, 310, 250–263. [Google Scholar] [CrossRef]
- Amaranatha Raju, M.; Ashok Babu, T.P.; Ranganayakulu, C. Flow Boiling Heat Transfer and Pressure Drop Analysis of R134a in a Brazed Heat Exchanger with Offset Strip Fins. Heat Mass Transf./Waerme-Stoffuebertragung 2017, 53, 3167–3180. [Google Scholar] [CrossRef]
- Vinoth, R.; Sachuthananthan, B. Experimental Study of Heat Transfer and Pressure Drop Characteristics of Microtube Condenser Using R134a. Int. J. Ambient. Energy 2022, 43, 4832–4837. [Google Scholar] [CrossRef]
- Khayat, O.; Afarideh, H. Numerical Investigation of Non-Newtonian Liquid–Gas Flow in Venturi Flow Meter Using Computational Fluid Dynamics. Iran. J. Sci. Technol. Trans. Mech. Eng. 2021, 45, 393–401. [Google Scholar] [CrossRef]
- Crane Co. Flow of Fluids through Valves, Fittings and Pipe—Technical Paper No. 410; Crane Co.: Stamford, CT, USA, 2013; ISBN 1400527120. [Google Scholar]
- Gabl, R.; Achleitner, S.; Neuner, J.; Aufleger, M. Accuracy Analysis of a Physical Scale Model Using the Example of an Asymmetric Orifice. Flow Meas. Instrum. 2014, 36, 36–46. [Google Scholar] [CrossRef]
- Wu, J.; Ai, Z.; Zhou, Q. Head Loss Coefficient of Orifice Plate Energy Dissipator. J. Hydraul. Res. 2010, 48, 526–530. [Google Scholar] [CrossRef]
- Ulusarslan, D. Effect of Diameter Ratio on Loss Coefficient of Elbows in the Flow of Low-Density Spherical Capsule Trains. Part. Sci. Technol. 2010, 28, 348–359. [Google Scholar] [CrossRef]
- Jo, J.B.; Kim, J.S.; Yoon, S.E. Experimental Estimation of the Head Loss Coefficient at Surcharged Four-Way Junction Manholes. Urban Water J. 2018, 15, 780–789. [Google Scholar] [CrossRef]
- Fester, V.G.; Kazadi, D.M.; Mbiya, B.M.; Slatter, P.T. Loss Coefficients for Flow of Newtonian and Non-Newtonian Fluids through Diaphragm Valves. Chem. Eng. Res. Des. 2007, 85, 1314–1324. [Google Scholar] [CrossRef]
- Lee, J.H.; Lee, K.H. Prediction of the Resistance Coefficient in a Segment Ball Valve. J. Mech. Sci. Technol. 2010, 24, 185–188. [Google Scholar] [CrossRef]
- Mylaram, N.K.; Idem, S. Pressure Loss Coefficient Measurements of Two Close-Coupled HVAC Elbows. HVAC R Res. 2005, 11, 133–146. [Google Scholar] [CrossRef]
- Ministerio de Vivienda. Resolucion 0799 de 2021; Ministerio de Vivienda: Santa fé de Bogotá, Colombia, 2021.
- Khan, T.S.; Dai, Y.; Alshehhi, M.S.; Khezzar, L. Experimental Flow Characterization of Sand Particles for Pneumatic Transport in Horizontal Circular Pipes. Powder Technol. 2016, 292, 158–168. [Google Scholar] [CrossRef]
- Nguyen, Q.K.; Jung, K.H.; Lee, G.N.; Park, S.B.; Kim, J.M.; Suh, S.B.; Lee, J. Experimental Study on Pressure Characteristics and Flow Coefficient of Butterfly Valve. Int. J. Nav. Archit. Ocean. Eng. 2022, 15, 100495. [Google Scholar] [CrossRef]
- Kwon, H.J. Head Loss Coefficient Regarding Backflow Preventer for Transient Flow. KSCE J. Civ. Eng. 2008, 12, 205–211. [Google Scholar] [CrossRef]
- Wen, Q.; Liu, Y.; Chen, Z.; Wang, W. Numerical Simulation and Experimental Validation of Flow Characteristics for a Butterfly Check Valve in Small Modular Reactor. Nucl. Eng. Des. 2022, 391, 111732. [Google Scholar] [CrossRef]
- AL-Washali, T.; Mahardani, M.; Sharma, S.; Arregui, F.; Kennedy, M. Impact of Float-Valves on Water Meter Performance under Intermittent and Continuous Supply Conditions. Resour. Conserv. Recycl. 2020, 163, 105091. [Google Scholar] [CrossRef]
- Gilbert, M. Principles of Pressure Transducer Function, and Sources of Error in Clinical Use. Anaesth. Intensive Care Med. 2015, 16, 1–6. [Google Scholar] [CrossRef]
- Torres-Guzman, J.; Forastieri, J. Differential Pressure Comparison from 5 Pa to 500 Pa with a Liquid Column Manometer between CENAM (Mexico) and INTI—Fisica y Metrologia (Argentina). Measurement 2013, 46, 4328–4331. [Google Scholar] [CrossRef]
Disclaimer/Publisher’s Note: The statements, opinions and data contained in all publications are solely those of the individual author(s) and contributor(s) and not of MDPI and/or the editor(s). MDPI and/or the editor(s) disclaim responsibility for any injury to people or property resulting from any ideas, methods, instructions or products referred to in the content. |
© 2023 by the authors. Licensee MDPI, Basel, Switzerland. This article is an open access article distributed under the terms and conditions of the Creative Commons Attribution (CC BY) license (https://creativecommons.org/licenses/by/4.0/).