Article

Contribution of Evaporation to Precipitation Changes in the Yangtze River Basin—Precipitation Recycling

1
National Climate Center, China Meteorological Administration, Beijing 100081, China
2
Collaborative Innovation Center on Forecast and Evaluation of Meteorological Disasters/Institute for Disaster Risk Management/School of Geographical Sciences, Nanjing University of Information Science & Technology, Nanjing 210044, China
*
Author to whom correspondence should be addressed.
Water 2023, 15(13), 2407; https://doi.org/10.3390/w15132407
Submission received: 24 March 2023 / Revised: 16 June 2023 / Accepted: 26 June 2023 / Published: 29 June 2023

Abstract

:
Locally evaporated water vapor is an important source of precipitation in China. The spatiotemporal variation characteristics of the precipitation recycling ratio (ρ) in the Yangtze River Basin (YRB) in 1979–2020 were calculated and analyzed, and the contribution of internal and external cycling precipitation changes to the total precipitation changes in YRB under climate change was studied. The results show that the annual average ρ in YRB is approximately 10.3%, with the highest value of 21.8% in summer, lower than 10% in spring and autumn, and the lowest in winter, with only approximately 3.5%. Over the past 40 years, the annual average ρ in YRB has shown an increasing trend, with an increased rate of 0.4%/10a, especially in summer, with an increasing rate of 1.2%/10a. In terms of spatial distribution, ρ in YRB shows an obvious difference between the eastern and western regions, with that in the upstream western region being significantly higher than that in the downstream eastern region. The annual average ρ in the upstream region was 15–35% and can reach 20–50% in summer. The annual average ρ in the downstream region is below 10%. In general, precipitation formed by advection moisture accounts for the majority of the total precipitation in YRB. From 1979 to 2020, the annual precipitation in YRB showed an increasing trend. The cumulative increase is about 47.4 mm, of which 68.9% was contributed by local evaporation, and 31.1% was contributed by external moisture.

1. Introduction

Precipitation is formed by the condensation of atmospheric water vapor, and the sources of atmospheric water vapor in a given region are local evaporation and external water vapor inputs [1]. Since the 1950s, attention has increasingly been paid to the role of internal and external circulation of terrestrial water, and local evaporation has been found to be an important source of water vapor at certain times in some regions [2]. Both Horton [3] and McDonald [4] emphasized the importance of local evapotranspiration for precipitation in a region. Scientists initially considered the use of isotopic measurements to study the contribution of evaporation to precipitation; for example, Dansgaard [5] proposed the concept of precipitation isotope deuterium surplus (d-excess) based on the effect of evaporation on the slope and intercept of the Meteoric Water Line (MWL), noting that it could be used to measure the effect of land surface evaporation on the decay of precipitation isotope content. During this period, the assessment of the effect of local evaporation or external water vapor input on precipitation was generally limited to qualitative descriptions due to the unavailability of actual measurements and the lack of estimation methods.
Budyko was the first (proposed in 1954 and formulated in 1974) to derive a proportional relationship between total regional precipitation and precipitation formed by external water vapor transport [1]. The ratio is a simple function of evapotranspiration, water vapor transport flux, and distance scale, which can be transformed simply into a one-dimensional precipitation recycling ratio expression. Molion [6] was the first to define the evaporation recycling ratio (i.e., the proportion of evaporation forming local precipitation to total evaporation) and introduced a model to calculate this ratio based on the atmospheric moisture conservation equation using dimensionless water vapor trajectory analysis [7]. All these studies assume that the total water vapor, external inflow water vapor, and local evaporative water vapor vary linearly with the one-dimensional flow field, and, therefore, can only be considered as an ideal state result for the atmosphere. Brubaker et al. [8] developed a two-dimensional water recycling model by replacing the distance variable of the Budyko model with an area variable. Burde et al. [9], on the other hand, argued that the relationship between total water vapor, external inflow water vapor, and locally evaporated water vapor depends on the flow field structure and the spatial distribution of water vapor, and the distance variable cannot be simply replaced by the area variable. By introducing a flow field correction factor, Burde et al. [9] further improved another two-dimensional water recycling model. Eltahir and Bras [10] derived the atmospheric water vapor conservation equation on the grid cell based on the characteristics of conventional meteorological data, giving a new moisture recycling model that can be calculated using iterative methods and achieving better applications in the Amazon and Mississippi River basins. During this period, isotope methods also started to be used for quantitative assessment of precipitation recirculation rates. For example, Gat et al. [11] derived a model from calculating the evaporative water vapor deuterium surplus based on the isotopic evaporation model developed by Craig and Gordon [12], which in turn gave the calculation of precipitation recycling ratio in the Great Lakes region of North America. The isotope approach has also been nested into the atmospheric circulation model GCM and applied to water cycle or recycling studies [13,14], making the atmosphere-ocean-land boundary layer processes, large-scale circulation, and water cycle into a unified whole, and thus is considered to have higher accuracy than the conventional methods [15].
Since the 2000s, with the continuous enrichment of various meteorological data and the rapid improvement of computing power, the research methods of moisture recycling have become more refined and precise, and the numerical analysis methods, atmospheric circulation model methods, and isotope methods have been developed significantly. For example, Burde and Zangvil [16] made the first attempt to solve the atmospheric water vapor conservation equation in the Lagrangian coordinate system and gave a one-dimensional analytical solution for the moisture recycling ratio. Dominguez et al. [17] used a similar method to transform the coordinates of x, y, and t to obtain the Dynamic Recycling Model (DRM) in Lagrangian coordinates, which can calculate the moisture recycling ratio at different time scales. The water accounting model (WAM) was proposed by van der Ent et al. [18] by applying numerical methods to solve the atmospheric water vapor conservation equation. In terms of atmospheric circulation models, Numaguti [19] conducted a water vapor tracking experiment using the CCSR/NIESA GCM to analyze the origin and transport of water vapor in the global atmosphere-land system, focusing on the estimation of the water recycling ratio in Eurasia. Based on the NASA GEOS GCM model for water vapor tracking, Bosilovich and Schubert [20] studied the sources of precipitation in the North American and Indian regions. Compared to GCMs, regional climate models (RCMs) with a water vapor tracking diagnostic module have the advantage of higher resolution to provide a finer picture of topography, land surface heterogeneity, atmospheric water vapor advection, convection, dispersion, and cloud microphysics processes. For example, the high-resolution model (HRM) [21], the Mesoscale Meteorological community Model MM5 [22], and the Weather Research and Forecasting Model WRF [23] have achieved good results in the Elbe River basin, the West African region, and the North American monsoon region, respectively.
In terms of isotopic methods, Peng et al. [24] proposed an isotopic moisture recycling model that considers the contributions of evaporation and transpiration, respectively, and Froehlich et al. [25] studied the contribution of evaporation to precipitation in the Alpine region by drawing on Peng’s model and considering the effect of evaporation under clouds. Subsequently, Peng et al. [26] developed a ternary linear solution equation from the precipitation isotopic content balance.
In China, Liu and Wang [27] were the first to calculate the contribution of regional evaporation to precipitation using a one-dimensional recirculation model and found that approximately 17% of evaporated water was recirculated to form precipitation, accounting for 10% of the total precipitation in China. Yi and Tao [28] developed a precipitation recycling model based on the Eltahir and Brubaker models and found that the contribution of evapotranspiration to precipitation in the Yangtze River Basin was approximately 10%. Kang et al. [29,30] used the Eltahir model to estimate the precipitation recycling ratio in south-central and northern China and found that the total precipitation recycling ratio was 28.8% in south-central China and approximately 19% in the Yellow River basin. Hua et al. [31,32] used the DRM model and found that precipitation recycling in arid and semi-arid regions of China showed an enhanced trend, where the precipitation in the Qinghai-Tibet Plateau and its surrounding areas strongly depends on the recycling process, while the contribution of recycling precipitation is much smaller in southeastern China because of the influence of summer wind water vapor transport. Su et al. [33] evaluated the global and Chinese regional moisture recirculation rates based on the WAM model and found that the precipitation recycling ratio in mainland China was 32.6%, and the evaporative recycling ratio was 44.9%. Fremme and Sodemann [34] conducted a diagnostic analysis of the source of precipitation water vapor in the lower Yangtze River basin and found that water vapor from ocean evaporation contributed 42% of the precipitation in the Yangtze River basin and water vapor from land evaporation contributed 58%, with the contribution of evaporative water vapor from within the region to precipitation of 15.8%. Wu et al. [35] studied precipitation recycling in northwest China based on the Eltahir model and found that the contribution of external circulation to the increase in precipitation in northwest China was significantly higher than that of internal circulation. Li et al. [36] applied the above model to the Qinghai-Tibet Plateau region and found that the average annual precipitation recycling ratio on the plateau was 12.2%, with the highest value of 26% on average in summer. Based on ERA5 reanalysis data and the Brubaker recycling model, Zhao and Zhou [37] evaluated the summer recycling rate and basic characteristics of the water cycle over the Tibetan Plateau, and concluded that 77.4% of the summer precipitation over the Tibetan Plateau contributed by external water vapor input, while only 22.6% of the precipitation was formed through local evaporation recycling. The external input water vapor dominates the water vapor source of the plateau precipitation. A recent study in the same region indicates that the internal cycle (87.2%) contributes more to the precipitation shift than the external cycle (12.8%), and precipitation recycling contributes more to heavy precipitation than to light precipitation [38].
Scientists have created several types of models to study precipitation recycling and have obtained good calculations in different watersheds or regions around the globe. We found that the scale dependence of precipitation recycling has not been well addressed in previous studies; that is, the larger the study area, the larger the recycling ratio, making the results for different areas and shapes not comparable. Second, there have been relatively few research results regarding the Chinese region, especially in the Yangtze River basin, in recent years. At the same time, owing to model and data source differences, some research results also have large uncertainties. In this study, we selected the Yangtze River basin (YRB), the largest area in China, as the study area and adopted an improved iso-scale calculation scheme to calculate and analyze the temporal variation and spatial distribution of the precipitation recycling ratio in the basin. The second part of the paper introduces the study area, data, and the precipitation recycling calculation model; the third part gives the main conclusions of the paper in detail, including the characteristics of temporal variation and spatial distribution of precipitation recycling rate in YRB, the variation characteristics of evaporation and water vapor transport, and also the contributions of both to the increase of precipitation in YRB.

2. Materials and Methods
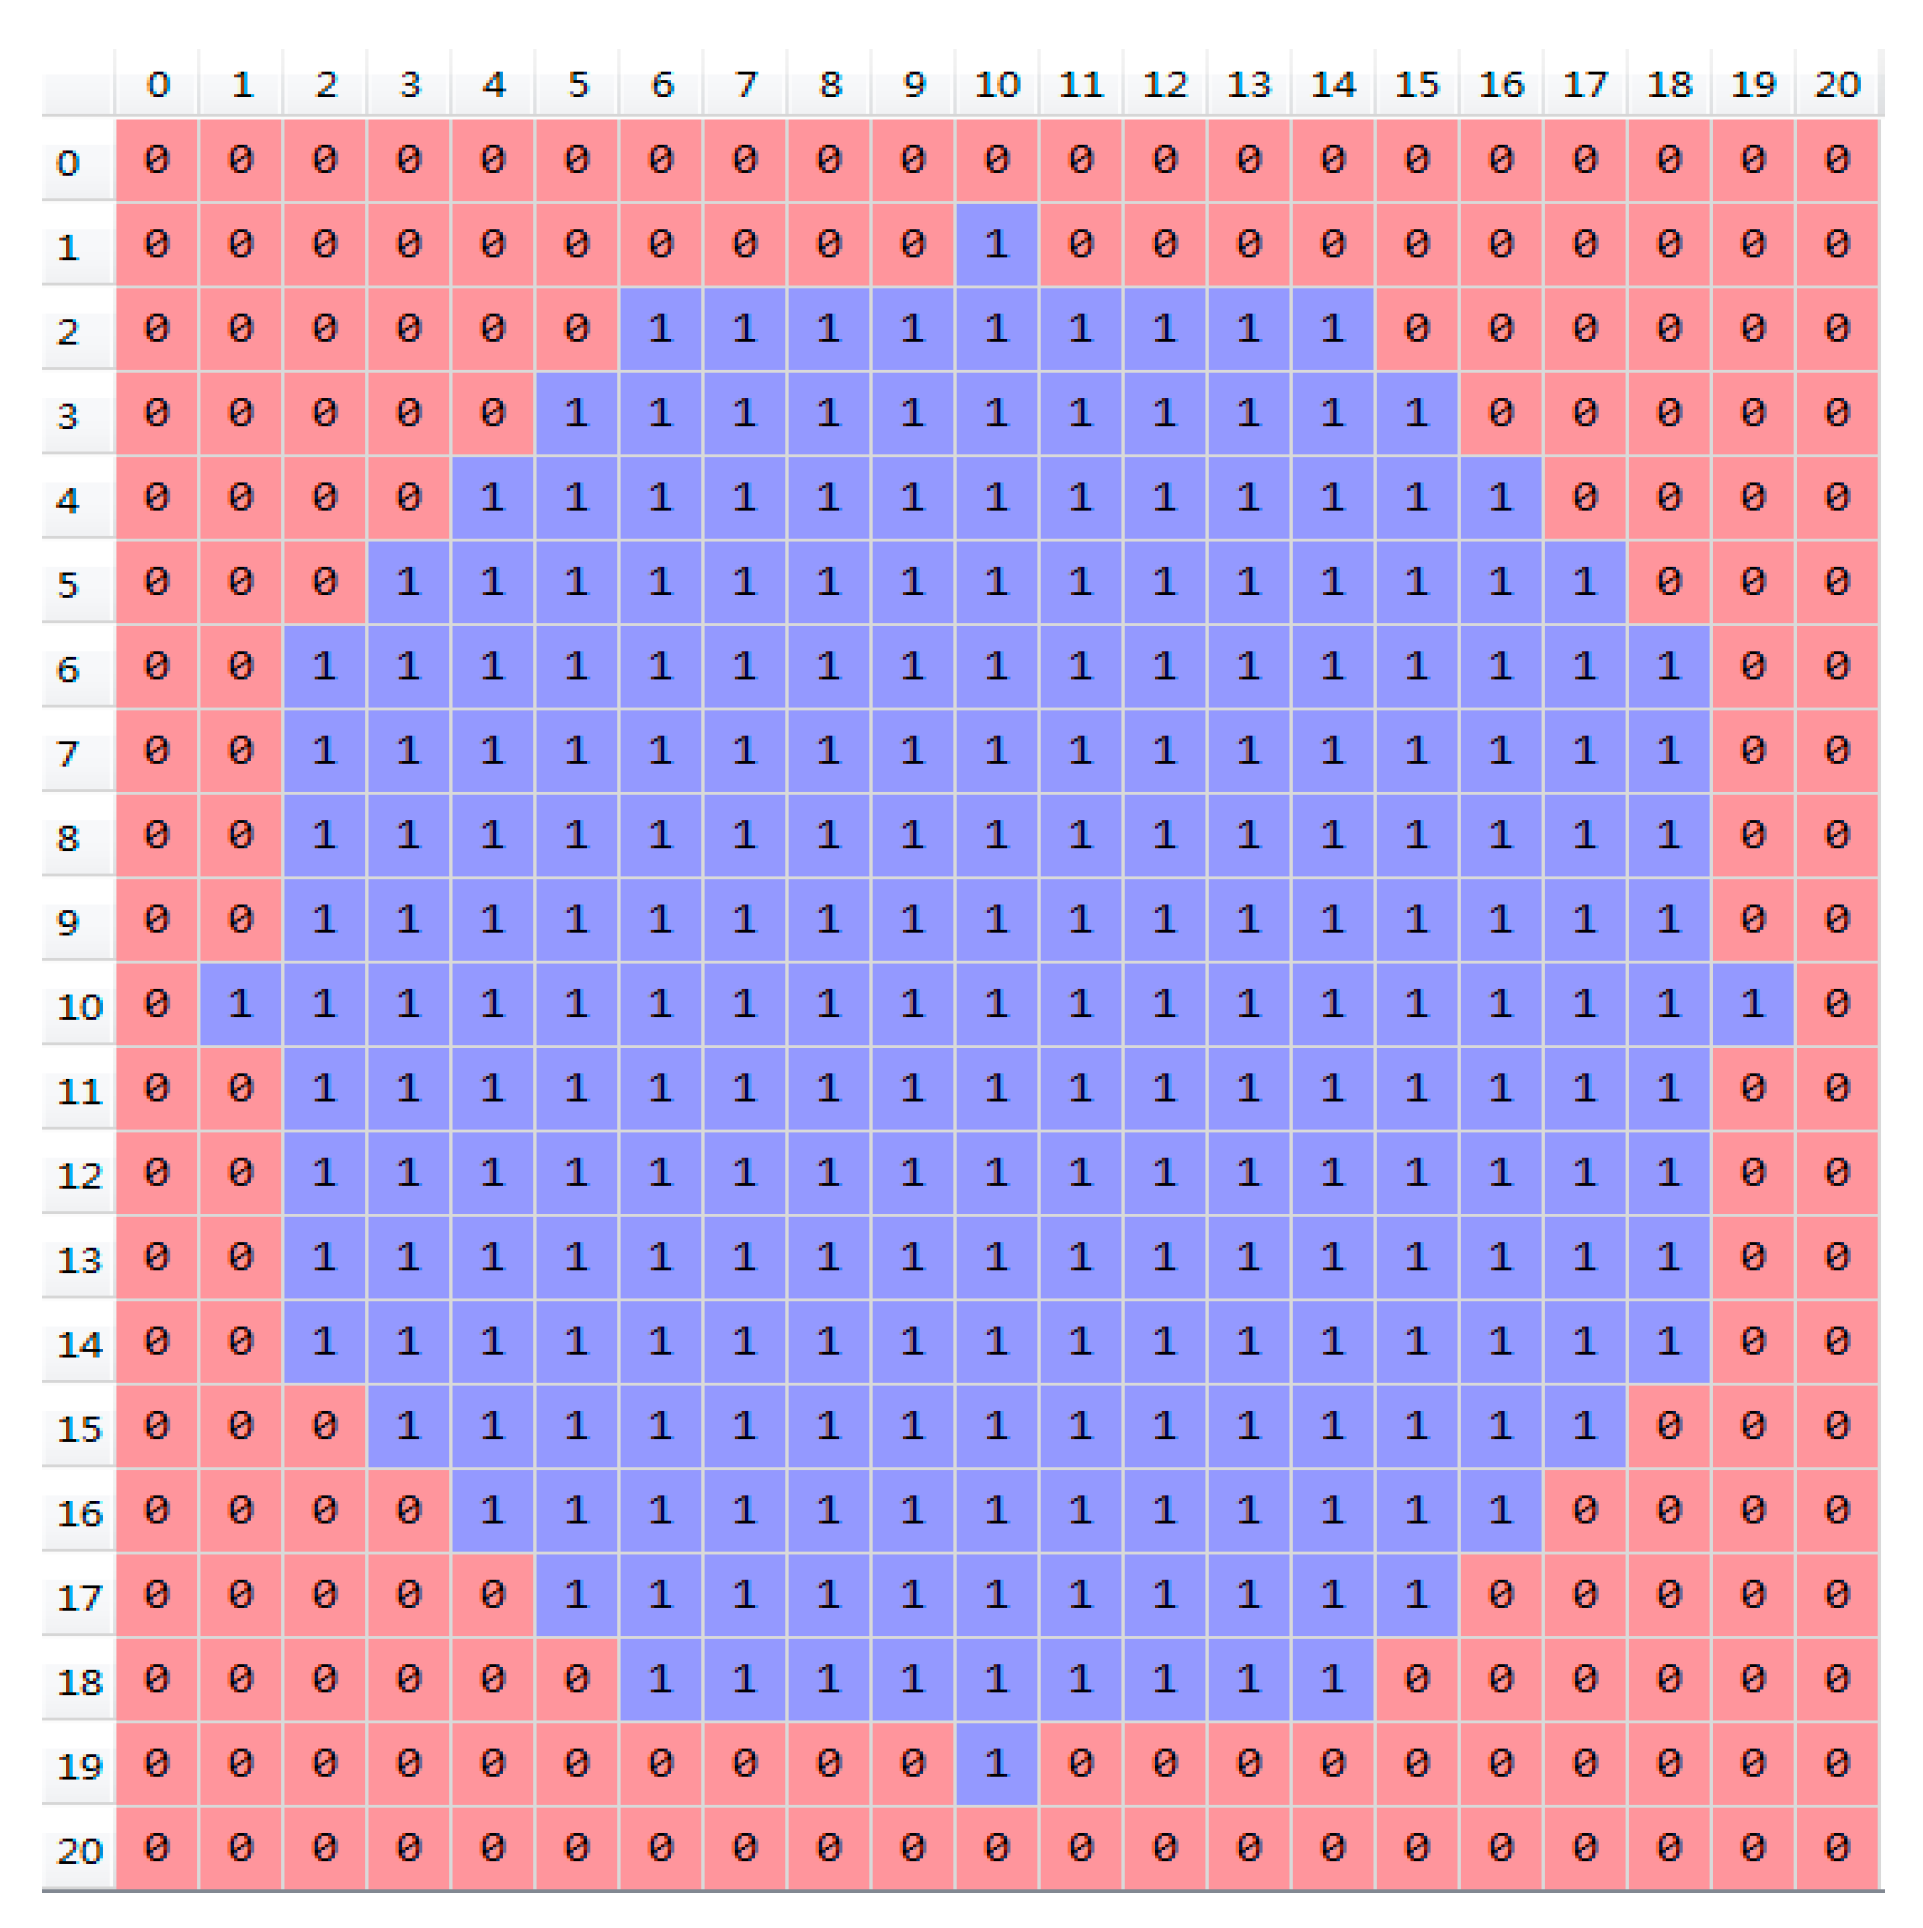
2.1. Study Area

The Yangtze River originates from the Tanggula Mountains on the Qinghai-Tibet Plateau, with a total length of more than 6300 km and a drainage area of 1.8 million km2. It is the third-largest river in the world (Figure 1). One-third of China’s water resources and three-fifths of its hydropower resources come from YRB. Most of the country’s freshwater lakes are distributed in the middle and lower reaches of the Yangtze River, which are China’s important strategic water source, ecological treasure houses, and golden waterways. The Hengduan Mountains in YRB, located in the second and third-step transition zone of China, are located at the eastern edge of the Qinghai-Tibet Plateau, which is located at the intersection of several monsoons. This region is sensitive to global climate change owing to its diverse climate types and extremely complex climatic conditions. The upper reaches of the Yangtze River are abundant in water and have a large drop in terrain, and its hydropower resources are extremely rich, making it an important base for hydropower development in China.
The average annual precipitation in the Yangtze River Basin is about 1070 mm, decreasing from southeast to northwest. Annual precipitation in the southeast can reach 1200 mm, while less than 500 mm in the northwest. The distribution of precipitation in the basin is uneven throughout the year, and the precipitation in the rainy season from May to October accounts for about 70–90% of the annual precipitation. Heavy rain frequently occurs in summer, and the weather systems that cause heavy rain in the basin mainly include cold front troughs, low vortex shear, Meiyu front, tropical cyclones, and eastern waves. The maximum annual precipitation is 2–4 times the minimum annual precipitation, and the minimum annual precipitation is 0.46–0.62 times the annual average annual precipitation. Therefore, the Yangtze River Basin is one of the most drought- and flood-prone areas in China.

2.2. Data

Evaporation and moisture transportation data were used to calculate the precipitation recycling ratio. At present, most observations are available for pan evaporation, while actual evaporation monitoring data are relatively few. Compared with evaporation, observations of water vapor are scarcer. Sounding stations are rare, and it is difficult to cover the boundaries of the study area. Considering that it is difficult for evaporation and water vapor observation stations to cover the boundaries of the study area and maintain data consistency, the evaporation and water vapor transport data used in the calculation of ρ in this study were from ERA5 monthly data, the fifth generation ECMWF atmospheric reanalysis of the global climate (https://cds.climate.copernicus.eu/cdsapp#!/dataset/reanalysis-era5-single-levels-monthlymeans?tab=overview (accessed on 19 April 2021)) [39]. The horizontal resolution is 0.25° × 0.25°. Precipitation data were obtained from the China Meteorological Forcing Dataset (CMFD). CMFD is based on Princeton reanalysis data, GEWEX-SRB, the Global Land Data Assimilation System (GLDAS), and TRMM precipitation data combined with observations from the CMA [40]. The original horizontal resolution of the CMFD data is 0.1° × 0.1°. To facilitate the calculation, we use a linear interpolation method to interpolate it to a resolution of 0.25° × 0.25° consistent with the ERA5 data. Some research indicates that CMFD could well reproduce the spatial distribution of mean monthly precipitation and temperature in China. A good correlation is found between CMFD and situ observations under different amounts of monthly precipitation conditions [41,42].
The time period of the datasets in this study was 1979–2020. Moreover, spring is from March to May (MAM), summer is from June to August (JJA), autumn is from September to November (SON), and winter is from December to February (DJF) the following year.

2.3. Methods

According to the characteristics of the gridded meteorological data, the area consisting of four grid points can be defined as a grid cell. On each grid cell, each water cycle variable satisfies the following equation:
N w t = I w + E O W P w N o t = I o O o P o
where subscripts w and o denote molecules that evaporate within and outside the grid cell, respectively. I and O are inflow and outflow, P is precipitation, E is evaporation, and N is water vapor content (see Figure 2). N, I, O, P, and E are variables in space and time. Each of I and O is a summation of the components of flux in the two horizontal directions. Equation (1) includes both the terrestrial (up) and atmospheric (down) branches of the water balance equation.
The precipitation recycling ratio (ρ) refers to the proportion of precipitation contributed by local evaporation in total precipitation, representing the ability of recycling within the region. Based on its definition, ratio ρ can be expressed as:
ρ = P w P = P w P w + P o
Observation experiments and relevant studies have shown that it takes only about 15 min for water vapor molecules evaporating at the surface to mix in the vertical for up to a depth of one kilometer [10]. At the monthly timescale (or quarterly or annually), the water vapor over the study area can be considered to be fully mixed. Therefore, ρ can be defined as:
ρ = P w P = P w P w + P O = O w O w + O o
Compared with water vapor fluxes and evaporation, the change rate for water vapor storage is very low on the monthly timescale. Nw or No is small compared with the water vapor flux I, O, and E, thus from Equations (1) and (3), we can obtain the formula for calculating the precipitation recycling ratio on the grid cell:
ρ = I w + E I w + E + I o
Because of the scale dependence of ρ [8], an “iso-scale” calculation method was adopted in this study; that is, for any grid cell (i, j), the calculation range of ρ is the region consisting of a certain number of surrounding grid cells [35,36]. For example, given the radius with 10 grid cells, then the calculation range is an area composed of 253 surrounding grid cells (Figure 3; [36]). For YRB, the area scale of each calculation unit was approximately 16.5 km2. In each calculation unit, the precipitation recycling ratio (ρ) of each grid cell is calculated by an iterative method, i.e., given the initial value of ρ (e.g., 0.5), the first iteration values of Pw and Po and Ow and Oo can be calculated according to the first half part of Equation (1), and note that Ow and Oo are the Iw and Io of the next grid cell. Using the latter part of Equation (1), the first iteration value of ρ can be calculated. Continuing the iterative process, eventually, the entire computational cell will reach equilibrium, i.e., ρ will converge to the true value.
The non-parametric Mann–Kendall test [43] was used to estimate the significance of the long-term trend in annual ρ and seasonal ρ during 1979–2020. The principle is that for time variables x1, x2…, xn, we construct the following statistics:
Z = S 1 var S , S > 0 0 , S = 0 S + 1 var S , S < 0
where S = i = 1 n 1 j = i + 1 n s g n x j x i , var S = n n 1 2 n + 5 / 18 . The statistic Z meets the standard normal distribution, and the increasing or decreasing trend of the time variable x was determined based on its positive or negative. Given the corresponding confidence levels (90%, 95%, and 99%), the significance level of the changing trend of the time variable x was determined (0.1, 0.05, and 0.01). Significance levels of 0.1, 0.05, and 0.01 were then taken as thresholds to classify the confidence (90%, 95%, and 99%) of changing trends.

3. Results

3.1. Spatiotemporal Variation of Precipitation Recycling Ratio (ρ)

The average annual ρ of YRB during 1979–2020 is approximately 10.3%, with the highest of 21.8% in summer, 7.6%, and 8.4% in spring and autumn, respectively, and the lowest of 3.5% in winter. The average annual ρ in YRB shows an increasing trend, with an increased rate of approximately 0.4%/10a (Figure 4). From the perspective of seasonal distribution, ρ in summer increased the most significantly, with an increased rate of 1.2%/10a, followed by autumn, which increased first and then decreased, with an increased rate of approximately 0.2%/10a. However, the change in ρ was not obvious in spring and winter. From the p values, the increasing trend of annual and four-season precipitation recycling ratios were not significant.
Figure 5 shows the spatial distribution of ρ in YRB. It can be seen that ρ in the basin differs distinctly between eastern and western regions. The upper reaches of the basin are high-value areas of ρ, with an annual average of 15–35% and peaks of 20–50% in summer. The highest ρ occurred in the Sichuan Basin and its surrounding areas, with an annual average of more than 20% and a peak of over 35% in summer. The lower reaches of the Yangtze River have relatively low values, with an annual average of less than 10%. The spatial distributions of ρ in spring, summer, and winter are consistent with the annual distribution, and the area with relatively high ρ in autumn is located in the southeast of YRB.
Almost all annual ρ values in YRB show an increasing trend, with the most obvious increasing trend observed in the middle and upper reaches of the basin, which are significant at the 95% confidence level (Figure 6). From the perspective of seasonal changes, the spatial distribution of summer ρ dominates that of annual ρ, and its high and low trend distributions are consistent with the spatial distribution of the annual ρ change trend. The spring and autumn ρ of the entire basin also increased. The area with an obvious increase in spring is located in the lower reaches of the Yangtze River, while in autumn, it is in the upper reaches. In winter, ρ in most areas showed an increasing trend but showed a decreasing trend only in the upstream area. The region with an obvious increasing trend was located in the middle reaches of the river basin.

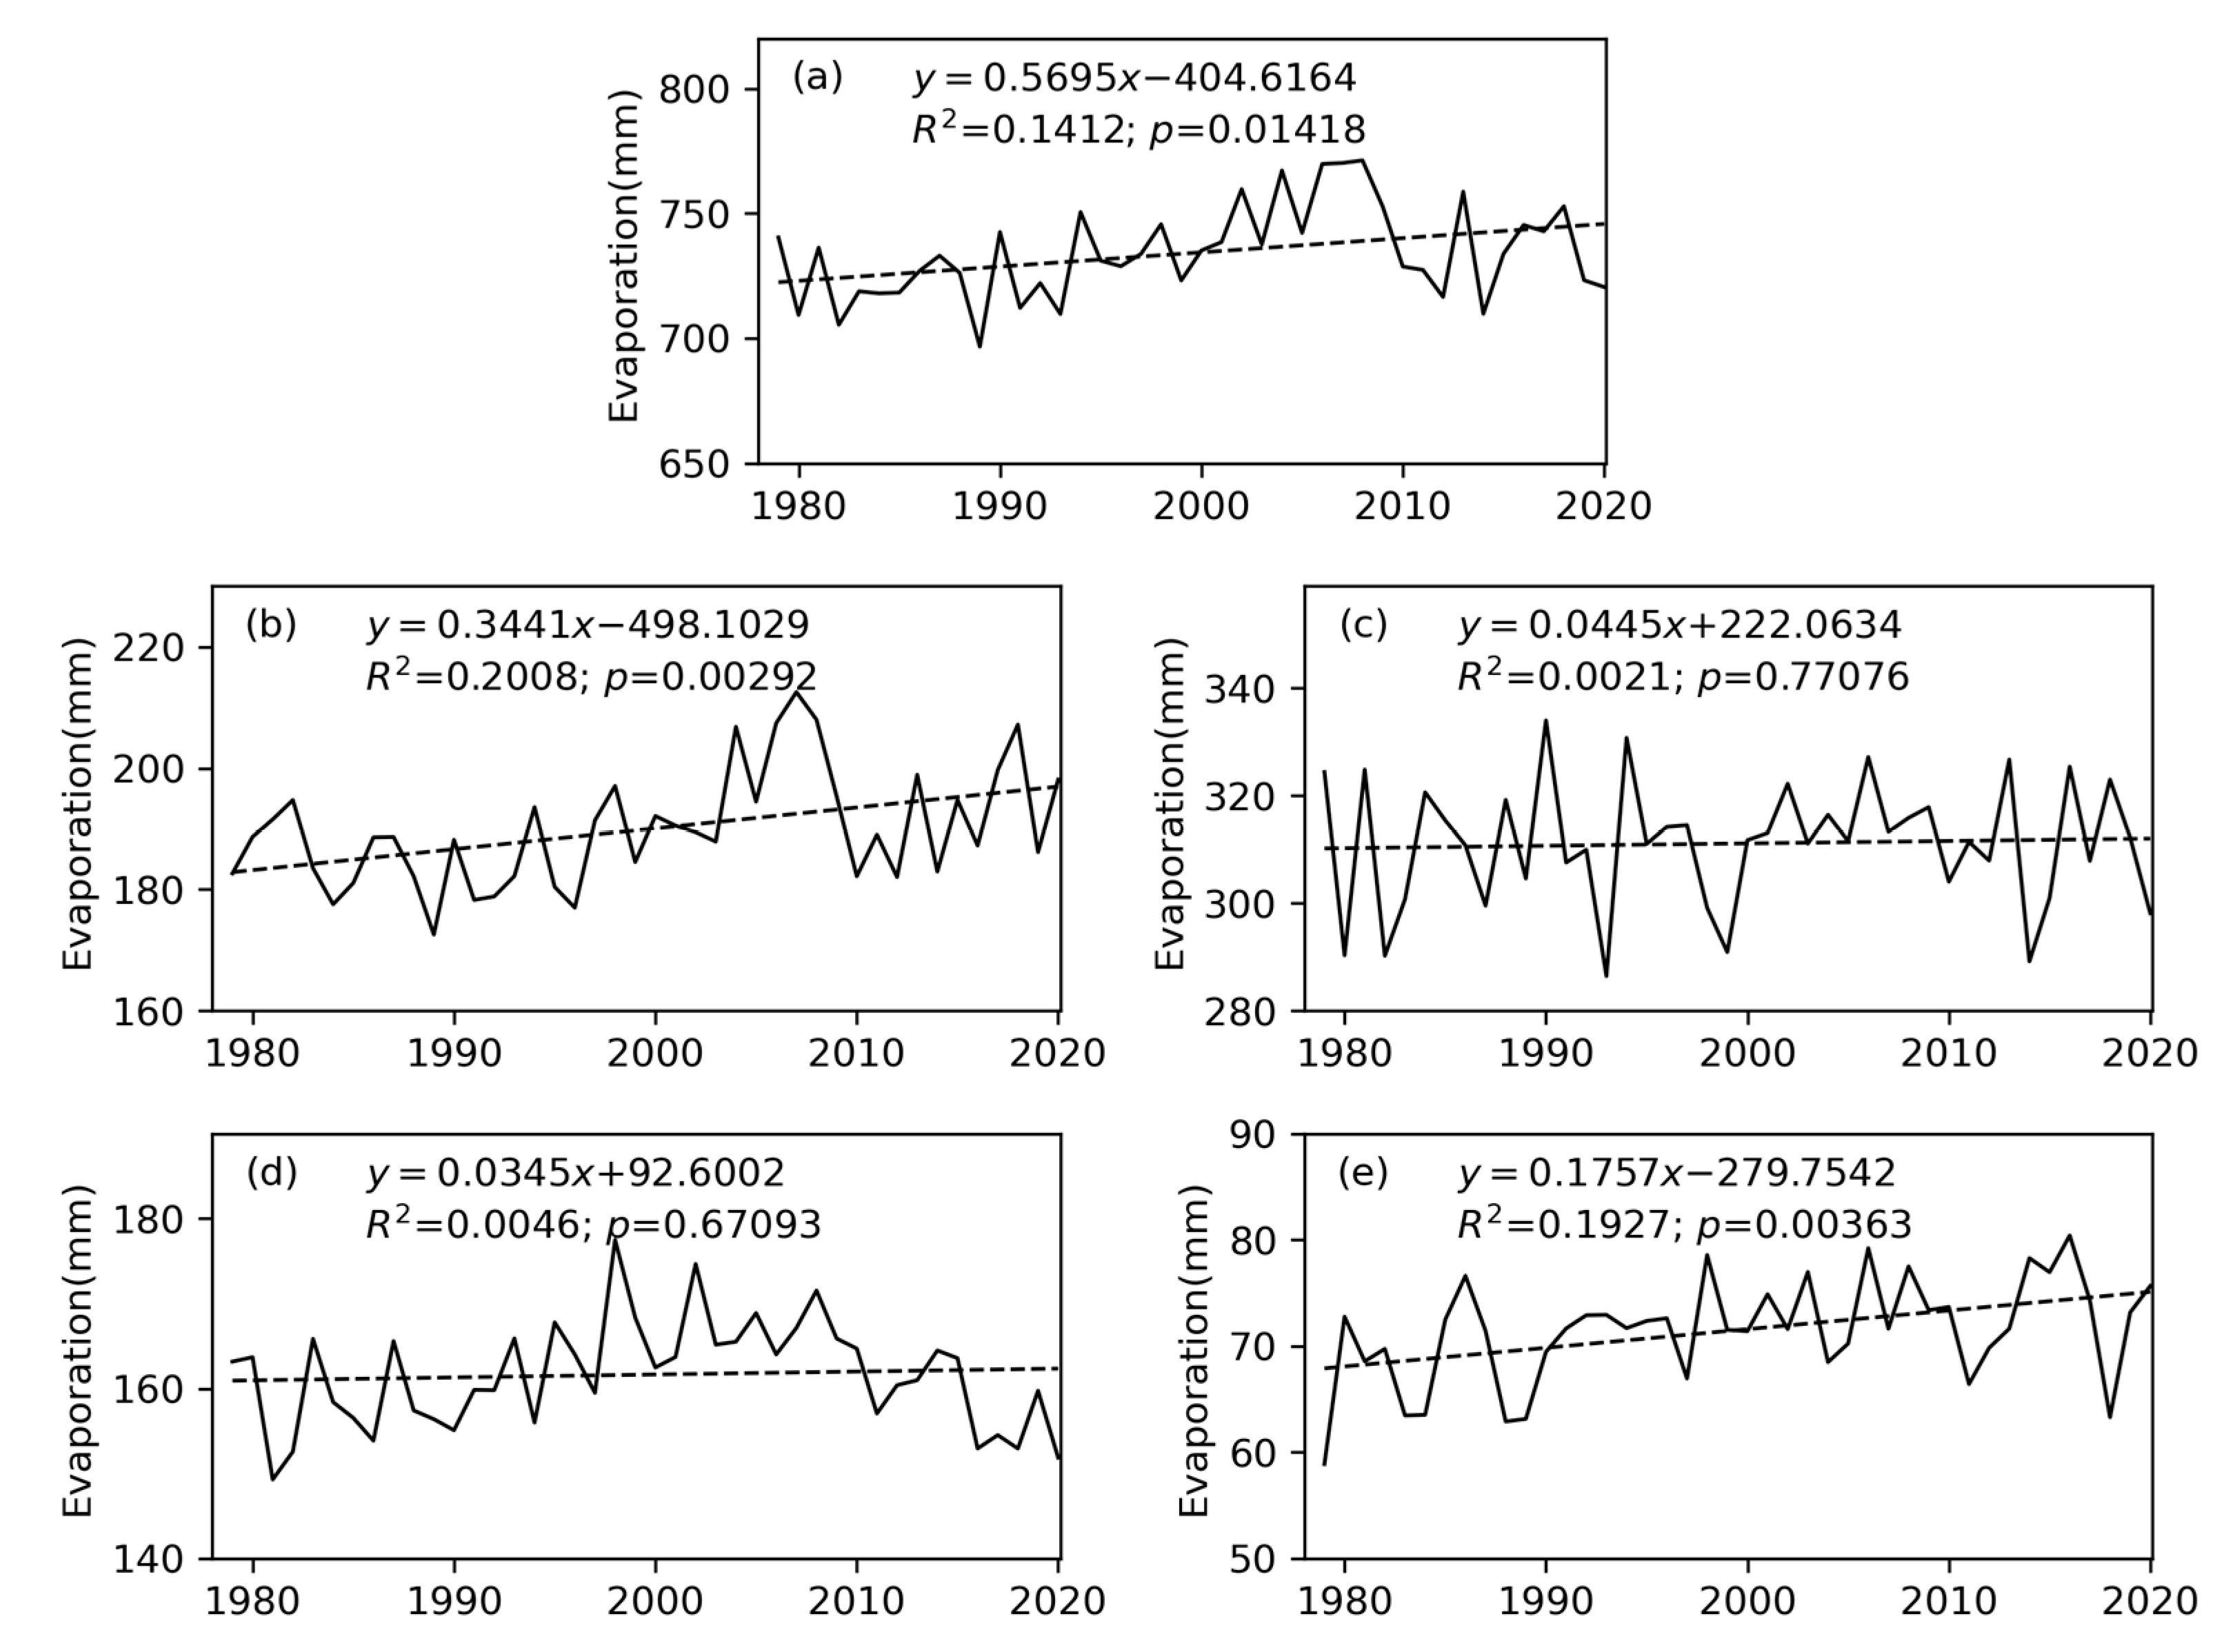
3.2. Changes in Evapotranspiration in YRB

The variation of precipitation recycling is the result of the combination of local evapotranspiration variation and external water vapor transport. The temporal variation of evapotranspiration in YRB is given in Figure 7. In the context of global warming, evapotranspiration in YRB shows a certain increasing trend with an increased rate of 5.7 mm/10a (p-value = 0.01418). It is mainly reflected in spring and winter with an increased rate of 3.4 mm/10a (p-value = 0.00292) and 1.8 mm/10a (p-value = 0.00363), respectively, while the changing trend in summer and autumn is not obvious. Since we directly used ERA5 evaporation here, it is not possible to precisely determine the cause of the increase, but it is generally accepted that increasing temperature could increase evaporation, which is evidence of the global water cycle accelerating [44]. It has also been suggested that temperature is not the only factor affecting the change of evapotranspiration, and the influence of various factors such as radiation, wind speed, cloud, and subsurface water supply conditions make the change of evapotranspiration very complex, and the characteristics of the change vary from region to region [45]. Some studies have found that pan evaporation in the Yangtze River Basin shows a downward trend [46,47,48] rather than increasing with the increase of temperature, which belong to the so-called “evaporation paradox” phenomenon [46]. It has been suggested that pan evaporation or potential evapotranspiration reflects only the evaporation capacity of the atmosphere under adequate water supply conditions and is complementary to the actual evapotranspiration. The decrease in the former corresponds to the increase in the latter. However, in YRB, the actual evapotranspiration calculated by the complementary theoretical model based on meteorological station observations is also decreasing [47], which is not quite consistent with the results analyzed in this paper. Due to the complexity of evapotranspiration, an in-depth study is necessary.
The spatial distribution of evapotranspiration in YRB is given in Figure 8. It can be seen that it roughly shows the characteristics of high in the east and low in the west, where the annual evapotranspiration in the eastern region basically lives above 700 mm/a, while the annual evapotranspiration in the river source area, which is located in the west, is generally within 400 mm. The spatial patterns of annual and seasonal evapotranspiration are basically the same with the exception of the Sichuan basin region, which is a relatively high-value area although it is located in the middle and west of YRB, which is very consistent with the spatial distribution of ρ.

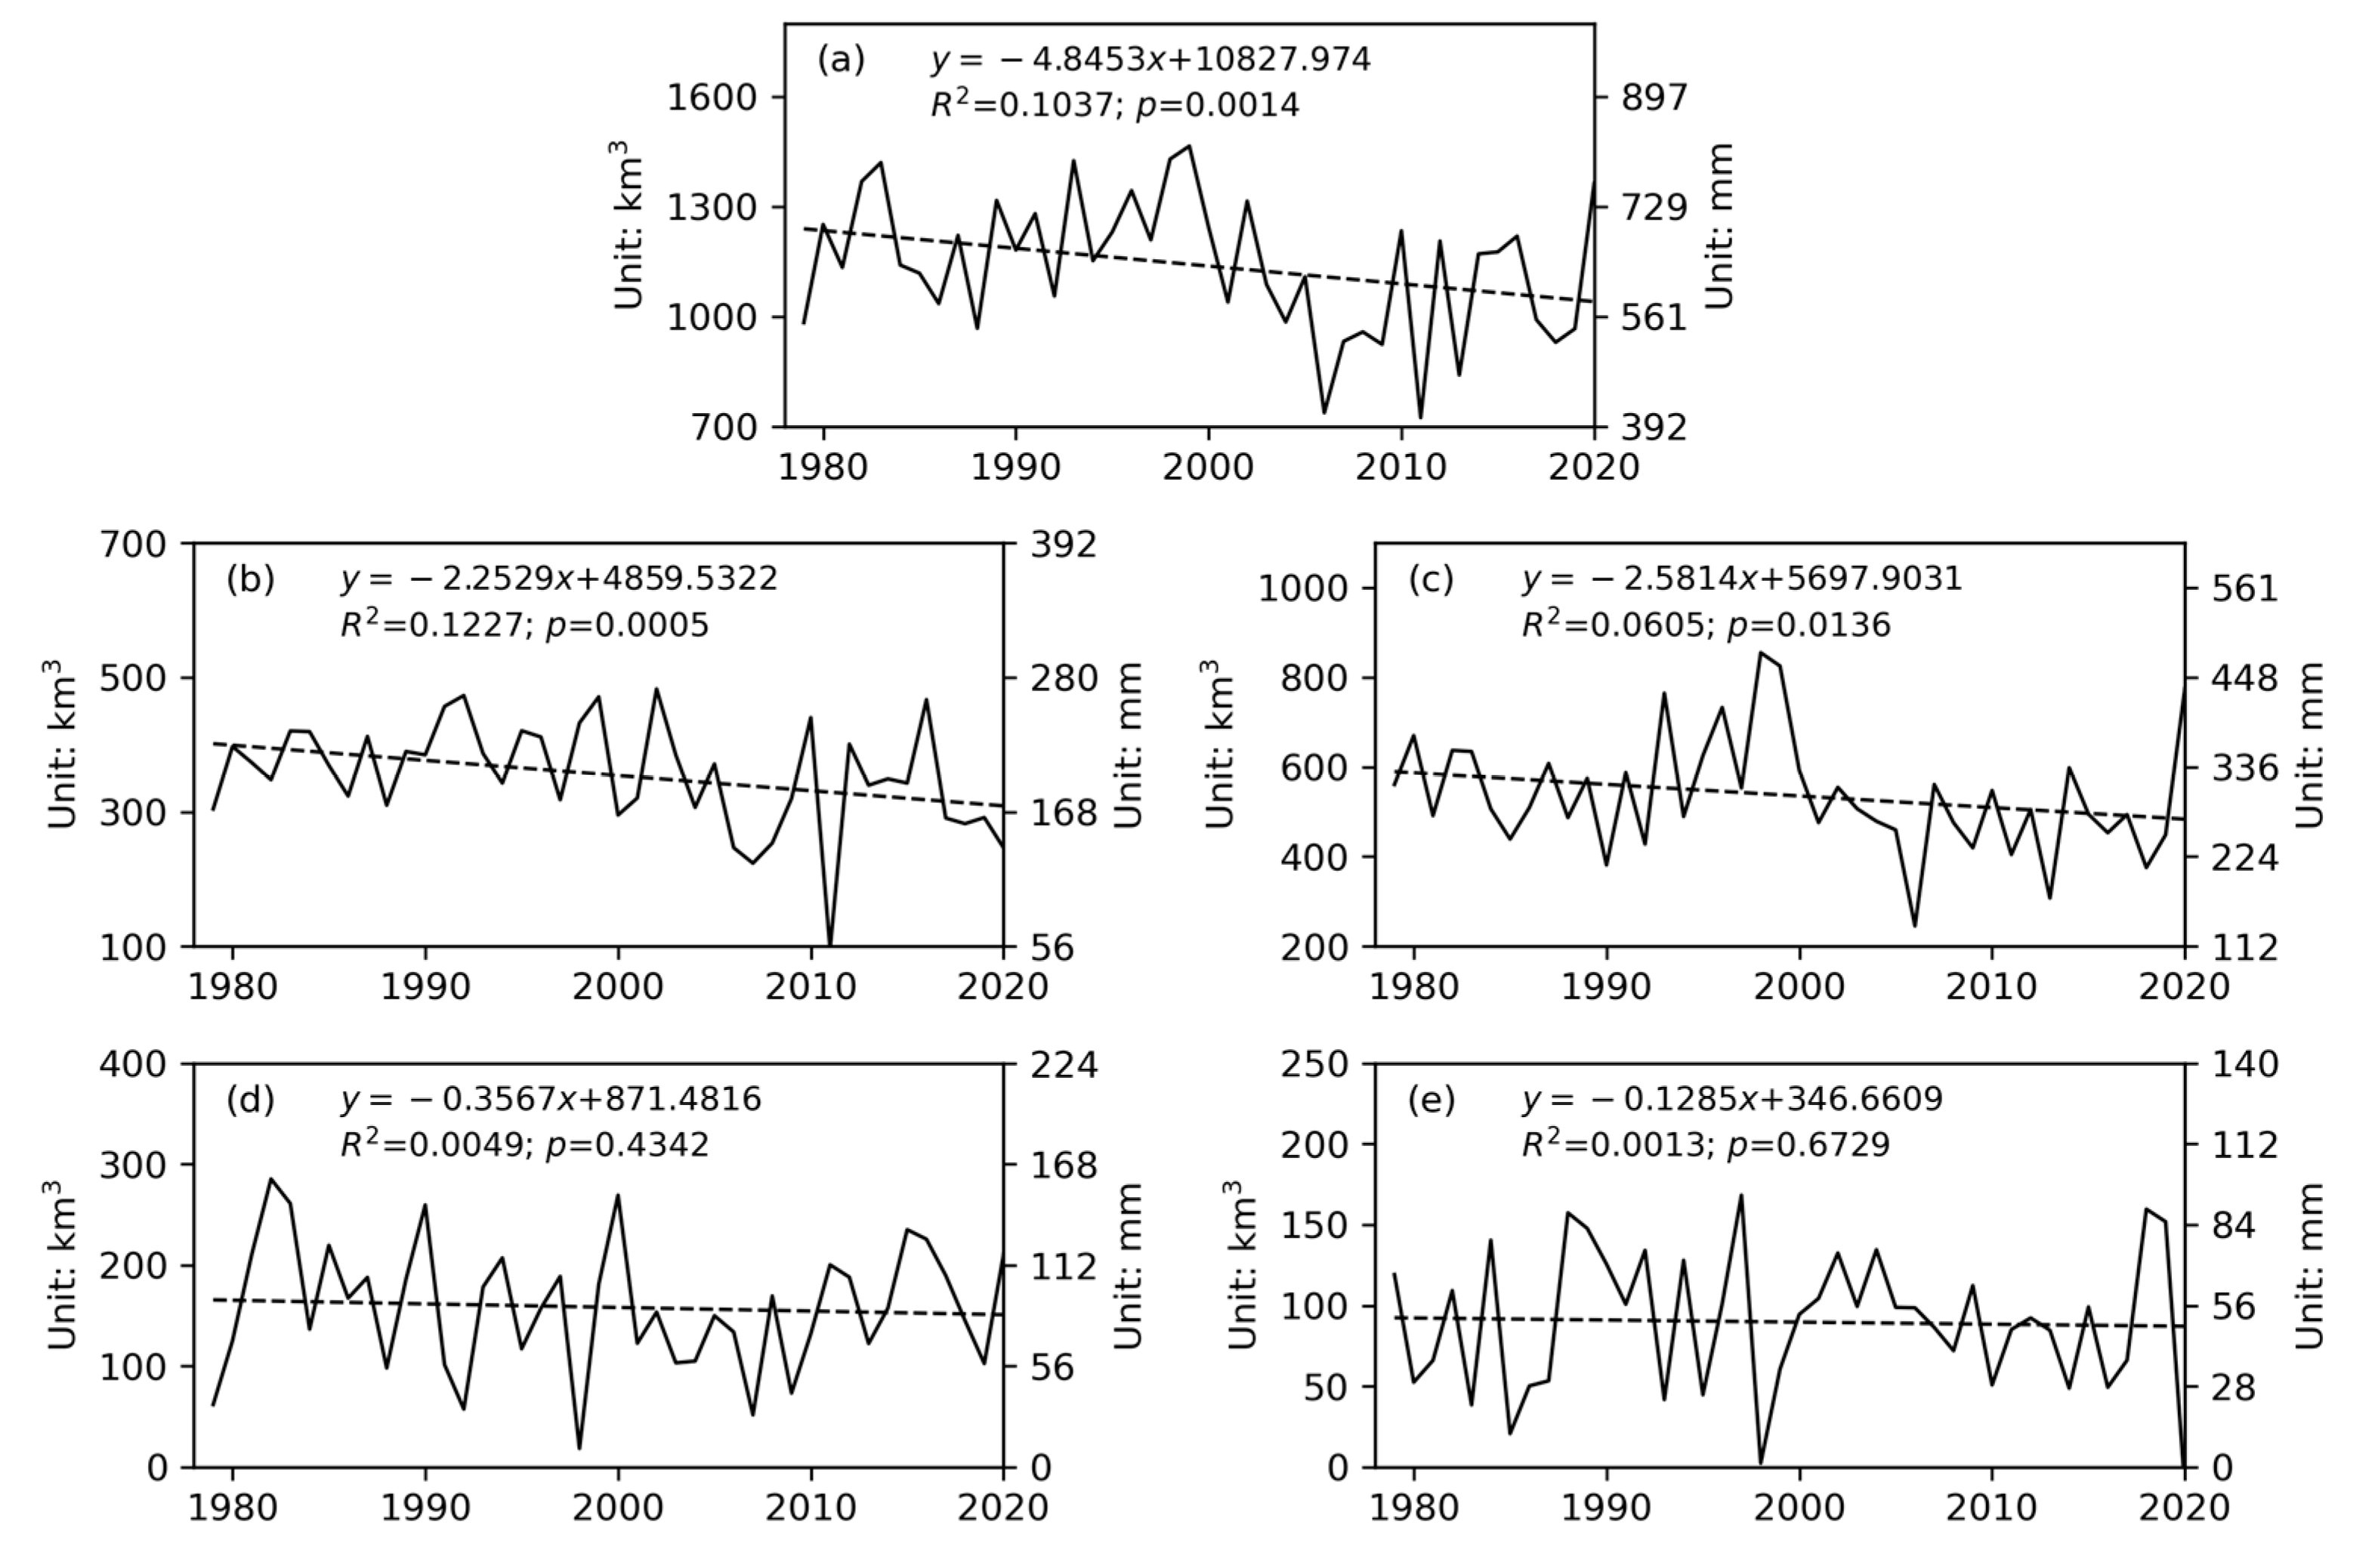
3.3. Change of External Moisture Flux

YRB is located in the Asia monsoon region, and water vapor transport is mainly influenced by the East Asian monsoon and South Asian monsoon, and water vapor brought by the monsoon airflow is the main source of its precipitation. The West Pacific Ocean, South China Sea, Bay of Bengal, and Indian Ocean are the four major water vapor source areas of YRB and transport water vapor to YRB through four important channels, including water vapor transport from the southwest monsoon in the South China Sea; water vapor transport from the southwest airflow in the west side of the West Pacific paramount; water vapor transport from the southwest monsoon in the Indian Ocean and the Bay of Bengal. In addition, water vapor transport from the westerly wind belt in the middle and high latitudes is also one of the sources of water vapor in the Yangtze River, but the amount of water vapor transport is relatively small and mainly affects the upper Yangtze River area in winter and spring. In summer, YRB is most obviously influenced by monsoonal water vapor transport, and the water vapor transport flux is the strongest (Figure 9).
Figure 10 gives the annual and four-season net water vapor budget in YRB. It can be seen that the annual water vapor budget in the YRB shows a decreasing trend, with a decrease rate of 48.5 km3/10a (p-value = 0.0014), mainly from the contribution of decreasing water vapor balance in spring and summer. The rate of decline reached 22.5 km3/10a (p value = 0.0005) in spring and 25.8 km3/10a (p value = 0.0005) in summer. In addition, the trend of water vapor budget in autumn and winter is not significant, with p values greater than 0.1. Dividing by the area of the YRB (178.4 × 10⁴ km2), the water vapor budget in mm can be obtained, which can be easily compared with evaporation and precipitation in the basin (see the right vertical axis in Figure 10).

3.4. Difference Contributions between Evaporation and External Moisture Flux to Precipitation

The annual average precipitation of YRB is approximately 1071.5 mm (Table 1), showing an overall increasing trend, with an increased rate of 11.9 mm/10a (not passing the significance test). According to Equation (1), the total precipitation can be divided into internal recycling precipitation (Pw) and external cycling precipitation (Po, Table 1). Pw (precipitation contributed by local evaporation) in the basin was about 141.6 mm/a, and the Po (precipitation contributed by advection moisture) was about 929.9 mm/a. Both values showed increasing trends, with increasing rates of 8.2 mm/10a (passing the 0.1 significance level test) and 3.7 mm/10a (failing the significance test), respectively. The results show that the Po accounts for the majority of the total precipitation in YRB; however, 68.9% of the increase in precipitation in the basin was contributed by Pw, while 31.1% was contributed by Po.
Seasonal changes in Pw and Po showed clear differences. Owing to the typical characteristics of the monsoon climate, YRB was dominated by summer precipitation (approximately 487.7 mm/a), accounting for 45.5% of annual precipitation. Summer Pw was about 100.4 mm/a, showing an increasing trend of 6.2 mm/10a, while summer Po was about 387.2 mm/a, showing a decreasing trend of −6.8 mm/10a. Their contributions to the total precipitation in summer almost canceled each other out. The spring precipitation in the basin was approximately 281.1 mm/a, accounting for 26.2% of the annual precipitation. Spring Pw was about 19.2 mm/a, showing a slight increase trend, while spring Po was about 262.0 mm/a, showing an increasing trend, with an increased rate of about 5.5 mm/10a. The autumn precipitation was approximately 213.0 mm/a, accounting for 19.9% of the annual precipitation. Autumn Pw was about 19.5 mm/a, showing a slight increase trend, and autumn Po was about 193.6 mm/a, also showing a slight increase trend. There was less precipitation in winter, approximately 88.5 mm/a, which accounted for only 8.3% of annual precipitation. Moisture-producing precipitation mainly came from outside the region.
Figure 11 shows the spatial distribution of total precipitation (P), Po, and Pw in YRB. The spatial distribution of P in the Basin was greater in the southeast and lesser in the northwest; that is, it gradually increased from the upstream to the downstream. The spatial distribution of Po was consistent with that of P, whereas the spatial distribution of Pw was high in the upper reaches and low in the middle and lower reaches. The high-value area is located in the Sichuan Basin in the upper reaches. The changing trend of P in YRB has complex spatial and seasonal differences (Figure 12). The P in the lower reaches increased significantly but decreased in the middle and upper reaches, with the exception of high-altitude areas at the source of the Yangtze River and the eastern part of the middle reaches. The distribution of the changing trend of Po was consistent with that of P, indicating that the distribution of Po significantly dominates that of P, especially in summer. Pw showed an increase in the entire basin, especially in the upper reaches at high altitudes. The spatial difference between Pw and Po complicates changes to P.

4. Conclusions and Discussion

In this paper, we use the Eltahir two-dimensional moisture recycling model and the iso-scale calculation method; we calculated and analyzed changes in the precipitation recycling ratio (ρ) in the Yangtze River basin (YRB) and quantitatively evaluated the contribution of local evaporation and advection moisture to precipitation changes in YRB. The main conclusions are as follows: (1) The multi-year average precipitation recycling ratio in YRB is about 10.3%, with the highest in summer, up to 21.8% on average, below 10% in spring and autumn, and the lowest in winter, only about 3.5%. (2) Over the past 40 years, the annual ρ in the basin has shown an increasing trend, with an increased rate of approximately 0.4%/10a, and the most significant increase rate was in summer, with an increased rate of 1.2%/10a. (3) ρ in the upper reaches of the western basin was significantly higher than that in the lower reaches of the eastern basin. The annual average ρ in the upper reaches is 15–35% and can reach 20–50% in summer, whereas in the downstream area, it is below 10%. (4) From 1979 to 2020, the annual precipitation in the basin showed an increasing trend, and the internal recycling precipitation (Pw) contributed 68.9% to the increase in precipitation, with contributions in all seasons, particularly in summer. The contribution of external cycling precipitation (Po) to the increase in annual precipitation in the basin was 31.1%, which is mainly attributed to the positive contribution of spring and autumn precipitation. Owing to the downward trend of advection moisture in summer, the contribution to precipitation increases in the basin canceled each other out with other seasons, making the contribution of Po to precipitation increase less than half of that of Pw. (5) The spatiotemporal variation in precipitation in YRB is mainly dominated by Po, while the variation in Pw makes the temporal and spatial distribution of total precipitation more complex.
We compared the results of Liu [27] and Yi [28], which are the earliest studies on precipitation recycling in YRB. Among them, Liu [27] concluded that the contribution of local evaporation to precipitation in YRB is about 14.1%, which is slightly higher than our results; But the conclusions of Yi [28] are very close to those of this paper, including the annual average value and seasonal variations of the recycling ratio. The spatial distribution is also very similar, with the high-value areas all located in the Sichuan basin. The most recent study from Fremme and Sodemann [34], whose study area is mainly located in the middle and lower reaches of YRB, is very consistent with ours in terms of basic conclusions, although the study area is smaller than ours and the methods of the study are different. This indicates that our conclusions are still reliable, and that our proposed iso-scale calculation scheme performs stably.
Nevertheless, there might are still some uncertainties in our study. The first is from the underlying data. In this study, we only used EAR5 data, including evaporation and water vapor transport data, which quality directly determines the accuracy of our results. The application of actual observation data, if any, will improve the reliability of our results. For example, for evaporation data, some early studies actually found that actual evapotranspiration in YRB showed a decreasing trend [47], while evaporation using ERA5 data was increasing. Due to the complexity of evaporation itself, it is not yet certain which result is more accurate. In addition, in terms of models, our study is yet to be compared from different model calculations, and in some comparative studies available, there are some differences in the performance of different models in the same area, some of which are significant.

Author Contributions

Conceptualization, X.L.; methodology, P.W.; software, X.L.; validation, P.W.; formal analysis, P.W.; data curation, P.W.; writing—original draft preparation, X.L.; writing—review and editing, P.W.; visualization, X.L. All authors have read and agreed to the published version of the manuscript.

Funding

Second Tibetan Plateau Scientific Expedition and Research Program (STEP), grant number 2019QZKK0208, and China Three Gorges Corporation Project, grant number 0704182 and 0704181.

Data Availability Statement

The data in this study are available from the corresponding authors upon request.

Conflicts of Interest

The authors declare no conflict of interest.

References

  1. Budyko, M.I. Climate and Life; Academic Press: New York, NY, USA; London, UK, 1974. [Google Scholar]
  2. Starr, V.P.; Peixoto, J.P. On the Global Balance of Water Vapor and the Hydrology of Deserts. Tellus 1958, 10, 188–194. [Google Scholar] [CrossRef] [Green Version]
  3. Horton, R.E. Hydrologic Interrelations between Lands and Oceans. Eos Trans. Am. Geophys. Union 1943, 24, 753–764. [Google Scholar] [CrossRef]
  4. McDonald, J.E. The Evaporation-Precipitation Fallacy. Weather 1962, 17, 168–177. [Google Scholar] [CrossRef]
  5. Dansgaard, W. Stable Isotopes in Precipitation. Tellus 1964, 16, 436–468. [Google Scholar] [CrossRef]
  6. Molion, L.C.B. A Climatonomic Study of the Energy and Moisture Fluxes of the Amazonas Basin with Considerations of Deforestation Effects; The University of Wisconsin-Madison: Madison, WI, USA, 1975. [Google Scholar]
  7. Lettau, H.; Lettau, K.; Molion, L.C.B. Amazonia’s Hydrologic Cycle and the Role of Atmospheric Recycling in Assessing Deforestation Effects. Mon. Weather Rev. 1979, 107, 227–238. [Google Scholar] [CrossRef]
  8. Brubaker, K.L.; Entekhabi, D.; Eagleson, P.S. Estimation of Continental Precipitation Recycling. J. Clim. 1993, 6, 1077–1089. [Google Scholar] [CrossRef]
  9. Burde, G.I.; Zangvil, A.; Lamb, P.J. Estimating the Role of Local Evaporation in Precipitation for a Two-Dimensional Region. J. Clim. 1996, 9, 1328–1338. [Google Scholar] [CrossRef]
  10. Eltahir, E.A.B.; Bras, R.L. Precipitation Recycling in the Amazon Basin. Q. J. R. Meteorol. Soc. 1994, 120, 861–880. [Google Scholar] [CrossRef]
  11. Gat, J.R.; Matsui, E. Atmospheric Water Balance in the Amazon Basin: An Isotopic Evapotranspiration Model. J. Geophys. Res. Atmos. 1991, 96, 13179–13188. [Google Scholar] [CrossRef]
  12. Craig, H.; Gordon, L. Deuterium and Oxygen 18 Variations in the Ocean and Marine Atmosphere. In Stable Isotopes in Oceanographic Studies and Paleotemperatures; Tongiorgi, E., Ed.; Laboratiorio di Geologica Nucleare: Spoleto, Italy, 1965; pp. 9–130. [Google Scholar]
  13. Joussaume, S.; Sadourny, R.; Jouzel, J. A General Circulation Model of Water Isotope Cycles in the Atmosphere. Nature 1984, 311, 24–29. [Google Scholar] [CrossRef]
  14. Cole, J.E.; Rind, D.; Webb, R.S.; Jouzel, J.; Healy, R. Climatic Controls on Interannual Variability of Precipitation Δ18O: Simulated Influence of Temperature, Precipitation Amount, and Vapor Source Region. J. Geophys. Res. Atmos. 1999, 104, 14223–14235. [Google Scholar] [CrossRef]
  15. Risi, C.; Bony, S.; Vimeux, F.; Frankenberg, C.; Noone, D.; Worden, J. Understanding the Sahelian Water Budget through the Isotopic Composition of Water Vapor and Precipitation. J. Geophys. Res. Atmos. 2010, 115, D24110. [Google Scholar] [CrossRef] [Green Version]
  16. Burde, G.I.; Zangvil, A. The Estimation of Regional Precipitation Recycling. Part II: A New Recycling Model. J. Clim. 2001, 14, 2509–2527. [Google Scholar] [CrossRef]
  17. Dominguez, F.; Kumar, P.; Liang, X.-Z.; Ting, M. Impact of Atmospheric Moisture Storage on Precipitation Recycling. J. Clim. 2006, 19, 1513–1530. [Google Scholar] [CrossRef]
  18. van der Ent, R.J.; Savenije, H.H.G.; Schaefli, B.; Steele-Dunne, S.C. Origin and Fate of Atmospheric Moisture over Continents. Water Resour. Res. 2010, 46, W09525. [Google Scholar] [CrossRef] [Green Version]
  19. Numaguti, A. Origin and Recycling Processes of Precipitating Water over the Eurasian Continent: Experiments Using an Atmospheric General Circulation Model. J. Geophys. Res. Atmos. 1999, 104, 1957–1972. [Google Scholar] [CrossRef]
  20. Bosilovich, M.G.; Schubert, S.D. Water Vapor Tracers as Diagnostics of the Regional Hydrologic Cycle. J. Hydrometeorol. 2002, 3, 149–165. [Google Scholar] [CrossRef]
  21. Sodemann, H.; Wernli, H.; Schwierz, C. Sources of Water Vapour Contributing to the Elbe Flood in August 2002—A Tagging Study in a Mesoscale Model. Q. J. R. Meteorol. Soc. 2009, 135, 205–223. [Google Scholar] [CrossRef]
  22. Knoche, H.R.; Kunstmann, H. Tracking Atmospheric Water Pathways by Direct Evaporation Tagging: A Case Study for West Africa. J. Geophys. Res. Atmos. 2013, 118, 12,345–12,358. [Google Scholar] [CrossRef]
  23. Dominguez, F.; Miguez-Macho, G.; Hu, H. WRF with Water Vapor Tracers: A Study of Moisture Sources for the North American Monsoon. J. Hydrometeorol. 2016, 17, 1915–1927. [Google Scholar] [CrossRef]
  24. Peng, H.; Mayer, B.; Norman, A.-L.; Krouse, H.R. Modelling of Hydrogen and Oxygen Isotope Compositions for Local Precipitation. Tellus B Chem. Phys. Meteorol. 2005, 57, 273. [Google Scholar] [CrossRef]
  25. Froehlich, K.; Kralik, M.; Papesch, W.; Rank, D.; Scheifinger, H.; Stichler, W. Deuterium Excess in Precipitation of Alpine Regions—Moisture Recycling. Isot. Environ. Health Stud. 2008, 44, 61–70. [Google Scholar] [CrossRef]
  26. Peng, T.-R.; Liu, K.-K.; Wang, C.-H.; Chuang, K.-H. A Water Isotope Approach to Assessing Moisture Recycling in the Island-Based Precipitation of Taiwan: A Case Study in the Western Pacific. Water Resour. Res. 2011, 47, W08507. [Google Scholar] [CrossRef]
  27. Liu, G.; Wang, J. A Study on Hydrologic Cycle of Land-Atmosphere System of China. Adv. Water Sci. 1997, 8, 99–107. [Google Scholar]
  28. Yi, L.; Tao, S. Construction and Analysis of a Precipitation Recycling Model. Adv. Water Sci. 1997, 8, 205–211. [Google Scholar]
  29. Kang, H.; Gu, X.; Zhu, G.; Paul, W. Precipitation Recycling in Southern and Central China. Chin. J. Atmospheric Sci. 2004, 28, 892–900. [Google Scholar]
  30. Kang, H.; Gu, X.; Fu, X.; Xu, X. Precipitation Recycling over the Northern China. J. Appl. Meteorol. Sci. 2005, 16, 139–147. [Google Scholar]
  31. Hua, L.; Zhong, L.; Ke, Z. Precipitation Recycling and Soil–Precipitation Interaction across the Arid and Semi-Arid Regions of China. Int. J. Climatol. 2016, 36, 3708–3722. [Google Scholar] [CrossRef]
  32. Hua, L.; Zhong, L.; Ke, Z. Characteristics of the Precipitation Recycling Ratio and Its Relationship with Regional Precipitation in China. Theor. Appl. Climatol. 2017, 127, 513–531. [Google Scholar] [CrossRef]
  33. Su, T.; Lu, Z.; Zhou, J.; Hou, W.; Li, Y.; Tu, G. Spatial Distribution and Seasonal Variation Characteristics of Global Atmospheric Moisture Recycling. Acta Phys. Sin. 2014, 63, 099201. [Google Scholar] [CrossRef]
  34. Fremme, A.; Sodemann, H. The Role of Land and Ocean Evaporation on the Variability of Precipitation in the Yangtze River Valley. Hydrol. Earth Syst. Sci. 2019, 23, 2525–2540. [Google Scholar] [CrossRef] [Green Version]
  35. Wu, P.; Ding, Y.; Liu, Y.; Li, X. The Characteristics of Moisture Recycling and Its Impact on Regional Precipitation against the Background of Climate Warming over Northwest China. Int. J. Climatol. 2019, 39, 5241–5255. [Google Scholar] [CrossRef]
  36. Li, X.; Wu, P.; Ding, Y.; Liu, Y.; Li, Q. Spatial-Temporal Variation of Precipitation Recycling over the Tibetan Plateau under Climate Warming. Atmospheric Res. 2022, 280, 106431. [Google Scholar] [CrossRef]
  37. Zhao, Y.; Zhou, T. Interannual Variability of Precipitation Recycle Ratio Over the Tibetan Plateau. J. Geophys. Res. Atmos. 2021, 126, e2020JD033733. [Google Scholar] [CrossRef]
  38. Zhang, B.; He, Y.; Ren, Y.; Huang, B.; Peng, Y.; Wang, S.; Guan, X. The Influence of the Precipitation Recycling Process on the Shift to Heavy Precipitation over the Tibetan Plateau in the Summer. Front. Earth Sci. 2023, 11, 1078501. [Google Scholar] [CrossRef]
  39. Hersbach, H.; Bell, B.; Berrisford, P.; Hirahara, S.; Horányi, A.; Muñoz-Sabater, J.; Nicolas, J.; Peubey, C.; Radu, R.; Schepers, D.; et al. The ERA5 Global Reanalysis. Q. J. R. Meteorol. Soc. 2020, 146, 1999–2049. [Google Scholar] [CrossRef]
  40. He, J.; Yang, K.; Tang, W.; Lu, H.; Qin, J.; Chen, Y.; Li, X. The First High-Resolution Meteorological Forcing Dataset for Land Process Studies over China. Sci. Data 2020, 7, 1–11. [Google Scholar] [CrossRef] [Green Version]
  41. Li, Y.; Qin, X.; Liu, Y.; Jin, Z.; Liu, J.; Wang, L.; Chen, J. Evaluation of Long-Term and High-Resolution Gridded Precipitation and Temperature Products in the Qilian Mountains, Qinghai–Tibet Plateau. Front. Environ. Sci. 2022, 10, 906821. [Google Scholar] [CrossRef]
  42. Lei, N.; Zhou, Z.; Zhuang, Q.; Chen, W.; Chalov, S.; Liu, S.; Gao, L.; Dong, G. Performance Evaluation and Improvement of CMFD’s Precipitation Products Over Shanghai City, China. Earth Space Sci. 2023, 10, e2022EA002690. [Google Scholar] [CrossRef]
  43. Hirsch, R.M.; Slack, J.R.; Smith, R.A. Techniques of Trend Analysis for Monthly Water Quality Data. Water Resour. Res. 1982, 18, 107–121. [Google Scholar] [CrossRef] [Green Version]
  44. Huntington, T.G. Evidence for Intensification of the Global Water Cycle: Review and Synthesis. J. Hydrol. 2006, 319, 83–95. [Google Scholar] [CrossRef]
  45. Wang, K.; Dickinson, R.E.; Wild, M.; Liang, S. Evidence for Decadal Variation in Global Terrestrial Evapotranspiration between 1982 and 2002: 1. Model Development. J. Geophys. Res. Atmos. 2010, 115, D20112. [Google Scholar] [CrossRef] [Green Version]
  46. Brutsaert, W.; Parlange, M.B. Hydrologic Cycle Explains the Evaporation Paradox. Nature 1998, 396, 30. [Google Scholar] [CrossRef] [Green Version]
  47. Wang, Y.; Liu, B.; Su, B.; Zhai, J.; Gemmer, M. Trends of Calculated and Simulated Actual Evaporation in the Yangtze River Basin. J. Clim. 2011, 24, 4494–4507. [Google Scholar] [CrossRef]
  48. Cong, Z.T.; Yang, D.W.; Ni, G.H. Does Evaporation Paradox Exist in China? Hydrol. Earth Syst. Sci. 2009, 13, 357–366. [Google Scholar] [CrossRef] [Green Version]
Figure 1. Topographic map of YRB.
Water 15 02407 g001
Figure 2. Schematic diagram of precipitation recycling [36].
Water 15 02407 g002
Figure 3. Sketch map of the “iso-scale” calculation method of ρ [36].
Water 15 02407 g003
Figure 4. Time series of ρ in YRB ((a): annual; (b): spring; (c): summer; (d): autumn; (e): winter; units: %; R2: coefficient of determination; p: p-value).
Water 15 02407 g004
Figure 5. Spatial distribution of ρ in YRB ((a): annual; (b): spring; (c): summer; (d): autumn; (e): winter; units: %).
Water 15 02407 g005
Figure 6. Spatial distribution of changes to ρ in YRB ((a): annual; (b): spring; (c): summer; (d): autumn; (e): winter; MK-test, black dots mean the trends are significant at 95% confidence level).
Water 15 02407 g006
Figure 7. Time series of evapotranspiration in YRB ((a): annual; (b): spring; (c): summer; (d): autumn; (e): winter; units: mm; R2: coefficient of determination; p: p-value).
Water 15 02407 g007
Figure 8. Spatial distribution of evapotranspiration in YRB ((a): annual; (b): spring; (c): summer; (d): autumn; (e) winter; units: mm).
Water 15 02407 g008
Figure 9. Average water vapor transport flux in YRB ((a): annual; (b): spring; (c): summer; (d): autumn; (e) winter; units: kg/(m·s)).
Water 15 02407 g009
Figure 10. Temporal variation of annual and seasonal water vapor budget in YRB ((a): annual; (b): spring; (c): summer; (d): autumn; (e) winter; units: 106 kg/s; R2: coefficient of determination; p: p-value).
Water 15 02407 g010
Figure 11. Spatial distribution of P (ae), Po (fj), and Pw (ko) in YRB.
Water 15 02407 g011
Figure 12. Same as Figure 11 but for linear trends (mm/10a); black dots indicate significance at the 99% confidence level.
Water 15 02407 g012
Table 1. Changes in total precipitation (P), internal recycling precipitation (Pw), and external cycling precipitation (Po) in YRB during 1979–2020 (mean and cumulative change: mm, variabilities: mm/10a).
PPwPo
MeanVariabilityCumulative Change
P)
MeanVariabilityCumulative Change (ΔPw)MeanVariabilityCumulative Change (ΔPo)
Annual1071.511.947.4141.68.232.7929.93.714.7
Spring281.16.124.219.20.62.4262.05.521.9
Summer487.7−0.6−2.2100.46.224.9387.2−6.8−27.1
Autumn213.03.513.819.51.24.9193.62.28.9
Winter88.5−0.3−1.32.40.10.386.0−0.4−1.6
Disclaimer/Publisher’s Note: The statements, opinions and data contained in all publications are solely those of the individual author(s) and contributor(s) and not of MDPI and/or the editor(s). MDPI and/or the editor(s) disclaim responsibility for any injury to people or property resulting from any ideas, methods, instructions or products referred to in the content.

