Article

Extreme Summer Precipitation Characteristics and Associated Water Vapor Transport in Southern Xinjiang

1
College of Geography and Remote Sensing Sciences, Xinjiang University, Urumqi 830002, China
2
Institute of Desert Meteorology, China Meteorological Administration, Urumqi 830002, China
3
Jinzhou Meteorological Bureau, Jinzhou 121000, China
4
Taklimakan Desert Meteorology Field Experiment Station of China Meteorological Administration, Urumqi 830002, China
5
Xinjiang Key Laboratory of Desert Meteorology and Sandstorm, Urumqi 830002, China
6
Collaborative Innovation Center on Forecast and Evaluation of Meteorological Disasters, Key Laboratory for Aerosol-Cloud Precipitation of China Meteorological Administration, Nanjing University of Information Science and Technology, Nanjing 210044, China
*
Author to whom correspondence should be addressed.
Water 2023, 15(13), 2361; https://doi.org/10.3390/w15132361
Submission received: 8 June 2023 / Revised: 20 June 2023 / Accepted: 23 June 2023 / Published: 27 June 2023

Abstract

:
In this study, we analyzed the spatial and temporal characteristics of extreme precipitation in summer in southern Xinjiang (SXJ) using CN05.1 daily precipitation data, the National Centers for Environmental Prediction (NCEP) monthly average data, and ERA5 four-times-daily reanalysis data from 1961 to 2020, determined the interdecadal variation in extreme precipitation, and further explored the circulation mechanisms and anomalous water vapor transport characteristics associated with changes in extreme precipitation. The results showed that extreme precipitation, extreme precipitation days, and extreme precipitation contribution in SXJ all increased significantly, with the turnaround occurring in 1986. Enhanced vertical upward motion, greater convergence of water vapor at lower levels, and a more unstable atmospheric convection led to an increase in extreme precipitation along the southern border region. The eastward Pacific Ocean and southward Indian Ocean provided anomalous water vapor transport, and the boundary water vapor flux trend and its correlated distribution with extreme precipitation showed that southern boundary water vapor transport played an important role in the increase in extreme precipitation. At vertical heights, the dominant longitudinal water vapor transport fluxes were concentrated in the middle and upper layers, whereas the latitudinal water vapor transport fluxes were concentrated in the middle and lower layers.

1. Introduction

Southern Xinjiang (SXJ) is adjacent to the Qinghai–Tibet Plateau, which forms the Tarim Basin, has an area of 530,000 km2, and is surrounded by the Tianshan Mountains and the Pamirs. The topography in SXJ is very complex, and the special atmospheric circulation and water vapor conditions produce precipitation with unique characteristics, which are represented by scarce precipitation along with significant interdecadal variations in precipitation levels [1,2,3]. According to the IPCC Sixth Assessment Report, extreme rainfall events are projected to become more frequent globally, which will lead to significant increases in rainfall [4]. In recent years, there has been an obvious increasing trend in rainstorms in SXJ [5,6,7], and the frequency of local rainstorms has increased. Moreover, the special topography of the SXJ region makes it extremely sensitive to climate change, and it presents a fragile ecosystem and has relatively sparse vegetation cover; therefore, heavy rainfall events are likely to trigger secondary disasters, such as mudslides, and cause huge casualties and economic losses [8,9,10]. Therefore, the changing characteristics of extreme precipitation events and their possible causes must be studied in order to provide a scientific basis for rational water resource use and ecological protection and to offer a better understanding of the climatic transformations in SXJ.
Previous studies have focused on the circulation characteristics related to precipitation anomalies in Xinjiang. South Asian high pressure is an important atmospheric circulation system affecting heavy rainfall in Xinjiang. The east–west oscillation of its central position have different effects on circulation and water vapor transport, thus causing certain differences in precipitation in Xinjiang. The effects on heavy rainfall in SXJ are particularly prominent when the distribution is bimodal [11,12]. In summer, the West Asian subtropical westerly rapids are located over Xinjiang, and its north–south position, intensity, and axis direction influences precipitation [13,14,15]. The movement of the West Pacific subtropical high pressure to the northwest often causes changes in the regional circulation of Xinjiang, and together with the eastward advance of the Iranian high pressure cell, a circulation pattern of “two highs sandwiching one low” is formed, which is conducive to the formation of regional precipitation [16,17,18]. The Central Asian low vortex is a weather-scale cold vortex system that occurs east of the Aral Sea and extends to the Xinjiang region. It is often associated with the Ural ridge and represents an important influencing system for the heavy rainfall process in Xinjiang [19,20,21,22]. The precipitation in western Xinjiang is more sensitive to the Central Asian low vortex [23]. Huang et al. [24] found that precipitation anomalies in SXJ are associated with a “Silk Road pattern”-like telecorrelation that results in potential height anomalies between India and North-Central China. The gradient forces generated by the height anomalies bring water vapor from the Indian Ocean and cause an anomalous upward movement in SXJ that causes precipitation. A strong connection occurs between the precipitation anomalies in Xinjiang and the North Atlantic Oscillation (NAO), and the negative NAO phase corresponds well with the anomalous summer precipitation in Xinjiang [25,26,27,28]. In addition, changes in the summer monsoon season also cause changes in weather systems and water vapor transport, which in turn cause precipitation anomalies in Xinjiang [29,30,31]. However, previous studies have primarily focused on analyzing the causes of annual precipitation and have not thoroughly investigated extreme precipitation. Moreover, analyses of precipitation anomalies have mainly focused on external signals, and systematic and detailed analyses of water vapor transport and revenue and expenditure processes that are closely related to extreme precipitation are limited.
Precipitation cannot be formed without the supply of water vapor, and its transport status is of great importance when studying the causes and mechanisms of heavy rainfall [32,33,34]. Water vapor transport, receipts, and expenditures are directly related to precipitation events and near-surface climate conditions [35,36,37]. By calculating multi-year, average vertically integrated water vapor transport fluxes, researchers have determined the summer water vapor transport conditions in the eastern part of the plateau and its adjacent areas. The most significant feature is the strong easterly water vapor transport that crosses the equator near 45° E to form a strong southwesterly water vapor conveyor belt that flows like a large river through the Indian Ocean, eastern China, Korea, and Japan to the North Pacific region [38]. Xu et al. [39] constructed a water vapor transport influence area in the shape of a “large triangular fan”, with the plateau region at the top and low-latitude active source areas associated with South China Sea monsoon and Indian monsoon outbreaks at the “bottom edge”. For the climatic mean, heavy rainfall in SXJ is concentrated in summer, and the atmospheric circulation system for its water vapor transport is mainly the westerly wind belt [40,41,42]. Water vapor transport in the northwestern region is also influenced by the South China Sea, Arabian Sea, and northwestern Pacific Ocean [41,43]. Therefore, water vapor transport in the Xinjiang region originates from three channels: first, the Eurasian continent and the Atlantic Ocean through westerly airflow to the west; second, the Northwest Pacific and South China Sea through the East Asian monsoon; and third, the Arabian Sea and the Bay of Bengal through the southwest monsoon [44,45,46]. Water vapor mainly originates from the Atlantic Ocean and Indian Ocean [13,44]. Furthermore, a number of studies have investigated the relationship between regional droughts and floods and water vapor transport, income, and expenditures, and they pointed out that precipitation anomalies are easily induced when the water vapor transport characteristics differ from the climatic state [47,48,49,50,51]. The anomalies in water vapor transport and the budget are the direct cause of anomalies in summer precipitation.
Based on a review of the literature, many questions remain unanswered regarding the variability in summer extreme precipitation and its correlation with water vapor transport in SXJ. For example, what are the circulation patterns and main sources of water vapor that affect the variability in extreme summer precipitation in SXJ? How does water vapor vary at each boundary? Is the wind or water vapor component the greatest contributor to the variability in boundary water vapor fluxes? Which boundary water vapor flux transport process is most closely associated with shifts in extreme summer precipitation along the southern border? How is water vapor that contributes to changes in regional water balance distributed vertically across the boundaries? Focusing on these questions, we analyzed the horizontal, vertical, and temporal dimensions of the water vapor transport anomalies associated with extreme summer precipitation shifts in SXJ using a variety of sources to reveal their effects on extreme summer precipitation in SXJ.

2. Data and Methods

Our study area of interest was SXJ (Figure 1), and summer refers to the months of June–August. The datasets used herein were as follows: (1) the CN05.1 Chinese regional day-by-day gridded observation precipitation dataset [52], which has a time range of 1961–2020 and a horizontal resolution of 0.25° × 0.25°; (2) the NCEP monthly average reanalysis dataset, which has a spatial resolution of 2.5° × 2.5° and was used to analyze circulation characteristics using variables such as geopotential height, temperature, horizontal wind field, vertical wind speed, surface pressure, and specific humidity; (3) the ERA5 four-times-daily reanalysis dataset, which has a spatial resolution of 0.25° × 0.25° and was used to estimate water vapor transport fluxes using variables such as meridional and latitudinal winds, surface pressure, and specific humidity; and (4) a topographic dataset collected using the global topographic model developed by the National Geophysical Data Center (NGDC) under the National Oceanic and Atmospheric Administration (NOAA), which had a resolution of 2 min and included the topography of the global land and ocean.
In studies on extreme precipitation, the extreme precipitation index is mostly defined using the threshold method [53,54,55], and precipitation events that exceed the threshold values are considered extreme precipitation events. Thresholds can be divided into absolute and percentile thresholds. SXJ has a wide range, and the absolute threshold would make inter-regional comparisons meaningless; therefore, the percentile threshold method was used. The specific extreme precipitation index threshold is defined by arranging daily precipitation data greater than 0.1 mm at a single grid point in ascending order and defining the daily precipitation corresponding to the 95th percentile as the extreme precipitation threshold, above which an extreme precipitation event is considered to have occurred. The extreme precipitation characteristics used were the total extreme precipitation (R95p), defined as the sum of the precipitation features (daily precipitation > the 95% daily precipitation quantile); extreme precipitation days (R95f), defined as the number of days when extreme precipitation occurs (daily precipitation > the 95% daily precipitation quantile); extreme precipitation intensity (R95i), defined as the ratio of total extreme precipitation to extreme precipitation days; and extreme precipitation contribution (R95r), defined as the sum of extreme precipitation (daily precipitation > the 95% daily precipitation quantile) as a percentage of total summer precipitation.
The vertical whole-layer water vapor flux (Q) is calculated as follows [56]:
Q = 1 g P s P t q v   d p ,
where g is the acceleration of gravity, pt is set as 300 hPa, ps is the surface air pressure, q is the specific humidity, v is the wind field, and p is the pressure.
The water vapor budget at the four boundaries in the east (QE), west (QW), south (QS), and north (QN) is calculated as follows [57,58]:
Q E = φ S φ N Q λ E α d φ ,
Q W = φ s φ N Q λ W α d φ ,
Q s = λ W λ E Q φ s α cos φ s d λ ,
Q N = λ W λ E Q φ N α cos φ N d λ ,
where λE (λW) is the longitude of the east (west) boundary, φS (φN) is the latitude of the south (north) boundary, and α is the radius of the Earth. The total water vapor budget is calculated as follows:
Q T = Q E + Q W + Q S + Q H
In addition, the least squares method was used to calculate the linear trend of extreme precipitation variability, and the Mann–Kendall test and sliding average method were used to analyze the interdecadal characteristics of precipitation and boundary water vapor transport in SXJ. The t-test and Pearson correlation coefficient were used to verify the significance level and measure the linear correlation between variables, respectively.

3. Results

3.1. Spatial Distribution of Extreme Summer Precipitation Characteristics in SXJ

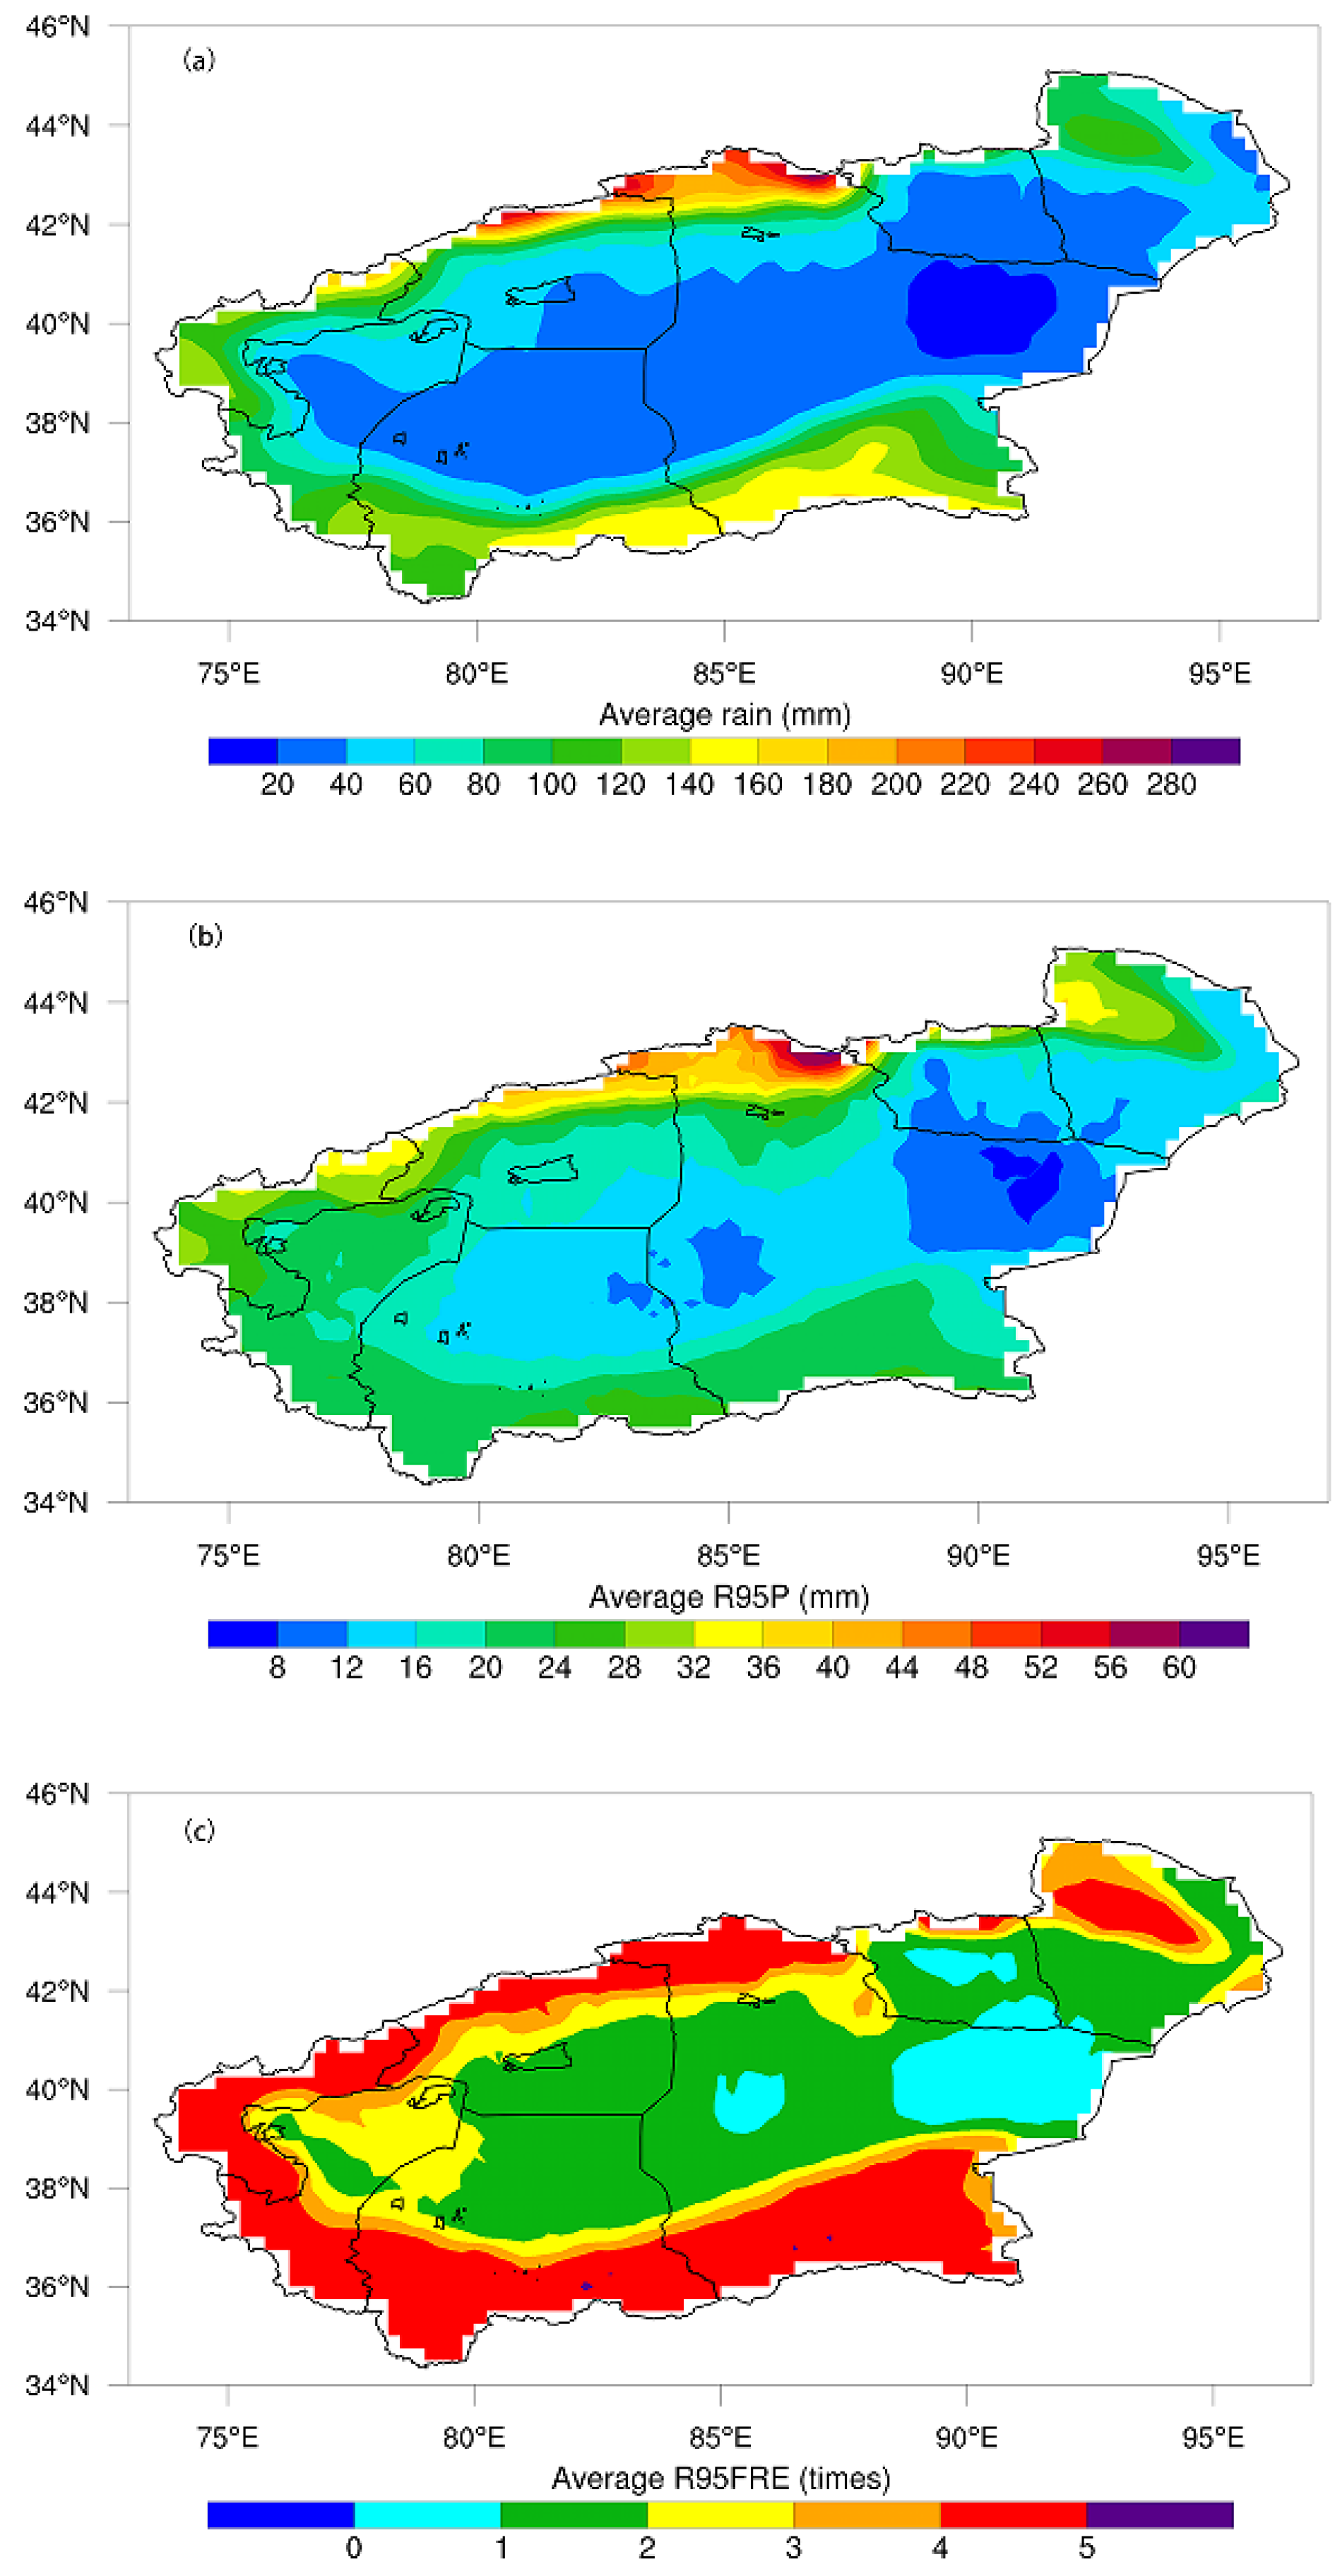
The spatial distribution of the total annual average summer precipitation (Figure 2a) shows that summer precipitation in SXJ had very obvious geospatial distribution characteristics, which were mainly reflected in a decreasing trend from the Tianshan Mountains to the Tarim Basin and the eastern edge of the basin, where the precipitation was greater than 200 mm, less than 50 mm, and less than 20 mm, respectively.
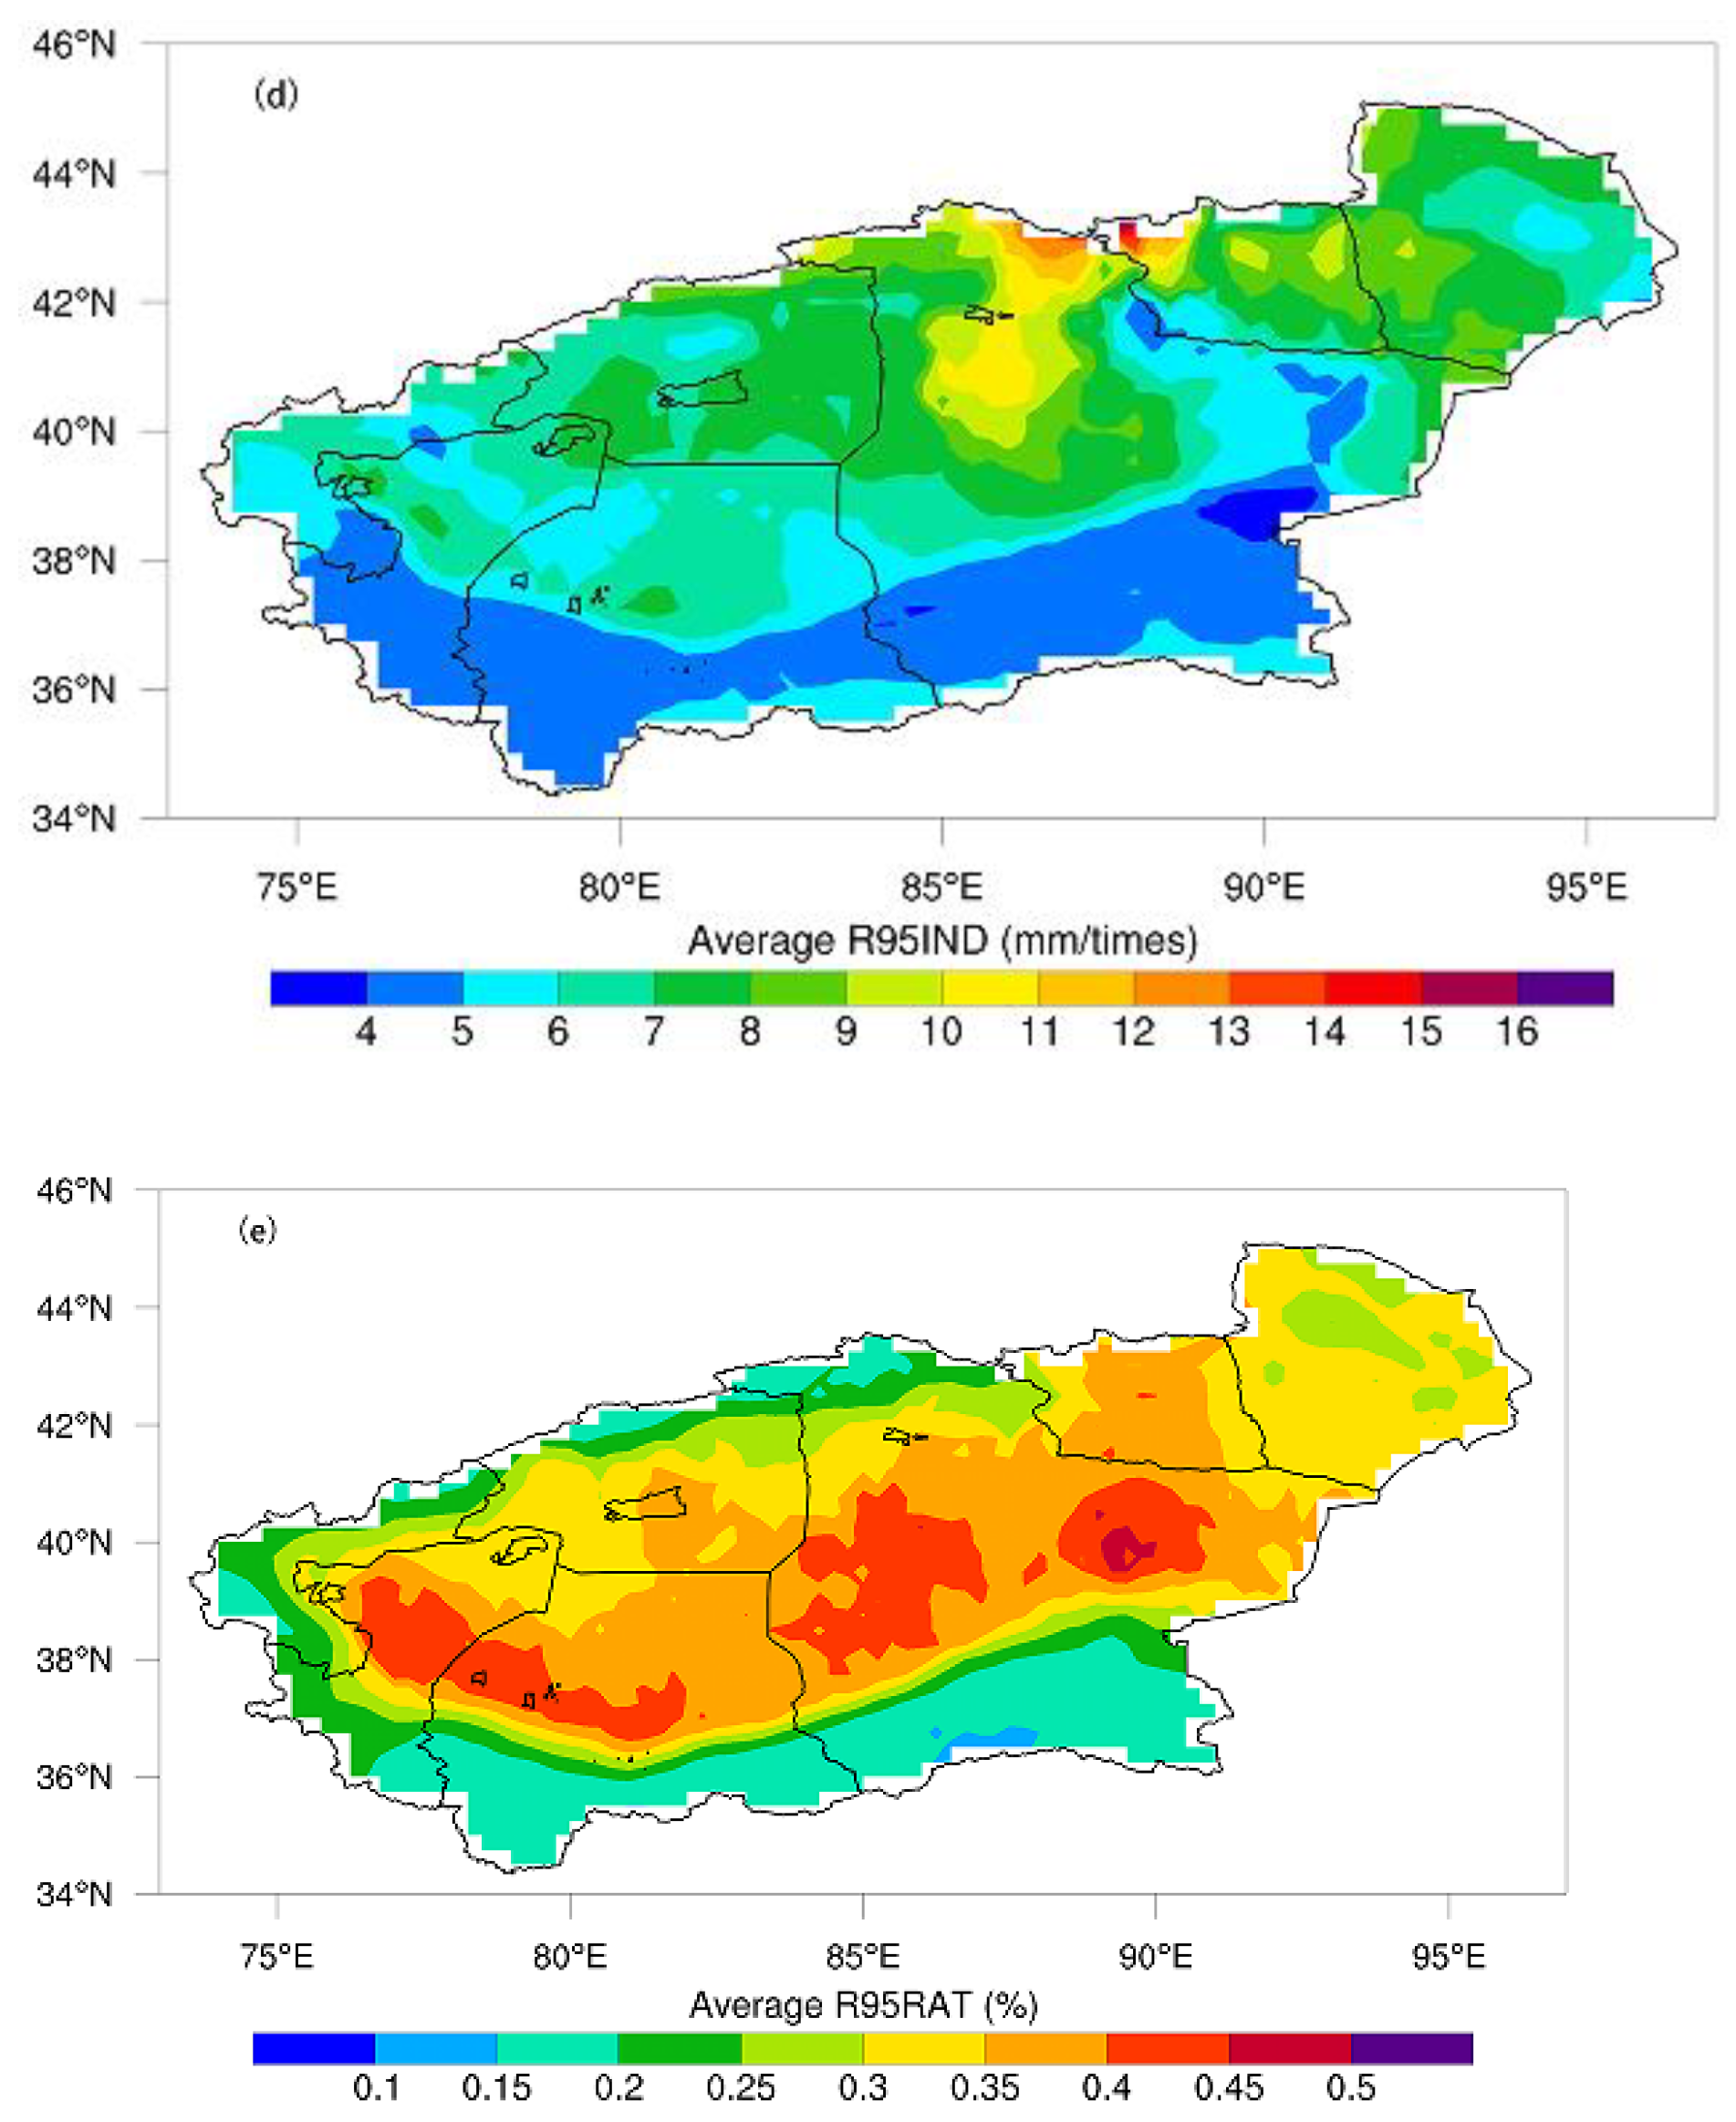
The spatial distribution of each characteristic quantity of extreme precipitation in summer in SXJ is shown in Figure 2b–e. R95p and R95f were similar to the spatial distribution of total summer precipitation, and Figure 2b shows that the high value of R95p (more than 50 mm) was located in the Tianshan Mountains, whereas the low value (less than 10 mm) was located in the eastern edge of the Tarim Basin. The areas with frequent extreme precipitation were located in the mountainous areas surrounding the basin, and the high value of R95f could reach 5 days, whereas the low value was less than 1 day (Figure 2c). The spatial distribution of R95i (Figure 2d) demonstrated that the high value of precipitation intensity was located in the northern part of Bazhou towards the Tianshan Mountains, where it could exceed 10 mm/day. R95r demonstrated an increasing trend in spatial distribution from the mountains to the basin (Figure 2e), with high values in the Kashgar and Hotan areas along the northern slope of the Kunlun Mountains and the central part of Bazhou, where the contribution of extreme precipitation could reach approximately 45%.

3.2. Spatial and Temporal Trends in Extreme Summer Precipitation Characteristics in SXJ

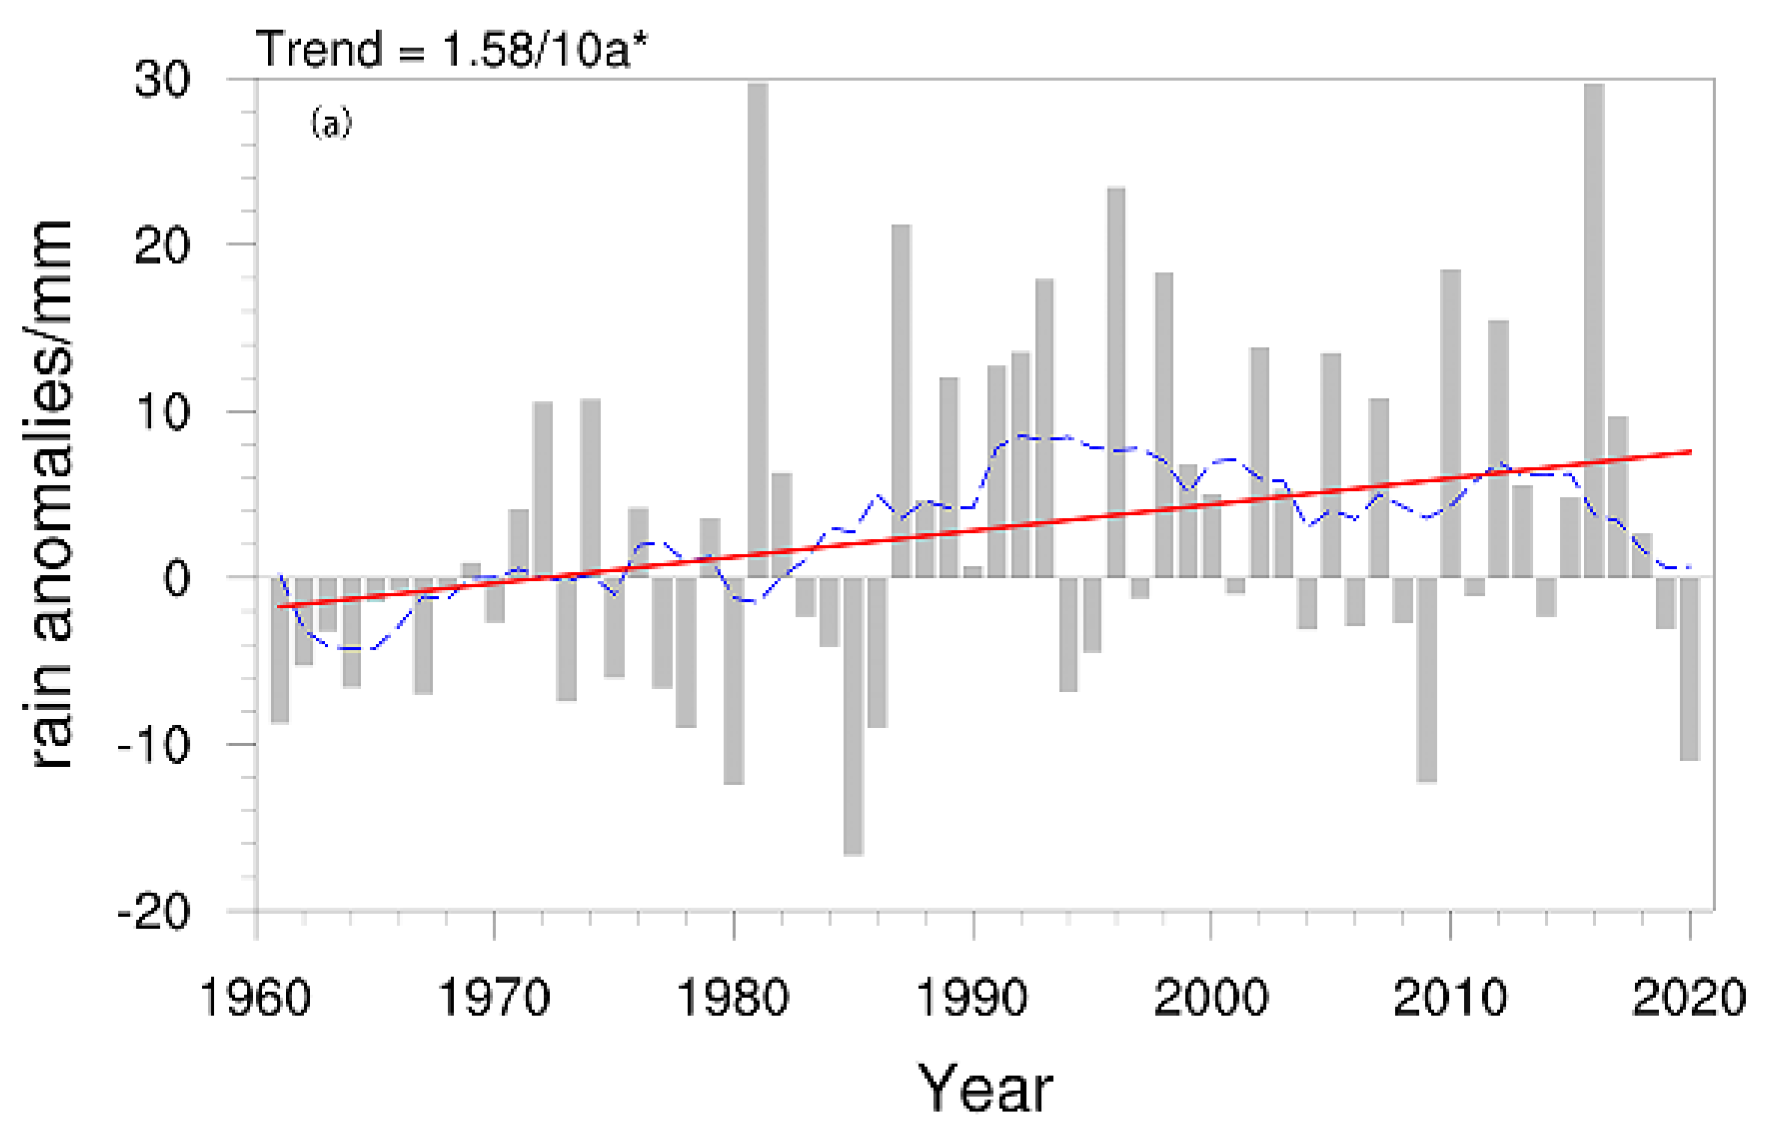
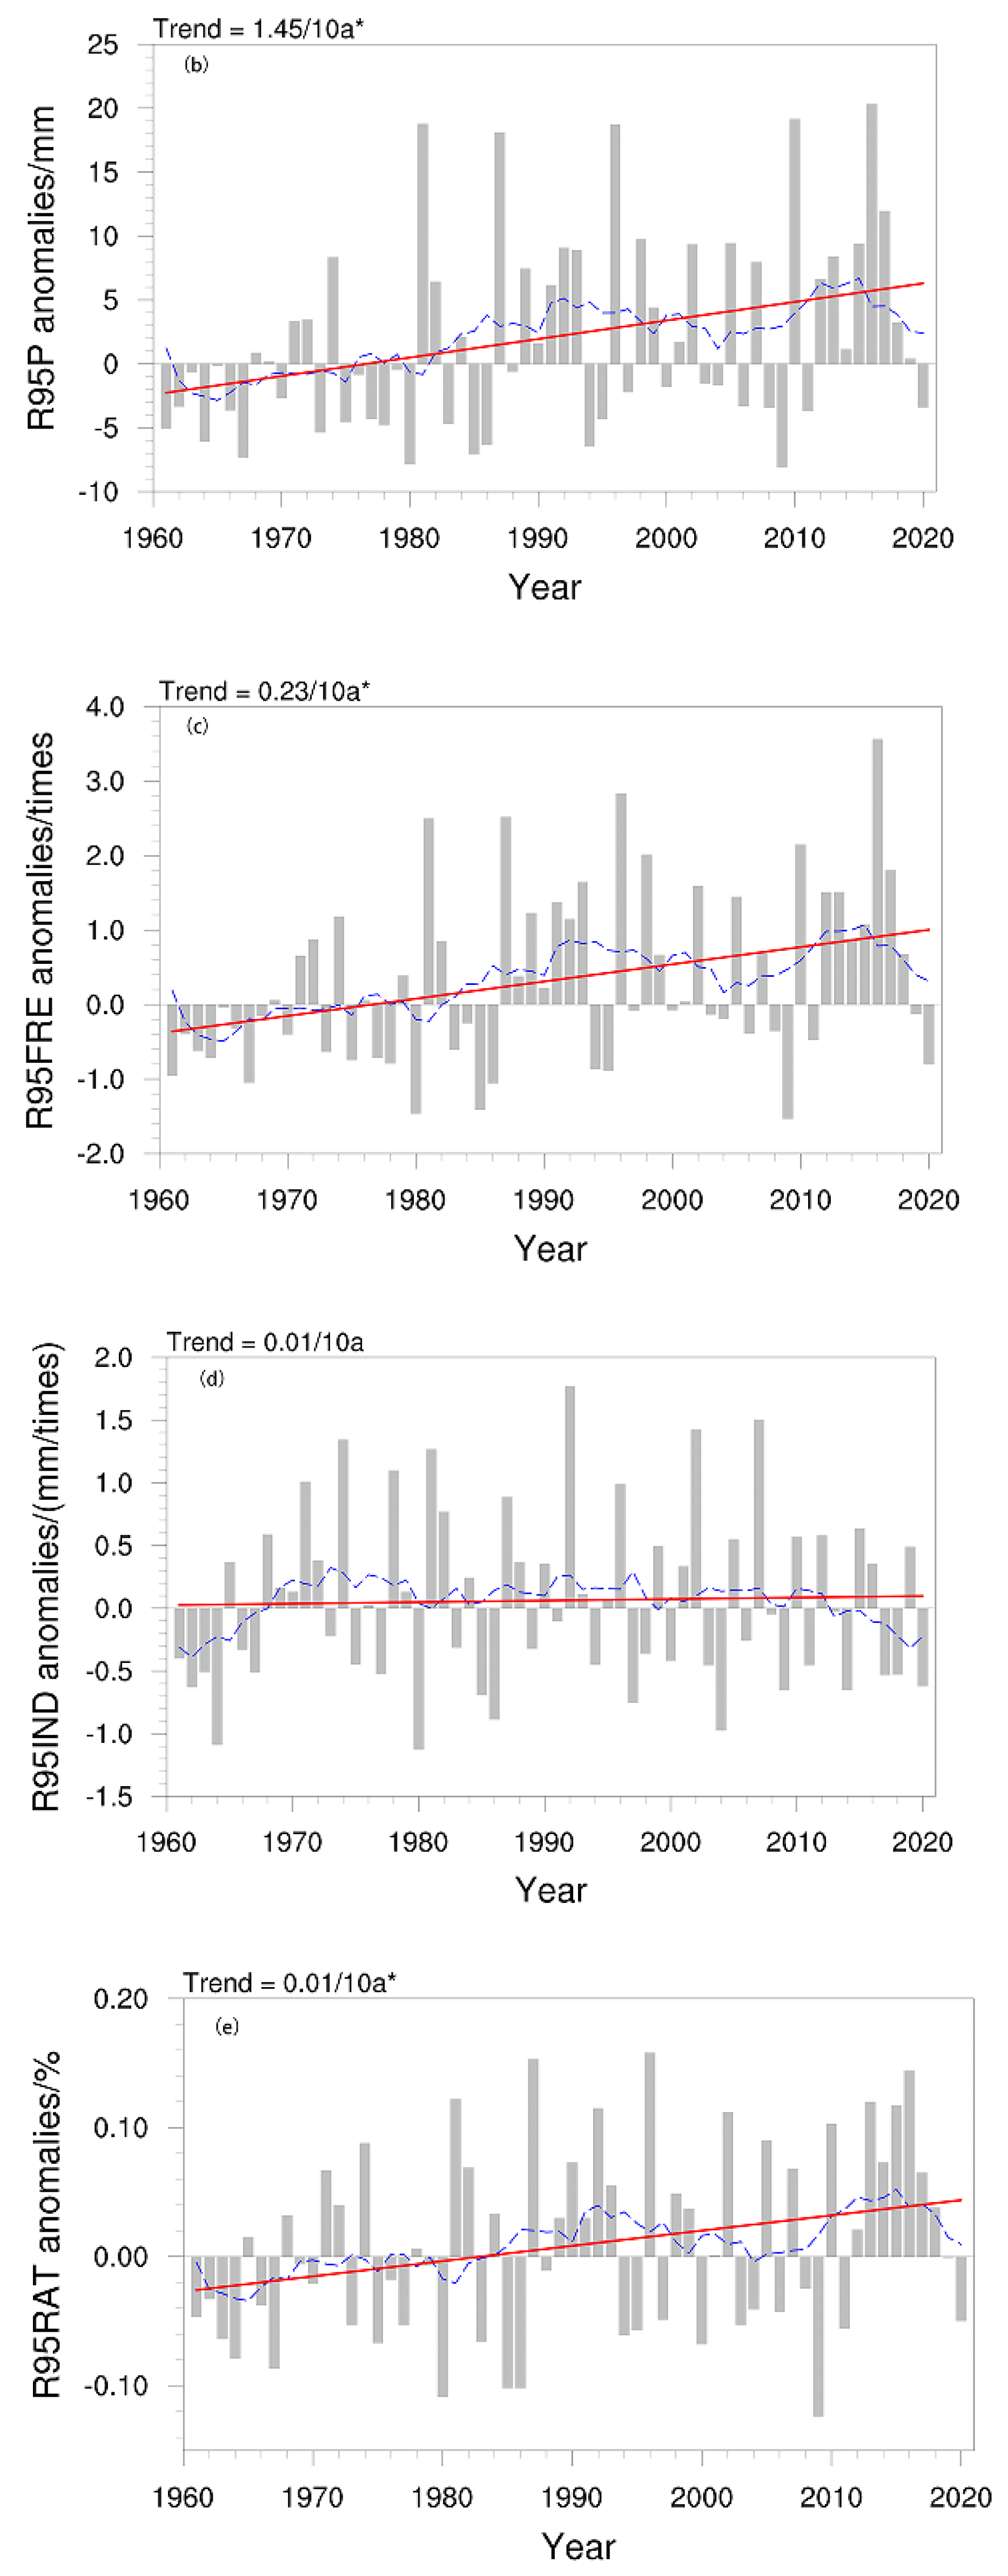
To explore the temporal variation in extreme summer precipitation in SXJ, we analyzed the interannual variation in summer precipitation and each extreme precipitation characteristic from 1961 to 2020 (Figure 3a–e). Summer precipitation, R95p, R95f, and R95r in SXJ showed a significant increasing trend during the study period at rates of 1.58 mm/10 a, 1.45 mm/10 a, 0.23 day/10 a, and 1%/10 a, respectively, which shows that extreme precipitation in SXJ contributes significantly to the total summer precipitation. In contrast, R95i also showed an increasing trend, but the change was not significant, which indicates that the increase in extreme precipitation in SXJ was mainly caused by an increase in extreme precipitation days rather than an increase in precipitation intensity. In addition, the results from the 11-year sliding average showed that significant interdecadal variation occurred in the characteristics of extreme precipitation in SXJ.
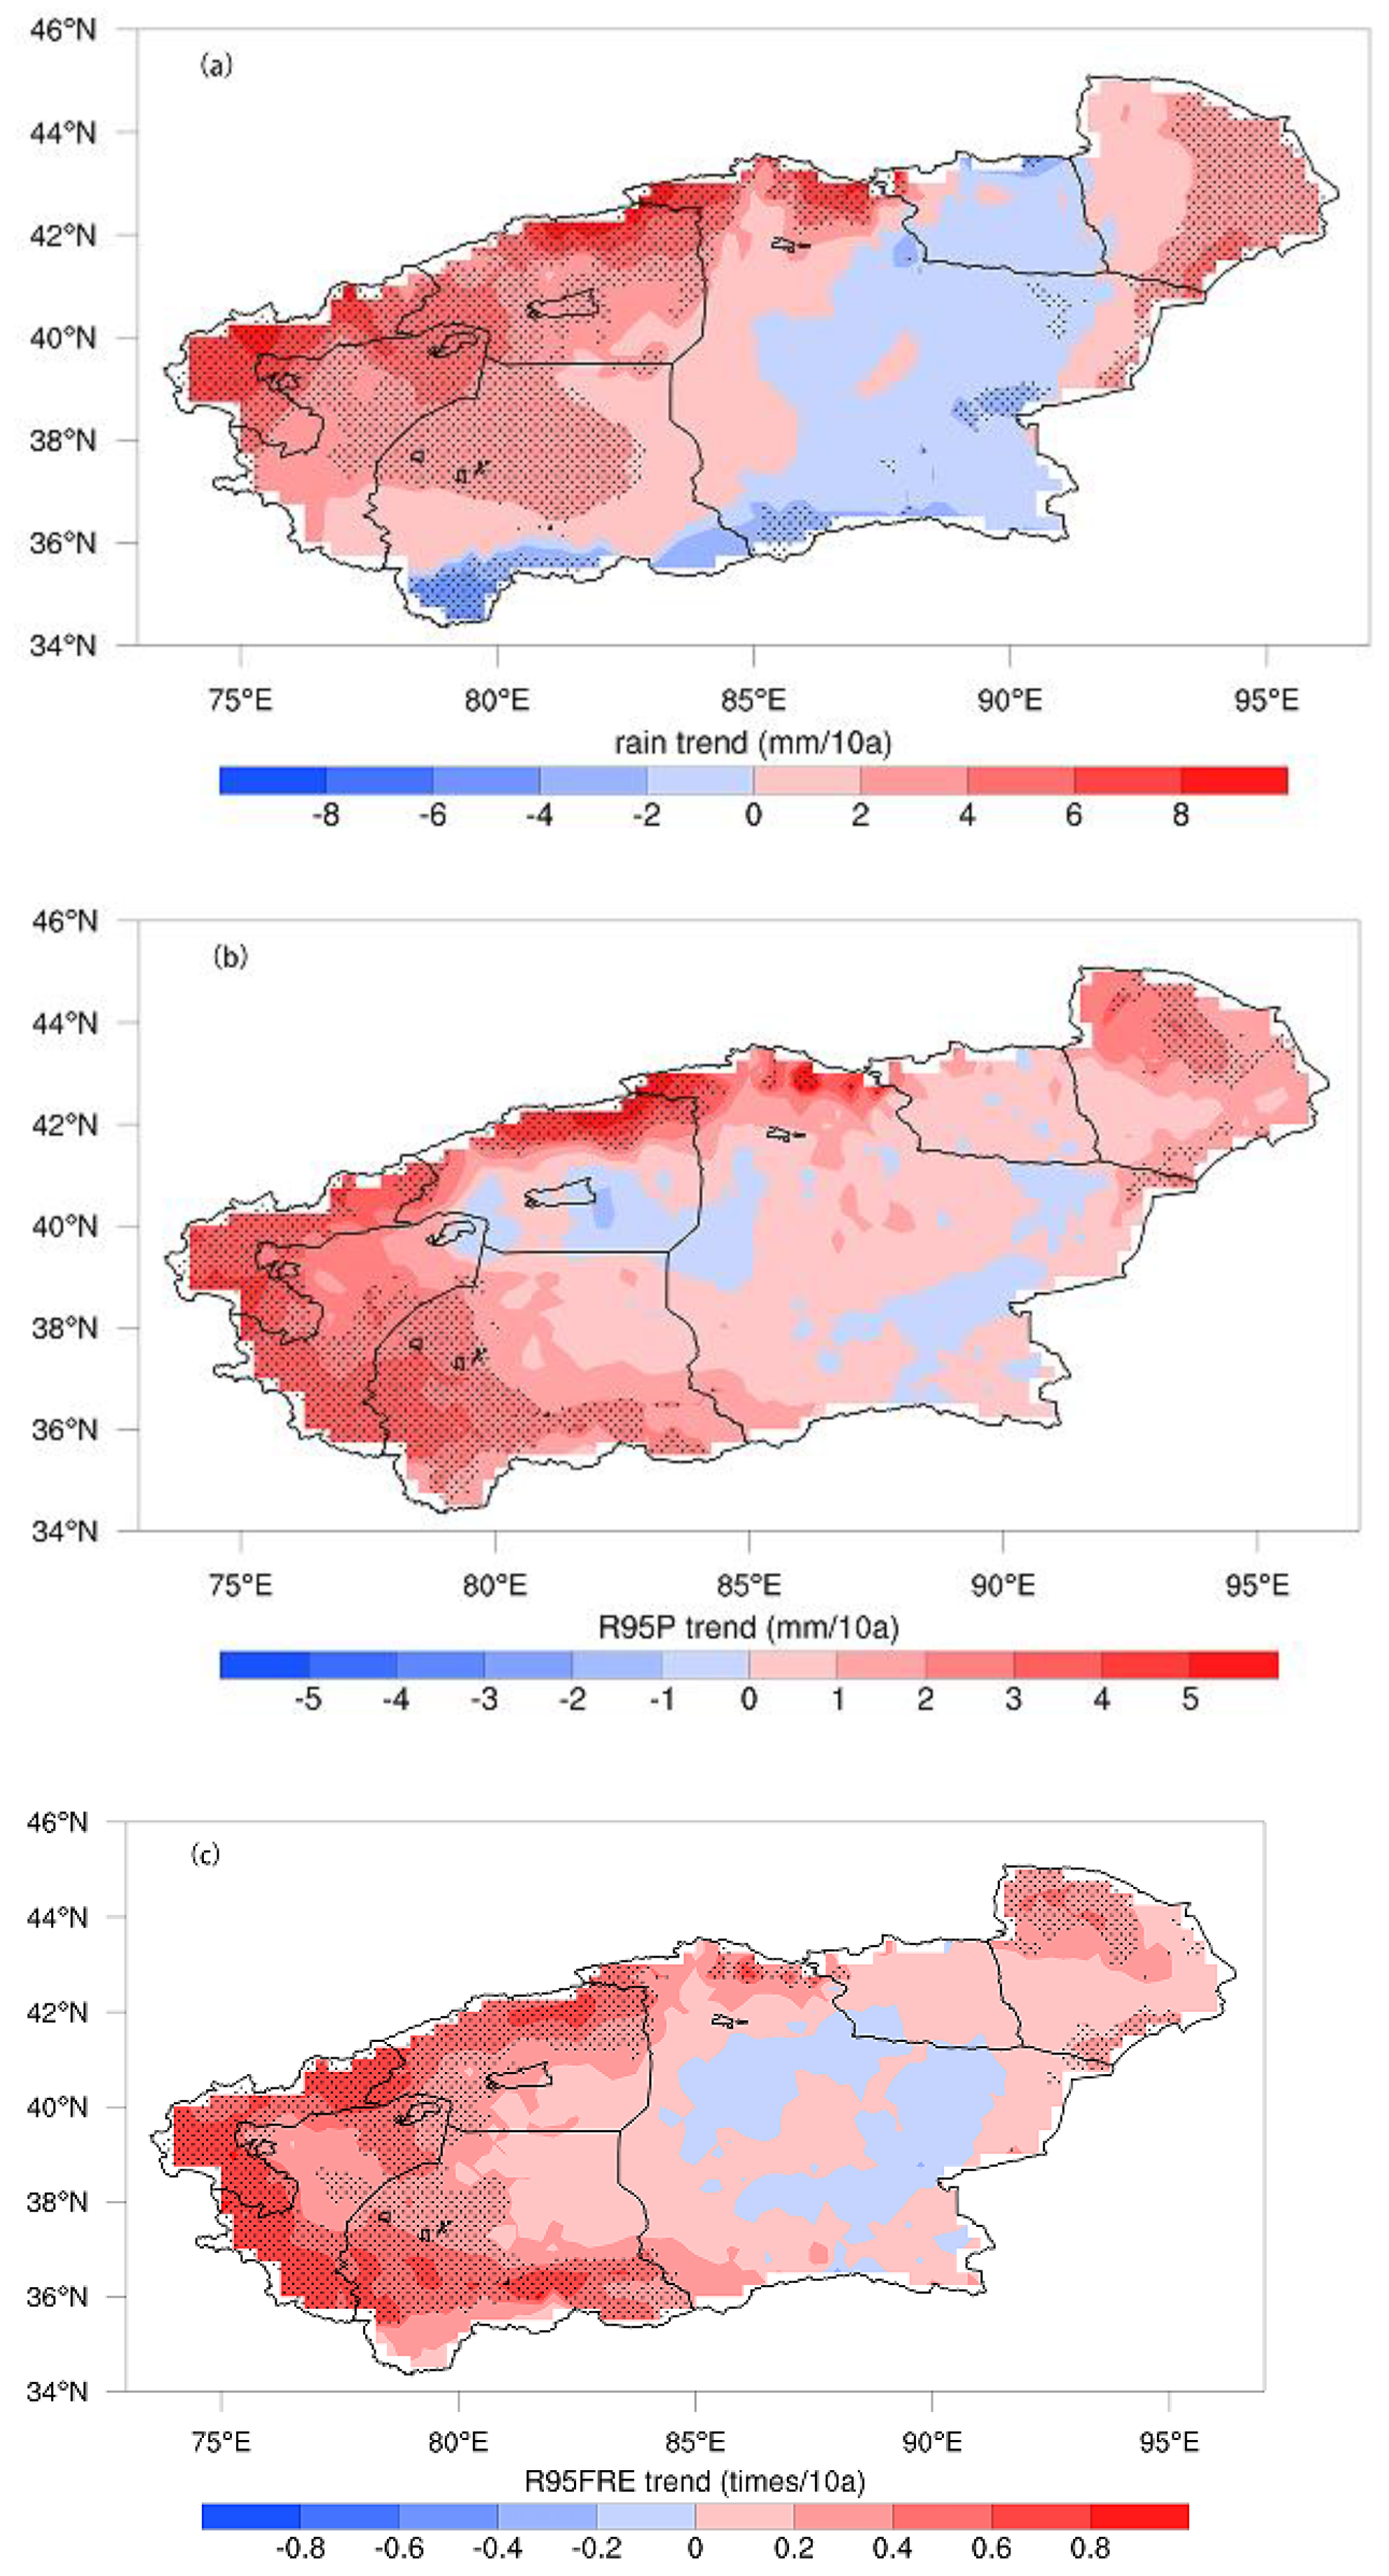
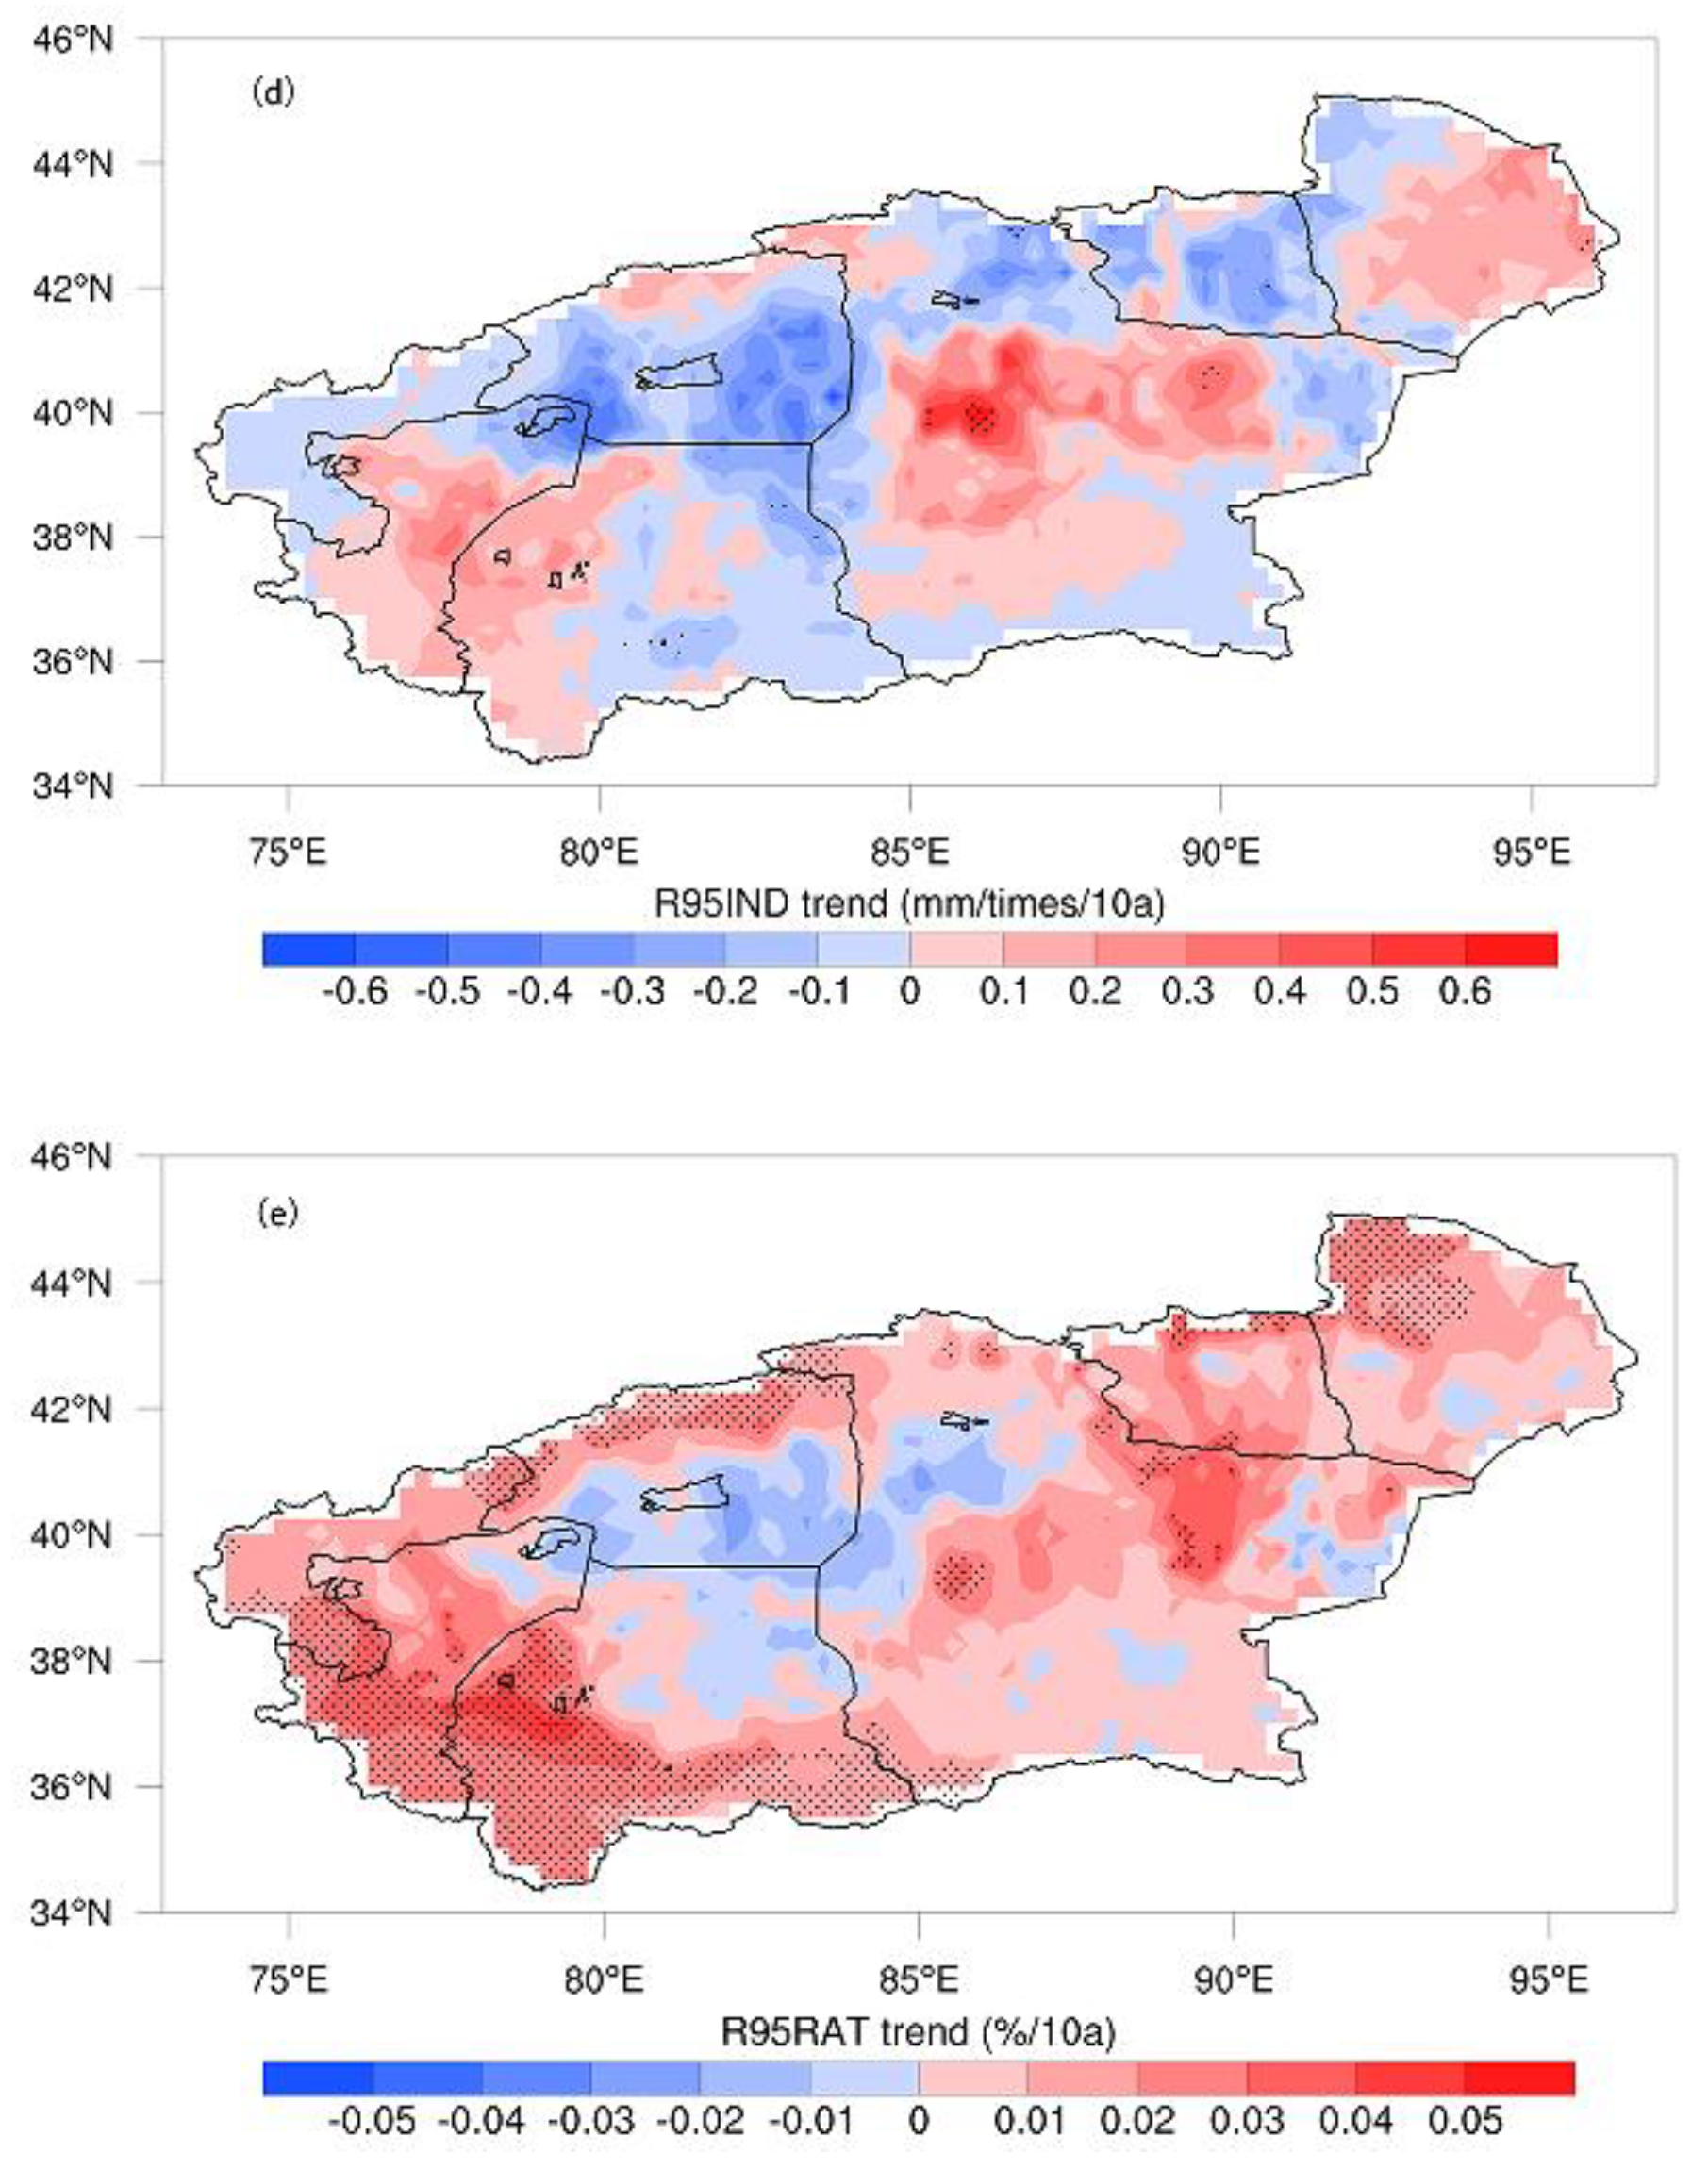
To provide details on the distribution of the changes in extreme summer precipitation in SXJ, we analyzed the spatial distribution of summer precipitation and the linear trend of each extreme precipitation characteristic in SXJ from 1961 to 2020. Figure 4a shows that summer precipitation presented an increasing trend in western SXJ, the Tianshan Mountains, and the Hami region, with the maximum rate of growth reaching 8 mm/10 a; however, a significant decreasing trend was observed in the northern region of the Kunlun Mountains, with the maximum rate of decrease reaching −4 mm/10 a. The spatial distribution of the R95p trend (Figure 4b) differed slightly from that of summer precipitation, with a significant increasing trend in the northern region of the Kunlun Mountains and a maximum growth rate in the Tianshan Mountains of up to 5 mm/10 a. The spatial distribution of the R95r trend (Figure 4c) was broadly similar to and more extensive than that of R95p, with a maximum value of 0.8 day/10 a along the mountains in the western part of SXJ. Figure 4d reveals that R95i showed a significant increase only in a small part of central Bazhou, with a maximum value of 0.6 mm/day/10 a. Figure 4e shows the spatial distribution of the R95r trend, with significant increasing trends in the middle Tianshan Mountains, southern Kashgar and Hotan regions, central Bazhou, and northern Hami, with maximum values in the southern Hotan region of up to 5%/10 a. These results reveal that changes in the extreme precipitation characteristics played a crucial role in the changes in total precipitation.

3.3. Interdecadal Variation in Extreme Summer Precipitation in SXJ

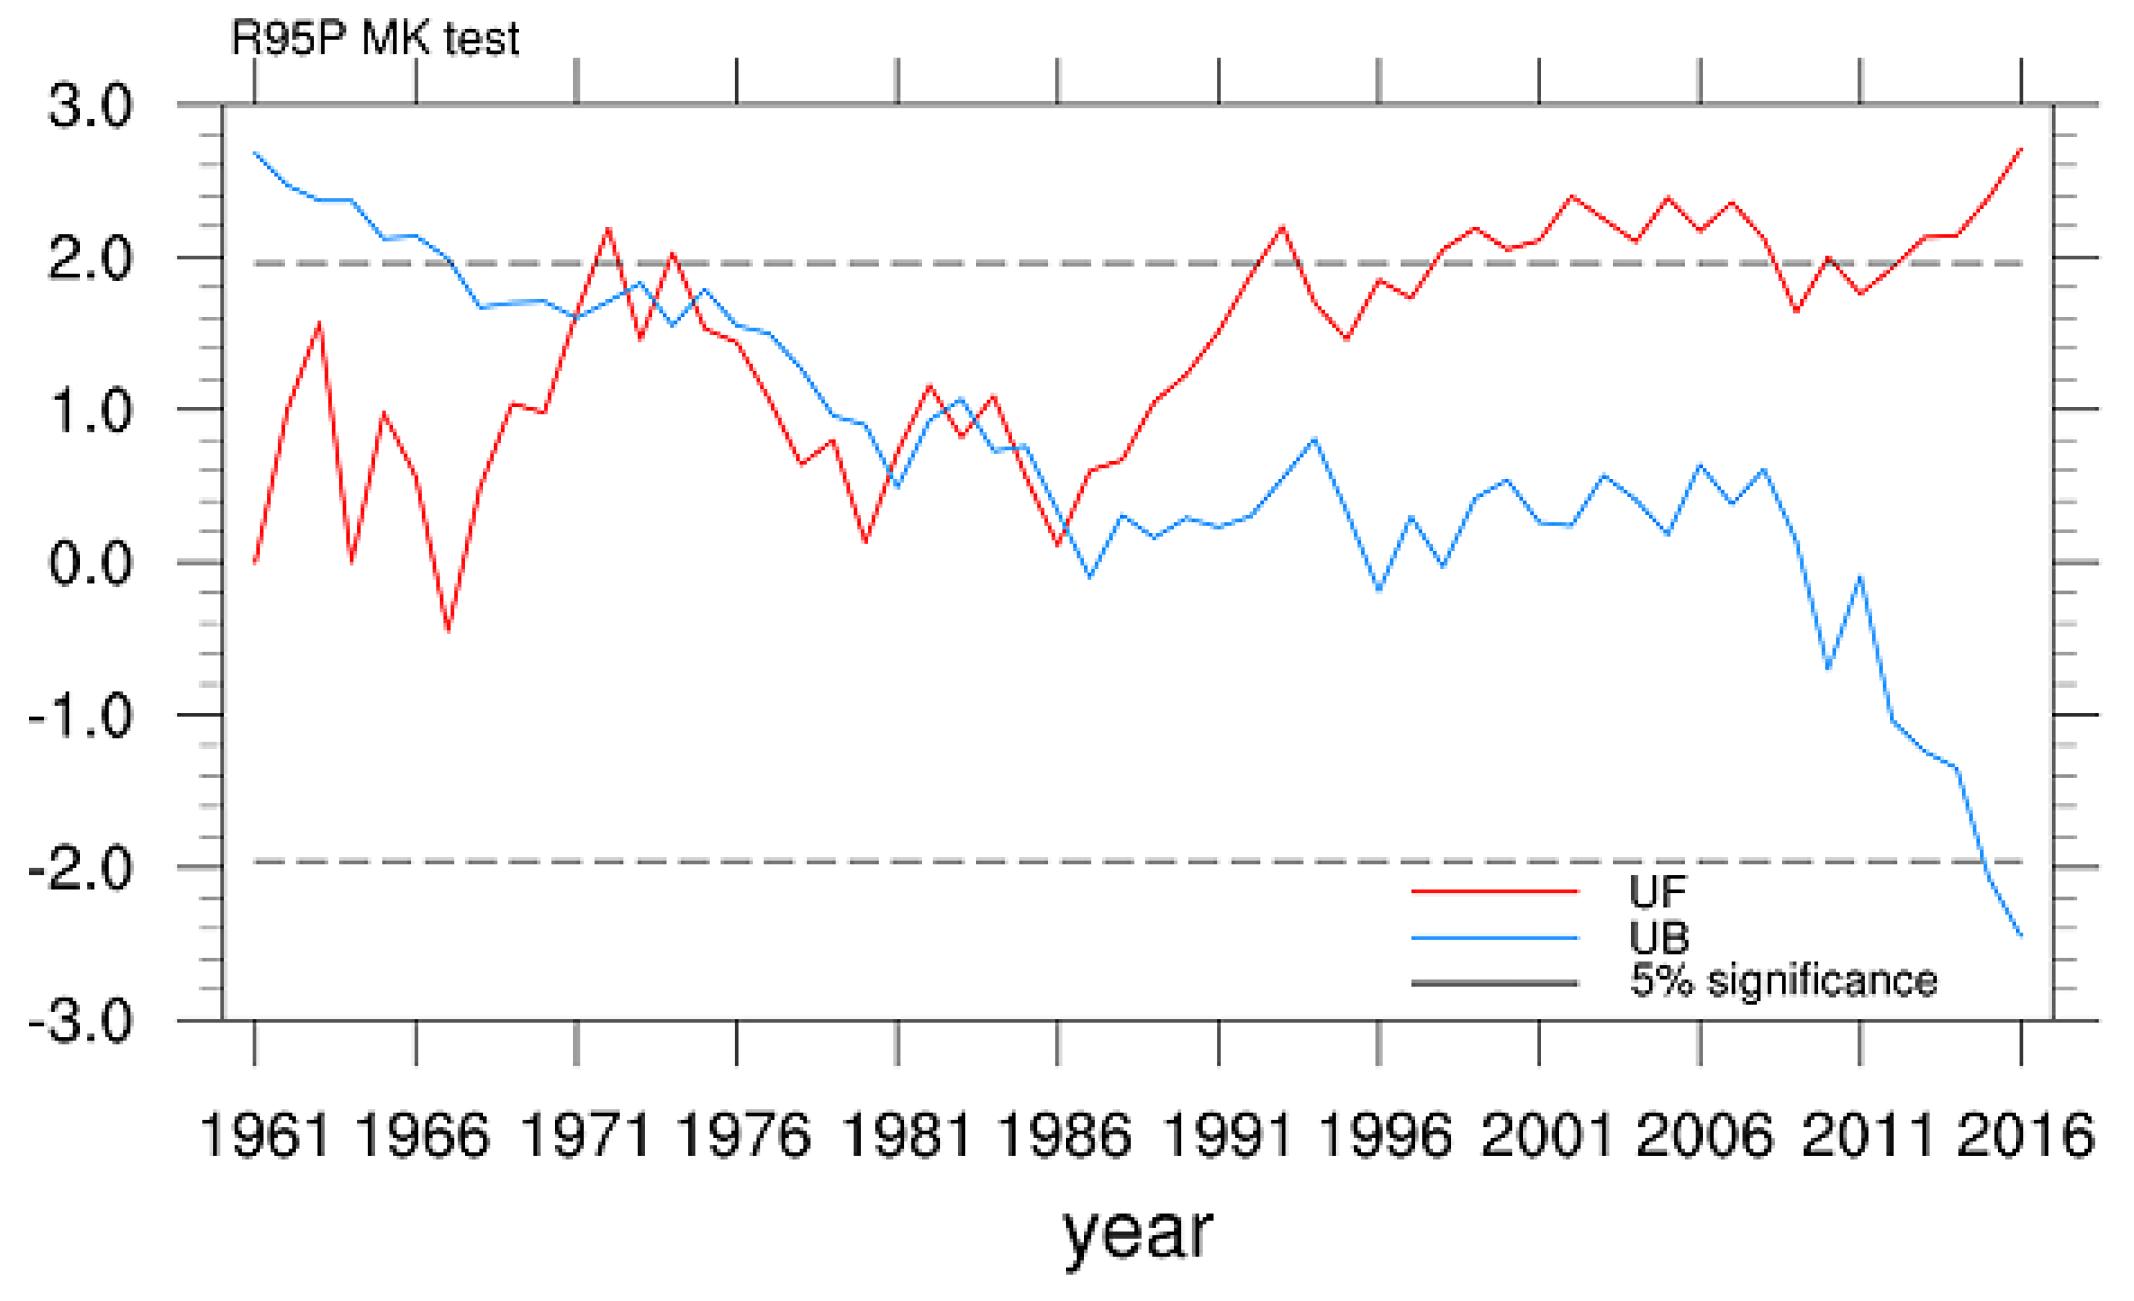
The time series of R95p in SXJ revealed that extreme precipitation presented an interdecadal turn in the mid-1980s. To further pinpoint the time at which an abrupt change occurred, the Mann–Kendall test was applied to the R95p results. Figure 5 shows that the intersection of the curves for the UF statistical series and UB statistical series roughly occurred in 1986, which passed the significance test at the 0.05 level, indicating that a sudden change in extreme summer precipitation from low to high precipitation occurred in 1986.

3.4. Physical Mechanisms Associated with Extreme Summer Precipitation Variability in SXJ

3.4.1. Large-Scale Circulation Anomalies

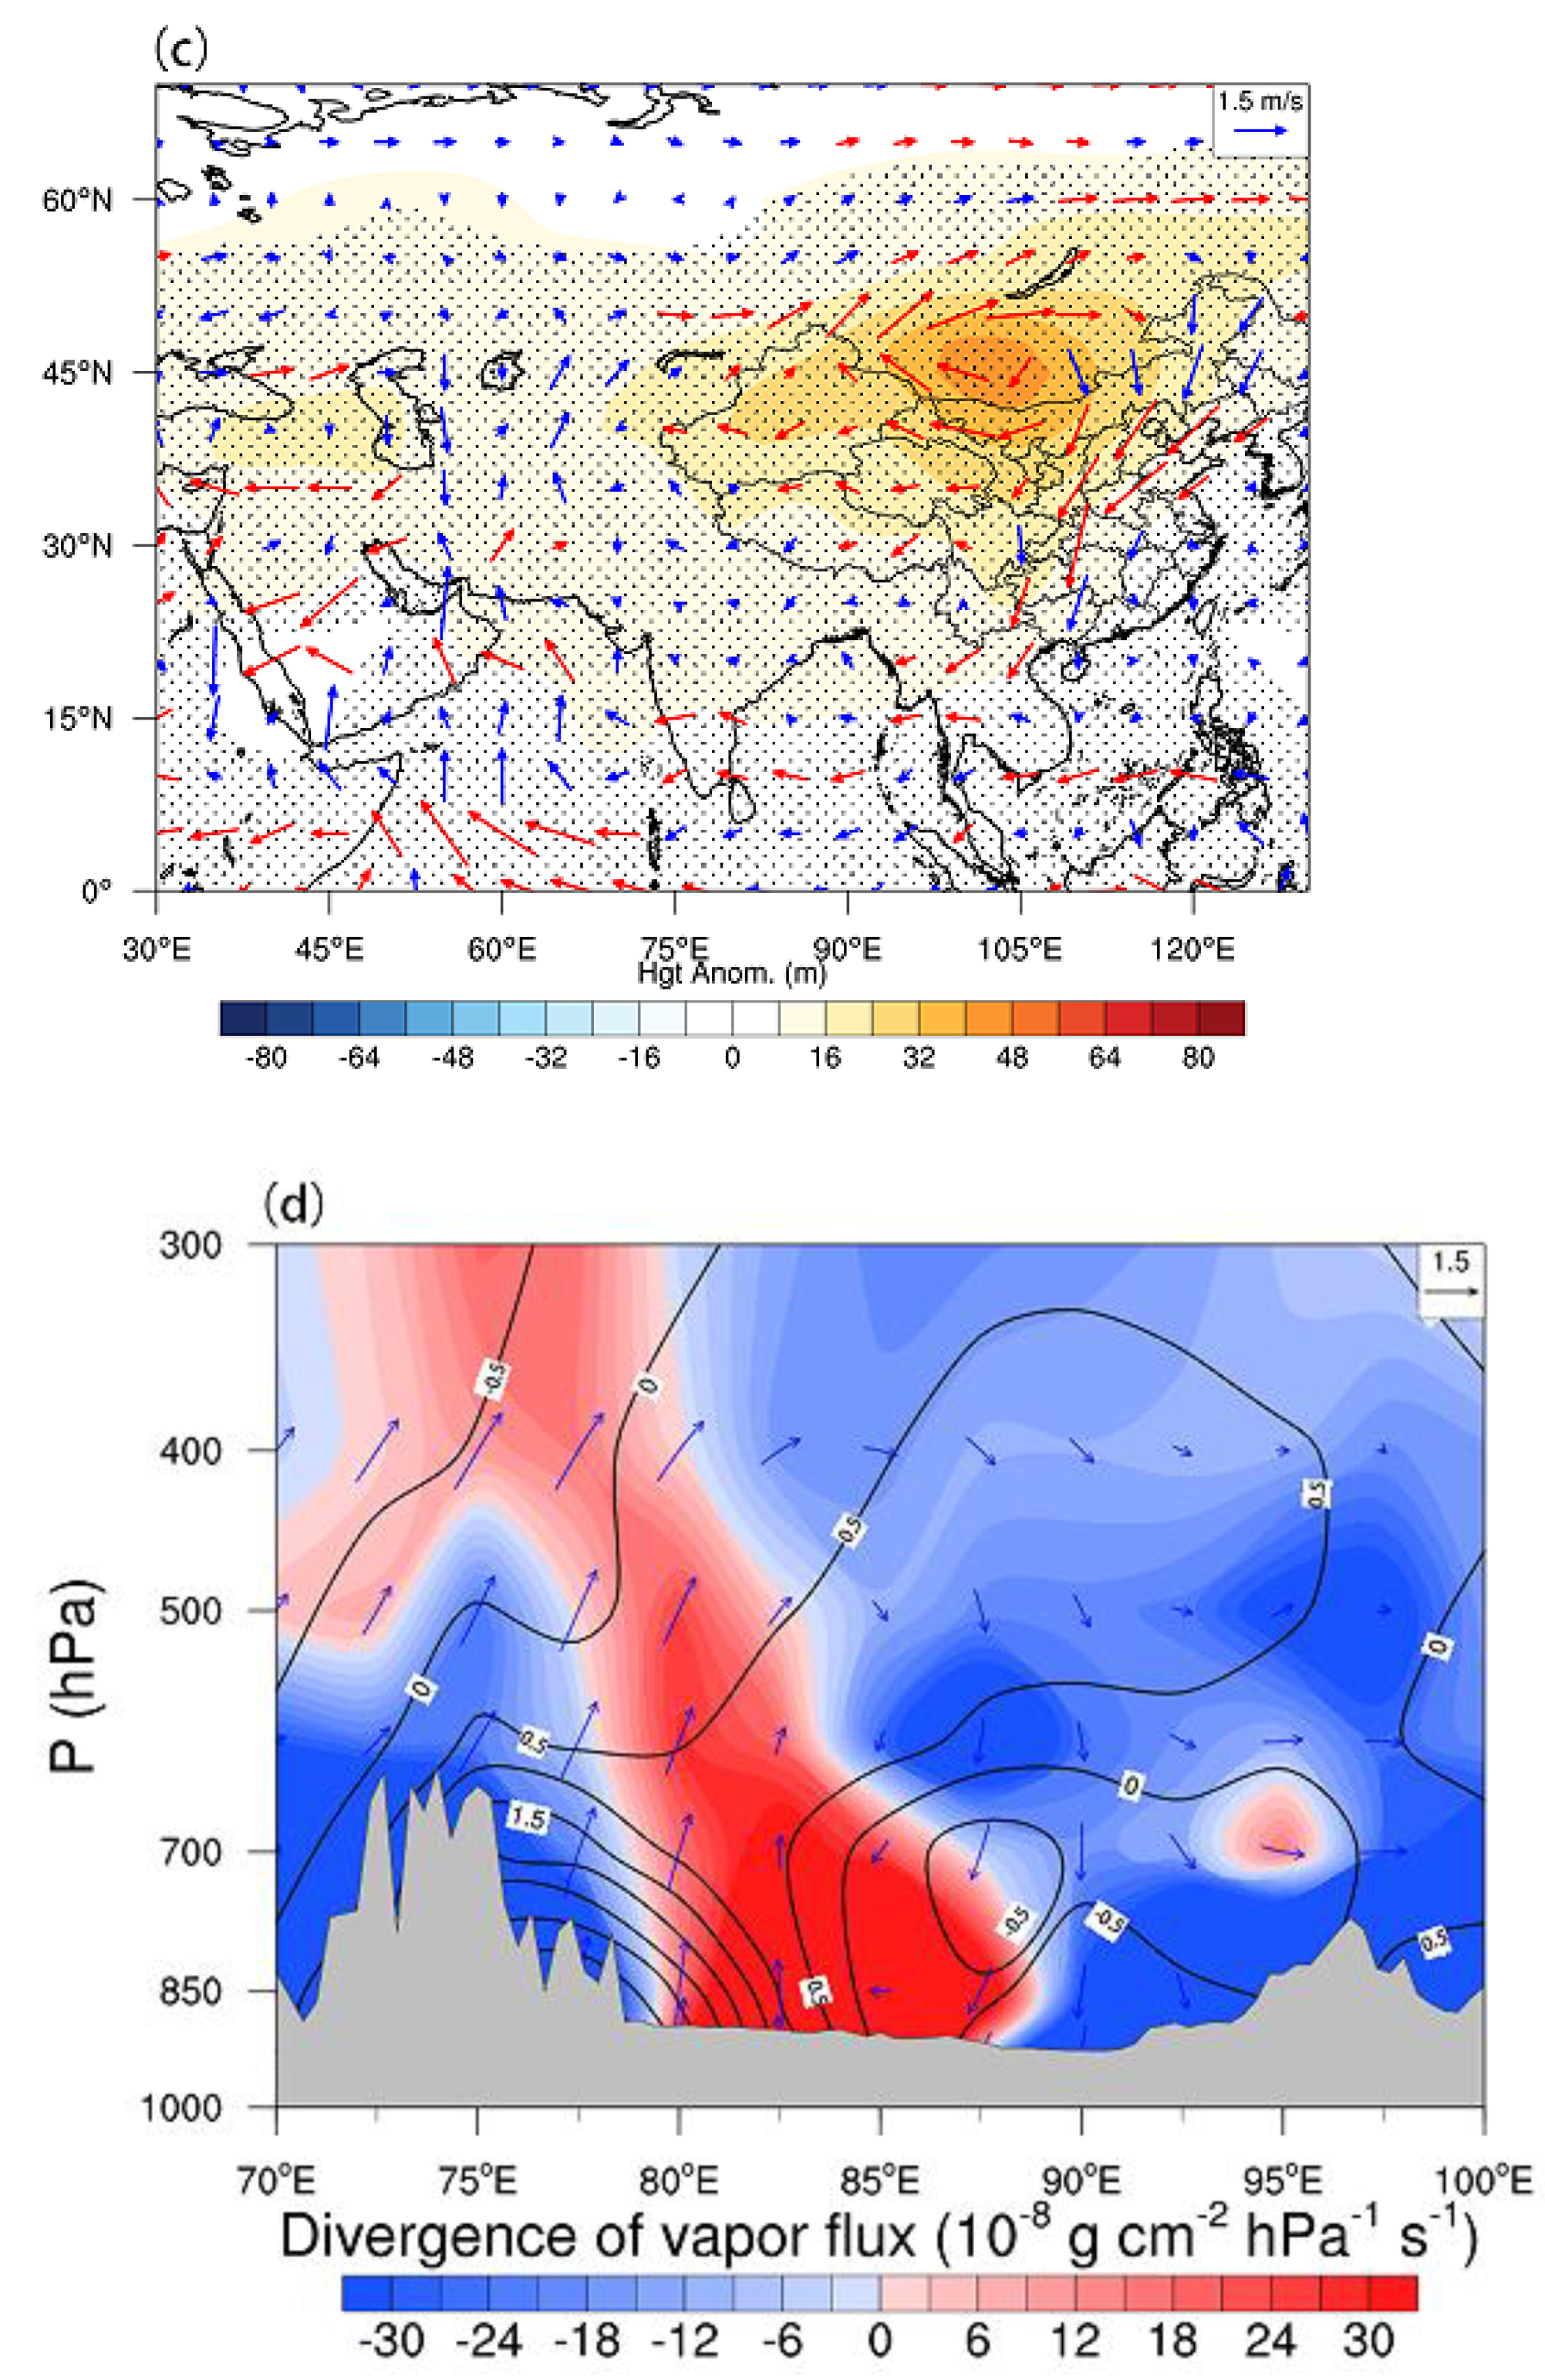
The occurrence of extreme precipitation is often closely related to atmospheric circulation; therefore, we analyzed the difference in circulation between the two periods before and after the abrupt change in extreme precipitation. The difference fields of the 200-hPa potential height and wind field (Figure 6a) revealed that cyclonic circulation and a low potential center occurred on both the east and west sides of SXJ, whereas the rising branch of the cyclonic circulation on the west side dominated the southern border area and contributed to the upward motion and high-altitude divergence in the area. Figure 6b,c show the differences in the geopotential height and wind fields at 500 hPa and 850 hPa, respectively. In the middle and lower levels, the strong anticyclonic circulation in the Mongolian region controlled the western part of China. This circulation pattern led to periodic changes in the anomalous southwesterly flow in the western region to southeasterly flow and the formation of shear over SXJ. This circulation pattern strengthened the upward flow from 1986 to 2020, thereby increasing precipitation in the region. The vertical profiles of the wind field, the pseudo-equivalent level temperature, and the water vapor flux divergence difference field averaged over 36–44° N from 1986 to 2020. Furthermore, the data from 1961 to 1985 (Figure 6d) showed that an upward vertical motion anomaly occurred over western SXJ. Moreover, the negative divergence of the low-level water vapor flux indicated strong low-level water vapor convergence, whereas decreases in the pseudo-equivalent level temperature with increasing height indicated more unstable atmospheric convection. These results demonstrate that enhanced vertical upward motion, greater water vapor convergence at lower levels, and more unstable atmospheric convection contributed to the increase in extreme precipitation over western SXJ.

3.4.2. Water Vapor Transport Anomaly

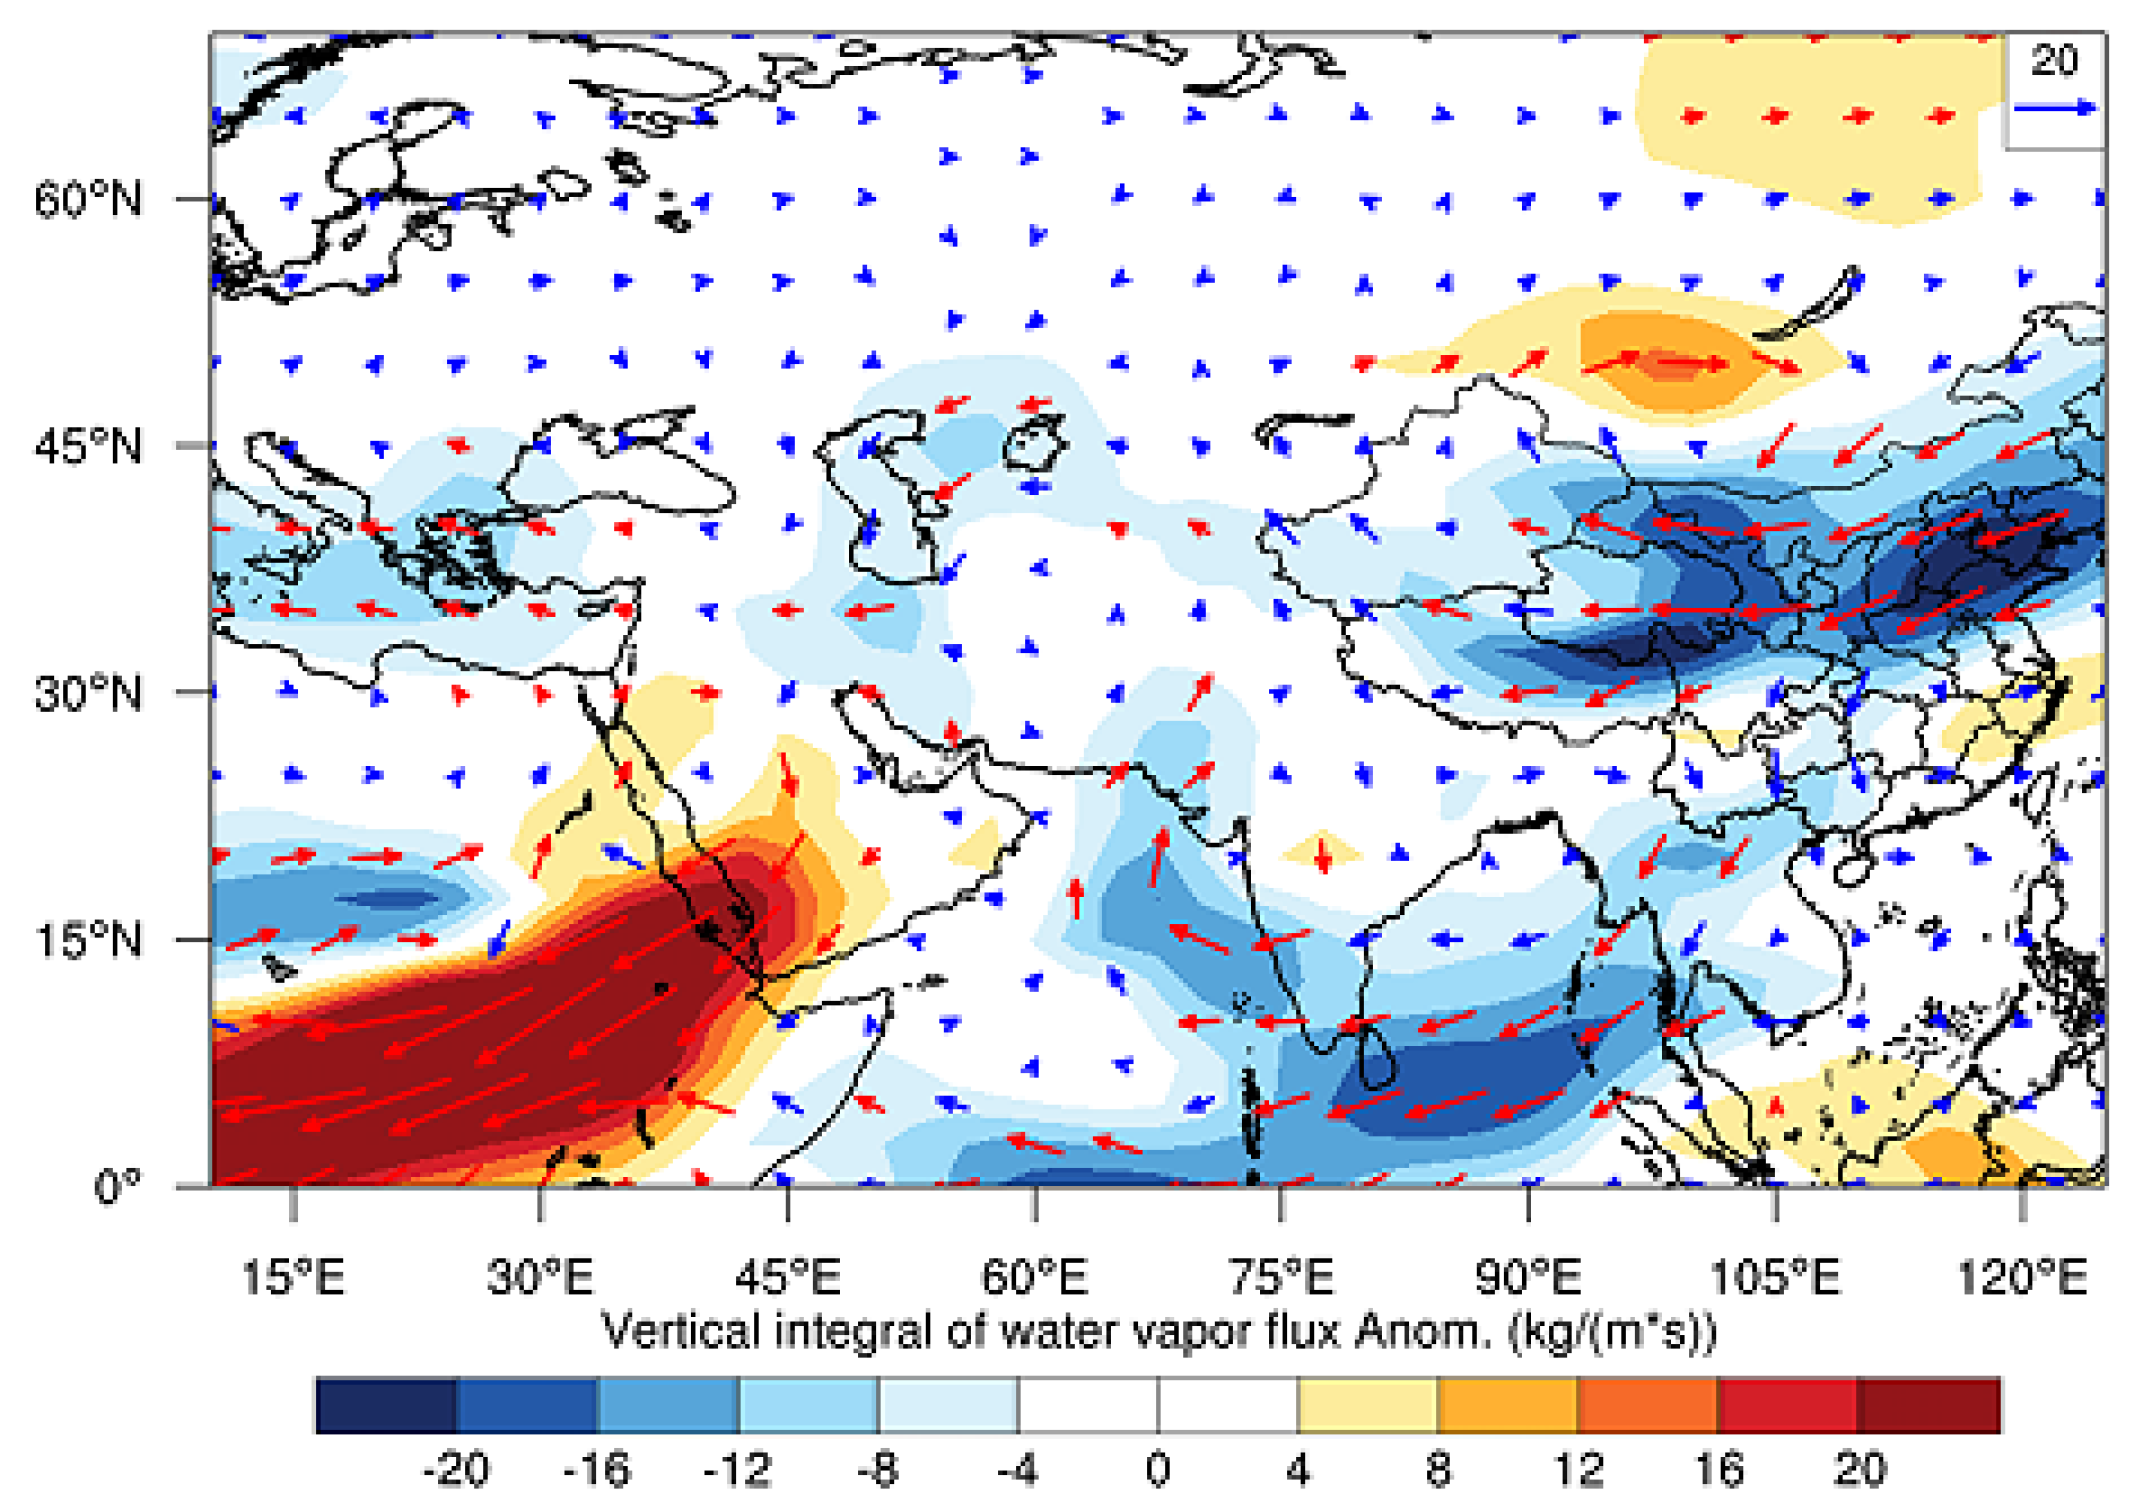
Abundant water vapor is necessary for the formation of heavy rainfall; therefore, we analyzed the distribution pattern of summer vertical water vapor flux anomalies from 1961 to 1985 and from 1986 to 2020 (Figure 7). The results showed that an anomalous anticyclonic circulation occurred in the Mongolian region as well as the Indian Ocean region, where anomalous water vapor was transported eastward from the Pacific Ocean and southward from the Arabian Sea and the Bay of Bengal to the SXJ.
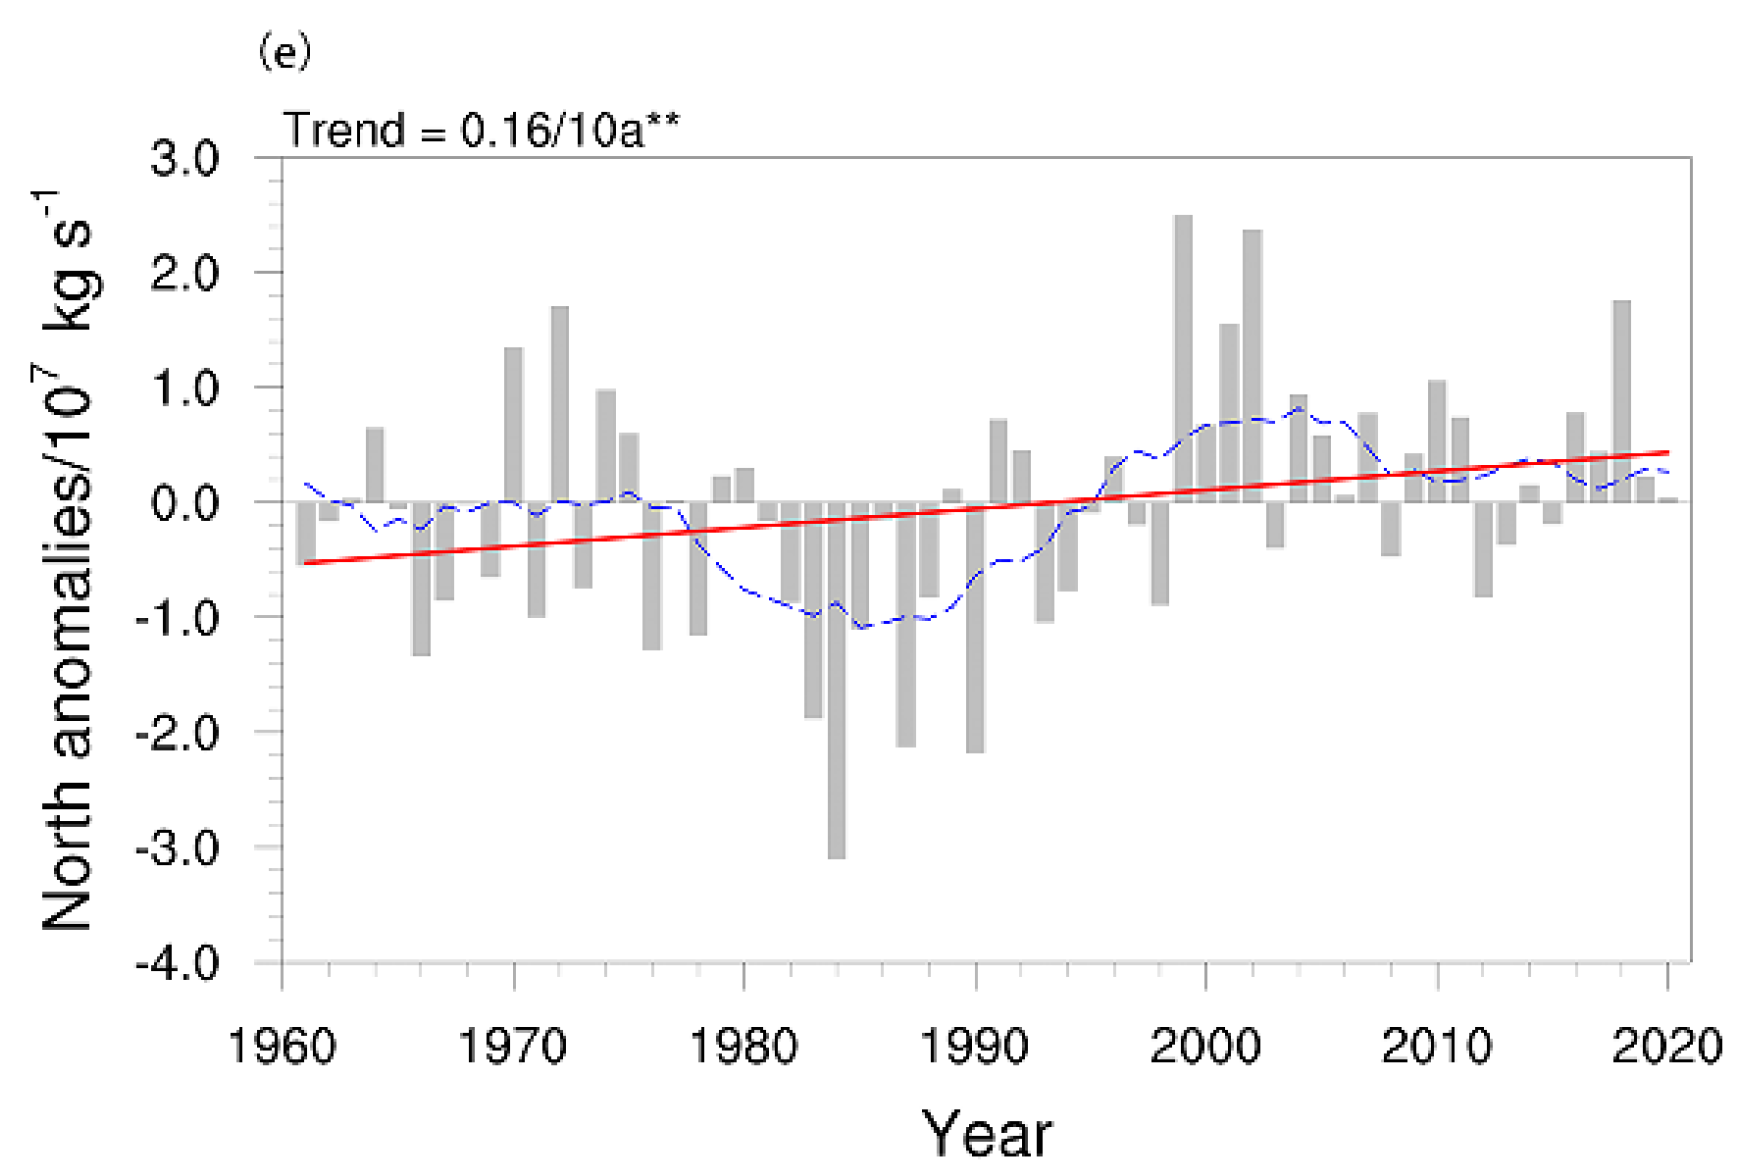
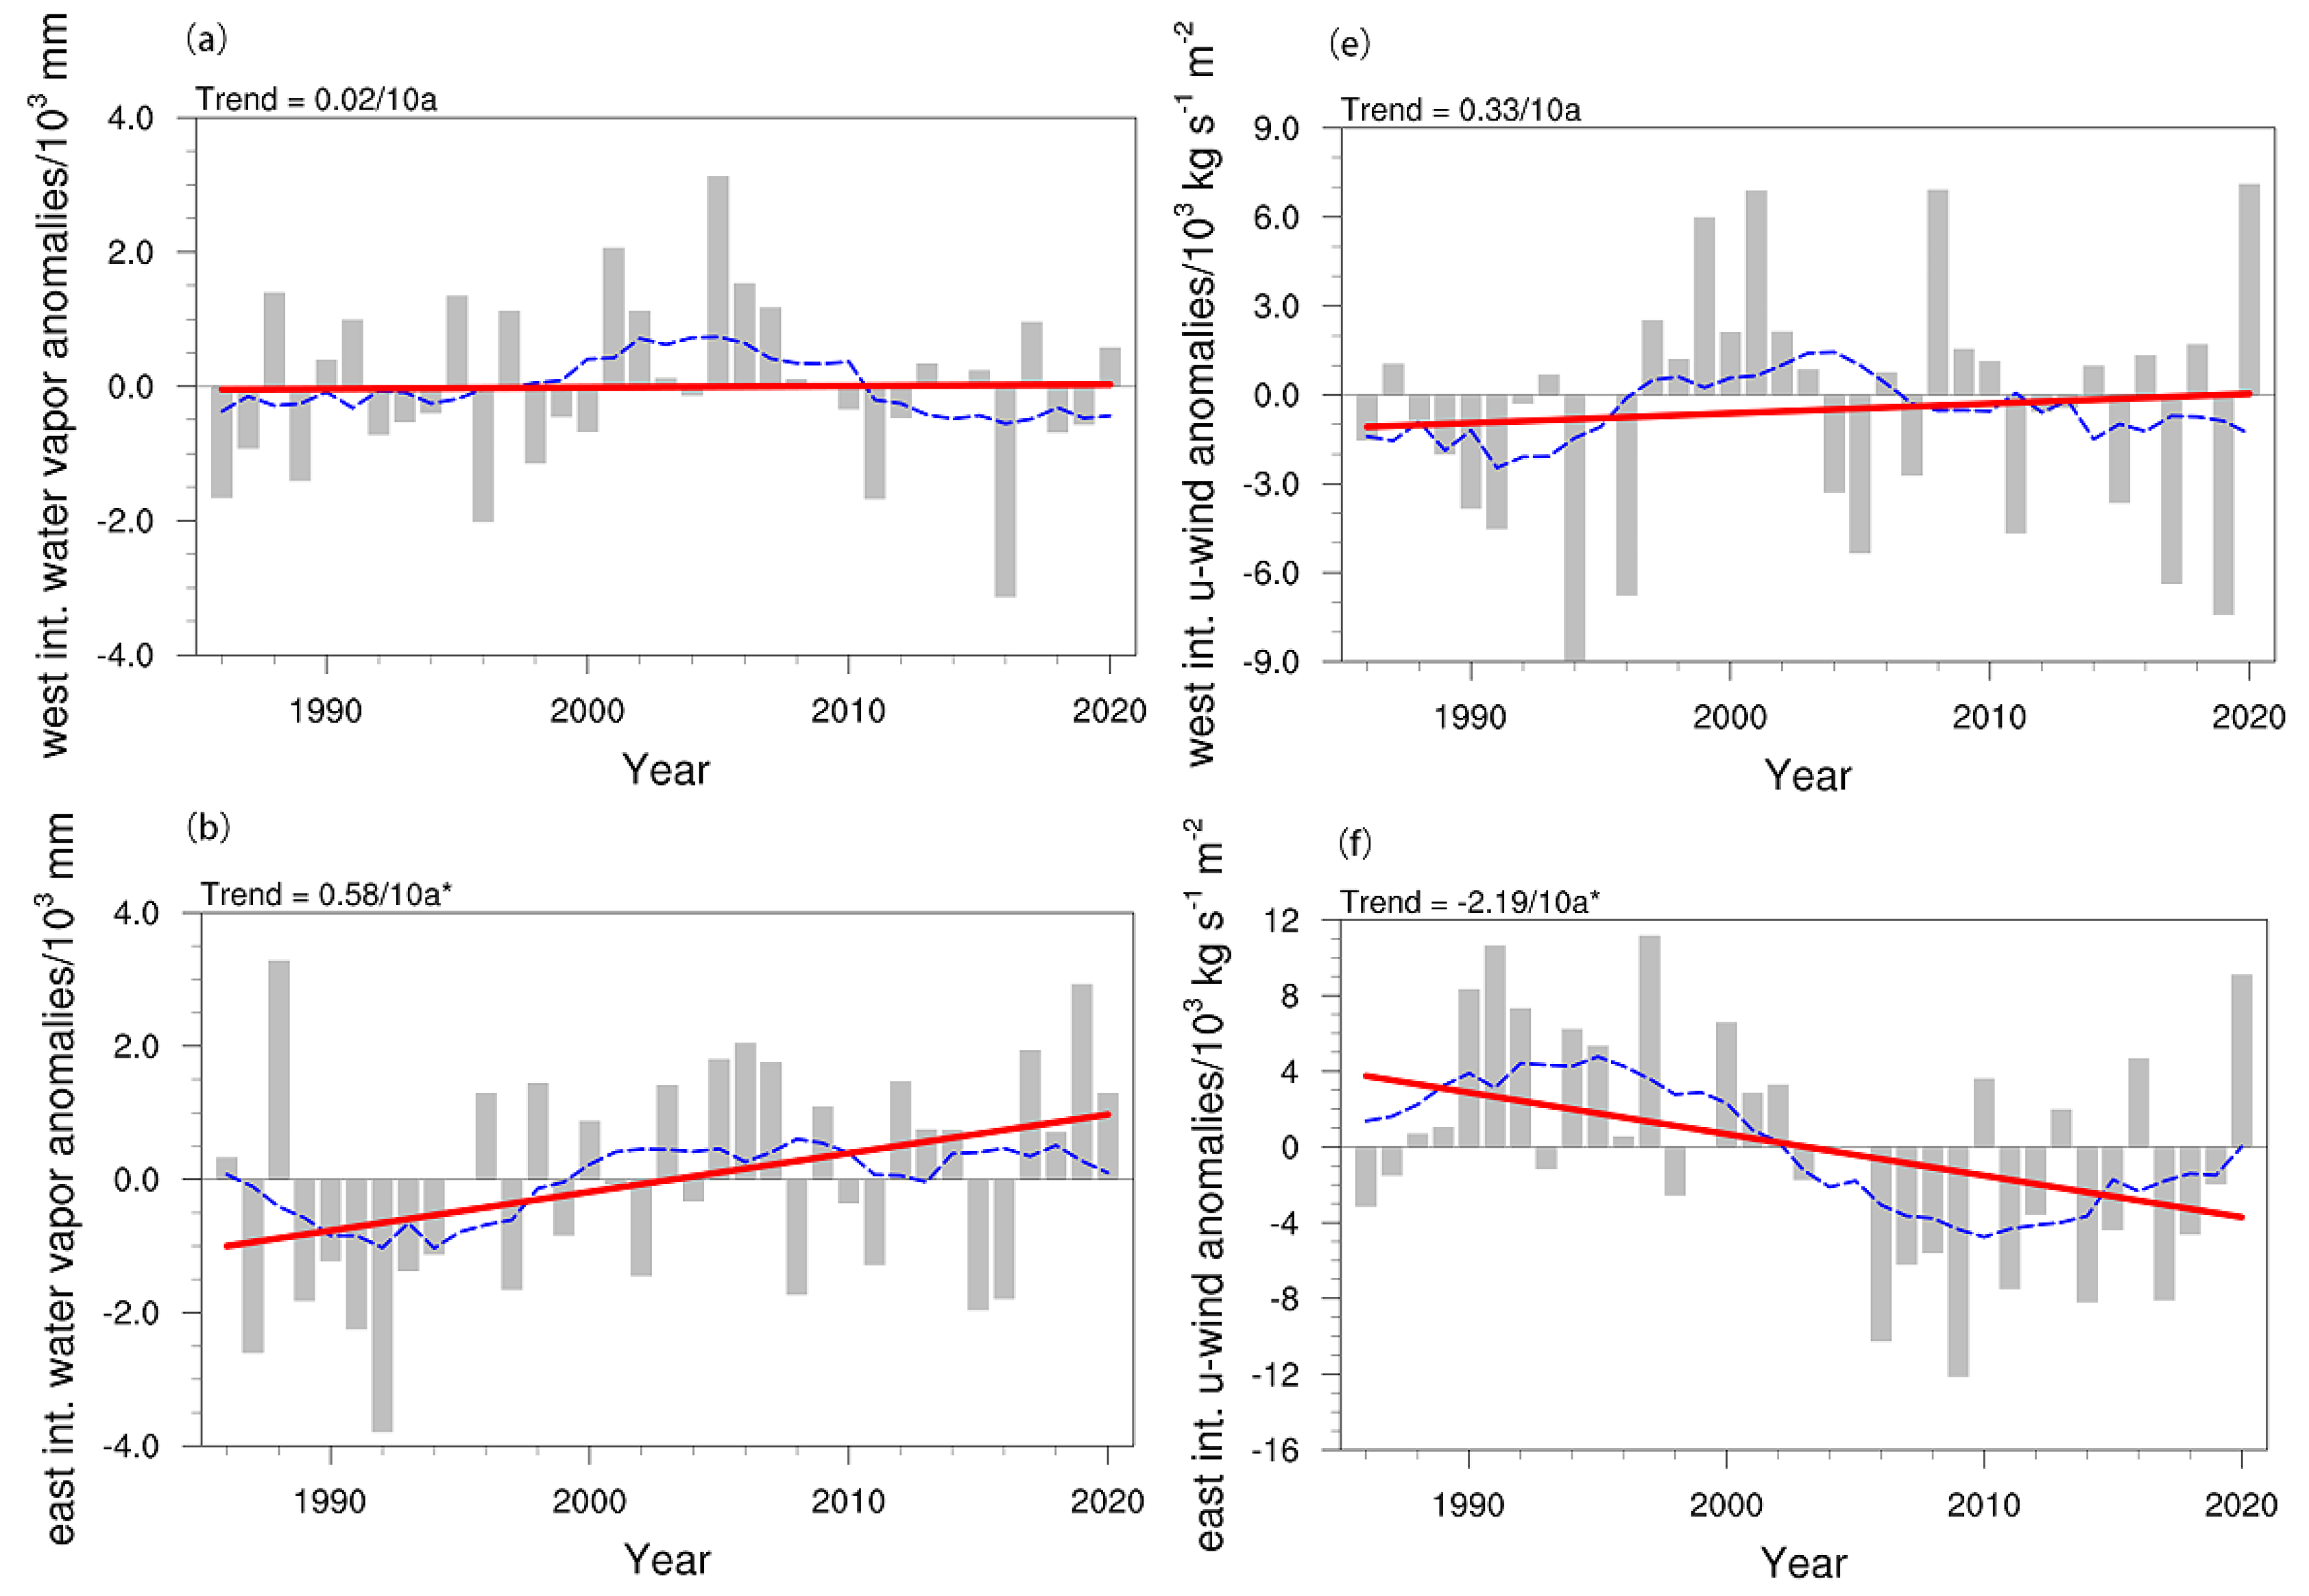
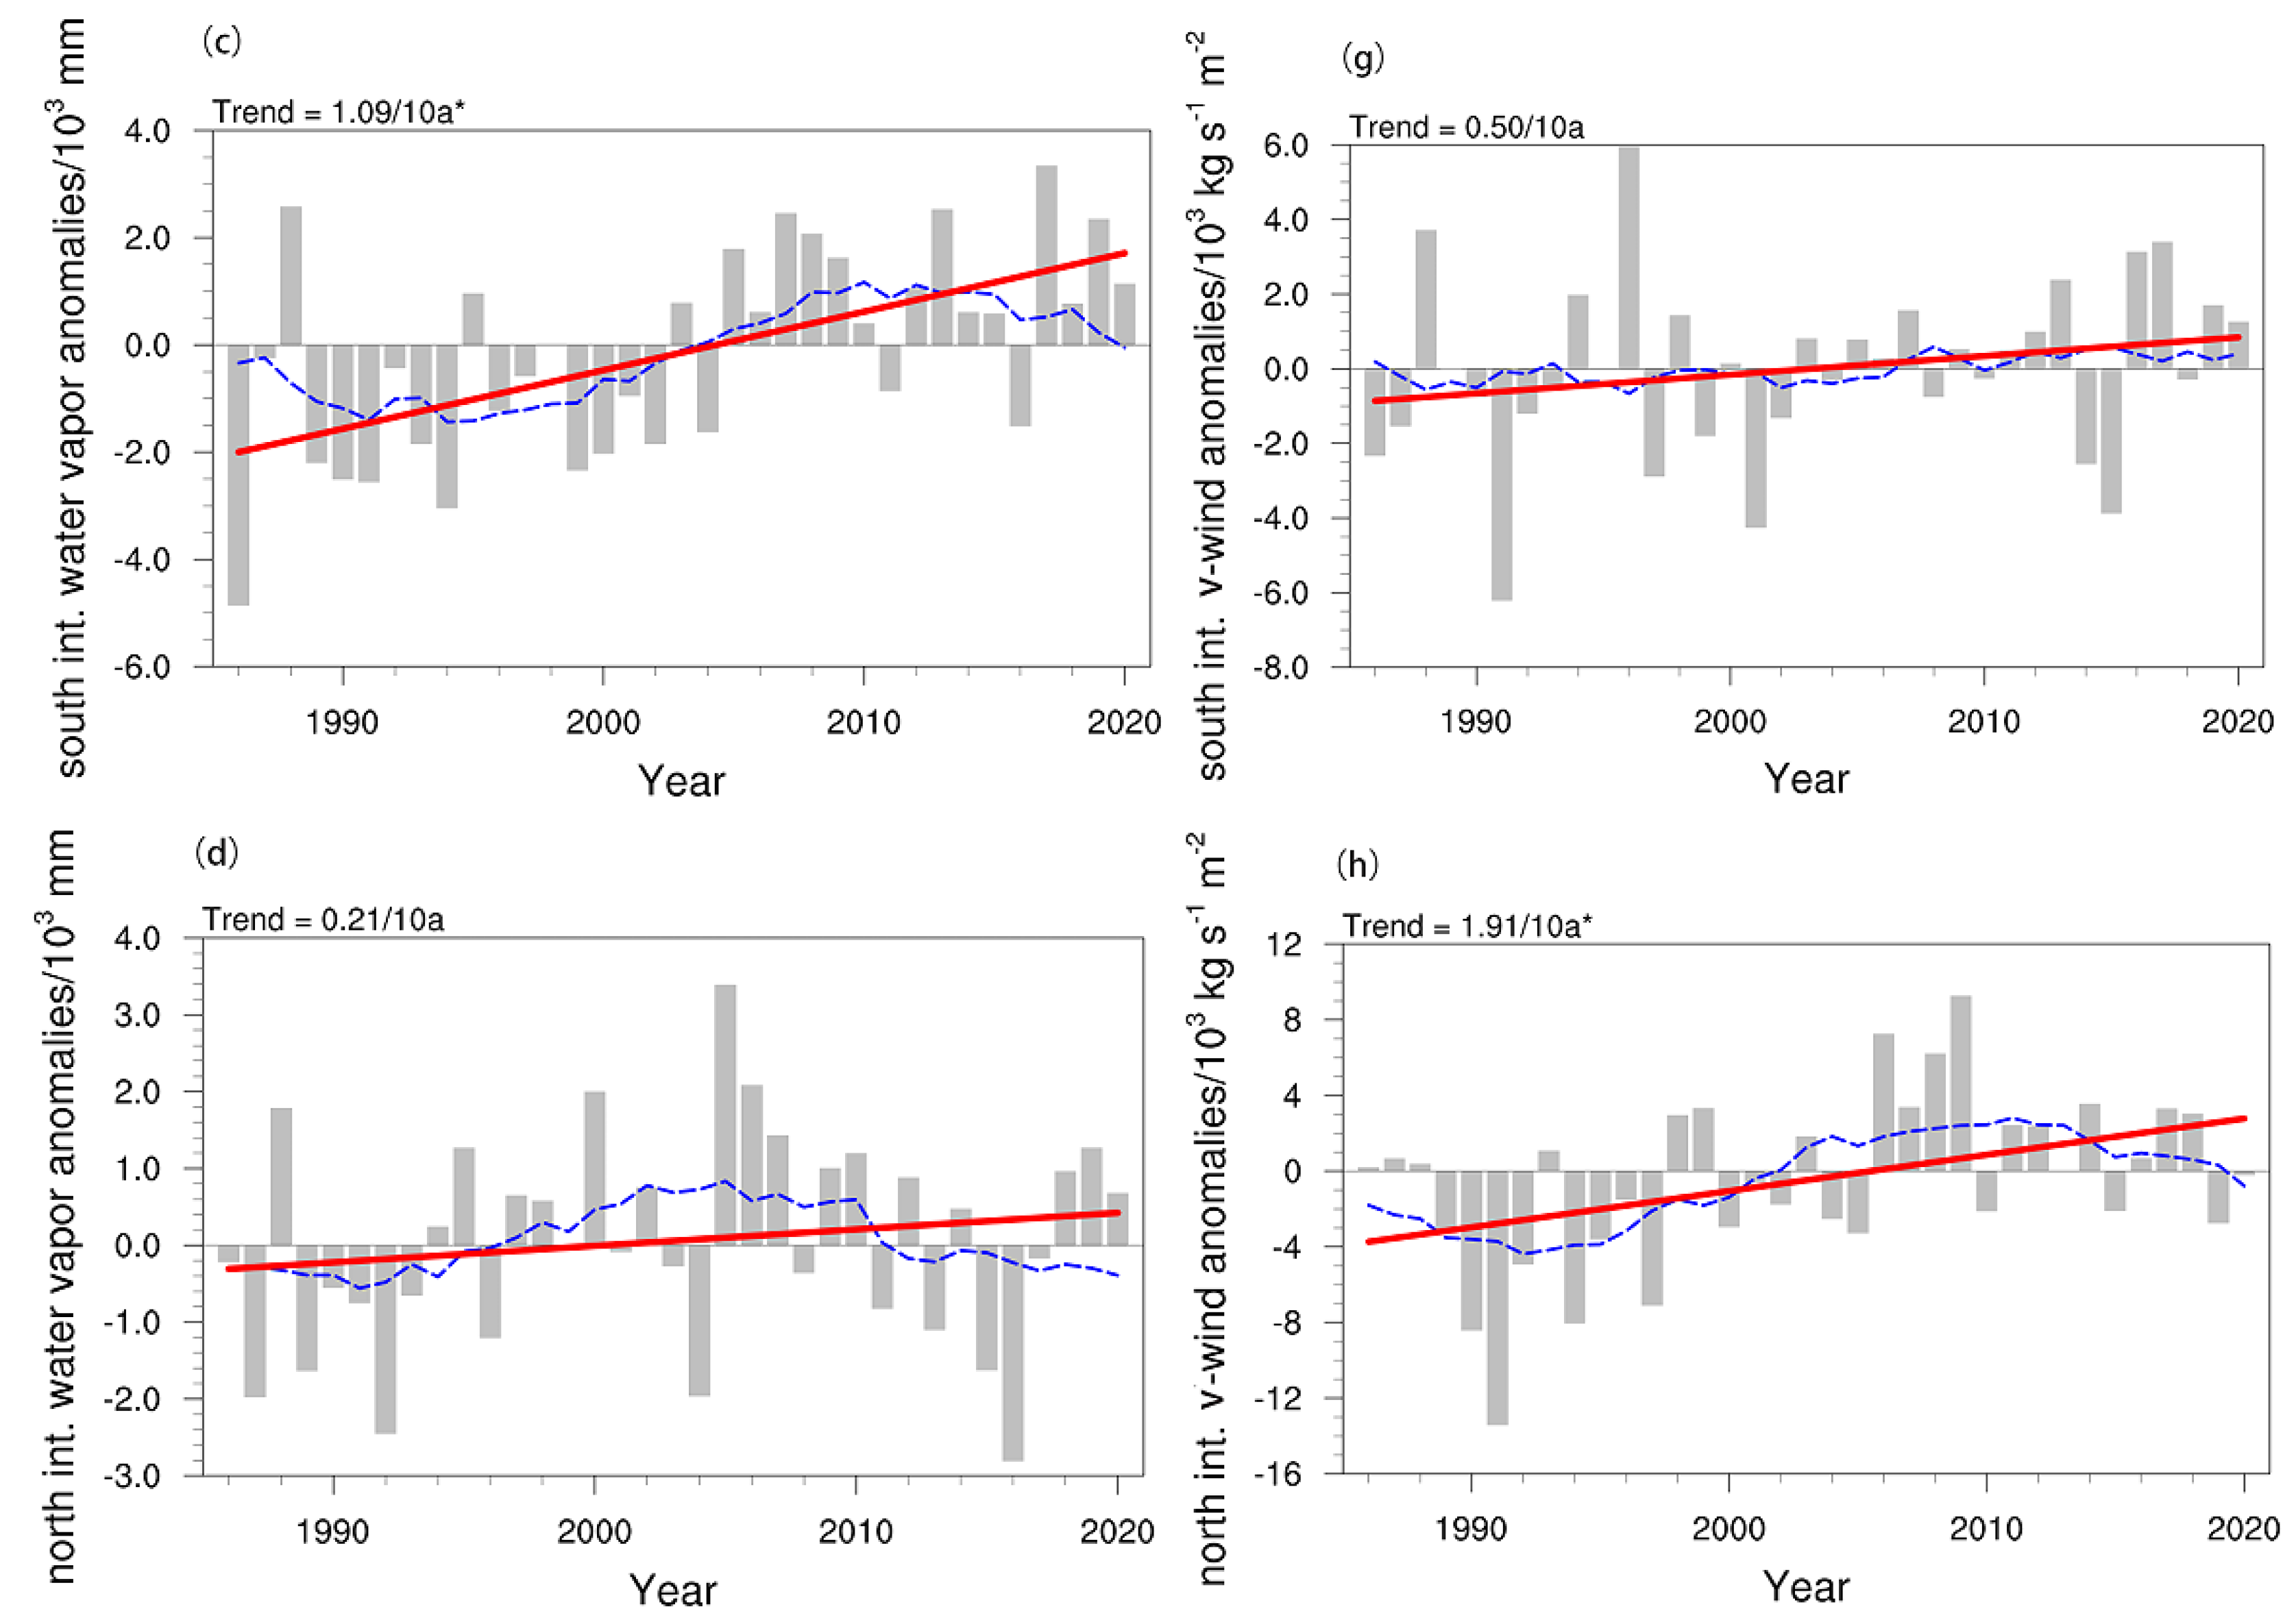
To further explore the relationship between extreme precipitation variability and water vapor transport variability in SXJ, we delineated the boundary of water vapor transport in SXJ (South: 34° N, North: 44° N, West: 74° E, and East: 96° E), and analyzed the combined difference in water vapor revenue and expenditure between 1961 and 1985 and between 1986 and 2020 (Figure 8a). We also analyzed the time series of standardized water vapor transport across the four borders (Figure 8 be). Compared with the previous period, the water vapor in SXJ increased by 1.33 × 10⁷ kg∙s−1 from 1986 to 2020. The water vapor along the western, southern, and eastern borders increased by 0.11 × 10⁷ kg∙s−1, 1.12 × 10⁷ kg∙s−1, and 0.65 × 10⁷ kg∙s−1, respectively, and the water vapor along the northern boundary decreased by 0.55 × 10⁷ kg∙s−1. These results revealed that water vapor transport in the meridional direction was dominant. The temporal trends of water vapor transport at the four boundaries over the last 60 years showed that significant changes did not occur at the western boundary, a significant decrease in the outflow of water vapor occurred at the eastern boundary, a significant increase in the inflow of water vapor occurred at the southern boundary, and a significant increase in the outflow of water vapor occurred at the northern boundary. The Mann–Kendall mutation test indicated that the turning point of this change occurred after the 1980s, which corresponds well with the trend of extreme precipitation. In addition, in order to determine whether wind or water vapor perturbation had a greater contribution to the changes in water vapor transport at each boundary, we analyzed the trends of the whole-layer integrals of the q and u/v components at the four boundaries from 1986 to 2020. The trend of u-wind (Figure 9e) was stronger than that of water vapor (Figure 9a), but it was not significantly stronger on the western boundary. Both the u-wind and water vapor trends were significant, and the u-wind trend (Figure 9f) was larger than that of water vapor on the eastern boundary (Figure 9b). The water vapor trend (Figure 9c) was much stronger than that of v-wind (Figure 9g) on the southern boundary and the v-wind trend (Figure 9h) was stronger than that of water vapor on the northern boundary (Figure 9d). Therefore, the variation in water vapor transport on the western, eastern, and northern boundaries was caused by perturbation of the wind field, whereas the variation on the southern boundary was caused by perturbation of the water vapor field.
In order to better understand the influence of water vapor transport at the four boundaries on extreme precipitation in SXJ, we analyzed the distribution of water vapor fluxes in four directions that were related to extreme precipitation in SXJ in summer. A negative correlation area between extreme precipitation and water vapor transport at the western border was observed in the Kezhou region (Figure 10a), a negative correlation area with the eastern border was observed in the middle part of the Tianshan Mountains (Figure 10b), and a positive correlation area with the northern border was observed in the middle part of the Tianshan Mountains (Figure 10d). Although these correlation areas were small, a large area with positive correlations was observed with the southern border in the western part of SXJ (Figure 10c), which means that water vapor transport from the southern border plays a crucial role in extreme precipitation in SXJ.
In order to clarify how water vapor, which leads to a change in the water budget in SXJ, is distributed in the vertical direction of each boundary, we present vertical cross-sections of the differences in water vapor transport fluxes between the four borders from 1961 to 1985 and from 1986 to 2020. The anomalous water vapor input on the northern boundary was concentrated in the lower 850 hPa, and the area with a large value of water vapor output was concentrated in the 90–96° E region at 700–400 hPa (Figure 11a). The entire layer on the southern boundary showed anomalous water vapor input, and the area with a large value of water vapor output was located in the 87–92° E region at 500 hPa (Figure 11b). The water vapor anomalies on the western boundary were scattered and anomalous water vapor input was mainly dominant at 700–300 hPa (Figure 11c). Anomalous water vapor input was observed at 850–500 hPa on the eastern boundary, with the high value area located at 40–43° N (Figure 11d).

4. Discussion and Conclusions

In this study, 60 years of precipitation data were used to analyze the spatial and temporal variations of each extreme precipitation feature in SXJ, to identify the abrupt time points of interdecadal transitions in extreme precipitation, and to explore large-scale circulation and water vapor transport anomalies before and after the transitions. In addition, the trends of boundary water vapor transport and the contributions of water vapor disturbance and wind disturbance to the changes in water vapor transport were investigated, and the correlation between extreme precipitation changes in SXJ and the water vapor flux of each boundary were analyzed. The vertical distribution characteristics of water vapor transport at each boundary were also given. The following conclusions were reached:
  • The areas with large values of extreme precipitation, extreme precipitation days, and extreme precipitation intensity in summer in SXJ were located in the Tianshan Mountains, at the northern slope of the Kunlun Mountains, and in the Hami region. The areas with large values of extreme precipitation contribution were located in the area around the southern leaning mountains of Kashgar and Hotan and the central part of Bazhou. Apart from extreme precipitation intensity, the other characteristic quantities showed an interdecadal increasing trend over the past 60 years, and the increase in extreme precipitation was likely more associated with an increase in the number of extreme precipitation days. In the western part of SXJ, the Tianshan Mountains, and the Hami area, extreme precipitation, the number of precipitation days, and the contribution of precipitation all exhibited a significant increasing trend. The turning point for the sudden change in extreme precipitation was 1986.
  • The large-scale circulation differences that caused the dramatic increase in extreme precipitation after 1986 were as follows: the upper levels in SXJ were dominated by the ascending branch of the western cyclonic circulation, thus leading to enhanced upward motion and dispersion in the upper levels; and the middle and lower levels were dominated by the ascending branch of the anticyclone in Mongolia, thus leading to periodic shifts in the upper airflow in SXJ and enhanced upward motion. In addition, stronger water vapor convergence at lower levels and enhanced atmospheric convective instability combined to cause an increase in extreme summer precipitation in SXJ.
  • The anomalous water vapor that caused the increase in extreme precipitation in summer in SXJ originated from the eastward Pacific Ocean and the southward Indian Ocean. Water vapor flow to the eastern, western, and southern boundaries increased and water vapor flow decreased at the northern boundary. The changes in water vapor transport at the southern and northern boundaries were significant and consistent with the trends in extreme precipitation, indicating that meridional water vapor transport was dominant. The changes in water vapor transport on the western, eastern, and northern boundaries were caused by perturbation of the wind field, whereas changes on the southern boundary were caused by perturbation of the water vapor field. Water vapor on the southern boundary was highly correlated with extreme precipitation in the western part of the southern border, which implies that water vapor transport on the southern boundary played a major role in the variations observed in extreme summer precipitation in SXJ after 1986. The water vapor transport at vertical heights exhibited greater input at the eastern and southern boundaries and greater output at the northern boundary. The meridional water vapor transport flux was concentrated in the middle and upper layers, whereas the latitudinal water vapor transport flux was concentrated in the middle and lower layers.
In general, this paper reveals the anomalous water vapor transport characteristics associated with the interdecadal variability in extreme precipitation in SXJ and highlights the importance of water vapor transport at the southern border for increases in extreme precipitation in summer. However, the station data included in the CN05.1 dataset were basically distributed at the edge of the Tarim Basin and relatively few data points were located in the desert hinterland, which introduced some uncertainty in the spatial distribution of extreme precipitation in the South Xinjiang Basin. Although the accuracy of the ERA5 data has been widely verified [59,60], the analysis of water vapor transport may still be biased. In the future, we will use satellite data to study water vapor transport in SXJ, to identify the source–sink structure of water vapor transport, and to verify our conclusions. In addition to large-scale circulation and water vapor transport anomalies, thermal anomalies in the plateau and sea surface temperature anomalies can also affect summer precipitation in SXJ [61,62]. These physical mechanisms related to precipitation variability still require further exploration. Thus, our group will attempt to further identify the physical mechanisms affecting extreme precipitation in SXJ through numerical models.

Author Contributions

Conceptualization, C.J. and Q.H. (Qing He); methodology, C.J. and Q.H. (Qian Huang); software, Q.H. (Qian Huang); validation, C.J.; formal analysis, C.J. and Q.H. (Qing He); resources, Q.H. (Qian Huang); data curation, Q.H. (Qian Huang); writing—original draft preparation, C.J.; writing—review and editing, C.J.; visualization, C.J.; project administration, Q.H. (Qing He). All authors have read and agreed to the published version of the manuscript.

Funding

This research was funded by the National Natural Science Foundation of China, grant number 42030612; the Third Xinjiang Scientific Expedition and Research program, grant number 2021xjkk030501; and the Second Tibetan Plateau Scientific Expedition and Research (STEP) program, grant number 2019QZKK010206.

Data Availability Statement

The daily precipitation data used in the study were obtained from the Climate Change Research Center, Chinese Academy of Sciences. The monthly average NCEP reanalysis data are available at https://psl.noaa.gov/data/gridded/data.ncep.reanalysis.html (accessed on 25 May 2023). The ERA5 reanalysis data are available at https://cds.climate.copernicus.eu/cdsapp#!/dataset/reanalysis-era5-pressure-levels (accessed on 25 May 2023). The terrain data can be obtained from https://www.ngdc.noaa.gov/mgg/global/relief/ETOPO2/ETOPO2v2-2006/ETOPO2v2c/netCDF/ (accessed on 25 May 2023).

Acknowledgments

We would like to express heartfelt thanks to the Urumqi Desert Meteorological Institute of China Meteorological Administration for their support. We would like to thank Suxiang Yao, School of Atmospheric Science, Nanjing University of Information Science and Technology, for her support in revising the manuscript.

Conflicts of Interest

The authors declare no conflict of interest.

References

  1. Yang, L.M.; Li, X.; Zhang, G.X. Some advances and problems in the study of heavy rain in Xinjiang. Clim. Environ. Res. 2011, 16, 188–198. [Google Scholar]
  2. Ci, H.; Zhang, Q.; Zhang, J.H.; Bai, Y.G.; Liu, J.Y. Spatiotemporal variations of extreme precipitation events within Xinjiang during 1961–2010. Geogr. Res. 2014, 33, 1881–1891. [Google Scholar]
  3. Wu, X.L.; Zhang, T.X.; Wang, H.; Yu, X.J.; Zheng, X.N.; Li, H.Y. Facts analysis of temperature and precipitation change of Xinjiang in recent 60 years. Desert Oasis Meteorol. 2020, 14, 27–34. [Google Scholar]
  4. IPCC. Climate Change 2021: The Physical Science Basis. Contribution of Working Group I to the Fifth Assessment Report of the Intergovernmental Panel on Climate Change; Cambridge University Press: Cambridge, UK; New York, NY, USA, 2021. [Google Scholar]
  5. Zeng, J.; Guo, F.; Zhao, C.; Sun, Z.Y.; Zhao, Y.J. Climate change of small oases in the southern margin of Taklimakan Desert in recent 50 years. Arid. Zone Geogr. 2014, 37, 948–957. [Google Scholar]
  6. Han, Y.H.; Ma, Z.G.; Yang, Q.; Pan, Z.H. Changing characteristics of daytime and nighttime precipitation in Xinjiang under global warming. Clim. Environ. Res. 2014, 19, 763–772. [Google Scholar]
  7. Wang, S.P.; Jiang, F.Q.; Wu, X.B.; Hu, R.J. Temporal and spatial variability of the extreme precipitation indices overthe arid regions in Northwest China from 1961 to 2010. J. Glaciol. Geocryol. 2014, 36, 318–326. [Google Scholar]
  8. Zou, S.; Duan, W.L.; Christidis, N.; Nover, D.; Abuduwaili, J.; De Maeyer, P.; Van De Voorde, T. An extreme rainfall event in summer 2018 of Hami city in eastern Xinjiang, China. Adv. Clim. Chang. Res. 2021, 12, 795–803. [Google Scholar] [CrossRef]
  9. Chen, Y.; Ma, Y. Spatial and temporal characteristics of flood and rainstorm disaster in Xinjiang. Arid Land Geogr. 2021, 44, 1515–1524. [Google Scholar]
  10. Jin, C.; He, Q.; Huang, Q. A review on rainstorm research in southern Xinjiang. Trans. Atmos. Sci. 2023, 46, 82–96. [Google Scholar]
  11. Wang, Q.; Zhao, Y.; Chen, F.; Yang, Q.; Huang, A.N. Characteristics of different patterns of South Asia high and their relationships with summer precipitation in Xinjiang. Plateau Meteorol. 2017, 36, 1209–1220. [Google Scholar]
  12. Duan, W.; He, B.; Takara, K.; Luo, P.; Hu, M.; Alias, N.E.; Nover, D. Changes of precipitation features and extremes over Japan between 1901 and 2012 and their connection to climate indices. Clim. Dyn. 2015, 45, 2273–2292. [Google Scholar] [CrossRef]
  13. Yang, L.M.; Liu, J. Some advances of water vapor research in Xinjiang. J. Nat. Hazards 2018, 27, 1–13. [Google Scholar]
  14. Ren, G.Q.; Zhao, Y. Relationship between the Subtropical Westerly Jet and Summer Rainfall over Central Asia from 1961 to 2016. Plateau Meteorol. 2022, 41, 1425–1434. [Google Scholar]
  15. Xu, R.; Ming, J. Patterns of Extreme Precipitation and Characteristics of Related Systems in the Northern Xinjiang Region. Atmosphere 2021, 12, 358. [Google Scholar] [CrossRef]
  16. Zhang, J.L.; Yang, X.; Shi, J.J. Analysis of the Influence of the Qinghai-Xizang Plateau Weather System on a Rare Rainstorm Process on the Northern Slope of Kunlun Mountain. Plateau Meteorol. 2021, 40, 1002–1011. [Google Scholar]
  17. Wang, Y.Q.; Feng, J.; Li, J.P.; An, R. Interannual Variation of Summer Precipitation in the Eastern of Northwest China and its Relationship with Circulation. Plateau Meteorol. 2020, 39, 290–300. [Google Scholar]
  18. Zhang, J.L.; Li, R.Q.; Li, N.; Li, H.H.; Shi, J.J. Preliminary Analysis of the Water Vapor Characteristics of the “July 19” Heavy Rain in 2021 in the Tarim Basin, Xinjiang. Chin. J. Atmos. Sci. 2023, 47, 567–584. [Google Scholar]
  19. Li, B.; Li, Y.Y.; Chen, Y.R. Research Progress of Tibetan Plateau Vortex and Central Asian Vortex in Recent Decade. Plateau Mt. Meteorol. Res. 2023, 43, 17–27. [Google Scholar]
  20. Zhuang, X.C.; Li, R.Q.; Li, B.Y.; Li, J.L.; Sun, Z.J. Analysis on Rainstorm Caused by Central Asian Vortex in Northern Xinjiang. Meteor. Mon. 2017, 43, 924–935. [Google Scholar]
  21. Ayitken, M.; Yang, L.M.; Zhang, Y.H.; Musa, Y. Characteristic analysis of environment of short-time heavy rainfall under the background of the Central Asian Vortex in Xinjiang in recent ten years. Arid Zone Geogr. 2018, 41, 273–281. [Google Scholar]
  22. Yang, T.; Yang, L.M.; Li, J.G.; Zhou, Y.S.; Ran, L.K. Review of studies about Central Asian vortex and its influence on heavy precipitation in Xinjiang. Torrential Rain Disasters 2022, 41, 613–620. [Google Scholar]
  23. Guo, N.; Zhou, Y.; Yang, L. Statistical analysis of Central Asian vortices and their influence on precipitation in Xinjiang. Atmos. Res. 2021, 249, 105327. [Google Scholar] [CrossRef]
  24. Huang, W.; Feng, S.; Chen, J.; Chen, F. Physical mechanisms of summer precipitation variations in the Tarim Basin in northwestern China. J. Clim. 2015, 28, 3579–3591. [Google Scholar] [CrossRef]
  25. Hua, L.; Zhong, L.; Ma, Z. Decadal transition of moisture sources and transport in northwestern China during summer from 1982 to 2010. J. Geophys. Res. Atmos. 2017, 122, 12522–12540. [Google Scholar] [CrossRef]
  26. Bothe, O.; Fraedrich, K.; Zhu, X. Precipitation climate of Central Asia and the large-scale atmospheric circulation. Theor. Appl. Climatol. 2012, 108, 345–354. [Google Scholar] [CrossRef]
  27. Wang, S.; Zhang, M.; Sun, M.; Wang, B.; Li, X. Changes in precipitation extremes in alpine areas of the Chinese Tianshan Mountains, central Asia, 1961–2011. Quat. Int. 2013, 311, 97–107. [Google Scholar] [CrossRef]
  28. Zhang, J.; Chen, Z.; Chen, H.; Ma, Q.; Teshome, A. North Atlantic multidecadal variability enhancing decadal extratropical extremes in boreal late summer in the early twenty-first century. J. Clim. 2020, 33, 6047–6064. [Google Scholar] [CrossRef] [Green Version]
  29. Zhao, Y.; Huang, A.; Zhou, Y.; Huang, D.; Yang, Q.; Ma, Y.; Li, M.; Wei, G. Impact of the Middle and Upper Tropospheric Cooling over Central Asia on the Summer Rainfall in the Tarim Basin, China. J. Clim. 2014, 27, 4721–4732. [Google Scholar] [CrossRef]
  30. Zhao, Y.; Huang, A.; Zhou, Y.; Yang, Q. The impacts of the summer plateau monsoon over the Tibetan Plateau on the rainfall in the Tarim Basin, China. Theor. Appl. Climatol. 2016, 126, 265–272. [Google Scholar] [CrossRef]
  31. Chen, C.; Zhang, X.; Lu, H.; Jin, L.; Du, Y.; Chen, F. Increasing summer precipitation in arid Central Asia linked to the weakening of the East Asian summer monsoon in the recent decades. Int. J. Climatol. 2021, 41, 1024–1038. [Google Scholar] [CrossRef]
  32. Ding, Y.H.; Hu, G.Q. A study on water vapor budgetover China during the 1998 severe flood periods. Acta Meteor. Sin. 2003, 61, 129–145. [Google Scholar]
  33. Li, J.L.; Li, Z.R.; Yang, J.C.; Shi, Y.Z.; Fu, J. Analyses on Spatial Distribution and Temporal Variation of Atmosphere Water Vapor over Northwest China in Summer of Later 10 Years. Plateau Meteorol. 2012, 31, 1574–1581. [Google Scholar]
  34. Xu, X.; Shi, X.; Wang, Y.; Peng, S.; Shi, X. Data analysis and numerical simulation of moisture source and transport associated with summer precipitation in the Yangtze River Valley over China. Meteorol. Atmos. Phys. 2008, 100, 217–231. [Google Scholar] [CrossRef]
  35. Jiang, X.L.; Ma, Z.G.; Gong, Y.F. Comparative Analysis of Relationship between Moisture Budget and Precipitation Changes among Global Significantly Wetting/Drying Regions. Plateau Meteorol. 2015, 34, 1279–1291. [Google Scholar]
  36. Wang, Y.X.; Yan, H.M.; Jin, Y.; Peng, Q.X. Characteristics of Water Vapor Transport over the Low-Latitude Highlands and its Effect on Yunnan Climate. Plateau Meteorol. 2020, 39, 925–934. [Google Scholar]
  37. Pan, F.; He, D.M.; Cao, J.; Lu, Y. Multiple branches of water vapor transport over the Nujiang River Basin in summer and its impact on precipitation. Acta Geogr. Sin. 2023, 78, 87–100. [Google Scholar]
  38. Zhou, C.Y.; Jiang, X.W.; Li, Y.Q.; Wei, G.C. Features of Climate Change of Water Vapor Resource overEastern Region of the Tibetan Plateau and Its Surroundings. Plateau Meteorol. 2009, 28, 55–63. [Google Scholar]
  39. Xu, X.D.; Tao, S.Y.; Wang, J.Z.; Chen, L.S.; Zhou, L.; Wang, X.R. The relationship between water vapor transport features of Tibetan Plateau-Monsoon “Large triangle” affecting region and drought-flood abnormality of China. Acta Meteorol. Sin. 2002, 60, 258–264. [Google Scholar]
  40. Wang, K.L.; Jiang, H.; Zhao, H.Y. Atmospheric water vapor transport from westerly and monsoon over the Northwest China. Adv. Water Sci. 2005, 16, 432–438. [Google Scholar]
  41. Wei, N.; Gong, Y.F.; Sun, X.; Fang, J.G. Variation of Precipitation and Water Vapor Transport over the Northwest China from 1959 to 2005. J. Desert Res. 2010, 30, 1450–1457. [Google Scholar]
  42. Huang, W.; Chang, S.Q.; Xie, C.L.; Zhang, Z.P. Moisture sources of extreme summer precipitation events in North Xinjiang and their relationship with atmospheric circulation. Adv. Clim. Chang. Res. 2017, 8, 12–17. [Google Scholar] [CrossRef]
  43. He, J.H.; Liu, Y.Y.; Chang, Y. Analysis of summer precipitation anomaly and the feature of water vapor transport and circulation in Northwest China. J. Arid Meteorol. 2005, 23, 10–16. [Google Scholar]
  44. Yu, Y.X.; Wang, J.S.; Li, Q.Y. Spatial and Temporal Distribution of Water Vapor and Its Variation Trend in Atmosphere over Northwest China. J. Glaciol. Geocryol. 2003, 25, 149–156. [Google Scholar]
  45. Wang, X.R.; Xu, X.D.; Wang, W.G. Charateristic of Spatial Transportation of Water Vapor for Northwest China’s Rainfall in Spring and Summer. Plateau Meteorol. 2007, 26, 749–758. [Google Scholar]
  46. Li, W.L.; Wang, K.L.; Fu, S.M.; Jiang, H. The interrelationship between regional westerly index and the water vapor budget in Northwest China. J. Glaciol. Geocryol. 2008, 30, 28–34. [Google Scholar]
  47. Zhang, W.C.; Tang, Y.; Zheng, J.M.; Cao, J.; Ma, T. Impacts of the vapor transportation by summer monsoon on drought and flooding in summer of Yunnan. J. Nat. Resour. 2012, 27, 293–301. [Google Scholar]
  48. Li, Y.H.; Xu, H.M.; Gao, Y.H.; Li, Q. The characteristics of moisture transport associatied with drought/flood in summer over the east of the southwestern China. Acta Meteor. Sin. 2010, 68, 932–943. [Google Scholar]
  49. Liu, Z.L.; Zhang, X.P.; Li, Z.X.; He, X.G.; Guan, H.D. Spatial-temporal distribution characteristics of droughts /floods abnormality in the Dongting Lake Basin and its relationship with atmospheric circulation and water vapor transport. Resour. Environ. Yangtze Basin 2021, 30, 721–733. [Google Scholar]
  50. Ke, H.; Yin, Y.X.; Wang, X.J.; Luo, Z.W.; Liu, M.Y. Characteristics of summer drought and water vapor differences in typical drought and flood years in the coastal provinces. J. China Hydrol. 2022, 42, 29–34. [Google Scholar]
  51. Zhou, C.; Li, Y.; Peng, J. The characteristics and variation of precipitation and water resource of Sichuan and Chongqing basin on the eastern side of the plateau. Chin. J. Atmos. Sci. 2006, 30, 1217. [Google Scholar]
  52. Wu, J.; Gao, X.J. A gridded daily observation dataset over China region and comparison with the other datasets. Chin. J. Geophys. 2013, 56, 1102–1111. [Google Scholar]
  53. Xue, L.Q.; Liu, X.Q.; Song, J.J.; Zhang, Z.Q.; Li, X.C. Determine threshold of basin extreme events based on percentile method analysis. J. Hydroelectr. Eng. 2013, 32, 26–29. [Google Scholar]
  54. Chi, X.X.; Yin, Z.E.; Wang, X.; Sun, Y.K. A comparison of methods for benchmarking the threshold of daily precipitation extremes in China. J. Catastrophology 2015, 30, 186–190. [Google Scholar]
  55. Yang, Z.X.; Qi, P.; Sun, L.; Cui, X.P.; Zhao, Y.L. Thresholds determination and characteristics analysis of short-time heavy rainfall in the Northeast side of Qinghai Tibet Plateau. J. Arid Meteorol. 2021, 39, 563–568. [Google Scholar]
  56. Trenberth, K.E. Climate diagnostics from global analyses: Conservation of mass in ECMWF analyses. J. Clim. 1991, 4, 707–722. [Google Scholar] [CrossRef]
  57. Xu, K.; Zhong, L.; Ma, Y.; Zou, M.; Huang, Z. A study on the water vapor transport trend and water vapor source of the Tibetan Plateau. Theor. Appl. Climatol. 2020, 140, 1031–1042. [Google Scholar] [CrossRef]
  58. Xu, D.; Kong, Y.; Wang, C.H. Changes of Water Vapor Budget in Arid Area of Northwest China and Its Relationship with Precipitation. J. Arid Meteorol. 2016, 34, 431–439. [Google Scholar]
  59. Liu, H.B.; Dong, L.; Yan, R.J.; Zhang, X.C.; Guo, C.; Liang, S.C.; Tu, J.L.; Feng, X.D.; Wang, X.L. Evaluation of Near-Surface Wind Speed Climatology and Long-Term Trend over China’s Mainland Region Based on ERA5 Reanalysis. Clim. Environ. Res. 2021, 26, 299–311. [Google Scholar]
  60. Liu, J.; Chen, Y.; Wang, M.; Zhou, X.M. Comparison of the Applicability between ERA-Interim and ERA5 Reanalysis in Complex Terrain Area of Southwest China. Plateau Mt. Meteorol. Res. 2023, 43, 95–103. [Google Scholar]
  61. Wang, T.Z.; Zhao, Y. Relationships between Thermal Anomalies over the Qinghai-Xizang Plateau and Tropical Indian Ocean in May with Summer Rainfall in Xinjiang. Plateau Meteorol. 2021, 40, 1–14. [Google Scholar]
  62. Niu, M.M.; Zhang, J.; Ma, Q.R.; Chen, Z.H. Influence of Indian Ocean Warming on Extreme Precipitation in the Western Tianshan Mountains from Late Spring to Early Summer. Chin. J. Atmos. Sci. 2023, 47, 295–310. [Google Scholar]
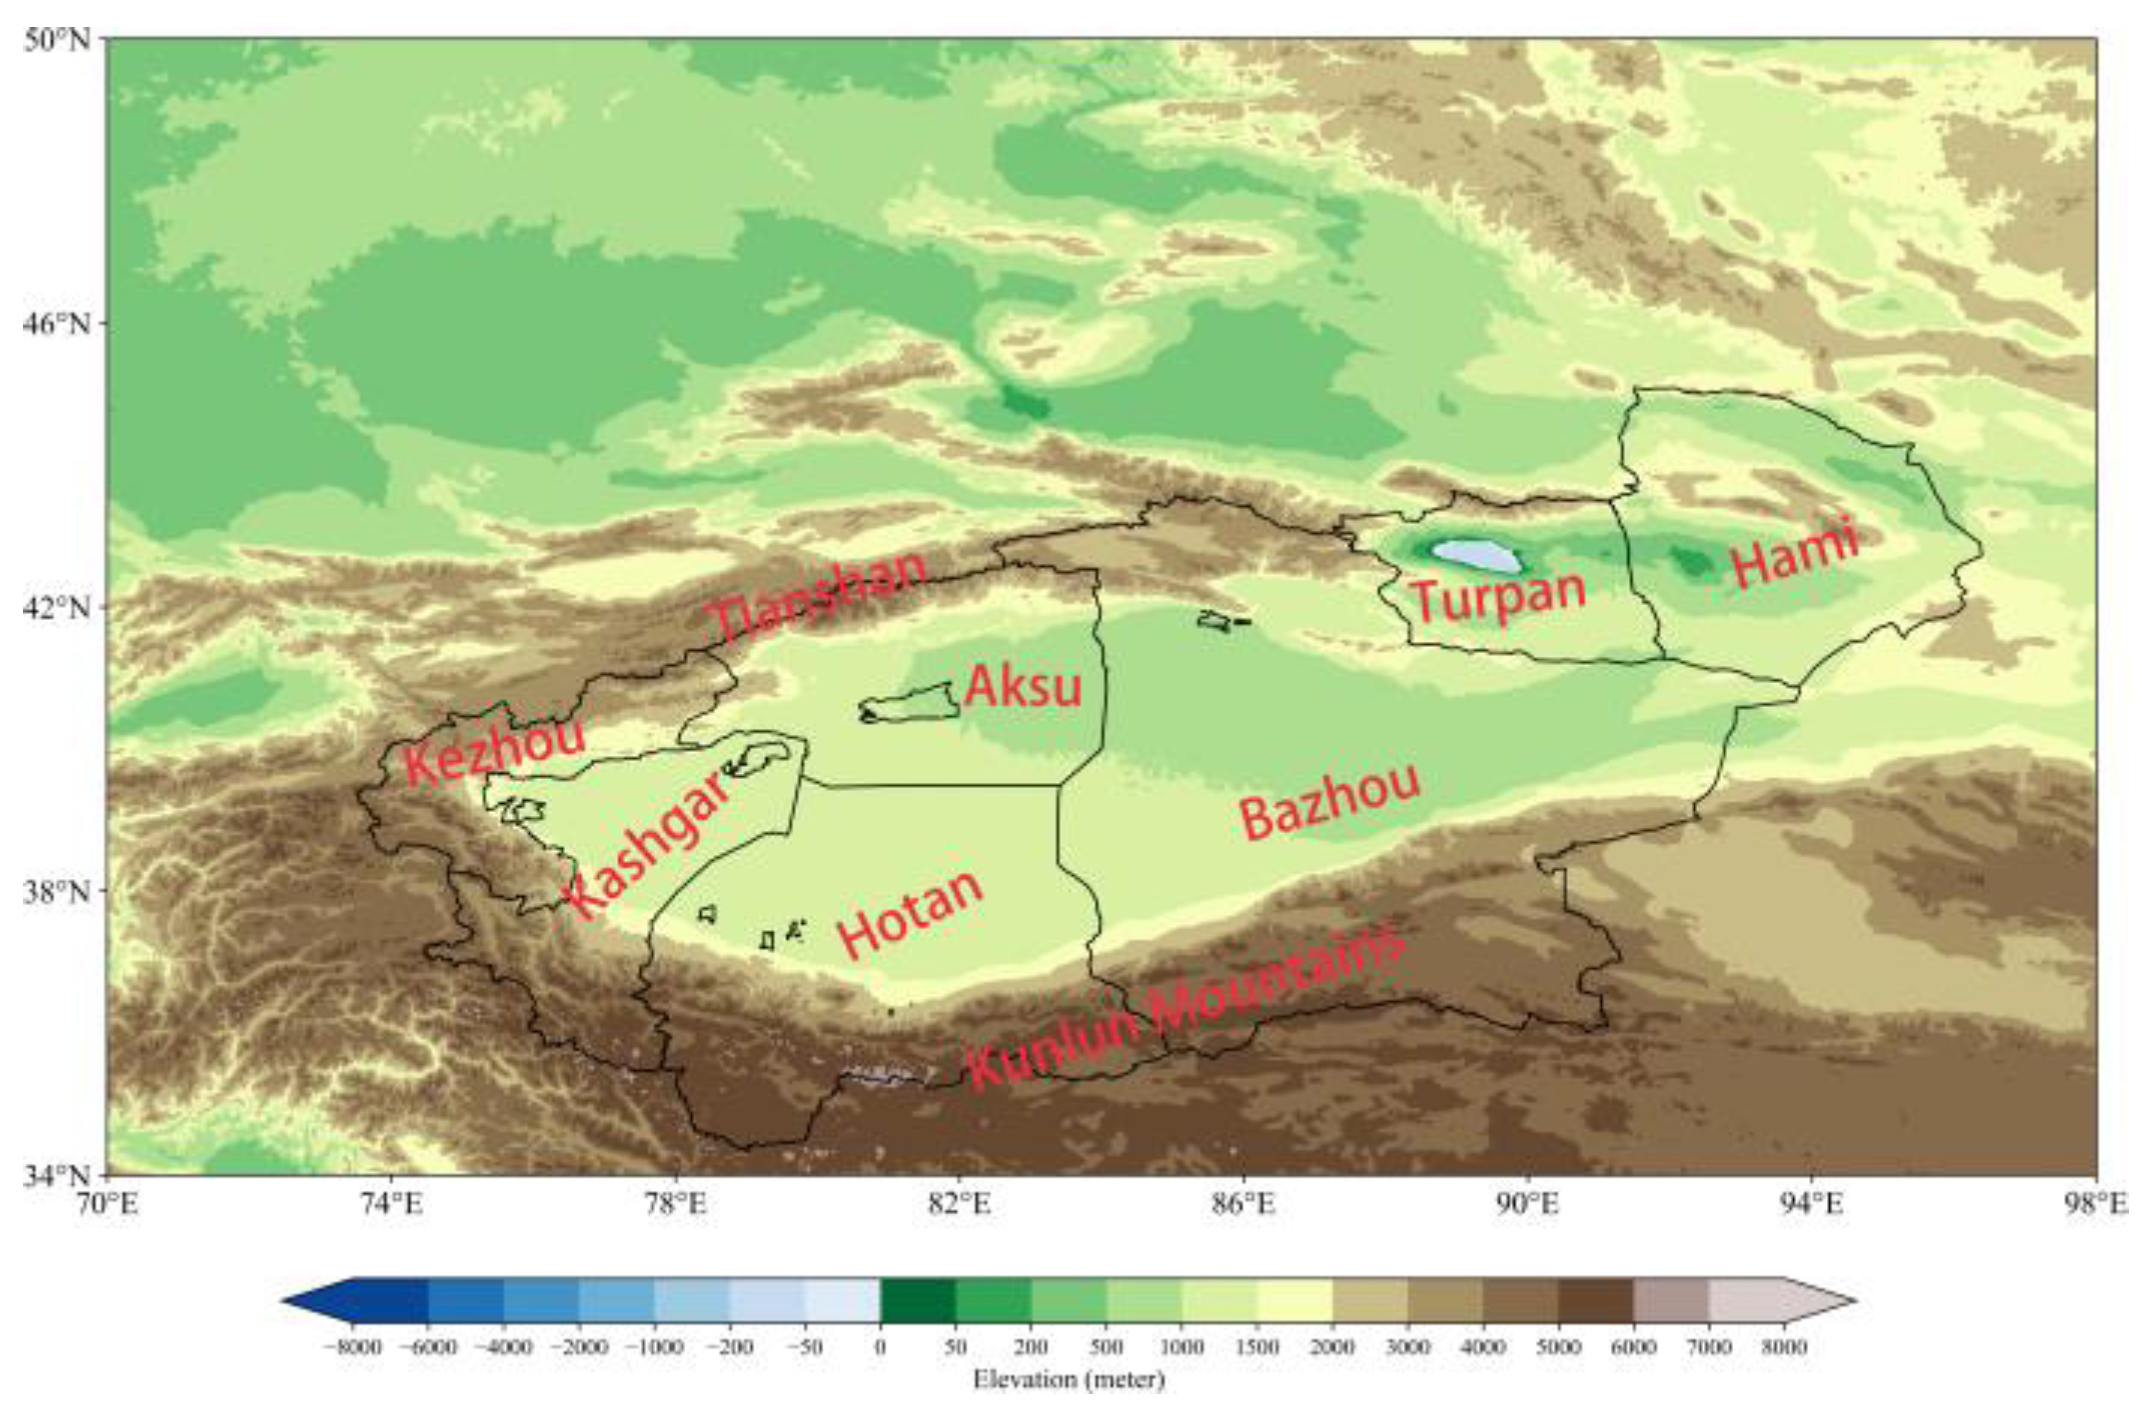
Figure 1. Topography of SXJ (the black solid line indicates the study area).
Water 15 02361 g001
Figure 2. Spatial distribution of summer precipitation and each extreme precipitation characteristic in SXJ from 1961 to 2020: (a) summer precipitation (unit: mm), (b) R95p (unit: mm), (c) R95f (units: day), (d) R95i (unit: mm/day), and (e) R95r (unit: %).
Water 15 02361 g002aWater 15 02361 g002b
Figure 3. Time series of summer precipitation and each extreme precipitation characteristic in SXJ from 1961 to 2020: (a) summer precipitation, (b) R95p, (c) R95f, (d) R95i, and (e) R95r. The red line is the trend line; the blue dashed line is the 11−year sliding average; and asterisk indicates that the value passed the 0.05 t−test.
Water 15 02361 g003aWater 15 02361 g003b
Figure 4. Spatial trend distribution of summer precipitation and each extreme precipitation characteristic in SXJ from 1961 to 2020: (a) summer precipitation, (b) R95p, (c) R95f, (d) R95i, and (e) R95r. The dotted areas indicate that the values passed the 0.05 t−test.
Water 15 02361 g004aWater 15 02361 g004b
Figure 5. Mann−Kendall test for regional mean summer extreme precipitation in SXJ from1961 to 2020. The dashed lines indicate significance at the 0.05 level.
Water 15 02361 g005
Figure 6. Difference fields at (a) 200 hPa, (b) 500 hPa, and (c) 850 hPa geopotential height (shading, units: m) and horizontal winds (vectors, units: m·s−1). (d) Vertical profiles of the difference fields along the 36–44° N wind field (vectors, units: m·s−1), pseudo−equivalent potential temperature (contour, units: °C), and water vapor flux divergence (shading, units: 10−8·g·cm−2·hPa−1·s−1). The dots and red vectors indicate significant differences between the two periods at the 0.05 level, and the gray shading represents topographic shielding.
Water 15 02361 g006aWater 15 02361 g006b
Figure 7. Differences in summer vertical water vapor fluxes (vectors, units: kg∙m−1∙s−1) and their convergence (shading, units: kg∙m−2∙s−1) between 1961 and 1985 and between 1986 and 2020. The red vectors indicate significant differences between the two periods at the 0.05 level.
Water 15 02361 g007
Figure 8. (a) Combined differences in summer water vapor receipts and expenditures in SXJ between 1961 and 1985 and between 1986 and 2020 (units: 107 kg∙s−1). The red rectangles represent the water vapor transport boundaries: (b) west, (c) east, (d) south, and (e) north. Standardized time series of boundary water vapor transport. The red line is the trend line, the blue dashed line is the 11−year sliding average, double asterisk indicates values that passed the 0.05 t−test, and single asterisk indicates values that passed the 0.1 t−test.
Water 15 02361 g008aWater 15 02361 g008b
Figure 9. Standardized time series of the whole−layer integration of the q and u/v components at the four boundaries (west (a,e), east (b,f), south (c,g), and north (d,h)) in SXJ in summer from 1986 to 2020. The red solid line indicates the trend line, the blue dashed line indicates the 11−year sliding average, and asterisk indicates that the value passed the 0.05 t−test.
Water 15 02361 g009aWater 15 02361 g009b
Figure 10. Correlation distribution of extreme precipitation in SXJ in summer with (a) western, (b) eastern, (c) southern, and (d) northern boundary water vapor transport flux from 1986 to 2020. The dotted area indicates that the value passed the 0.05 t–test.
Water 15 02361 g010aWater 15 02361 g010b
Figure 11. Vertical cross−sections of the difference in water vapor transport flux at the (a) northern, (b) southern, (c) western, and (d) eastern boundaries between 1961 and 1985 and between 1986 and 2020. The gray shading represents topographic shielding.
Water 15 02361 g011
Disclaimer/Publisher’s Note: The statements, opinions and data contained in all publications are solely those of the individual author(s) and contributor(s) and not of MDPI and/or the editor(s). MDPI and/or the editor(s) disclaim responsibility for any injury to people or property resulting from any ideas, methods, instructions or products referred to in the content.