Article

Sustainability Assessment of Urban Waterscape Belt Ecological Reconstruction Based on LCA–Emergy–Carbon Emission Methodology

1
School of Civil Engineering and Architecture, Nanjing Institute of Technology, Nanjing 211167, China
2
Research Institute Co., Ltd., Southeast University Architectural Design, Nanjing 210096, China
3
College of Architecture and Urban Planning, Qingdao University of Technology, Qingdao 266033, China
4
School of Civil Engineering and Architecture, Jiangsu University of Science and Technology, Zhenjiang 212100, China
*
Authors to whom correspondence should be addressed.
Water 2023, 15(13), 2345; https://doi.org/10.3390/w15132345
Submission received: 16 April 2023 / Revised: 10 June 2023 / Accepted: 20 June 2023 / Published: 24 June 2023
(This article belongs to the Special Issue Sustainable Development of Water, Energy, and Environment Systems)

Abstract

:
Rivers play a key role in regulating urban ecology, which can improve urban climate while slowing the heat island effect. As one of embodied energy in the field of ecology, emergy theory can be used to quantitatively evaluate the ecological characteristics of a system. This will help to further explore urban ecological sustainability in this article. In this study, four ecological riverbank reconstruction projects have been executed to restore the ecology along the banks of the Jinchuan River in Nanjing, China, which focus on the key river–lakeside and waterfront space in the main urban area. The LCA–emergy–carbon emission method was applied through a series of indicators, including emergy indexes and carbon emission indicators. It is important to distinguish prior research, and few have utilized this approach on urban waterways and waterscapes. The results illustrate that the reconstruction system has obvious improvement significance to the whole river ecology. This change can also be seen when using LCA–emergy analysis. In a 20-year cycle, the emergy of the material production stage and maintenance phase account for a major emergy share, followed by the construction stage, transportation process, and design process stage. The sustainability (ESI indicator) has been improved after carrying out the reconstruction projects. By choosing water and gravel as the primary material, the carbon emission can be reduced. The water treatment process accounts for the vast majority of carbon emissions. Secondly, gravel also plays an important role in carbon emission. Finally, an improved measure (clean energy reuse) was conducted to enhance the ecology of the reconstruction projects and obtained a significant ecological sustainability boost.

1. Introduction

1.1. Background

As the urban environment continues to deteriorate, achieving a sustainable urban environment has become a top priority for governments and urban managers [1,2]. With global environmental degradation accelerating and the urban heat island effect becoming more prevalent, it is essential to find ways to address and mitigate these issues [3,4]. Urban rivers and their surrounding ecological environment are integral parts of the urban environment and play a crucial role in the overall ecology of the city. The positive impact that water and greenery can have on the urban environment makes it imperative to conduct sustainability assessments of urban waterscape belt ecological reconstruction using the LCA–emergy–carbon emission methodology. This study aims to provide a meaningful reference for future urban planning and management by government and urban managers.

1.2. Literature Review

1.2.1. Emergy Method

Emergy was first introduced as an energy concept around 40 years ago and has been used to assess the sustainability of various systems [5]. This approach was initially used in agriculture and ecology to evaluate the sustainable state of agricultural and ecosystem systems [6,7], before expanding into other fields such as urban studies [8,9], industry [10,11], building systems [12,13], and economics [14]. Today, more and more cross-over studies are being conducted using the emergy approach, with a series of combinations involving GIS tools [15,16], carbon emission methods [17,18], ecological footprint assessments [19,20,21], life cycle assessments (LCA) [22,23], and other approaches.
Taking a green urban district as an example, Daniel et al. (2020) implemented a sustainability analysis based on emergy view [8]. By integrating the emergy method and ecological footprint approach, urban ecological security was assessed to explore the environmental state [9]. Industrial systems are also the focus of emergy evaluation, especially the whole-life-cycle approach framework [10]. Junxue et al. (2023) conducted an emergy analysis based on the point of view of raw material emergy and chemical composition for the building glass industry [11]. Some authors studied an emergy synthesis for a systemic evaluation of a major highway expansion [12]. Through the integration of the emergy perspective and the fuzzy multi-criteria method, a series of sustainable indexes were displayed for green building manufacturing [13]. Sustainability at the economic level is the focus of national attention, and some researchers have introduced emergy methods into the economic field to investigate sustainable hierarchy [14]. Xueqi et al. (2019) executed a study on the emergy-based thermodynamic geography of the Jing-Jin-Ji region with a lot of measured data [15]. To analyze the global ecosystem structure and productivity, the LCA–emergy method has been utilized for sustainability assessment [16]. From the view of ecology and a low-carbon perspective, a solar power plant was selected for sustainability analysis [17]. A sustainable living environment is the premise of healthy living, which has been investigated with the holistic environmental emergy evaluation of Chongming Eco-island in China [18]. Shanghai port logistics were chosen to evaluate the ecological sustainability in view of the emergy ecological footprint framework [19]. The marine ranching resources and environmental carrying capacity were considered through an ecological emergy footprint methodology [20]. A comparative sustainability investigation was conducted using ecological footprint sustainability and emergy analysis in Iran [21]. The sustainability evaluation of a residential building was carried out using the LCA–emergy approach [22]. To confirm the ecological level of typical agricultural products, the emergy–life cycle assessment framework was adopted to test the sustainability effect [23].

1.2.2. LCA–Emergy

Life cycle assessment (LCA) is an authoritative methodology that plays a critical role and is widely used in various systems, including building systems. Urban river ecological environment reconstruction belongs to the construction process, which can be classified as a building system. The LCA–emergy method has been applied to several studies, including the environmental sustainability assessment of highway engineering [12], residential building environment study [22], and building cement material system evaluation [23], among others.
Several scholars have applied the LCA method in the field of building systems. For instance, Vivian et al. (2022) collected a series of BIM and LCA studies to display the development trend of both, especially for the combination investigation [24]. Similarly, based on BIM and LCA, a prefabricated building was chosen and assessed to confirm its sustainability state [25]. The latest advances in both BIM and LCA studies were presented through a systematic review [26]. The life cycle assessment tool was used and tested for the final effect in early decision support design [27], while a comprehensive survey was conducted and presented through a summary of challenges and directions for future research in view of LCA in building systems [28]. Fatma and Brian (2022) studied the relationship between circular economy and the environment using the life cycle sustainability assessment [29]. To analyze the sustainability comparison of different renewal strategies in the building system, the LCA–emergy approach was selected and verified [30].
There are many ecological studies on urban waterways and waterscapes, but research using the LCA–emergy methodology in this area is relatively rare. This is one of the distinctive features of this study, which to some extent supplements current research on ecological assessments of urban river landscapes.

1.2.3. Carbon Emissions of Building Systems

The carbon emissions of building systems have drawn constant attention, especially with China’s goal to achieve carbon neutrality by 2060. Many scholars have explored ways to reduce carbon emissions in building systems to mitigate the impact of climate change. Shan et al. (2022) analyzed the challenges and opportunities for carbon neutrality in China’s building sector [31]. The integrated carbon dynamic emission framework was used to analyze carbon emissions in commercial buildings as an example [32], while low-carbon cities were investigated through a building-stock-level carbon emission model [33]. Public buildings are a type of mass building that needs to be focused on for regional inequality in carbon emission intensity [34]. Xiaoyan et al. (2022) selected the prefabricated building supply chain for low carbon model analysis [35], while a low-carbon residential building style was tried and verified by incorporating green space and water bodies in the design [36]. Korean scholars explored the possibility of carbon-neutral apartment building renovation with passive house-certified components [37,38], while relevant scholars in several countries such as China [39,40], Australia [41,42], the USA [43], and Iran [44] conducted in-depth research on building carbon emissions.

1.3. Motivations, Innovations, and Contributions

To date, no other researchers have studied the combination of LCA–emergy and LCA–carbon emission perspectives in construction projects. While the LCA–emergy method enables quantitative ecological investigation, it cannot analyze the state in terms of carbon view. By adding the new perspective of LCA–carbon emission, the LCA–emergy–carbon emission framework can be established to cover ecological and low-carbon research for building construction projects.
In this paper, a representative reconstruction project along the urban waterscape belt was selected, and its ecological degree and carbon emission state were analyzed and displayed using the LCA–emergy–carbon emission methodology. This analysis could provide a valuable reference for designers and managers.

2. Material and Methods

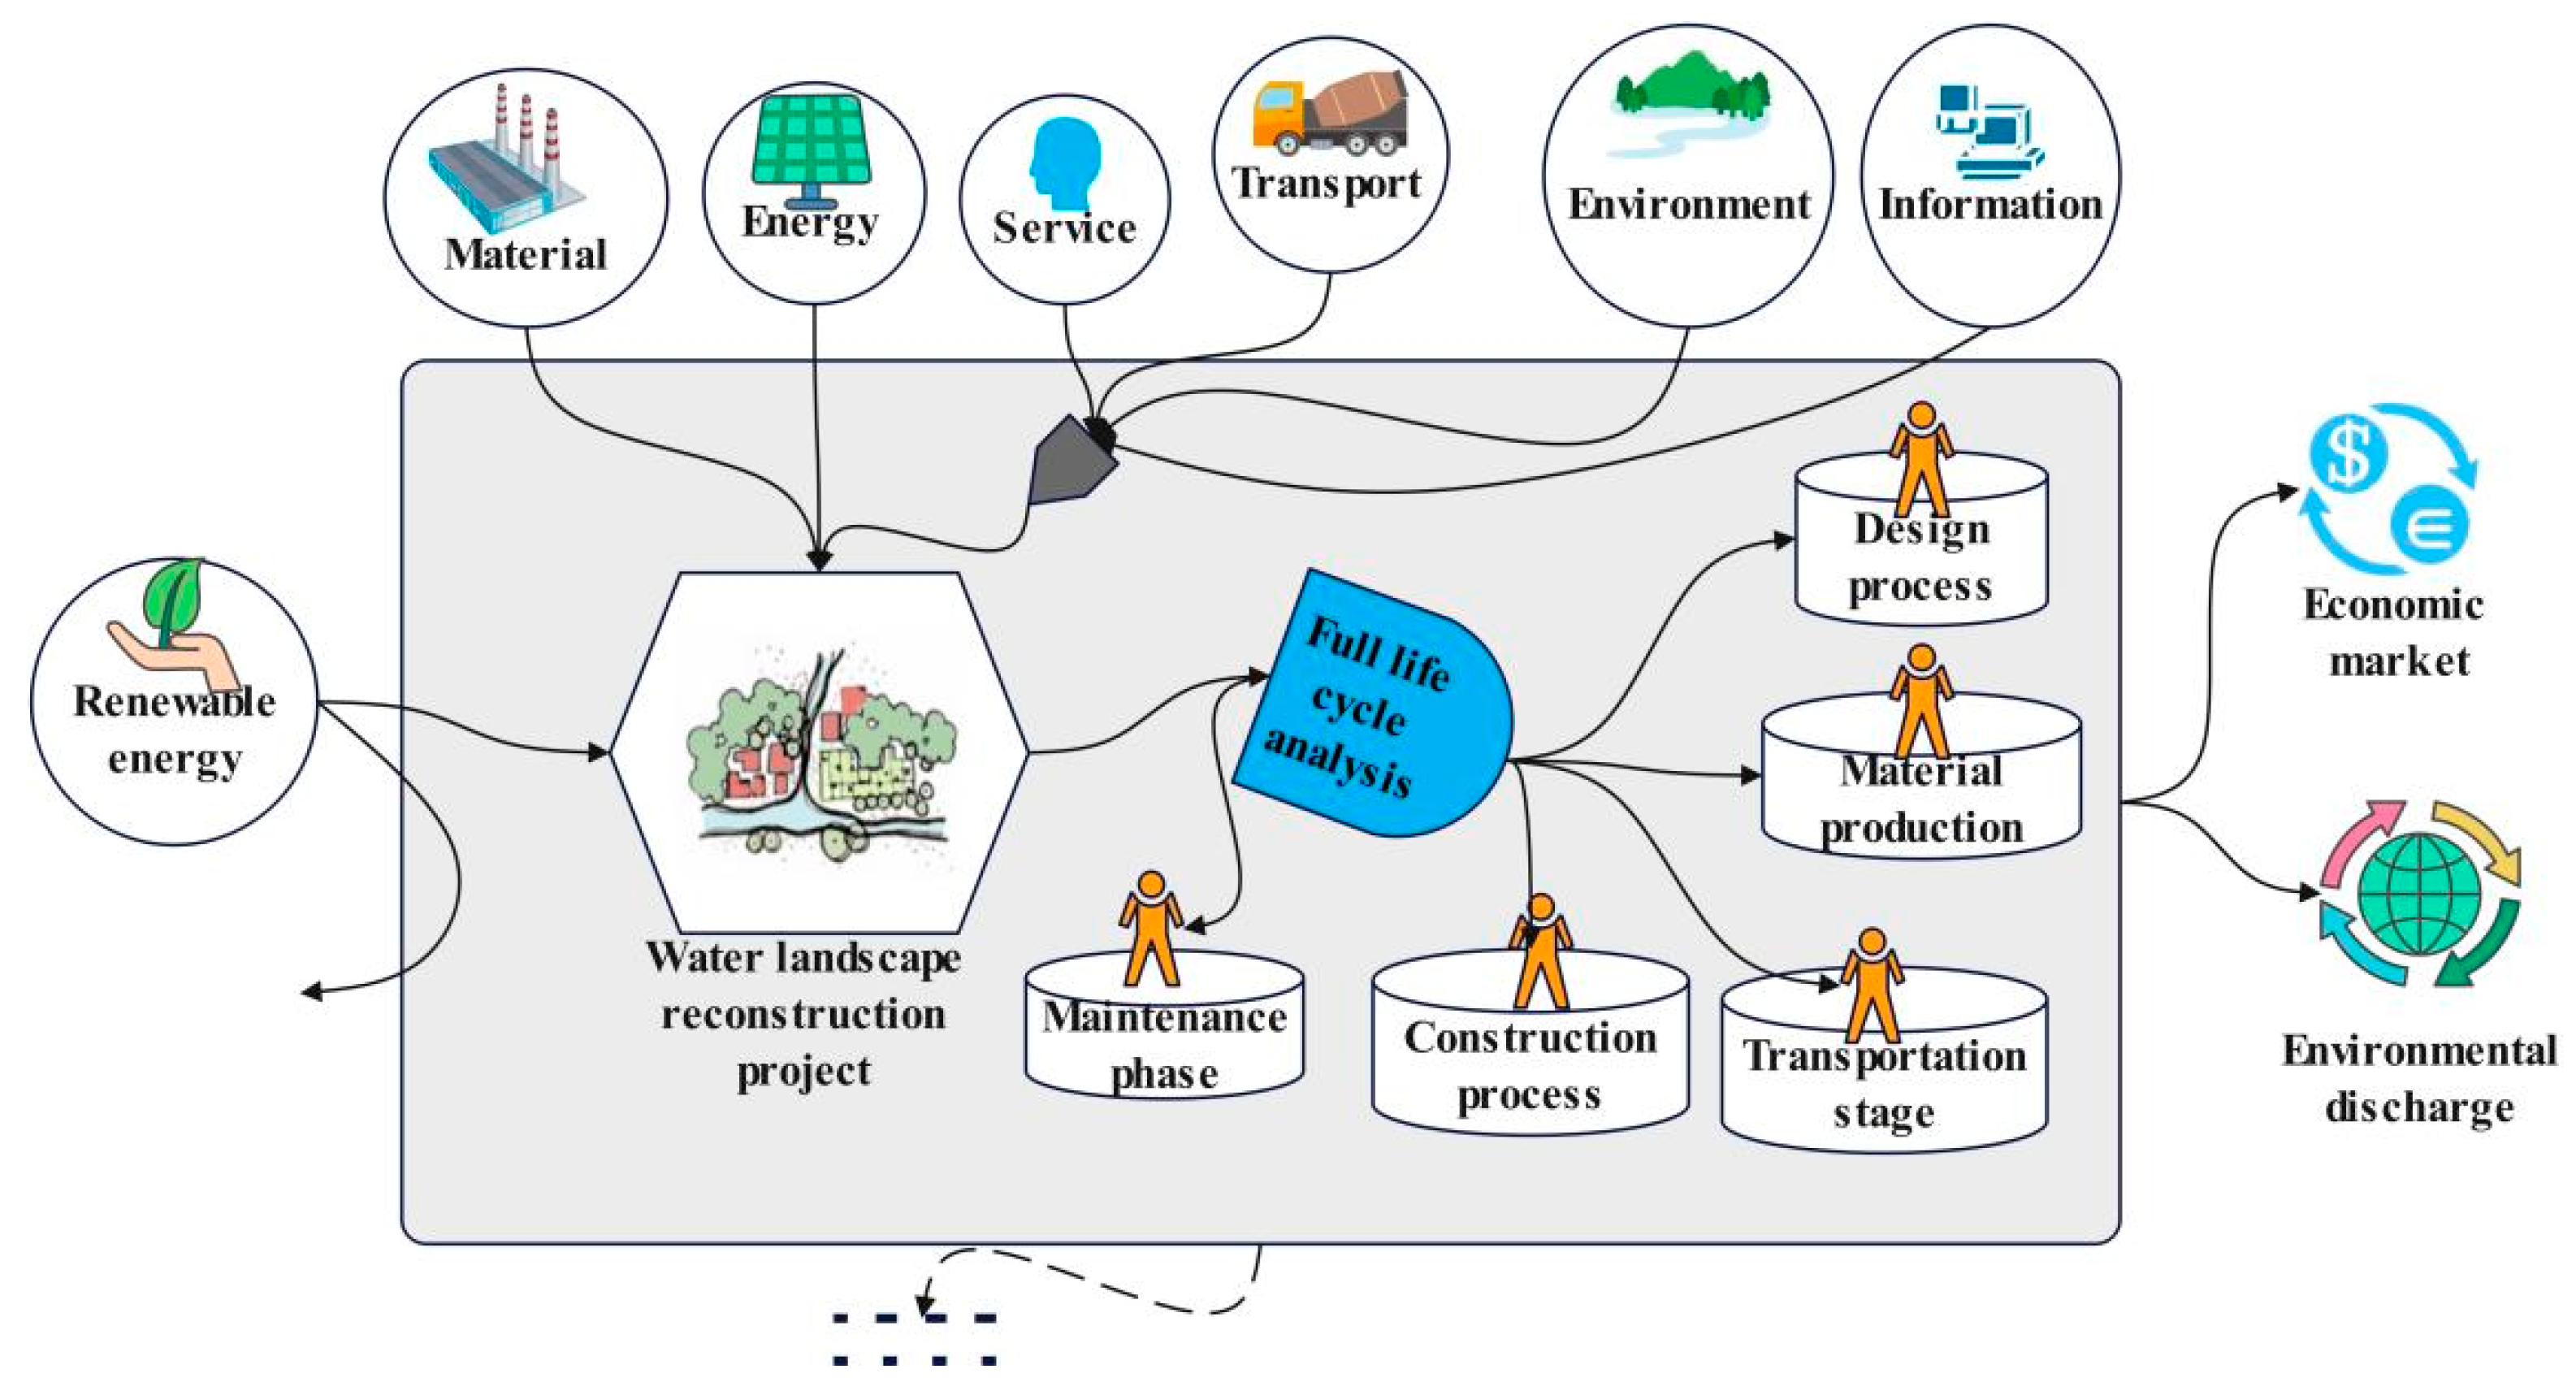
2.1. Research Framework

To verify the sustainability effect of the urban waterscape renovation project, a comprehensive research framework needs to be considered and utilized. In this context, a composite framework was designed based on the ecological emergy perspective and carbon emission view to investigate the sustainability of the entire water landscape renovation project. The framework is displayed in Figure 1. To address the two questions (on the left side of Figure 1), the logic process path was arranged from left to right, which includes project process, analysis view, and sustainable indicators. Thus, the basic framework is shown to explore the sustainability level of the urban waterscape reconstruction project.

2.2. LCA–Emergy Model

2.2.1. Emergy Introduction

Emergy is an ecological concept that was proposed by H. T. Odum, a professor at the University of Florida, in the 1980s [5]. Its purpose is to evaluate the sustainability of a target system using solar emjoules (sej) as the unit. Since then, this theory has been widely used in various fields, including ecological systems, urban studies, agriculture, and industrial processes. The main advantage of emergy analysis is that it can integrate the concepts of different physical dimensions for unified comparisons, such as matter flow, energy flow, and information flow. Its calculation can be realized based on basic data and unit emergy values (UEVs). The UEVs consist of three types, which are sej/kg, sej/j, and sej/USD [44].

2.2.2. LCA–Emergy

By integrating the emergy perspective into the LCA process of the urban waterscape reconstruction project, an LCA–emergy approach was proposed based on five stages of emergy coupling, including the design stage, material production stage, material transportation stage, construction stage, and maintenance stage. This approach enables a detailed ecological assessment of the entire renovation project to check its sustainable effect.
In this study, a series of emergy indicators were adopted to assess the project system, which can be divided into two parts. On the one hand, basic indexes were used to adjust the hierarchy of renewable rate and non-renewable ratio. On the other hand, higher level indicators were designed to evaluate the sustainability state in terms of environmental load rate, emergy yield rate, and environmental sustainability parameters [45].
To conduct the emergy calculation and analysis, the latest emergy calculation criteria were applied in this study [46].

2.2.3. Emergy Diagram

To analyze the urban waterscape belt project as a case study, four sections should be focused on in Figure 2. On the left, renewable energy is involved, which has two parts, and most of it goes into the system for evaluation. At the top of the figure, six types of inputs are listed, including materials, energy, services, transportation, environment, and information, which will support the completion of the entire waterscape reconstruction system.
Within the framework of the evaluation system, five stages have been selected as the core sections for the full life cycle analysis. Finally, the waterscape restoration system will have economic benefits and environmental impacts on external systems.

2.2.4. Emergy Indicators

The sustainability hierarchy can be realized based on a set of emergy indicators. In this study, there are four critical indexes (ELR, EYR, ESI and UEVs) that have been displayed in Table 1.
(1)
Environmental loading ratio (EIR)
EIR expresses the relationship between negative elements and the environment for the target system. It can be calculated through Equation (1). The ELR standard is divided into three levels, which are low level ( E L R < 2 ), moderate intensity ( 3 < E L R < 10 ), and high level ( E L R > 10 ).
E L R = ( E p + E a ) E t o t a l
where E p is the non-renewable resource emergy, E a is the non-renewable energy emergy, and E t o t a l is the entire emergy of the target system.
(2)
Emergy yield ratio (EYR)
EYR reveals the impact of the external system, which can be calculated by Equation (2). It explains how dependent the waterscape reconstruction project system is on the outside world. The larger the value, the closer the relationship.
E Y R = E m E t o t a l
where E m is the external emergy input, and E t o t a l is the holistic emergy for the waterscape reconstruction project system.
(3)
Emergy sustainability indicator (ESI)
ESI is a comprehensive index that can be obtained based on the EYR and ELR (Equation (3)), which illustrates the final sustainable state for the waterscape reconstruction project system. Generally speaking, it can be divided into three sustainability degrees, which are ESI < 1 (low level), 1 < ESI < 5 (medium level), and ESI > 5 (high sustainability).
E S I = E Y R E L R
(4)
Unit emergy values (UEVs)
U E V s = E t E t o t a l i n p u t
UEVs represent the unit emergy amount, including unit mass (sej/kg), unit energy (sej/j), unit labor service (sej/USD), etc. It reveals the conversion efficiency and hierarchy of the target system.

2.2.5. Sensitivity Analysis

Because this study involves a lot of data analysis, sensitivity analysis needs to be conducted to confirm and guarantee the study’s accuracy. In this study, four types of assumptions are implemented to explore the uncertainty analysis of the whole system [22]:
(1)
Hypothesis model A: 10% of the underlying data will be adjusted, and then the changes in three key indicators (ELR/EYR/ESI) will be checked.
(2)
Hypothesis model B: 8% of the basic indicators for data adjustment, to verify the floating of three critical indicators (ELR/EYR/ESI).
(3)
Hypothesis model C: the basic data will be considered with a 5% float. After calculation, the floating range of the index group will be verified.
(4)
Hypothesis model D: a smaller data float (3%) will be performed, and sensitivity analysis will show the sensitivity precision on the basis of a diminutive range variation.

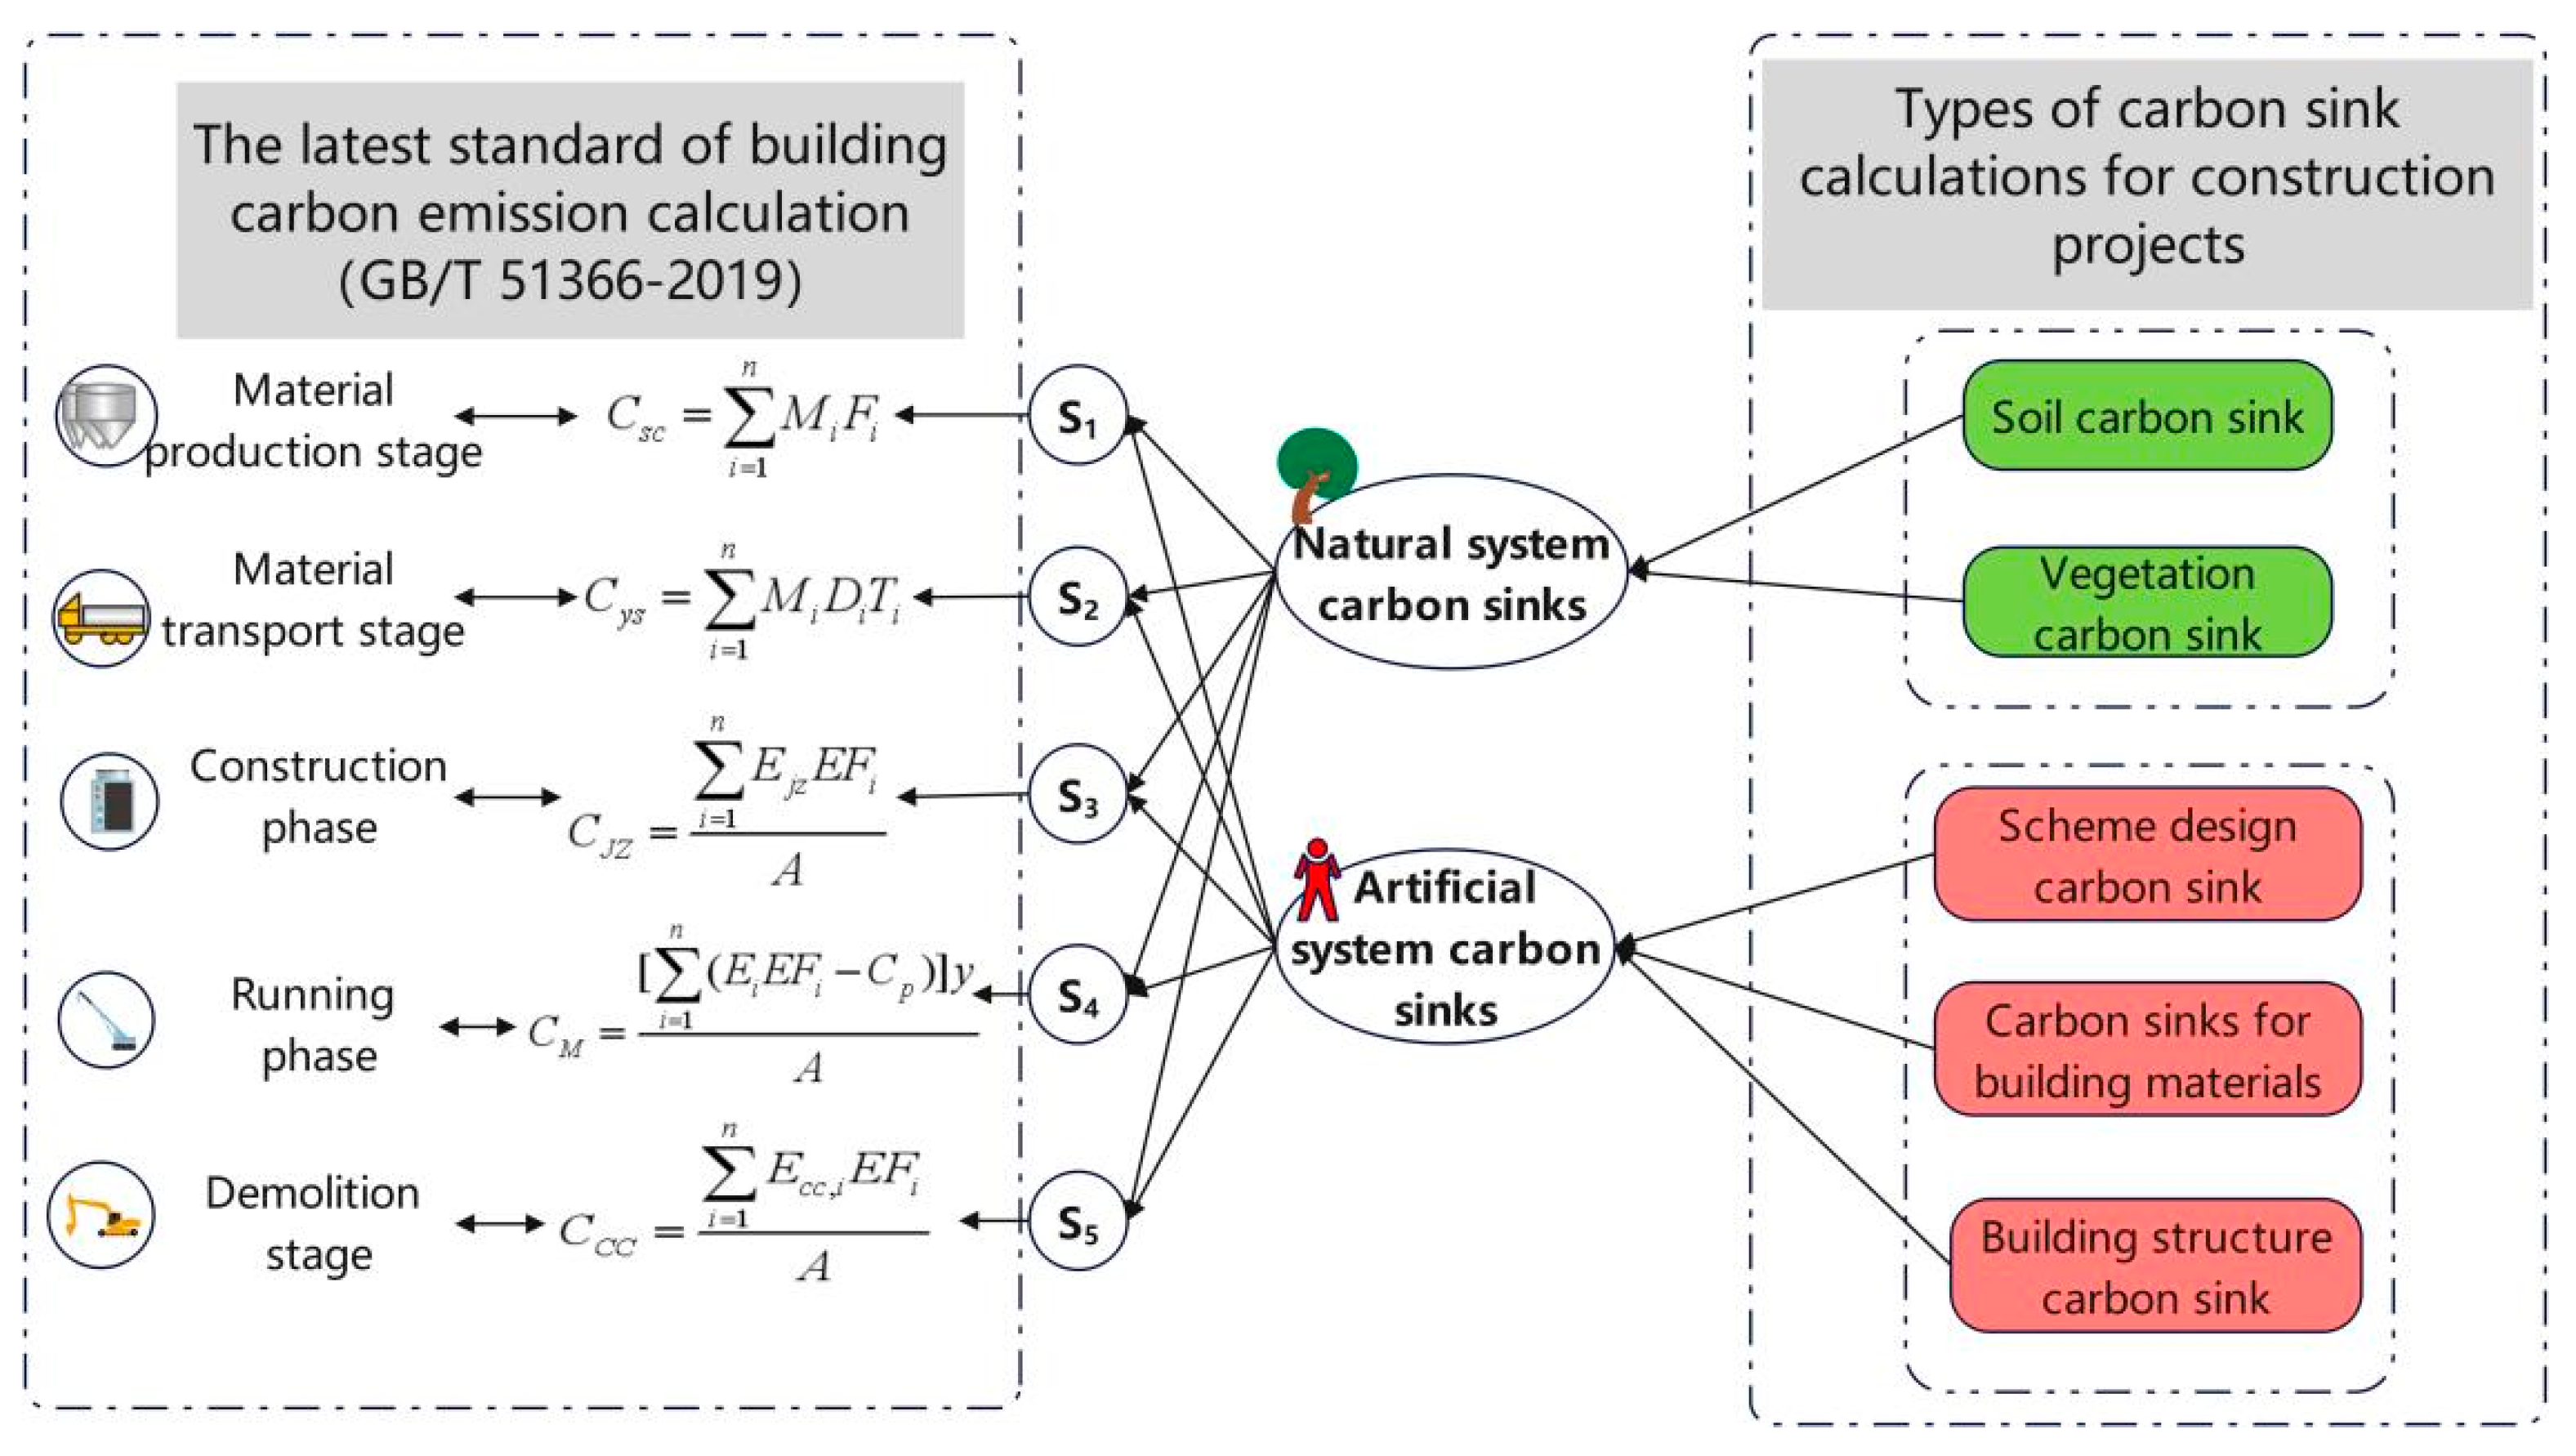
2.3. LCA–Carbon Calculation Model

According to the latest standard of building project carbon emission calculation, a reconstruction project can be assessed quantitatively. In this study, the carbon sink was also considered (the right side of Figure 3). Depending on the exact path of the carbon sink, it was divided into two paths, which are the natural system carbon sink and the artificial system carbon sink.
(1)
Natural carbon sink system implementation path
  • Soil type method calculation model
    Average organic carbon in each area unit:
    T j d = i = 1 k ρ i P i D i ( 1 S i )
    where ρ i is soil weight; P i is the average organic carbon storage; D i is soil thickness; and S i is the average gravel content.
    Total soil organic carbon of regional area:
    M d = j = 1 k A j T j d
    where A j is the area of a grid cell, T j d is the unit mean organic carbon density, and n is the total soil area grid units.
  • Life zone method computational model
    Relationship between the density and depth of soil organic carbon:
    B D = b 0 + b 1 D + b 2 lg C f
    where B D is soil weight; b1, b2, b3 are constants of soil weight and carbon density under different vegetation types; D is the depth from the surface to the center of the soil layer; and Cf is the organic carbon mass fraction.
    The average carbon density of layers per unit area:
    C = C f + B D ( 1 δ 2 m m ) V
    where δ 2 m m is the gravel fraction; V is soil layer volume.
  • Estimation model of remote sensing technology method
    The total amount of carbon in all types of soil:
    C i = 0.58 S i ( H j Q j W j )
    where i is soil type; C i is soil organic carbon storage (t); 0.58 is the carbon storage conversion factor; S i is soil area; H j is mean soil thickness; Q j is average mass fraction of soil organic matter; and W j is average soil weight.
(2)
Artificial carbon sink system implementation path
Building materials with carbon adsorption are mainly concentrated in concrete materials, mortar, and non-metallic oxides, among which concrete materials are the main channel of carbon sinks. The carbonization process involves temperature, humidity, exposure conditions, porosity, water–cement ratio, strength grade, ambient CO2 concentration, surface coatings, and other complex factors.
  • Classical concrete carbonation theory estimation model
d = 2 D C O 2 C 0 m 0 × t
where d is the concrete carbonation depth; D C O 2 is the effective diffusion coefficient of carbon dioxide in concrete; C 0 is the concentration of the concrete surface; m 0 is carbon dioxide absorption per unit volume of concrete; and t is the carbonization time.
  • Molecular level carbonization theory estimation model
d = 2 D C O 2 [ C O 2 ] 0 [ C a ( O H ) 2 ] 0 + 3 [ C S H ] 0 + 3 [ C 3 S ] 0 + 2 [ C 2 S ] 0 × t
where [ C a ( O H ) 2 ] 0 [ C S H ] 0 [ C 3 S ] 0 [ C 2 S ] 0 is the initial concentration of each carbide-able substance; D C O 2 is the effective diffusion coefficient of carbon dioxide in concrete; and [ C O 2 ] 0 is the concentration of carbon dioxide on the concrete surface.
  • Carbonization estimation model based on water–cement ratio
The water–cement ratio is greater than 0.6,
d = r c × r a × r s × W / C 0.25 0.3 × ( 1.15 + 3 W / C ) × t
The water–cement ratio is less than 0.6,
d = r c × r a × r s × 4.6 W / C 1.76 7.2 × t
where W / C is the water–cement ratio; r c is the influence coefficient of cement variety; r a is the aggregate variety influence coefficient; and r s is the influence coefficient of concrete admixture.
  • Carbonation estimation model based on compressive strength of concrete
d = k 1 × k 2 × k 3 × [ 24.48 f 2.74 ] × t
where f is the standard compressive strength of concrete; k1 is the regional influence coefficient; k2 is indoor and outdoor influence coefficient; and k3 is the curing time coefficient of concrete.
  • Carbonization estimation model based on different material correction coefficients
d = K W × K C × K g × K F A × K b × K t × α × t
where α is the coefficient of concrete carbonation velocity; K W , K C , K g , K F A , K b , and K t are the influence coefficients of water–cement ratio, cement dosage, aggregate type, fly-ash-to-cement content ratio, curing method, and cement variety, respectively; and t is the carbonization time.
  • Carbonization estimation model for diffusion theory
d = 839 ( 1 R H ) 1.1 × W / C 0.34 C × V 0 × t
where RH is ambient relative humidity; W / C is water–cement ratio; C is cement dosage; and V 0 is the volume fraction of carbon dioxide.
Note: Equations (5)–(16) are referred to in [47].

3. Case Study

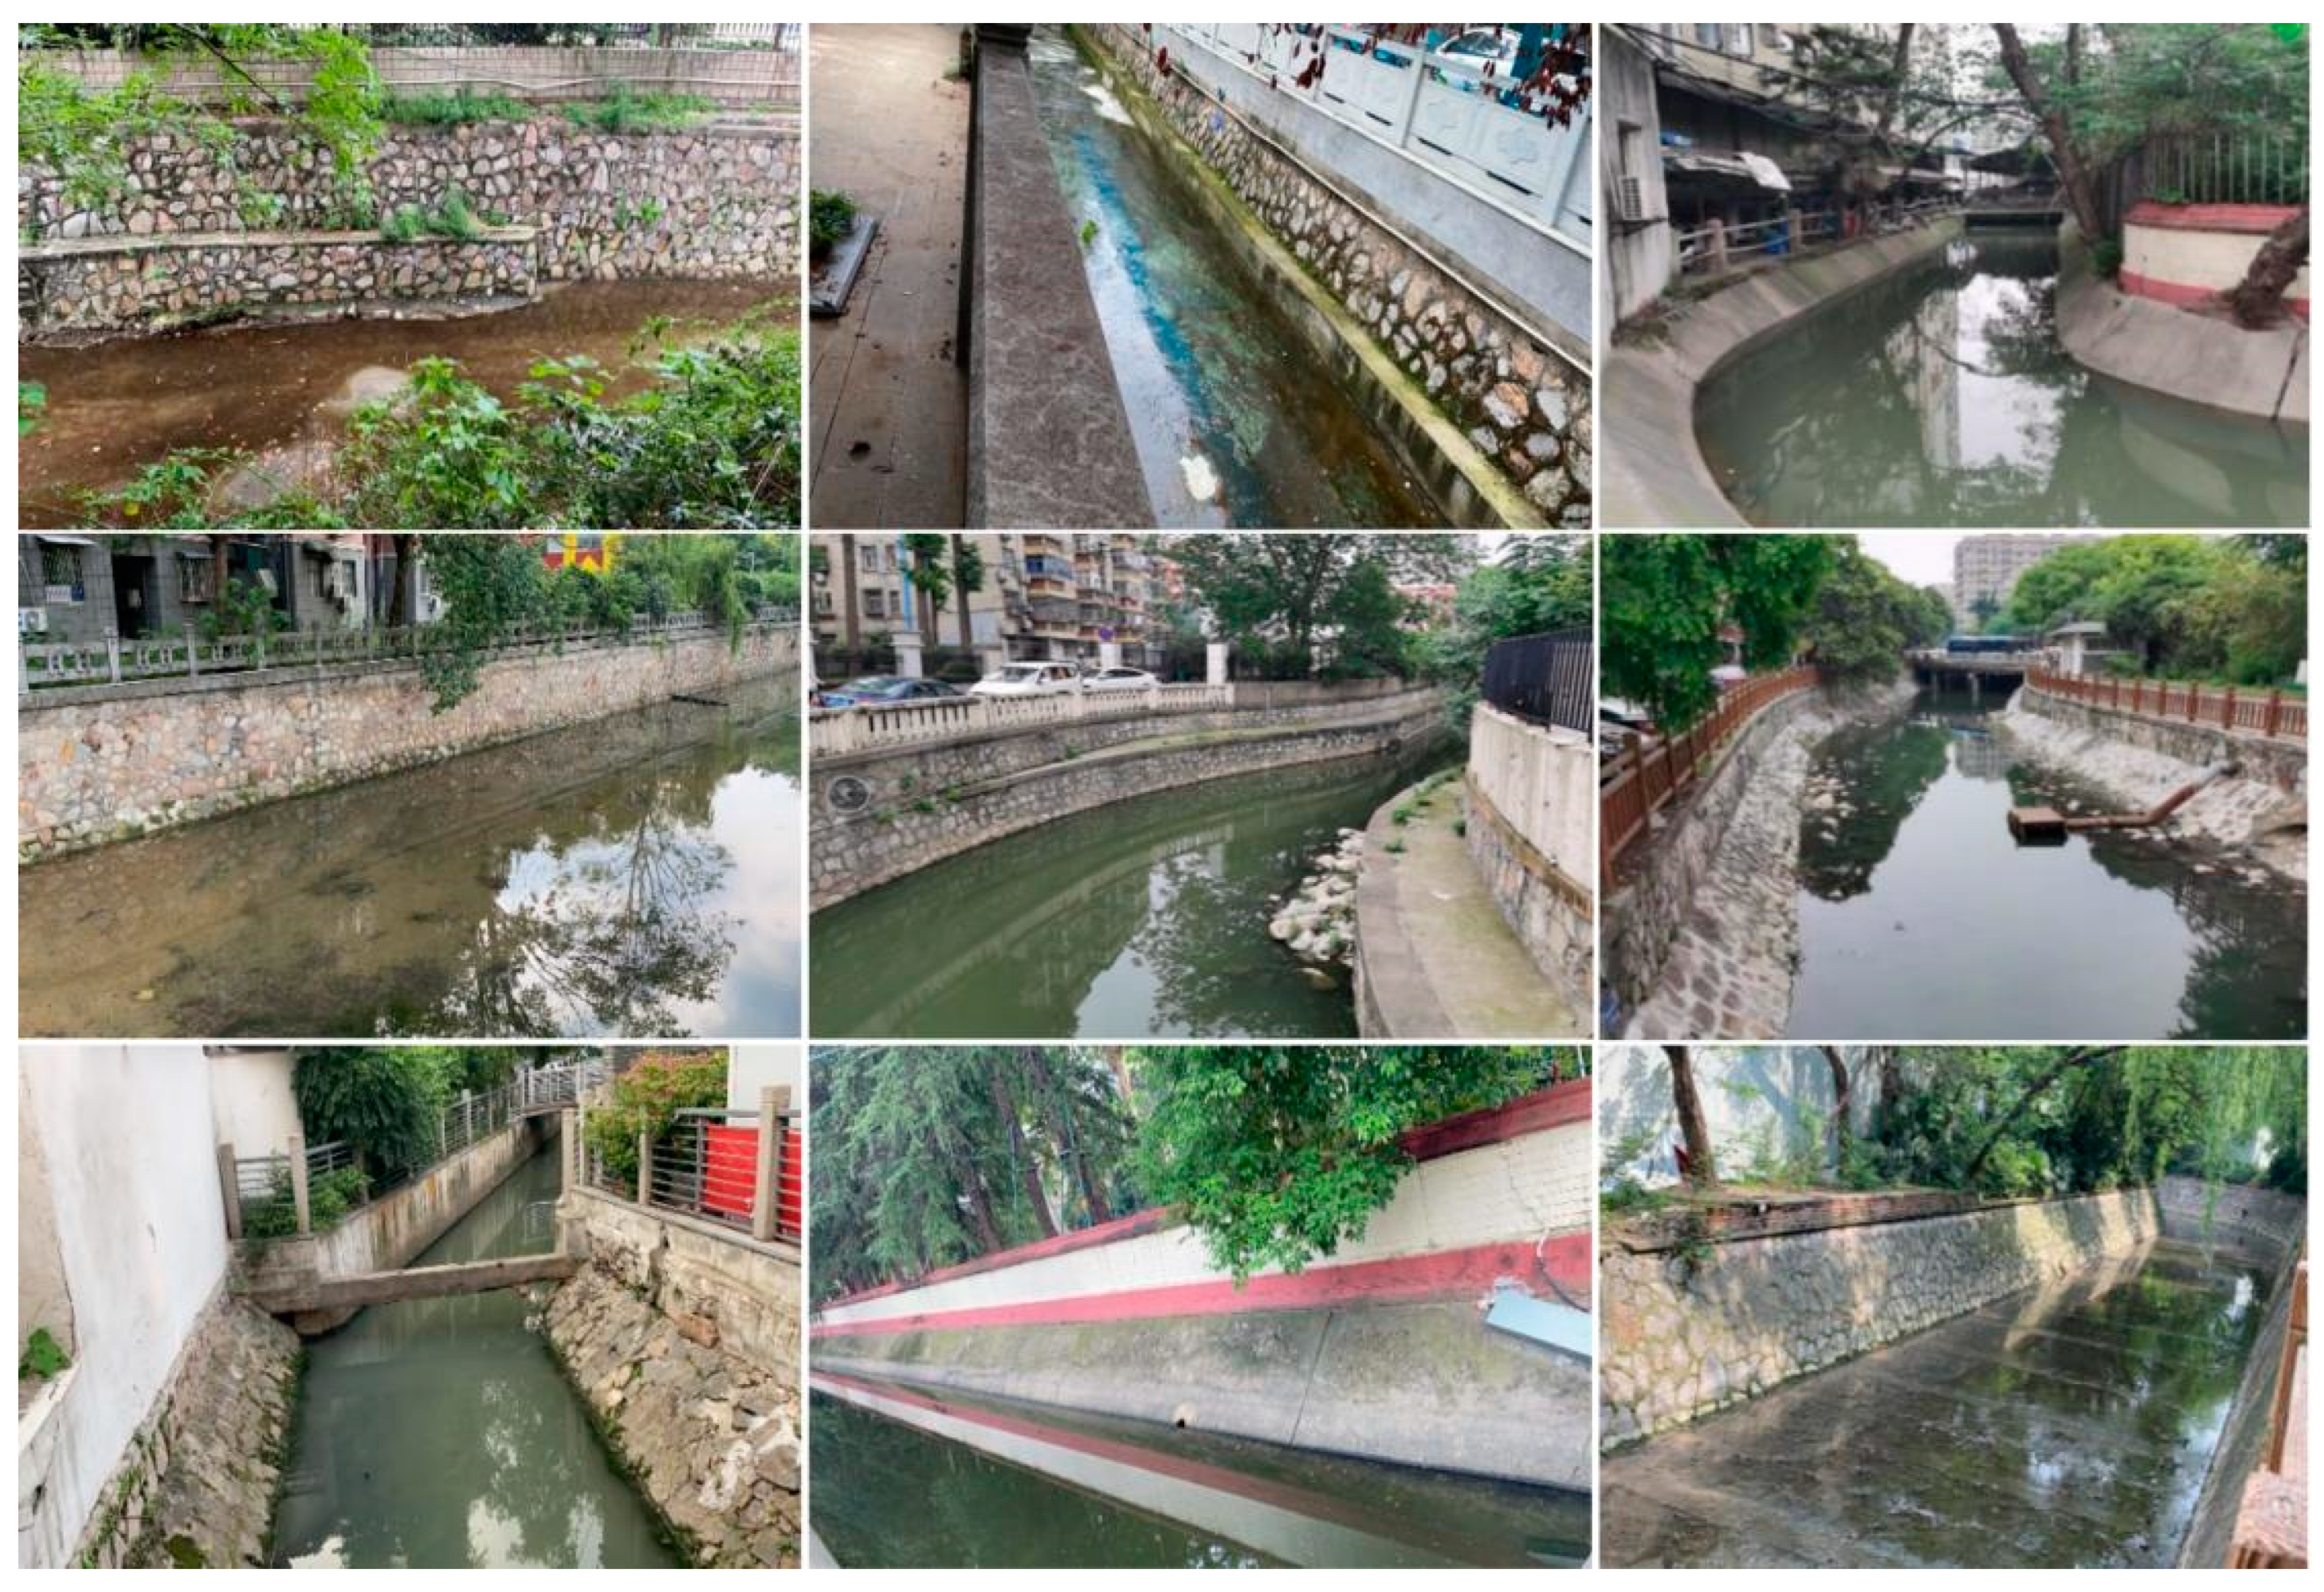
3.1. Case Introduction

The study area is located in the Jinchuan River (main river) basin in Nanjing. The total length of waterfront roads in the Jinchuan River basin, including Xuanwu Lake, is 48.85 km, and the current penetration rate is 54.14%. Most of the waterways in the Jinchuan River system have been restored to a waterfront recreational green belt with a width of about 2–10 m, but there are many breaks in the trails and poor accessibility. The present situation of the riverfront green buffer zone is quite different, as some river sections have narrow landscape spaces, and the waterfront buffer zone is missing. Most river plants lack species diversity and are single in planting form, resulting in linear and monotonous river landscapes that lack ecological characteristics.
Currently, there is a major problem concerning the ecology on both sides of the river which needs to be addressed (Figure 4 and Table 2).
The current hard bank protection structure used for most of the protection constructions results in isolated water and land ecosystems. Fish, amphibians, aquatic insects, and other aquatic animals have lost their habitats for reproduction and refuge, while various aquatic plants have lost their natural growth space. The river water ecosystem structure has been destroyed, resulting in the river gradually losing its ability to self-purify and conserve aquatic biodiversity, among other ecological functions.
In Figure 5, several strategies and projects have been designed to promote ecological sustainability in the urban waterscape reconstruction project. For example, stepped levees are being constructed in reconstruction project 1, while coupled small ecological banks are being considered to reduce carbon emissions across the river in project 2. A green walking path is arranged near the river bank to enhance interaction between residents and the river environment in project 3. Comprehensive riverbank types are also being implemented to improve the overall environmental sustainability while enhancing ornamental value in project 3.
The reconstruction process focuses on the key river–lakeside and waterfront spaces in the main urban area. Through spatial investigation, big data analysis, connectivity and ecological analysis of the waterfront, a multi-dimensional evaluation of spatial development and construction, ecological environment, transportation accessibility, waterfront facilities, spatial vitality, and other aspects of the waterfront is conducted. Based on this, objectives and strategies for the connectivity and ecological transformation of the waterfront are proposed for planning research, followed by the proposal of different regional construction schemes according to local conditions.

3.2. Data Collection

To assess the ecological reconstruction project, a range of data needs to be collected. In this study, most of the data were collected through the documents of the construction enterprise, especially the construction list, including the material list, energy list, manual service list, etc. Site material data were obtained from the local government department, and all site images were collected from on-site surveys.

4. Results and Discussion

4.1. LCA–Emergy Analysis

This section considers and analyzes two aspects, including LCA–emergy discussion and LCA–carbon emission analysis. Based on these two perspectives, the ecological assessment and carbon emission effect evaluation are shown for the reconstruction project, which has positive implications for sustainability improvement.

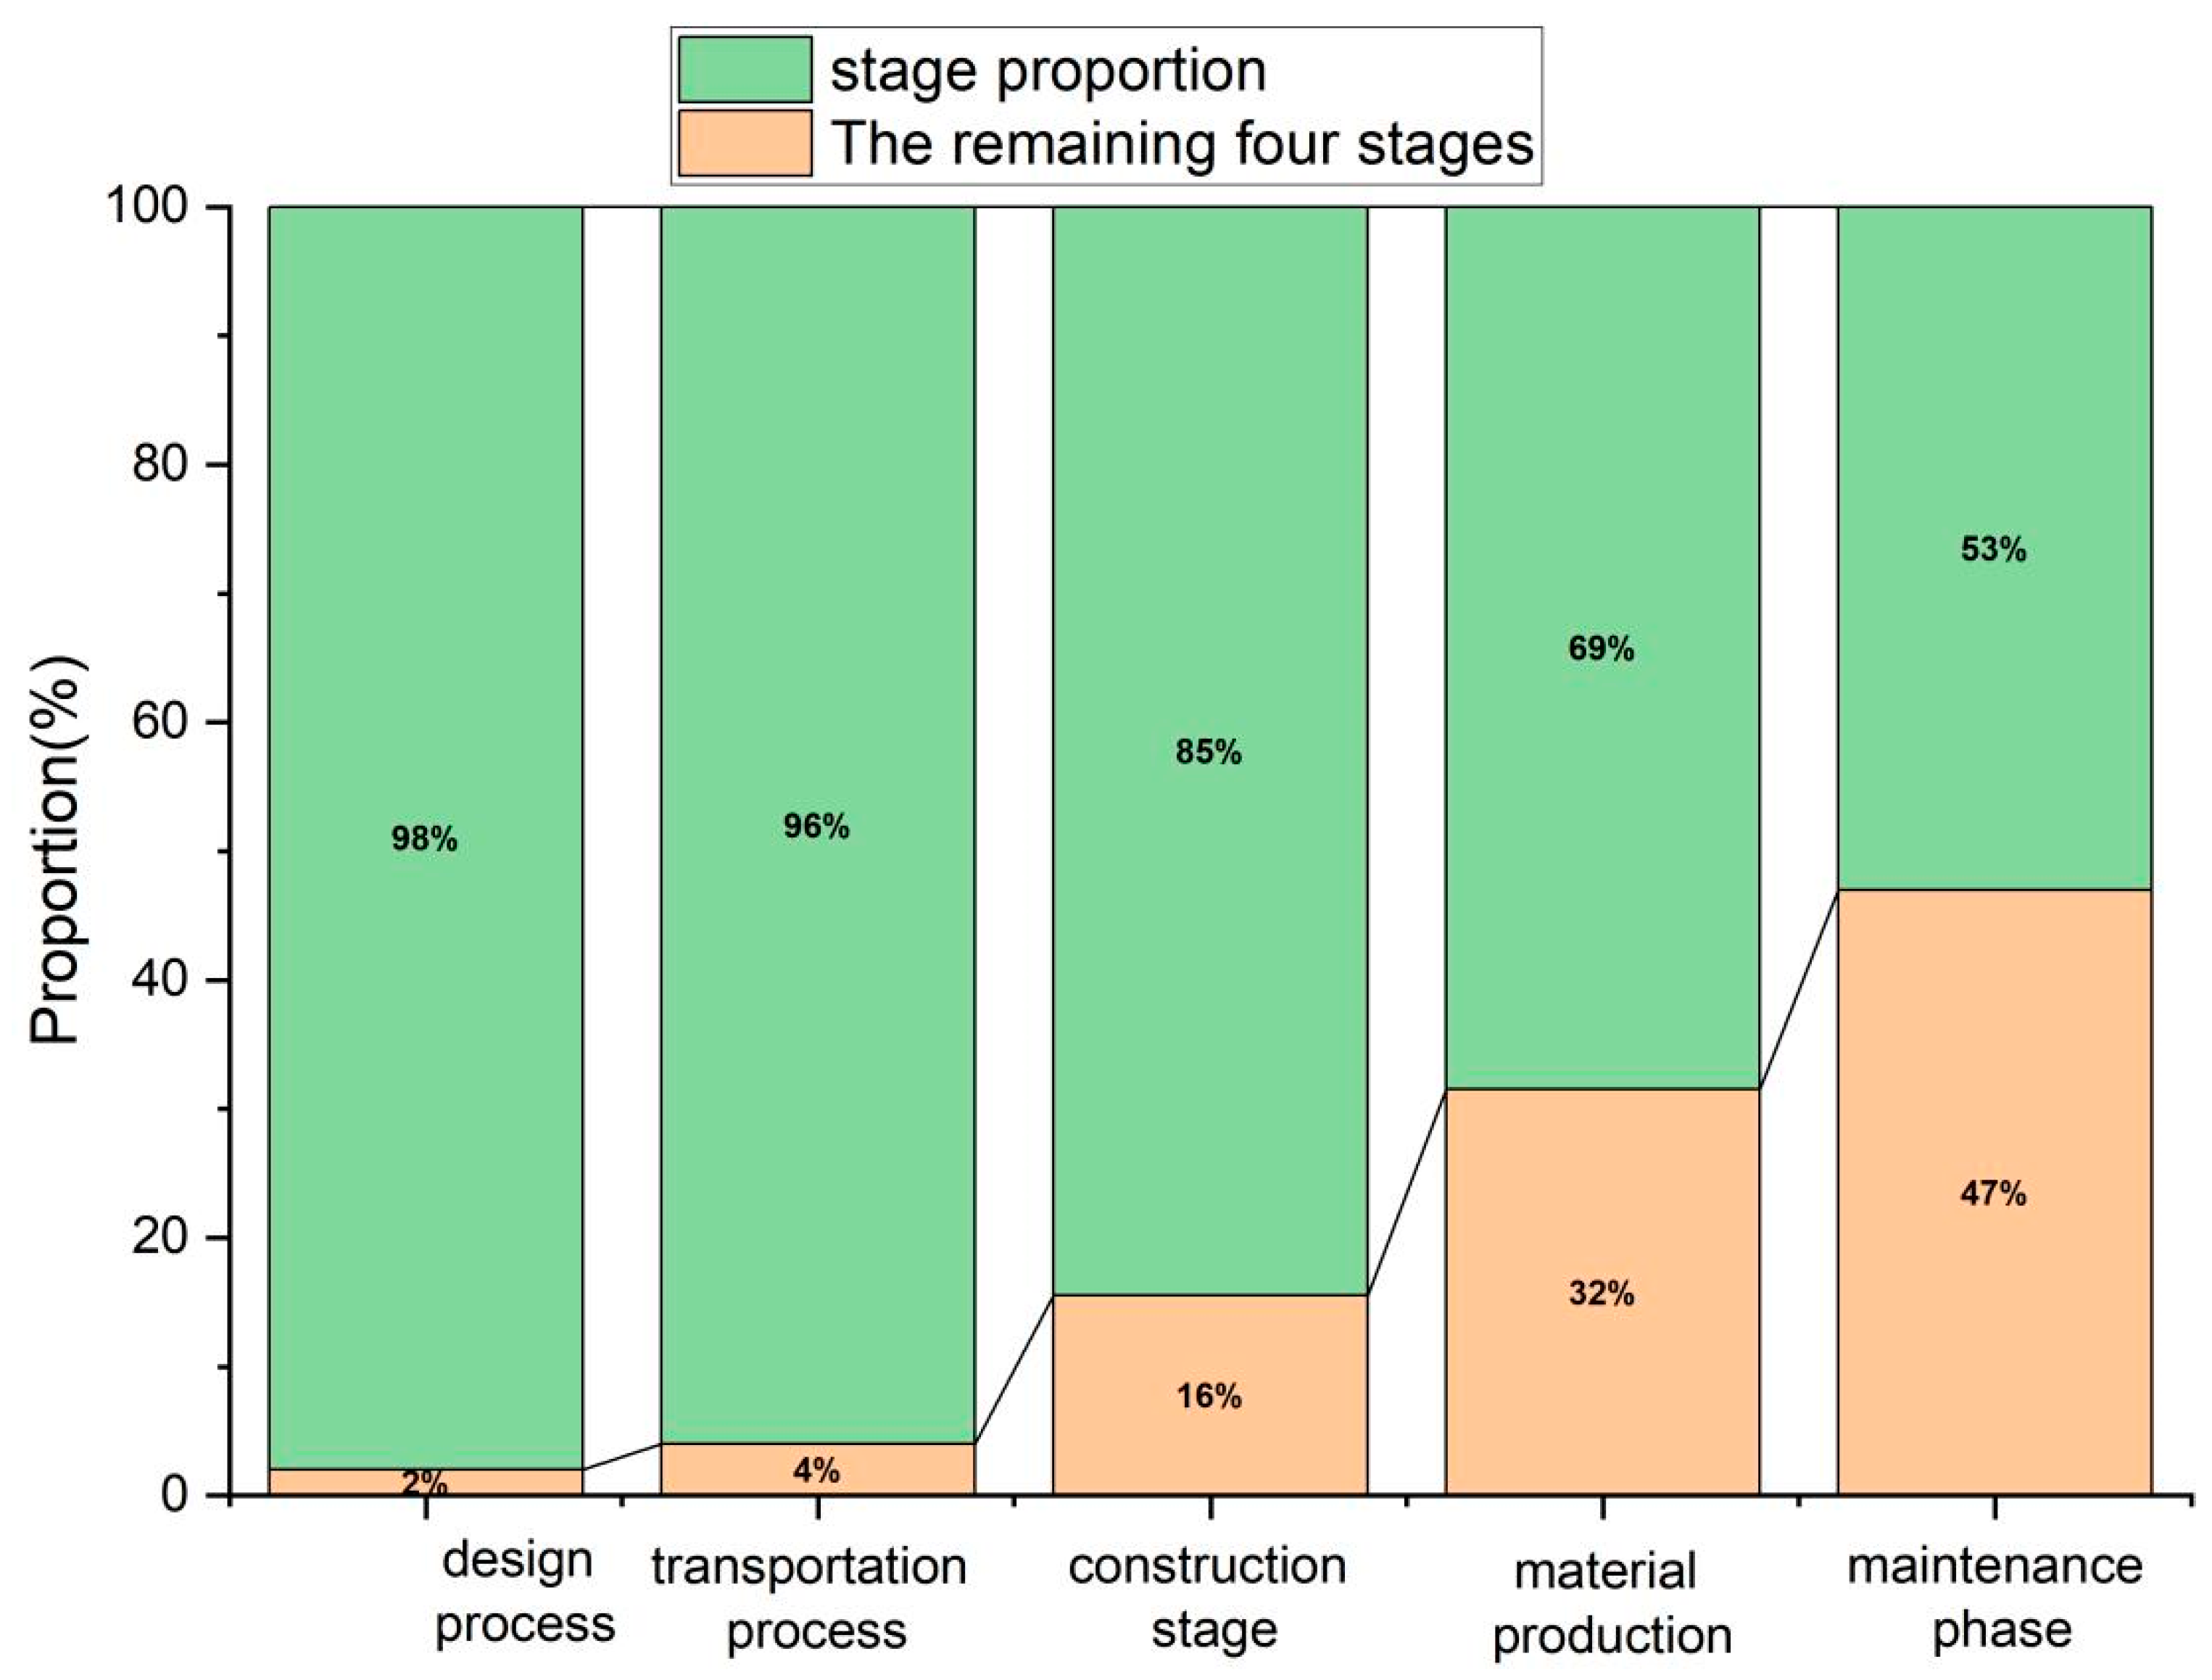
4.1.1. Dominated Contributor

In this study, for reconstruction project 1, five stages were selected and analyzed, including the design process, material production, transportation process, construction stage, and maintenance phase. According to the final calculation, in a 20-year cycle, the emergy of the material production stage and maintenance phase accounted for 78.5% of the entire emergy, followed by the construction stage, transportation process, and design process stage. The comparative analysis diagram identifies the major contributors. In Figure 6, it is clear that the emergy of the material production stage and maintenance phase plays the primary role in the overall reconstruction project.

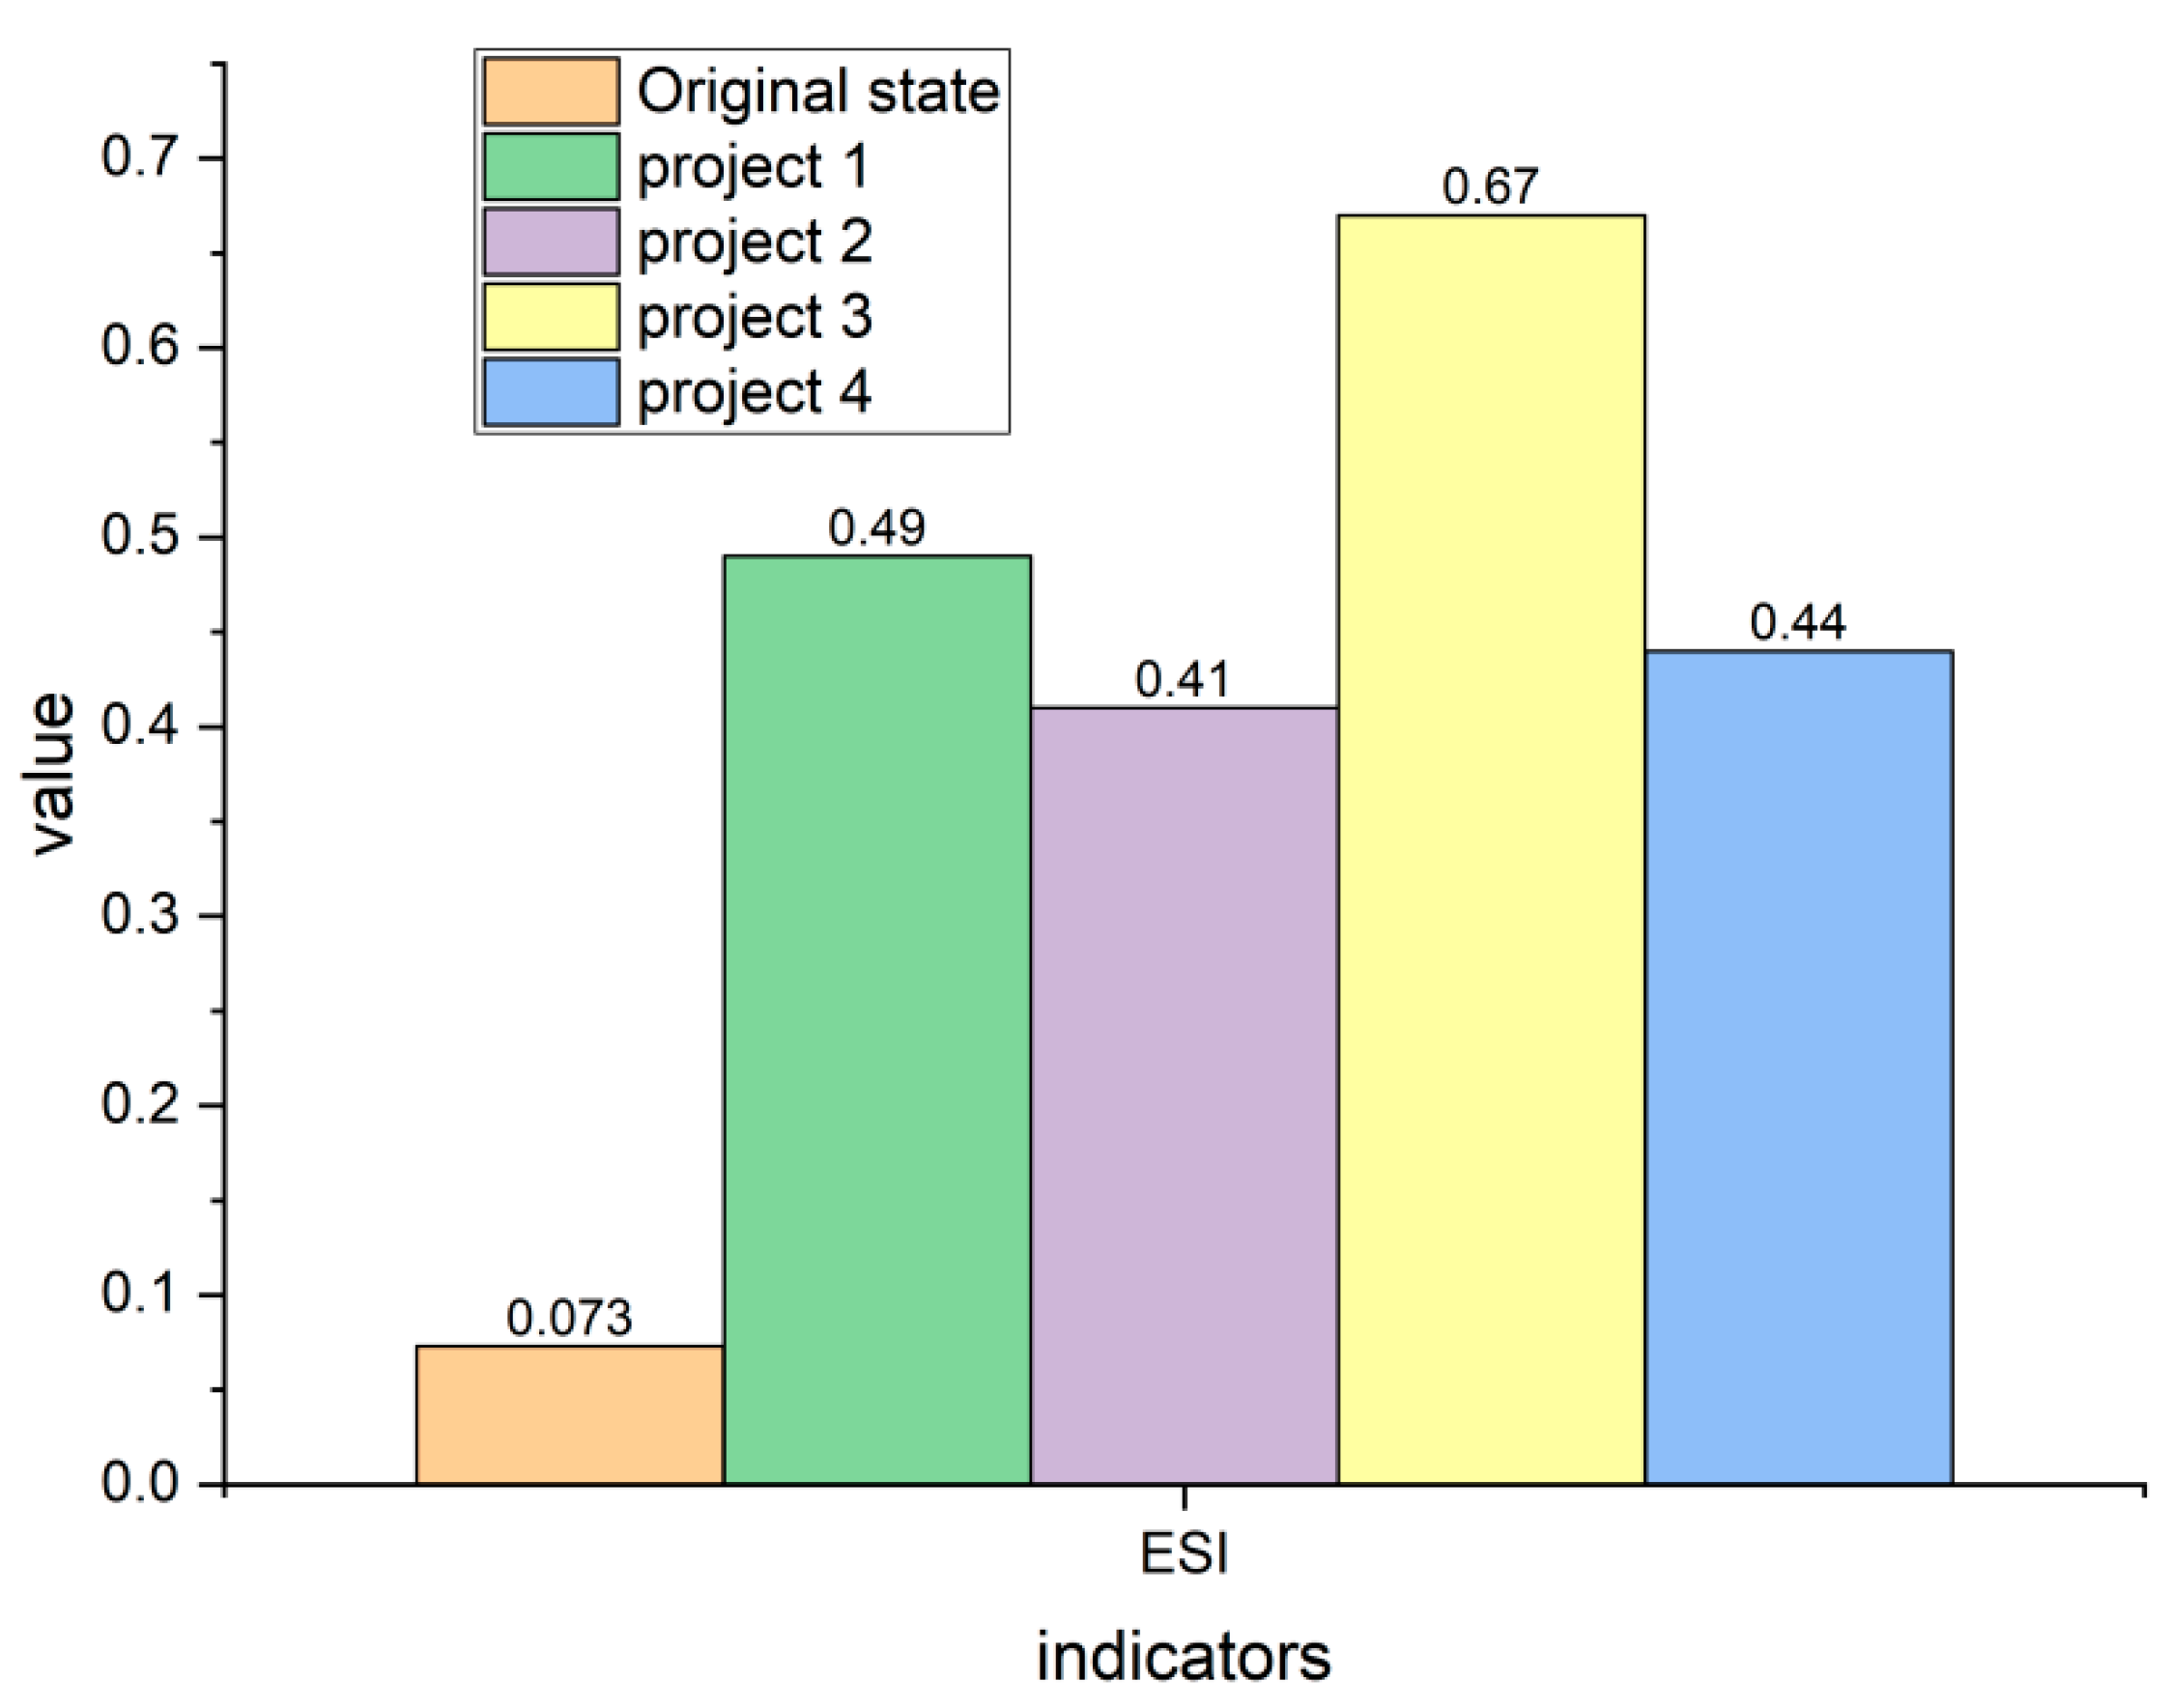
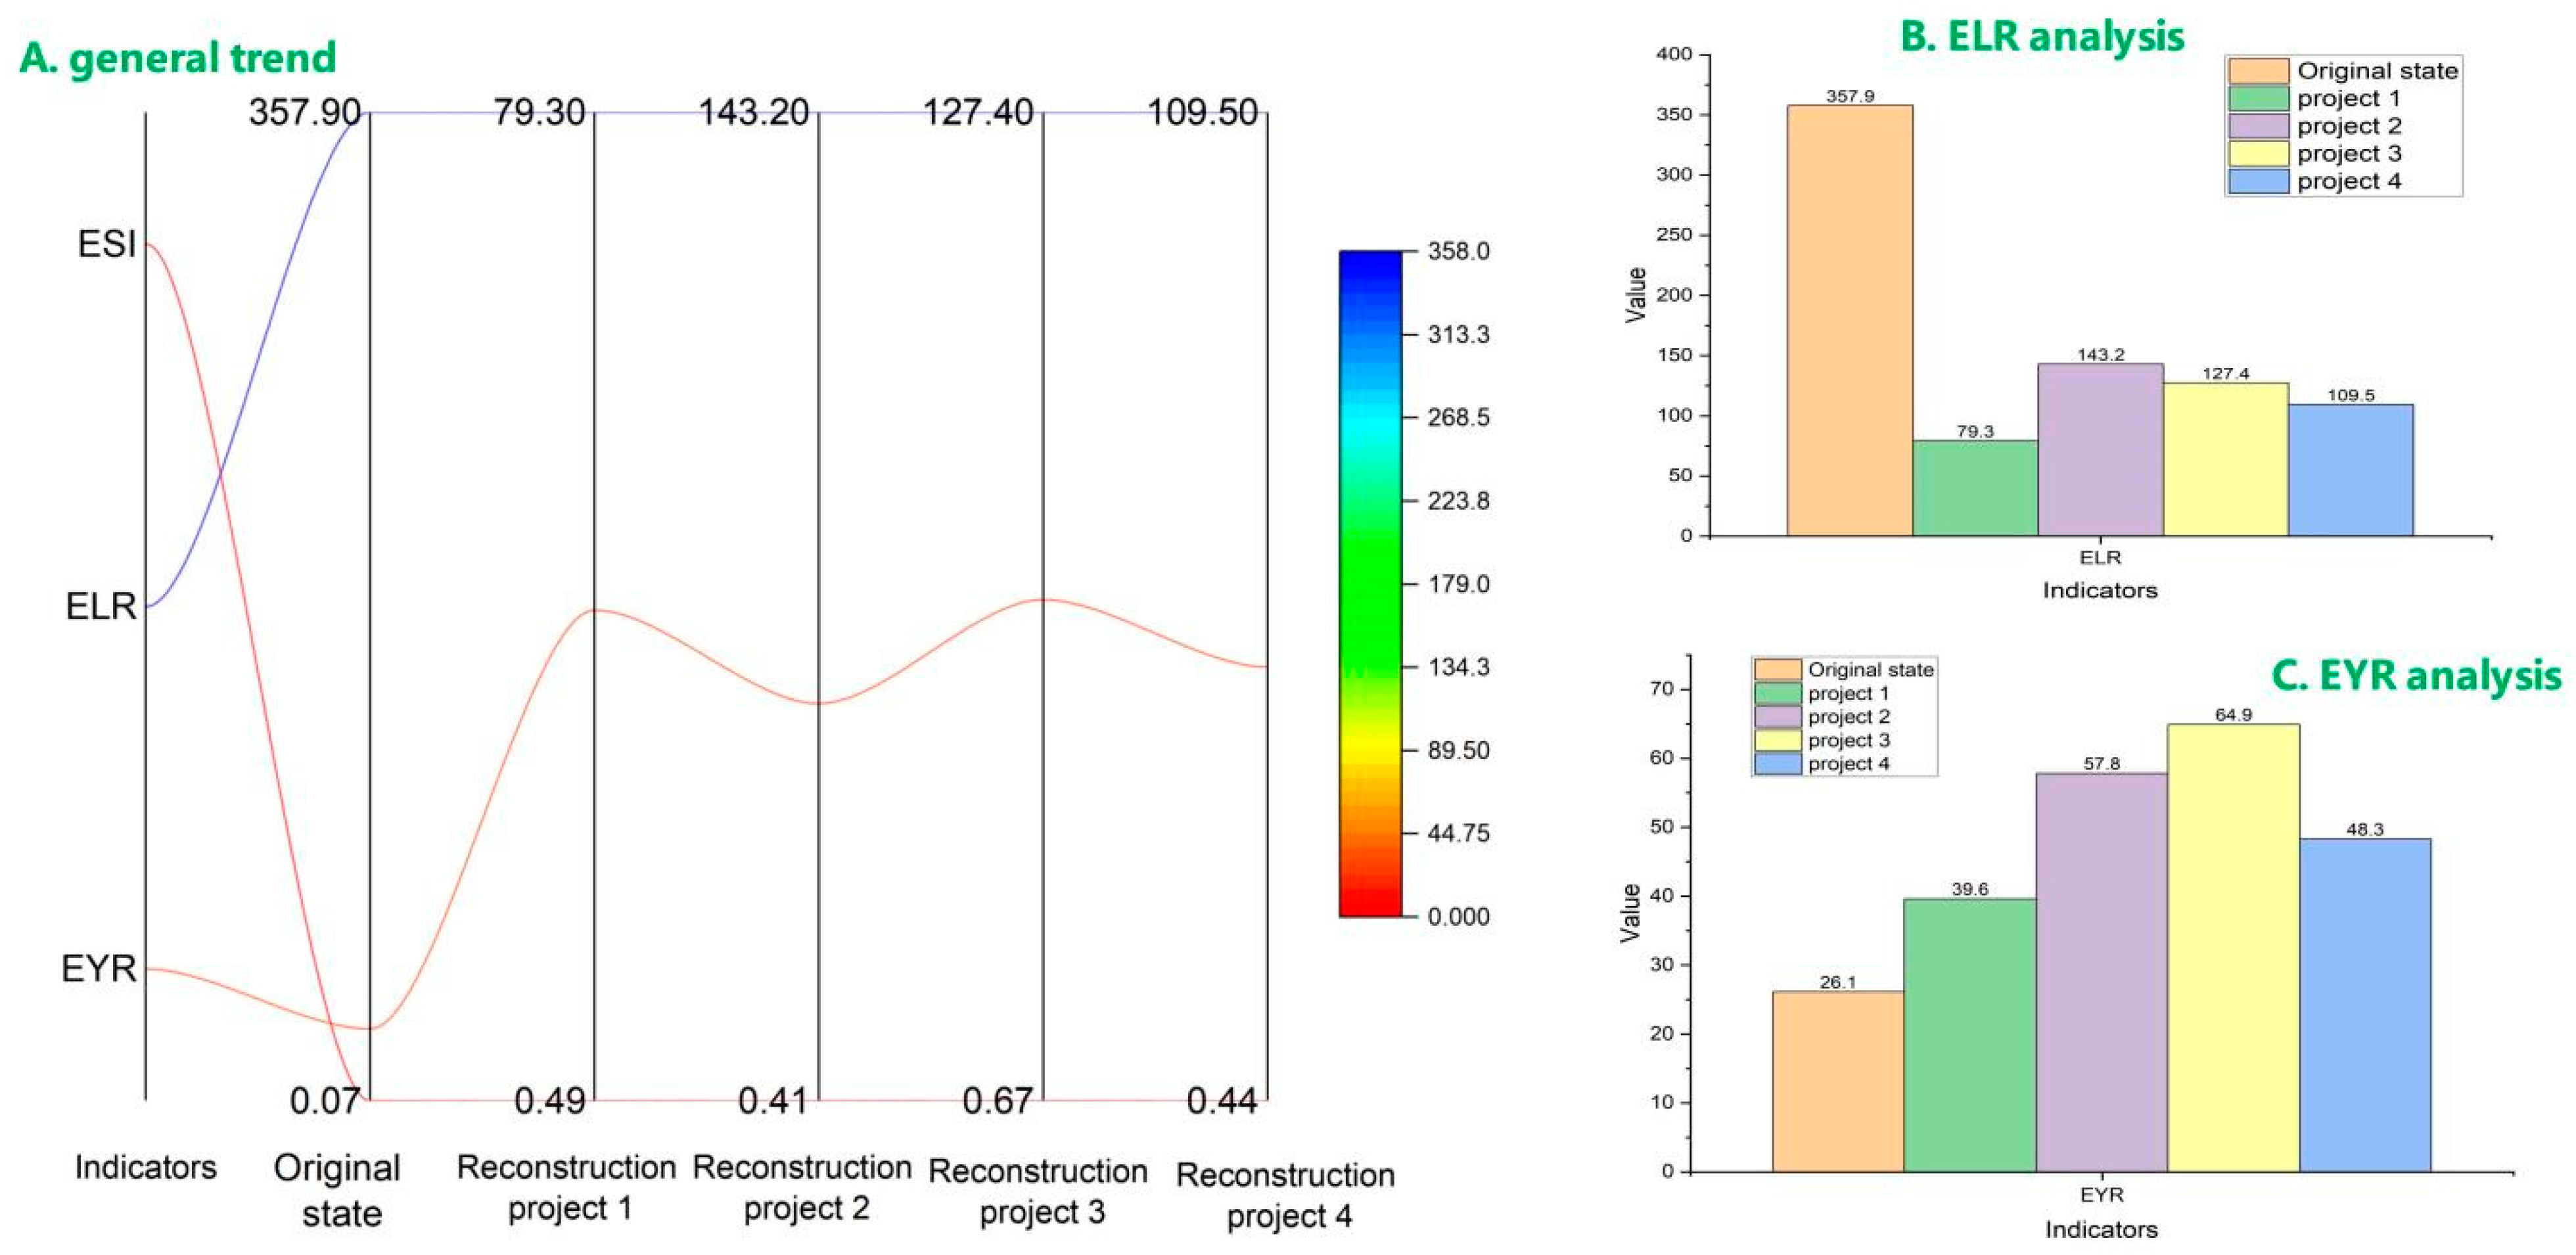
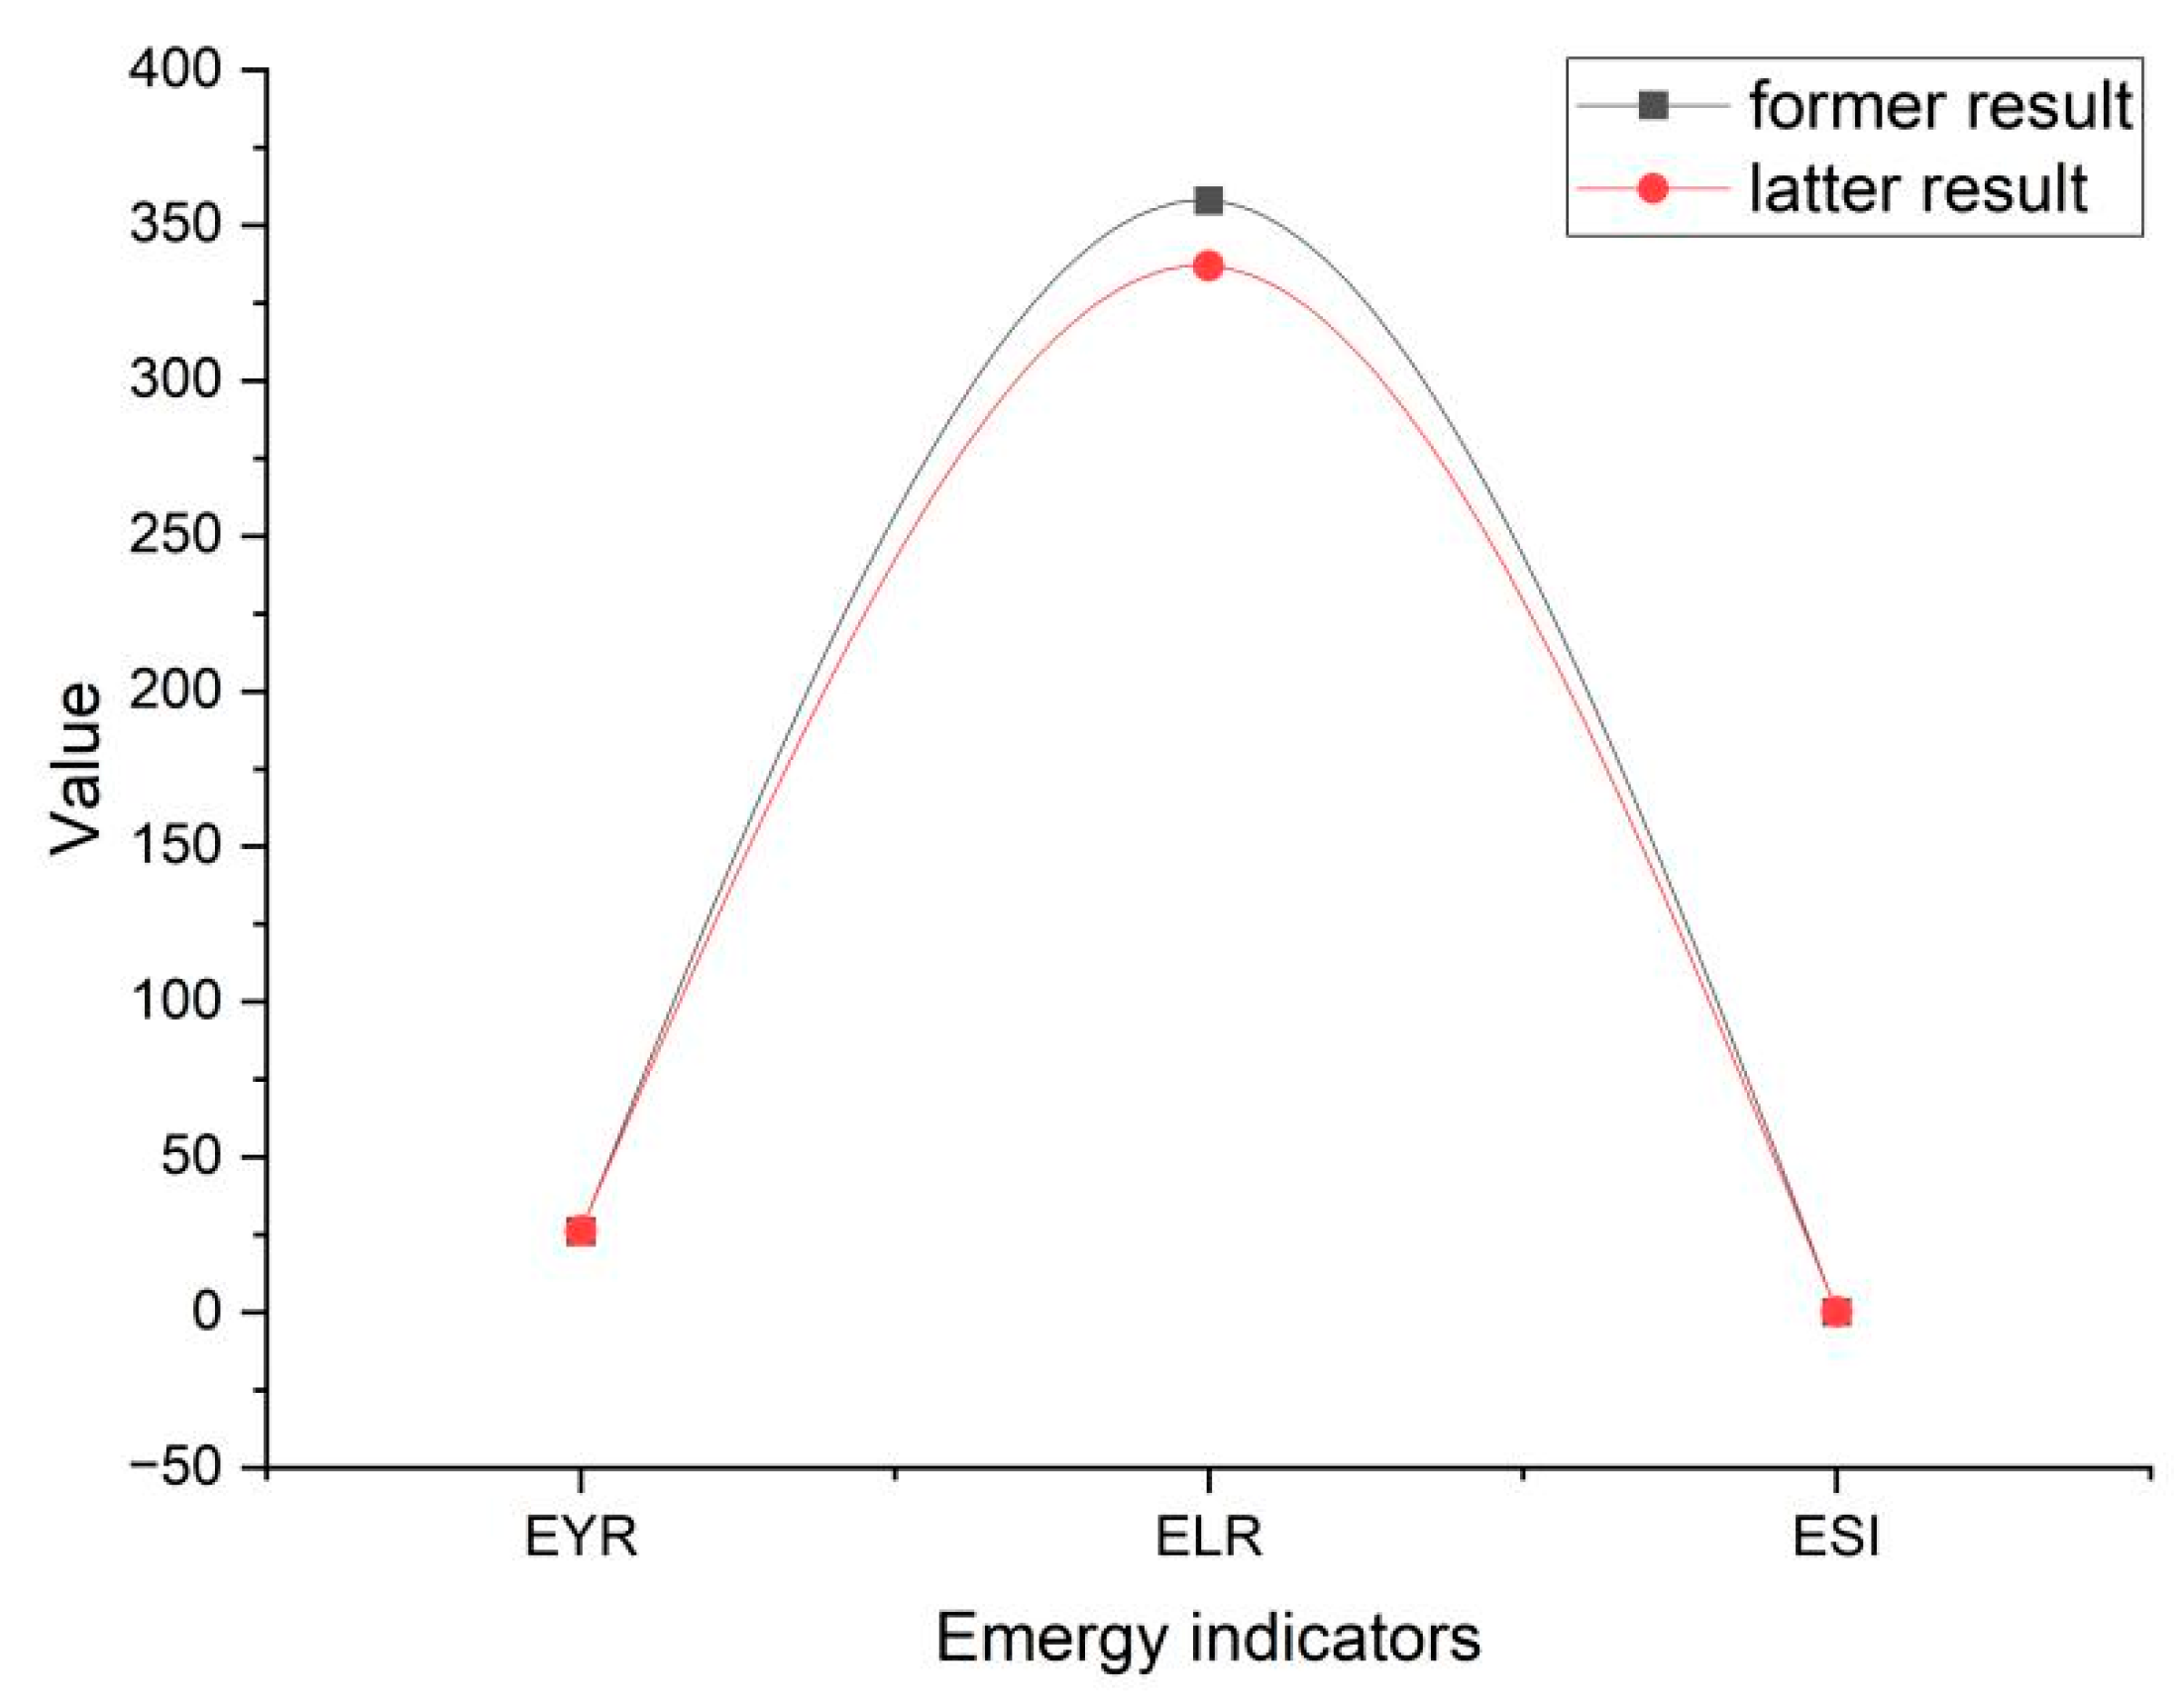
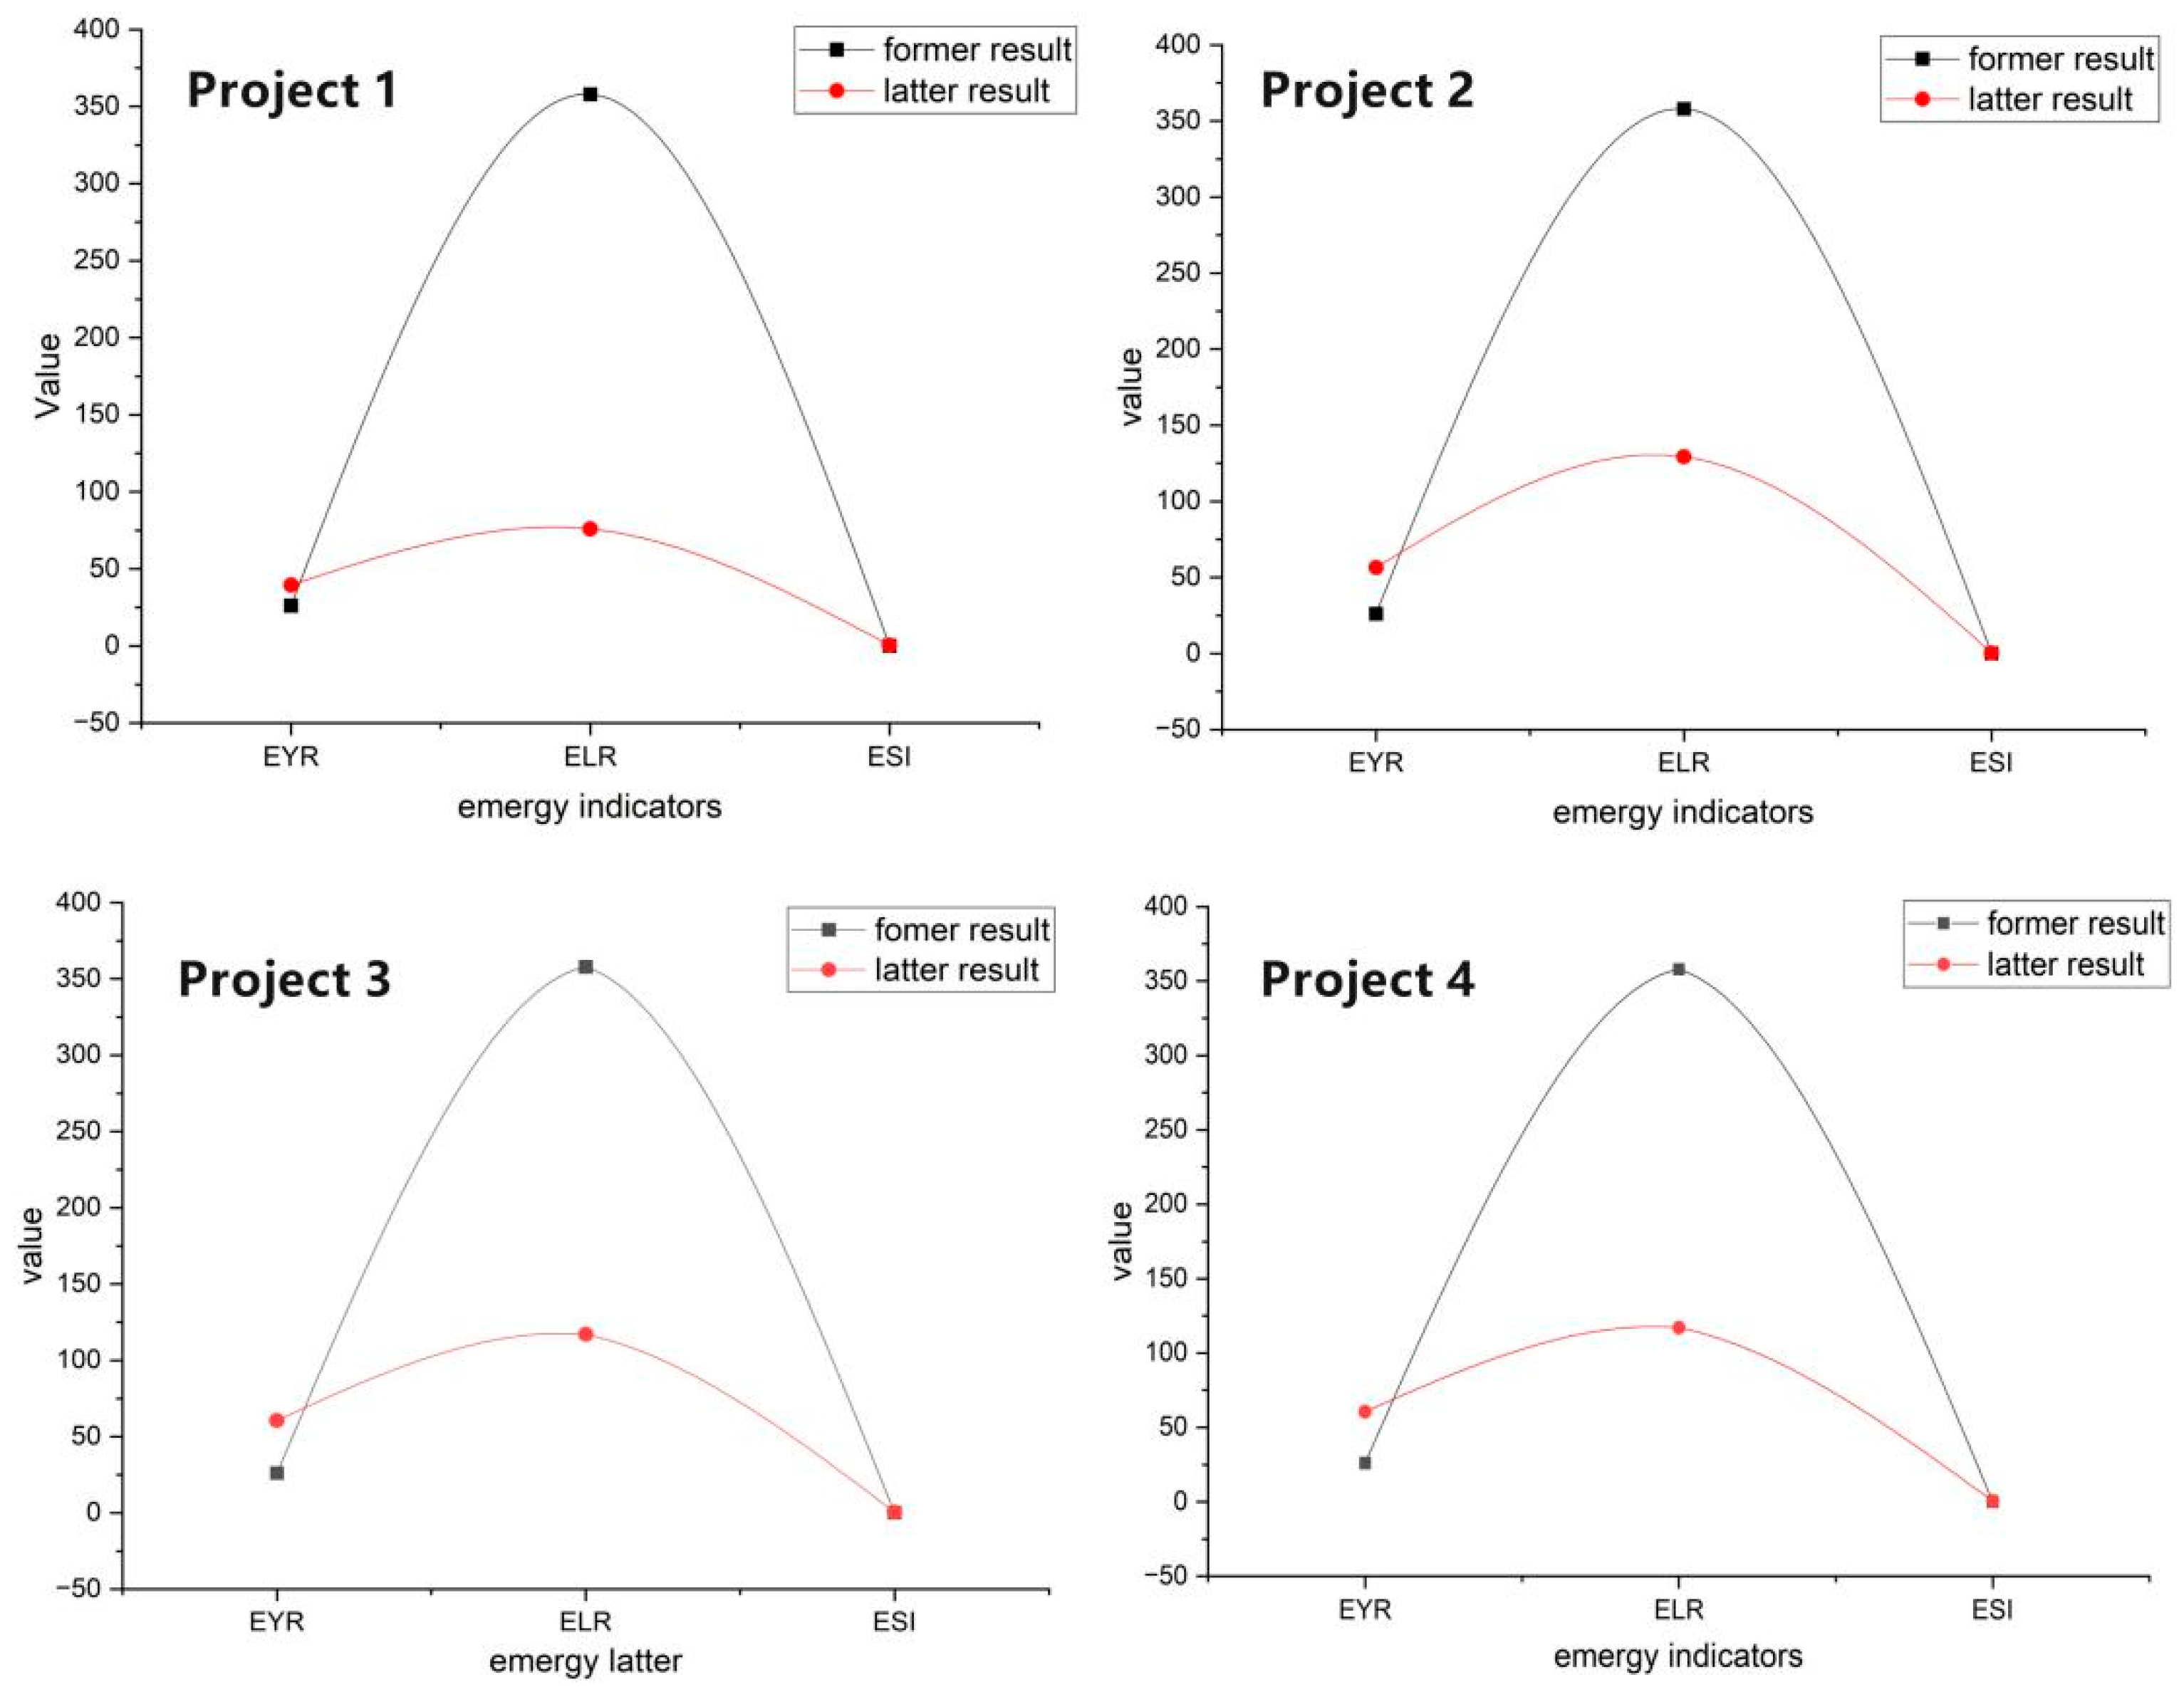
4.1.2. Emergy Indexes Analysis

In Table 3 and Figure 7, three key categories of indicators were evaluated and calculated, including EYR, ELR, and ESI. Based on the basic data, the ELR of the whole river landscape project is 357.6, which is much higher than the standard line (357.6 >> 5), resulting in a very low emergy sustainability indicator (0.073 << 1).
For the whole reconstruction project, there is the original project and four sub-renovation projects, which are reconstruction projects 1 through 4. By comparing with the original state from the view of ESI, the sustainability has been improved obviously (from 0.073 to 0.49/0.41/0.67/0.44) after carrying out the reconstruction works.
In Figure 8, the general trend has been displayed (Figure 8A), and the ELR and EYR values have been compared (Figure 8B,C). Figure 8A illustrates the comparison of three indexes (ESI/ELR/EYR) in five states. The color cloud map on the right side of the table in Figure 8 represents the line colors of the three indicators. The closer the color is to blue, the higher the value.
In addition to the improvement in ESI indicators, the ELR and EYR have also been improved from 357.9 to 79.3/143.2/127.4/109.5 and from 26.1 to 39.6/57.8/64.9/48.3, respectively. In an ecological system analysis based on the emergy concept, a smaller value of the ELR demonstrates a lighter environmental load pressure and a more sustainable system. The EYR represents how closely the system is connected to the outside world and explains the proportion of material flow, energy flow, and information flow input from the outside world to the reconstructed system. In this study, the original engineering system had a high environmental load rate (35.7), indicating that the previous river landscape system had a poor ecological state.
After ecosystem reconstruction, the environmental load rate was reduced, and the ecology of the system was greatly enhanced (79.3/143.2/127.4/109.5), roughly by 4.51 times (reconstruction project 1). On the contrary, taking the EYR as an example, the higher the EYR, the more beneficial it is to the sustainability of the reconstruction system, which has been improved by about 2.49 times (reconstruction project 3). Based on the above information (ELR and EYR), the ESI was calculated in Figure 7 and was found to have been improved by approximately 9.18 times (reconstruction project 3).

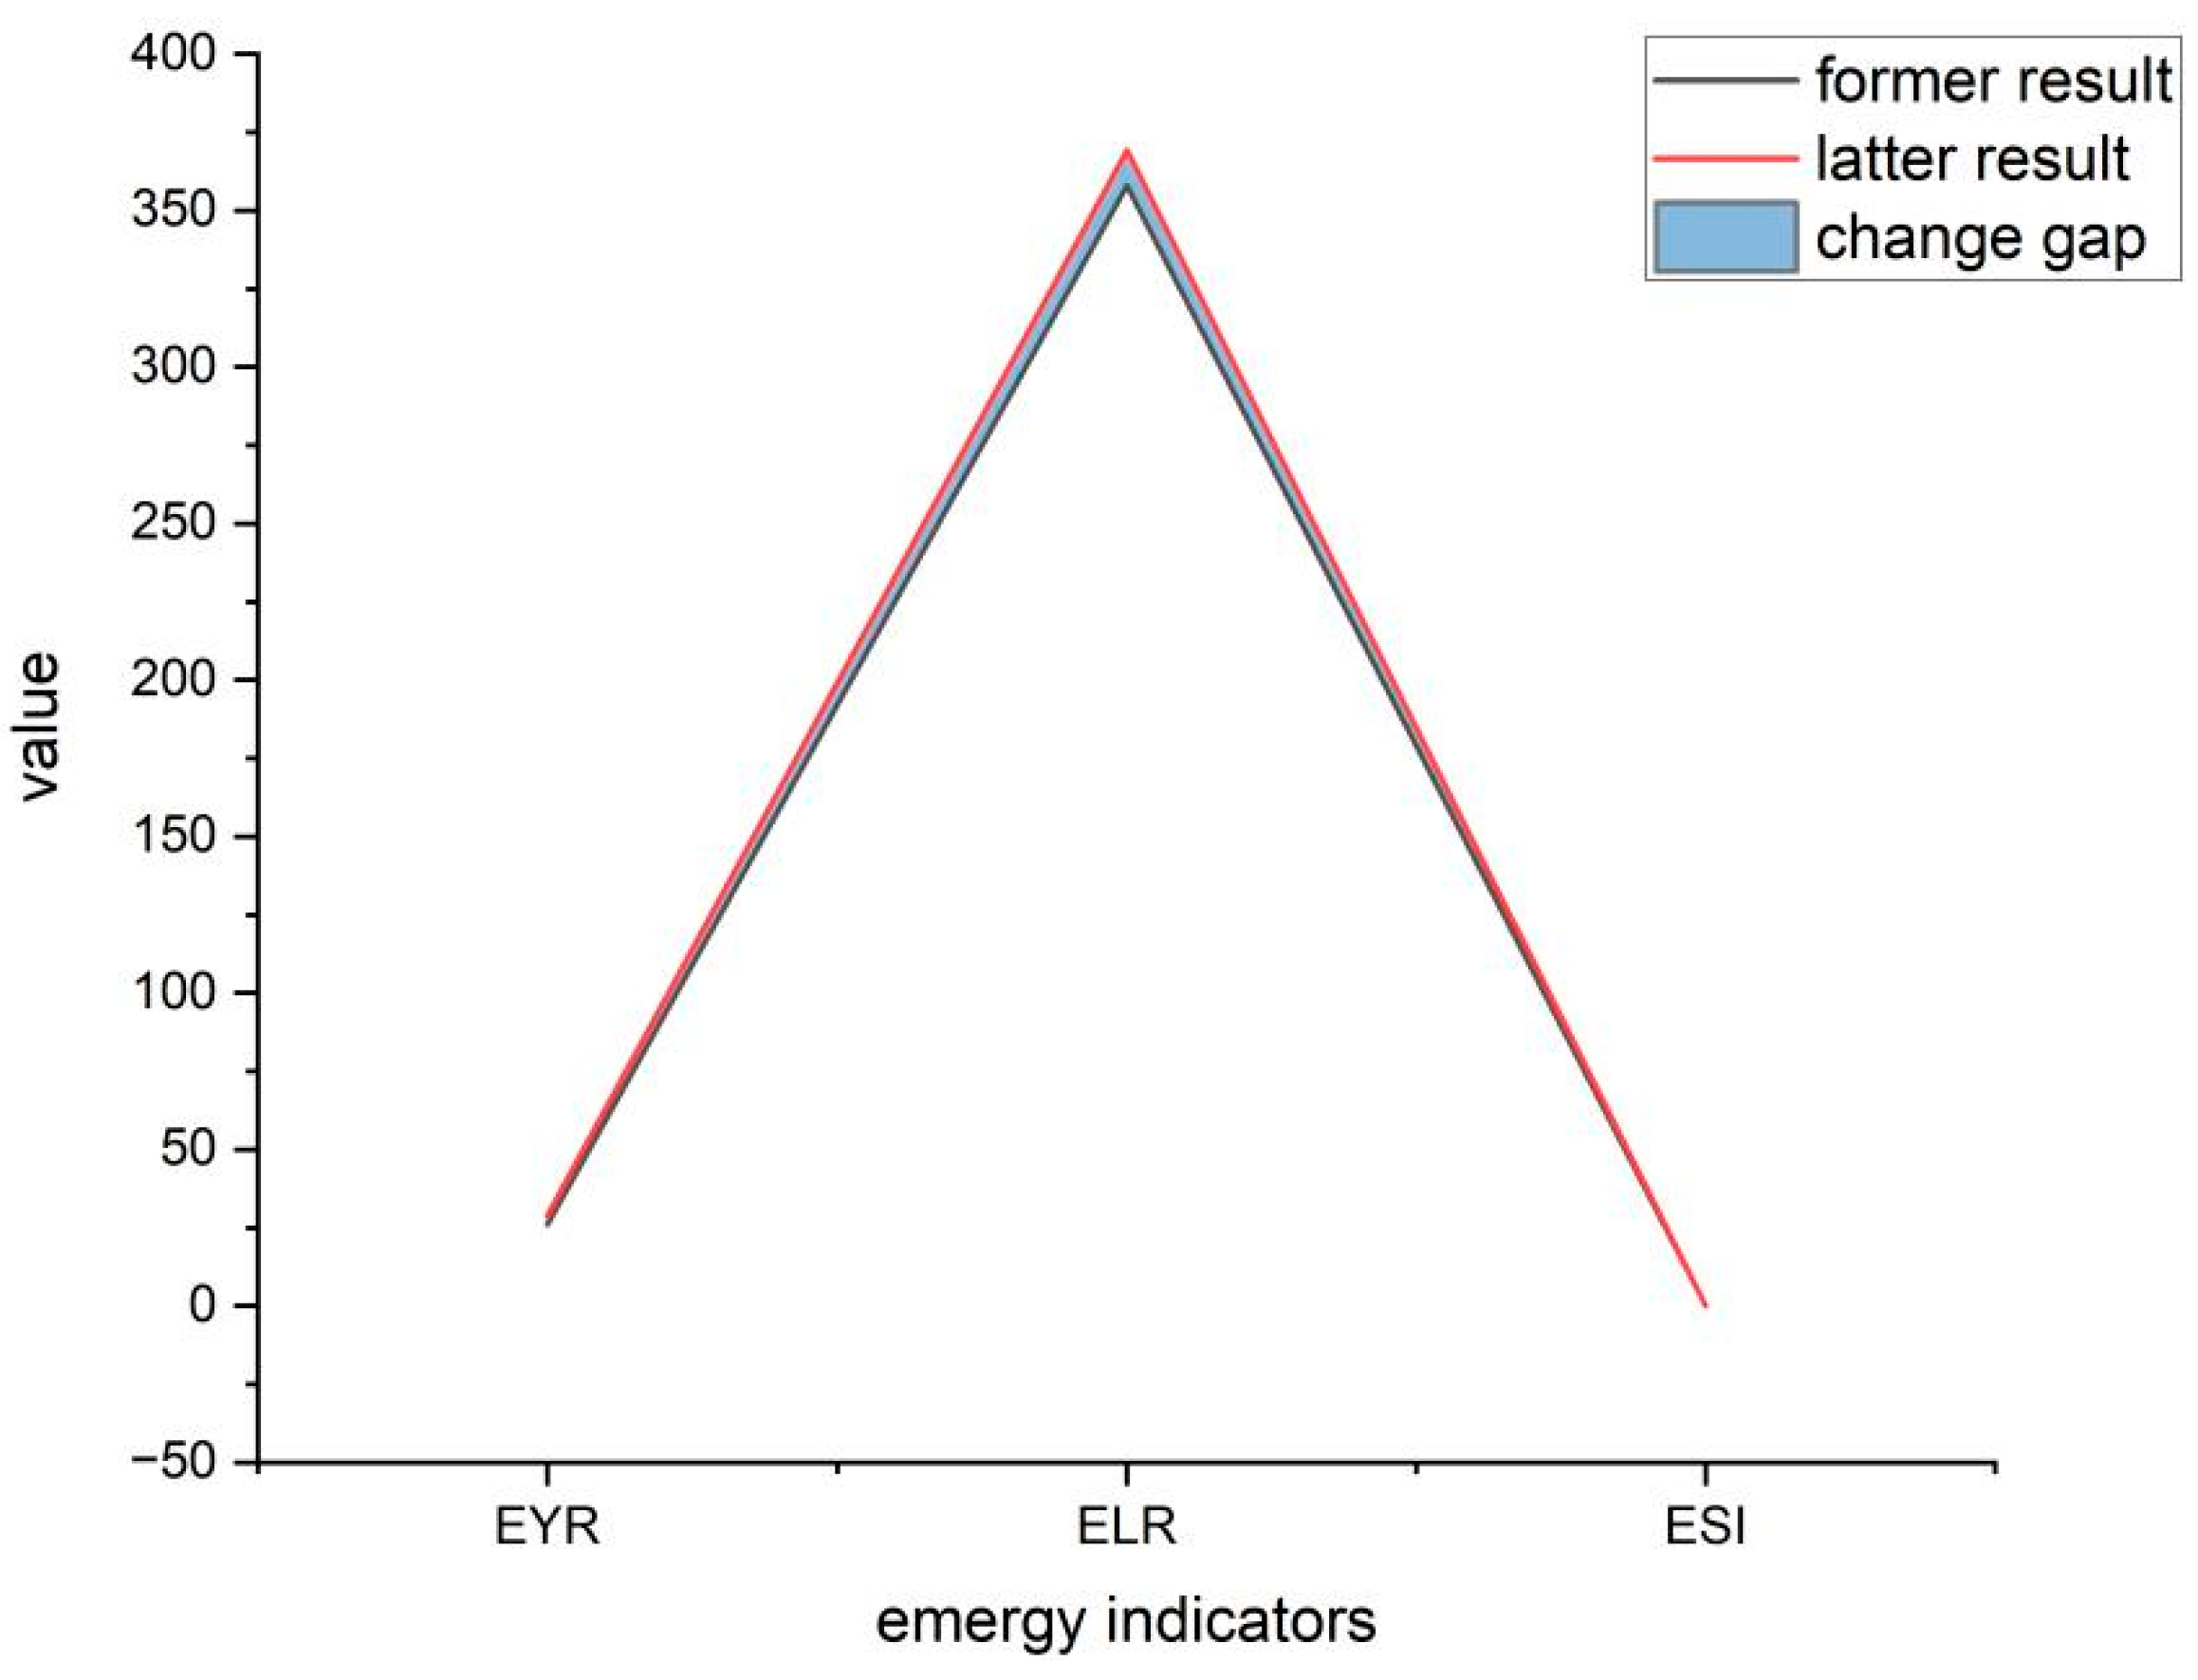
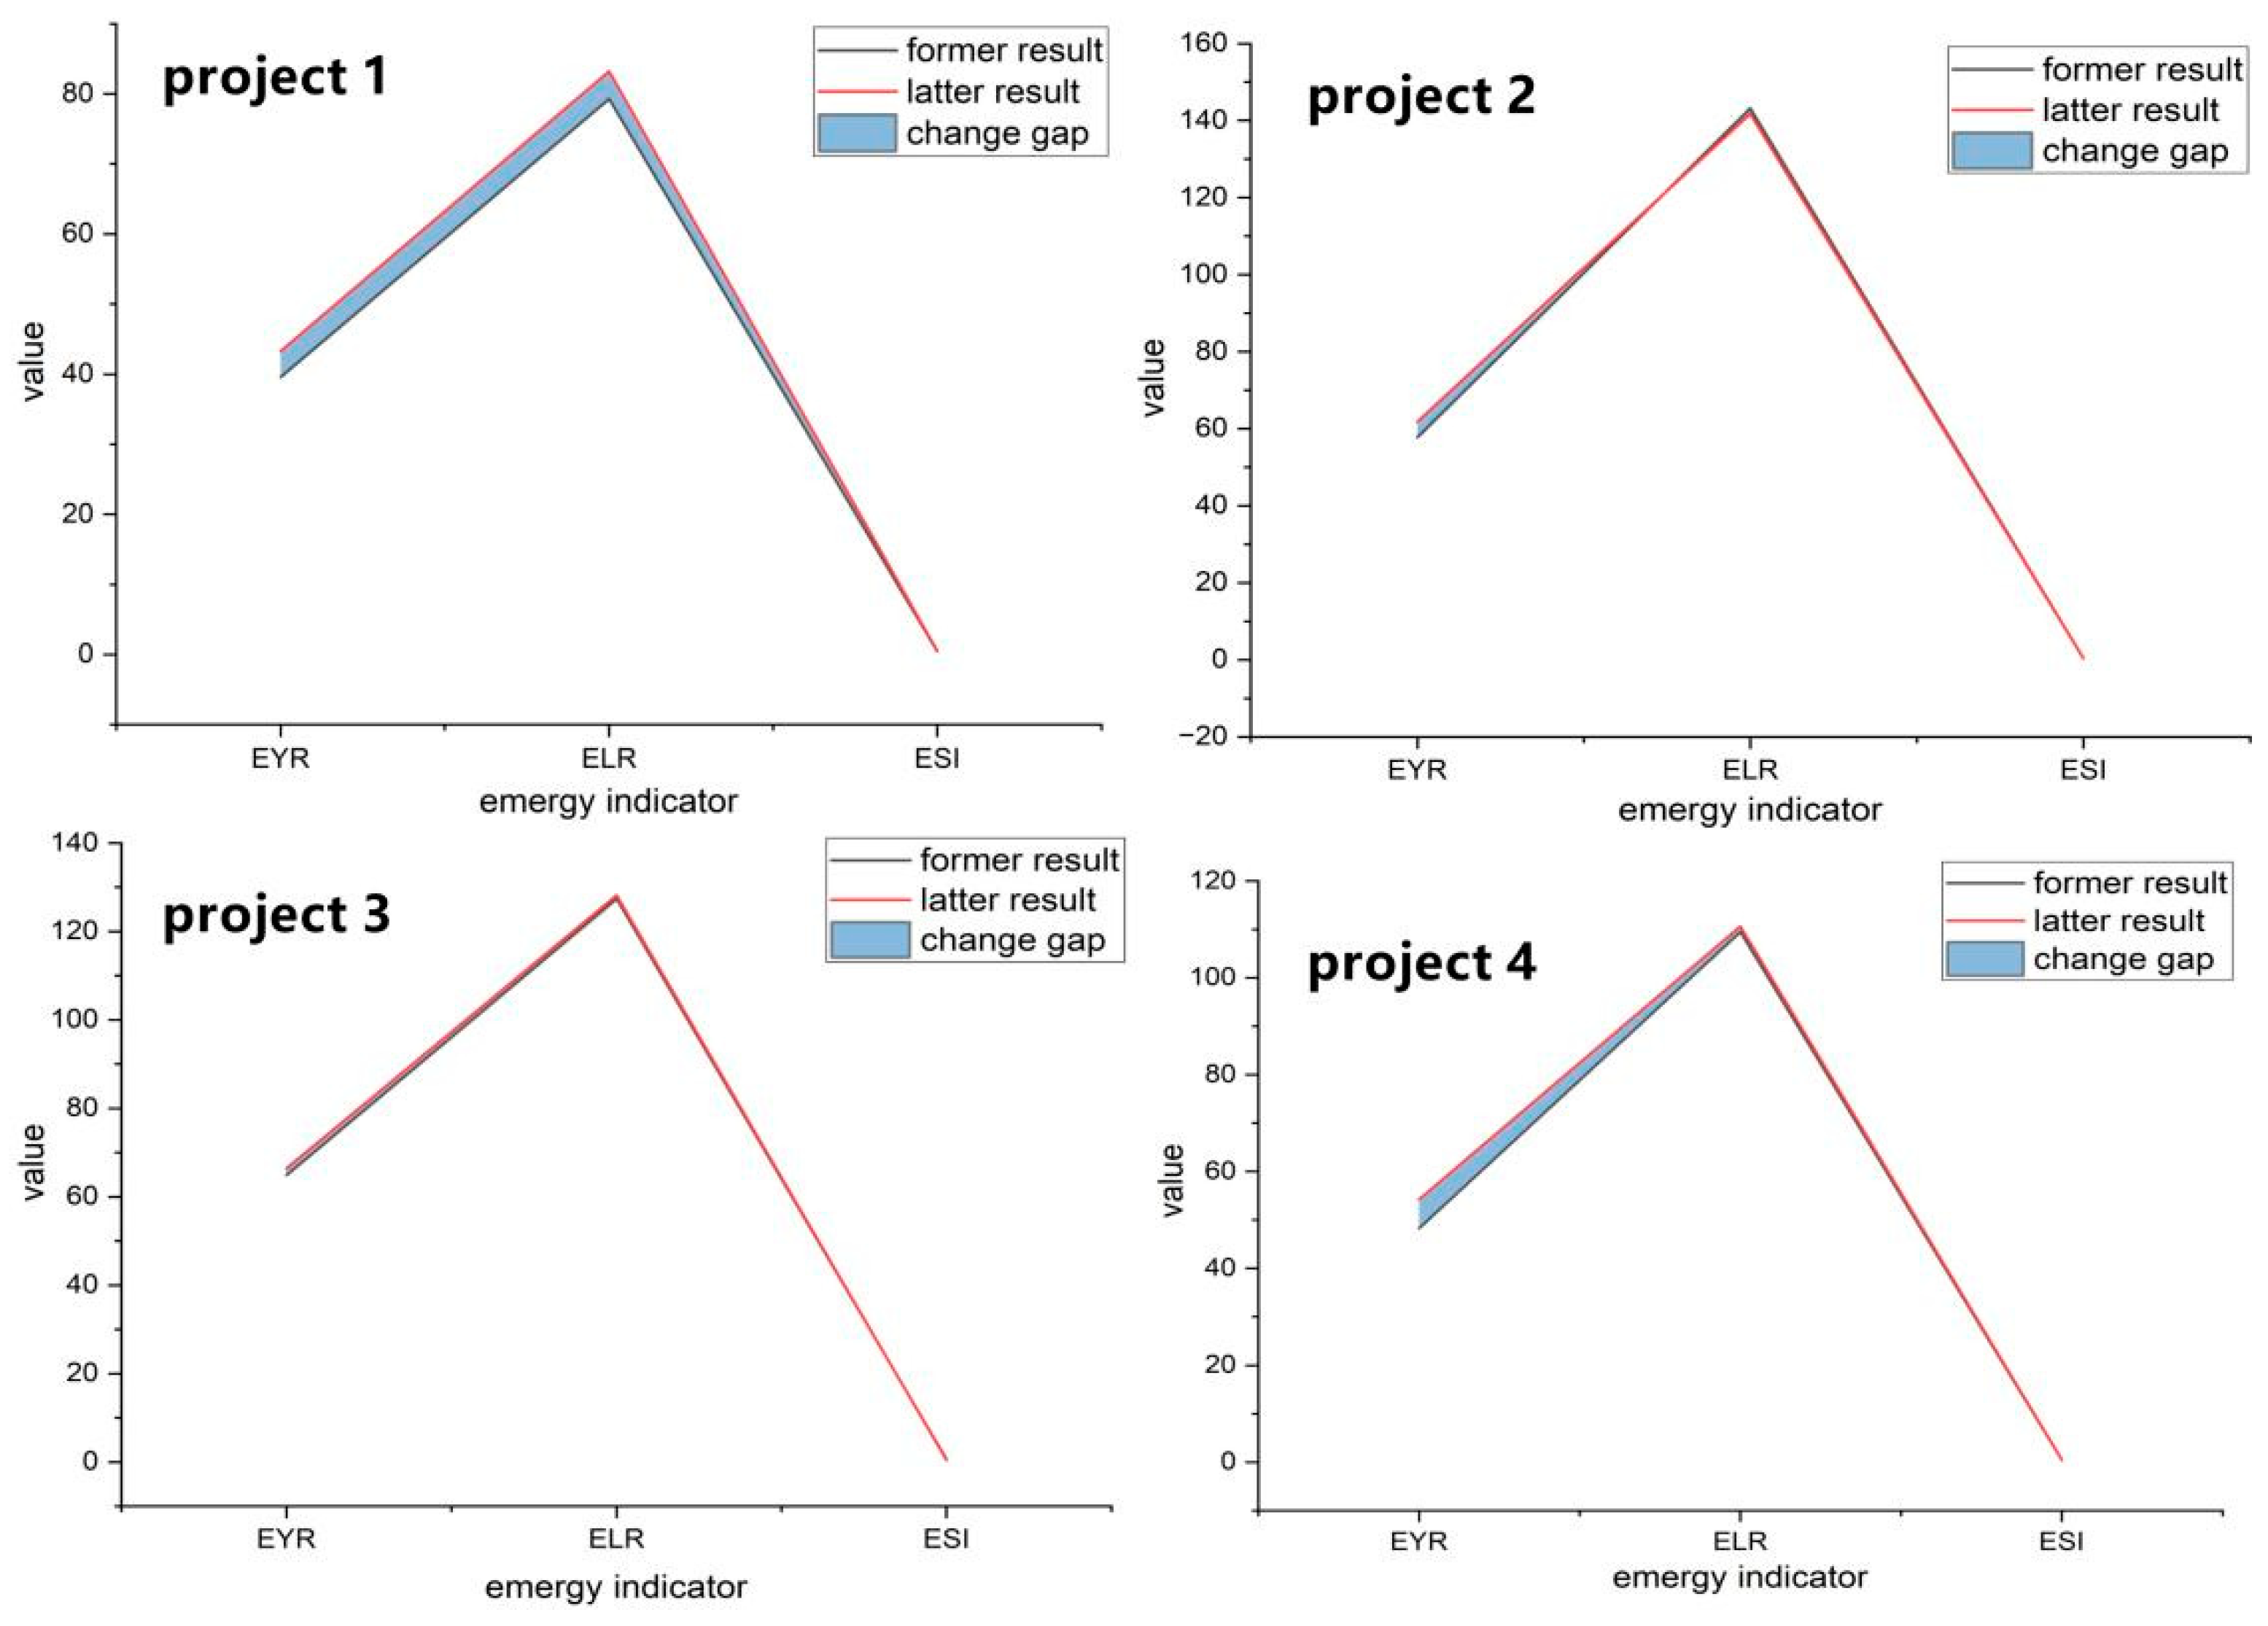
4.1.3. Sensitivity Analysis

To assess the uncertainty of the study outcome, a sensitivity analysis was conducted and explored with the following two hypotheses:
Hypothesis H1.
By adjusting the magnitude of the underlying data by roughly 10%, the result of the emergy analysis is confirmed.
Hypothesis H2.
Identify changes in sustainability parameters by changing the fluctuation of unit emergy values by approximately 5%.
The indicators of the four implemented reconstruction projects were analyzed to evaluate the degree of sensitivity. Table 4 displays the change data of indicators under these two kinds of assumptions, and Figure 9 and Figure 10 display sensitivity analysis in all states.
In the case of Hypothesis H1, Figure 9 demonstrates the sensitivity variation level, and the change gap is clear. The EYR showed the most obvious difference (about 9.38%), followed by the ESI (roughly 5.19%) and the ELR (3.09%). Figure 10 presents the sensitivity change maps of the four reconstruction projects. Reconstruction project 3 shows the optimal stability, followed by Project 2, project 4, and project 1, which can be clearly checked and verified using Figure 10.
In the case of Hypothesis H2, Figure 11 and Figure 12 show the gap level. In Figure 11, the ELR has the greatest influence on sensitivity (clear difference), followed by the EYR and ESI (not obvious). The variation fluctuation variances after the reconstruction projects are displayed in Figure 12. In general, the ELR has a high value, resulting in the most obvious changes in its sensitivity. From reconstruction projects 1 to 4, a similar pattern can be seen in Figure 12. For the same reason, the variation in the EYR is the second highest (project 3 > project 2 > project 4 > project 1). For the ESI, there was little noticeable change.

4.1.4. Unit Emergy Values (UEVs)

As a core concept, unit emergy values (UEVs) play a critical role in ecological assessment based on the emergy method. They represent an ecological level to describe energy and the resource input efficiency of the target system. In this study, the UEVs of the reconstruction projects were computed and found to be 3.79 × 10¹⁴ sej/m2, 4.05 × 10¹⁶ sej/m2, 3.61 × 10¹⁴ sej/m2, and 3.98 × 10¹⁶ sej/m2. From the perspective of UEVs, the ranking of sustainability views is project 3 > project 1 > project 4 > project 2, which is consistent with the evaluation of the emergy index.

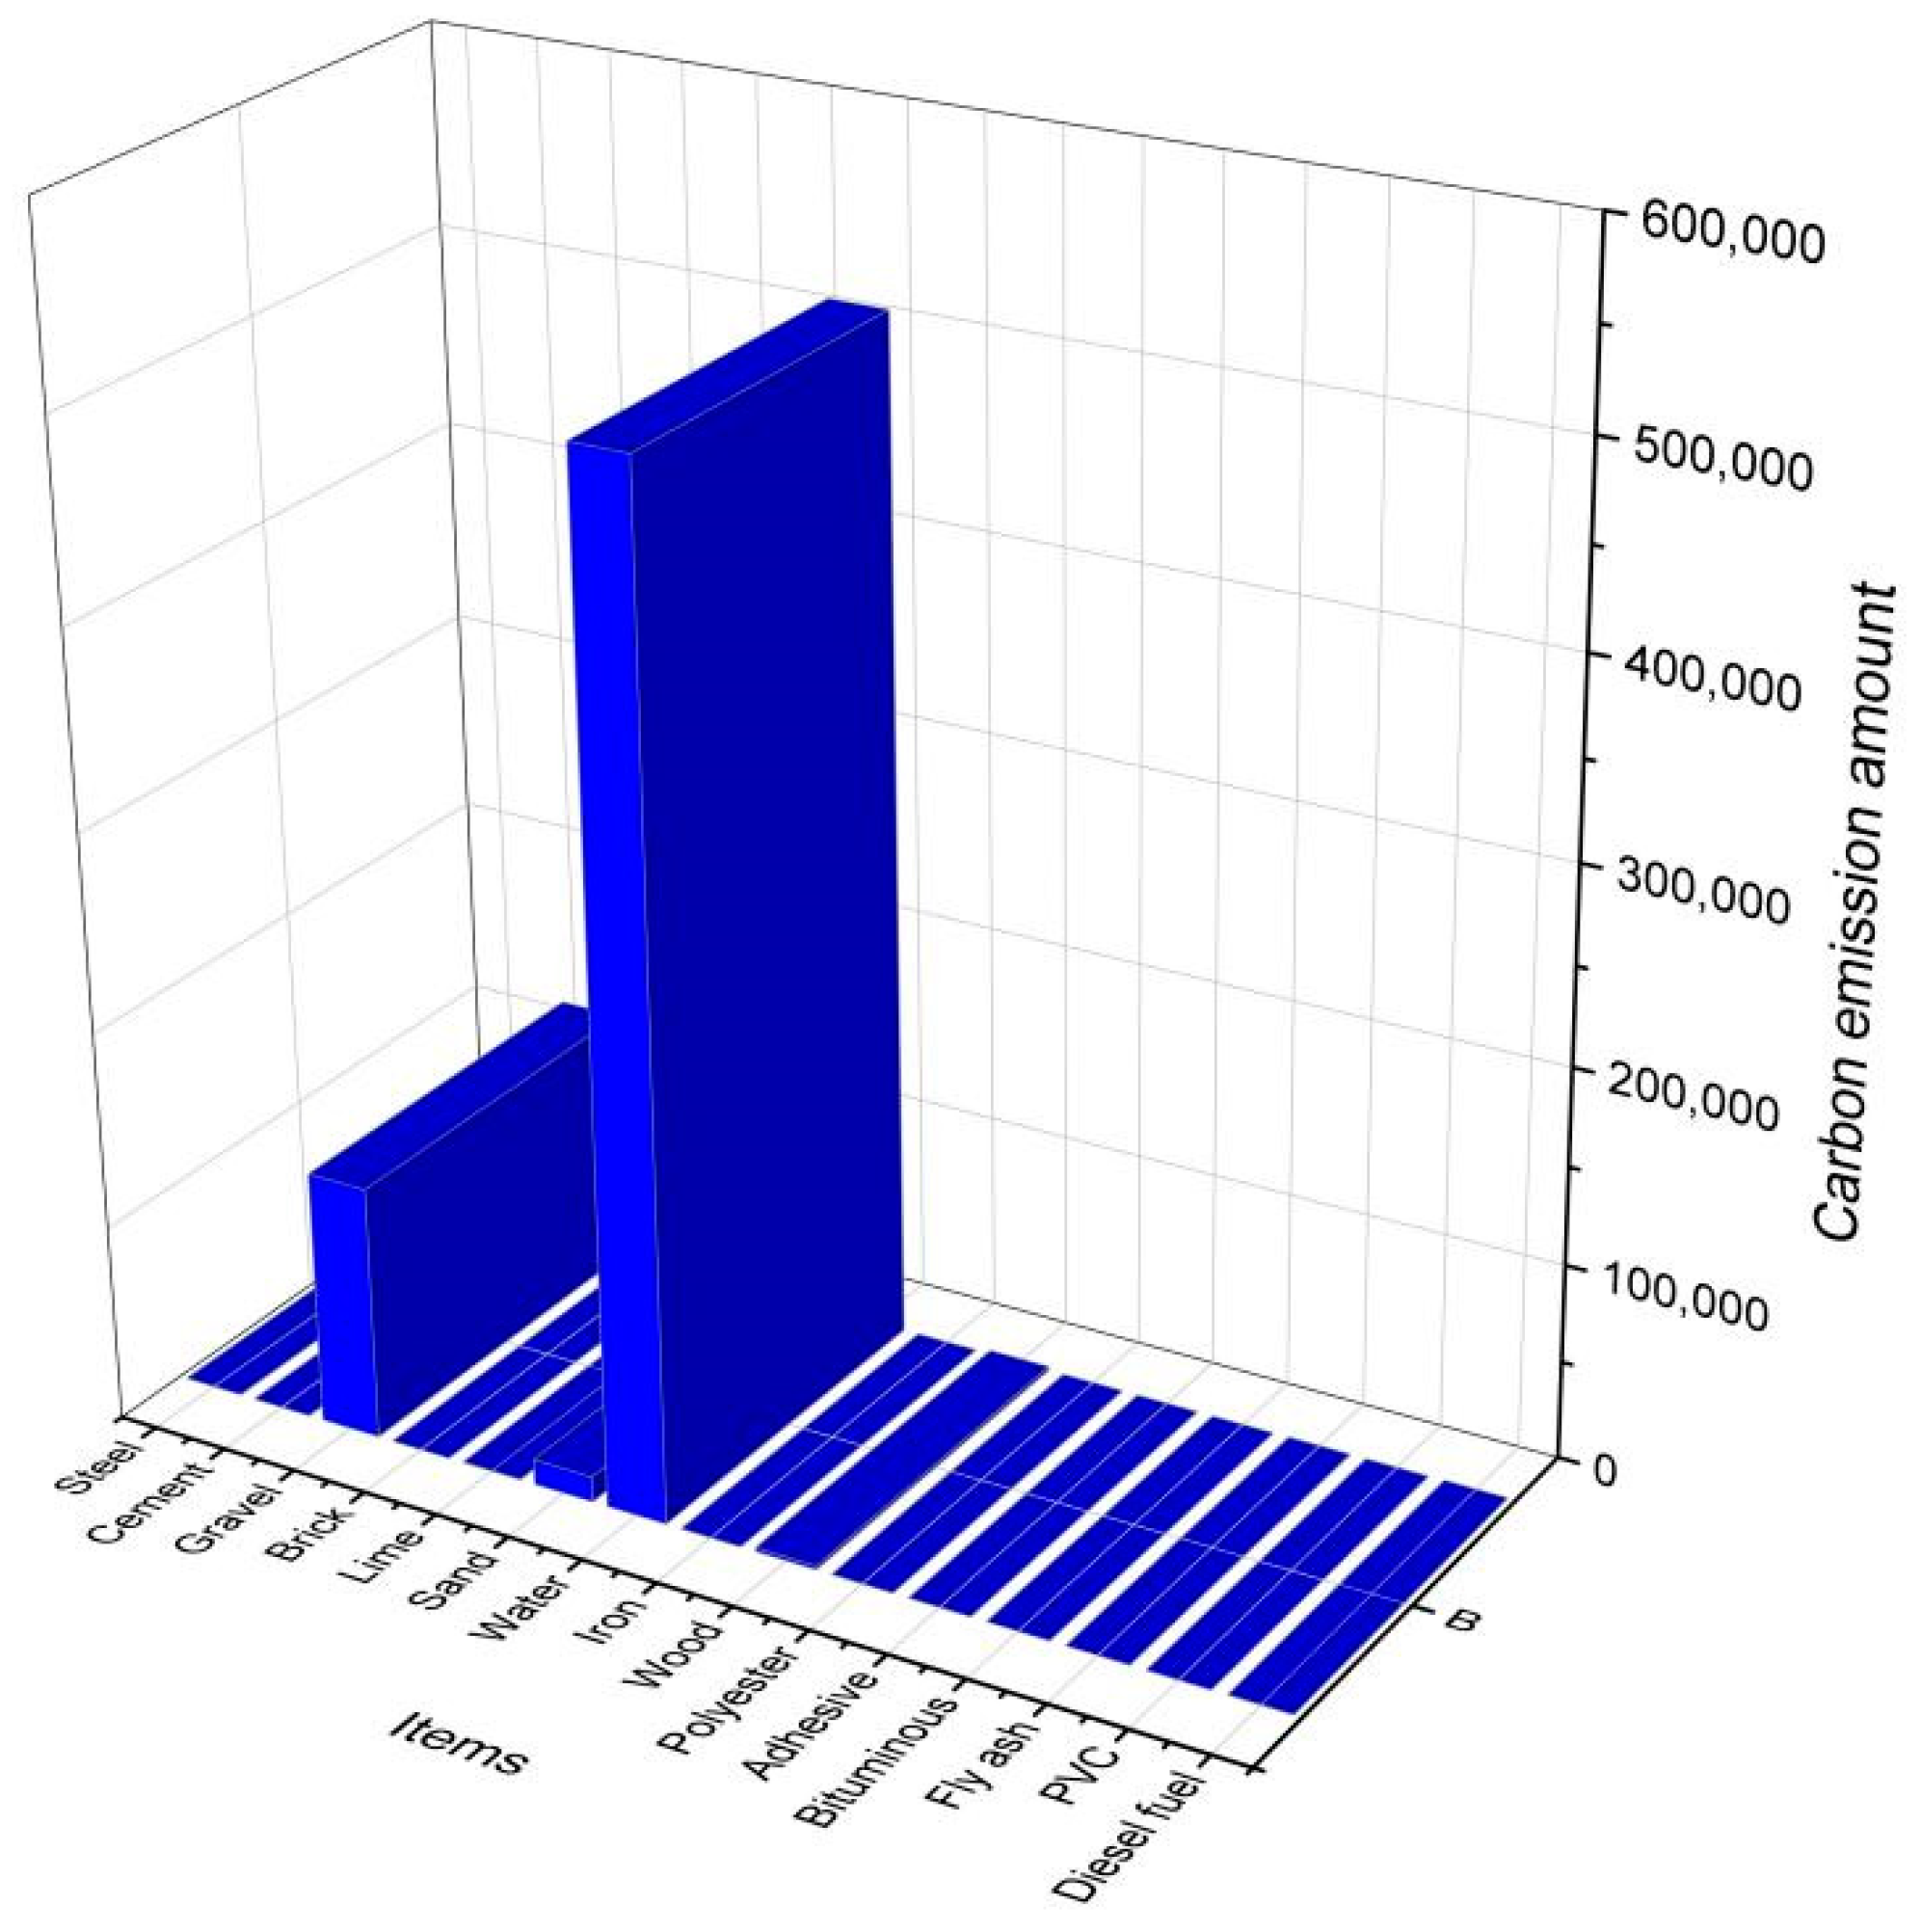
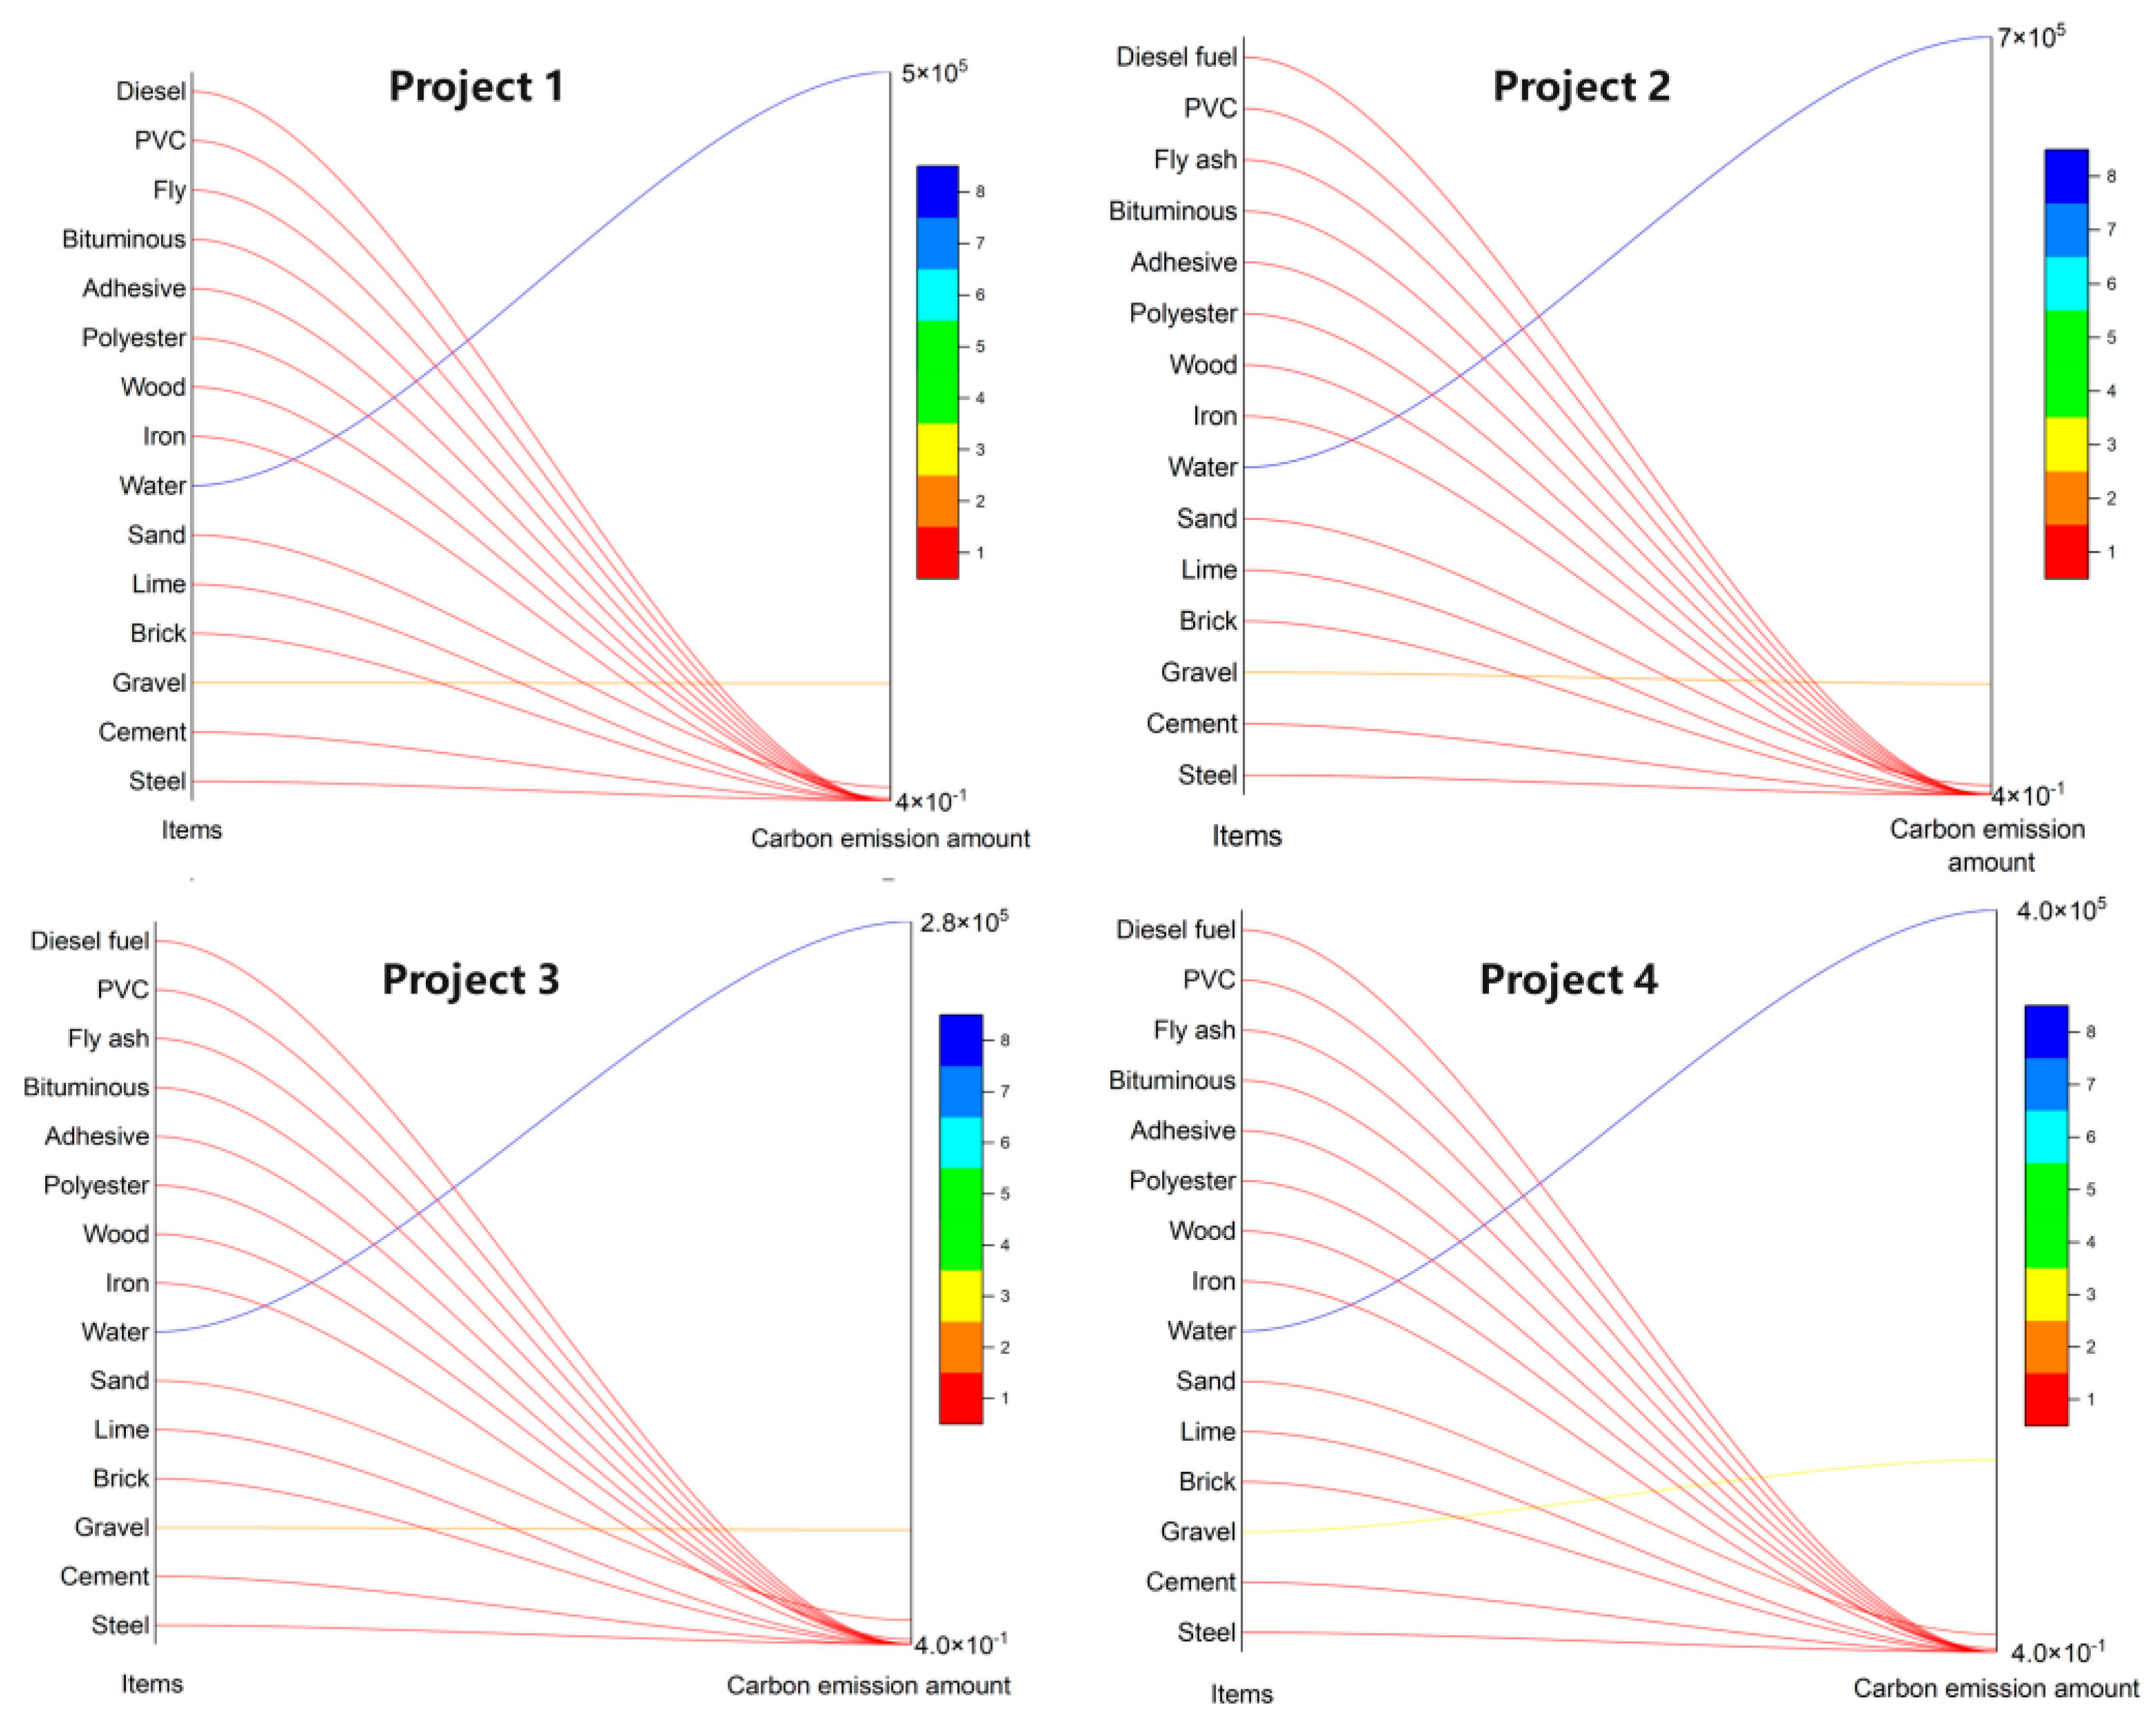
4.2. LCA–Carbon Emission Analysis

In this section, two parts will be discussed: carbon emission calculation and carbon sink evaluation. The carbon emission analysis for all four types of projects will be covered and discussed.

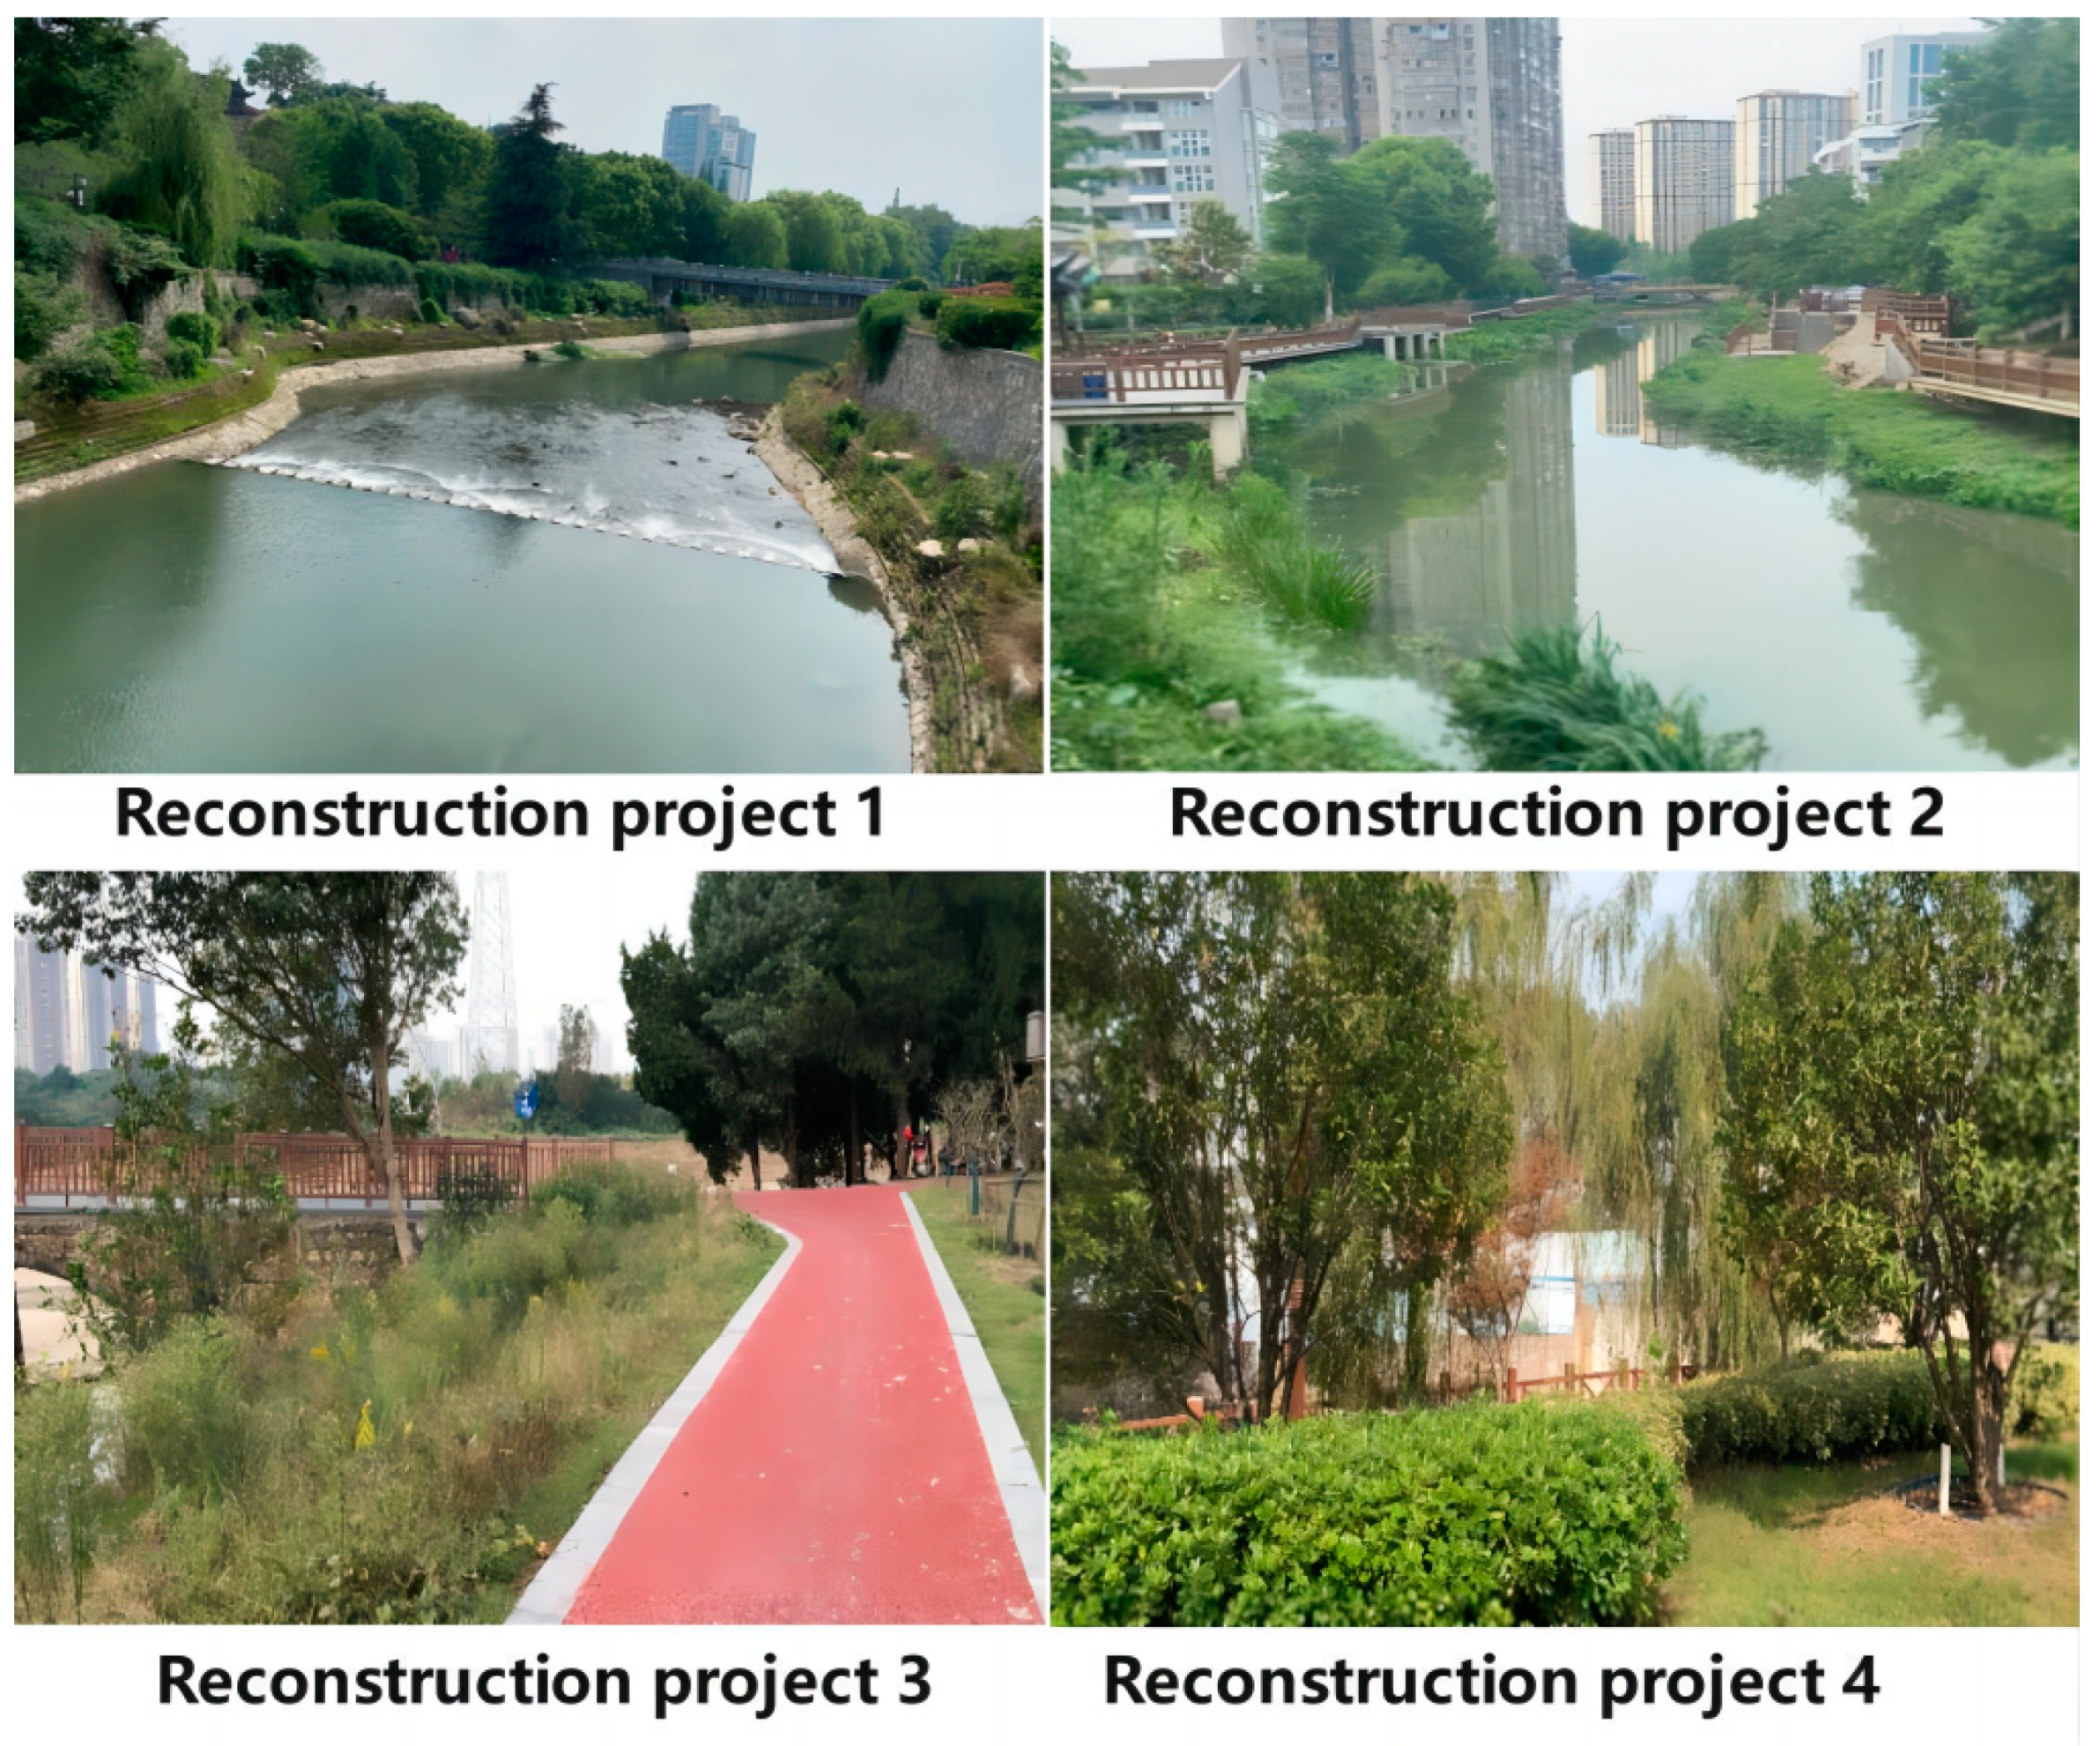
4.2.1. The Carbon Emission Analysis of Reconstruction Project 1

Table 5 lists the primary material, energy inputs, and carbon emission factors, including major data for project 1. A total of 15 inputs were counted, with the main contributor being clean water to support river flow, which can be verified from Table 5 and Figure 13. In order to maintain the ecological level of the entire construction process, non-ecological types of materials are minimized, such as steel, cement, diesel fuel, etc. Water and gravel were selected as major elements to complete reconstruction project 1, representing ecological options. Figure 14 clearly expresses the designer’s choice of elements.

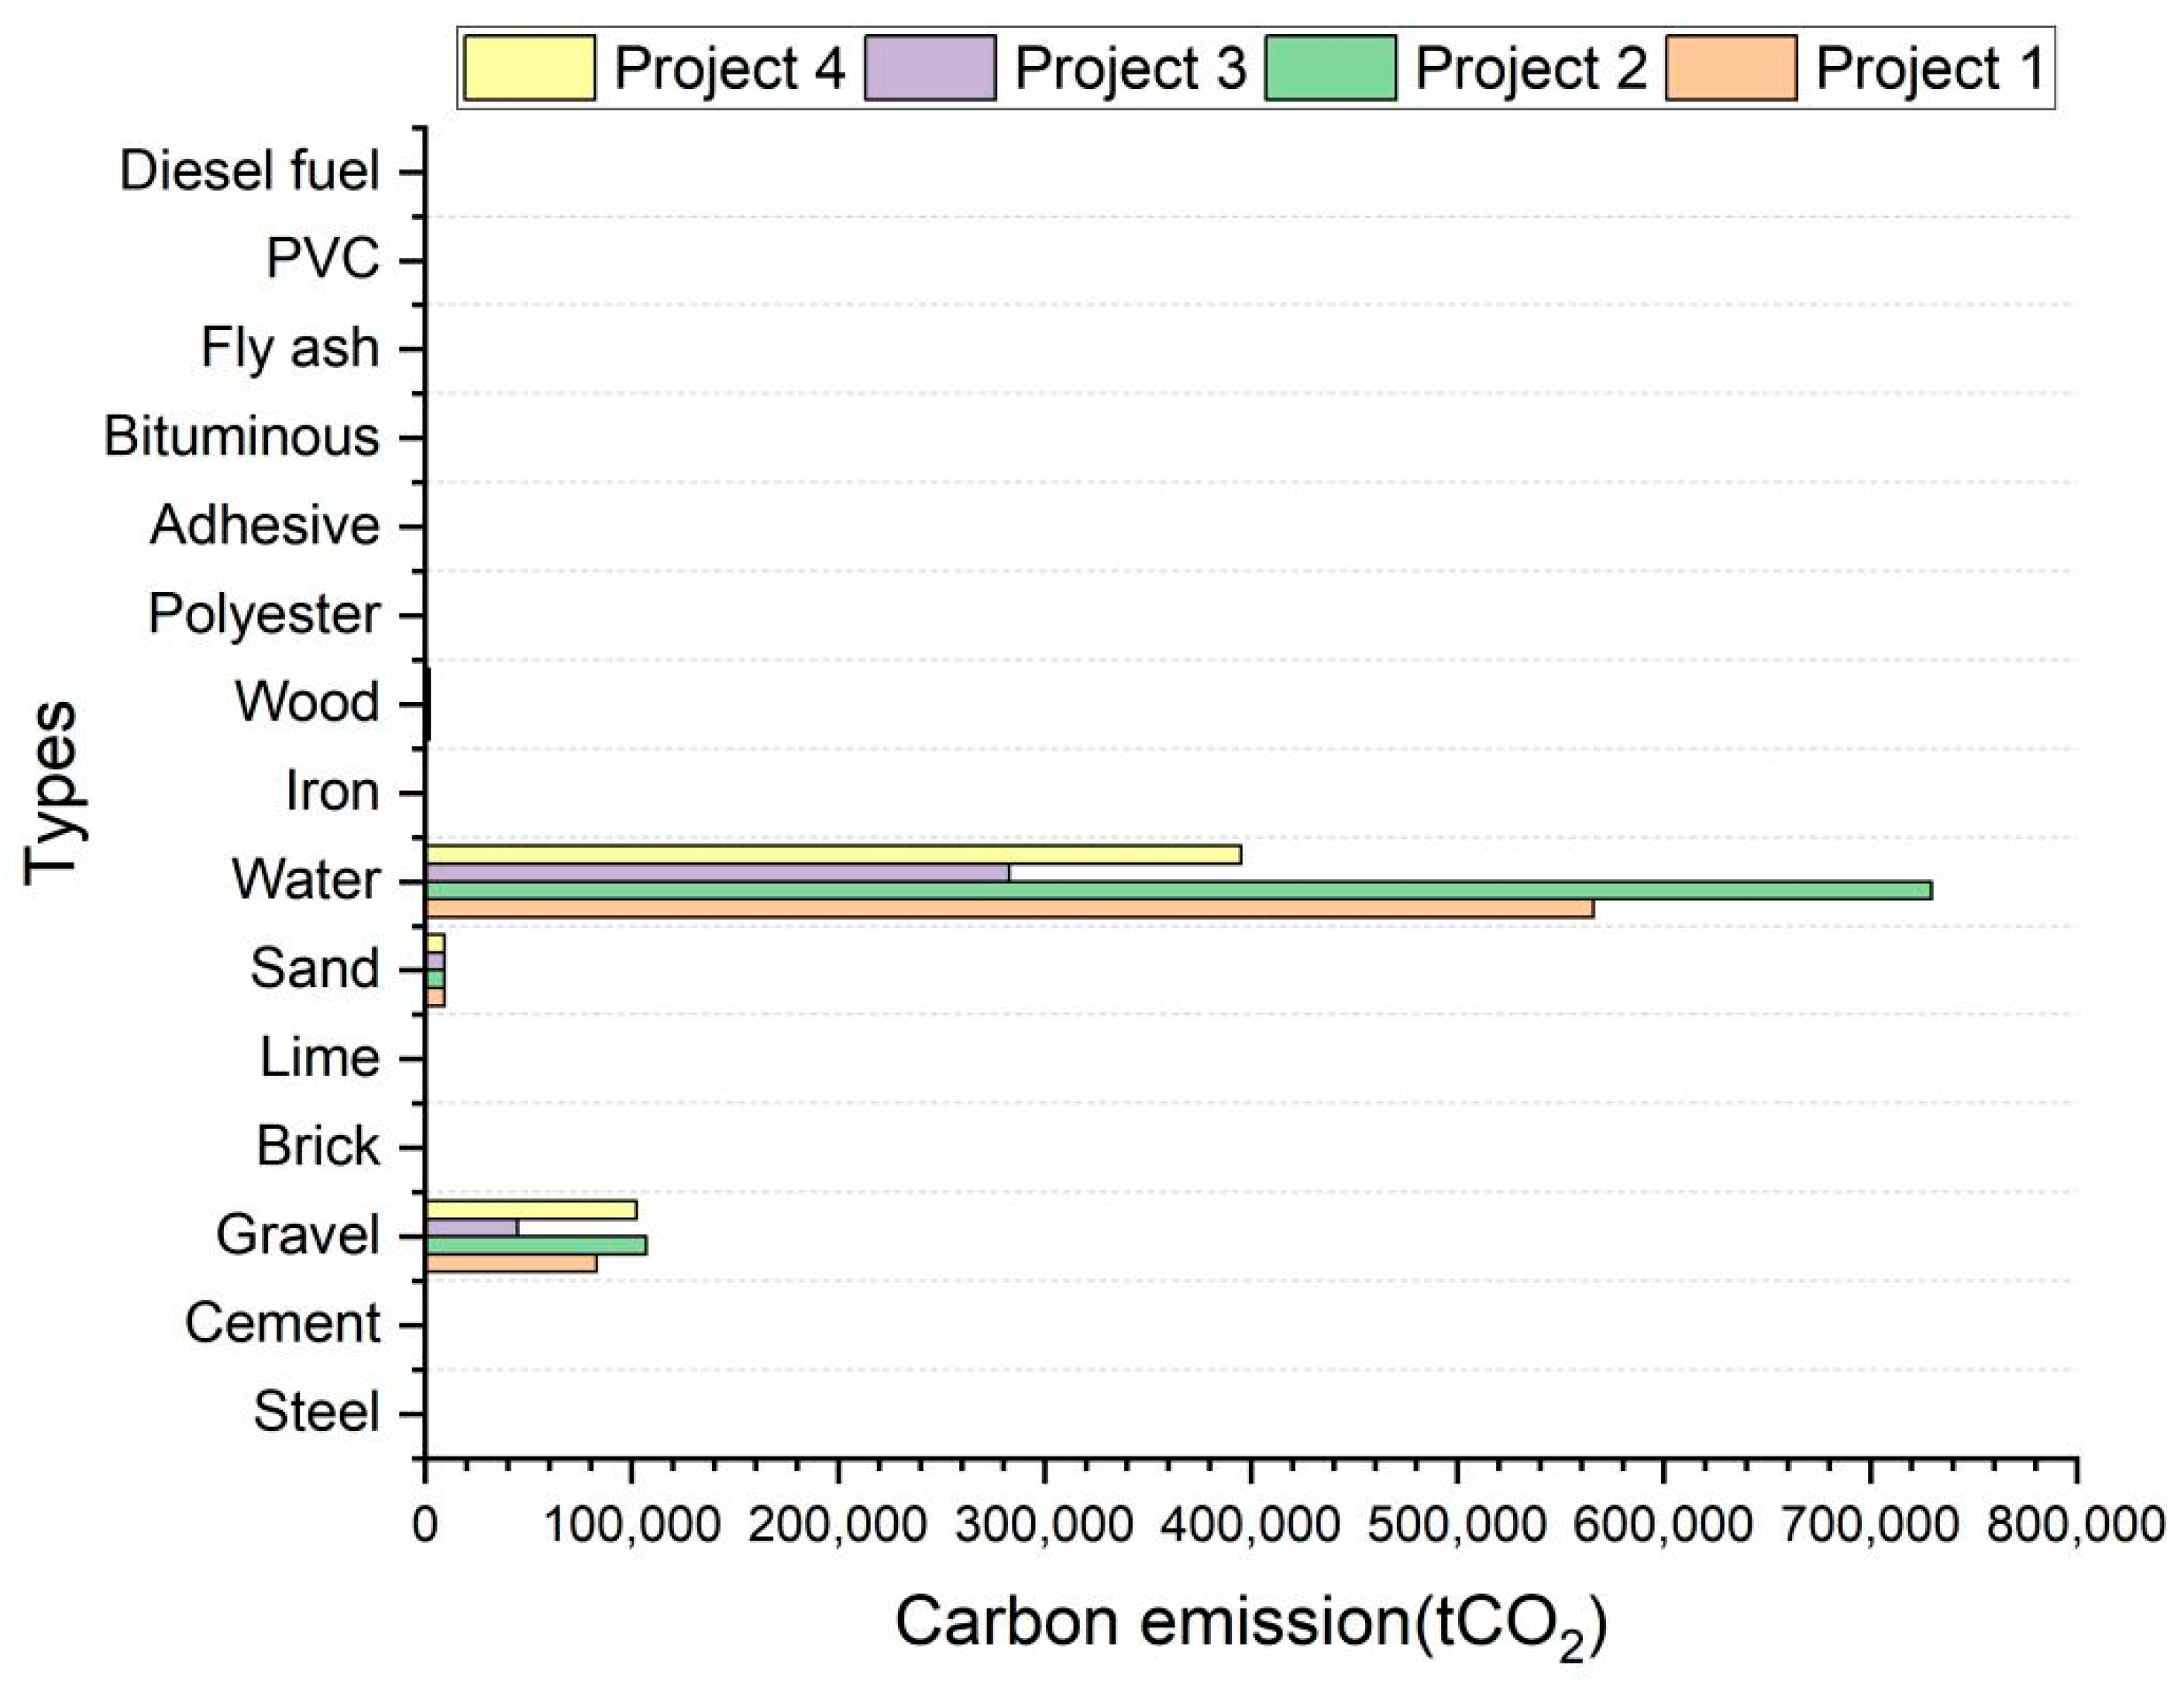
4.2.2. The Carbon Emission Comparative Analysis of Reconstruction Projects 1 to 4

Figure 15 and Figure 16 compare the critical carbon emission factors of the reconstruction projects. The water treatment process accounts for most of the carbon emissions, which were 516,600 tCO2 in project 1, 729,800 tCO2 in project 2, 282,900 tCO2 in project 3, and 395,240 tCO2 in project 4 (refer to Table A1 in Appendix A). Secondly, gravel also plays an important role (roughly 19.6%, 12.6%, 13.2%, and 20.1% in projects 1 to 4). In addition, other carbon emissions are minimal, which is also in line with the requirements of ecological engineering. The most important design requirement of this reconstruction project was to minimize the input of non-renewable resources and try to use natural materials to ensure the ecology of the whole project. Based on the core design concept, water and gravel were selected as the primary materials in Figure 15.

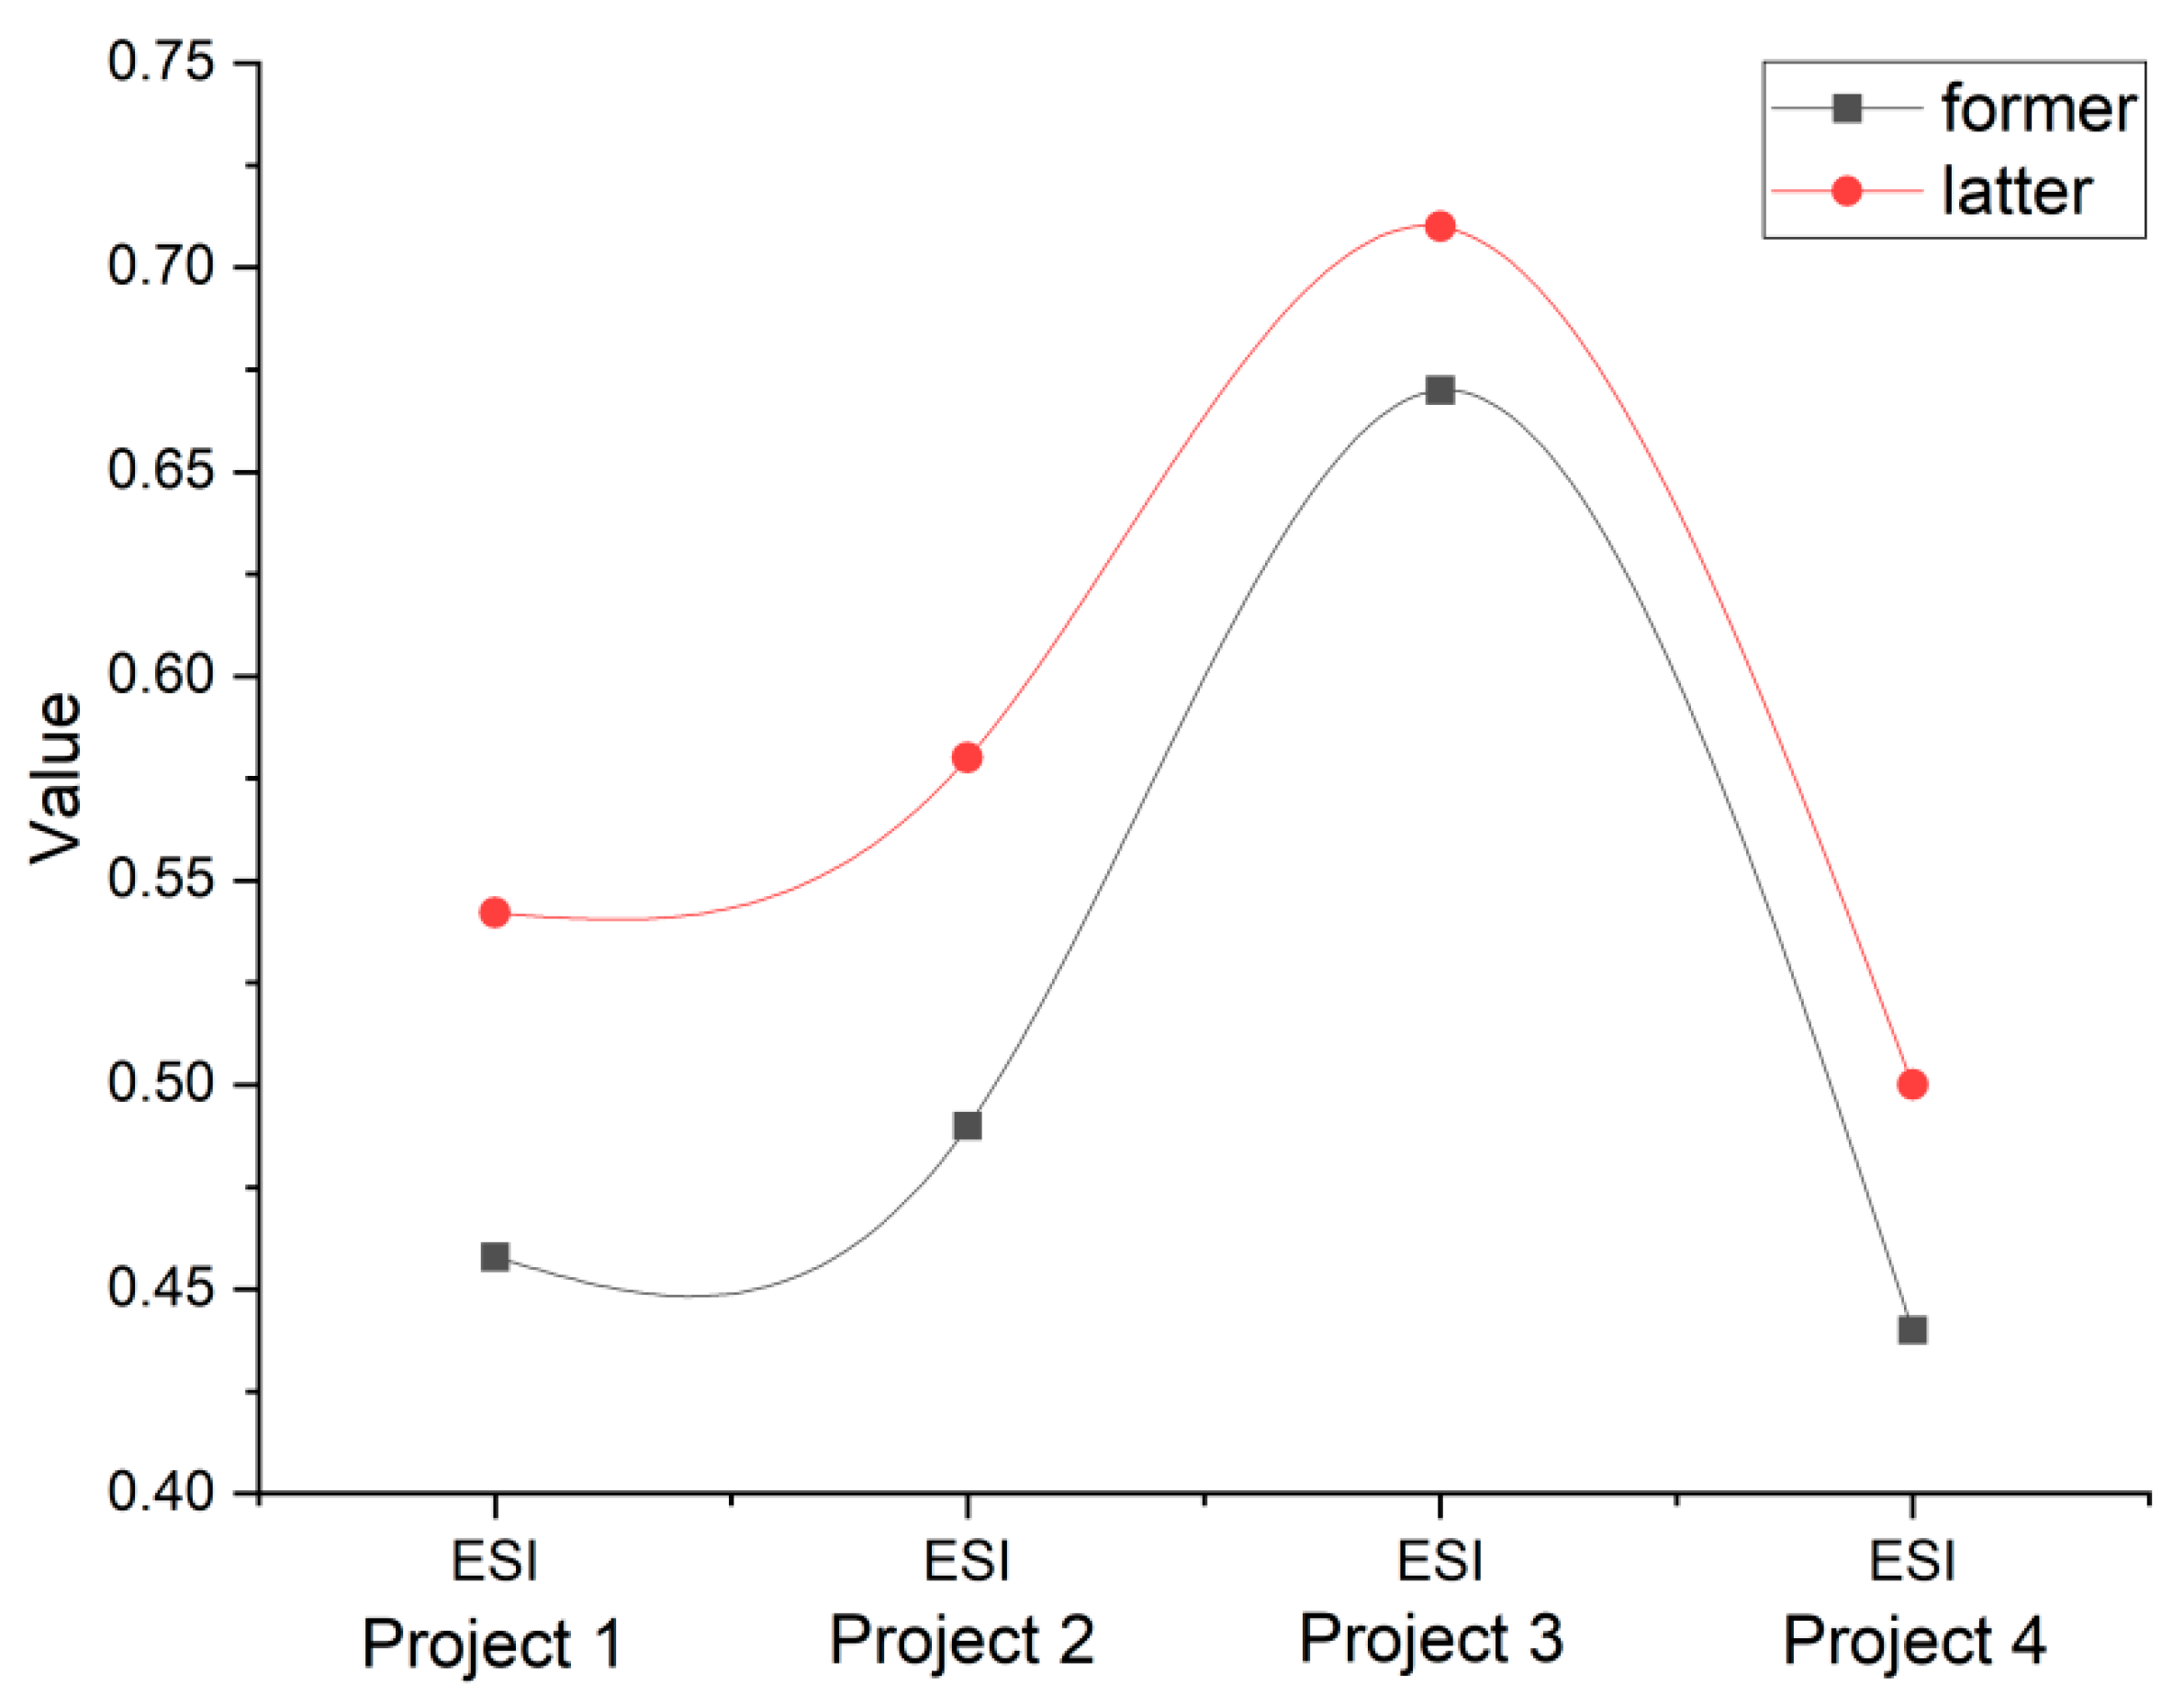
4.2.3. Carbon Sink Analysis

The natural carbon sink system analysis shows that the soil absorption of carbon dioxide is the main route. Based on the experimental sample of the Jinchuan River (Main river) basin, the mean carbon concentration in the soil along the river was 26.41 g/kg (1–20 cm), and the carbon density was 3.98 kg/m2. There are three types of regional variation coefficients, which are 0.45, 0.51, and 0.63. By estimating the carbon sink of the reconstructed area, the total carbon uptake is about 5000 t.
Soil under water in rivers also has an adsorption effect on carbon dioxide. The research area for this part is the sediment on the riverbed (20 cm thick), with an average organic carbon density of 40.92 t·hm-2. Based on the length of the entire river, which is 48.85 km, the preliminary calculation of the carbon sink of the river bottom soil sediment is 7996 t, indicating that the carbon sink capacity of the river bottom is stronger than that of terrestrial soils. In this calculation process, the difference in the riverbed is not considered.
To reinforce the banks of the river, a significant amount of concrete was used in the reconstruction projects. Concrete will absorb a certain amount of carbon dioxide in the process of curing and continuous carbonization, which can effectively reduce carbon dioxide emissions. According to the equation in Section 2.3 and concrete data collection from the four reconstruction projects, their comparisons have been conducted and analyzed in Figure 16. The research in this paper shows that the carbonization depth of concrete directly affects the amount of carbon dioxide absorption, which can be evaluated according to the work quantity of the reconstruction projects. In accordance with the service life estimate of 20 years, the carbon sinks of the four types of reconstruction projects are 600 t, 650 t, 680 t, and 720 t.
Through the comprehensive consideration of natural and artificial carbon sink systems, the four ecological reconstruction projects can reduce carbon emissions by 0.85% (project 1), 0.66% (project 2), 1.64% (project 3), and 1.09% (project 4).

4.3. Comparison with Existing Research Progress

Until now, for the study of the water landscape, the popular design means are ecological methods, such as emergy assessment, the ecological footprint method, carbon emission design, landscape pattern index, ecological security, etc. The similarity is that some scholars have studied the waterscape zone with a single method, rather than comprehensively. This is the limitation of current research and the direction that needs to be improved [48,49,50,51,52].
In this study, an LCA–emergy–carbon emission framework was designed and used to evaluate the ecological sustainability of the urban waterscape belt. Through the review in this paper, the research methodology of the ecological sustainability of the waterscape zone is expanded, which is conducive to the deepening and expansion of this kind of research.

5. Clean Energy Improvement Strategy

To enhance the ecological level and optimize carbon emissions, improvement measures need to be proposed. In this study, a clean energy (solar energy) input measure was adopted and implemented.
For a construction project, the use of renewable energy can improve the sustainability of the entire system and reduce carbon emissions simultaneously [53,54,55,56,57,58]. For example, if the utilization rate of renewable energy is increased by 20%, the environmental loading ratio will change significantly. The change in emergy parameters is shown in Table 6.
In Figure 17, the gaps between the former and latter values have been displayed. The most significant change is the environmental load rate in project 2 (15.3 difference), which is significantly reduced, followed by project 4 (11.9 difference), project 1 (11.4 difference), and project 3 (5.5 difference), which were all caused by the input of renewable energy. The increase in new energy input leads to an increase in renewable emergy and reduces the environmental load on the whole system. Simultaneously, the entire ecological level has been clearly enhanced, which can be verified in Figure 18. Among them, the order of change rates is project 1 (18.39%), project 2 (18.37%), project 4 (13.64%), and project 3 (5.97%). It demonstrates that the impact of clean energy on the four reconstructed systems is different, depending on the structure level of each reconstruction project system.

6. Conclusions

In this study, four ecological reconstruction projects along the Jinchuan River (main river) basin in Nanjing were conducted and analyzed to explore environmental sustainability based on the LCA–emergy method and the LCA–carbon emission approach.
From the view of LCA–emergy, the primary contributors have been found, which dominate the ecological emergy change in the whole reconstructed system. Taking reconstruction project 1 as an example, over a 20-year cycle, the emergy of the material production stage and maintenance phase account for 78.5% of the entire emergy, followed by the construction stage, transportation process, and design process stage. In view of emergy indicator analysis, by comparing with the original state from the view of ESI, the sustainability has been improved significantly (from 0.073 to 0.49/0.41/0.67/0.44) after carrying out the reconstruction works.
From the perspective of carbon emission, based on the core design concept, water and gravel were selected as the primary materials to reduce the amount of carbon emissions. The water treatment process accounted for the vast majority of carbon emissions, which were 516,600 tCO2 in project 1, 729,800 tCO2 in project 2, 282,900 tCO2 in project 3, and 395,240 tCO2 in project 4. Secondly, gravel also played an important role (roughly 19.6%, 12.6%, 13.2%, and 20.1% of projects 1 to 4). Through the comprehensive consideration of natural and artificial carbon sink systems, the four ecological reconstruction projects can reduce carbon emissions by 0.85% (project 1), 0.66% (project 2), 1.64% (project 3), and 1.09% (project 4).
To improve the ecological level of the entire rebuilt system, a clean energy improvement strategy was considered in this study, which had clear enhancements for the four reconstruction projects and testified to the effectiveness of the improvement measures.

Author Contributions

Conceptualization, J.Z.; investigation, D.Y.; formal analysis, J.Z. and Y.G.; methodology, J.Z.; resources, D.D.; writing—review and editing, J.Z. All authors have read and agreed to the published version of the manuscript.

Funding

This research received no external funding.

Institutional Review Board Statement

Not applicable.

Informed Consent Statement

Not applicable.

Data Availability Statement

This study did not report any data.

Acknowledgments

The authors are thankful for the support from Nanjing Institute of Technology to conduct this research.

Conflicts of Interest

The authors declare no conflict of interest.

Appendix A

Table A1. Comparison of carbon emissions across the four projects.
TypesProject 1Project 2Project 3Project 4Unit
Steel189.6189.6189.6189.6tCO2
Cement26.626.626.626.6tCO2
Gravel129,600107,20044,800102,400tCO2
Brick9.89.89.89.8tCO2
Lime316.8316.8316.8316.8tCO2
Sand13,052.0953895389538tCO2
Water516,600729,800282,900395,240tCO2
Iron43.143.143.143.1tCO2
Wood1999.51999.51999.51999.5tCO2
Polyester89.489.489.489.4tCO2
Adhesive7.27.27.27.2tCO2
Bituminous0.40.40.40.4tCO2
Fly ash119.5119.5119.5119.5tCO2
PVC33.333.333.333.3tCO2
Diesel fuel253.8253.8253.8253.8tCO2

References

  1. Beck, D.; Ferasso, M. Bridging ‘Stakeholder Value Creation’ and ‘Urban Sustainability’: The need for better integrating the Environmental Dimension. Sustain. Cities Soc. 2023, 89, 104316. [Google Scholar] [CrossRef]
  2. Hao, Z.; Wang, Y. Evaluation of socio-economic-ecological environmental benefits of urban renewal projects based on the coupling coordination degree. Environ. Sci. Pollut. Res. 2023, 30, 56946–56968. [Google Scholar] [CrossRef] [PubMed]
  3. Li, D.; Yan, S.; Chen, G. Effects of Urban Redevelopment on Surface Urban Heat Island. IEEE J. Sel. Top. Appl. Earth Obs. Remote Sens. 2023, 16, 2366–2373. [Google Scholar] [CrossRef]
  4. Ramsay, E.E.; Duffy, G.A.; Burge, K.; Taruc, R.R.; Fleming, G.M.; Faber, P.A.; Chown, S.L. Spatio-temporal development of the urban heat island in a socioeconomically diverse tropical city. Environ. Pollut. 2023, 316, 120443. [Google Scholar] [CrossRef] [PubMed]
  5. Odum, H.T. Environmental Accounting: Emergy and Environmental Decision Making; John and Wiley and Sons: Hoboken, NJ, USA, 1996; pp. 32–34. [Google Scholar]
  6. Mufan, Z.; Yong, G.; Hengyu, P.; Fei, W.; Dong, W. Ecological and socioeconomic impacts of payments for ecosystem services—A Chinese garlic farm case. J. Clean. Prod. 2021, 285, 124866. [Google Scholar] [CrossRef]
  7. Asgharipour, M.R.; Amiri, Z.; Campbell, D.E. Evaluation of the sustainability of four greenhouse vegetable production ecosystems based on an analysis of emergy and social characteristics. Ecol. Model. 2020, 424, 109021. [Google Scholar] [CrossRef]
  8. Bergquist, D.; Garcia-Caro, D.; Joosse, S.; Granvik, M.; Peniche, F. The Sustainability of Living in a “Green” Urban District: An Emergy Perspective. Sustainability 2020, 12, 5661. [Google Scholar] [CrossRef]
  9. Zhang, J.; Ma, L. Urban ecological security dynamic analysis based on an innovative emergy ecological footprint method. Environ. Dev. Sustain. 2021, 23, 16163–16191. [Google Scholar] [CrossRef]
  10. Santagata, R.; Zucaro, A.; Fiorentino, G.; Lucagnano, E.; Ulgiati, S. Developing a procedure for the integration of Life Cycle Assessment and Emergy Accounting approaches. The Amalfi paper case study. Ecol. Indic. 2020, 117, 106676. [Google Scholar] [CrossRef]
  11. Zhang, J.; Zhang, H.; Asutosh, A.T.; Sun, N.; Fu, X.; Wang, H.; Li, X. Ecological sustainability assessment of building glass industry in China based on the point of view of raw material emergy and chemical composition. Environ. Sci. Pollut. Res. 2023, 30, 40670–40697. [Google Scholar] [CrossRef] [PubMed]
  12. Cristiano, S.; Gonella, F. To build or not to build? Megaprojects, resources, and environment: An emergy synthesis for a systemic evaluation of a major highway expansion. J. Clean. Prod. 2019, 223, 772–789. [Google Scholar] [CrossRef]
  13. Yadegaridehkordi, E.; Hourmand, M.; Nilashi, M.; Alsolami, E.; Samad, S.; Mahmoud, M.; Alarood, A.A.; Zainol, A.; Majeed, H.D.; Shuib, L. Assessment of sustainability indicators for green building manufacturing using fuzzy multi-criteria decision making approach. J. Clean. Prod. 2020, 277, 122905. [Google Scholar] [CrossRef]
  14. Yang, L.; Wang, C.; Yu, H.; Yang, M.; Wang, S.; Chiu, A.S.; Wang, Y. Can an island economy be more sustainable? A comparative study of Indonesia, Malaysia, and the Philippines. J. Clean. Prod. 2019, 242, 118572. [Google Scholar] [CrossRef]
  15. Wang, X.; Liu, G.; Coscieme, L.; Giannetti, B.F.; Hao, Y.; Zhang, Y.; Brown, M.T. Study on the emergy-based thermodynamic geography of the Jing-Jin-Ji region: Combined multivariate statistical data with DMSP-OLS nighttime lights data. Ecol. Model. 2019, 397, 1–15. [Google Scholar] [CrossRef]
  16. Lee, D.J.; Brown, M.T. Estimating the Value of Global Ecosystem Structure and Productivity: A Geographic Information System and Emergy Based Approach. Ecol. Model. 2020, 439, 109307. [Google Scholar] [CrossRef]
  17. Fan, Y.; Meng, J.; Ye, H.; Wang, P.; Wang, Y.; Wang, Y. Sustainability and ecological efficiency of low-carbon power system: A concentrating solar power plant in China. J. Environ. Manag. 2021, 290, 112659. [Google Scholar] [CrossRef] [PubMed]
  18. Hou, M.; Braham, W.W. Land development in an urban megalopolis: A holistic environmental assessment of housing on Chongming Eco-island, China. J. Clean. Prod. 2021, 312, 127617. [Google Scholar] [CrossRef]
  19. Xie, B.; Zhang, X.; Lu, J.; Liu, F.; Fan, Y. Research on ecological evaluation of Shanghai port logistics based on emergy ecological footprint models. Ecol. Indic. 2022, 139, 108916. [Google Scholar] [CrossRef]
  20. Du, Y.-W.; Wang, Y.-C.; Li, W.-S. Emergy ecological footprint method considering uncertainty and its application in evaluating marine ranching resources and environmental carrying capacity. J. Clean. Prod. 2022, 336, 130363. [Google Scholar] [CrossRef]
  21. Zadehdabagh, N.; Monavari, S.M.; Kargari, N.; Taghavi, L.; Pirasteh, S. Sustainability of agroecosystems by indices: A comparative study between indicators of ecological footprint sustainability and emergy analysis; a case study in Dez catchment, Iran. Ecol. Model. 2022, 474, 110165. [Google Scholar] [CrossRef]
  22. Chen, X.; Wang, H.; Zhang, J.; Zhang, H.; Asutosh, A.T.; Wu, G.; Wei, G.; Shi, Y.; Yang, M. Sustainability Study of a Residential Building near Subway Based on LCA-Emergy Method. Buildings 2022, 12, 679. [Google Scholar] [CrossRef]
  23. Wang, Y.; Liu, G.; Cai, Y.; Giannetti, B.F.; Agostinho, F.; Almeida, C.M.V.B.; Casazza, M. The Ecological Value of Typical Agricultural Products: An Emergy-Based Life-Cycle Assessment Framework. Front. Environ. Sci. 2022, 10, 824275. [Google Scholar] [CrossRef]
  24. Tam, V.W.; Zhou, Y.; Illankoon, C.; Le, K.N. A critical review on BIM and LCA integration using the ISO 14040 framework. Build. Environ. 2022, 213, 108865. [Google Scholar] [CrossRef]
  25. Xu, J.; Teng, Y.; Pan, W.; Zhang, Y. BIM-integrated LCA to automate embodied carbon assessment of prefabricated buildings. J. Clean. Prod. 2022, 374, 133894. [Google Scholar] [CrossRef]
  26. Teng, Y.; Xu, J.; Pan, W.; Zhang, Y. A systematic review of the integration of building information modeling into life cycle assessment. Build. Environ. 2022, 221, 109260. [Google Scholar] [CrossRef]
  27. Hassan, S.R.; Megahed, N.A.; Eleinen, O.M.A.; Hassan, A.M. Toward a national life cycle assessment tool: Generative design for early decision support. Energy Build. 2022, 267, 112144. [Google Scholar] [CrossRef]
  28. Fnais, A.; Rezgui, Y.; Petri, I.; Beach, T.; Yeung, J.; Ghoroghi, A.; Kubicki, S. The application of life cycle assessment in buildings: Challenges, and directions for future research. Int. J. Life Cycle Assess. 2022, 27, 627–654. [Google Scholar] [CrossRef]
  29. Larsen, V.G.; Tollin, N.; Sattrup, P.A.; Birkved, M.; Holmboe, T. What are the challenges in assessing circular economy for the built environment? A literature review on integrating LCA, LCC and S-LCA in life cycle sustainability assessment, LCSA. J. Build. Eng. 2022, 50, 104203. [Google Scholar] [CrossRef]
  30. Cui, W.; Hong, J.; Liu, G.; Li, K.; Huang, Y.; Zhang, L. Co-Benefifits Analysis of Buildings Based on Different Renewal Strategies: The Emergy-Lca Approach. Int. J. Environ. Res. Public Health 2021, 18, 592. [Google Scholar] [CrossRef]
  31. Hu, S.; Zhang, Y.; Yang, Z.; Yan, D.; Jiang, Y. Challenges and opportunities for carbon neutrality in China’s building sector—Modelling and data. Build. Simul. 2022, 15, 1899–1921. [Google Scholar] [CrossRef]
  32. Huo, T.; Xu, L.; Liu, B.; Cai, W.; Feng, W. China’s commercial building carbon emissions toward 2060: An integrated dynamic emission assessment model. Appl. Energy 2022, 325, 119828. [Google Scholar] [CrossRef]
  33. Zhang, N.; Luo, Z.; Liu, Y.; Feng, W.; Zhou, N.; Yang, L. Towards low-carbon cities through building-stock-level carbon emission analysis: A calculating and mapping method. Sustain. Cities Soc. 2022, 78, 103633. [Google Scholar] [CrossRef]
  34. Gan, L.; Liu, Y.; Shi, Q.; Cai, W.; Ren, H. Regional inequality in the carbon emission intensity of public buildings in China. Build. Environ. 2022, 225, 109657. [Google Scholar] [CrossRef]
  35. Wang, X.; Du, Q.; Lu, C.; Li, J. Exploration in carbon emission reduction effect of low-carbon practices in prefabricated building supply chain. J. Clean. Prod. 2022, 368, 133153. [Google Scholar] [CrossRef]
  36. Liu, W.; Zuo, B.; Qu, C.; Ge, L.; Shen, Q. A reasonable distribution of natural landscape: Utilizing green space and water bodies to reduce residential building carbon emissions. Energy Build. 2022, 267, 112150. [Google Scholar] [CrossRef]
  37. Amoruso, F.M.; Sonn, M.-H.; Schuetze, T. Carbon-neutral building renovation potential with passive house-certified components: Applications for an exemplary apartment building in the Republic of Korea. Build. Environ. 2022, 215, 108986. [Google Scholar] [CrossRef]
  38. Chen, C.; Bi, L. Study on spatio-temporal changes and driving factors of carbon emissions at the building operation stage—A case study of China. Build. Environ. 2022, 219, 109147. [Google Scholar] [CrossRef]
  39. Gan, L.; Ren, H.; Cai, W.; Wu, K.; Liu, Y.; Liu, Y. Allocation of carbon emission quotas for China’s provincial public buildings based on principles of equity and efficiency. Build. Environ. 2022, 216, 108994. [Google Scholar] [CrossRef]
  40. Grinham, J.; Fjeldheim, H.; Yan, B.; Helge, T.D.; Edwards, K.; Hegli, T.; Malkawi, A. Zero-carbon balance: The case of HouseZero. Build. Environ. 2021, 207, 108511. [Google Scholar] [CrossRef]
  41. Partridge, L.E.; Loughnane, E.J. Committed carbon-upgrading existing buildings. Struct. Des. Tall Spéc. Build. 2008, 17, 989–1002. [Google Scholar] [CrossRef]
  42. Nadoushani, Z.S.M.; Akbarnezhad, A. Effects of structural system on the life cycle carbon footprint of buildings. Energy Build. 2015, 102, 337–346. [Google Scholar] [CrossRef]
  43. Ioannidou, D.; Sonnemann, G.; Suh, S. Do we have enough natural sand for low-carbon infrastructure? J. Ind. Ecol. 2020, 24, 1004–1015. [Google Scholar] [CrossRef]
  44. Sheykhi, M.; Chahartaghi, M.; Hashemian, S.M. Performance Evaluation of a Combined Heat and Power System with Stirling Engine for Residential Applications. Iran. J. Sci. Technol. Trans. Mech. Eng. 2019, 44, 975–984. [Google Scholar] [CrossRef]
  45. Zhang, J.; Srinivasan, R.S.; Peng, C. A Systematic Approach to Calculate Unit Emergy Values of Cement Manufacturing in China Using Consumption Quota of Dry and Wet Raw Materials. Buildings 2020, 10, 128. [Google Scholar] [CrossRef]
  46. Zhang, J.; Srinivasan, R.S.; Peng, C. Ecological Assessment of Clay Brick Manufacturing in China Using Emergy Analysis. Buildings 2020, 10, 190. [Google Scholar] [CrossRef]
  47. Shi, T. Carbon Sequestration in Urban Ecosystem; China Architecture and Building Press: Beijing, China, 2022; Volume 6. [Google Scholar]
  48. Wu, H.; Fang, S.; Zhang, C.; Hu, S.; Nan, D.; Yang, Y. Exploring the impact of urban form on urban land use efficiency under low-carbon emission constraints: A case study in China’s Yellow River Basin. J. Environ. Manag. 2022, 311, 114866. [Google Scholar] [CrossRef]
  49. Liu, X.; Huang, J.; Liu, W.; Ding, Y.; Ge, L. Research on the Coastal Landscape Pattern Index in the District of Nansha. Sustainability 2023, 15, 3378. [Google Scholar] [CrossRef]
  50. Cheng, Q. Study of ecological water-demand security in the Linghekou Reserve of north-eastern China, based on landscape pattern. Mar. Freshw. Res. 2022. [CrossRef]
  51. Li, J. Water Environment Governance of Urban and Rural Spaces Integrating Natural Ecological Landscape Design Method. J. Environ. Public Health 2022, 2022, 3623141. [Google Scholar] [CrossRef]
  52. Cao, Z.; Wan, B.; Xiao, Y.; Wu, M.; Tan, X.; Zhang, Q.; Wang, D. Exploring the Impact of Landscape Ecological Risk on Water Quality in the Danjiangkou Reservoir, China. Earth Space Sci. 2022, 9, e2022EA002363. [Google Scholar] [CrossRef]
  53. Brown, M.T.; Campbell, D.E.; De Vilbiss, C.; Ulgiati, S. The geobiosphere emergy baseline: A synthesis. Ecol. Model. 2016, 339, 92–95. [Google Scholar] [CrossRef]
  54. Kim, S.K.; Park, S. Impacts of renewable energy on climate vulnerability: A global perspective for energy transition in a climate adaptation framework. Sci. Total Environ. 2023, 859, 160175. [Google Scholar] [CrossRef]
  55. Shang, Y.; Han, D.; Gozgor, G.; Mahalik, M.K.; Sahoo, B.K. The impact of climate policy uncertainty on renewable and non-renewable energy demand in the United States. Renew. Energy 2022, 197, 654–667. [Google Scholar] [CrossRef]
  56. Zhao, J.; Dong, K.; Dong, X.; Shahbaz, M. How renewable energy alleviate energy poverty? A global analysis. Renew. Energy 2022, 186, 299–311. [Google Scholar] [CrossRef]
  57. Chu, L.K. The role of energy security and economic complexity in renewable energy development: Evidence from G7 countries. Environ. Sci. Pollut. Res. 2023, 30, 56073–56093. [Google Scholar] [CrossRef] [PubMed]
  58. Ji, M.; Zhang, W.; Xu, Y.; Liao, Q.; Klemeš, J.J.; Wang, B. Optimisation of multi-period renewable energy systems with hydrogen and battery energy storage: A P-graph approach. Energy Convers. Manag. 2023, 281, 116826. [Google Scholar] [CrossRef]
Figure 1. Research Framework of the waterscape belt reconstruction project.
Water 15 02345 g001
Figure 2. Emergy diagram of water landscape belt reconstruction system.
Water 15 02345 g002
Figure 3. Low-carbon design methods for whole life cycle building systems.
Water 15 02345 g003
Figure 4. Main status quo of the urban rivers in the study area.
Water 15 02345 g004
Figure 5. The scenes after ecological reconstruction projects.
Water 15 02345 g005
Figure 6. Contribution rate of each stage (reconstruction project 1).
Water 15 02345 g006
Figure 7. ESI comparisons before and after renovation.
Water 15 02345 g007
Figure 8. Trend chart of three critical indicators.
Water 15 02345 g008
Figure 9. Sensitivity change of the original state under Hypothesis H1.
Water 15 02345 g009
Figure 10. Sensitivity changes of four reconstruction projects under Hypothesis H1.
Water 15 02345 g010
Figure 11. Sensitivity change of the original state under Hypothesis H2.
Water 15 02345 g011
Figure 12. Sensitivity changes of the four reconstruction projects under Hypothesis H2.
Water 15 02345 g012
Figure 13. Dominated carbon emission differentiation.
Water 15 02345 g013
Figure 14. Design element selection in reconstruction project 1.
Water 15 02345 g014
Figure 15. Carbon emission amount change in reconstruction projects 1 to 4.
Water 15 02345 g015
Figure 16. Carbon emission amount comparison.
Water 15 02345 g016
Figure 17. Emergy indicator improvements based on clear energy replacement.
Water 15 02345 g017
Figure 18. ESI indicator changes from projects 1 to 4.
Water 15 02345 g018
Table 1. Eco-efficiency emergy indicators.
No.IndicatorsSymbolMeaning
1Environmental loading ratioELRNatural environmental stress
2Emergy yield ratioEYRProduction efficiency
3Emergy sustainability indicatorESIEnvironmental sustainability degree
4Unit emergy valuesUEVsEntire system efficiency
Table 2. Part of the shoreline investigation and reconstruction.
Name
(Branch/River)
FormHard Shoreline ProportionEcological Shoreline
Ratio
Ecological
Proportion after Reconstruction
Pearl RiverMasonry and ecological shoreline90%10%75%
Northern sectionMasonry and ecological shoreline80%20%75%
Eastern sectionMasonry and ecological shoreline90%10%75%
Middle sectionMasonry and ecological shoreline85%15%75%
Southern sectionMasonry and ecological shoreline92%8%75%
Outside the Qinhuai RiverMasonry and ecological shoreline50%50%75%
Qingxi RiverMasonry and ecological shoreline90%10%75%
Yudai RiverMasonry and ecological shoreline95%5%75%
East Jade Belt RiverMasonry and ecological shoreline93%7%75%
West Jade Belt RiverMasonry and ecological shoreline93%7%75%
Mingyu RiverMasonry and ecological shoreline85%15%75%
Binhu districtMasonry and ecological shoreline95%5%75%
Table 3. Emergy indexes list.
No.IndicatorsValues
Original state
1Emergy yield ratio (EYR)26.1
2Environmental loading ratio (ELR)357.9
3Emergy sustainability indicator (ESI)0.073
Reconstruction project 1
4Emergy yield ratio (EYR)39.6
5Environmental loading ratio (ELR)79.3
6Emergy sustainability indicator (ESI)0.49
Reconstruction project 2
7Emergy yield ratio (EYR)57.8
8Environmental loading ratio (ELR)143.2
9Emergy sustainability indicator (ESI)0.41
Reconstruction project 3
10Emergy yield ratio (EYR)64.9
11Environmental loading ratio (ELR)96.9
12Emergy sustainability indicator (ESI)0.67
Reconstruction project 4
13Emergy yield ratio (EYR)48.3
14Environmental loading ratio (ELR)109.5
15Emergy sustainability indicator (ESI)0.44
Table 4. Sensitivity change list.
No.IndicatorsFormer ValueHypothesis H1Hypothesis H2
Latter ValueLatter Value
Original state
1EYR26.128.826.3
2ELR357.9369.3336.9
3ESI0.0730.0770.078
Reconstruction project 1
4EYR39.643.339.5
5ELR79.383.275.9
6ESI0.490.520.520
Reconstruction project 2
7EYR57.861.956.5
8ELR143.2141.7129.3
9ESI0.410.440.437
Reconstruction project 3
10EYR64.966.460.6
11ELR96.9128.2117.0
12ESI0.670.520.518
Reconstruction project 4
13EYR48.354.349.5
14ELR109.5110.6100.9
15ESI0.440.490.491
Table 5. The carbon emission of reconstruction project 1.
ItemDataUnitCarbon Emission FactorsCarbon EmissionUnit
Steel7.10 × 104kg2.67 tCO2/t189.6tCO2
Cement3.80 × 105kg0.07 tCO2/t26.6tCO2
Gravel8.10 × 106kg16 kgCO2/kg129,600tCO2
Brick4.10 × 104kg0.24 kgCO2/kg9.8tCO2
Lime7.20 × 105kg0.44 tCO2/t316.8tCO2
Sand5.20 × 106kg2.51 kgCO2/t13,052.0tCO2
Water6.30 × 108m30.82 kgCO2/m3516,600tCO2
Iron2.10 × 104kg2.05 tCO2/t43.1tCO2
Wood6.45 × 106kg0.31 kgCO2/kg1999.5tCO2
Polyester1.23 × 103kg72.65tCO2/t89.4tCO2
Adhesive6.51 × 103kg1.1 kgCO2/kg7.2tCO2
Bituminous9.52 × 103kg0.04 kgCO2/kg0.4tCO2
Fly ash6.64 × 105kg0.18 tCO2/t119.5tCO2
PVC6.95 × 103kg4.79 kgCO2/kg33.3tCO2
Diesel fuel6.68 × 104kg3.797 tCO2/t253.8tCO2
Table 6. Improvement in emergy indexes.
No.IndicatorsFormer Values Latter Values
Reconstruction project 1
1Emergy yield ratio (EYR)39.639.6
2Environmental loading ratio (ELR)79.368.3
3Emergy sustainability indicator (ESI)0.490.58
Reconstruction project 2
4Emergy yield ratio (EYR)57.857.8
5Environmental loading ratio (ELR)143.2117.9
6Emergy sustainability indicator (ESI)0.410.49
Reconstruction project 3
7Emergy yield ratio (EYR)64.964.9
8Environmental loading ratio (ELR)96.991.4
9Emergy sustainability indicator (ESI)0.670.71
Reconstruction project 4
10Emergy yield ratio (EYR)48.348.3
11Environmental loading ratio (ELR)109.597.6
12Emergy sustainability indicator (ESI)0.440.50
Disclaimer/Publisher’s Note: The statements, opinions and data contained in all publications are solely those of the individual author(s) and contributor(s) and not of MDPI and/or the editor(s). MDPI and/or the editor(s) disclaim responsibility for any injury to people or property resulting from any ideas, methods, instructions or products referred to in the content.

