Article

Effect of Autumn Irrigation on Salt Leaching under Subsurface Drainage in an Arid Irrigation District

1
Chinese-Israeli International Center for Research and Training in Agriculture, China Agricultural University, Beijing 100083, China
2
Center for Agricultural Water Research, China Agricultural University, Beijing 100083, China
*
Author to whom correspondence should be addressed.
Water 2023, 15(12), 2296; https://doi.org/10.3390/w15122296
Submission received: 30 May 2023 / Revised: 14 June 2023 / Accepted: 17 June 2023 / Published: 20 June 2023
(This article belongs to the Special Issue Coupling Effect of Water and Fertilizer on Crops in Salinized Soil)

Abstract

:
Non-growing season irrigation and farmland subsurface drainage play a crucial role in salt leaching and salinization control in arid irrigation areas. This study aimed to investigate the reduction of autumn irrigation quotas and drainage discharge while maintaining soil moisture retention and reducing soil salinization. Field experiments were conducted with different autumn irrigation quotas (160 mm for SD1, 180 mm for SD2, and 200 mm for SD3) combined with subsurface drainage (1.5 m drain depth and 45 m spacing). A control treatment (referred to as CK) without subsurface drainage received 200 mm of irrigation. The results showed that, after 31 days of autumn irrigation, the groundwater depth in all three subsurface drainage plots stabilized to 1.5 m, with the CK being 0.2–0.3 m shallower compared to the SD plots. The mean soil water content in the 0–150 cm soil layer of the SD1, SD2, SD3, and CK after autumn irrigation was 0.36, 0.39, 0.41, and 0.42 cm3cm−3, respectively. The combination of autumn irrigation and subsurface drainage significantly reduced the soil salt content. The mean desalination rates in the root zone (0–60 cm) soil layer were 57.5%, 53.7%, 51.9%, and 45.1% for the SD3, SD2, CK, and SD1, respectively. The mean desalination rate of 60–150 cm was not significantly different between the SD2 and SD3 (p > 0.05), and both were significantly higher than that of the SD1 and CK (p < 0.05). The drainage discharge was 31, 36, and 40 mm in the SD1, SD2 and SD3, respectively. The amount of salt discharge through the drain pipe increased with increasing irrigation quota, which was 1.22 t/ha, 1.41 t/ha, and 1.50 t/ha for the SD1, SD2, and SD3, respectively. Subsurface drainage is an effective way to prevent salt accumulation in the soil, and an autumn irrigation quota of 180 mm is recommended for leaching of salinity in the Hetao Irrigation District. These findings provide valuable insights into optimizing irrigation practices and managing soil salinization in arid regions.

Graphical Abstract

1. Introduction

Soil salinization is a significant constraint on the functional roles of agricultural soil ecosystems in arid regions globally [1,2]. It considerably inhibits crop growth and leads to increased groundwater salinization, particularly in arid to semiarid environments. Almost 831 million hectares (Mha) of the world’s land area are estimated to be adversely affected by salt, with 52 percent of that area under sodic conditions and 48 percent under saline conditions [3]. As an important agricultural production area, the Hetao Irrigation District, with a total irrigation area of 573,300 ha, is one of the three largest irrigation districts in China [4,5]. The specific hydrogeological and climatic conditions in the Hetao Irrigation District lead to agricultural water utilization depending mainly on the diversion of water from the Yellow River. However, unsuitable irrigation management in the Hetao Irrigation District leads to a tremendous waste of water resources, while the disproportionate ratio of irrigation to drainage in the Hetao Irrigation District causes the groundwater level to rise seasonally [6].
The Hetao Irrigation District is one of the largest salinized irrigation districts in China, with salinized land covering approximately 39.4 × 10⁴ ha, which accounts for 68.72% of the total arable land area. Salinity is introduced to farmland either through irrigation with water from the Yellow River or by capillary rise through groundwater, thus causing a serious problem of secondary salinization in cultivated land [7]. The effective utilization of water resources and reduction of soil salinization levels have become important influencing factors to achieve high-quality development in agriculture and maintain sustainability in ecology [8,9]. Salinity gradually accumulates in soil during the crop growing season in the Hetao Irrigation District, and the soil can reach moderate or severe salinization by the end of the crop growth period [10]. Ren et al. [11] found that the temporal variation in soil salinity was also significant, with the proportion of salt-affected soil at the regional scale increasing from 28% to 42% by the end of the growing season.
The global water crisis is gradually worsening, with water resources in many regions facing an increasing threat of overuse and misuse [12]. In the last few decades, the average annual amount of water diverted from the Yellow River has been approximately 4.8 billion m3 [13,14]. However, due to the intensifying demand in the Yellow River basin, the plan is to reduce the amount of water diverted from the Yellow River to the Hetao Irrigation District to 4 billion m3 [15]. Autumn irrigation, which is a traditional agricultural water management method used to leach excessive salinization and maintain soil water content, accounts for 36.6% of the total annual irrigation volume in the Hetao Irrigation District. Autumn irrigation is a necessary and effective way to inhibit the soil salinity and provide good soil moisture for the sowing of spring crops in the next year [16,17,18]. Tan et al. [19] found that, after autumn irrigation, the ice cover had a positive effect on soil salinization control and moisture preservation according to the field-scale survey and PCA. Therefore, future reductions in water resources applied to farmland will severely limit agricultural productivity in the Hetao Irrigation District if optimized water management is not adapted. Developing a water-saving autumn irrigation schedule to relieve salinization and improve water use efficiency is critical to the sustainable development of agriculture.
To maintain a balance of soil salinity in the root zone of an irrigation district on a regional scale, the ratio of drainage to irrigation needs to be at least 10–15% [20,21,22]. Subsurface drainage is an important measure for reducing the level of salinization and alkalization in cultivated land [23]. It can effectively control groundwater levels, thereby preventing the accumulation of soil salinity [24,25,26]. By discharging infiltration water with high salinity formed by soil leaching in the outside of the system, subsurface drainage can help to maintain a more stable soil salinity [27]. Mao et al. [28] investigated salt accumulation and leaching patterns in the root zone of the soil using the UBMOD model. They found that the autumn irrigation quota should be determined according to two factors to achieve salinity balance in the Hetao Irrigation District: the hydrological year and the mineralization of the irrigation water. Related experiments and model simulations have shown that combining subsurface drainage with a certain leaching fraction during the crop growth period can significantly improve soil salinity in farmland [29]. Malak Shahi et al. [30] used different arrangements of subsurface drainage to control groundwater levels and investigated the response of evapotranspiration to fluctuations in groundwater levels in paddy fields. Zhang et al. [31] conducted a simulation study on the spatiotemporal variation characteristics of the water and salt in coastal saline soils under flood irrigation and subsurface drainage.
Previous studies have mainly focused on the quantification of water and salt transportation and salinization reduction in the root zone (less than 1 m) under subsurface drainage. Few field experiments have focused on soil water and salt balance in the 0–150 cm soil layer and shallow groundwater responses to different autumn irrigation amounts, especially under subsurface drainage conditions. The objectives of this study were to (1) understand the change in soil water content, salinity of the soil profile, and the dynamics of groundwater when autumn irrigation was applied under subsurface drainage, (2) analyze the water and salt balance in the experimental area, and (3) propose an appropriate autumn irrigation quota for saline soil to ensure the leaching of successive salinity at a certain groundwater level.

2. Materials and Methods

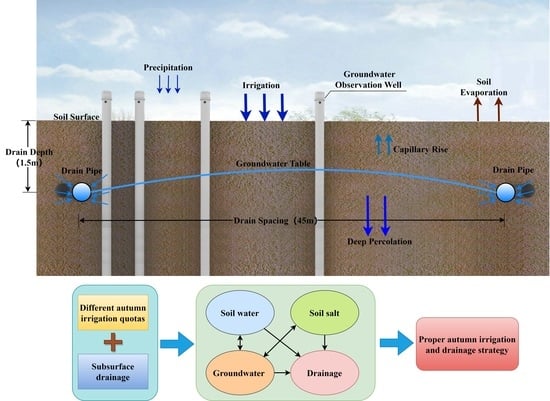
2.1. Experimental Region and Site

The field experiments were conducted at Hetao Experimental Station, located in the Yongji irrigation area of the Hetao Irrigation District, Inner Mongolia (107°39′ E, 41°92′ N, 1045 m above sea level). The area has a mid-temperate semiarid continental climate, with an average annual temperature of 3.8–7.5 °C and a frost-free period of 130–150 d. The average annual rainfall is 140–280 mm, while the pan evaporation ranges from 2032–2587 mm, which results in an evaporation-to-precipitation ratio greater than 10. Approximately 80% of the precipitation occurs from March to October, and the annual groundwater depth ranges from 0.8 m–2.5 m. During the autumn irrigation period, the average temperature is 6.95 °C, and the effective precipitation is 2.0 mm in the experimental area (Figure 1).

2.2. Experiment Description

The soil texture of the experimental site is sandy loam or silty loam, and the basic physical properties of the soil profile are shown in Table 1. The saturated hydraulic conductivity of soil (Ks) at a depth of 0–150 cm was measured in situ using the Guelph permeameter. At the end of the crop growth period, the groundwater depth is shallow, and the total dissolved solid of groundwater is relatively high. Strong evaporation intensifies the salinization of farmland soil, thus leading to moderate or severe levels of salinization. Seven drain pipes were buried at a depth of 1.5 m, with a spacing of 45 m. The diameter of the drain pipe was 110 mm, and its slope was 2‰. Geotextiles and mineral materials, including graded gravel and sand, were used as filtering materials around the drain pipes. The drain pipes were all connected to the collection pipes, and the drainage flow rate of each subsurface drainage plot was recorded in real time by electromagnetic flow meters, as shown in Figure 2. The leaching quotas in the subsurface drainage experimental region were 160 mm (SD1), 180 mm (SD2), and 200 mm (SD3). The leaching quota for the control treatment (CK) was set at 200 mm. The CK plot was located 120 m away from the SD plot, and no subsurface drainage was installed in it. Thus, the influence of subsurface drainage on the CK plot could be considered negligible.

2.3. Measurements

Autumn irrigation was conducted one time on 25 October 2020. The autumn irrigation stage starts from 18 October and ends on 26 November. Soil samples were collected at both the initiation and end of the autumn irrigation period from multiple sampling points. The sampling points were chosen according to the distance from the drain pipes in the subsurface drainage plots (SD1–SD3), which were 0, 2, 6, 13, and 22.5 m, respectively. Soil samples were taken from the upper layer (0–10 cm and 10–20 cm) every 20 cm from 20 to 120 cm and at 30 cm from 120 to 150 cm. Three replicates were collected for each treatment. Soil water content was measured using the thermos-gravimetric method. The soil samples were naturally dried, ground, and then passed through a 2 mm fine sieve, and the soil extract was prepared according to the ratio of soil to water mass at 1:5; they were then shaken and left to stand for more than 2 h [32]. The electrical conductivity EC 1:5 (ms cm−1) of the extract was measured by a conductivity meter. The soil salt content (SSC, g kg−1) was calculated by the empirical formula SSC = 2.882EC1:5 + 0.183 [33].
The irrigation channels were designed with a standard concrete trapezoidal cross-section, and flow meters were used to monitor the flow of channels, thereby controlling the amount of irrigation water in each plot. The electrical conductivity (EC, μs cm−1) of the Yellow River water used for irrigation was measured at 710 μs/cm, which was converted to mineralization according to the empirical formula TDS = 0.69 × EC/1000 (TDS is the total dissolved solids, g L−1) [34,35]. The total dissolved solid content of the irrigated water was 0.49 g/L. The electrical conductivity of the drainage water was sampled and measured every day for each SD during the autumn irrigation period. Four groundwater observation wells were set up at distances of 2 m, 6 m, 13 m, and 22.5 m from the drain pipe, respectively, in three subsurface drainage plots. Hobo water level logger-U20 (Onset Computer Corp., Bourne, MA, USA) devices were installed in the observation wells for daily monitoring of groundwater depth at different horizontal distances from the drain pipe. The drainage volume of different subsurface drainage plots was recorded and counted daily during the autumn irrigation period. Soil evaporation (Ea) was measured by weighing microlysimeters. The microlysimeters were divided into two parts: the inner tube and the outer tube; both were made of PVC. The height of both the inner and outer tubes was 200 mm, and the diameters were 160 mm and 200 mm, respectively. The soil in the microlysimeters was replaced every 2–3 days to ensure consistent moisture content with the farm. The bottom of the inner tube was fixed with a 12-mesh double layer gauze. Three replicates of microlysimeters were set up in different plots and weighed every day at noon using an electronic balance.

2.4. Data Analysis Methodology

Soil water storage is calculated as follows:
W n = n = 1 8 10 H n × θ n ,
where W n is the water storage of the n soil layer per unit area (mm), H n is the thickness of the corresponding soil layer (cm), and θ n  is the water content of soil in the corresponding soil layer (cm3 cm−3).
The change in soil water storage and desalination rate is defined as the percentage variation in soil water content and salt content relative to the initial condition. The two indicators are used to evaluate the joint performance of autumn irrigation and subsurface drainage in water storage change and desalination. The change in soil water storage is given by
S w c = W i + 1 W i W i × 100 % ,
where S w c is the change rate of soil water storage (%), W i is the soil water storage at the beginning of the stage (mm), and W i + 1 is the soil water storage at the end of the stage (mm).
The soil desalination rate is calculated using Equation (3):
D s a = S S C i S S C i + 1 S S C i × 100 % ,
where D s a is the desalination rate (%), S S C i is the soil salt content at 12 o’clock noon on that day (g), and S S C i + 1 is the soil salt content at 12 o’clock noon on the next day (g).
The net deep percolation ( N p ) is calculated through the soil water balance. The water balance equation is expressed as:
N p = P r + I E a D W ,
where P r is the effective precipitation (mm), I is the irrigation (mm), E a is the soil evaporation (mm), D is the subsurface drainage (mm), and W is the variation in soil water storage (0–150 cm) between the end and beginning of the autumn irrigation period (mm).
The average daily soil evaporation is calculated using the following Equation (5):
E a v = 10 × m i + 1 m i S × T × ρ w ,
where E a v is the average daily soil evaporation (mm), m i + 1 is the weight of the microlysimeter at the end of the monitoring interval (g), m i is the weight of the microlysimeter at the beginning of the monitoring interval (g), S is the bottom surface area inside the microlysimeter (cm2), T is the total number of days in the monitoring interval, and ρ w is the density of water, which is assumed to be a constant value of 1 g cm−3.
The total amount of salt drained from the subsurface pipe is calculated using the following Equation (6):
S d = 1 0 2 × T D S d i × D i ,
where S d is the amount of salt drained out of the plot from the subsurface pipe (t ha−1), T D S d i is the daily total dissolved solid amount (TDS) of drainage water in different subsurface drainage plots (g/L), and D i is the daily subsurface drainage in different subsurface drainage plots (mm).

3. Results

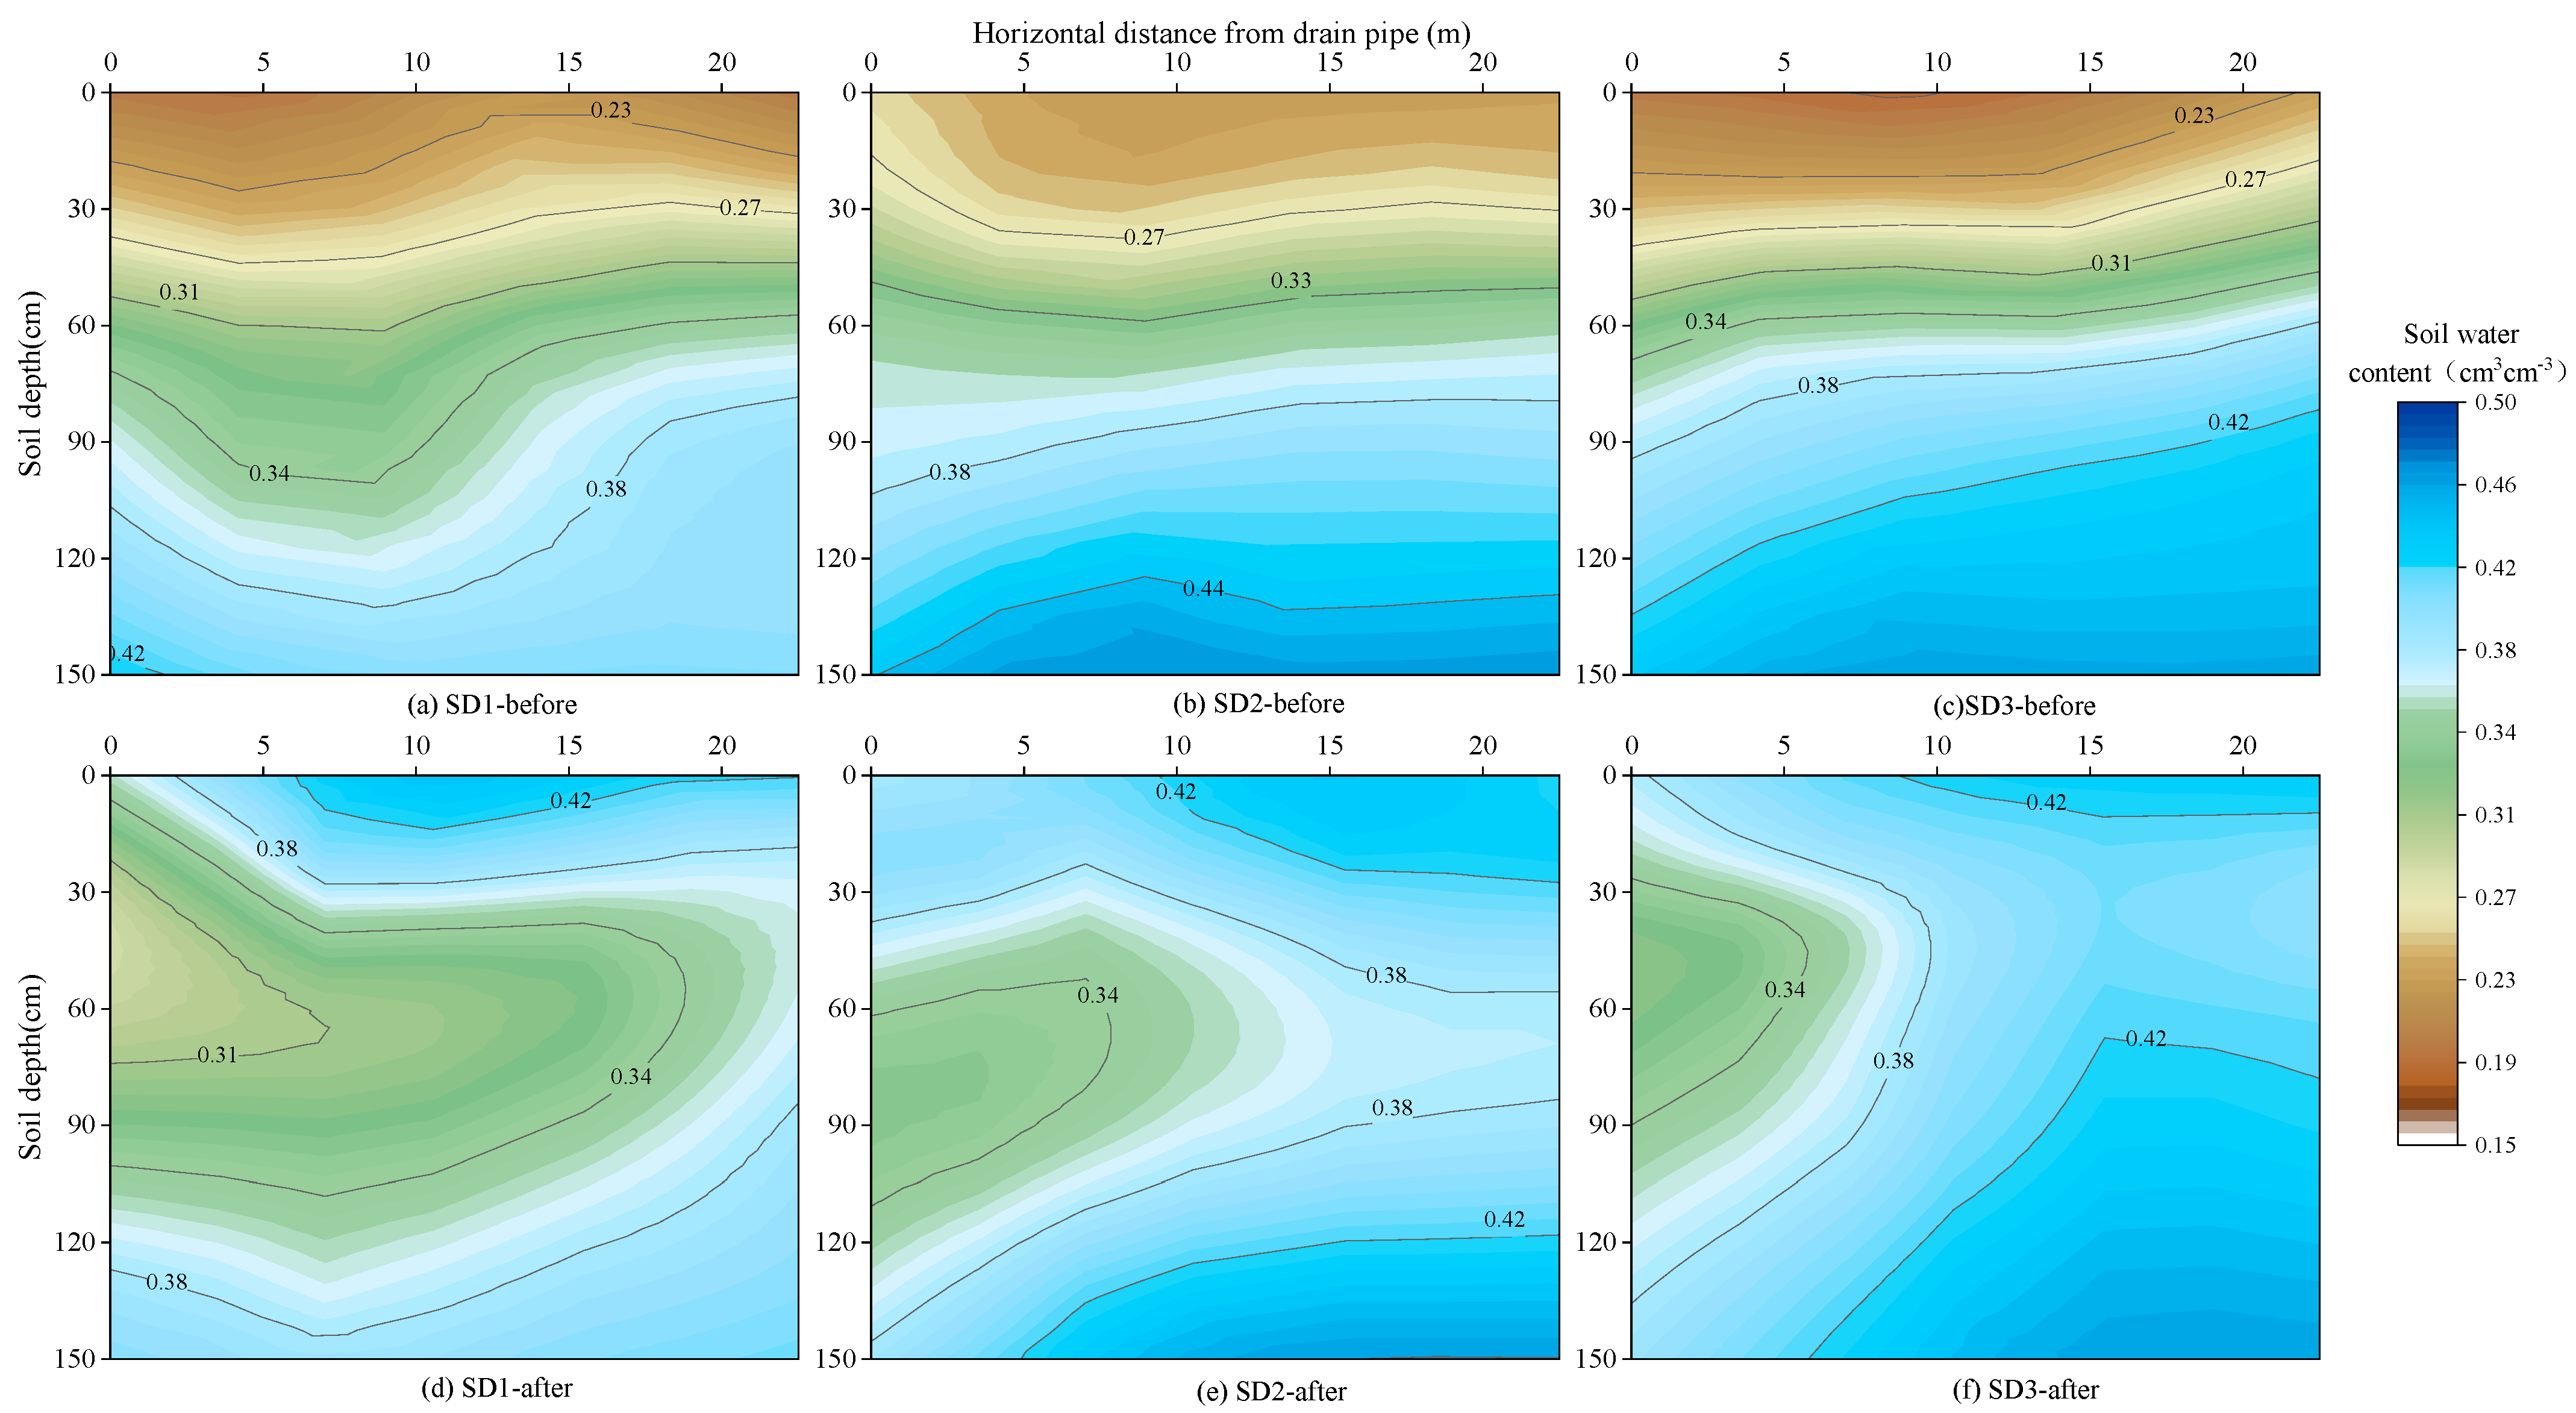
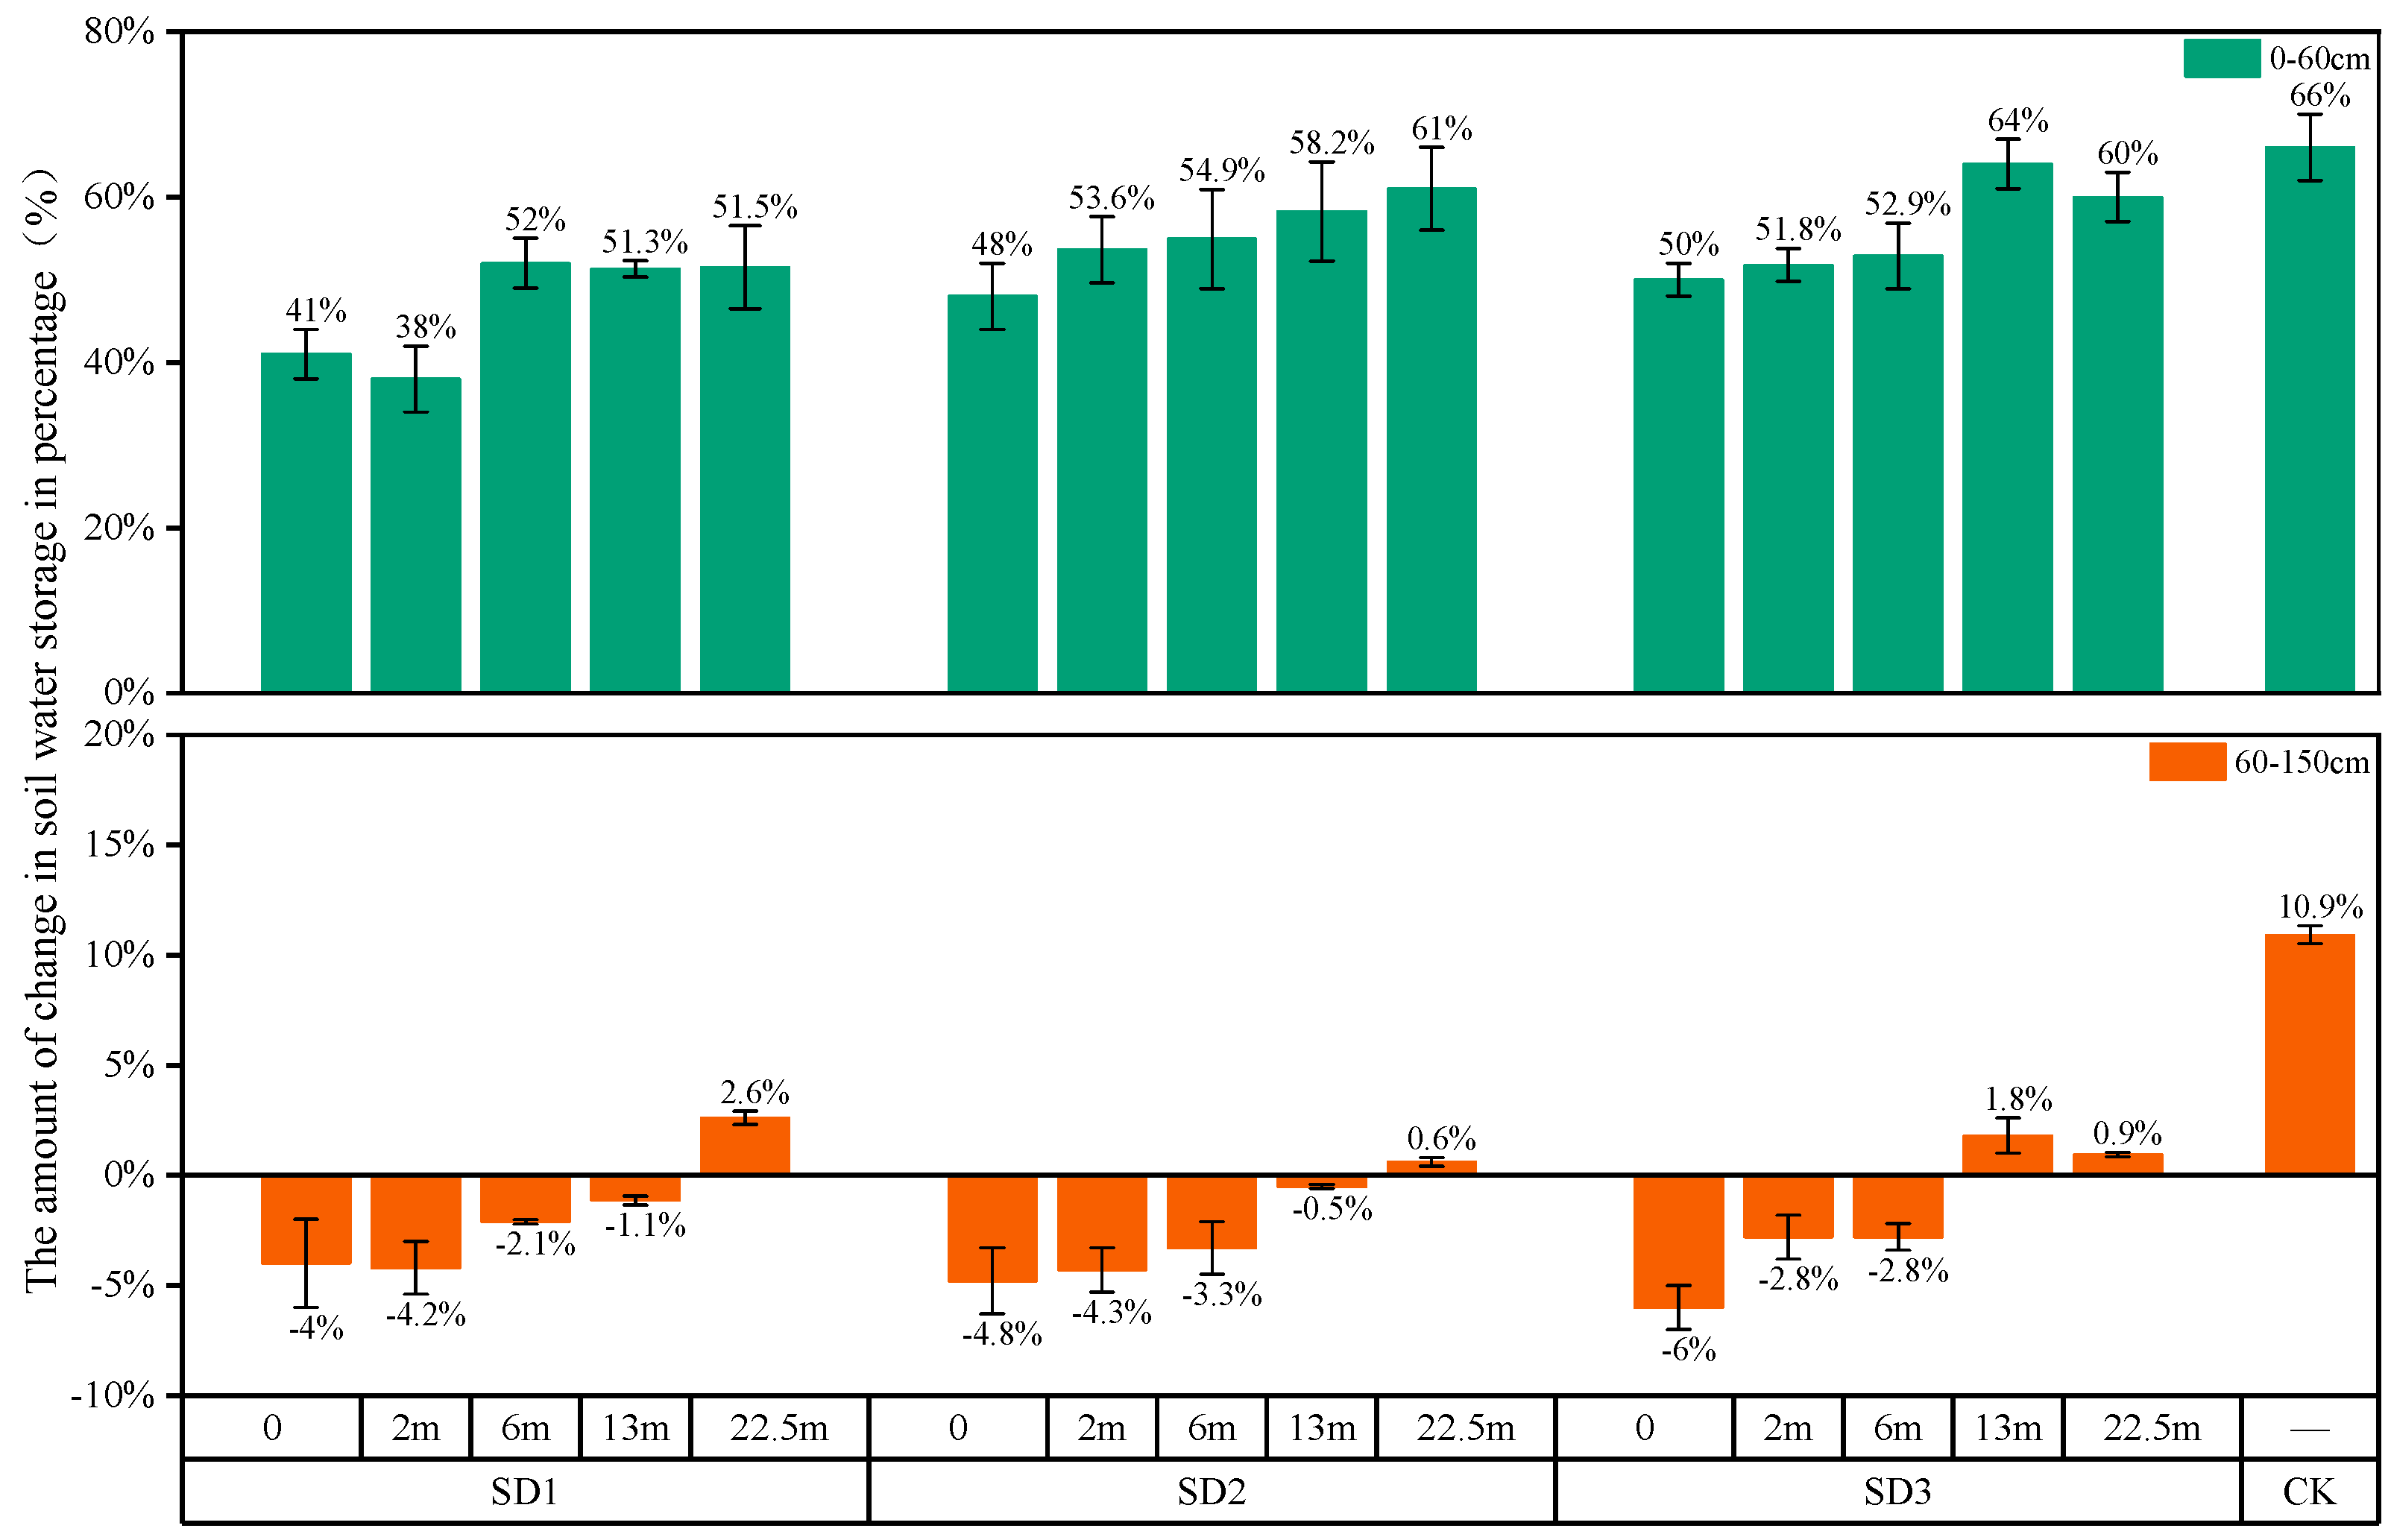
3.1. Distribution of Water Content in Soil Profile

The autumn irrigation significantly increased the soil water content for both the CK and SDs, as shown in Figure 3 and Figure 4. Before autumn irrigation, the soil water content of the top layer was very low (i.e., 0.21 cm3cm−3 for the CK treatment) due to evapotranspiration during the crop growth season. The soil water content in the CK gradually increased with increasing soil depth, with a drastic increase occurring between depths of 40 cm and 80 cm. The highest measured soil water content was 0.44 cm3cm−3, which was obtained at depths below 100 cm. After autumn irrigation, the soil water content in the 0–150 cm soil layer of the CK treatment increased significantly by up to 0.37–0.45 cm3cm−3. Figure 4 shows the two-dimensional soil profile water content distributions before and after irrigation at different horizontal distances (0–22.5 m) along the drain pipe in the SDs. Before autumn irrigation, there were no significant differences in soil water content among the SD1, SD2, and SD3. The water content of the topsoil layer (0–20 cm) for the SDs demonstrated an extremely low value (less than 0.24 cm3cm−3). Although the water content showed an increase with increasing soil depth, it was still less than 0.30 cm3cm−3 for the soil water content at a depth of 60 cm. The maximum value of 0.45 cm3cm−3 was measured at a depth of 1.5 m. The shallow groundwater table made a significant contribution to the water supply of the upper soil layer due to the capillary rise [36]. As seen in Figure 4d,f, the average soil water content for the root zone (0–60 cm depth) of the SD1, SD2, and SD3 rose to 0.36, 0.39, and 0.39 cm3cm−3 after autumn irrigation, respectively. Similarly, the mean soil water content of the lower layer (60–150 cm depth) for the SD1, SD2, and SD3 rose to 0.37, 0.40, and 0.42 cm3cm−3, respectively.
The average soil water content in the SDs increased with increasing irrigation quotas. It was 7.7% and 8.8% higher in the root zone (0–60 cm) for the SD2 and SD3 than for the SD1, and it was also 9.9% and 13.6% higher in the lower layer (60–150 cm) for the SD2 and SD3 than for the SD1, respectively. After autumn irrigation, the average water content of the 0–150 cm soil layer for the CK was 0.42, which was 15.4%, 6.3%, and 2.9% higher than that for the SD1, SD2 and SD3, respectively. The water content of the soil profile increased with horizontal distance (0–22.5 m) from the center of the drain pipe after autumn irrigation. The water content of the soil profile showed different distribution characteristics for the SDs, with higher irrigation quotas resulting in slower soil water drainage. The contours for soil water content within a value of 0.34 cm3cm−3 were 17.5 m, 7.5 m, and 5 m away from the drain pipe for the SD1, SD2, and SD3, respectively.
The comparison of changes in the soil profile water storage after and before autumn irrigation at different irrigation treatments is shown in Figure 5. A positive value indicated an increase in the soil water storage, while negative values indicated a decrease. After autumn irrigation, the average change in the soil water storage in the root zone (0–60 cm) increased by 50.5%, 58.2%, 59.9%, and 66.0% for the SD1, SD2, SD3, and CK, respectively. The change in the soil water storage in the root zone increased gradually with increasing horizontal distance from the drain pipe in the SDs. Within the horizontal distance of 0–13 m from the drain pipe, the average change in the soil water storage in the 0–60 cm soil layer was 45.8% for the SD1 and 50.8% and 51.9% for the SD2 and SD3, respectively. Within 13–22.5 m from the pipe, the average change in soil water storage in the 0–60 cm soil layer was 62.0% for the SD3, followed by 59.6% for the SD2 and 51.4% for the SD1. The average change in the soil water storage at depths of 60–150 cm under the SD1, SD2, SD3, and CK was −0.01%, −0.9%, 0.1%, and 10.9%, respectively. The average change in the soil water storage in the 60–150 cm soil layer of the CK treatment was much higher than that of the SDs, thus indicating that subsurface drainage is an effective technique to divert groundwater away and decrease the groundwater level. The change in soil water storage in the 60–150 cm soil layer of the SDs after autumn irrigation showed a similar change pattern with the 0–60 cm soil layer along the horizontal direction, although there was no significant intertreatment difference. For example, the change in the soil water storage in the 60–150 cm soil layer under the SD2 at distances of 0, 2, 6, 13, and 22.5 m away from the drain pipe was −4.8%, −4.3%, −3.3%, −0.5%, and 0.6%, respectively. The change in the 60–100 cm soil water storage was greater than zero at distances 22.5 m away from the drain pipe in all the SDs. The spacing of the subsurface drainage should be controlled within 45 m.

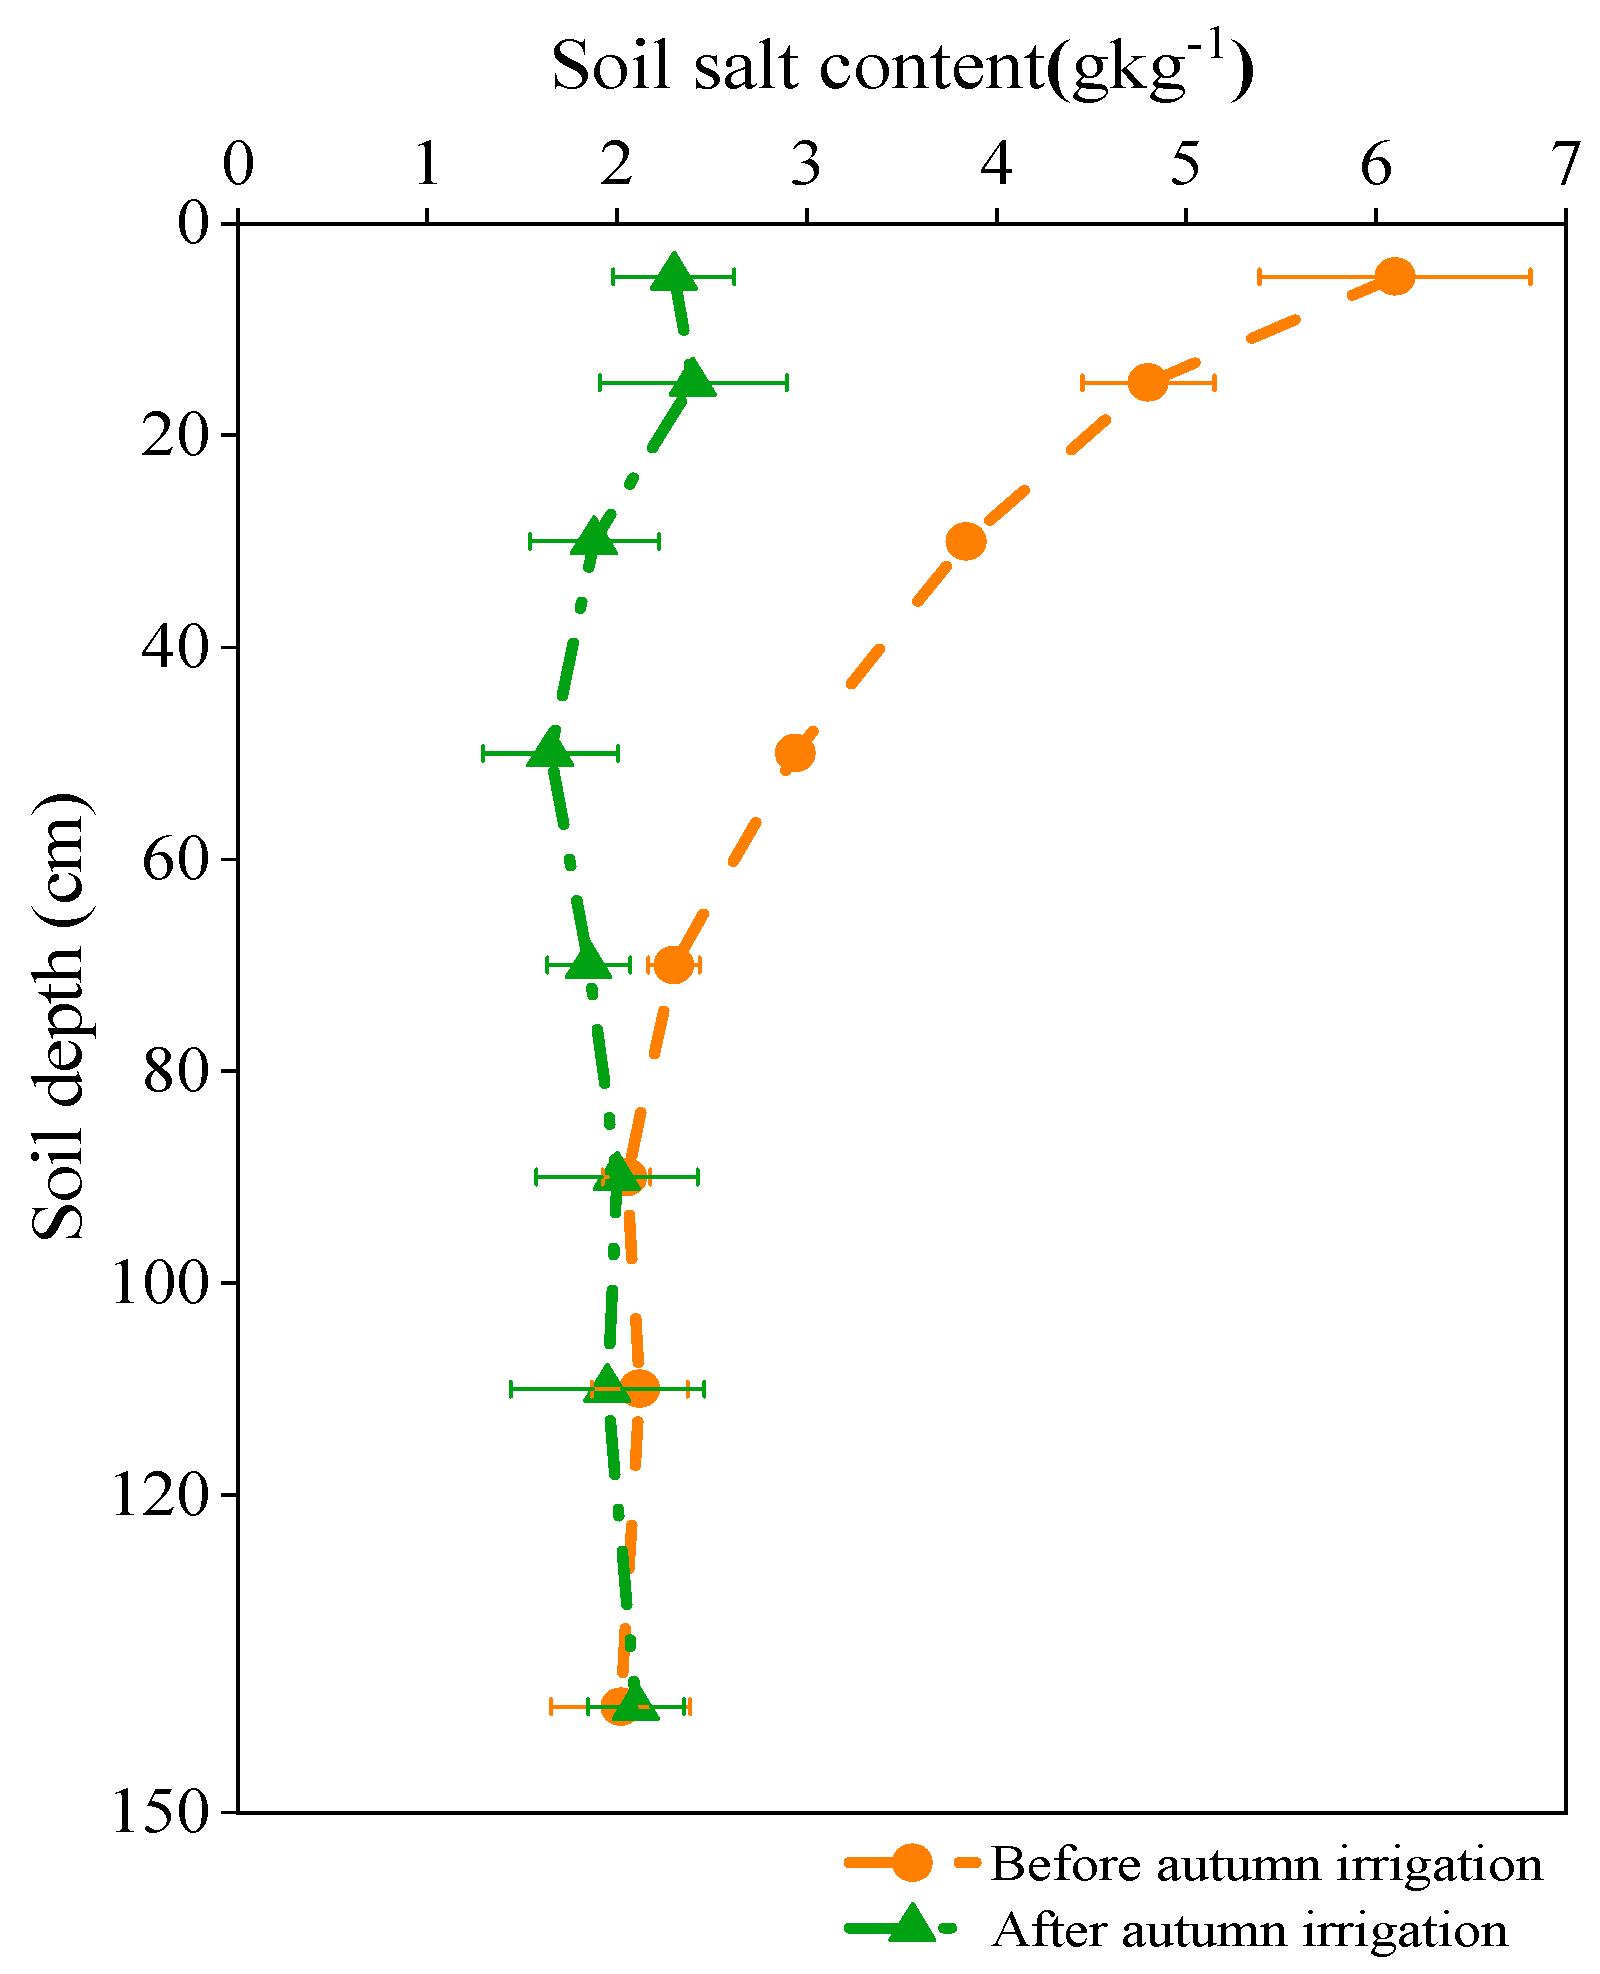
3.2. Distribution of Salt Content in the Soil Profile

The main purpose of autumn irrigation was to leach salt out of the root zone and eliminate salt accumulation as much as possible. The soil salt content of the top layer (0–20 cm) before autumn irrigation was high (e.g., with soil salinity greater than 6.1 g/kg for the CK treatment) (as shown in Figure 6). As a result of continuous evapotranspiration from the late growth stages of sunflower to autumn irrigation, the salt was continuously transported up the root zone through capillary rise and accumulated in the top layer of the soil. The distribution of the soil salt content gradually decreased with increasing soil depth, and a significant decrease in the soil salt content occurred at depths of 30 cm to 60 cm. The soil salt content in the 60–150 cm soil layer was in the range of 2.02–2.3 g/kg. Figure 7 presents the two-dimensional soil profile salt content distribution in the cross sections (0–22.5 m) of the subsurface drainage plots (SDs) from the center of the drain pipe during the autumn irrigation period. The salt content of the topsoil layer for the SDs demonstrated high values within the range of 3.28–5.59 g/kg. The average soil salt contents in the 20–60 cm and 60–150 cm layers were 2.48 g/kg and 1.80 g/kg, respectively. Considering the relatively high soil salt content after sunflower harvest, it was necessary to conduct autumn irrigation for soil leaching in combination with subsurface drainage to remove excessive soil salts and reduce soil salinization.
All treatments showed the successful leaching of salinity out of the soil profile, although the effectiveness varied among treatments. After autumn irrigation, the mean soil salt contents in the 0–60 and 60–150 cm soil layers for the CK were 1.96 g/kg and 1.98 g/kg, respectively. The soil salt content in the 0–60 cm profile was reduced to 2.03 g/kg, 1.75 g/kg, and 1.56 g/kg for the SD1, SD2, and SD3, respectively. The mean soil salt content for the 60–150 cm layer under the SD1, SD2, and SD3 was 1.69, 1.79, and 1.72 g/kg, respectively, with the latter two being 5.9% and 1.8% higher than the former. The distribution of the soil salt content under the SD1–SD3 after autumn irrigation showed a trend of gradually increasing with the horizontal distance from the center of the drain pipe (Figure 7d,f). The soil profile reached nonsaline levels (<2.0 g/kg) at a horizontal distance within 12.5 m, 15.5 m, and 18 m from the center of the drain pipe under the SD1, SD2, and SD3, respectively.
The comparison of the desalination rate of the 0–150 cm soil profile after and before autumn irrigation for different irrigation treatments is shown in Figure 8, where positive values indicate desalination and negative values indicate salt accumulation. The mean desalination rates of the soil in the root zone (0–60 cm) for the SD3, SD2, CK, and SD1 were 57.5%, 53.7%, 51.9%, and 45.1%, respectively. The desalination rate of the root zone showed a decreasing trend with increasing horizontal distance from the drain pipe in the SDs. Within the horizontal distance of 0–13 m from the drain pipe, the desalination rate in the 0–60 cm soil layer was 60.9% for the SD1 and 63.1% and 70.1% for the SD2 and SD3, respectively. Within the horizontal distance of 13–22.5 m from the pipe, the desalination rate in the 0–60 cm soil layer was 54% for the SD3, followed by 51.8% for the SD2 and 44.2% for the SD1. The desalination rate for the deep soil layer (60–150 cm) showed a significant reduction compared to the root zone, with average desalination rates of 15.9%, 14.0%, 10.2%, and 5.8% under the SD3, SD2, SD1, and CK, respectively. In addition, the desalination rate of the 60–150 cm soil layer at a distance of 22.5 m from the pipe decreased by 27.9–39% from that above the pipe. For example, the desalination rates at a depth of 60–150 cm in the SD3 at distances of 0, 2, 6, 13, and 22.5 m away from the drain pipe were 40%, 43.3%, 24.8%, 15.4%, and 7.1%, respectively.

3.3. Groundwater Depth Dynamics during the Autumn Irrigation Period

The change in groundwater depth was affected by the subsurface drainage and different autumn irrigation quotas (as shown in Figure 9). Before irrigation, the fluctuation in groundwater depth ranged from 0.8 to 1.0 m. During the autumn irrigation period, the change in the groundwater table could be classified into stable, rising, and falling phases for all experimental plots. The groundwater table for all plots rose rapidly on 25 October, and it reached its shallowest depth on 28 October. The decrease in groundwater depth in the CK was the fastest, and it took the longest time to increase after reaching its minimum depth. As the irrigation quota increased, the duration of groundwater at depths less than 60 cm increased, with the CK treatment having a significantly longer duration than the SD treatments (p < 0.05). From 25 October to 11 November, the difference in groundwater depth between horizontal distances of 22.5 m and 2 m away from the drain pipe was 16–21 cm. Then, from 12 November to 26 November, the gradient of the groundwater table along the cross section of the drain pipe gradually decreased. The groundwater depth of the subsurface drainage plots stabilized at 1.5 m on the 31st day after irrigation, while the groundwater depth of the CK plot gradually stabilized at 1.20 m.

3.4. Water and Salt Balance of the Experimental Area

Both the irrigation quota and subsurface drainage had a significant effect on the water and salt balance of the experimental field during the autumn irrigation period, as shown in Table 2 and Table 3. The effective precipitation was only 2 mm during the autumn irrigation period according to the meteorological data. The evaporation for the SD1, SD2, SD3, and CK treatments was 52, 57, 61, and 67 mm, respectively. The subsurface drainage volumes recorded by the electromagnetic flow meters during the autumn irrigation period were 31, 36, and 40 mm under the SD1, SD2, and SD3, respectively. The amount of water drained by the subsurface drainage increased with increasing irrigation quota. It was 15.7% and 26.8% higher than the SD1 when compared with the SD2 and SD3, respectively. The net deep percolation from the CK treatment reached 65 mm, which accounted for 32.4% of the irrigation water. The net deep percolation of the SD3, SD2, and SD1 was 36 mm, 26 mm, and 20 mm, respectively. Moreover, the average water storage in the soil profile gradually increased with increasing autumn irrigation quota. The highest increase in water storage for the depth of 0–150 cm was 70 mm, which was obtained in the CK treatment. The increases in water storage for the SD2 and SD3 were 63 mm and 65 mm, which were 5.7% and 9.3% higher than that of the SD1, respectively.
The average total dissolved solid (TDS) concentration of the Yellow River water used for autumn irrigation was 0.49 g/L. The amount of irrigation-introduced salt by the SD1, SD2, SD3, and CK was 0.79 t/ha, 0.89 t/ha, 0.99 t/ha, and 0.99 t/ha, respectively (Table 3). During the autumn irrigation period, salt in the soil profile was leached into the deep layer or groundwater reservoir [37]. The daily salt discharge of each SD plot was obtained by multiplying the TDS of the drainage by the daily discharge volume. The salt discharge through the drain pipe increased with increasing irrigation quota and was 1.50 t/ha, 1.41 t/ha, and 1.22 t/ha for the SD3, SD2, and SD1, respectively. In addition, the salt discharge from the drain pipe in the SD3 was 6.4% and 23.0% greater than that in the SD2 and SD1, respectively. The amount of salt leaching into the deep soil and the groundwater reservoir was 20.17, 22.55, 22.96, and 23.19 t/ha for the SD1, SD2, SD3, and CK, respectively. All groundwater in the experiments received a certain amount of salinity, and the groundwater in the CK plot received the highest amount of salinity. This demonstrated that agricultural irrigation constitutes a continuous source of saline water for groundwater.

4. Discussion

4.1. Effect of Different Treatments on Soil Water

The groundwater table, as well as the average TDS concentration of groundwater and evapotranspiration, are directly related to soil water–salt changes [38,39]. Therefore, controlling the groundwater table is key to preventing soil salinization [40]. Large amounts of irrigation can cause a rise in the groundwater table, and salt migration to the topsoil layer through groundwater evaporation can result in soil resalinization after irrigation. The autumn irrigation quota in the Hetao Irrigation District is generally very high, and the hydraulic conductivity of the saline–alkaline soil is poor [41,42]. Additionally, subsurface drainage can drain shallow groundwater out of farmland, thus accelerating the rate of decline in the groundwater level after autumn irrigation. At the end of the autumn irrigation period, the groundwater depth in the subsurface drainage area gradually stabilized at 1.5 m, while in the CK area, it gradually stabilized at 1.20 m. The combination of subsurface drainage and effective autumn irrigation can promote the flow of soil water and salt transport downward, thereby lowering the salinization level of saline soil [43,44].
During the autumn irrigation period, the infiltration rate of the soil profile decreased gradually with increasing distance from the drain pipe [36,45]. An analysis of the soil water content variation before and after irrigation revealed that the distribution and changes in the soil water content were mainly influenced by irrigation quotas and subsurface drainage, which is consistent with the finding of Heng [29]. After autumn irrigation, the mean soil water content of the 0–150 cm soil layer was significantly higher in the CK treatment than in the other treatments (p < 0.05). There was no significant difference in the soil water content between the SD3 and SD2 (p > 0.05), while both treatments had significantly higher soil water contents than the SD1 zone (p < 0.05). Additionally, the change in water storage for the 0–150 cm soil layer increased with increasing horizontal distance from the drain pipe. However, the gradient of soil water content change was decreasing as the distance exceeded 13 m (e.g., from 13 to 22.5 m), as the hydraulic gradient caused by the drain pipe decreased with increasing distance. The soil freezing period follows the autumn irrigation period [46]. During the soil freezing period, the freezing sharp develops downward from the soil surface, and the soil water continues to migrate and accumulate in the top frozen layer, which is driven by the upward gradient of soil water potential. Simultaneously, salt tends to move from unfrozen layers upward toward frozen layers during the freezing period [47,48,49]. The soil water storage within the 60–150 cm depth was effectively reduced via subsurface drainage after autumn irrigation, and the movement of water from the lower nonfreezing zone to the upper layer during the freezing period of the farmland was better reduced. Thus, this could reduce the accumulation of surface soil salts due to strong evaporation during the freezing and thawing period.

4.2. Effect of Different Treatments on Soil Salt

Studies indicate that resalination of soil in late crop growth stages is mainly caused by a shallow groundwater depth and high evapotranspiration rates [36,50]. In the present study, soil salinity was leached out of the root zone through autumn irrigation and subsurface drainage. This management is a useful irrigation practice for reducing salt stress on crops in the next growing season, especially in arid and semiarid zones with severe farmland soil salinization [46,49]. The desalination rate of the 0–60 cm soil layer in each plot was significantly higher than that of the 60–150 cm soil layer during autumn irrigation (p < 0.05), which is consistent with the results of Feng et al. [51]. Meanwhile, there was no significant difference in the mean desalination rate of the 60–150 cm layer between the SD2 and SD3 (p > 0.05), but the mean desalination rate of this layer for both treatments was significantly higher than that of the SD1 and CK (p < 0.05). As the distance decreased, the amount of water discharged through the drain pipe increased, thereby leading to an increase in the quantity of salinity that was discharged along with the water. The amount of water discharged through the drain pipe increased with decreasing distance, thus enhancing the quantity of salinity discharged along with water [52,53]. This study found that increasing the autumn irrigation quota extended the period during which the groundwater depth was maintained at a shallow depth condition (0–60 cm). A high potential evaporation rate promoted the upward transportation of soil water; therefore, an inappropriate autumn irrigation quota could lead to the reduced effectiveness of soil salinity leaching in salt-affected agricultural land.
There is a considerable amount of salt leaching into the deep soil or groundwater reservoir when using large amounts of water for irrigation during the non-growth period of crops (autumn and preplanting irrigation). Although irrigation can redistribute soil salinity within the soil profile, the salinization of the leached soil cannot be significantly reduced without drainage measures [54]. In addition, water for irrigation may introduce new sources of salt into the soil. During the freezing–thawing period, some of the salinity will be transported upward and accumulate in the topsoil due to strong evaporation before the sowing period of crops [19]. The ratio of drainage to irrigation (RDI) is a useful indicator used for evaluating the condition of salinization/salt accumulation or desalinization in irrigation districts, particularly in arid and semiarid regions. For irrigation-dominated farming, maintaining a suitable RDI is crucial to prevent the salinization of farmland and to maintain sustainability in the development of agricultural planting [22,55]. The average value of the RDI in the Hetao Irrigation District has been measured at 12–15% [56]. The RDI values under the SD1, SD2, and SD3 were 19.6%, 20.1%, and 19.9%, respectively, which were significantly higher than the average RDI for the Hetao Irrigation District.
Subsurface drainage significantly promotes the efficiency of leaching and the drainage of salinity compared to the existing open ditch system in the Hetao Irrigation District [57]. Subsurface drainage reduces the amount of water from deep percolation during the autumn irrigation period, which inhibits the downward redistribution of salt in saline soil and prevents the upward transport of salts during the freezing period. There was no significant difference in the amount of salt discharged through the subsurface drainage system between the SD3 and SD2. Irrigation with a quota of 180 mm was the best irrigation schedule among the SDs. The deep leaching salt in the SDs was significantly lower than that in the CK treatment (p < 0.05). We found that, compared to the SD1, and although the SD2 had a 20 mm reduction in its irrigation quota, its effect on the 0–150 cm soil depth moisture retention did not significantly decrease. Furthermore, the SD2 showed no significant difference from the SD3 in terms of soil salt leaching. In order to address the water resource crisis and to minimize drainage and deep percolation, subsurface drainage combined with 180 mm autumn irrigation is the optimal way to reduce the level of salinization at the experimental site.

5. Conclusions

The effects of autumn irrigation on soil water and salinity balance in the Hetao Irrigation District are site-specific and influenced by irrigation quotas and subsurface drainage. Based on our research findings, the following key conclusions can be drawn:
(1)
Autumn irrigation significantly improved the soil water content and storage, which increased with the amount of water applied. After autumn irrigation, the mean soil water content in the 0–150 cm depth for the SD1, SD2, and SD3 was 0.363, 0.394, and 0.407 cm3cm−3, respectively, which was 15.4%, 6.3%, and 3.0% lower, respectively, than that of the plots without subsurface drainage (CK).
(2)
Autumn irrigation combined with subsurface drainage effectively reduced soil profile salinity, with different treatments showing varying leaching effects. The mean desalination rates in the root zone (0–60 cm) for the SD3, SD2, CK, and SD1 were 57.5%, 53.7%, 51.9%, and 45.1%, respectively. Furthermore, the soil salt content distribution under the SD1–SD3 after autumn irrigation showed a trend of gradually increasing with the horizontal distance from the center of the drain pipe.
(3)
The groundwater table of the SD plots was stabilized at 1.5 m on the 31st day after irrigation in the SDs, while the groundwater table of the CK plots gradually stabilized at 1.20 m correspondingly.
(4)
The ratio of drainage to irrigation was 19.6%, 20.1%, and 19.9% for the SD1, SD2, and SD3, respectively. The salt discharge through the drain pipe increased with increasing irrigation quota and was 1.50 t/ha, 1.41 t/ha, and 1.22 t/ha for the SD3, SD2 and SD1, respectively.
To prevent the accumulation of salts in agricultural irrigation districts with shallow groundwater and to cope with the worsening world water crisis, it is essential to combine irrigation for salinity leaching with subsurface drainage. Based on our findings, an autumn irrigation quota of 180 mm combined with subsurface drainage is the optimal irrigation management approach for moderately saline soil in the Hetao Irrigation District.

Author Contributions

J.L. (Jiawei Liu): Data curation, Writing—original draft preparation, Investigation, Methodology; Q.H.: Methodology, Supervision, Writing—review and editing, Funding acquisition; Z.L.: Data curation, Investigation; N.L.: Conceptualization; J.L. (Jinshuai Li): Investigation; G.H.: Supervision, Funding acquisition. All authors have read and agreed to the published version of the manuscript.

Funding

This research was jointly supported by the National Key Research and Development Program of China (No. 2021YFD1900601) and the National Natural Science Foundation of China (Nos. U2243217, 52220105007 and 51779256).

Data Availability Statement

The data that has been used is confidential.

Conflicts of Interest

The authors declare that they have no known competing financial interests or personal relationships that could have appeared to influence the work reported in this paper.

References

  1. Dehaan, R.L.; Taylor, G.R. Field-derived spectra of salinized soils and vegetation as indicators of irrigation-induced soil salinization. Remote Sens. Environ. 2002, 80, 406–417. [Google Scholar] [CrossRef]
  2. Masoud, A.A.; Koike, K. Arid land salinization detected by remotely-sensed landcover changes: A case study in the siwa region, nw egypt. J. Arid Environ. 2006, 66, 151–167. [Google Scholar] [CrossRef]
  3. Sharma, S.B.; Sayyed, R.Z.; Trivedi, M.H.; Gobi, T.A. Phosphate solubilizing microbes: Sustainable approach for managing phosphorus deficiency in agricultural soils. SpringerPlus 2013, 2, 587. [Google Scholar] [CrossRef] [PubMed] [Green Version]
  4. Wang, Y.B.; Liu, D.; Cao, X.C.; Yang, Z.Y.; Song, J.F.; Chen, D.Y.; Sun, S.K. Agricultural water rights trading and virtual water export compensation coupling model: A case study of an irrigation district in china. Agric. Water Manag. 2017, 180, 99–106. [Google Scholar] [CrossRef]
  5. Yu, R.; Liu, T.; Xu, Y.; Zhu, C.; Zhang, Q.; Qu, Z.; Liu, X.; Li, C. Analysis of salinization dynamics by remote sensing in hetao irrigation district of north china. Agric. Water Manag. 2010, 97, 1952–1960. [Google Scholar] [CrossRef]
  6. Chang, X.; Gao, Z.; Wang, S.; Chen, H. Modelling long-term soil salinity dynamics using saltmod in hetao irrigation district, china. Comput. Electron. Agric. 2019, 156, 447–458. [Google Scholar] [CrossRef]
  7. Munns, R.; Tester, M. Mechanisms of salinity tolerance. Annu. Rev. Plant Biol. 2008, 59, 651. [Google Scholar] [CrossRef] [PubMed] [Green Version]
  8. Cresswell, R.G.; Mullen, I.C.; Kingham, R.; Kellett, J.; Dent, D.L.; Jones, G.L. Airborne electromagnetics supporting salinity and natural resource management decisions at the field scale in australia. Int. J. Appl. Earth Obs. Geoinf. 2007, 9, 91–102. [Google Scholar] [CrossRef]
  9. Metternicht, G.I.; Zinck, J.A. Remote sensing of soil salinity: Potentials and constraints. Remote Sens. Environ. 2003, 85, 1–20. [Google Scholar] [CrossRef]
  10. Dou, X.; Shi, H.; Li, R.; Miao, Q.; Tian, F.; Yu, D.; Zhou, L.; Wang, B. Effects of controlled drainage on the content change and migration of moisture, nutrients, and salts in soil and the yield of oilseed sunflower in the hetao irrigation district. Sustainability 2021, 13, 9835. [Google Scholar] [CrossRef]
  11. Ren, D.; Wei, B.; Xu, X.; Engel, B.; Li, G.; Huang, Q.; Xiong, Y.; Huang, G. Analyzing spatiotemporal characteristics of soil salinity in arid irrigated agro-ecosystems using integrated approaches. Geoderma 2019, 356, 113935. [Google Scholar] [CrossRef]
  12. Jana, P.; Pandey, R.; Semeraro, T.; Alatalo, J.M.; Areteno, R.; Todaria, N.P.; Tripathi, R. Community perspectives on conservation of water sources in tarkeshwar sacred groves, Himalaya, India. Water Supply 2021, 21, 4343–4354. [Google Scholar] [CrossRef]
  13. Xu, X.; Sun, C.; Qu, Z.; Huang, Q.; Ramos, T.B.; Huang, G. Groundwater recharge and capillary rise in irrigated areas of the upper yellow river basin assessed by an agro-hydrological model. Irrig. Drain. 2015, 64, 587–599. [Google Scholar] [CrossRef]
  14. Xue, J.; Ren, L. Assessing water productivity in the hetao irrigation district in inner mongolia by an agro-hydrological model. Irrig. Sci. 2017, 35, 357–382. [Google Scholar] [CrossRef]
  15. Zhang, H.; Xiong, Y.; Huang, G.; Xu, X.; Huang, Q. Effects of water stress on processing tomatoes yield, quality and water use efficiency with plastic mulched drip irrigation in sandy soil of the hetao irrigation district. Agric. Water Manag. 2017, 179, 205–214. [Google Scholar] [CrossRef]
  16. Wang, W.; Wang, W.; Wang, P.; Wang, X.; Wang, L.; Wang, C.; Zhang, C.; Huo, Z. Impact of straw return on soil temperature and water during the freeze-thaw period. Agric. Water Manag. 2023, 282, 108292. [Google Scholar] [CrossRef]
  17. Li, R.; Shi, H.; Flerchinger, G.N.; Akae, T.; Wang, C. Simulation of freezing and thawing soils in inner mongolia hetao irrigation district, china. Geoderma 2012, 173–174, 28–33. [Google Scholar] [CrossRef]
  18. Lu, X.; Li, R.; Shi, H.; Liang, J.; Miao, Q.; Fan, L. Successive simulations of soil water-heat-salt transport in one whole year of agriculture after different mulching treatments and autumn irrigation. Geoderma 2019, 344, 99–107. [Google Scholar] [CrossRef]
  19. Tan, X.; Wu, J.; Wu, M.; Huang, J.; Tan, B.; Li, L. Effects of ice cover on soil water, heat, and solute movement: An experimental study. Geoderma 2021, 403, 115209. [Google Scholar] [CrossRef]
  20. Tanji, K.K.; Kielen, N.C. Agricultural Drainage Water Management in Arid and Semi-Arid Areas; FAO: Rome, Italy, 2002. [Google Scholar]
  21. Zhao, C.; Yan, Y.; Yilihamu, Y.; Li, J.; Zhao, Z.; Wu, L. Effects of soil moisture on cotton root length density and yield under drip irrigation with plastic mulch in aksu oasis farmland. J. Arid Land 2010, 2, 243–249. [Google Scholar]
  22. Hu, S.; Zhao, C.; Zhu, H. Hydrosalinity balance and critical ratio of drainage to irrigation (rdi) for salt balance in weigan river irrigation district of the Tarim Basin (China). Environ. Earth Sci. 2017, 76, 242. [Google Scholar] [CrossRef]
  23. Bahceci, I.; Nacar, A.S. Subsurface drainage and salt leaching in irrigated land in south-east turkey. Irrig. Drain. J. Int. Comm. Irrig. Drain. 2009, 58, 346–356. [Google Scholar]
  24. Askri, B.; Khodmi, S.; Bouhlila, R. Impact of subsurface drainage system on waterlogged and saline soils in a saharan palm grove. Catena 2022, 212, 106070. [Google Scholar] [CrossRef]
  25. Heng, T.; Liao, R.; Wang, Z.; Wu, W.; Li, W.; Zhang, J. Effects of combined drip irrigation and sub-surface pipe drainage on water and salt transport of saline-alkali soil in Xinjiang, China. J. Arid Land 2018, 10, 932–945. [Google Scholar] [CrossRef] [Green Version]
  26. Zhang, J.; Werner, A.D.; Lu, C. Improving salt leaching efficiency of subsurface drainage systems using low-permeability surface mulch. Adv. Water Resour. 2022, 162, 104147. [Google Scholar] [CrossRef]
  27. Everts, C.J.; Kanwar, R.S. Estimating preferential flow to a subsurface drain with tracers. Trans. ASAE 1990, 33, 451–457. [Google Scholar] [CrossRef]
  28. Mao, W.; Zhu, Y.; Wu, J.; Yang, J. Numerical simulation of the suitable autumn irrigation quota in the hetao irrigation district considering the assumption of mobile-immobile water. Trans. Chin. Soc. Agric. Eng. 2022, 38, 58–66. [Google Scholar]
  29. Heng, T.; He, X.; Yang, L.; Xu, X.; Feng, Y. Mechanism of saline–alkali land improvement using subsurface pipe and vertical well drainage measures and its response to agricultural soil ecosystem. Environ. Pollut. 2022, 293, 118583. [Google Scholar] [CrossRef]
  30. Shirahatti, M.S.; Dodamani, B.M.; Kuligod, V.B.; Balakrishnan, P.; Barkar, R.D. Impact of subsurface drainage system on reclamation of waterlogged area. Environ. Ecol. 2012, 30, 877–880. [Google Scholar]
  31. Zhang, J.; Liu, M.; Qian, H.; Zhang, Q.; Wang, Z. Spatial-temporal variation characteristics of water- salt movement in coastal saline soil improved by flooding and subsurface drainage. Trans. Chin. Soc. Agric. Eng. 2018, 34, 98–103. (In Chinese) [Google Scholar]
  32. Slavich, P.; Petterson, G. Anion exclusion effects on estimates of soil chloride and deep percolation. Soil Res. 1993, 31, 455–463. [Google Scholar] [CrossRef]
  33. Xu, X.; Huang, G.; Sun, C.; Pereira, L.S.; Ramos, T.B.; Huang, Q.; Hao, Y. Assessing the effects of water table depth on water use, soil salinity and wheat yield: Searching for a target depth for irrigated areas in the upper yellow river basin. Agric. Water Manag. 2013, 125, 46–60. [Google Scholar] [CrossRef]
  34. Ren, D.; Xu, X.; Hao, Y.; Huang, G. Modeling and assessing field irrigation water use in a canal system of hetao, upper yellow river basin: Application to maize, sunflower and watermelon. J. Hydrol. 2016, 532, 122–139. [Google Scholar] [CrossRef]
  35. Atekwana, E.A.; Atekwana, E.A.; Rowe, R.S.; Werkema, D.D.; Legall, F.D. The relationship of total dissolved solids measurements to bulk electrical conductivity in an aquifer contaminated with hydrocarbon. J. Appl. Geophys. 2004, 56, 281–294. [Google Scholar] [CrossRef]
  36. Dou, X.; Shi, H.; Li, R.; Miao, Q.; Yan, J.; Tian, F.; Wang, B. Simulation and evaluation of soil water and salt transport under controlled subsurface drainage using hydrus-2d model. Agric. Water Manag. 2022, 273, 107899. [Google Scholar] [CrossRef]
  37. Singh, A. Groundwater recharge assessment and long-term simulation for managing the threat of salinization of irrigated lands. J. Hydrol. 2022, 609, 127775. [Google Scholar] [CrossRef]
  38. Chen, S.; Mao, X.; Shang, S. Response and contribution of shallow groundwater to soil water/salt budget and crop growth in layered soils. Agric. Water Manag. 2022, 266, 107574. [Google Scholar] [CrossRef]
  39. Haj-Amor, Z.; Bouri, S. Subsurface drainage system performance, soil salinization risk, and shallow groundwater dynamic under irrigation practice in an arid land. Arab. J. Sci. Eng. 2019, 44, 467–477. [Google Scholar] [CrossRef]
  40. Gelaye, K.K.; Zehetner, F.; Loiskandl, W.; Klik, A. Effects of soil texture and groundwater level on leaching of salt from saline fields in kesem irrigation scheme, ethiopia. Soil Water Res. 2019, 14, 221–228. [Google Scholar] [CrossRef] [Green Version]
  41. Adeyemo, T.; Kramer, I.; Levy, G.J.; Mau, Y. Salinity and sodicity can cause hysteresis in soil hydraulic conductivity. Geoderma 2022, 413, 115765. [Google Scholar] [CrossRef]
  42. Vasconcelos, D.S.R.C.; Martins, V.M.; Carlos, T.L.; Samuel, B.; Moreira, S.T.; Rogério, M.C.; Fornalski, S.M.; de Moura, M.M.; Klaus, R. Examining the implications of spatial variability of saturated soil hydraulic conductivity on direct surface runoff hydrographs. Catena 2021, 207, 105693. [Google Scholar]
  43. Abd-Elaty, I.; Sallam, G.A.H.; Straface, S.; Scozzari, A. Effects of climate change on the design of subsurface drainage systems in coastal aquifers in arid/semi-arid regions: Case study of the nile delta. Sci. Total Environ. 2019, 672, 283–295. [Google Scholar] [CrossRef] [PubMed]
  44. Ghane, E.; Askar, M.H. Predicting the effect of drain depth on profitability and hydrology of subsurface drainage systems across the eastern USA. Agric. Water Manag. 2021, 258, 107072. [Google Scholar] [CrossRef]
  45. Feng, G.; Zhang, Z.; Wan, C.; Lu, P.; Bakour, A. Effects of saline water irrigation on soil salinity and yield of summer maize (Zea mays L.) In subsurface drainage system. Agric. Water Manag. 2017, 193, 205–213. [Google Scholar] [CrossRef]
  46. Liu, S.; Huang, Q.; Zhang, W.; Ren, D.; Xu, X.; Xiong, Y.; Huang, G. An improved estimation of soil water and salt dynamics by considering soil bulk density changes under freeze/thaw conditions in arid areas with shallow groundwater tables. Sci. Total Environ. 2023, 859, 160342. [Google Scholar] [CrossRef]
  47. Liu, S.; Huang, Q.; Ren, D.; Xu, X.; Huang, G. Soil evaporation and its impact on salt accumulation in different landscapes under freeze–thaw conditions in an arid seasonal frozen region. Vadose Zone J. 2021, 20, e20098. [Google Scholar] [CrossRef]
  48. Xie, H.; Jiang, X.; Tan, S.; Wan, L.; Wang, X.; Liang, S.; Zeng, Y. Interaction of soil water and groundwater during the freezing–thawing cycle: Field observations and numerical modeling. Hydrol. Earth Syst. Sci. 2021, 25, 4243–4257. [Google Scholar] [CrossRef]
  49. Xun, Y.; Xiao, X.; Sun, C.; Meng, H.; Gao, Y.; Huang, G.; Xu, X. Modeling heat-water-salt transport, crop growth and water use in arid seasonally frozen regions with an improved coupled spac model. J. Hydrol. 2022, 615, 128703. [Google Scholar] [CrossRef]
  50. Jouni, H.J.; Liaghat, A.; Hassanoghli, A.; Henk, R. Managing controlled drainage in irrigated farmers’ fields: A case study in the moghan plain, iran. Agric. Water Manag. 2018, 208, 393–405. [Google Scholar] [CrossRef]
  51. Feng, Z.; Wang, X.; Feng, Z. Soil n and salinity leaching after the autumn irrigation and its impact on groundwater in hetao irrigation district, china. Agric. Water Manag. 2005, 71, 131–143. [Google Scholar] [CrossRef]
  52. Darzi-Naftchali, A.; Mirlatifi, S.M.; Shahnazari, A.; Ejlali, F.; Mahdian, M.H. Effect of subsurface drainage on water balance and water table in poorly drained paddy fields. Agric. Water Manag. 2013, 130, 61–68. [Google Scholar] [CrossRef]
  53. Feng, G.; Zhu, C.; Wu, Q.; Wang, C.; Zhang, Z.; Mwiya, R.M.; Zhang, L. Evaluating the impacts of saline water irrigation on soil water-salt and summer maize yield in subsurface drainage condition using coupled hydrus and epic model. Agric. Water Manag. 2021, 258, 107175. [Google Scholar] [CrossRef]
  54. Xie, T.; Liu, X.; Sun, T. The effects of groundwater table and flood irrigation strategies on soil water and salt dynamics and reed water use in the yellow river delta, china. Ecol. Model. 2011, 222, 241–252. [Google Scholar] [CrossRef]
  55. Wang, D.; Zhao, C.; Zheng, J.; Zhu, J.; Gui, Z.; Yu, Z. Evolution of soil salinity and the critical ratio of drainage to irrigation (crdi) in the weigan oasis in the tarim basin. Catena 2021, 201, 105210. [Google Scholar] [CrossRef]
  56. Xia, L.; Liping, W.; Shengwei, Z.; Yiqiang, Z. Evaluation of irrigation and drainage water cation composition and salt leaching requirement in hetao irrigation district. Chin. J. Eco-Agric. 2011, 19, 500–505. [Google Scholar]
  57. Wen, Y.; Shang, S.; Rahman, K.U.; Xia, Y.; Ren, D. A semi-distributed drainage model for monthly drainage water and salinity simulation in a large irrigation district in arid region. Agric. Water Manag. 2020, 230, 105962. [Google Scholar] [CrossRef]
Figure 1. Temperature and precipitation during the autumn irrigation period in 2020.
Water 15 02296 g001
Figure 2. The location of the experimental site and its schematic layout of the subsurface drainage experiment.
Water 15 02296 g002
Figure 3. Distribution of soil water content in the control treatment (CK) before and after autumn irrigation.
Water 15 02296 g003
Figure 4. Two-dimensional soil water content (SWC) distribution in the cross sections (0–22.5 m) of subsurface drainage plots (SDs) from the center of drain pipe. (ac) are the SWC distributions of the soil profile for SD1–SD3 before autumn irrigation. (df) are the SWC distributions of the soil profile for SD1–SD3 after autumn irrigation.
Water 15 02296 g004
Figure 5. The comparison of soil water storage change among different treatments, different distances from the drain pipe, and different depths of the soil profile after autumn irrigation.
Water 15 02296 g005
Figure 6. The comparison of the distribution of soil salt content in the control treatment (CK) before autumn irrigation and after autumn irrigation.
Water 15 02296 g006
Figure 7. Two–dimensional soil salt content (SSC) distributions in the cross sections (0–22.5 m) of subsurface drainage plots (SDs) from the center of drain pipe. (ac) are the SSC distributions of the soil profile for SD1–SD3 before autumn irrigation. (df) are the SSC distributions of the soil profile for SD1–SD3 after autumn irrigation.
Water 15 02296 g007
Figure 8. The comparison of desalination rates among different treatments, different distances from the drain pipe, and different depths of the soil profile after autumn irrigation.
Water 15 02296 g008
Figure 9. The variation in groundwater depth of CK and SDs with different spacing from the subsurface drainage pipe during the autumn irrigation period.
Water 15 02296 g009
Table 1. Basic physical properties of soil profile at 0–150 cm depth in the experimental area.
Depth (cm)Soil Particle Size Distribution (%)Bulk Density (g∙cm−3)Field Capacity
(cm3∙cm−3)
Saturated Hydraulic Conductivity (cm/day)
SandSiltClay
0~1054.5539.835.621.510.3132.7
10~2057.8036.755.451.560.3220.5
20~4048.4046.475.431.490.3444.1
40~6053.6442.144.221.510.3080.9
60~8056.3239.823.861.470.3285.9
80~10027.4767.614.921.490.3270.1
100~12060.132.971.480.3150.2
120~15051.642.95.51.500.3355.6
Table 2. Water balance components (mm) for the control treatment (CK) and subsurface drainage treatments (SDs) during the autumn irrigation period.
TreatmentPrecipitation
(mm)
Irrigation
(mm)
Evaporation
(mm)
Net Deep Percolation
(mm)
Subsurface
Drainage (mm)
ΔW (mm)
SD1216052 ± 2 d20 ± 3 d3159 ± 1 c
SD2218057 ± 1 c26 ± 2 c3663 ± 1 b
SD3220061 ± 1 b36 ± 3 b4065 ± 3 b
CK220067 ± 2 a65 ± 3 a070 ± 2 a
Notes: The significance was calculated separately for the different treatments to the control. Means followed by a common lowercase letter are not significantly different at the 0.05 level by the least significant difference test.
Table 3. Salt balance of CK and SDs during autumn irrigation period.
TreatmentSi
(t/ha)
Sd
(t/ha)
Sl
(t/ha)
Ss
(t/ha)
SD10.791.2220.17 ± 0.60 b20.6 ± 0.63 c
SD20.891.4122.55 ± 0.36 a23.07 ± 0.49 a
SD30.991.5022.96 ± 0.37 a23.47 ± 0.44 a
CK0.99023.19 ± 0.41 a22.20 ± 0.39 b
Notes: Si is the salt added with irrigation water (t ha−1), Sd is the salt drained out of the plot from the subsurface pipe (t ha−1), Sl is the salt leaching into the deep soil (below the depth of 150 cm) and the groundwater reservoir, and Ss is the decrease in 0–150 cm soil salt storage during autumn irrigation (t ha−1). The significance was calculated separately for the different treatments to the control. Means followed by a common lowercase letter are not significantly different at the 0.05 level by the least significant difference test.
Disclaimer/Publisher’s Note: The statements, opinions and data contained in all publications are solely those of the individual author(s) and contributor(s) and not of MDPI and/or the editor(s). MDPI and/or the editor(s) disclaim responsibility for any injury to people or property resulting from any ideas, methods, instructions or products referred to in the content.

