Article

Identification of Potential Farm Pond Sites for Spring Surface Runoff Harvesting Using an Integrated Analytical Hierarchy Process in a GIS Environment in Northern Kazakhstan

by
Zhanassyl Teleubay
1,2,*,
Farabi Yermekov
1,
Ismail Tokbergenov
1,
Zhanat Toleubekova
1,
Aigerim Assylkhanova
2,
Nurlan Balgabayev
3 and
Zoltán Kovács
2,4
1
Center for Technological Competence in the Field of Digitalization of the Agro-Industrial Complex, S.Seifullin Kazakh AgroTechnical Research University, Astana 010000, Kazakhstan
2
Department of Economic and Social Geography, University of Szeged, 6720 Szeged, Hungary
3
Kazakh Research Institute of Water Management, Taraz 080000, Kazakhstan
4
Research Centre for Astronomy and Earth Sciences, Geographical Institute, 1112 Budapest, Hungary
*
Author to whom correspondence should be addressed.
Water 2023, 15(12), 2258; https://doi.org/10.3390/w15122258
Submission received: 29 May 2023 / Revised: 12 June 2023 / Accepted: 14 June 2023 / Published: 16 June 2023
(This article belongs to the Section Water and Climate Change)

Abstract

:
People living in arid and semi-arid areas with highly variable rainfall often face droughts and floods that affect water availability. Surface runoff harvesting is a historical water delivery system utilized in times of water scarcity to fulfill the ever-increasing demand for water, address climate change, and prevent desertification. However, the study of snowmelt and flood water harvesting in steppe areas with cold and semi-arid climates are understudied in the international literature. This paper, combining remote sensing (RS) and a geographic information systems (GIS)-based analytical hierarchy process (AHP), provides a cost-efficient and reliable tool for assessing potential farm pond sites in the steppe region of Northern Kazakhstan. The research is based on six weighted thematic layers: hydrogeology (5%), slope (10%), drainage density (25.5%), land use/land cover (25.5%), soil (5%), and snow water equivalent (29%), which mainly influence the availability, runoff, infiltration, and accumulation of snowmelt and flood water, in order to identify potential farm pond sites in the Akkayin district (North Kazakhstan). As a result, 3.3% of the study area had a very high potential, 35.5% high, 56.5% medium, 4.6% low, and only 0.1% was recognized as the least preferred. The most suitable sites had medium drainage density, low slope, high snow water equivalent, and were located on flooded vegetation. The accuracy of our model was assessed using the existing farm pond sites from the Soviet era, which showed 82% coincidence. Furthermore, by collecting meltwater from 30% of the study area (135,000 ha), one-fourth of the cultivated land in the Akkayin district (i.e., 54,000 ha) could be transferred to deficit irrigation. This would reduce floods, stabilize farmers’ income in dry years, and open up the possibility of cultivating other highly profitable crops. Overall, the study provides evidence of the great potential of the Akkayin district in snow meltwater harvesting in farm ponds as a response to agricultural drought and spring floods.

1. Introduction

Owing to intensifying climate change and shifting seasons, the northern grain-growing regions of the Republic of Kazakhstan suffer from regular droughts in the warm season and floods in the spring [1,2]. According to the agricultural drought-monitoring data of the CACILM-2 project of the FAO UN, in the period from 2001 to 2022, Akkaiyn district was not affected by droughts only for 8 years, which mainly occurred at the beginning of the millennium (2001–2007), and after 2016, the severity of drought increased on an annual basis (with the exception of 2018). Owing to the absence of major rivers in the North Kazakhstan Region, most agricultural production focuses on rain-fed crops (i.e., crops without irrigation); drought is a major threat to crop failure [3]. There are three major crop types cultivated in the study area: cereals (wheat, barley, and oat), legumes (lentils, clover, alfalfa, and peas), and oilseeds (safflower, sunflower, rapeseed, and flax). The sowing campaign typically begins in mid-May and ends in October. According to a United Nations Development Programme report (Strategic Measures to Combat Desertification in the Republic of Kazakhstan Until 2025), drought is causing Kazakhstan to lose around 200 million euros annually [4]. At the same time, there is heavy precipitation in the solid form (snow) during the winter, which is accompanied by excess liquid precipitation in spring, resulting in devastating floods [5]. Hence, a record high water over the past half a century was recorded in 2017, which forced 4000 people to leave their homes and 15 flooded settlements [6]. In this regard, collecting snow melt and flood water in farm ponds could solve the abovementioned challenges caused by regular droughts and floods in the region [7,8]. This was practiced during Soviet times in the 1970s and 1980s, when thousands of farm ponds were created, most of which were for agricultural purposes. However, after the collapse of the Soviet Union in 1991, many farm ponds were abandoned, which led to an increase in the salinity of stagnant water. It must be noted that, when planning these ponds, the factors of climate change and increased spring floods were not taken into account. Thus, they were not aimed at solving flood problems in the region.
Spring surface runoff harvesting in farm ponds is “the management and collection of surface runoff to increase the availability of water for agriculture and domestic needs and to maintain the ecosystem” [9]. This is a historical water delivery system utilized in times of water scarcity to fulfill the ever-increasing demand for water, combat climate change and unpredictability, and prevent desertification. Spring surface runoff harvesting in farm ponds prevents erosion and flooding, and reduces water pollution at the same time [10]. This method has several advantages, such as regulating surface runoff during the spring flood season, providing water for irrigation, and mitigating water shortages during droughts using excess water. People living in arid and semi-arid areas with highly variable rainfall often face droughts or floods that affect water availability. The success of the spring surface runoff harvesting technique principally depends on the selection of a suitable location. Combining remote sensing (RS) and a geographic information systems (GIS)-based analytical hierarchy process (AHP) would be a cost-effective and reliable tool to assess potential farm pond sites. RS technology can gather, process, and manage vast amounts of data, allowing researchers to effectively investigate, analyze, and manage water resources. The GIS-driven AHP method, being the most preferred multi-criteria decision analysis (MCDA) tool in engineering, allows us to find the degree of superiority of one alternative over another according to specified criteria [11]. Despite the novel MCDA methods, such as CILOS, SAPEVO-M, MEREC, etc., proposed in the last decade, it is important to remember that no single method is perfect or suitable for application in all decision-making circumstances [12]. In this work, we have given preference to the traditional AHP method of the American School of Decision Support Systems [13]. This was justified by the fact that the AHP incorporates such qualities as an effortlessly reasonable system, the ability to disentangle a troublesome issue by dividing it into smaller steps, and the unnecessity of authentic information sets [13]. Furthermore, recent works on the identification of potential surface runoff (rainwater) harvesting using the AHP method proved the effectiveness of this approach, with an accuracy of 70 to 92% [10,14,15,16,17]. Table 1 provides a quick summary of recent studies on potential rainwater harvesting using MCDA methods. Nevertheless, the AHP model has a disadvantage in the limited number of pairwise comparisons. If the model contains a large number of criteria as well as alternatives, the decision-making process can take a long time, and over time, matrix inconsistencies can begin to increase due to loss of attention and lack of concentration on the subject. In our case, this problem was not material. Previously, several researchers utilized the above-mentioned approach with different parameters to assess groundwater potential [18,19,20,21,22,23,24,25,26,27], land suitability for solar farms [28,29,30,31,32], urban flood vulnerability [33,34,35], dam site selection along rivers [36,37,38], and rainwater harvesting [10,14,15,16,17,39,40,41]. However, there is an immense gap in the study of spring melt and flood water harvesting in snowy, steppe areas with cold and semi-arid climates, as most similar works were carried out in tropical or desert areas, with no winter (Guatemala, Saudi Arabia, Taiwan, Iraq, India, Kenya, etc.) [10,14,15,16,17,39,40,41]. This is reflected in the input parameters and criteria chosen by the authors for the AHP model. For instance, Maina and Raude [41] used rainfall, slope, soil, land use/land cover, and distance from settlements and roads, Wu et al. [14] used the same parameters, but replaced rainfall with runoff, and Kadam et al. [40] included catchment size in this list. In general, about 75% of the list of parameters remained unchanged. It should also be noted that none of the previous works considered the snow cover factor, as this was not possible for their study areas.
In contrast, in our research in the northern part of the Republic of Kazakhstan, snow cover is the most influential input parameter, as we assess the possibility of reserving snow meltwater in farm ponds for further agricultural use. This approach contributes to increasing water productivity in agriculture, which is very critical for arid and semi-arid areas. Water in farm ponds can be used for deficit irrigation; thus, farmers will not focus on achieving the maximum yield during dry periods, but will increase their economic benefits and income stability [42]. Nevertheless, experiments with deficit irrigation in Turkey that lasted for four years found that the wheat yield increased by 65% and the water productivity doubled compared with rainfed agriculture [43]. This fact has also been confirmed by studies in China [44,45], Syria [46], and Bangladesh [47].
Although there are many approaches to identifying potential rainwater harvesting sites worldwide using AHP methods, there is a great need for more advanced, new approaches adapted to cold, semi-arid, and steppe conditions. Thus, the main objective of this study is to evaluate the potential of the Akkayin district in snow meltwater harvesting in farm ponds for agricultural needs as a response to agricultural drought and spring floods. To achieve this, within the framework of this study, we set the goals to (1) develop an approach that can assess farm pond sites for snow meltwater harvesting in the cold, semi-arid steppe zone with high accuracy (>80%), (2) identify limiting factors, and (3) exclude field studies in the future that require a lot of time and resources. During the research, six parameters were considered to assess the potential zones of farm ponds: hydrogeology, slope, drainage density, land use/land cover, soil, and snow water equivalent, which mainly influence the availability, runoff, infiltration, and accumulation of snow melt and flood water in the Akkayin district, North Kazakhstan region. The use of these particular input parameters is based both on the existing literature and the opinion of three experts (two academic: Zhanat Toleubekova and Nurlan Balgabayev, and one industrial: Askar Abirov). It should also be noted that the snow water equivalent map was compiled based on the methodology developed by the authors earlier [48]. After assigning the weights to each factor using the AHP method, a map showing potential areas with low, medium, high, and very high snowmelt and floodwater storage potential for agriculture was prepared. Actual data from existing farm ponds in the study area were collected to assess the accuracy of the final result. The outcomes of the study can provide a basis for early warning of floods, mitigation of agricultural drought, and, most importantly, socio-economic advancement in the region. Moreover, under the CC BY license, field snow survey data have been published for independent testing and comparative research by the international research community, and a freely accessible geoportal containing all research results has been created (see Data Accessibility Statement).
This work is organized as follows: (1) the materials and methods for selecting suitable sites for meltwater collection are thoroughly explained, (2) technical, economic, and environmental limiting factors are identified, (3) the results of the GIS-driven AHP implementation are discussed, and (4) conclusions and recommendations for future research are provided.

2. Materials and Methods

2.1. Study Area

The study area (see Figure 1) is one of the largest grain-sowing regions of Kazakhstan, the Akkayin district, which is located in the North Kazakhstan region. The area experiences a sharply continental climate characterized by a large amplitude of annual temperatures and dryness. Most of the region is located on the West Siberian lowland. The main feature of the relief is characterized by many closed basins with groups of lakes and single lakes. The distribution of precipitation over the years has been highly uneven. The average annual rainfall is typically between 225 and 335 mm. However, there have been years when the total annual precipitation rose above 600 mm or dropped to 204 mm. The coldest month is January, with an average mean temperature of −18.5–18.7 °C. The hottest month is July, when the average mean temperature is +18.5–18.7 °C. The average precipitation in winter varies between 22 and 42 mm. The snow cover in the area is unevenly distributed due to strong winds blowing away snow in open areas. During the summer, dry winds cause the soil to dry out quickly. The soils in the region are zonally distributed, so that ordinary loamy chernozems occur in the northern part, and to the south, they turn into southern chernozems with a lighter composition.

2.2. Data Sources

2.2.1. In Situ Surveying

A field snow survey in key areas was carried out on two dates, in the middle (from 25 to 27 January 2023) and at the end (from 25 to 27 February 2023) of the winter season (Figure 2). In total, the depth of the snow cover was measured at 312 points, and the density at 65 points in the Akkayin district, North Kazakhstan region (see Table 2).
A wooden snow gauge M-103 II (LLP “Seaguard-Group”, Almaty, Kazakhstan) with a division of 1 mm was used to measure the snow cover depth, and for snow density, a snow weight gauge VS-43M (LLP “Seaguard-Group”, Almaty, Kazakhstan) was utilized. The following equation was used to calculate the actual snow density:
ρ = m S D × S
where ρ is the density of snow in g/cm3, m is the mass of snow in g, SD is the snow depth in cm, and S is the area of the snow weight gauge VS-43M in cm2.
Owing to the difficulty of movement in the study area, most of which is occupied by snow-covered agricultural fields, an RM Vector 551i snowmobile (JSC “Russkaya mekhanika”, Ryabinsk, Russia) was used for fast movement (see Figure A1 of Appendix A). The accurate geopositioning of snow survey points was carried out using a Garmin Montana 610 system. All the gathered field snow survey data are available under the CC BY license in FigShare (see Data Availability Statement).
Moreover, a UAV survey was conducted between 16 and 21 August 2021 to build a detailed digital surface model (DSM) for further hydrological analysis. For this purpose, a fixed-wing UAV Supercam S350 (Unmanned Systems Group, Izhevsk, Russia) with a Sony A6000 (Sony Group Corporation, Minato, Japan) payload was used (see Figure A2 of Appendix A). The flight was carried out at a height of 1 km with a longitudinal overlap of 80% and a transverse overlap of 60%. Thus, 4368 images were received within six days, covering an area of around 45,000 ha. Ground control points (GCP) were not used due to the vastness of the territory during the UAV survey. Nevertheless, the post-processing of the central points of all images was performed using data from the onboard dual-frequency GPS and Stonex S900 and S10 base stations.

2.2.2. Thematic Layers and Digital Satellite Image Datasets

Six thematic layers (hydrogeology, slope, drainage density, land use/land cover, soil, and snow water equivalent) essentially controlling melt and flood water availability were prepared based on the expert’s opinion and the available literature. Hydrogeological maps on a scale of 1:200,000 compiled by the Kazakh Hydrological Department were digitized and used as input parameters. The slope and drainage density were mapped using a digital elevation model, while the land-use map was generated using high-resolution (10 m) satellite imagery (Sentinel-1 and Sentinel-2) and a knowledge-based classification method. The FAO-UNESCO Soil Map of the World database was used to prepare the soil map of the study area. Field snow survey data and Sentinel-2 MSI images with the nearest dates to the survey were utilized to prepare the most critical parameter, the snow water equivalent. The details of digital satellite image specification are provided in Table 3. Satellite images were downloaded from the Google Earth Engine (GEE) multi-petabyte catalog.

2.3. Methodology

The potential zones for snowmelt and flood water reservations were determined by overlaying all thematic layers in a weighted linear combination method using the spatial analysis tool in ArcGIS Pro 2.8 software. The relative weights of thematic layers and subgroups were determined using the analytical hierarchy process method. The conceptual model of the proposed framework is shown in Figure 3. The weights were set considering the opinion of a team of experts, which included one industrial and two academic experts. In addition, to identify unsuitable zones, a vector layer of agricultural land in the Akkayin district with a buffer zone of 1 km was used to identify productive zones for reserving melt and flood waters for agriculture. We considered collecting and reserving meltwater at a distance of more than 1 km from agricultural land inefficient.

2.3.1. Identification of Unsuitable Zones to Reserve Melt and Flood Water

At this stage of research, a feasibility study was carried out regarding the potential to reserve melt and flood water in the Akkayin district. During the designation of potential areas for reserving melt and flood water for agricultural use, it is necessary to consider some technical, economic, and environmental factors. From a technical point of view, it is not justifiable to reserve meltwater in remote places and extend miles of pipes to agricultural fields. From an economic point of view, agricultural enterprises would need to purchase a large number of necessary goods, such as pipes, and maintain them, which requires enormous financial and labor resources. From an environmental point of view, we excluded areas with a high content of harmful metals (metalloids) in water, such as manganese and arsenic, which is unacceptable for agricultural use. For this purpose, six meltwater samples were taken at key points to conduct chemical water analysis in May 2022. Detailed results of the chemical analysis of meltwater are provided in the test report (see Figure A3 of Appendix A). For example, the analysis recorded an excess of the maximum allowable norm of arsenic by three times (the norm is 0.05 mg/dm3, and the measured value was 0.16 mg/dm3). In addition, to create a buffer zone of 1 km, the boundaries of agricultural land in the study area were digitized in the .shp format (Figure 4).

2.3.2. Preparation of Thematic Layers

On the basis of the existing literature and expert opinions, eight thematic layers were created. To avoid unnecessary complications, experts removed two thematic layers, and the remaining six layers were weighted based on the AHP method (see Figure A4 of Appendix A). Further, explanations are provided regarding specific thematic layers.

Hydrogeology

The hydrogeological map displays the conditions of the occurrence, distribution patterns, and formation of groundwater [49,50]. As these maps are based on the results of hydrogeological surveys, considering geological and tectonic maps, parameters such as the lithological composition of aquifers and mineralization were important in this study. A hydrogeological map of the study area was digitized using ArcGIS Pro 2.8 software.

Slope

The slope gradient, which depicts the steepness of the Earth’s surface, is a crucial relief component. According to Melese and Belay [25,51], a moderate slope has the maximum potential for infiltration, whereas a steeper slope produces more runoff. The slope is one of the more important parameters when choosing zones for reserving melt and flood waters, the average value of which in the Akkayin district is about 2%. In our case, sites with a slope of more than 5% had lower potential as surface runoff increased. The slope gradient map was created from the digital elevation model using the spatial analyst toolbox in ArcGIS Pro 2.8 software, which utilized the following formula:
S = d Z d x 2 + d Z d y 2
where S is a slope in 3D, dZ/dx is the horizontal difference in height divided by the distance between pixels, and dZ/dy is the vertical difference in height divided by the distance between pixels.

Drainage Density

Another factor that affects the evaluation of locations for snowmelt and floodwater storage in farm ponds is drainage density. According to several researchers [19,52,53], locations with high drainage density inevitably have high runoff, which, in turn, suggests poor infiltration rates and reserve potential. In this paper, we consider that the most preferable areas for farm ponds should be downstream, but below the highest drainage density value. To create a drainage density map of the study area, we performed multiple geoprocessing operations, such as stream ordering to identify and classify streams from the digital elevation model based on the number of tributaries and creating a grid index. Finally, the drainage density was calculated by the following equation using the Line Density tool in ArcGIS Pro 2.8 software:
D D = 1 n L A
where DD is the drainage density, L is the stream length, and A is the basin area.

Land Use/Land Cover

Land use and land cover significantly influence surface runoff, the infiltration rate, water consumption, and snow accumulation [54]. Accordingly, strongly snow-blown bare ground, built-up areas, and water bodies were classified as the least-preferable areas for snowmelt and flood water storage, while flooded vegetation, grasslands, and shrubs were the top-three areas with a favorable environment for constructing farm ponds. The land use/land cover map of the study area was created using high-resolution Sentinel-1 and Sentinel-2 imagery, and a knowledge-based classification method was obtained from the ESRI LULC 2021.

Soil

According to Anbazhgan et al. and Etikala et al. [55,56], soil cover influenced surface water runoff and infiltration rate, which, in turn, affected the availability of melt and flood water for the reservation. The soil’s physical characteristics, including grain size and pore space, could also strongly impact groundwater recharge [57,58]. In comparison with fine-grained soils, coarse-grained soils are known to have a high infiltration rate and cause a larger loss of surface runoff in reserving snow meltwater in farm ponds [59]. However, due to global climate change, snow cover is melting faster than usual when the ground is still frozen to a depth of 1 to 1.5 m. According to the permafrost-measuring device (merzlometr) installed in the regional center of the Akkayin district, the depth of soil freezing varied from 45 cm to 197 cm between October 2022 and April 2023. Thus, in the early spring, regardless of the soil type, meltwater does not infiltrate the soil and, in turn, causes destructive floods. In this study, a soil map of the study area was obtained from the FAO/UNESCO Soil Map of the World portal.

Snow Water Equivalent

The snow water equivalent was the most important parameter in this study, as it integrally characterized the depth and density of snow cover that was theoretically planned to be reserved in the farm ponds. Additionally, this parameter fully described the snow reserves in a particular area and could clarify the water regime of rivers and lakes [48]. A high-resolution (10 m) snow water equivalent map of the study area was prepared using the authors’ previously developed and validated methodology for assessing the depth of snow cover and snow water equivalent using remote sensing data and GIS technologies. The main approaches and methods for calculating the snow water equivalent are shown in Figure 5. All calculations were carried out on the Google Earth Engine multi-petabyte cloud platform, and the source codes are available at the following link [60].

2.3.3. Assigning Relative Weights

Each thematic layer has a distinct effect on the runoff, infiltration, and accumulation of melt and flood waters on the Earth’s surface [23,61]. The relative weight of the input parameters was determined by using the AHP method and was based on the degree of influence of layers on the occurrence and dynamics of surface waters [62]. As the hierarchy-based structure of the decision issue was essential to the AHP method, determining the primary criteria, sub-criteria, alternatives, and hierarchy structure was a significant component of the decision process. The hierarchical structure of this process is illustrated in Figure 6.
This model has been frequently employed as a decision-making tool in issues requiring intricate parameters and domains with constrained data, both in terms of variety and reliability [63,64]. In the current research, expert judgment and an eigenvector were applied to assign weight and order to the input layers, while the principal eigenvalue was used to rank the factors [65,66,67]. To define the relative significance of indicators based on Saaty scale values [62], a hydrogeologist with industrial experience was recruited from the Kazakh Research Institute of Water Management, and two academic experts were involved from the local university (Table 4).
By dividing the column values by the column grand total, the eigenvector—representing each indicator’s relative weight [68]—was created, as illustrated in Table 5. The consistency of the matrix was measured by the sum of the eigenvalues (principal eigenvalue λmax), and a pairwise comparison matrix (6 × 6) was created using the input factors. Each entry describes how the relative row has an impact on the column factor. By contrasting the λmax values of the pairwise comparison matrix with different thematic layers present, the validity of the matrix was evaluated. It is important to note that the total number of parameters was less than λmax. When indications are solved in pairs, a certain degree of consistency may develop. Therefore, verifying the given weight’s correctness in a pairwise comparison is crucial.
Given that the discrepancy of the matrix grew with the number of comparisons, the AHP technique incorporated a consistency index to track variance. A consistency ratio lower than 10% was required to determine the weight; otherwise, the relative weights of each indicator should have been changed to mitigate the disparity [69]. The consistency index, as illustrated in the formula, was the ratio of the difference between λmax and the total amount of input layers used.
C I = λ m a x n n 1
C R = C I R I
where CI is the consistency index, λmax is the principal eigenvalue, n is the number of layers, CR is the consistency ratio, and RI is a random index.
Table 6 shows that the principal eigenvalue for this research was 6.15, which was higher than the total number of input layers, and that the consistency ratio of 2% was also within the tolerance limit (10%), showing that both the given weighting and consistency in pairs were appropriate.
Moreover, each input layer was reclassified into a common ratio scale and combined to produce a map of potential farm pond sites (PFPSs) to store melt and flood water. All reclassified rasterized maps were overlaid using the Weighted Overlay analysis tool. Finally, the weighted values of each raster layer were multiplied by the cell score of each input raster. In addition, potential farm pond sites were classified based on the potential farm pond site index value. The PFPS index was a dimensionless value calculated from the weights of each thematic layer and its characteristics. The PFPS index was calculated using the following formula:
P F P S i = i = 1 n w i x i
where PFPSi is the potential farm pond sites index, n is the number of layers, W is the normalized weighting of the layer, and xi is a relative score of the ith layer at the tth pixel.

2.3.4. Validation of Farm Pond Sites

Regarding the scientific relevance of this study, model validation is essential to assess the reliability of the results [70]. In this work, the identified potential areas of farm ponds for snowmelt and flood water storage were tested using existing farm ponds, or rather, their digitized vector layers (see Figure A5 of Appendix A). In the literature, other researchers also used ground data to cross-check the developed model for identifying potential zones [71,72,73]. The observed data on existing farm ponds were digitized, geo-positioned, and overlaid on a delineated map of potential farm pond areas for melt and flood water storage in a GIS environment. Thus, the share of existing farm ponds located in zones with low, medium, high, and very high potentials was calculated.

3. Results

In this research, six parameters (hydrogeology, slope, drainage density, land use/land cover, soil, and snow water equivalent) that mainly influence the runoff, infiltration, and accumulation of surface melt and flood water were carefully considered in the study area to assess the potential zones for the location of farm ponds. After assigning weights to each factor using the AHP method, a map of potential areas with low, medium, high, and very high snowmelt and floodwater storage potential for agriculture was compiled.

3.1. Hydrogeology

As the hydrogeological map combined both hydrological and geological characteristics of the area, parameters such as the infiltration rate, runoff, mineralization, and lithological composition of the aquifer were considered essential. The study area was classified into three classes: Pliocene–Quaternary aquifer, Quaternary lacustrine–alluvial aquifer, and Neogene aquifer, and their areas accounted for 323,700 ha (70.4%), 88,600 ha (19.3%), and 47,500 ha (10.3%), respectively (Figure 7). In this study, the Neogene aquifer had low potential for farm pond construction sites, because most of its territory was already occupied by salty lakes unsuitable for agriculture. The quaternary lacustrine–alluvial aquifer was assigned medium potential, because it has a low infiltration rate and higher runoff. However, this class tends to be very well sorted with highly laminar clays and sometimes carbonates that do not allow common crops of the region to be cultivated. The Pliocene–Quaternary aquifer, with lower mineralization but a high infiltration rate occupying almost three-quarters of the Akkaiyn district, was the most suitable for reserving melt and flood water for agriculture.

3.2. Slope

Slope is an important parameter when it comes to selecting zones for reserving melt and flood waters, the average value of which is about 2% in the Akkayin district. Generally, the steeper the slope, the greater the runoff, and conversely, a moderate slope provides more potential for surface water infiltration. The slope map of the study area was classified into five classes, namely very high (0–1%), high (1–2%), medium (2–3%), low (3–4%), and very low (>4%) potential areas (Figure 8). The results showed that more than 80% of the Akkayin district is suitable for farm pond construction in terms of surface relief, as 42% of the territory had a score of very high potential and 40.5% had high potential. Nevertheless, 64,153 ha (14%) was found to have medium, 12,074 ha (2.6%) low, and 4287 ha (0.9%) very low potential to reserve spring surface runoff.

3.3. Drainage Density

Drainage density was the second most important parameter after the snow water equivalent in this study. Commonly, locations with high drainage density inevitably have high runoff, which, in turn, suggests poor infiltration rates and reserve potential. The drainage density map of the Akkayin district had five similar classes to the slope map. During classification, we granted more preference to drainage density values higher than zero but below the maximum. Thus, the areas with very high drainage density had very low potential (1.3%), high drainage density areas had low potential (8.5%), and very low drainage density areas had medium potential (29%) for snow meltwater reservation. Very high potential was found in areas with low drainage density (34.5%), and areas with an average drainage density had high potential (26.7%) (Figure 9). To sum up, more than 60% of the study area was found to be suitable for farm ponds in terms of drainage density.

3.4. Land Use/Land Cover

The third most important parameter, the land use/land cover map, originally had eight classes, but was reclassified into five, similar to the previous maps’ classes (Figure 10). As built-up areas are unsuitable for agriculture and bare ground surfaces are useless for snow meltwater reservation, they were amalgamated into one class with very low potential for farm pond site construction (0.9%). Low potential was also afforded to water bodies (2%), because most of them had high mineralization and were located relatively far from agricultural fields. Trees and crops were also grouped together and classified as areas with medium potential (59.1%), while shrubs were considered more suitable for farm pond sites and ranked as surfaces with high potential (24.1%). According to the opinion of experts, grass and flooded vegetation surfaces were the most appropriate fields for snow meltwater reservation, occupying only 13.9% of the study area.

3.5. Soil

The soil map of the study area consisted of four classes: ordinary chernozems, ordinary carbonate chernozems, ordinary solonetz chernozems, and solonetz (Figure 11). Based on its physicochemical characteristics, solonetz with excessive alkalinity, which is harmful to many crops, was classified as an area with very low (4%) potential for farm ponds. Further, depending on the degree of salinity, ordinary solonetz chernozem had medium potential (27.2%), ordinary carbonate chernozem high (7.2%), and ordinary chernozem had very high (61.6%) potential for reserving melt and spring water for agriculture. Considering that the infiltration and water-holding capacity of the watershed depended on the structure, mechanical composition, and soil type, these properties were not considered when ranking the classes, as the type (chernozem) and subtype (ordinary) of soil were the same throughout the Akkaiyn region.

3.6. Snow Water Equivalent

A high-resolution snow water equivalent map of the study area was prepared using the earlier methodology of the authors [48]. After all, in the framework of this study, it was planned to assess the snow cover and the possibility of its reservation in the spring for agricultural needs. Thus, the snow water equivalent map was the most crucial parameter in the hierarchy structure. The final map was reclassified into five classes, and the ranking was based on the rule that the more snow, the better (Figure 12). According to the map, zones with very low potential occupied 5.9% of the study area (SWE ≤ 10 kg/m2), zones with low potential covered 6.9% (SWE ≤ 20 kg/m2), and the area of the medium-potential zone accounted for 8.6% (SWE ≤ 30 kg/m2). Such a small share of unsuitable territories indicates that the region receives an enormous amount of precipitation during the winter, affording good potential for snow meltwater reservation in spring. Accordingly, territories with a snow water equivalent between 30 and 40 kg/m2 and more than 50 kg/m2 were classified as zones with high (19.8%) and very high (58.8%) potential for farm pond sites, respectively.

3.7. Overall Assessment of Potential Farm Pond Sites

Weights were assigned to each input parameter using the experts’ opinions and the AHP methodology described in Section 2.3.3. As a result, the snow water equivalent map had the most significant weight (29%), drainage density and land use/land cover maps had the same weight, which was equal to 25.5%, slope was assigned a less significant weight (10%), and hydrogeology and soil cover maps equally had the smallest share in the weighting, accounting only for 5% (Figure 13). According to our understanding, this is the most appropriate weight distribution for the northern steppe regions of the Republic of Kazakhstan and regions with similar soil and climatic conditions.
Furthermore, using the Weighted Overlay tool in ArcGIS Pro 2.8 software, weights and ranks were assigned to each input parameter and their classes in the GIS environment. Thus, after reclassifying and layering maps of unsuitable zones (1 km buffer zone from agricultural land and the results of the chemical analysis of water), a final map of potential farm pond sites for spring surface runoff harvesting was obtained (Figure 14). As in the previous cases, the map with potential zones was classified into five categories: very high (3.3%), high (35.5%), medium (56.5%), low (4.6%), and very low (0.1%) potential. When unsuitable areas were skipped, the 450,000-hectare surface of the study area decreased to 370,000 ha. In the remaining territory, the area of the most reasonable sites for reservation of snow meltwater was 12,224 ha, while the territory with high potential occupied 131,502 ha. Shrubs and flooded vegetation with medium drainage density and high snow water equivalent occupied a major part of the most suitable territories for farm ponds. The largest part of the Akkayin district, accounting for almost 210,000 ha, fell into zones with medium potential. According to our results, the greater share of agricultural fields had medium potential for snowmelt reservation in the study area. On the other hand, water bodies, built-up areas, and territories with high slope and drainage density were classified as zones with low (17,039 ha) and very low (370 ha) potential. The results illustrate that they formed a relatively smaller proportion of the study area, but, in fact, many unsuitable zones (e.g., saline and clayey soils, high drainage density, and low snow water equivalent) coincided with the clipped areas with a buffer zone of 1 km from agricultural fields. Overall, almost 145,000 ha of productive land was found to be suitable for harvesting spring surface runoff in small farm ponds in the Akkayin district.

3.8. Validation of Potential Farm Pond Sites Map

To validate the final results for potential farm pond sites for spring surface runoff harvesting, existing farm ponds from the Soviet era in the Akkayin district were digitized (see Figure A5 of Appendix A). These farm ponds were created in the 1970s and 1980s with bulldozer technology; some of them are funnels that were deliberately blown up with explosives. Given that the topographic and geodetic works were carried out during the planning stages of these massive farm ponds, we believe that the most suitable places from a geographical point of view were chosen. Thus, we overlaid a vector file with 121 existing farm ponds on the final map showing potential zones. We found that not a single Soviet-type farm pond was located in a low-potential zone (0%), while 18% of them were constructed on a territory with medium potential (see Figure A6 of Appendix A). This is because some farm ponds were also supplied with groundwater using drilled wells, thus being located close to existing settlements and also serving livestock. However, 79% of the Soviet farm ponds (95) were located in a high-potential zone, and 3% in a zone with very high potential. On average, the qualitative assessment of potential melt and flood water reservation areas matched more than 80% of the ground data of existing farm ponds. This means that our data highly correlate with the areas of existing sites using the analytical hierarchy process in the GIS environment.

4. Discussion

Our results indicate that the GIS-driven AHP method performed well in identifying potential farm pond sites for snow meltwater harvesting in the study area. The results also show that the Akkayin district has a great potential to utilize excess surface runoff in agriculture, which creates opportunities for sustainable agriculture in the future amidst climate change. Previous studies showed that, by using the AHP methodology, it is possible to determine potential groundwater zones [22,25,52] and flood-vulnerable areas [33,34] with an accuracy of 70 to 92%, while the current work achieved a precision of 82%, which was in line with the average accuracy range of earlier works. Compared with similar studies related to the identification of potential rainwater harvesting sites [10,14,15,16,17,40,41], this study used a snow parameter that was not previously taken into account. We found that snow was a major cause of spring floods and was also a possible solution to drought in the region. It all depends on the planning and management of natural resources. According to long-term data from field snow surveys in the Akkayin district, the territory is annually covered with 20 cm of snow, and the average snow density reaches 300 kg/m3. This means that one square meter of land contains about 60 L of snow water, or 600 m3 per hectare. Suppose we assume that water losses through evaporation and infiltration are 15%. In this case, the meltwater collected from the territory of 5 hectares will be enough for 1 ha of wheat under fully fledged irrigation or 2 ha under deficit irrigation [74]. Considering this proportion, it is easy to calculate that, theoretically, by collecting meltwater from 30% of the study area (135,000 ha), one-fourth of the cultivated land in the Akkayin district, which accounts for 54,000 ha, can be transferred to deficit irrigation. This would not only reduce floods and stabilize farmers’ income in dry years, but would also open up the possibility of cultivating other highly profitable crops. Accordingly, local municipalities would receive more taxes, and they would spend less money to restore infrastructure after devastating floods. This would lead to more sustainable development in the region, increase economic growth and social responsibility, and maintain ecological balance.
Nevertheless, during this research, we also found that using the AHP method in a GIS environment for the delimitation of potential zones had several limitations: (1) the results obtained were partially subjective, as they partly depended on the opinion of experts, (2) although the primary approach remained unchanged, the weighting of input parameters and sub-criteria were strongly tied to a particular geographic area and could not be scaled, and (3) adding/removing alternatives to/from the existing model led to a change in the preferential order of other alternatives without alternating the values of pairwise comparisons concerning individual criteria. Considering the advantages and limitations of the identification of potential farm pond sites for spring surface runoff harvesting using an integrated AHP in a GIS environment, we expect that our approach will be helpful for sustainable water management, improving the socio-economic conditions of the population, and the development of irrigated agriculture in the Akkayin district, North Kazakhstan.
Overall, the potential of the Akkayin district in snow meltwater harvesting in farm ponds for agricultural needs as a response to agricultural drought and spring floods was found to be great. This is because the region receives a huge amount of precipitation in the winter and spring every year, and the snow melts very quickly due to climate change. Even though the territory of the Akkayin district is covered with highly water-holding capacity chernozem, the snow meltwater does not infiltrate the soil, as it remains frozen to a depth of 1–1.5 m until April. This creates destructive floods, high surface runoff, soil erosion, and the possibility of excess water retention in farm ponds.

5. Conclusions

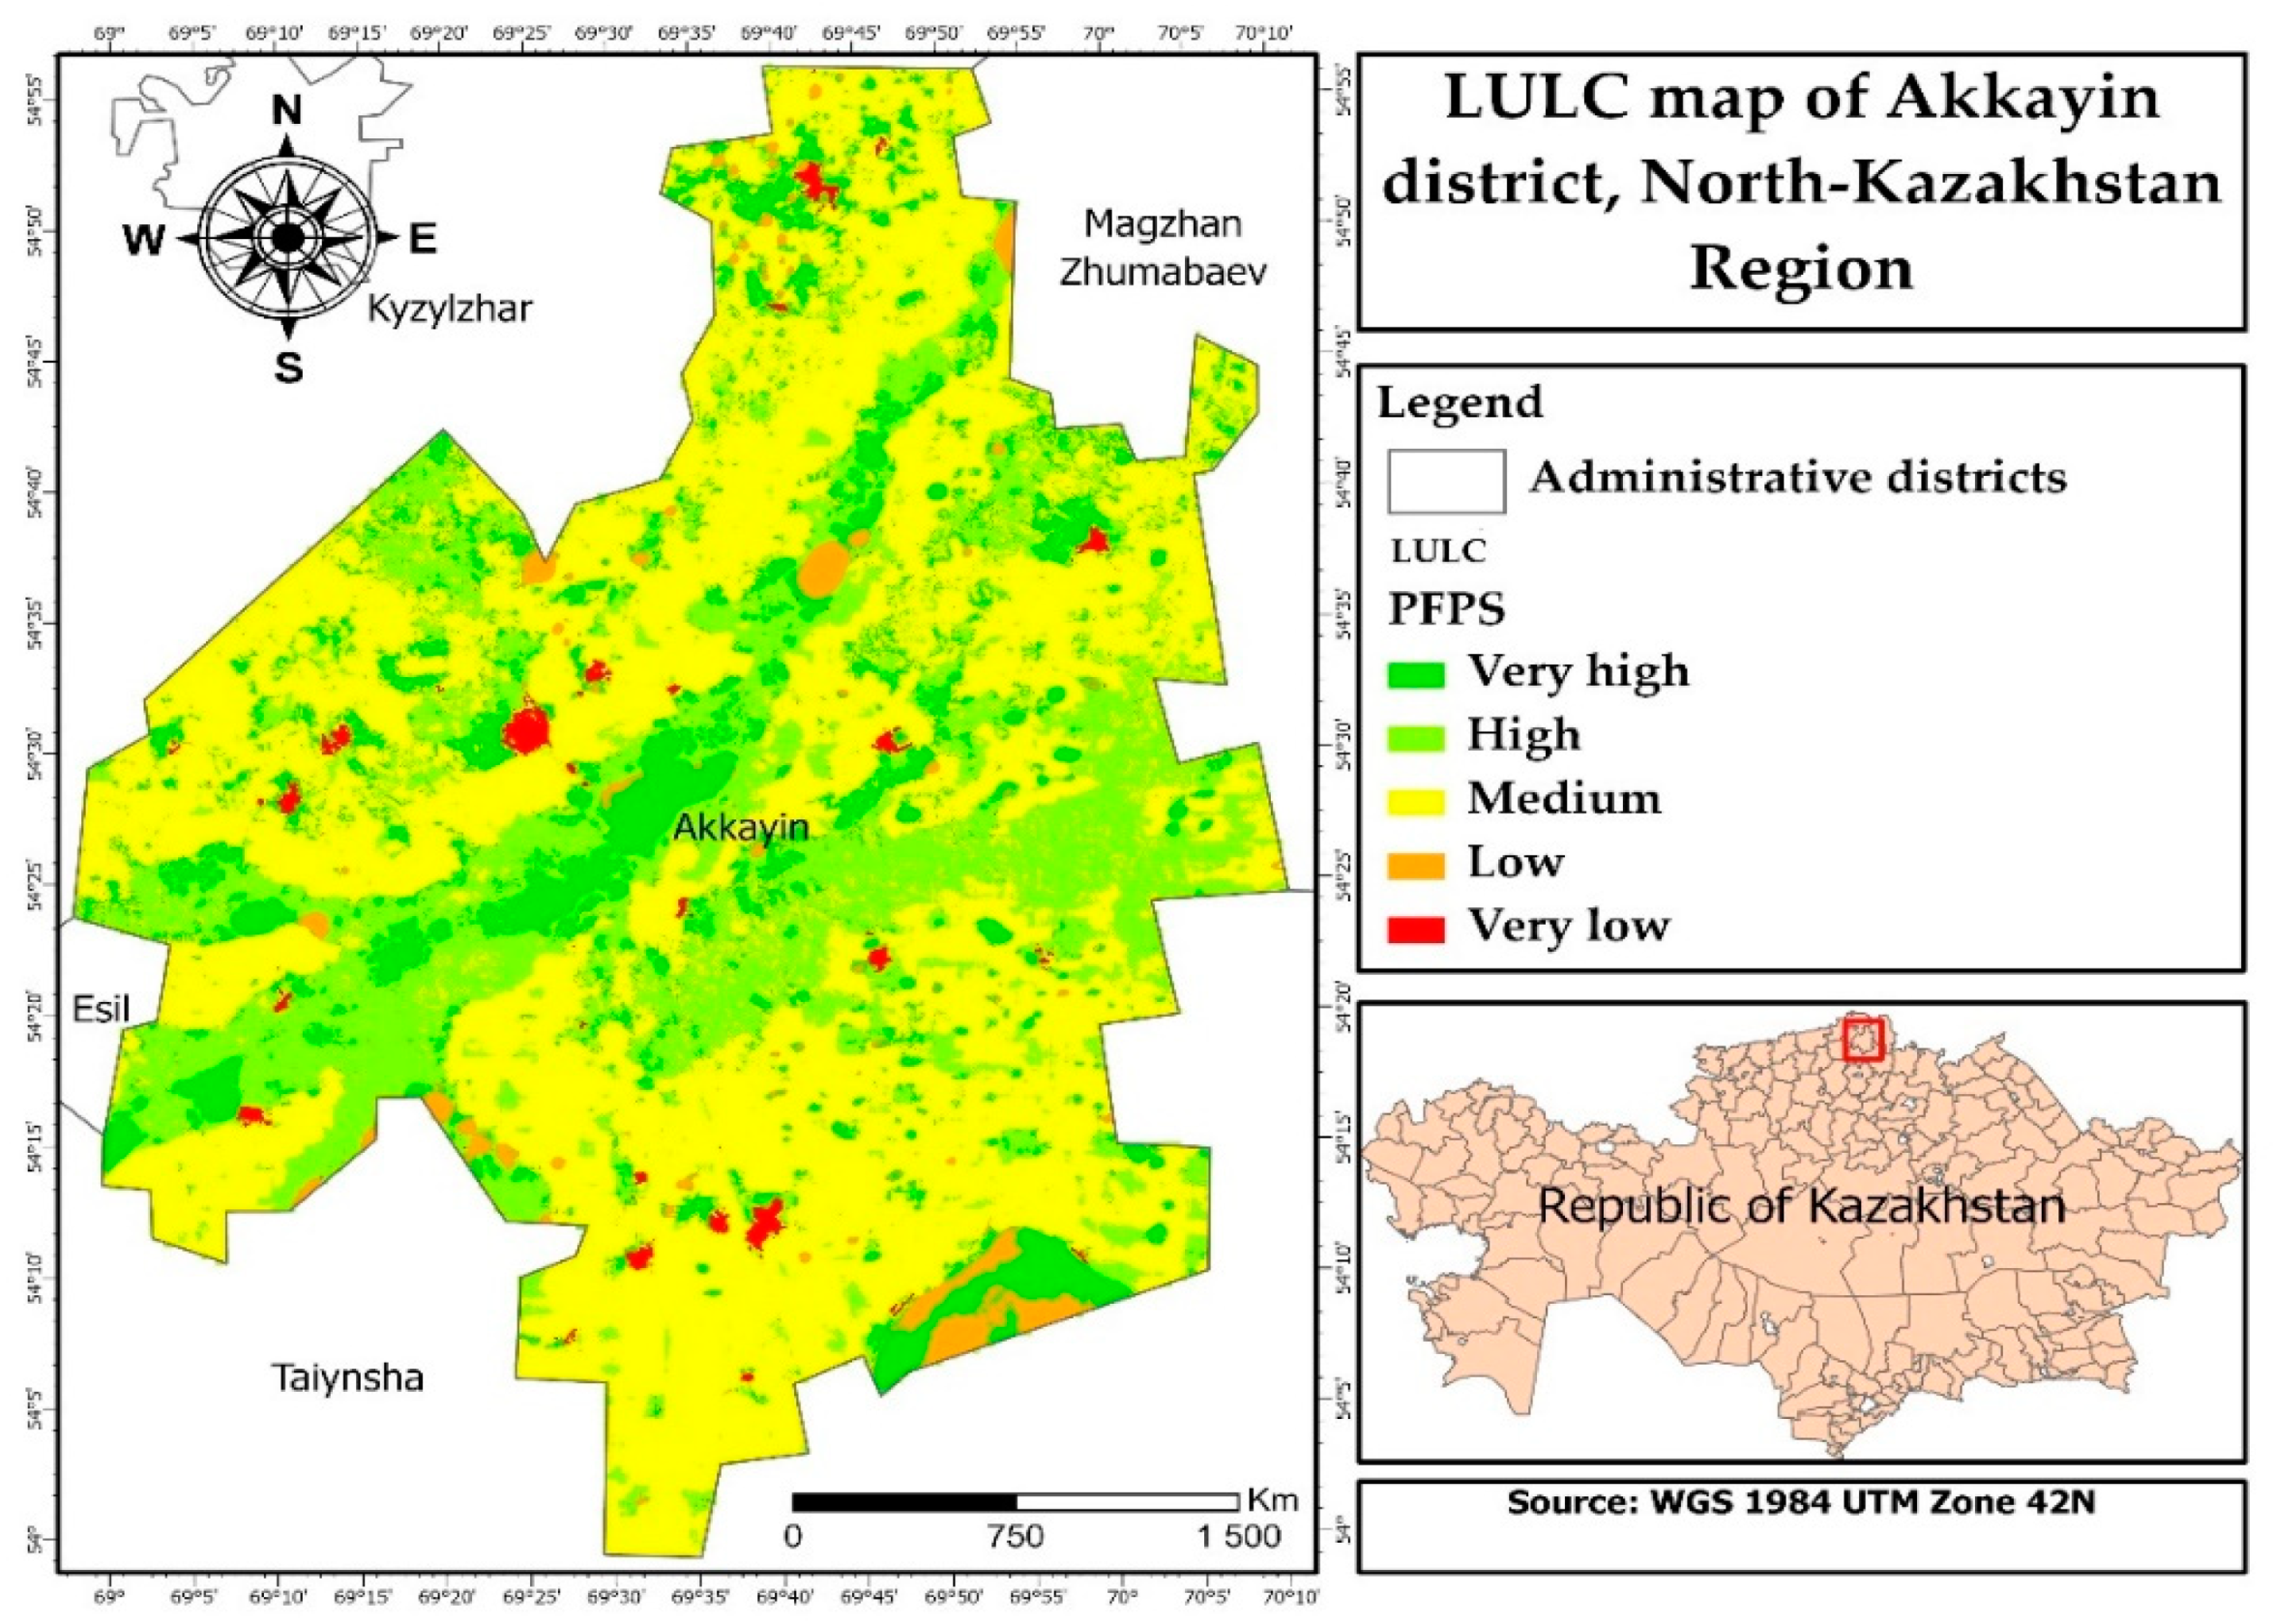
In this study, the identification of potential farm pond sites for surface runoff harvesting in the Akkayin district, North Kazakhstan region, was carried out using a GIS-driven AHP method and six input parameters: hydrogeology, slope, drainage density, land use/land cover, soil, and snow water equivalent, which mainly influence the availability, runoff, infiltration, and accumulation of snowmelt and flood water. As a result, 3.3% of the study area was recognized as a very-high-potential zone, 35.5% high, 56.5% medium, 4.6% low, and 0.1% as a very-low-potential zone. The most suitable territories were found to have medium drainage density, low slope, high snow water equivalent, and be located on flooded vegetation and shrubs. Moreover, the majority of cultivated agricultural land was classified to have medium potential, despite the significant amount of snow water stored and moderate slope. On the other hand, the less preferred zones formed a relatively smaller proportion of the study area, but the larger part of them coincided with the clipped areas with a buffer zone of 1 km from agricultural fields. As a result, using ground-based surveys, remote sensing, and AHP in a GIS environment, potential zones for farm ponds were obtained with an accuracy of 82%. The model accuracy was assessed by using the locations of existing farm ponds. Furthermore, limiting factors, such as the high content of harmful metals in meltwater and the optimal distance of farm ponds from agricultural fields, were also identified. The use of the model allows us to avoid field studies that require a lot of time and resources in further research. We think that our approach can be suitable for regions with similar soil and climatic conditions to Northern Kazakhstan to address drought and spring flood challenges through sustainable management and increasing water productivity. Further work is planned to evaluate the possible socio-economic effects of introducing sustainable water management by snowmelt and flood water harvesting in farm ponds and increasing water productivity in irrigation.

Author Contributions

Z.T. (Zhanassyl Teleubay) analyzed the data and drafted the manuscript; F.Y., I.T., Z.T. (Zhanat Toleubekova) and N.B. completed the manuscript and made major revisions; A.A. searched for references; Z.K. revised and proofread the manuscript. All authors have read and agreed to the published version of the manuscript.

Funding

This research has been funded by the Ministry of Agriculture of the Republic of Kazakhstan (Individual project registration number BR10764920) within the framework of the Scientific and Technical Program (STP) “Technologies and Technical Means of Irrigation when Introducing New Lands for Irrigation, Reconstruction, and Modernization of Existing Irrigation Systems” for 2021–2023. The work of Z.K. was supported by the Hungarian Scientific Research Fund (OTKA) Grant Agreement No. K135546, and the National Research, Development and Innovation Fund of the Ministry of Innovation and Technology, Hungary, grant number TKP2021-NVA-09.

Data Availability Statement

The field snow survey data used in the current work are openly available under the CC BY license in FigShare at https://doi.org/10.6084/m9.figshare.c.6651380.v1 (accessed on 13 June 2023). As part of the project, a geoportal was built: https://maps.gistech.kz/niiwater/ (accessed on 13 June 2023).

Conflicts of Interest

The authors declare no conflict of interest.

Abbreviations

AHPAnalytical hierarchy process
CC BYCreative Commons Attribution License
CIConsistency index
CILOSCriterion impact loss
CRConsistency ratio
DDDrainage density
DEMDigital elevation model
DSMDigital surface model
FAO UNFood and Agriculture Organization of the United Nations
GCPGround control points
GEEGoogle earth engine
GISGeographic information system
GPSGlobal positioning system
LULCLand use and land cover
MCDAMulti-criteria decision analysis
MERECMethod based on the removal effects of criteria
MSIMultispectral instrument
PFPSPotential farm pond sites
RIRandom index
RSRemote sensing
SAPEVO-MSimple aggregation of preferences expressed by ordinal vectors group decision making
SDSnow depth
SWESnow water equivalent
UAVUnmanned aerial vehicle
UNESCOUnited Nations Educational, Scientific and Cultural Organization

AppendixA

Figure A1. The process of measuring the snow height and density.
Water 15 02258 g0a1
Figure A2. The process of conducting a field UAV survey in the study area.
Water 15 02258 g0a2
Figure A3. Results (protocol) of the chemical analysis of meltwater at critical points of Akkayin district, North Kazakhstan region, and its English translation.
Water 15 02258 g0a3
Figure A4. Input thematic layers for potential farm pond site identification.
Water 15 02258 g0a4
Figure A5. Existing farm ponds from the USSR era in Akkayin district, North Kazakhstan region.
Water 15 02258 g0a5
Figure A6. Share of existing farm ponds in the developed map of potential zones.
Water 15 02258 g0a6

References

  1. Dubovyk, O.; Ghazaryan, G.; González, J.; Graw, V.; Löw, F.; Schreier, J. Drought Hazard in Kazakhstan in 2000–2016: A Remote Sensing Perspective. Environ. Monit. Assess. 2019, 191, 510. [Google Scholar] [CrossRef] [PubMed]
  2. Patrick, E. Drought Characterization and Management in Central Asia Region and Turkey; FAO Water Reports; FAO: Rome, Italy, 2017; ISBN 978-92-5-109604-8. [Google Scholar]
  3. Suleimenov, M.; Saparov, A.; Akshalov, K.; Kaskarbayev, Z. Land Degradation Issues in Kazakhstan and Measures to Address Them: Research and Adoption. Pedologist 2012, 55, 373–381. [Google Scholar] [CrossRef]
  4. Zhumabayev, E. Strategic Measures to Combat Desertification in the Republic of Kazakhstan until 2025|United Nations Development Programme. Available online: https://www.undp.org/ru/kazakhstan (accessed on 8 May 2023).
  5. Ongdas, N.; Akiyanova, F.; Karakulov, Y.; Muratbayeva, A.; Zinabdin, N. Application of HEC-RAS (2D) for Flood Hazard Maps Generation for Yesil (Ishim) River in Kazakhstan. Water 2020, 12, 2672. [Google Scholar] [CrossRef]
  6. Berezhnaya, Y. Residents of Northern Kazakhstan Are Afraid of a Repeat of the Unprecedented Flood. Available online: https://ru.sputnik.kz/20200131/severnyi-kazakhstan-povtorenie-pavodok-12714711.html (accessed on 8 May 2023).
  7. Rahman, A. Recent Advances in Modelling and Implementation of Rainwater Harvesting Systems towards Sustainable Development. Water 2017, 9, 959. [Google Scholar] [CrossRef] [Green Version]
  8. Al-Abadi, A.; Al-Shamma’a, A.; Aljabbari, M. A GIS-Based DRASTIC Model for Assessing Intrinsic Groundwater Vulnerability in Northeastern Missan Governorate, Southern Iraq. Appl. Water Sci. 2014, 7, 89–101. [Google Scholar] [CrossRef] [Green Version]
  9. Mekdaschi Studer, R.; Liniger, H. Water Harvesting: Guidelines to Good Practice; FAO: Rome, Italy, 2013. [Google Scholar]
  10. Alwan, I.A.; Aziz, N.A.; Hamoodi, M.N. Potential Water Harvesting Sites Identification Using Spatial Multi-Criteria Evaluation in Maysan Province, Iraq. ISPRS Int. J. Geo-Inf. 2020, 9, 235. [Google Scholar] [CrossRef] [Green Version]
  11. Ayan, B.; Abacıoğlu, S.; Basilio, M.P. A Comprehensive Review of the Novel Weighting Methods for Multi-Criteria Decision-Making. Information 2023, 14, 285. [Google Scholar] [CrossRef]
  12. Guitouni, A.; Martel, J.-M. Tentative Guidelines to Help Choosing an Appropriate MCDA Method. Eur. J. Oper. Res. 1998, 109, 501–521. [Google Scholar] [CrossRef]
  13. Karthikeyan, R.; Venkatesan, K.; Chandrasekar, A. A Comparison of Strengths and Weaknesses for Analytical Hierarchy Process. J. Chem. Pharm. Sci. 2019, 9, 12–15. [Google Scholar]
  14. Wu, R.-S.; Molina, G.L.L.; Hussain, F. Optimal Sites Identification for Rainwater Harvesting in Northeastern Guatemala by Analytical Hierarchy Process. Water Resour. Manag. 2018, 32, 4139–4153. [Google Scholar] [CrossRef] [Green Version]
  15. Sayl, K.; Adham, A.; Ritsema, C.J. A GIS-Based Multicriteria Analysis in Modeling Optimum Sites for Rainwater Harvesting. Hydrology 2020, 7, 51. [Google Scholar] [CrossRef]
  16. Balkhair, K.S.; Ur Rahman, K. Development and Assessment of Rainwater Harvesting Suitability Map Using Analytical Hierarchy Process, GIS and RS Techniques. Geocarto Int. 2021, 36, 421–448. [Google Scholar] [CrossRef]
  17. Chowdhury, M.; Paul, P.K. Identification of Suitable Sites for Rainwater Harvesting Using Fuzzy AHP and Fuzzy Gamma Operator: A Case Study. Arab. J. Geosci. 2021, 14, 585. [Google Scholar] [CrossRef]
  18. Subbarayan, S.; Thiyagarajan, S.; Jesudasan, J.; Singh, L.; Ayyakkanu, S.; Devanantham, A. Delineation of Groundwater Potential Zone Using Analytical Hierarchy Process and GIS for Gundihalla Watershed, Karnataka, India. Arab. J. Geosci. 2020, 13, 695. [Google Scholar] [CrossRef]
  19. Murmu, P.; Kumar, M.; Lal, D.; Sonker, I.; Singh, S.K. Delineation of Groundwater Potential Zones Using Geospatial Techniques and Analytical Hierarchy Process in Dumka District, Jharkhand, India. Groundw. Sustain. Dev. 2019, 9, 100239. [Google Scholar] [CrossRef]
  20. Lentswe, G.; Molwalefhe, L. Delineation of Potential Groundwater Recharge Zones Using Analytic Hierarchy Process-Guided GIS in the Semi-Arid Motloutse Watershed, Eastern Botswana. J. Hydrol. Reg. Stud. 2020, 28, 100674. [Google Scholar] [CrossRef]
  21. Upwanshi, M.; Damry, K.; Pathak, D.; Tikle, S.; Das, S. Delineation of Potential Groundwater Recharge Zones Using Remote Sensing, GIS, and AHP Approaches. Urban. Clim. 2023, 48, 101415. [Google Scholar] [CrossRef]
  22. Doke, A.; Zolekar, R.; Patel, H.; Das, S. Geospatial Mapping of Groundwater Potential Zones Using Multi-Criteria Decision-Making AHP Approach in a Hardrock Basaltic Terrain in India. Ecol. Indic. 2021, 127, 107685. [Google Scholar] [CrossRef]
  23. Arulbalaji, P.; Padmalal, D.; Sreelash, K. GIS and AHP Techniques Based Delineation of Groundwater Potential Zones: A Case Study from Southern Western Ghats, India. Sci. Rep. 2019, 9, 2082. [Google Scholar] [CrossRef] [Green Version]
  24. Şener, E.; Şener, Ş.; Davraz, A. Groundwater Potential Mapping by Combining Fuzzy-Analytic Hierarchy Process and GIS in Beyşehir Lake Basin, Turkey. Arab. J. Geosci. 2018, 11, 187. [Google Scholar] [CrossRef]
  25. Melese, T.; Belay, T. Groundwater Potential Zone Mapping Using Analytical Hierarchy Process and GIS in Muga Watershed, Abay Basin, Ethiopia. Glob. Chall. 2022, 6, 2100068. [Google Scholar] [CrossRef] [PubMed]
  26. Berhanu, K.G.; Hatiye, S.D. Identification of Groundwater Potential Zones Using Proxy Data: Case Study of Megech Watershed, Ethiopia. J. Hydrol. Reg. Stud. 2020, 28, 100676. [Google Scholar] [CrossRef]
  27. Aouragh, M.H.; Essahlaoui, A.; Abdelhadi, O.; El Hmaidi, A.; Said, K. Using Remote Sensing and GIS-Multicriteria Decision Analysis for Groundwater Potential Mapping in the Middle Atlas Plateaus, Morocco. Res. J. Recent Sci. 2015, 4, 2502. [Google Scholar]
  28. Noorollahi, E.; Fadai, D.; Shirazi, M.A.; Ghodsipour, S.H. Land Suitability Analysis for Solar Farms Exploitation Using GIS and Fuzzy Analytic Hierarchy Process (FAHP)—A Case Study of Iran. Energies 2016, 9, 643. [Google Scholar] [CrossRef] [Green Version]
  29. Sindhu, S.; Nehra, V.; Luthra, S. Investigation of Feasibility Study of Solar Farms Deployment Using Hybrid AHP-TOPSIS Analysis: Case Study of India. Renew. Sustain. Energy Rev. 2017, 73, 496–511. [Google Scholar] [CrossRef]
  30. Uyan, M. GIS-Based Solar Farms Site Selection Using Analytic Hierarchy Process (AHP) in Karapinar Region, Konya/Turkey. Renew. Sustain. Energy Rev. 2013, 28, 11–17. [Google Scholar] [CrossRef]
  31. Mehdaoui, R.; Anane, M.; Kurz, E.E.C.; Hellriegel, U.; Hoinkis, J. Geospatial Multi-Criteria Approach for Ranking Suitable Shallow Aquifers for the Implementation of an On-Farm Solar-PV Desalination System for Sustainable Agriculture. Sustainability 2022, 14, 8113. [Google Scholar] [CrossRef]
  32. Elboshy, B.; Alwetaishi, M.; Aly, R.M.H.; Zalhaf, A.S. A Suitability Mapping for the PV Solar Farms in Egypt Based on GIS-AHP to Optimize Multi-Criteria Feasibility. Ain Shams Eng. J. 2022, 13, 101618. [Google Scholar] [CrossRef]
  33. Gigović, L.; Pamučar, D.; Bajić, Z.; Drobnjak, S. Application of GIS-Interval Rough AHP Methodology for Flood Hazard Mapping in Urban Areas. Water 2017, 9, 360. [Google Scholar] [CrossRef] [Green Version]
  34. Ouma, Y.O.; Tateishi, R. Urban Flood Vulnerability and Risk Mapping Using Integrated Multi-Parametric AHP and GIS: Methodological Overview and Case Study Assessment. Water 2014, 6, 1515–1545. [Google Scholar] [CrossRef] [Green Version]
  35. Vojtek, M.; Vojteková, J. Flood Susceptibility Mapping on a National Scale in Slovakia Using the Analytical Hierarchy Process. Water 2019, 11, 364. [Google Scholar] [CrossRef] [Green Version]
  36. Jozaghi, A.; Alizadeh, B.; Hatami, M.; Flood, I.; Khorrami, M.; Khodaei, N.; Tousi, E.G. A Comparative Study of the AHP and TOPSIS Techniques for Dam Site Selection Using GIS: A Case Study of Sistan and Baluchestan Province, Iran. Geosciences 2018, 8, 494. [Google Scholar] [CrossRef] [Green Version]
  37. Yasser, M.; Jahangir, K.; Mohmmad, A. Earth Dam Site Selection Using the Analytic Hierarchy Process (AHP): A Case Study in the West of Iran. Arab. J. Geosci. 2013, 6, 3417–3426. [Google Scholar] [CrossRef]
  38. Esavi, V.; Karami, J.; Alimohammadi, A.; Niknezhad, S.A. Comparison the AHP and FUZZY-AHP Decision Making Methods in Underground DAM Site Selection in Taleghan Basin. Sci. Q. J. Geosci. 2012, 22, 27–34. [Google Scholar] [CrossRef]
  39. Chou, W.-W.; Lee, S.-H.; Wu, C.-F. Evaluation of the Preservation Value and Location of Farm Ponds in Yunlin County, Taiwan. Int. J. Environ. Res. Public. Health 2014, 11, 548–572. [Google Scholar] [CrossRef]
  40. Kadam, A.; Kale, S.; Pande, N.; Pawar, N.; Sankhua, R. Identifying Potential Rainwater Harvesting Sites of a Semi-Arid, Basaltic Region of Western India, Using SCS-CN Method. Water Resour. Manag. 2012, 26, 2537–2554. [Google Scholar] [CrossRef]
  41. Maina, C.; Raude, J. Assessing Land Suitability for Rainwater Harvesting Using Geospatial Techniques: A Case Study of Njoro Catchment, Kenya. Appl. Environ. Soil Sci. 2016, 2016, 4676435. [Google Scholar] [CrossRef] [Green Version]
  42. English, M. Deficit Irrigation. I: Analytical Framework. J. Irrig. Drain. Eng. 1990, 116, 399–412. [Google Scholar] [CrossRef]
  43. Ilbeyi, A.; Ustun, H.; Oweis, T.; Pala, M.; Benli, B. Wheat Water Productivity and Yield in a Cool Highland Environment: Effect of Early Sowing with Supplemental Irrigation. Agric. Water Manag. 2006, 82, 399–410. [Google Scholar] [CrossRef]
  44. Kang, S.; Zhang, L.; Liang, Y.; Hu, X.; Cai, H.; Gu, B. Effects of Limited Irrigation on Yield and Water Use Efficiency of Winter Wheat in the Loess Plateau of China. Agric. Water Manag. 2002, 55, 203–216. [Google Scholar] [CrossRef]
  45. Zhang, Y.; Kendy, E.; Qiang, Y.; Changming, L.; Yanjun, S.; Hongyong, S. Effect of Soil Water Deficit on Evapotranspiration, Crop Yield, and Water Use Efficiency in the North China Plain. Agric. Water Manag. 2004, 64, 107–122. [Google Scholar] [CrossRef]
  46. Zhang, H.; Oweis, T. Water–Yield Relations and Optimal Irrigation Scheduling of Wheat in the Mediterranean Region. Agric. Water Manag. 1999, 38, 195–211. [Google Scholar] [CrossRef]
  47. Ali, M.H.; Hoque, M.R.; Hassan, A.A.; Khair, A. Effects of Deficit Irrigation on Yield, Water Productivity, and Economic Returns of Wheat. Agric. Water Manag. 2007, 92, 151–161. [Google Scholar] [CrossRef]
  48. Teleubay, Z.; Yermekov, F.; Tokbergenov, I.; Toleubekova, Z.; Igilmanov, A.; Yermekova, Z.; Assylkhanova, A. Comparison of Snow Indices in Assessing Snow Cover Depth in Northern Kazakhstan. Sustainability 2022, 14, 9643. [Google Scholar] [CrossRef]
  49. Smith, L. Hydrogeology. In Reference Module in Earth Systems and Environmental Sciences; Elsevier: Amsterdam, The Netherlands, 2015; ISBN 978-0-12-409548-9. [Google Scholar]
  50. Ravier, E.; Buoncristiani, J.-F. Glaciohydrogeology. In Past Glacial Environments; Elsevier: Amsterdam, The Netherlands, 2018; pp. 431–466. ISBN 978-0-08-100524-8. [Google Scholar]
  51. Hagos, Y.G.; Andualem, T.G. Geospatial and Multi-Criteria Decision Approach of Groundwater Potential Zone Identification in Cuma Sub-Basin, Southern Ethiopia. Heliyon 2021, 7, e07963. [Google Scholar] [CrossRef] [PubMed]
  52. Andualem, T.G.; Demeke, G.G. Groundwater Potential Assessment Using GIS and Remote Sensing: A Case Study of Guna Tana Landscape, Upper Blue Nile Basin, Ethiopia. J. Hydrol. Reg. Stud. 2019, 24, 100610. [Google Scholar] [CrossRef]
  53. Thomas, R.; Duraisamy, V. Hydrogeological Delineation of Groundwater Vulnerability to Droughts in Semi-Arid Areas of Western Ahmednagar District. Egypt. J. Remote Sens. Space Sci. 2018, 21, 121–137. [Google Scholar] [CrossRef]
  54. Yifru, B.A.; Chung, I.-M.; Kim, M.-G.; Chang, S.W. Assessing the Effect of Land/Use Land Cover and Climate Change on Water Yield and Groundwater Recharge in East African Rift Valley Using Integrated Model. J. Hydrol. Reg. Stud. 2021, 37, 100926. [Google Scholar] [CrossRef]
  55. Anbazhagan, S.; Ramasamy, S. Evaluation of Areas for Artificial Groundwater Recharge in Ayyar Basin, Tamil Nadu, India through Statistical Terrain Analysis. J. Geol. Soc. India 2006, 67, 59–68. [Google Scholar]
  56. Etikala, B.; Golla, V.; Li, P.; Renati, S. Deciphering Groundwater Potential Zones Using MIF Technique and GIS: A Study from Tirupati Area, Chittoor District, Andhra Pradesh, India. HydroResearch 2019, 1, 1–7. [Google Scholar] [CrossRef]
  57. Musa, J.J.; Anijofor, S.C.; Obasa, P.; Avwevuruvwe, J.J. Effects of Soil Physical Properties on Erodibility and Infiltration Parameters of Selected Areas in Gidan Kwano. Niger. J. Technol. Res. 2017, 12, 46–54. [Google Scholar] [CrossRef]
  58. Gomboš, M.; Pavelková, D.; Kandra, B.; Tall, A. Impact of Soil Texture and Position of Groundwater Level on Evaporation from the Soil Root Zone. In Water Resources in Slovakia: Part I: Assessment and Development; The Handbook of Environmental Chemistry; Negm, A.M., Zeleňáková, M., Eds.; Springer International Publishing: Cham, Switzerland, 2019; pp. 167–181. ISBN 978-3-319-92853-1. [Google Scholar]
  59. Nolan, B.; Healy, R.; Taber, P.; Perkins, K.; Hitt, K.; Wolock, D. Factors Influencing Groundwater Recharge in the Eastern United States. J. Hydrol. 2006, 332, 187–205. [Google Scholar] [CrossRef] [Green Version]
  60. Teleubay, Z. Source Codes for Snow Depth and Snow Water Equivalent Calculation on Google Earthe Enigne Platform Using Sentinel-2 MSI Images. 2023. Available online: https://code.earthengine.google.com/5275cee100317d553e5b31013d9b1635 (accessed on 13 May 2023).
  61. Yeh, H.-F.; Cheng, Y.-S.; Lin, H.-I.; Lee, C.-H. Mapping Groundwater Recharge Potential Zone Using a GIS Approach in Hualian River, Taiwan. Sustain. Environ. Res. 2016, 26, 33–43. [Google Scholar] [CrossRef] [Green Version]
  62. Saaty, T. Decision Making with the Analytic Hierarchy Process. Int. J. Serv. Sci. 2008, 1, 83–98. [Google Scholar] [CrossRef] [Green Version]
  63. Saaty, T.; Vargas, L. Models, Methods, Concepts & Applications of the Analytic Hierarchy Process; Springer Science & Business Media: New York, NY, USA, 2001; ISBN 978-1-4614-3596-9. [Google Scholar]
  64. Asadabadi, M.; Chang, E.; Saberi, M. Are MCDM Methods Useful? A Critical Review of Analytic Hierarchy Process (AHP) and Analytic Network Process (ANP). Cogent Eng. 2019, 6, 1623153. [Google Scholar] [CrossRef]
  65. Carver, S.; Carver, S.J. Integrating Multi-Criteria Evaluation with Geographical Information Systems. Int. J. Geogr. Inf. Sci. 1991, 5, 321–339. [Google Scholar] [CrossRef] [Green Version]
  66. Hajkowicz, S.; Higgins, A. A Comparison of Multiple Criteria Analysis Techniques for Water Resource Management. Eur. J. Oper. Res. 2008, 184, 255–265. [Google Scholar] [CrossRef]
  67. Malczewski, J. GIS-Based Multicriteria Decision Analysis: A Survey of the Literature. Int. J. Geogr. Inf. Sci. 2006, 20, 703–726. [Google Scholar] [CrossRef]
  68. Brunelli, M. Introduction to the Analytic Hierarchy Process; SpringerBriefs in Operations Research; Springer International Publishing: Cham, Switzerland, 2015; ISBN 978-3-319-12501-5. [Google Scholar]
  69. Saaty, T.L. Axiomatic Foundation of the Analytic Hierarchy Process. Manag. Sci. 1986, 32, 841–855. [Google Scholar] [CrossRef]
  70. Chung, C.-J.; Fabbri, A. Validation of Spatial Prediction Models for Landslide Hazard Mapping. Nat. Hazards 2003, 30, 451–472. [Google Scholar] [CrossRef]
  71. Jha, M.; Chowdary, V.; Chowdhury, A. Groundwater Assessment in Salboni Block, West Bengal (India) Using Remote Sensing, Geographical Information System and Multi-Criteria Decision Analysis Techniques. Hydrogeol. J. 2010, 18, 1713–1728. [Google Scholar] [CrossRef]
  72. Magesh, N.S.; Chandrasekar, N.; Soundranayagam, J.P. Delineation of Groundwater Potential Zones in Theni District, Tamil Nadu, Using Remote Sensing, GIS and MIF Techniques. Geosci. Front. 2012, 3, 189–196. [Google Scholar] [CrossRef] [Green Version]
  73. Sarwar, A.; Ahmad, S.R.; Rehmani, M.I.A.; Javid, M.A.; Gulzar, S.; Shehzad, M.A.; Dar, J.S.; Baazeem, A.; Iqbal, M.A.; Rahman, M.H.U.; et al. Mapping Groundwater Potential for Irrigation, by Geographical Information System and Remote Sensing Techniques: A Case Study of District Lower Dir, Pakistan. Atmosphere 2021, 12, 669. [Google Scholar] [CrossRef]
  74. Geerts, S.; Raes, D. Deficit Irrigation as an On-Farm Strategy to Maximize Crop Water Productivity in Dry Areas. Agric. Water Manag. 2009, 96, 1275–1284. [Google Scholar] [CrossRef] [Green Version]
Figure 1. Study area and the soil map of the Republic of Kazakhstan.
Water 15 02258 g001
Figure 2. Waypoints of snow survey over the territory of Akkayin district, North Kazakhstan Region (a) between 25 and 27 January 2023 and (b) between 25 and 27 February 2023.
Water 15 02258 g002
Figure 3. The conceptual framework of the research.
Water 15 02258 g003
Figure 4. Digitized boundaries of agricultural fields in the study area.
Water 15 02258 g004
Figure 5. Flow chart of the methodology for calculating the snow water equivalent.
Water 15 02258 g005
Figure 6. Hierarchy structure of the identification of potential farm pond sites.
Water 15 02258 g006
Figure 7. Reclassified hydrogeological map of Akkayin district.
Water 15 02258 g007
Figure 8. Reclassified slope map of Akkayin district.
Water 15 02258 g008
Figure 9. Reclassified drainage density map of Akkayin district.
Water 15 02258 g009
Figure 10. Reclassified land use/land cover map of Akkayin district.
Water 15 02258 g010
Figure 11. Reclassified soil map of Akkayin district.
Water 15 02258 g011
Figure 12. Reclassified snow water equivalent map of Akkayin district.
Water 15 02258 g012
Figure 13. The relative weights of the potential farm pond site indicators.
Water 15 02258 g013
Figure 14. Overall potential farm pond sites for melt and flood water reservation map of Akkayin district, North Kazakhstan region, overlaid on agricultural fields.
Water 15 02258 g014
Table 1. A quick summary of recent studies on identification of potential rainwater harvesting sites.
ReferenceYearCountryApplied method
Kadam et al. [40]2012IndiaSelf-weighting
Chou et al. [39]2014TaiwanAnalytical Hierarchy Process
Maina and Raude [41]2016KenyaSelf-weighting
Wu et al. [14]2018GuatemalaAnalytical Hierarchy Process
Alwan et al. [10]2020IraqAnalytical Hierarchy Process
Sayl et al. [15]2020IraqAnalytical Hierarchy Process
Balkhair and Ur Rahman [16]2021Saudi ArabiaAnalytical Hierarchy Process
Chowdhury and Paul [17]2021IndiaAnalytical Hierarchy Process
Table 2. Snow survey dates and number of measured points in the study area.
Snow Survey Dates and Number of Points25–27 January 202325–27 February 2023
DepthDensityDepthDensity
Territory of Akkayin District1973911526
Table 3. Specifications of the Sentinel-2 multispectral instrument.
SensorAcquisition DateCloud CoverSpectral Band with Wavelet (µm)
Sentinel-220 January 2023, 42UWE1.13%Coastal aerosol (0.443)
Blue (0.490)
20 January 2023, 42UWF11.99%Green (0.560)
Red (0.665)
16 February 2023, 42UWE0%Vegetation red edge (0.705)
Vegetation red edge (0.740)
16 February 2023, 42UWF0%Vegetation red edge (0.783)
Near-infrared (0.842)
Vegetation red edge (0.865)
SWIR-Cirrus (1.375)
SWIR-1 (1.610)
SWIR-2 (2.190)
Table 4. Analytical hierarchy process significance scale by Saati.
Scale123456789
ImportanceEqualWeakModerateModerate plusStrongStrong plusVery strongHighly strongExtreme
Table 5. Relative weights of input layers compiled with expert judgment.
LayersSWEHydrogeologySlopeDrainage DensityLULCSoil
SWE155115
Hydrogeology1/511/31/31/51
Slope1/5311/31/33
Drainage Density153115
LULC153115
Soil1/511/31/51/51
Sum (col)3.620.012.73.93.720.0
Table 6. Evaluation of pairwise matrix consistency.
LayersColumn Sum (1)Principal Eigenvector (2)Rank (1 × 2)
SWE3.600.2901.045
Hydrogeology20.000.0470.943
Slope12.670.1001.268
Drainage Density3.870.2580.996
LULC3.730.2580.962
Soil20.000.0470.943
λmax 6.158
Disclaimer/Publisher’s Note: The statements, opinions and data contained in all publications are solely those of the individual author(s) and contributor(s) and not of MDPI and/or the editor(s). MDPI and/or the editor(s) disclaim responsibility for any injury to people or property resulting from any ideas, methods, instructions or products referred to in the content.

