Article

Dry and Wet Weather Survey for Human Fecal Sources in the San Diego River Watershed

Southern California Coastal Water Research Project, Costa Mesa, CA 92626, USA
*
Author to whom correspondence should be addressed.
Current address: The Nature Conservancy, Sacramento, CA 95811, USA.
Water 2023, 15(12), 2239; https://doi.org/10.3390/w15122239
Submission received: 18 April 2023 / Revised: 26 May 2023 / Accepted: 31 May 2023 / Published: 14 June 2023
(This article belongs to the Section Urban Water Management)

Abstract

:
State and federal agencies regulate fecal indicator bacteria (FIB), such as E. coli or Enterococcus, in order to manage public health risks at swimming beaches. Despite these goals, watershed managers are challenged in terms of how to best clean up sources of FIB because concentrations frequently exceed water quality objectives, and sources—both human and nonhuman sources of FIB—appear to be everywhere. Since most nonhuman fecal sources represent substantially lower public health risks than human sources do, this study utilizes the human fecal source marker HF183 to better define watershed managers’ riskiest sites and times in order to prioritize remediation actions. A total of 117 samples were collected and analyzed for both FIB and HF183 from 26 sites during multiple sampling campaigns between 2019 and 2021 along the mainstem in addition to major tributaries in a highly urbanized watershed. The results indicated that the vast majority of samples (96%) quantified HF183 during wet weather, ranging from 99 to 44,768 gene copies/100 mL. Similar to HF183, the FIB results exceeded water quality objectives for 100% of the samples in wet weather; however, HF183 was rarely quantified in dry weather, with 3 of 72 samples (4%) exceeding 500 gene copies/100 mL, while two-thirds of samples (67%) exceeded FIB water quality objectives during dry weather. Where HF183 was detected in dry weather, isolated and unpredictable events explained human fecal pollution. It is more challenging in wet weather to identify and quantify the source(s) of human fecal pollution.

1. Introduction

Water quality objectives (WQOs) for fecal indicator bacteria (FIB), such as total coliforms, fecal coliform, E. coli, and/or Enterococcus, have been established for many years [1]. These fecal indicator bacteria are highly abundant in human fecal waste, such as sewage, and their associated WQOs are regulatory-based thresholds that are routinely utilized to ensure that waters remain safe for swimming. These well known and long-standing WQOs are based on epidemiological studies on beachgoers exposed at beaches subjected to human sources of fecal pollution [2,3]. Increasing levels of FIB were associated with highly credible gastrointestinal illness, among other symptoms, and were especially significant in children [4,5,6].
The challenge in terms of implementing WQOs in urban watersheds is that FIB are not human-specific [7,8,9]. Applying WQOs to waterbodies polluted by nonhuman fecal sources may lead to the overestimating of human health risks because most warm-blooded, nonhuman sources contain FIB, but have a lower risk of illness than human sources do [10]. Ultimately, the levels and pathogenicity of human pathogens may not be as high in nonhuman sources, such as dogs, horses, or birds, as they are in human sources, such as raw sewage [11]. Compounding this challenge is the fact that FIB exceedances of WQOs are widespread, especially in urban watersheds. For example, the state of California—a state with the highest number of annual beachgoers in the United States [12]—has over 300 impaired waterbodies for FIB (https://www.waterboards.ca.gov/losangeles/water_issues/programs/303d/, accessed on 1 May 2023) that require total maximum daily loads (TMDLs). Cost estimates for complying with the bacteria TMDL in just one county of California—San Diego County, in the southwesternmost portion of the state—are estimated to be more than USD 1 billion [13].
Watershed managers are looking for tools that can distinguish human from nonhuman sources of FIB to help prioritize which waterbodies or times of year have the greatest human health risks. The most common tool used for identifying human sources of fecal pollution is the genetic marker HF183, found in the bacterium Bacteroides [14,15,16]. The HF183 human genetic marker is both sensitive and specific for human fecal pollution. Bacteroides is an obligate anaerobe that lives nearly exclusively in the human gut, ensuring that the environmental detection of HF183 is “fresh” because decay rates are rapid [17]. When faced with an overwhelming number of clean-up actions, identifying sites with the greatest levels of HF183 allows watershed managers to prioritize which waterbodies require the most urgent attention and when.
The goal of this study is to use the human fecal marker HF183 for identifying when and where watershed managers need to prioritize remediation, as well as where and when water quality improvements are less urgent. In this case study, we use a highly urban watershed in the arid west of the United States with a separate sanitary sewer system from a storm drain system, as well as the presence of additional human nonpoint sources, including septic systems and people experiencing homelessness.

2. Materials and Methods

This study was conducted in the lower San Diego River Watershed (Figure 1). The watershed is 419.1 km2 with 55 percent urban development; the dominant urban land use is residential. The watershed has an estimated 1911 km of sanitary sewer, 140,000 private laterals, 1692 septic systems, and 350 people experiencing homelessness residing within the river corridor.
The climate in San Diego is semi-arid, averaging approximately 26 cm of precipitation annually; the wettest months are January and February. The dry season extends from April to October.
There were 13 primary and 13 secondary sites, for a total of 26 sampling sites in this study (Figure 1, Supplementary Table S1). The 13 primary sites were located along the mainstem and at the end of major tributaries to the San Diego River. Each of these sites represent major sections of the river system, enabling the spatial stratification of potential sources. The 13 secondary sites were located upstream on the major tributaries and at the end of minor tributaries to provide enhanced spatial resolution.
There were three dry weather sampling events and three wet weather sampling events for this study. The three dry weather events were collected at the end of the summer (the driest part of the year), after the first storm of the year (which may wash off easily mobilized dry weather inputs), and at the end of the wet season (when groundwater may be contributing fecal pollution to the system). All dry weather samples were collected > 72 h after any measurable rainfall. Grab samples were collected at each primary and secondary site via the use of precleaned, sterilized bottles.
The three wet weather events were only collected at primary sites across a range of storm sizes during the 2020–2021 and 2021–2022 wet seasons. Storm precipitation ranged from 1.7 to 4.6 cm (0.68 to 1.8 inches) at the long-term rain gauge located at the San Diego International Airport.
All of the dry and wet weather samples were collected as short-term grabs in 1000 mL sterilized polyethylene or polypropylene bottles that were sample-rinsed prior to collection. Field blanks were collected for at least 10% of the samples. Samples were chilled on ice and delivered to the laboratory within 6 h of collection.

2.1. Laboratory Analysis

Once delivered to the laboratory, 100 mL portions of the water samples were filtered through 0.4-micron polycarbonate or 0.45-micron mixed cellulose ester membranes to collect bacteria, then flash frozen in liquid nitrogen and stored at −80 °C prior to DNA extraction.
Other portions of the water samples were used to quantify FIB. Cultivable Enterococcus, total coliforms, and E. coli were measured via the use of the Enterolert as well as Colilert methods and a Quantitray 2000™ system (IDEXX, Westbrook, ME, USA), according to the manufacturer’s instructions, with three dilutions covering a 100,000-fold range of concentration.
Frozen filters were processed in batches using commercially available DNA extraction kits (GeneRite RW-01 kit, GeneRite, NJ, USA). DNA extraction followed the methods developed by Cao et al. [17] and Steele et al. [18]. Briefly, frozen filters were placed into sterile 2 mL plastic tubes preloaded with glass beads. A lysis buffer was added and the tubes were placed on a BioSpec Mini-Beadbeater-16 (BioSpec Products Inc., Bartlesville, OK, USA) at maximum speed for 2 min. The extraction then proceeded according to the manufacturer’s instructions. DNA was eluted from the spin column in 100 μL of an elution buffer. Aliquots of eluted sample DNA were stored at −80 °C until they were analyzed by droplet digital PCR.
Negative extraction controls (NECs) containing only a lysis buffer in addition to a lysis buffer and control DNA (e.g., halophile or salmon testes DNA) were processed for every extraction in the same manner as the samples.
Human-associated Bacteroidales (HF183) were measured via the use of a droplet digital PCR assay following previously published protocols [17,18]. Samples were measured in replicate, using at least 20,000 droplets for an absolute quantification of HF183.
Field and equipment blanks were 100% nondetectable for FIB and HF183. Filtration controls were also 100% nondetectable.

2.2. Data Analysis

Data analysis consisted of three steps: (1) characterizing FIB concentrations and WQO exceedance rates during dry or wet weather in the San Diego River Watershed, (2) characterizing HF183 concentrations and proposed threshold exceedance rates during dry or wet weather in the San Diego River Watershed, and (3) correlations between FIB and HF183 during dry or wet weather. All graphic and data analyses were carried out through the use of Sigmaplot V12.5. The single-sample WQO for FIB was total coliforms >10,000 counts/100 mL, E. coli > 400 counts/100 mL, or Enterococcus > 104 counts/100 mL. A proposed threshold for HF183 has been suggested [19]; however, neither the State of California nor the US Environmental Protection Agency have legally promulgated a WQO for HF183. While not an enforceable WQO, HF183 > 500 gene copies/100 mL is intended to be a health-risk-based threshold comparable to risks from FIB thresholds associated with human sources.

3. Results

A total of 117 samples were collected during this study: 78 during dry weather and 39 during wet weather (Supplementary Table S2). All of the collected samples were successfully analyzed for FIB and HF183. All of the targeted sites had flowing water in wet weather, regardless of storm size; however, because of the region’s arid climate, between three and five sites (5–9% of sites) did not have flowing water during dry weather, and predefined alternate sites were sampled instead (Supplementary Table S3).
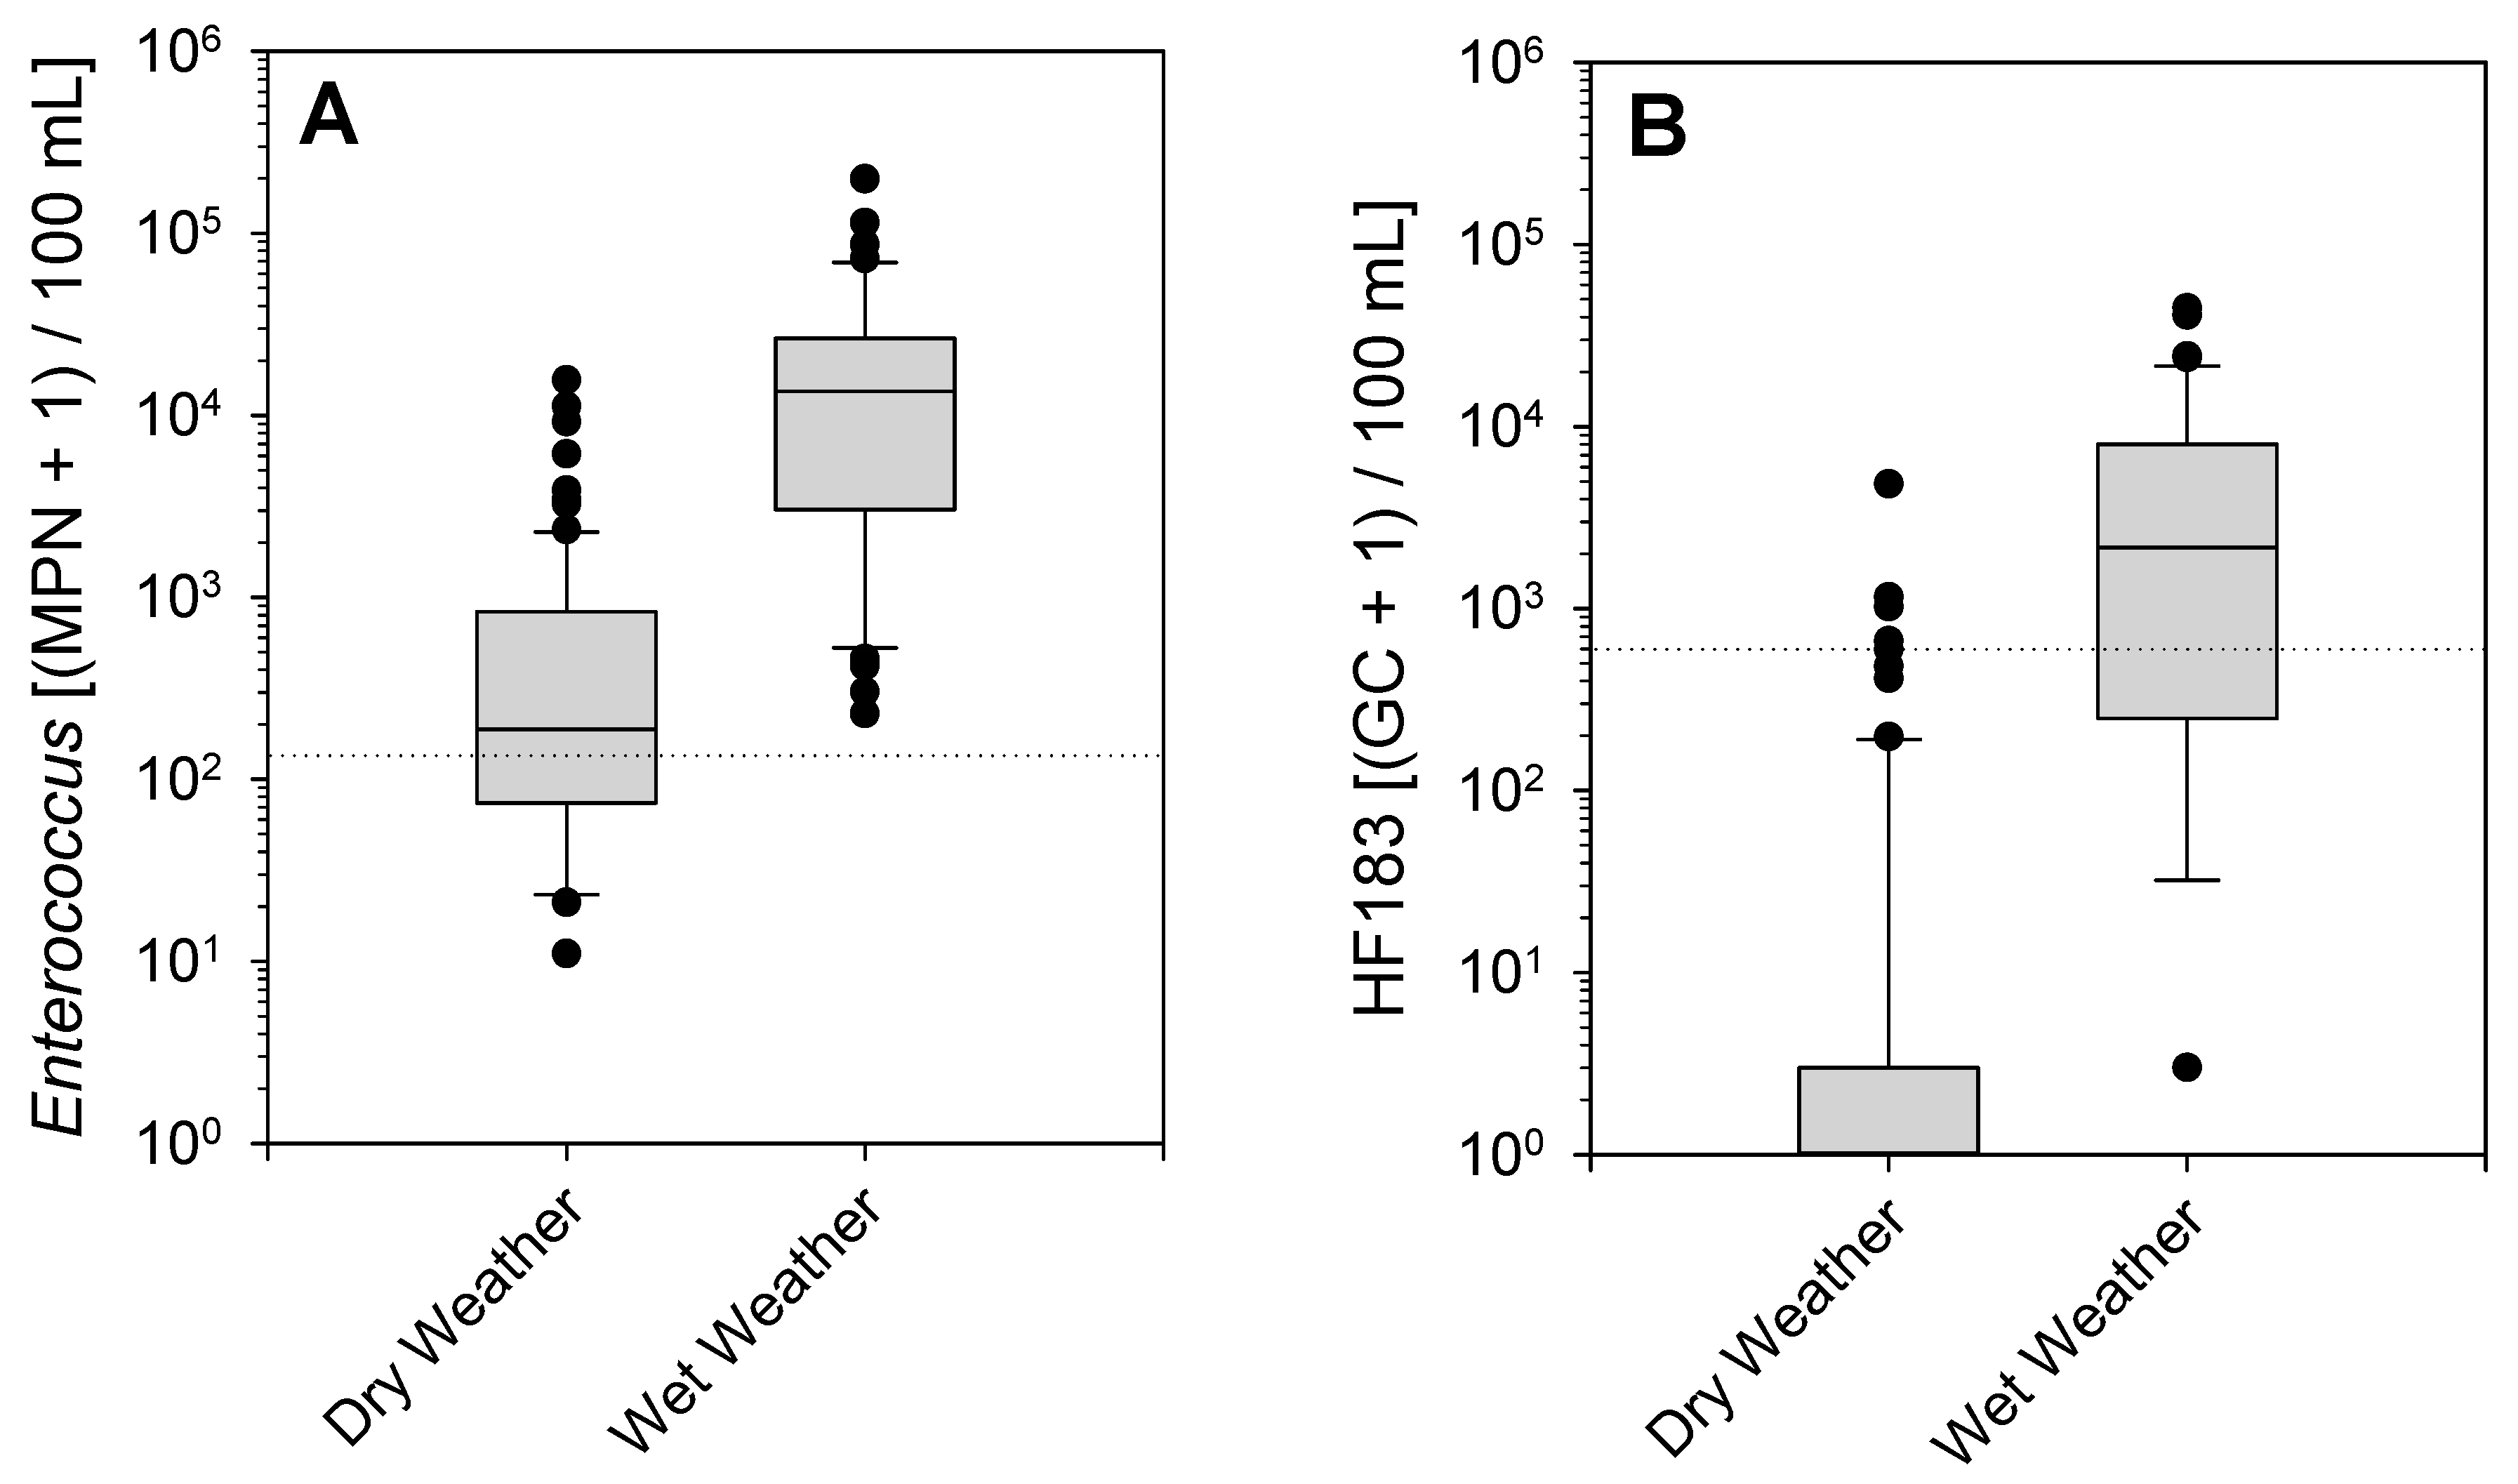
All (100%) of the samples collected during wet weather in this study exceeded the WQO for Enterococcus (Figure 2A). Concentrations ranged from 228 to 198,630 MPN/100 mL. While less frequently than for wet weather, the majority of the samples (58%) exceeded the WQO for Enterococcus in dry weather. The concentration range for Enterococcus was also smaller in dry weather than wet weather, from < 10 to 15,650 MPN/100 mL. Because Enterococcus exceeded the WQO more frequently than total coliforms or E. coli (Supplementary Tables S2 and S3), the remainder of the results for FIB will focus on Enterococcus.
In contrast to Enterococcus, there was a large difference in HF183 threshold exceedances between wet weather and dry weather (Figure 2). Two-thirds (67%) of the HF183 samples exceeded the 500 gene copies/100 mL threshold in wet weather, whereas 3 of 78 (4%) samples exceeded 500 gene copies/100 mL in dry weather. Concentrations ranged from nondetectable to 4840 gene copies/100 mL in dry weather. In comparison, HF183 concentrations ranged from nondetectable to 44,988 gene copies/100 mL in wet weather. These results infer that human fecal sources are infrequently present in dry weather, although Enterococcus exceeds WQOs, suggesting non-human sources predominate in dry weather.
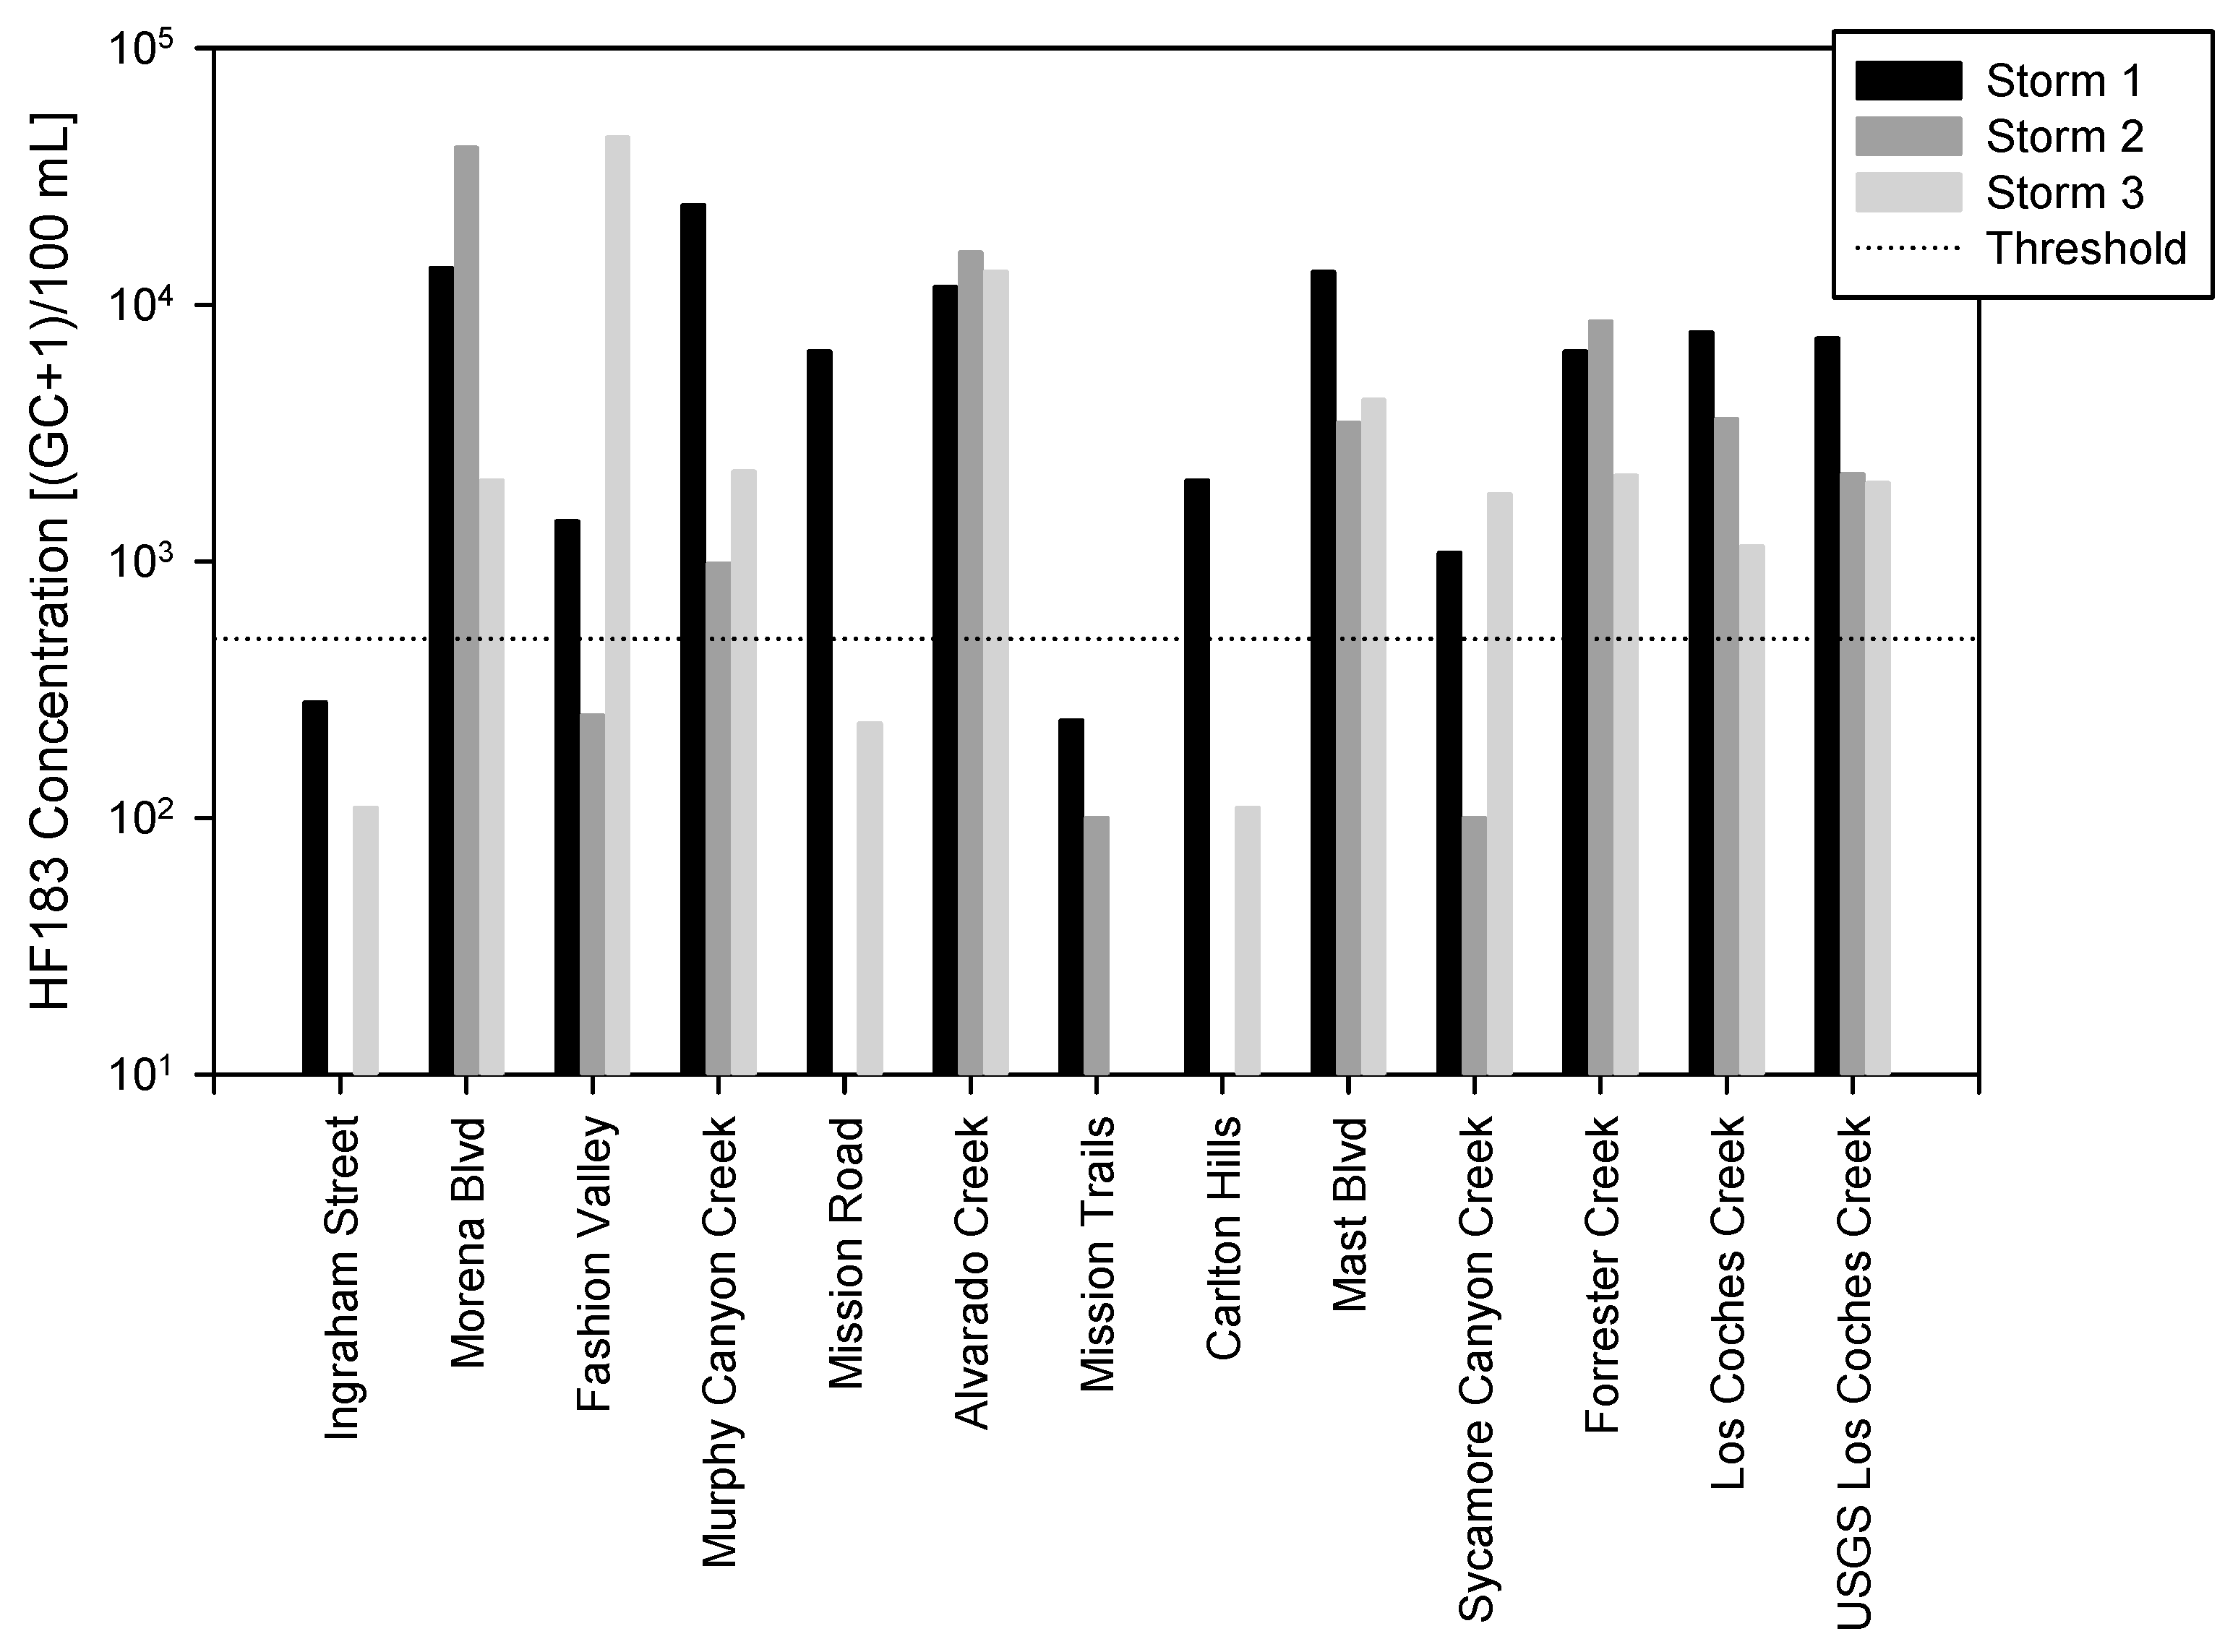
The concentrations of HF183 by site during each storm event did not show any predictable spatial pattern (Figure 3). No single site consistently had the greatest or lowest HF 183 concentrations during wet weather. Instead, concentrations spiked at different sites during individual events. Two sites showed some consistency: Alvarado Creek had consistently modest concentrations, and Mission Trails had a consistently decreased concentration of HF183. Regardless of spatial patterns, HF183 was routinely detected at all sites with seemingly stochastic peaks or dips, indicating a systemic wet weather human fecal source.
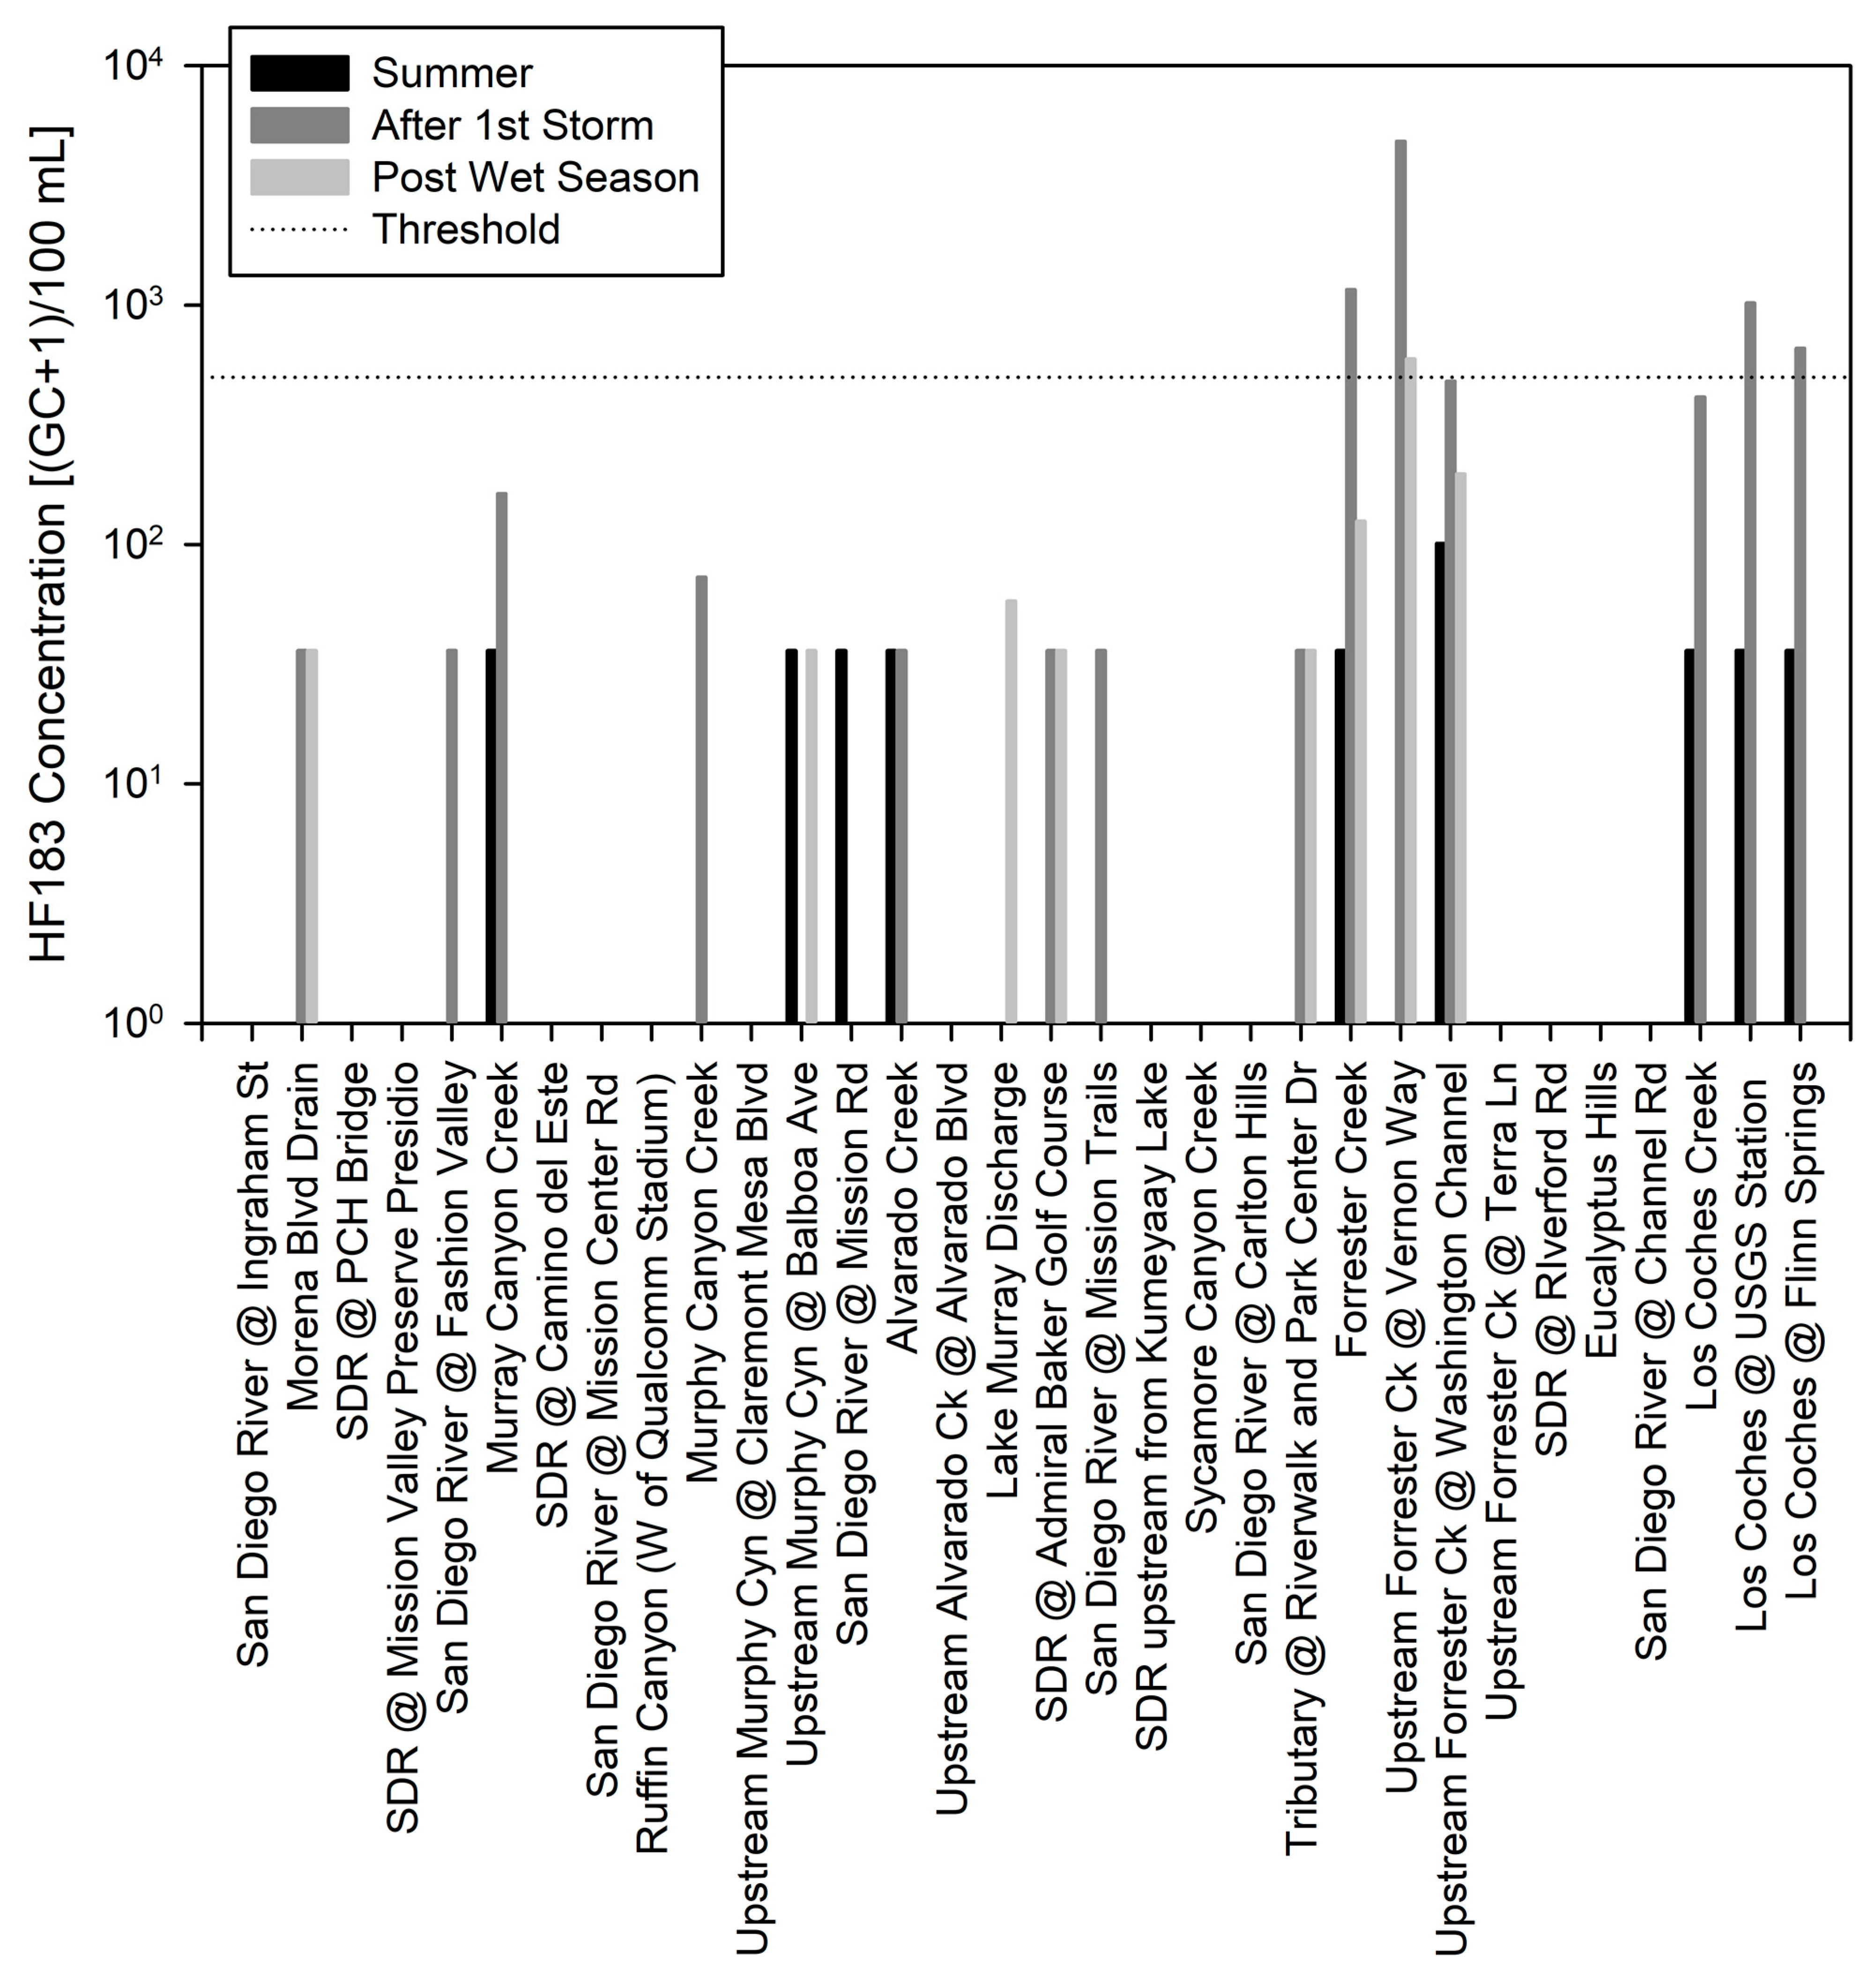
Dry weather, on the other hand, had a very predictable spatial relationship and source-specific rationale for high HF183 concentrations (Figure 4). HF183 concentrations were uniformly low to nondetectable in dry weather; however, there were two main spikes in HF183 concentrations during dry weather. The first spike occurred during sampling event number three, where the separate sanitary sewage system overflowed and entered a tributary to the San Diego River (Los Coches Creek). Concentrations of HF183 decreased flowing downstream in this tributary, due possibly to dilution and/or decay. Interestingly, follow-up samples were collected at the station nearest the spill three days after the sewage spill clean-up. This station, which had the greatest HF183 concentrations during the survey, had decreased to non-detectable concentrations in the follow-up sample.
The second main spike in HF183 concentrations during dry weather occurred during sampling events number two and three in a different tributary, Forester Creek. This tributary has documented encampments of people experiencing homelessness in the tributary flood control channel. Once again, concentrations decreased flowing downstream from the encampment.
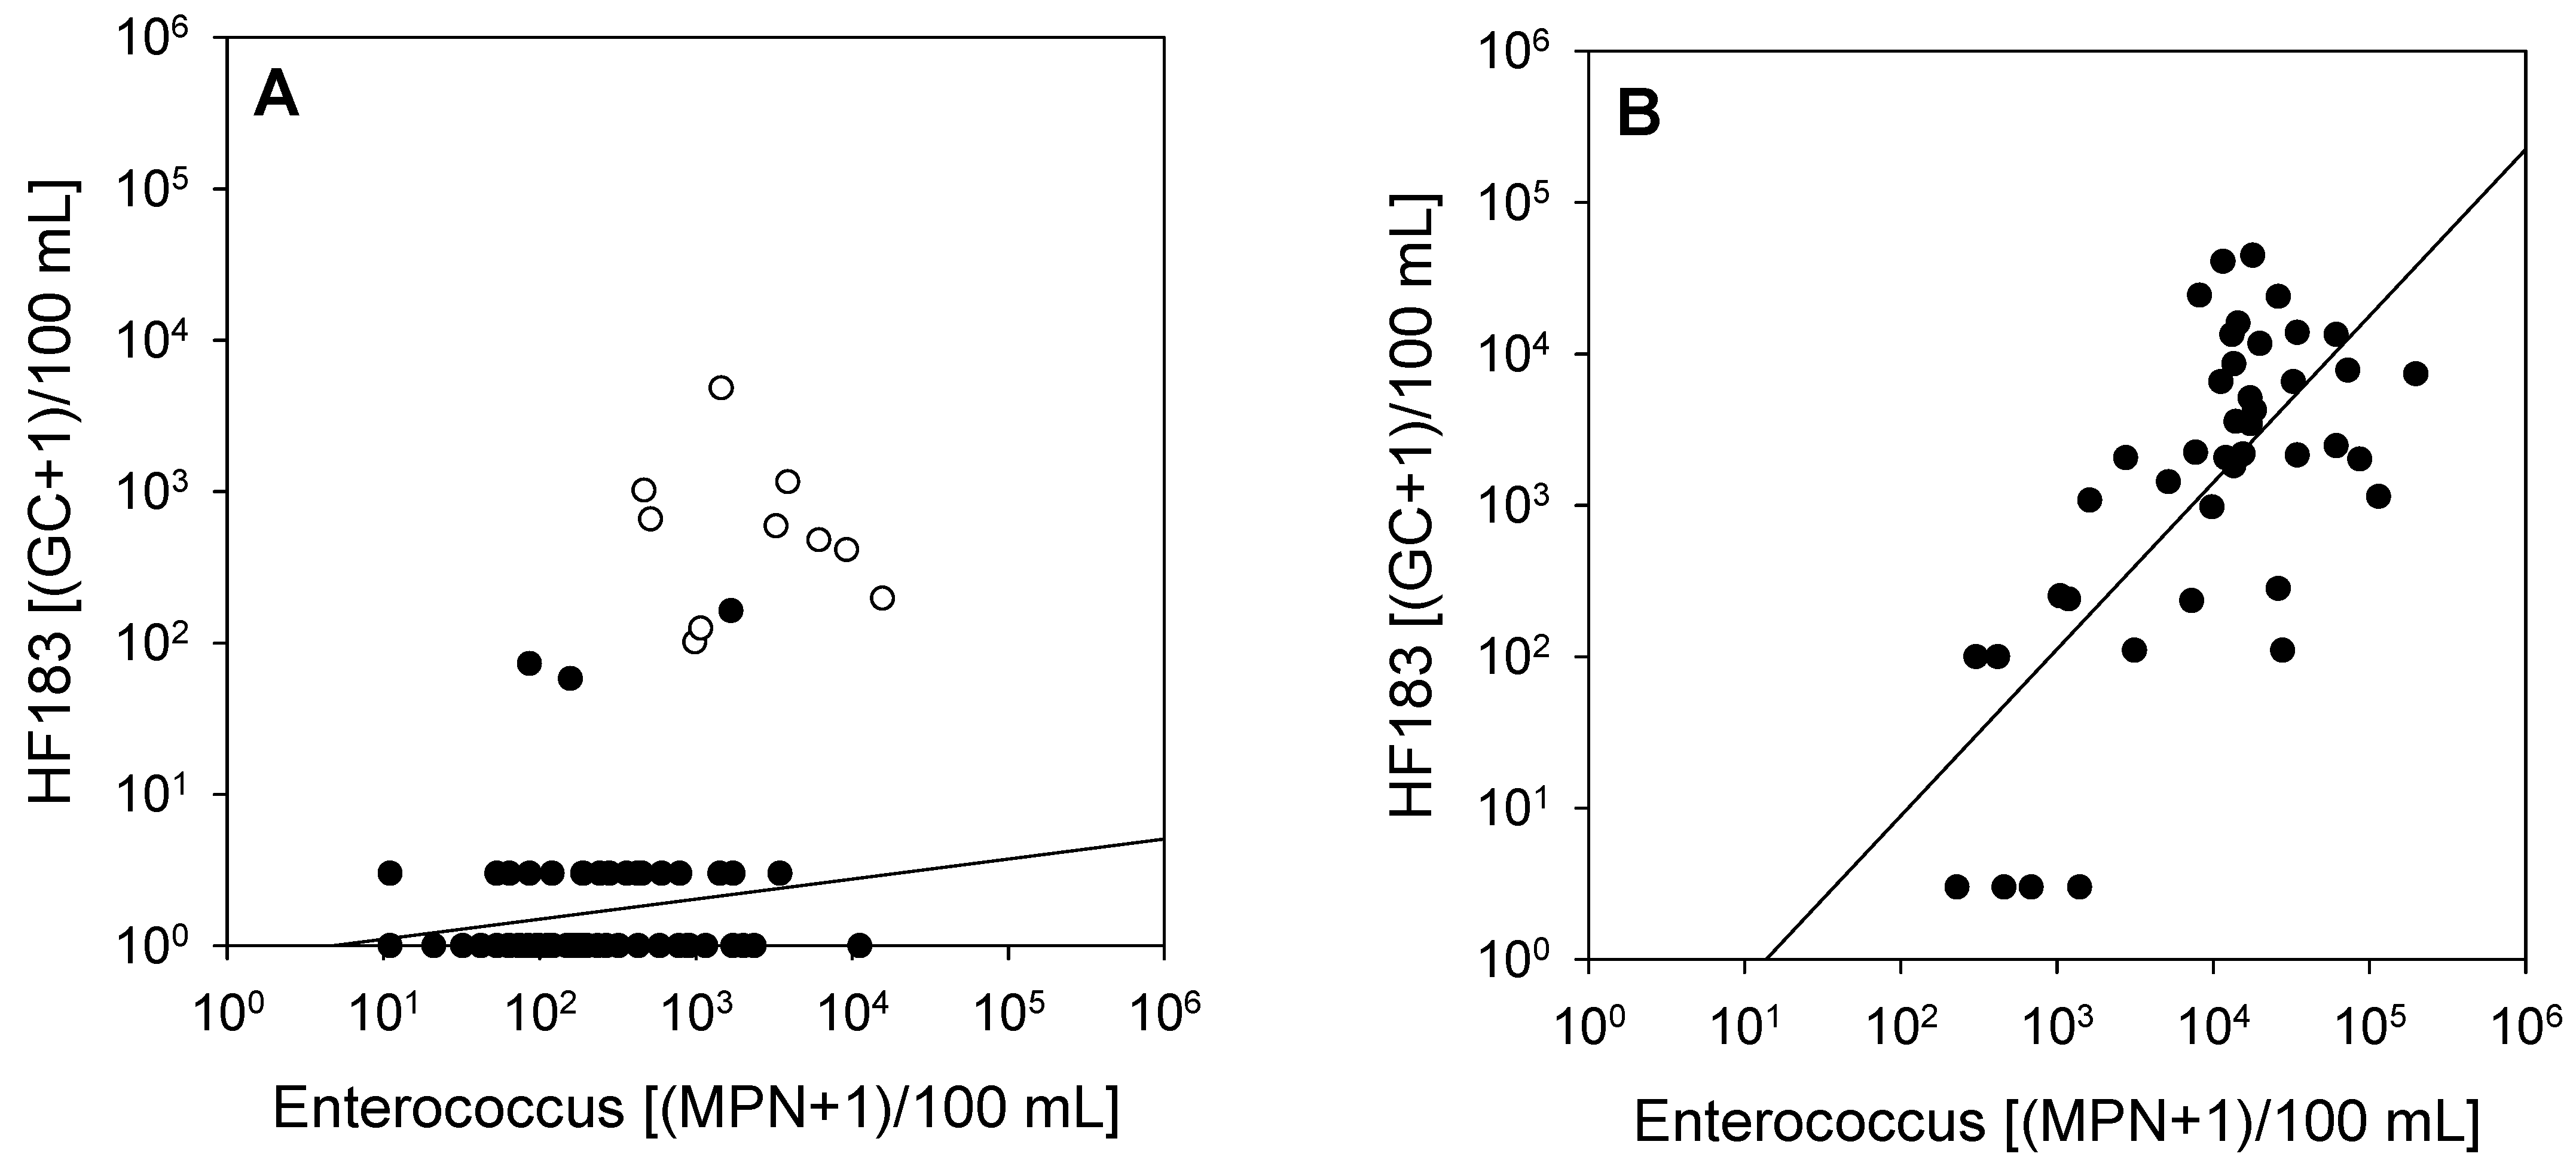
Correlations between concentrations of Enterococcus and HF183 in wet weather were statistically significant (log10-transformed, r2 = 0.499, p < 0.001). Despite not knowing what sources were mixing in the San Diego River during rainstorms, the highest HF183 concentrations occurred when Enterococcus concentrations were highest (Figure 5). In contrast, after excluding the known human inputs identified during dry weather (see the previous paragraph), concentrations of Enterococcus and HF183 were not correlated in dry weather (log10-transformed, r2 = 0.041, p = 0.087). The highest HF183 concentrations in dry weather did not occur at the highest Enterococcus concentrations, and many of the highest Enterococcus concentrations had nondetectable HF183 concentrations.

4. Discussion

Watershed managers nationwide struggle with how to meet regulatory WQOs for FIB. Particularly in wet weather, concentrations of FIB appear high almost everywhere almost all the time [8,9]. In dry weather, the problem of high FIB levels is especially problematic because that is when most body contact recreation (i.e., swimming) occurs and the risk of human health exposure via ingestion is greatest. When human fecal sources are present, epidemiology studies have repeatedly shown that FIB are predictive of health effects, such as highly credible gastrointestinal illness [2,3]. In these cases, remedial action should be taken to protect public health, which researchers have estimated could result in 90 million illnesses at a cost of USD 2.2–3.7 billion annually across the United States [20].
Quantitative risk assessments (QMRAs) have predicted less risk when human sources are absent than when human sources are present [10]. Human viruses such as norovirus, which is transmitted via human fecal sources, are consistently ranked as the most risk-producing pathogens in water contact recreation. This complicates watershed management in that not all sites exceeding WQOs for FIB have human sources. Given that a reduction in FIB to meet WQOs can cost billions of USD for just a single TMDL [13], HF183 provides a tool with which to identify human-specific sources, thereby focusing watershed managers on the most cost-effective solutions that are protective of public health.
In this study, HF183 concentrations were consistently low to nondetectable during dry weather, even when the majority of samples exceeded Enterococcus WQOs. This situation is a prime example of the conundrum that watershed managers face. When Enterococcus concentrations exceeded WQOs and HF183 concentrations were also high in this study, the human-specific source (a sanitary sewer overflow) was clearly as well as rapidly identified and remediated. This case study illustrates an example of an effective priority-setting process that could be utilized by others. HF183 has been used in other watersheds for source identification purposes over the past decade [21,22,23,24,25,26,27,28].
In order for HF183 to be a truly effective tool, watershed managers—both regulatory and regulated agencies—need to agree on a meaningful HF183 threshold. Risk-based thresholds for HF183 do exist in the literature. Boehm et al. [29] used a QMRA from surface releases of raw sewage to identify an HF183 threshold of ~4000 gene copies/100 mL for a risk estimate of 30 illnesses/1000 exposures, a risk level recommended by the US EPA [2,3]. Boehm and Soller [16] updated their HF183 threshold to ~500 gene copies/100 mL to account for a range of raw sewage HF183 concentrations and decay rates. Soller et al. [11] suggested an HF183 threshold of ~4000 gene copies/100 mL for a risk estimate of 32 illnesses/1000 exposures based on a QMRA from wet weather discharges. Regardless, no regulatory thresholds currently exist for HF183, and this limits the application of HF183 as a priority-setting tool for watershed managers. Some regulators may argue that any level of HF183 is not permissible. For the current project, the most conservative threshold from the literature—500 gene copies/100 mL—was used as a metric for estimating risk levels of concern to ensure that the lack of relationships between Enterococcus and HF183 were not a result of an overinflated threshold.
In contrast to dry weather, wet weather had HF183 exceeding 500 gene copies/100 mL at almost every site during nearly every storm event sampled. This indicates that consistent inputs of human fecal sources occur during wet weather and should be a public health concern. In this instance, HF183 was used as a predictor of human fecal source contributions because previous research quantified human-specific pathogens, including norovirus, in wet weather discharges from this watershed [18]. Moreover, there was an increased risk of illness quantified for surfers immersing during or immediately following rainstorms compared to when these same surfers immersed during dry weather or did not immerse at all [30].
Based on the widespread quantification of HF183 at levels of concern during wet weather, watershed managers in the San Diego River have stopped asking “if human fecal sources are present in wet weather discharges?”, but rather “which human source is present in wet weather discharges?”. In separate sanitary and storm drain systems, such as the San Diego River, this is a challenging question to answer since many potential sources exist, such as sanitary sewer overflows, the subsurface exfiltration of a sanitary sewer system that surfaces at some point downslope, leaking or overflowing private laterals, nonfunctioning onsite wastewater treatment systems, and/or insufficient sanitation services for people experiencing homelessness camping along the river corridor. Quantifying these different sources during wet weather when they commingle and transport downstream is the next research challenge for effective watershed management and public health protection.

Supplementary Materials

The following supporting information can be downloaded at: https://www.mdpi.com/article/10.3390/w15122239/s1. Table S1: Site name, tributary or mainstem location, latitude/longitude (NAD 83 datum), percent of total watershed area (total area = 419.1 km2), and site description. Table S2: Site name and concentration of Enterococcus, E. coli, Total Coliforms, and HF183 from Dry Weather Survey Events 1–3. Table S3: Site name and concentration of Enterococcus, E. coli, and Total Coliforms from Wet Weather Survey Events 1–3.

Author Contributions

All authors contributed equally to conceptualization, investigation, formal analysis, draft preparation. All authors have read and agreed to the published version of the manuscript.

Funding

This research was funded by the Southern California Coastal Water Research Project, with additional funding from the County of San Diego, City of San Diego, City of El Cajon, City of La Mesa, and Padre Dam Municipal Water District.

Data Availability Statement

All raw data are available in the Supplementary Materials.

Acknowledgments

The authors thank the project’s Steering Committee, comprised of regulatory, regulated, and nongovernmental advocacy agencies (in alphabetical order): Caltrans, City of El Cajon, City of La Mesa, City of San Diego, City of Santee, County of San Diego, Metropolitan Transit System, Padre Dam Municipal Water District, San Diego Coastkeeper, San Diego Regional Water Quality Control Board, San Diego River Park Foundation, and San Diego State University. The authors also thank the project’s Technical Review Committee (in alphabetical order): Trish Holden, John Izbicki, Mia Mattioli, Sandra McLellan, and Martha Tremblay. The authors thank the wet weather sampling support from WSP Inc., San Diego.

Conflicts of Interest

The authors declare no conflict of interest. While guidance and review were asked of the project’s Steering Committee, no personal circumstances or interest inappropriately influenced the representation or interpretation of reported research results. The funders did not bias the design of the study; the collection, analyses, or interpretation of the data; the writing of the manuscript; or the decision to publish the results.

References

  1. EPA. Recreational Water Quality Criteria; 20-F-12-058; United States Environmental Protection Agency, Office of Science and Technology, Health and Ecological Criteria Division, Office of Water: Washington, DC, USA, 1986; 69p.
  2. Cabelli, V.J.; Dufour, A.P.; Levin, M.A.; McCabe, L.J.; Haberman, P.W. Relationship of microbial indicators to health effects at marine bathing beaches. Am. J. Public Health 1979, 69, 690–696. [Google Scholar] [CrossRef] [PubMed] [Green Version]
  3. Wade, T.J.; Sams, E.; Brenner, K.P.; Haugland, R.; Chern, E.; Beach, M.; Wymer, L.; Rankin, C.C.; Love, D.; Li, Q.; et al. Rapidly measured indicators of recreational water quality and swimming-associated illness at marine beaches: A prospective cohort study. Environ. Health 2010, 9, 66. [Google Scholar] [CrossRef] [PubMed] [Green Version]
  4. Arnold, B.F.; Wade, T.J.; Benjamin-Chung, J.; Schiff, K.C.; Griffith, J.F.; Dufour, A.P.; Weisberg, S.B.; Colford, J.M., Jr. Acute gastroenteritis and recreational water: Highest burden among young US children. Am. J. Public Health 2016, 106, 1690–1697. [Google Scholar] [CrossRef] [PubMed]
  5. Leonard, A.F.C.; Garside, R.; Ukoumunne, O.C.; Gaze, W.H. A Cross-Sectional Study on the Prevalence of Illness in Coastal Bathers Compared to Non-Bathers in England and Wales: Findings from the Beach User Health Survey. Water Res. 2020, 176, 115700. [Google Scholar] [CrossRef]
  6. Wade, T.J.; Arnold, B.F.; Schiff, K.; Colford, J.M.; Weisberg, S.B.; Griffith, J.F.; Dufour, A.P. Health Risks to Children from Exposure to Fecally-Contaminated Recreational Water. PLoS ONE 2022, 17, e0266749. [Google Scholar] [CrossRef] [PubMed]
  7. Zimmer-Faust, A.G.; Steele, J.A.; Griffith, J.F.; Schiff, K.C. The challenges of microbial source tracking at urban beaches for Quantitative Microbial Risk Assessment (QMRA). Mar. Pollut. Bull. 2020, 160, 111546. [Google Scholar] [CrossRef]
  8. Tiefenthaler, L.L.; Stein, E.D.; Schiff, K.C. Levels and patterns of fecal indicator bacteria in stormwater runoff from homogenous land use sites and urban watersheds. J. Water Health 2011, 9, 279–290. [Google Scholar] [CrossRef]
  9. Schiff, K.C.; Kinney, P. Tracking sources of bacterial contamination in stormwater discharges to Mission Bay, California. Water Environ. Res. 2001, 73, 534–542. [Google Scholar] [CrossRef]
  10. Soller, J.; Bartrand, T.; Molina, M.; Whelan, G.; Schoen, M.; Ashbolt, A. Estimated human health risks from recreational exposures to stormwater containing animal faecal material. Environ. Model. Softw. 2015, 72, 21–32. [Google Scholar] [CrossRef]
  11. Soller, J.A.; Schoen, M.; Steele, J.A.; Griffith, J.F.; Schiff, K.C. Incidence of gastrointestinal illness following wet weather recreational exposures: Harmonization of quantitative microbial risk assessment with an epidemiologic investigation of surfers. Water Res. 2017, 121, 280–289. [Google Scholar] [CrossRef]
  12. Schiff, K.C.; Weisberg, S.B.; Dorsey, J.H. Microbiological monitoring of marine recreational waters in southern California. Environ. Manag. 2001, 27, 149–157. [Google Scholar] [CrossRef] [PubMed]
  13. Environmental Incentives and Econorthwest. Cost-Benefit Analysis: San Diego Region Bacteria Total Maximum Daily Loads. 2017; p. 649. Available online: https://www.google.com/url?sa=t&rct=j&q=&esrc=s&source=web&cd=&ved=2ahUKEwiewfyUpcD8AhUdJkQIHXhlAukQFnoECBgQAQ&url=https%3A%2F%2Fwww.waterboards.ca.gov%2Fsandiego%2Fwater_issues%2Fprograms%2Fbasin_plan%2Fdocs%2Fissue3%2FFinal_CBA.pdf&usg=AOvVaw3dBfW53P_EjA-3dZLSJNtw (accessed on 1 May 2023).
  14. Boehm, A.B.; Van De Werfhorst, L.C.; Griffith, J.F.; Holden, P.A.; Jay, J.A.; Shanks, O.C.; Wanga, D.; Weisberg, S.B. Performance of forty-one microbial source tracking methods: A twenty-seven lab evaluation study. Water Res. 2013, 47, 6812–6828. [Google Scholar] [CrossRef] [PubMed]
  15. Harwood, V.; Shanks, O.; Koraijkic, A.; Verbyla, M.; Ahmed, W.; Iriate, M. General and host-associated bacterial indicators of faecal pollution. In Water and Sanitation for the 21st Century: Health and Microbiological Aspects of Excreta and Wastewater Management; Global Water Pathogen Project, Part 2: Indicators and Microbial Source Tracking Markers; Rose, J.B., Jiménez-Cisneros, B., Eds.; Michigan State University: East Lansing, MI, USA, 2017. [Google Scholar] [CrossRef]
  16. Shanks, O.C.; Korajkic, A. Microbial source tracking: Characterization of human fecal pollution in environmental waters with HF183 quantitative real-time PCR. In Microbial Forensics; Academic Press: Cambridge, MA, USA, 2020; pp. 71–87. [Google Scholar]
  17. Cao, Y.; Raith, M.R.; Griffith, J.F. Droplet digital PCR for simultaneous quantification of general and human-associated fecal indicators for water quality assessment. Water Res. 2015, 70, 337–349. [Google Scholar] [CrossRef] [PubMed]
  18. Steele, J.A.; Blackwood, A.D.; Griffith, J.F.; Noble, R.T.; Schiff, K.C. Quantification of pathogens and markers of fecal contamination during storm events along popular surfing beaches in San Diego, California. Water Res. 2018, 136, 137–149. [Google Scholar] [CrossRef]
  19. Boehm, A.; Soller, J. Refined ambient water quality thresholds for human-associated fecal indicator HF183 for recreational waters with and without co-occurring gull fecal contamination. Microb. Risk Anal. 2020, 16, 100139. [Google Scholar] [CrossRef]
  20. DeFlorio-Barker, S.; Wing, C.; Jones, R.M.; Dorevitch, S. Estimate of incidence and cost of recreational waterborne illness on United States surface waters. Environ. Health 2018, 17, 3. [Google Scholar] [CrossRef] [Green Version]
  21. Sauer, E.P.; VandeWalle, J.L.; Bootsma, M.J.; McLellan, S.L. Detection of the human specific Bacteroides genetic marker provides evidence of widespread sewage contamination of stormwater in the urban environment. Water Res. 2011, 45, 4081–4091. [Google Scholar] [CrossRef]
  22. Sidhu, J.P.S.; Ahmed, W.; Gernjak, W.; Aryal, R.; McCarthy, D.; Palmer, A.; Kolotelo, P.; Toze, S. Sewage Pollution in Urban Stormwater Runoff as Evident from the Widespread Presence of Multiple Microbial and Chemical Source Tracking Markers. Sci. Total Environ. 2013, 463–464, 488–496. [Google Scholar] [CrossRef]
  23. Villemur, R.; Imbeau, M.; Vuong, M.N.; Masson, L.; Payment, P. An Environmental Survey of Surface Waters Using Mitochondrial DNA from Human, Bovine and Porcine Origin as Fecal Source Tracking Markers. Water Res. 2015, 69, 143–153. [Google Scholar] [CrossRef]
  24. Cao, Y.; Raith, M.; Smith, P.; Griffith, J.; Weisberg, S.; Schriewer, A.; Sheldon, A.; Crompton, C.; Amenu, G.; Gregory, J.; et al. Regional Assessment of Human Fecal Contamination in Southern California Coastal Drainages. Int. J. Environ. Res. Public Health 2017, 14, 874. [Google Scholar] [CrossRef] [Green Version]
  25. Nshimyimana, J.P.; Cruz, M.C.; Thompson, R.J.; Wuertz, S. Bacteroidales Markers for Microbial Source Tracking in Southeast Asia. Water Res. 2017, 118, 239–248. [Google Scholar] [CrossRef] [PubMed]
  26. Jennings, W.C.; Gálvez-Arango, E.; Prieto, A.L.; Boehm, A.B. CrAssphage for Fecal Source Tracking in Chile: Covariation with Norovirus, HF183, and Bacterial Indicators. Water Res. X 2020, 9, 100071. [Google Scholar] [CrossRef] [PubMed]
  27. McKee, B.A.; Molina, M.; Cyterski, M.; Couch, A. Microbial Source Tracking (MST) in Chattahoochee River National Recreation Area: Seasonal and Precipitation Trends in MST Marker Concentrations, and Associations with E. Coli Levels, Pathogenic Marker Presence, and Land Use. Water Res. 2020, 171, 115435. [Google Scholar] [CrossRef] [PubMed]
  28. Sherchan, S.; Shahin, S.; Alarcon, J.; Brosky, H.; Potter, C.; Dada, A.C. Microbial Source Tracking of Fecal Contamination in Stormwater Runoff. J. Water Health 2022, 20, 1271–1283. [Google Scholar] [CrossRef]
  29. Boehm, A.B.; Graham, K.E.; Jennings, W.C. Can We Swim Yet? Systematic Review, Meta-Analysis, and Risk Assessment of Aging Sewage in Surface Waters. Environ. Sci. Technol. 2017, 52, 9634–9645. [Google Scholar] [CrossRef]
  30. Arnold, B.F.; Schiff, K.C.; Ercumen, A.; Benjamin-Chung, J.; Steele, J.A.; Griffith, J.F.; Steinberg, S.J.; Smith, P.D.; McGee, C.D.; Wilson, C.; et al. Acute Illness Among Surfers After Exposure to Seawater in Dry- and Wet-Weather Conditions. Am. J. Epidemiol. 2017, 186, 866–875. [Google Scholar] [CrossRef] [Green Version]
Figure 1. Map of the lower San Diego River with sampling sites.
Water 15 02239 g001
Figure 2. Paired box plots of (A) Enterococcus and (B) HF183 between dry weather and wet weather, with threshold reference lines. Boxes represent 10, 25, 50, 75, and 90 percentiles, and symbols are in the outer deciles. Dashed lines represent thresholds, including a single-sample water quality objective for Enterococcus (104 MPN/100 mL) and a risk-based threshold for HF183 (500 gene copies/100 mL) from the literature. One was added to all of the values for the logarithmic axis. Most of the Enterococcus samples were above the threshold, while only wet weather HF183 samples were above the threshold; HF183 dry weather samples were below the threshold.
Water 15 02239 g002
Figure 3. HF183 concentrations per site in wet weather. The river flows from right to left. The threshold is set at 500 gene copies/100 mL. One is added to all values for the logarithmic axis.
Water 15 02239 g003
Figure 4. HF183 concentrations per site in dry weather. The river flows from right to left. The trigger level is set at 500 gene copies/100 mL. One is added to all values for the logarithmic axis.
Water 15 02239 g004
Figure 5. Relationship between Enterococcus and HF183 in the San Diego River watershed during (A) dry and (B) wet weather. For dry weather, unfilled symbols indicate that known human sources were present due to a sanitary sewer overflow and homeless encampment, and therefore excluded from the regression. One is added to all values for the logarithmic axis.
Water 15 02239 g005
Disclaimer/Publisher’s Note: The statements, opinions and data contained in all publications are solely those of the individual author(s) and contributor(s) and not of MDPI and/or the editor(s). MDPI and/or the editor(s) disclaim responsibility for any injury to people or property resulting from any ideas, methods, instructions or products referred to in the content.