Article

An Alternating, Current-Induced Electromagnetic Field for Membrane Fouling and Scaling Control during Desalination of Secondary Effluent from Municipal Wastewater

Department of Civil Engineering, New Mexico State University, Las Cruces, NM 88003, USA
*
Author to whom correspondence should be addressed.
Water 2023, 15(12), 2234; https://doi.org/10.3390/w15122234
Submission received: 24 May 2023 / Revised: 11 June 2023 / Accepted: 12 June 2023 / Published: 14 June 2023
(This article belongs to the Special Issue Advanced Technologies for Water and Wastewater Treatment)

Abstract

:
Membrane treatment of secondary effluent for reuse applications is a promising approach to expand water supplies and provide flexibility to water resources management. However, effective control of membrane fouling and scaling is crucial for cost-effective treatment and system resilience. This study compared the performance of antiscalants to an alternating, current-induced electromagnetic field (EMF) as an alternative pretreatment method to reverse osmosis. Compared to the no-EMF control experiments, the EMF device resulted in 13% higher water recovery and 366% lower flux decline at 60% of water recovery, along with 2–8 times lower precipitation of fouling and scaling, as evidenced by scanning electron microscope, energy dispersive X-ray spectroscopy, and chemical extraction analysis. The combination of the EMF with antiscalant was more effective for reducing membrane fouling and scaling, increasing water recoveries up to 89.3%, as compared to the EMF (67.5%) and antiscalant-only (73.6%) configurations. This is the first study to demonstrate synergistic effects of using an EMF in combination with antiscalants and could lead to lower pretreatment costs. Additional research is required to quantify the economics of this approach and to fully understand the fundamental mechanisms governing fouling and scaling control by an EMF.

Graphical Abstract

1. Introduction

Wastewater reclamation and reuse offer a practical solution to enhance water supply resilience and alleviate local freshwater demand [1,2,3]. Reverse osmosis (RO) is an advanced membrane desalination technology that effectively removes pathogens, organic, and inorganic substances in wastewater, providing high-quality water for beneficial reuse [1,2,3,4,5,6,7,8,9,10,11]. However, membrane fouling and scaling are major operational problems that, if not controlled, can lead to a decreased water flux, deteriorated permeate water quality, elevated feed pressures, increased energy demand, and more frequent chemical cleaning. Operation and maintenance costs can increase considerably due to the need for extensive pretreatment and frequent cleaning; the latter may shorten membrane lifespans, increase downtime, and reduce water production [5,6,9,10,12,13,14,15,16,17,18].
Membrane fouling and scaling often occur together during treatment of wastewater with RO because organics and sparingly soluble salts coexist in this matrix. Colloidal particles, microorganisms, organic matter, and sparingly soluble salts (e.g., CaCO3, CaSO4, SiO2, and BaSO4) present in feedwater adhere to, and precipitate, either within the polymer matrix of the membrane or on its surface. The mechanisms of membrane fouling and scaling are complicated during wastewater reclamation, primarily due to the high concentration of biological activity, suspended particles, colloids, and the presence of complex dissolved organic matter generated during biological wastewater treatment in secondary effluent [10,15,19,20,21,22,23,24].
Ensuring adequate pretreatment is crucial for the reliable operation and prolonged lifetime of RO membranes for wastewater reclamation. During wastewater desalination, RO trains mostly experience bio/organic fouling in the lead-position membrane elements, whereas the end-position elements are primally affected by inorganic scaling, such as calcium phosphate, due to higher ion concentrations in the water [16]. Various technological approaches are available for pretreatment, including modification of membrane properties, pH adjustment, use of antiscalants and/or disinfectants, hydraulic flush, and chemical cleaning [25].
Instead of relying on chemical pretreatment to prevent membrane fouling and scaling, an alternative approach is to use non-chemical pretreatment methods, such as an electromagnetic field (EMF) [26,27,28]. EMFs can be generated and induced by ferrite magnets [29], by wrapping metallic wire around a pipe carrying water, or wrapping wire directly around membrane pressure vessels [30]. Water does not come into direct contact with the electrodes, and an EMF is induced due to alternating current (AC) or permanent magnets (e.g., neodymium magnets and ferrite magnets). Water is subject to a quick variation of coil voltage in the hertz (Hz) to megahertz frequency range [17]. There are many types of commercial EMF water conditioning devices with differing EMF signal generation methods, directions, and intensities in terms of electric field strength (measured in volts per meter) and magnetic flux densities (measured in Tesla).
Several studies have demonstrated the effectiveness of using EMFs for treating wastewater, although there are no agreed-upon mechanisms. Zaidi et al. attributed the enhanced solid–liquid separation performance of the applied magnetic field to promote the aggregation of colloidal particles [31]. Wang et al. in a paper review summarized improvements during the treatment, which included the removal of turbidity (efficiency not stated), suspended solids (efficiency not stated), chemical oxygen demand (COD) decreased by 25%, and total nitrogen and ammonia nitrogen decreased by 22.4% to 39.5% [32]. Sibiya et al. observed similar results and demonstrated that the magnetic field (20 mT) increased the removal of turbidity, total suspended solids (TSS), and COD [33]. An increase in COD removal efficiency of up to 82% using an EMF was also reported in other studies [34,35,36].
Conversely, some studies have shown the use of an EMF to be ineffective for preventing or retarding fouling formation [37,38]. The conflicting outcomes reported may be attributed to various factors such as the utilization of different magnetic or electric fields, variations in their frequency and intensity, variations in water composition, and disparities in the treatment processes [39]. Additionally, the efficacy of EMF treatment may be influenced by the characteristics of the pipe materials through which the EMF is transmitted [40,41].
Despite numerous laboratory and pilot studies exploring the use of EMFs for scaling control in brackish water desalination [42,43], there is a lack of systematic research on the impact of EMFs on RO membrane fouling and scaling during wastewater treatment [
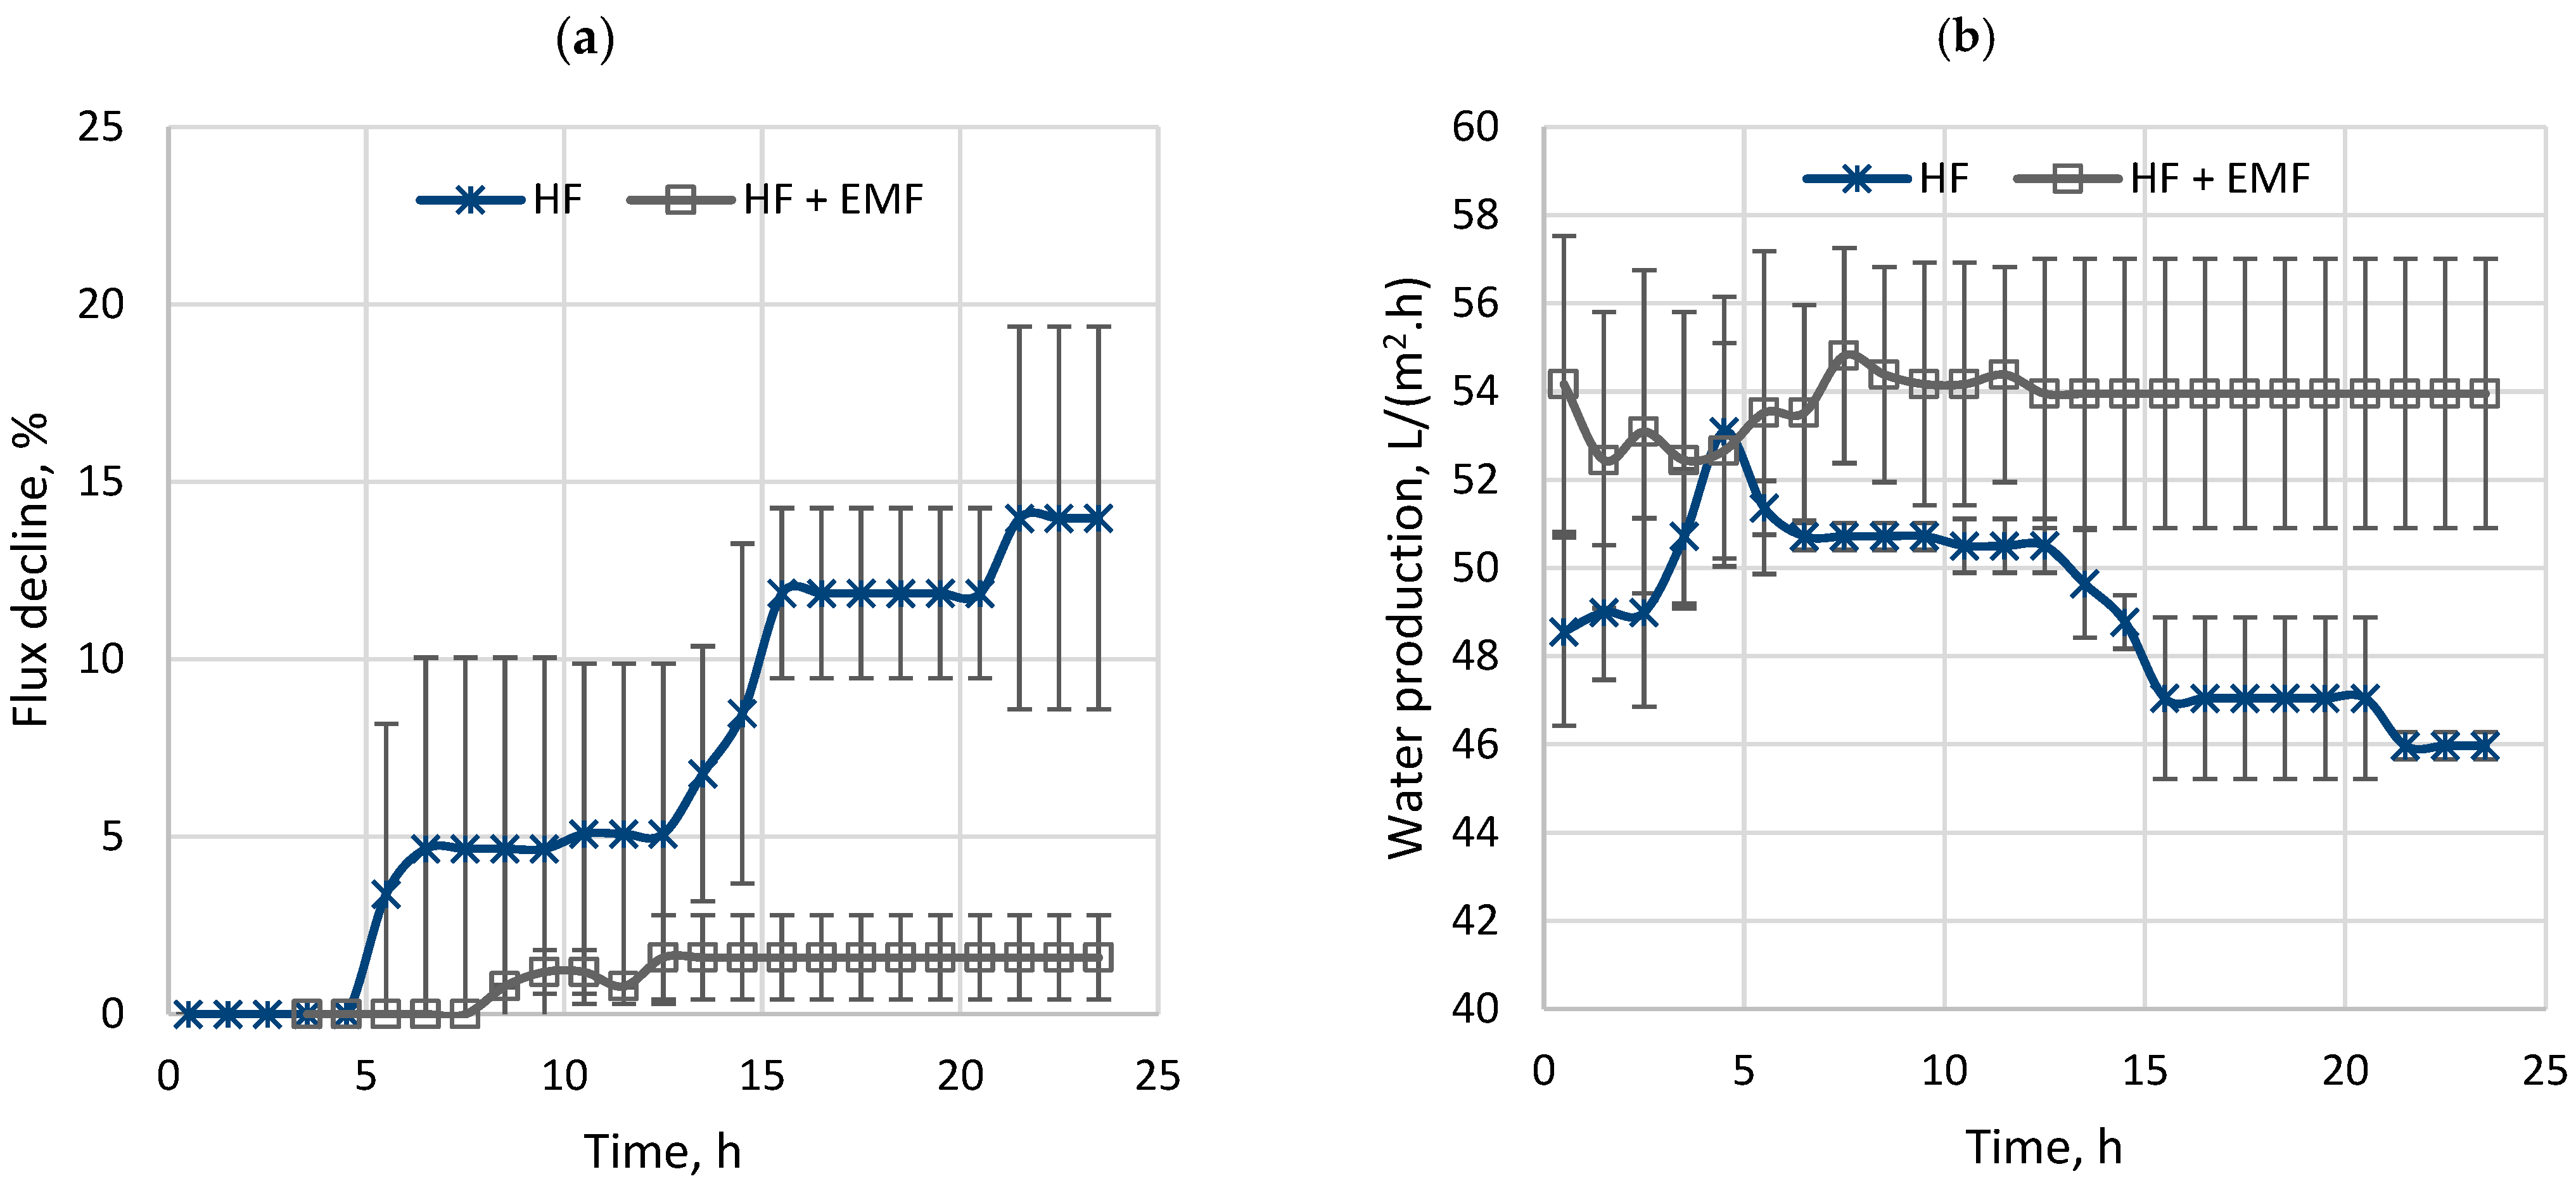
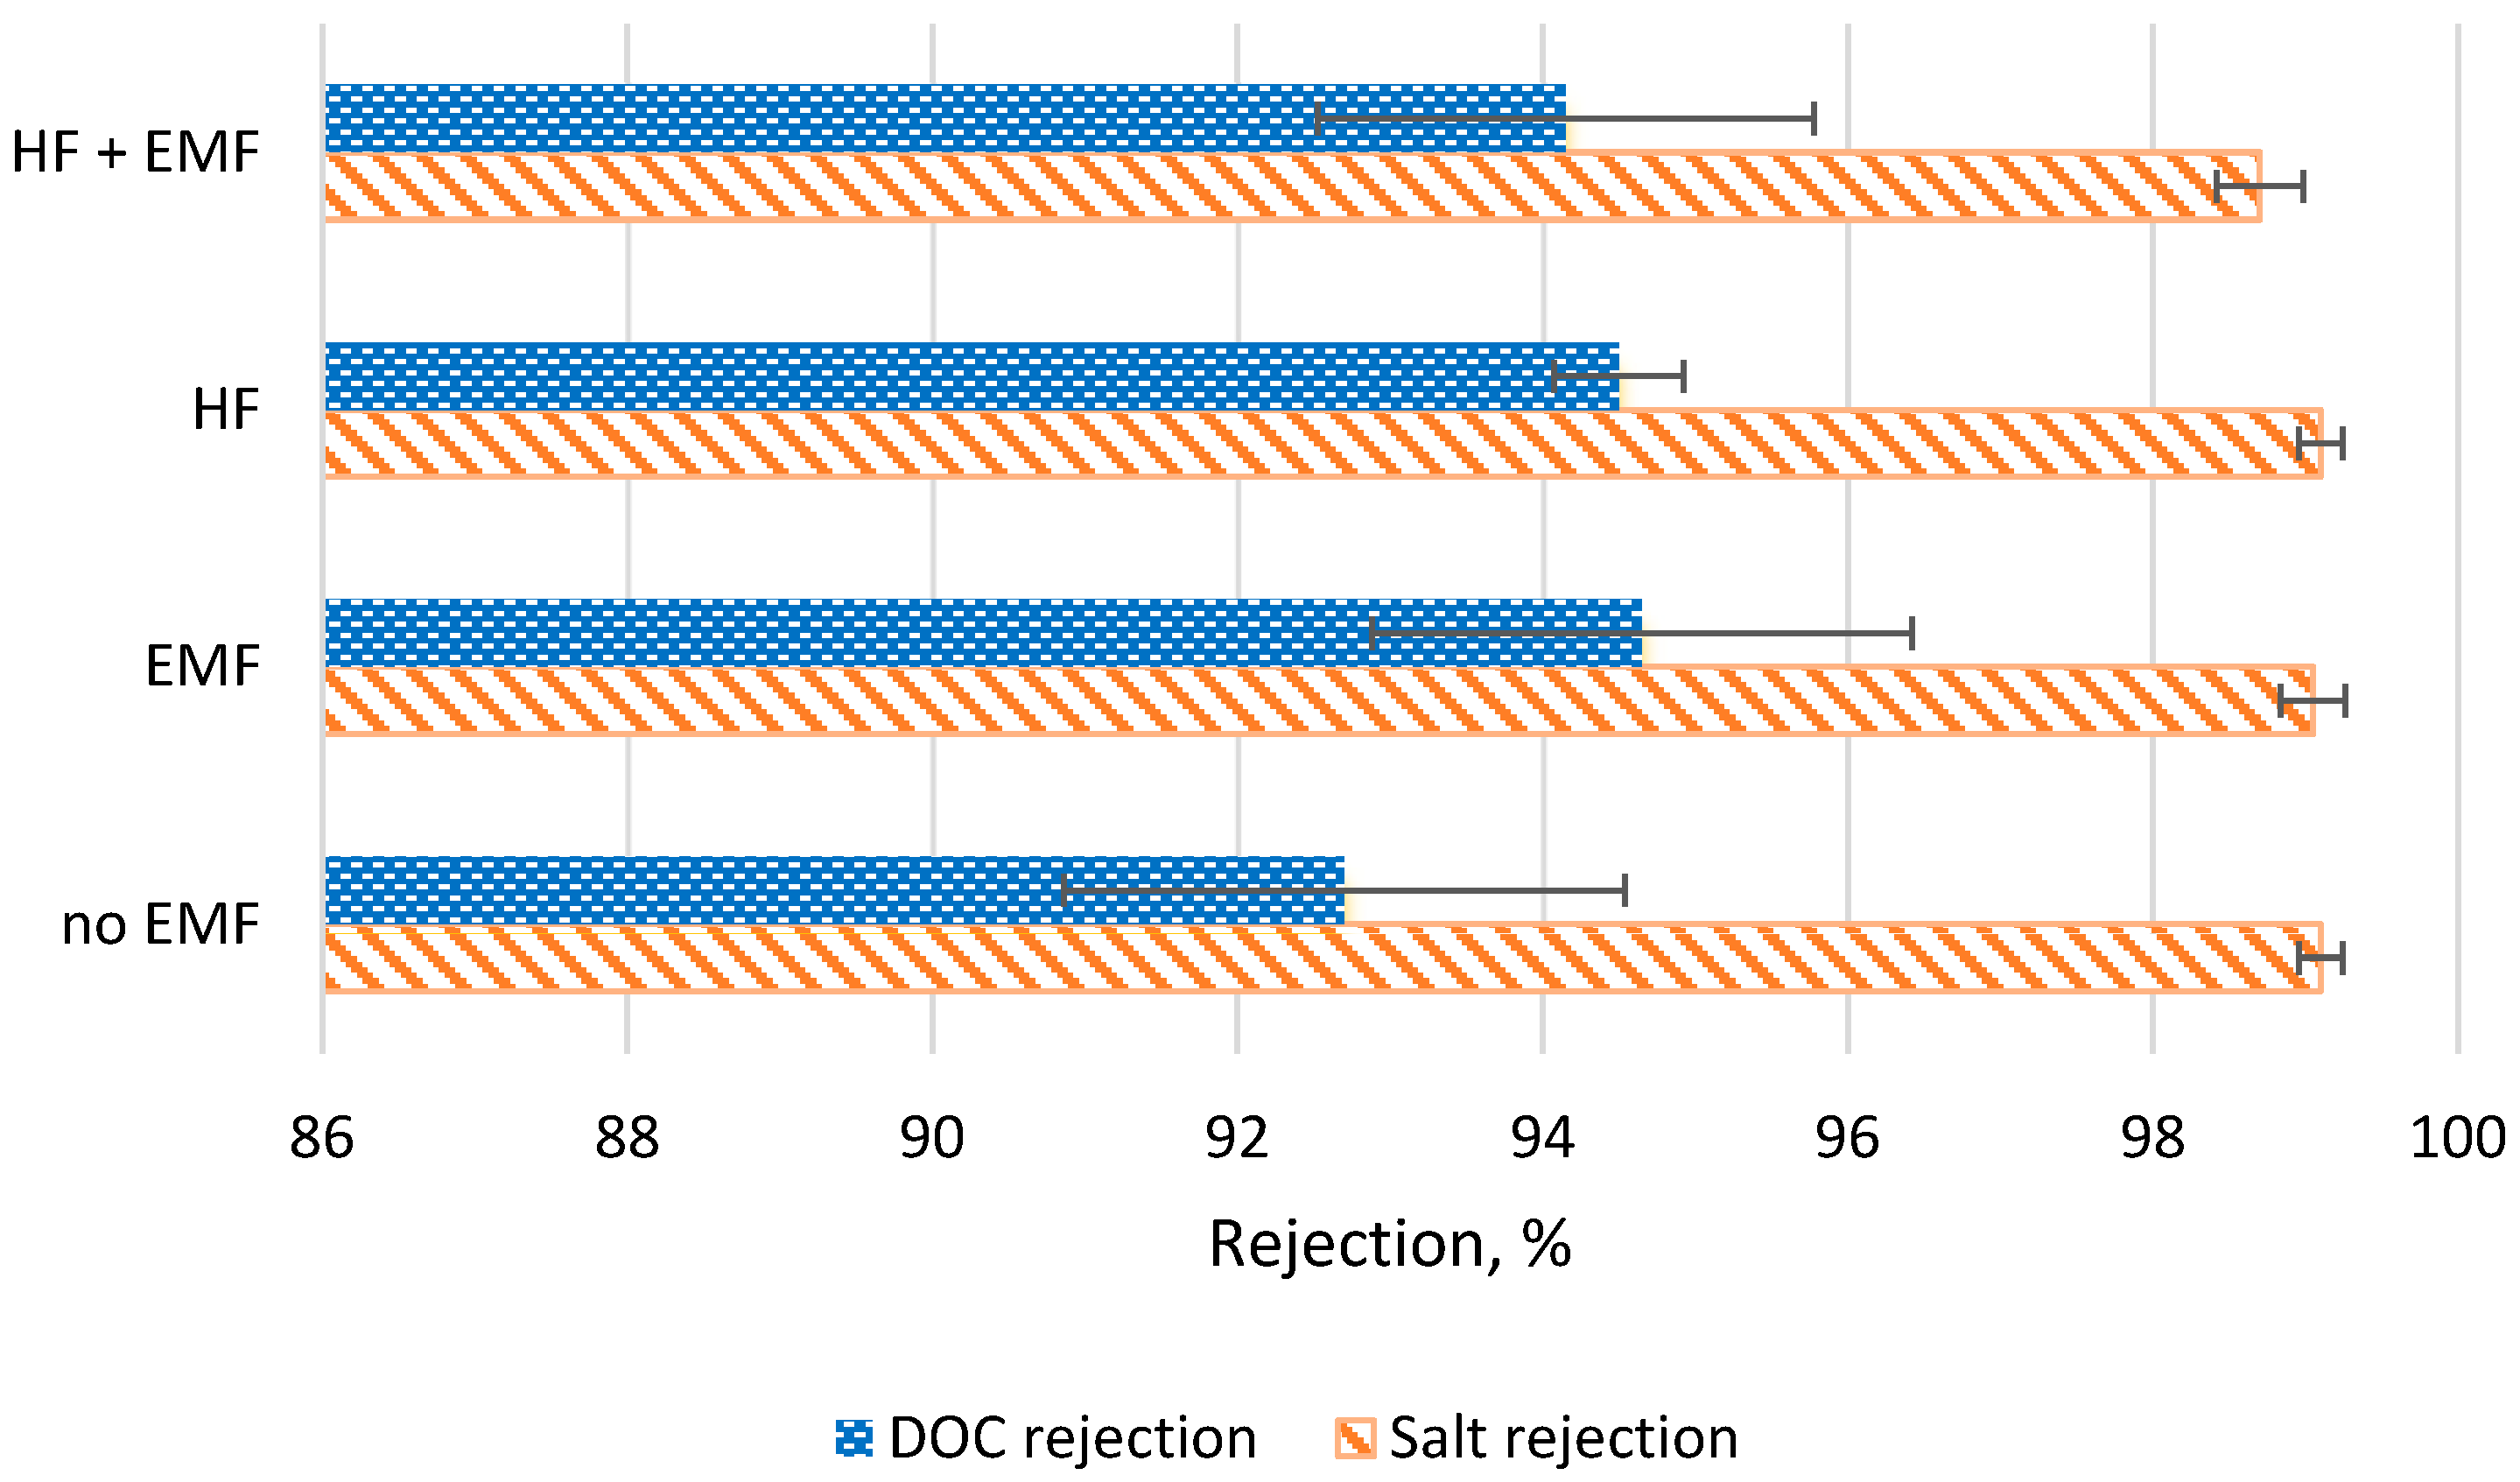
41]. This research is the first study that quantitatively assessed the effect of an AC-induced EMF on foulant formation and accumulation on RO membrane surfaces, as well as its influence on permeate water quality during secondary effluent treatment. This study filled the knowledge gap in comparing the effectiveness of the EMF to antiscalants, a commonly employed pretreatment method, and explored the synergistic effects of EMF in combination with antiscalants on RO membrane performance. Additional experiments were conducted to determine if membrane flux restoration was possible through periodic hydraulic flushing, both with and without the presence of the EMF. The findings of this study enhance our understanding of how EMFs influence the performance of RO systems in wastewater treatment and offer insights into the reduction or elimination of chemical usage during advanced wastewater treatment and reuse.

2. Materials and Methods

2.1. Feedwater Quality

The effects of EMF on RO membrane fouling and scaling control were studied using the secondary effluent from the Roberto Bustamante Wastewater Treatment Plant (RBWWTP), El Paso, TX, USA (Table 1).
Electrical conductivity (EC) and pH and temperature were measured using a hand-held conductivity meter (Hach SensION 5 conductivity meter, Cole-Palmer, Vernon Hills, IL, USA) and a pH meter (Oakton PC 300 m, Cole-Palmer, Vernon Hills, IL, USA), respectively. Alkalinity was measured using the acid titration method (Hach Digital Titrator, Model 16900, Cole-Palmer, Vernon Hills, IL, USA). Elements and metals were analyzed with inductively coupled plasma–optical emission spectrometry (ICP-OES; Optima 4300 DV, PerkinElmer, MA, USA), and common cations and anions were measured using an ion chromatograph (IC; ICS-2100, Dionex, Sunnyvale, CA, USA). Organics in water were measured as dissolved organic carbon (DOC; Shimadzu TOC-L, Kyoto, Japan) using fluorescence excitation–emission matrix spectroscopy (F-EEM, Aqualog-UV-800-C, Horiba Instruments Inc., Piscataway, NJ, USA). All the samples for IC, ICP-OES, DOC, and F-EEM measurements were filtered using Cole-Parmer Nylon Chromatography Syringe filters (0.45 μm pore size) before the instrumental analysis.

2.2. Properties of EMF

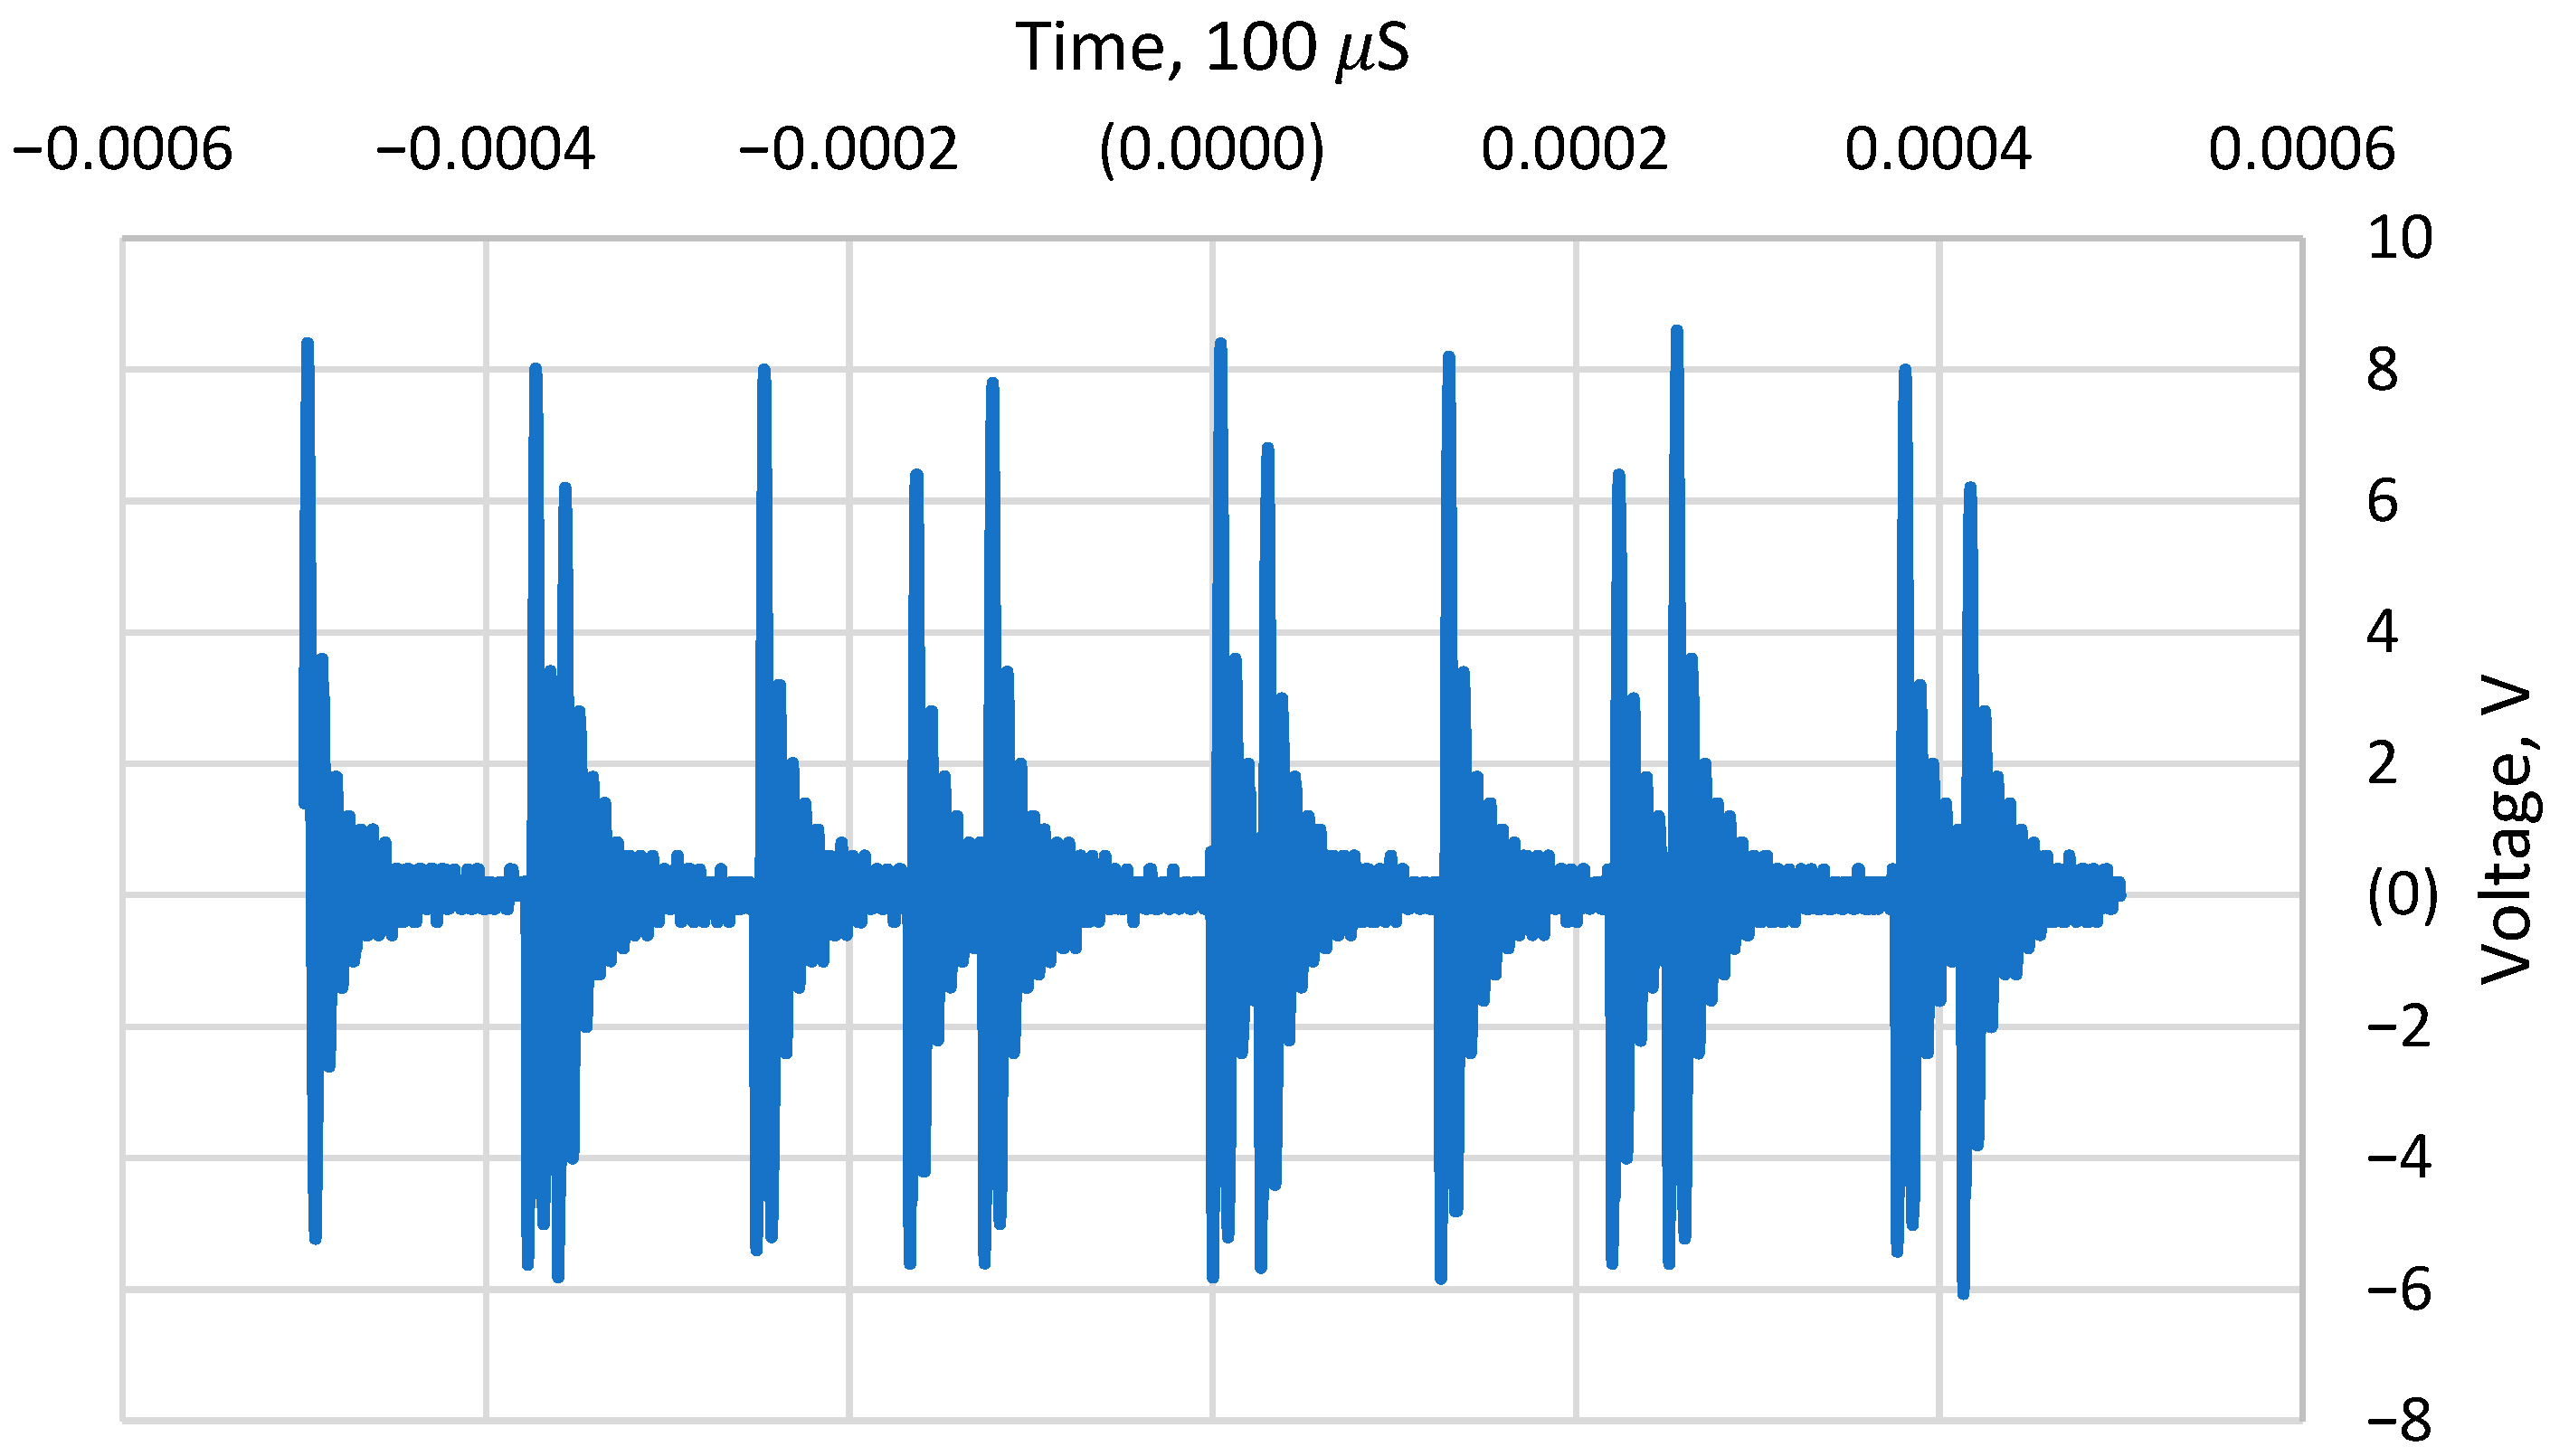
The EMF device utilized in this study is designed for scale control with a specialized transducer connected to a ferrite ring that generates pulsed, decaying sinusoidal electric signals at a frequency of ±150 kHz. The device operates at a maximum power of 1.2 W and produces a peak-to-peak voltage of 14.4 V (Figure 1). The characterization of the EMF device was performed using an oscilloscope Tektronix TDS 1002B (Tektronix, Beaverton, OR, USA) and a 3DHALL magnetic sensor (Model SENM3DX, Senis, Switzerland) that allows the acquisition of all three magnetic-field components (Bx, By, and Bz) at the same time. The magnetic field and electric field generated by the device were measured as 0.51 mT and 811 V/m, respectively.

2.3. Bench-Scale Fouling and Scaling Experiments

The objective of this research is to assess the effectiveness of EMFs in reducing fouling and scaling on RO membranes during the treatment of municipal secondary effluent. In a typical potable reuse project, RO filtration is preceded by microfiltration (MF) or ultrafiltration (UF). However, in this study, the wastewater was intentionally not filtered by MF or UF to accelerate scaling and particulate fouling on the RO membranes.
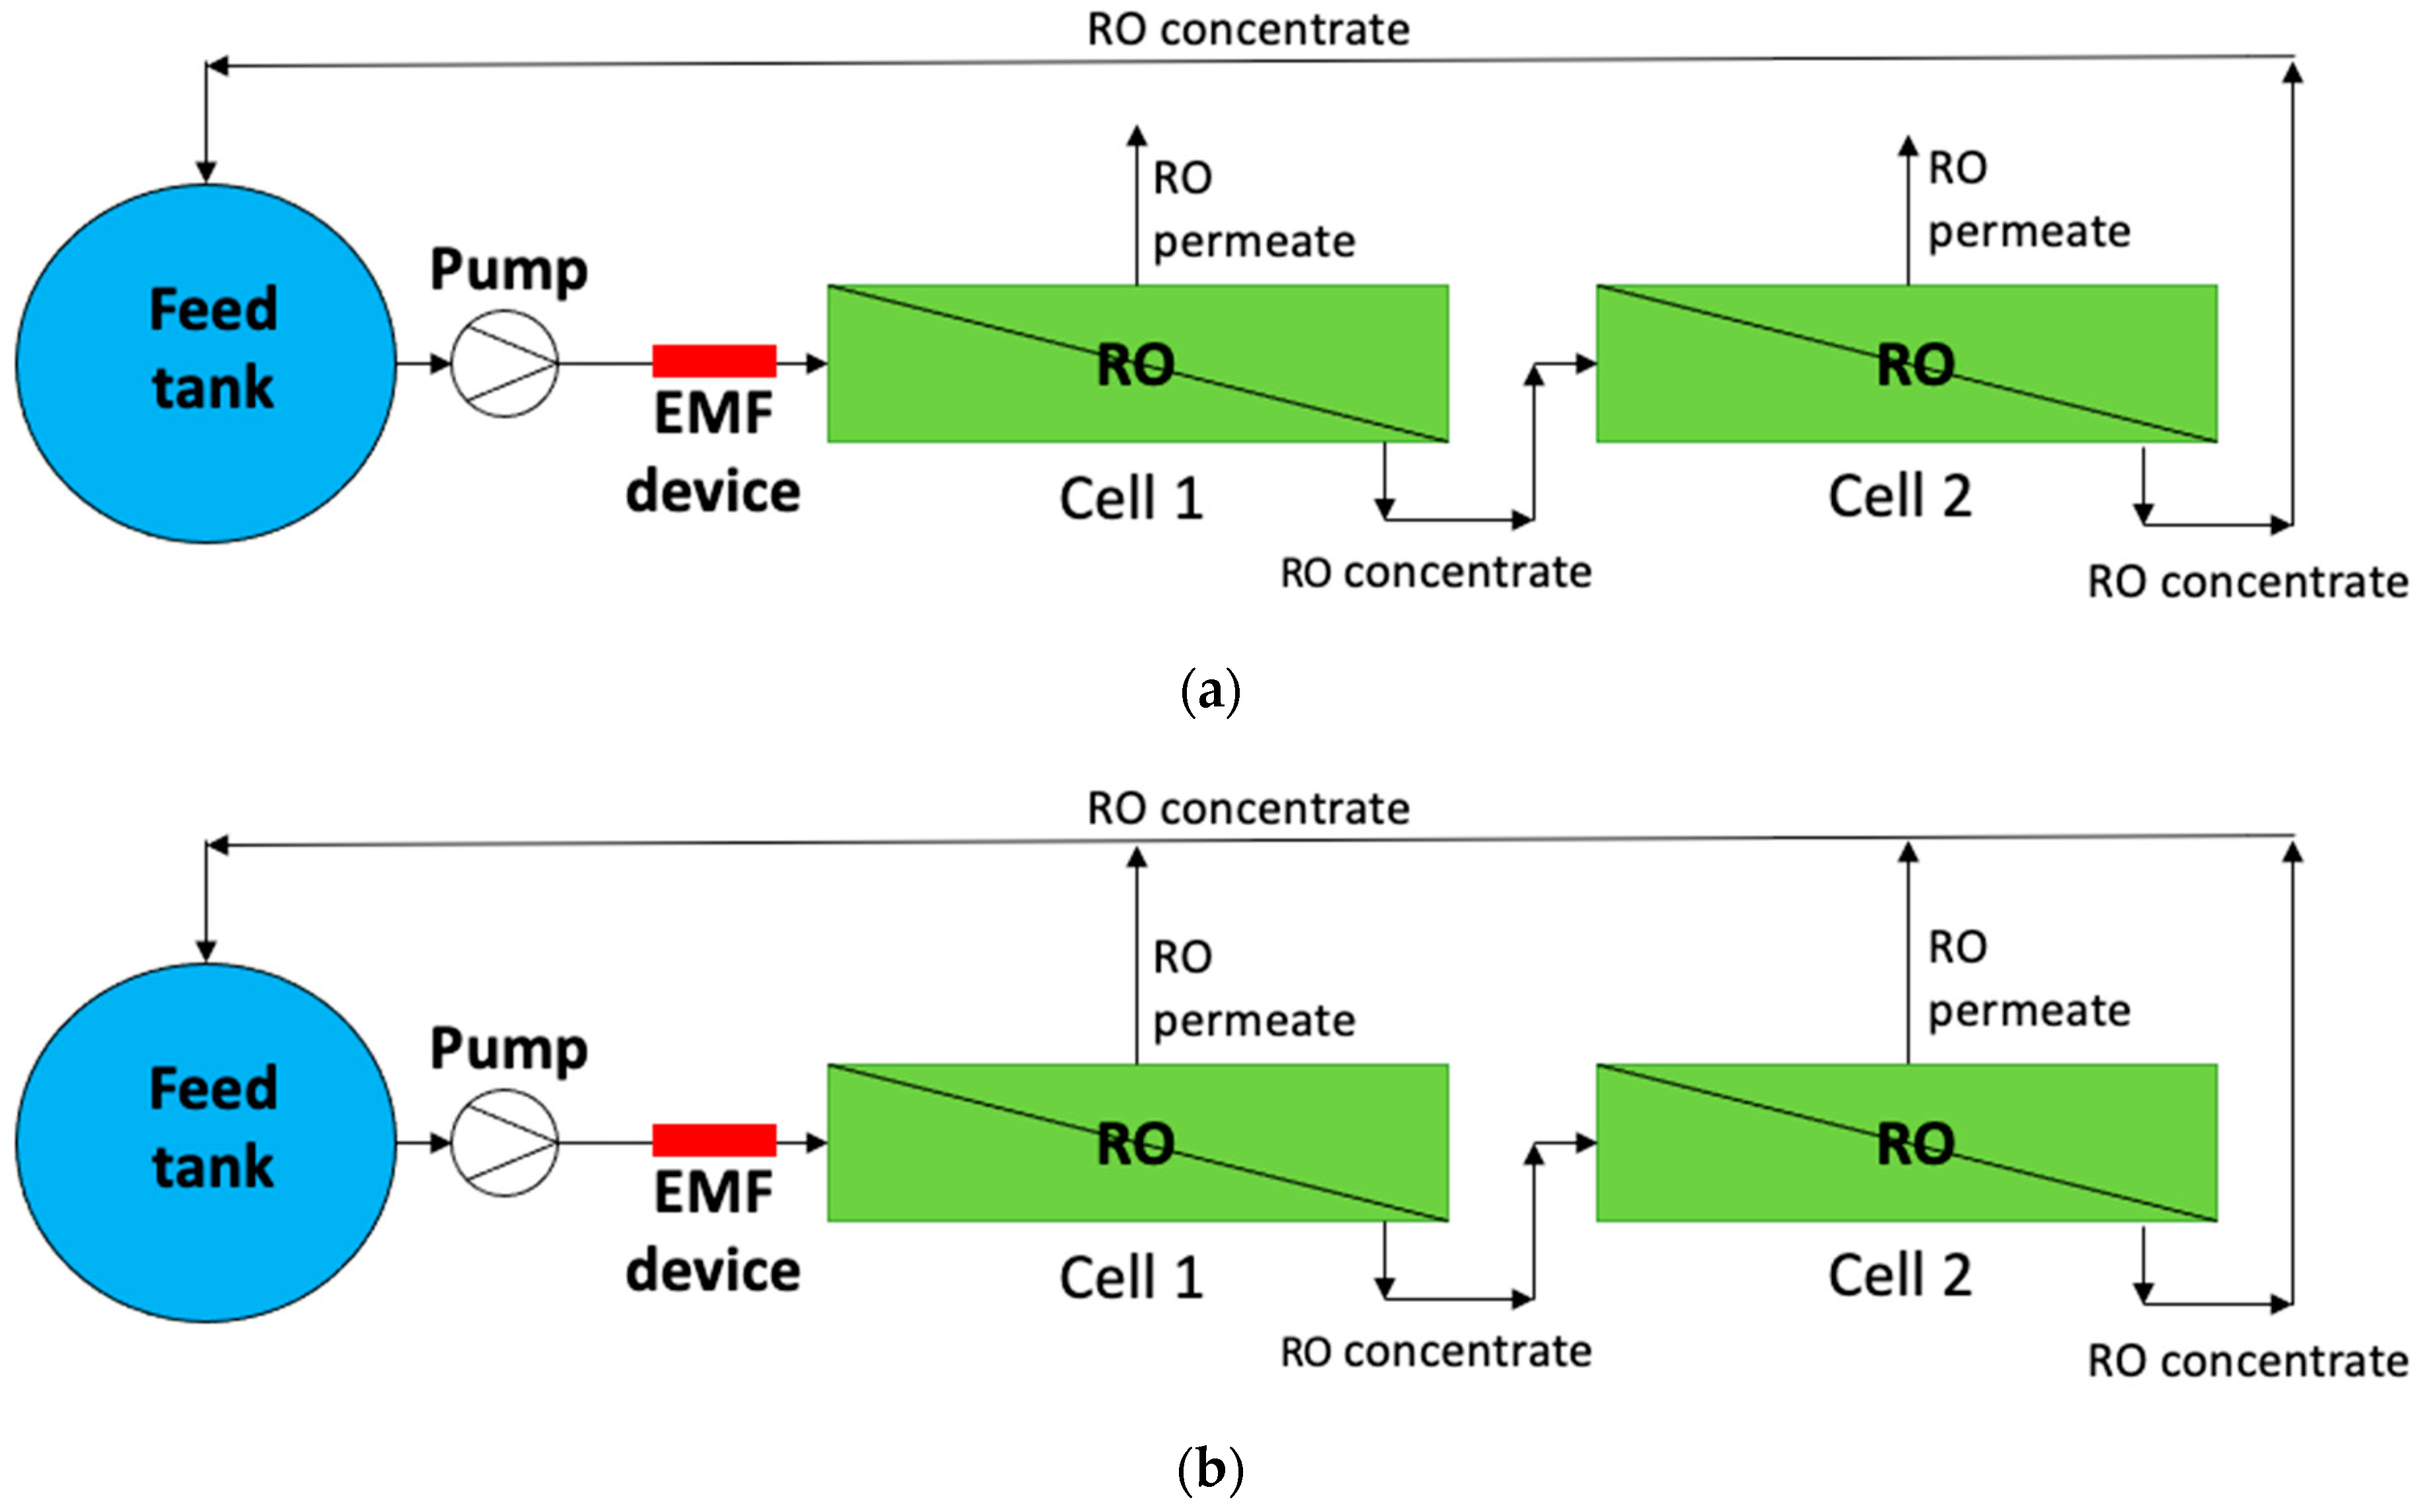
A flat-sheet, bench-scale filtration system was employed to investigate the effect of EMF on low-pressure, brackish water RO membranes (Hydranautics’ ESPA2-LD flat sheet membranes) that included two standard cross-flow SEPA cells. The SEPA cells were installed in series and are regarded as duplicates in each test, with a slight increase in feedwater concentration to the second cell. The rectangular plate-and-frame cell used had the dimensions of a channel length of 14.6 cm, a width of 9.5 cm, and a height of 0.86 mm (34 mil). This configuration resulted in an effective membrane area of 139 cm2 per unit and a cross-sectional flow area of 0.82 cm2. The cells and tubing were made of stainless steel. To manage membrane fouling and scaling, the EMF device was placed at the inlet of the RO units through an SA 213 grade TP 316 stainless steel pipe with an outer diameter of 3/8 inches and an inner diameter of 0.255 inches.
A LabVIEW data acquisition system was used for monitoring and controlling the RO system, which operated in either a continuous, recirculation mode (recirculating both concentrate and permeate to the feed tank) or feed-and-bleed mode (recirculating only concentrate to the feedwater tank while discharging permeate to enhance water recovery) (Figure A1). The feedwater flow rate was controlled at 1 L/min (cross-flow or linear flow velocity of 0.20 m/s) using a Hydra-cell pump (M03EKSGSFSHA, Wanner Engineering, Inc., Minneapolis, MN, USA) with a Dayton motor (1F798, Grainger, IL, USA), and feed pressure was maintained at 150 psi (1034 kPa) through manual and automated pressure valves. Two different operation modes were tested with up to four different pretreatment conditions, including (a) no pretreatment, (b) only EMF, (c) only adding antiscalant, and (d) EMF combined with the addition of antiscalant. In feed-and-bleed operation, tests with 10 L of feedwater were conducted until the highest possible water recovery (with a target of 90%) was achieved. Hypersperse MDC714, manufactured by Suez Water, was used as the antiscalant in these experiments with a dosage of 1 mg/L. During the testing, pressure, flow rate, conductivity, pH, temperature, and turbidity were monitored for all the streams in the RO system, and water samples were collected for chemical analysis.
All the experiments were conducted in replicates to ensure experimental reproducibility, especially because this study used real wastewater that had variability in water quality, as shown in Table 1. The variability of the membrane-fouling experiments was calculated as the standard deviation of permeate water flux/average water flux of duplicate testing. The experimental results demonstrate high reproducibility of the membrane fouling experiments with a variability of less than 10%. Four experiments had variability higher than 10%, which was caused by the high amounts of suspended solids in secondary effluent, resulting in different particulate fouling trends in duplicate experiments.

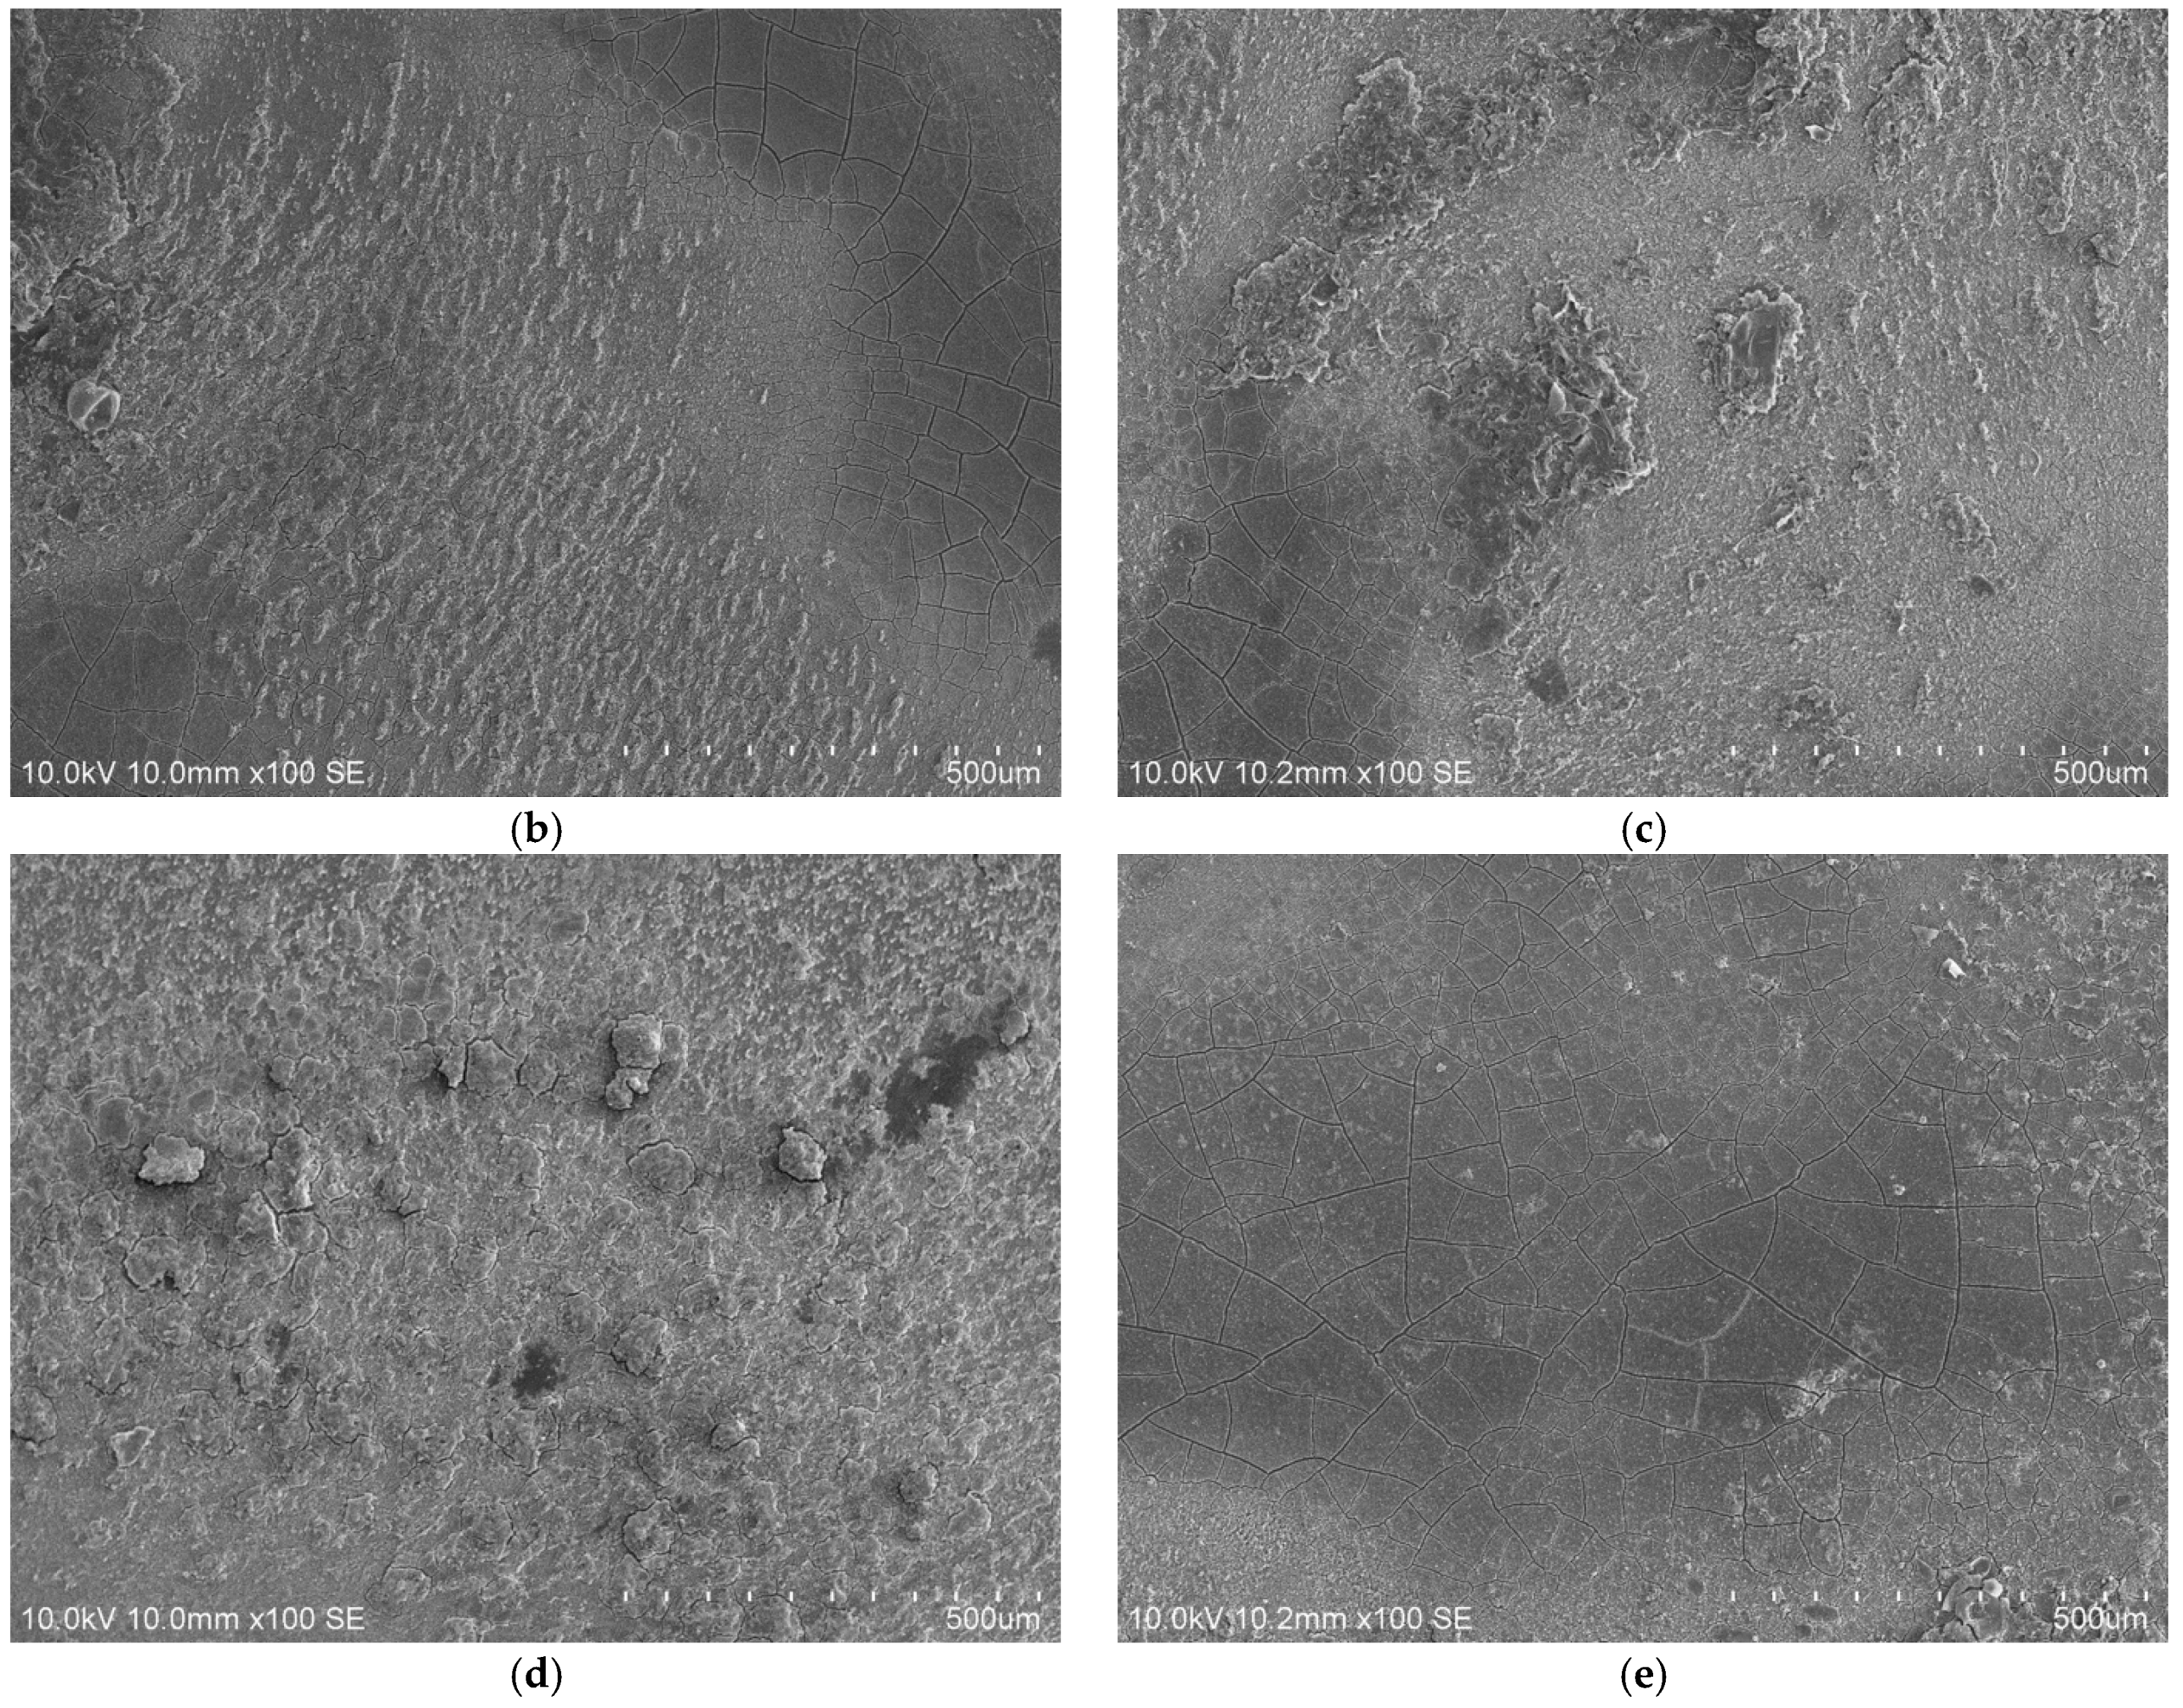
2.4. RO Membrane Fouling Characterization

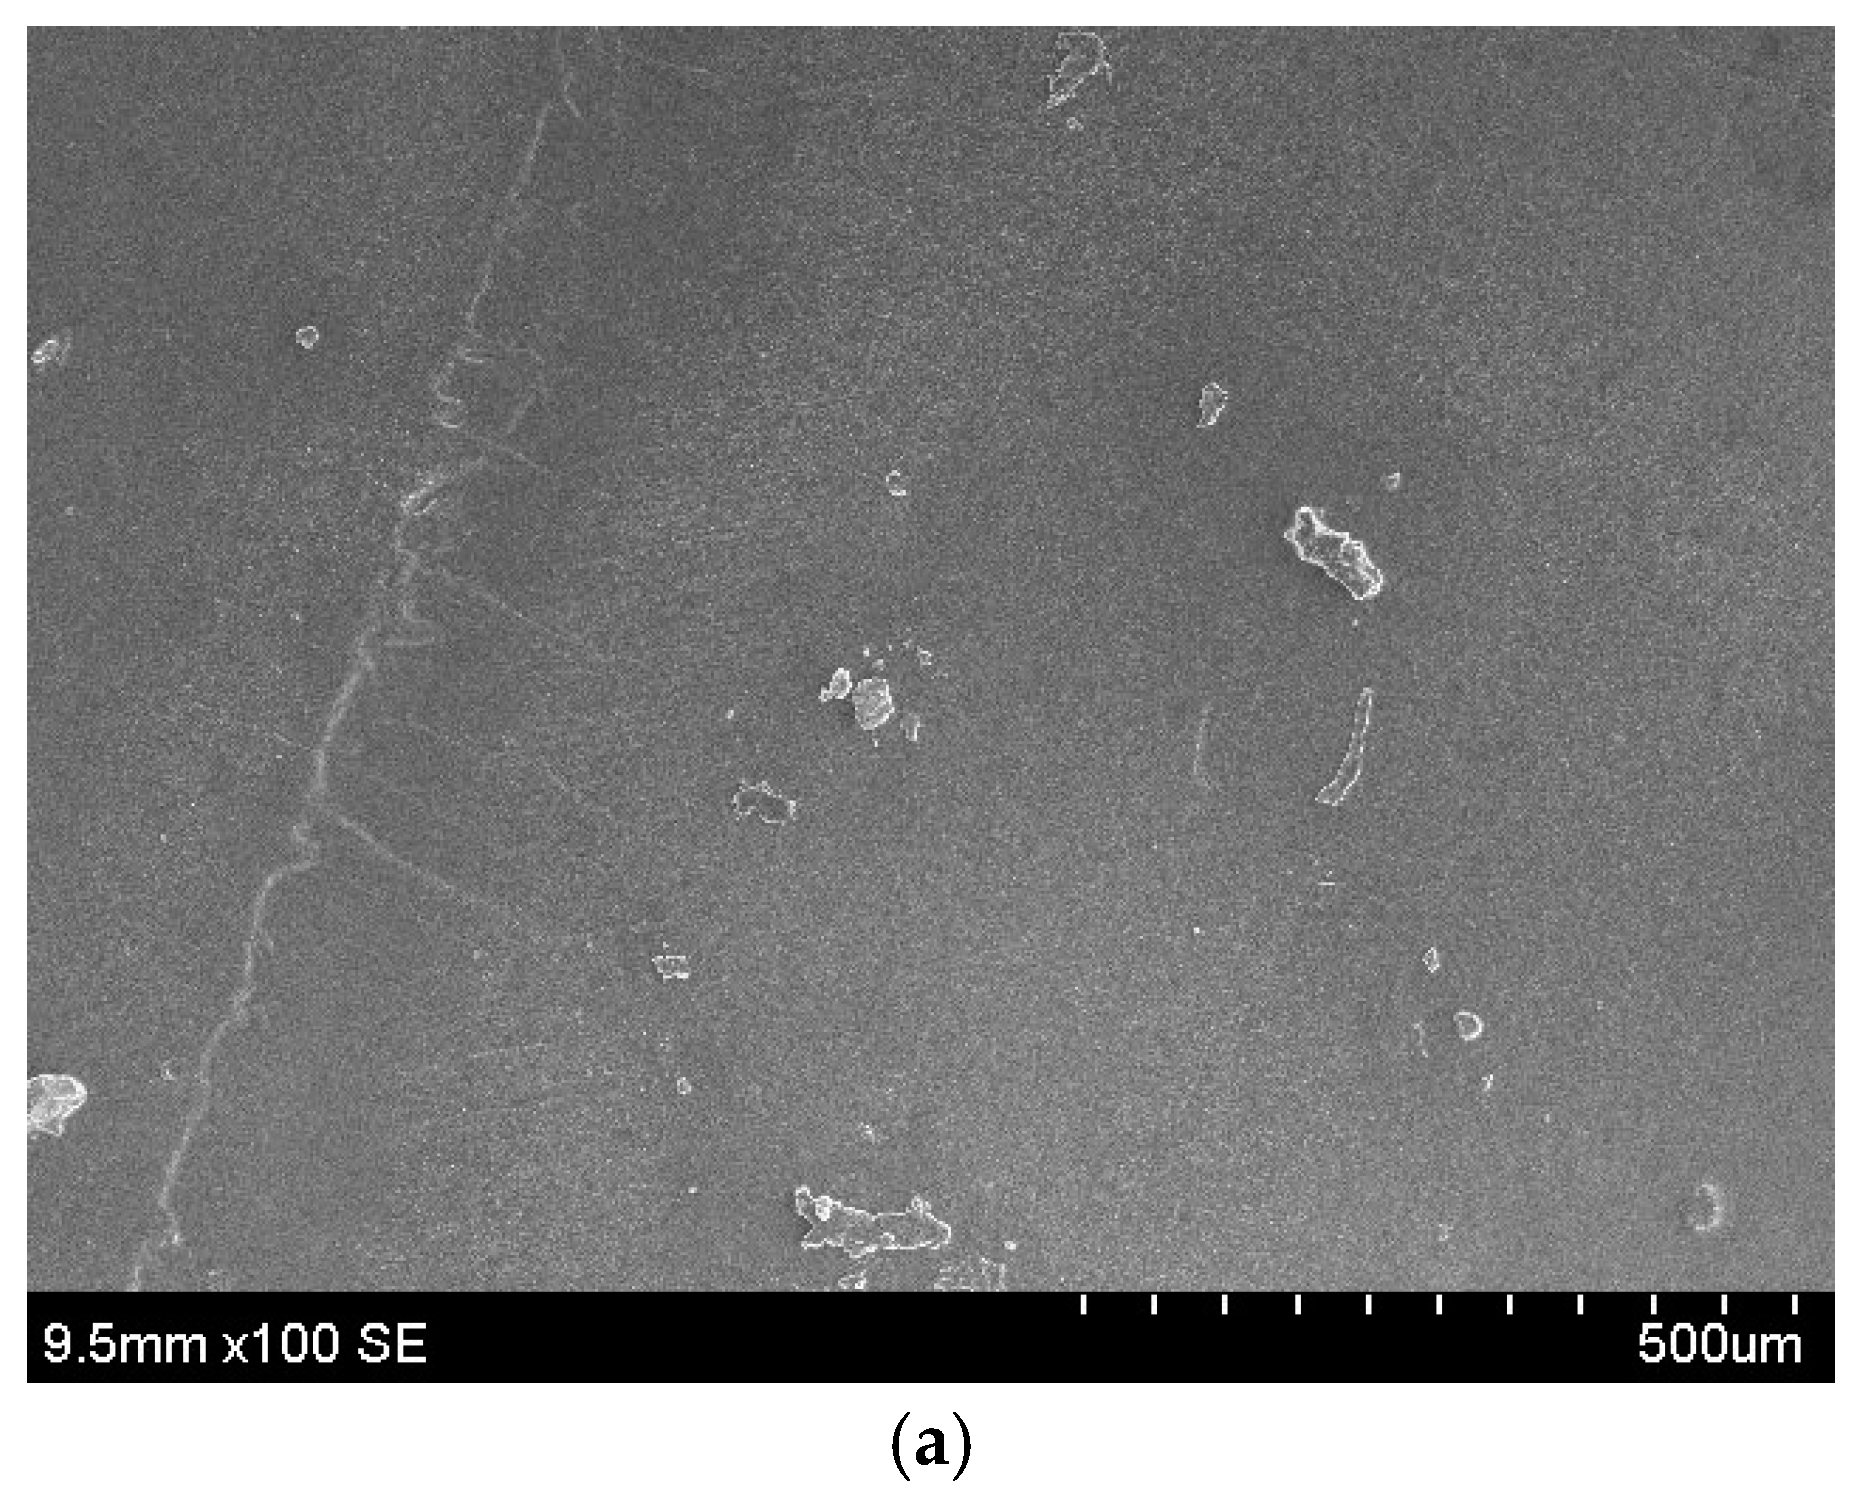
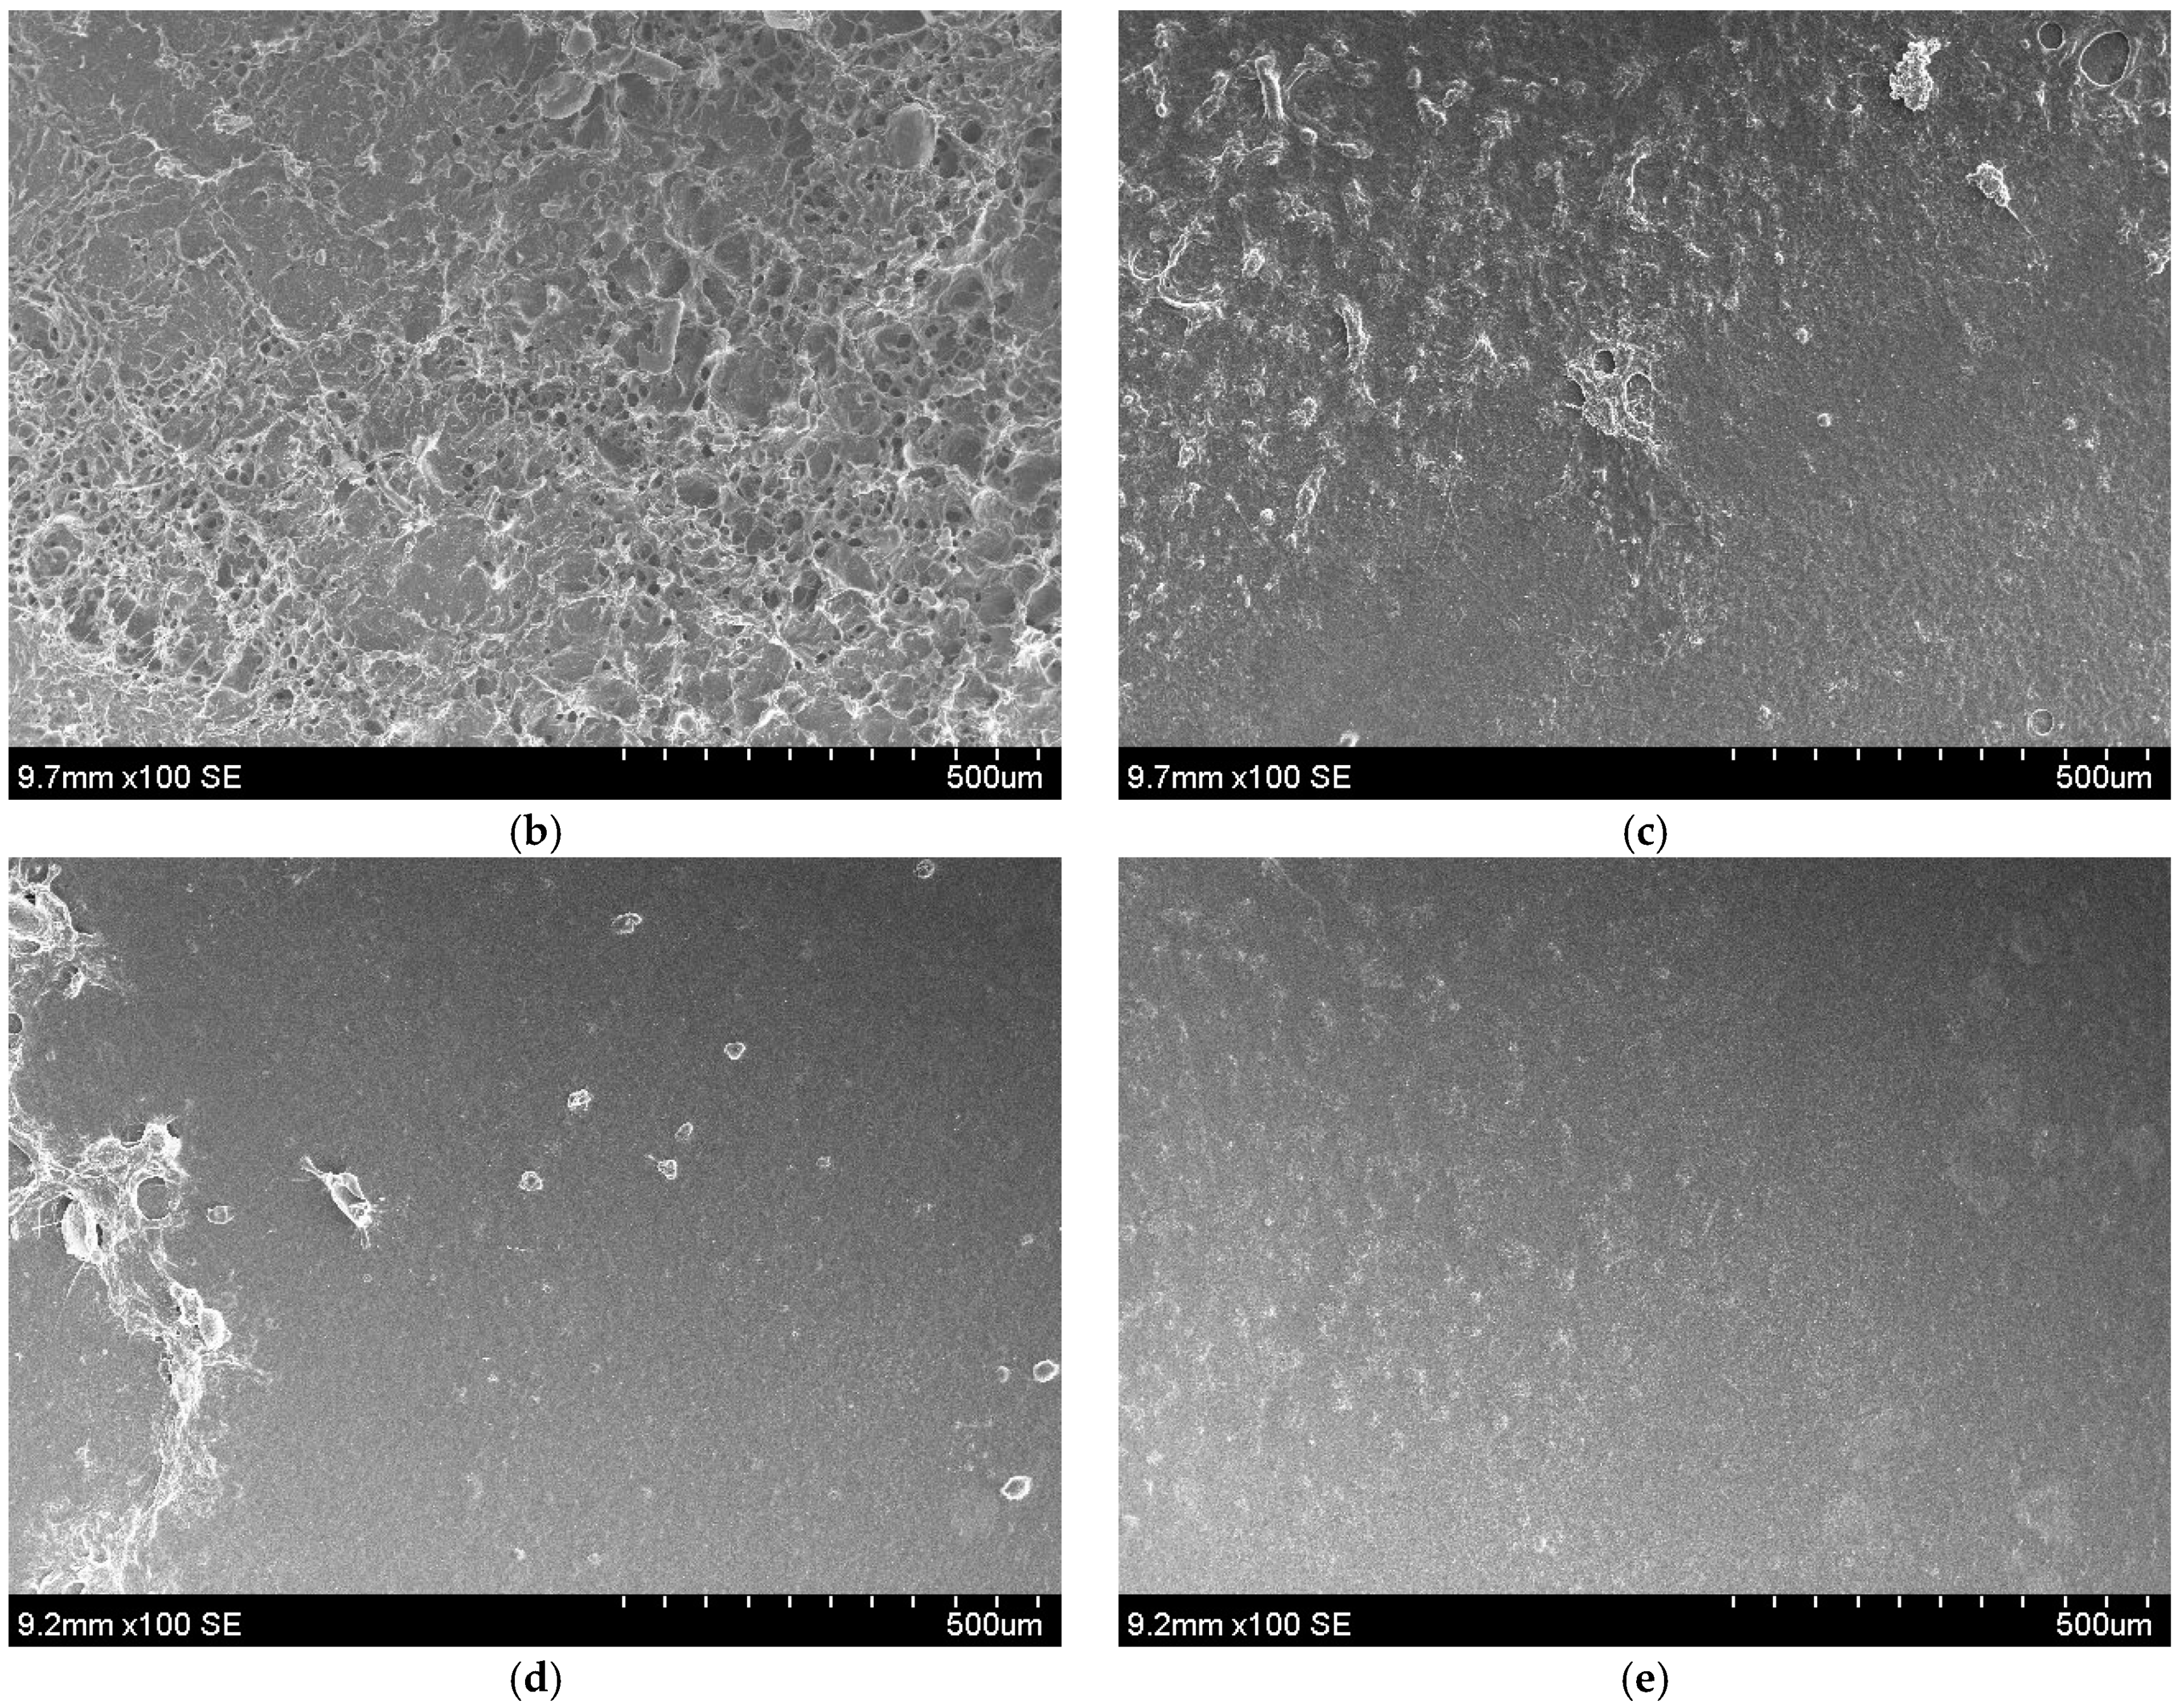
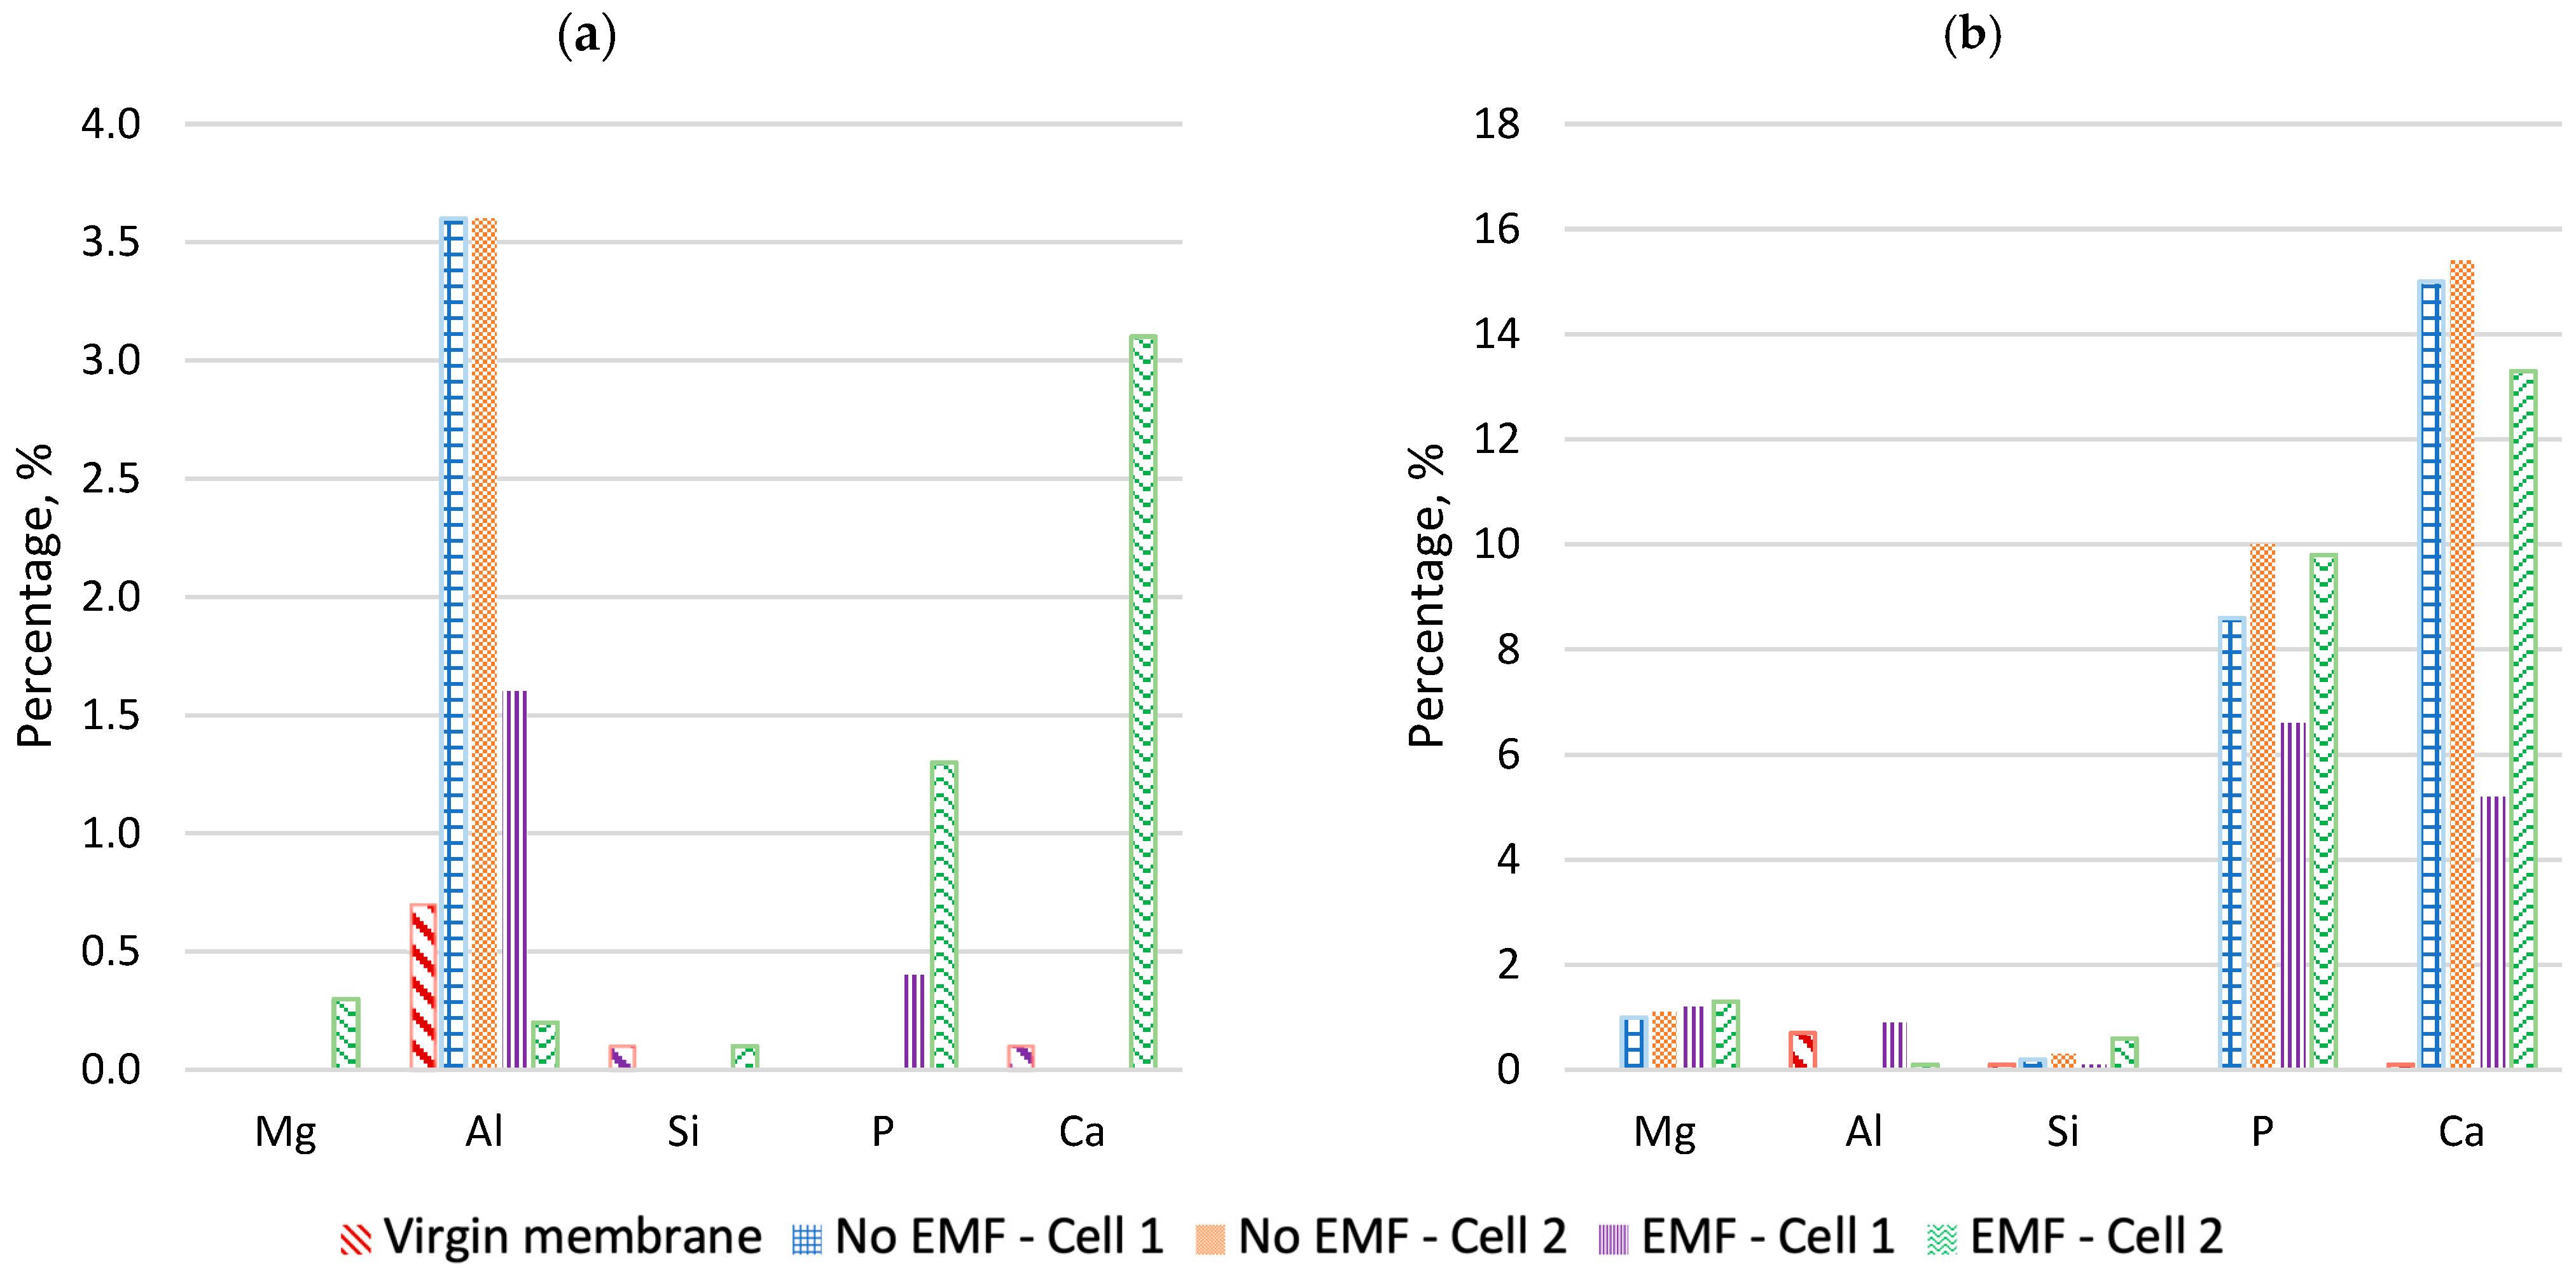
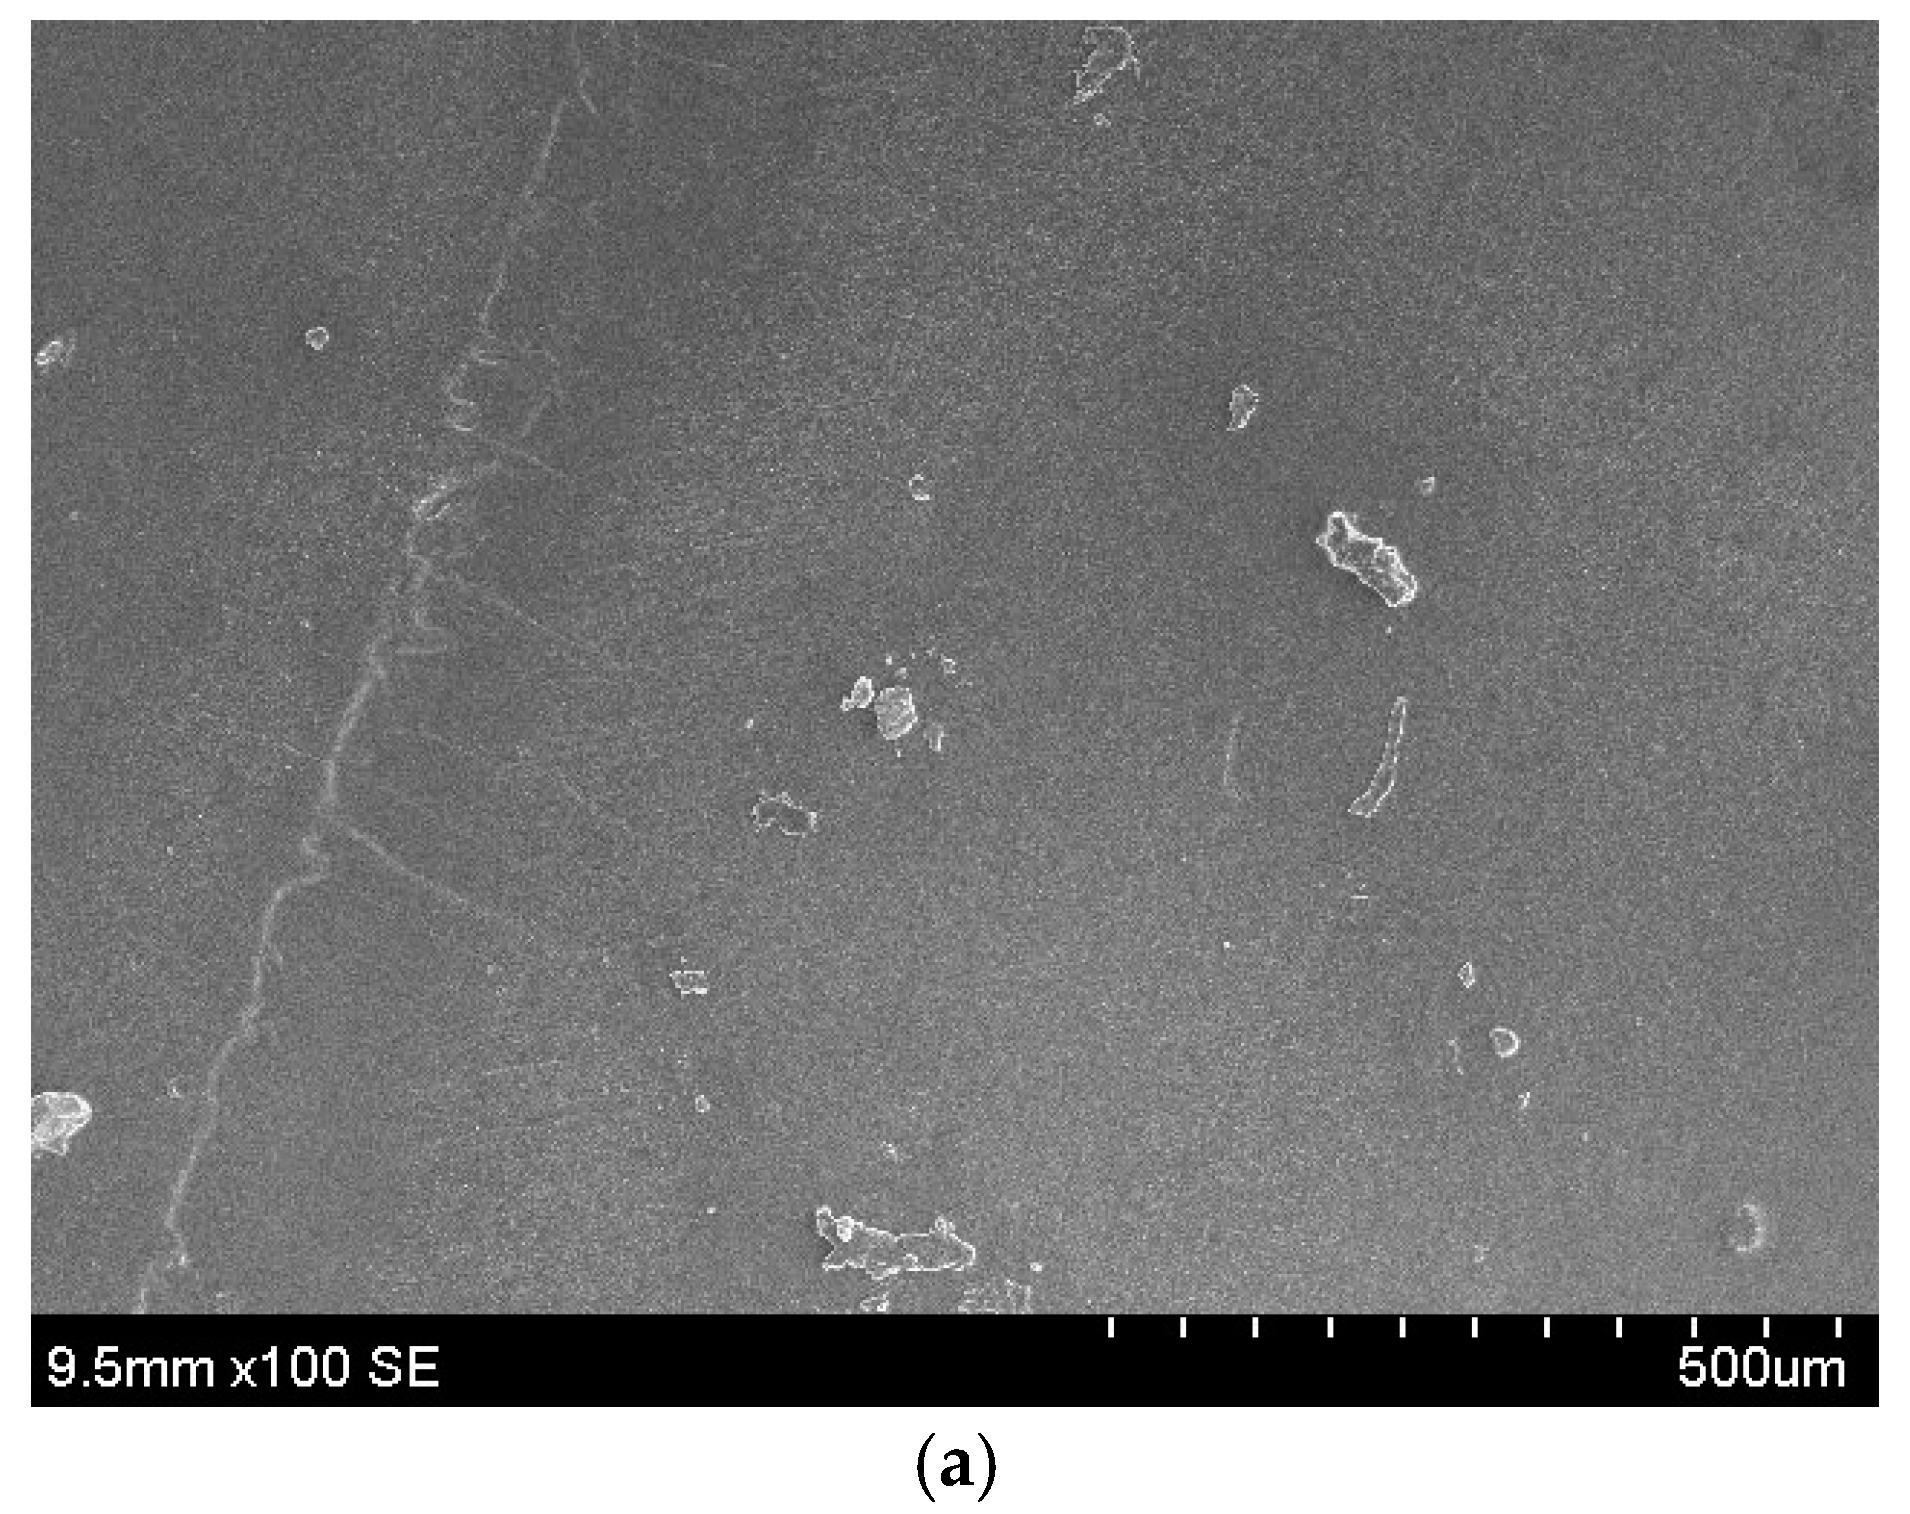
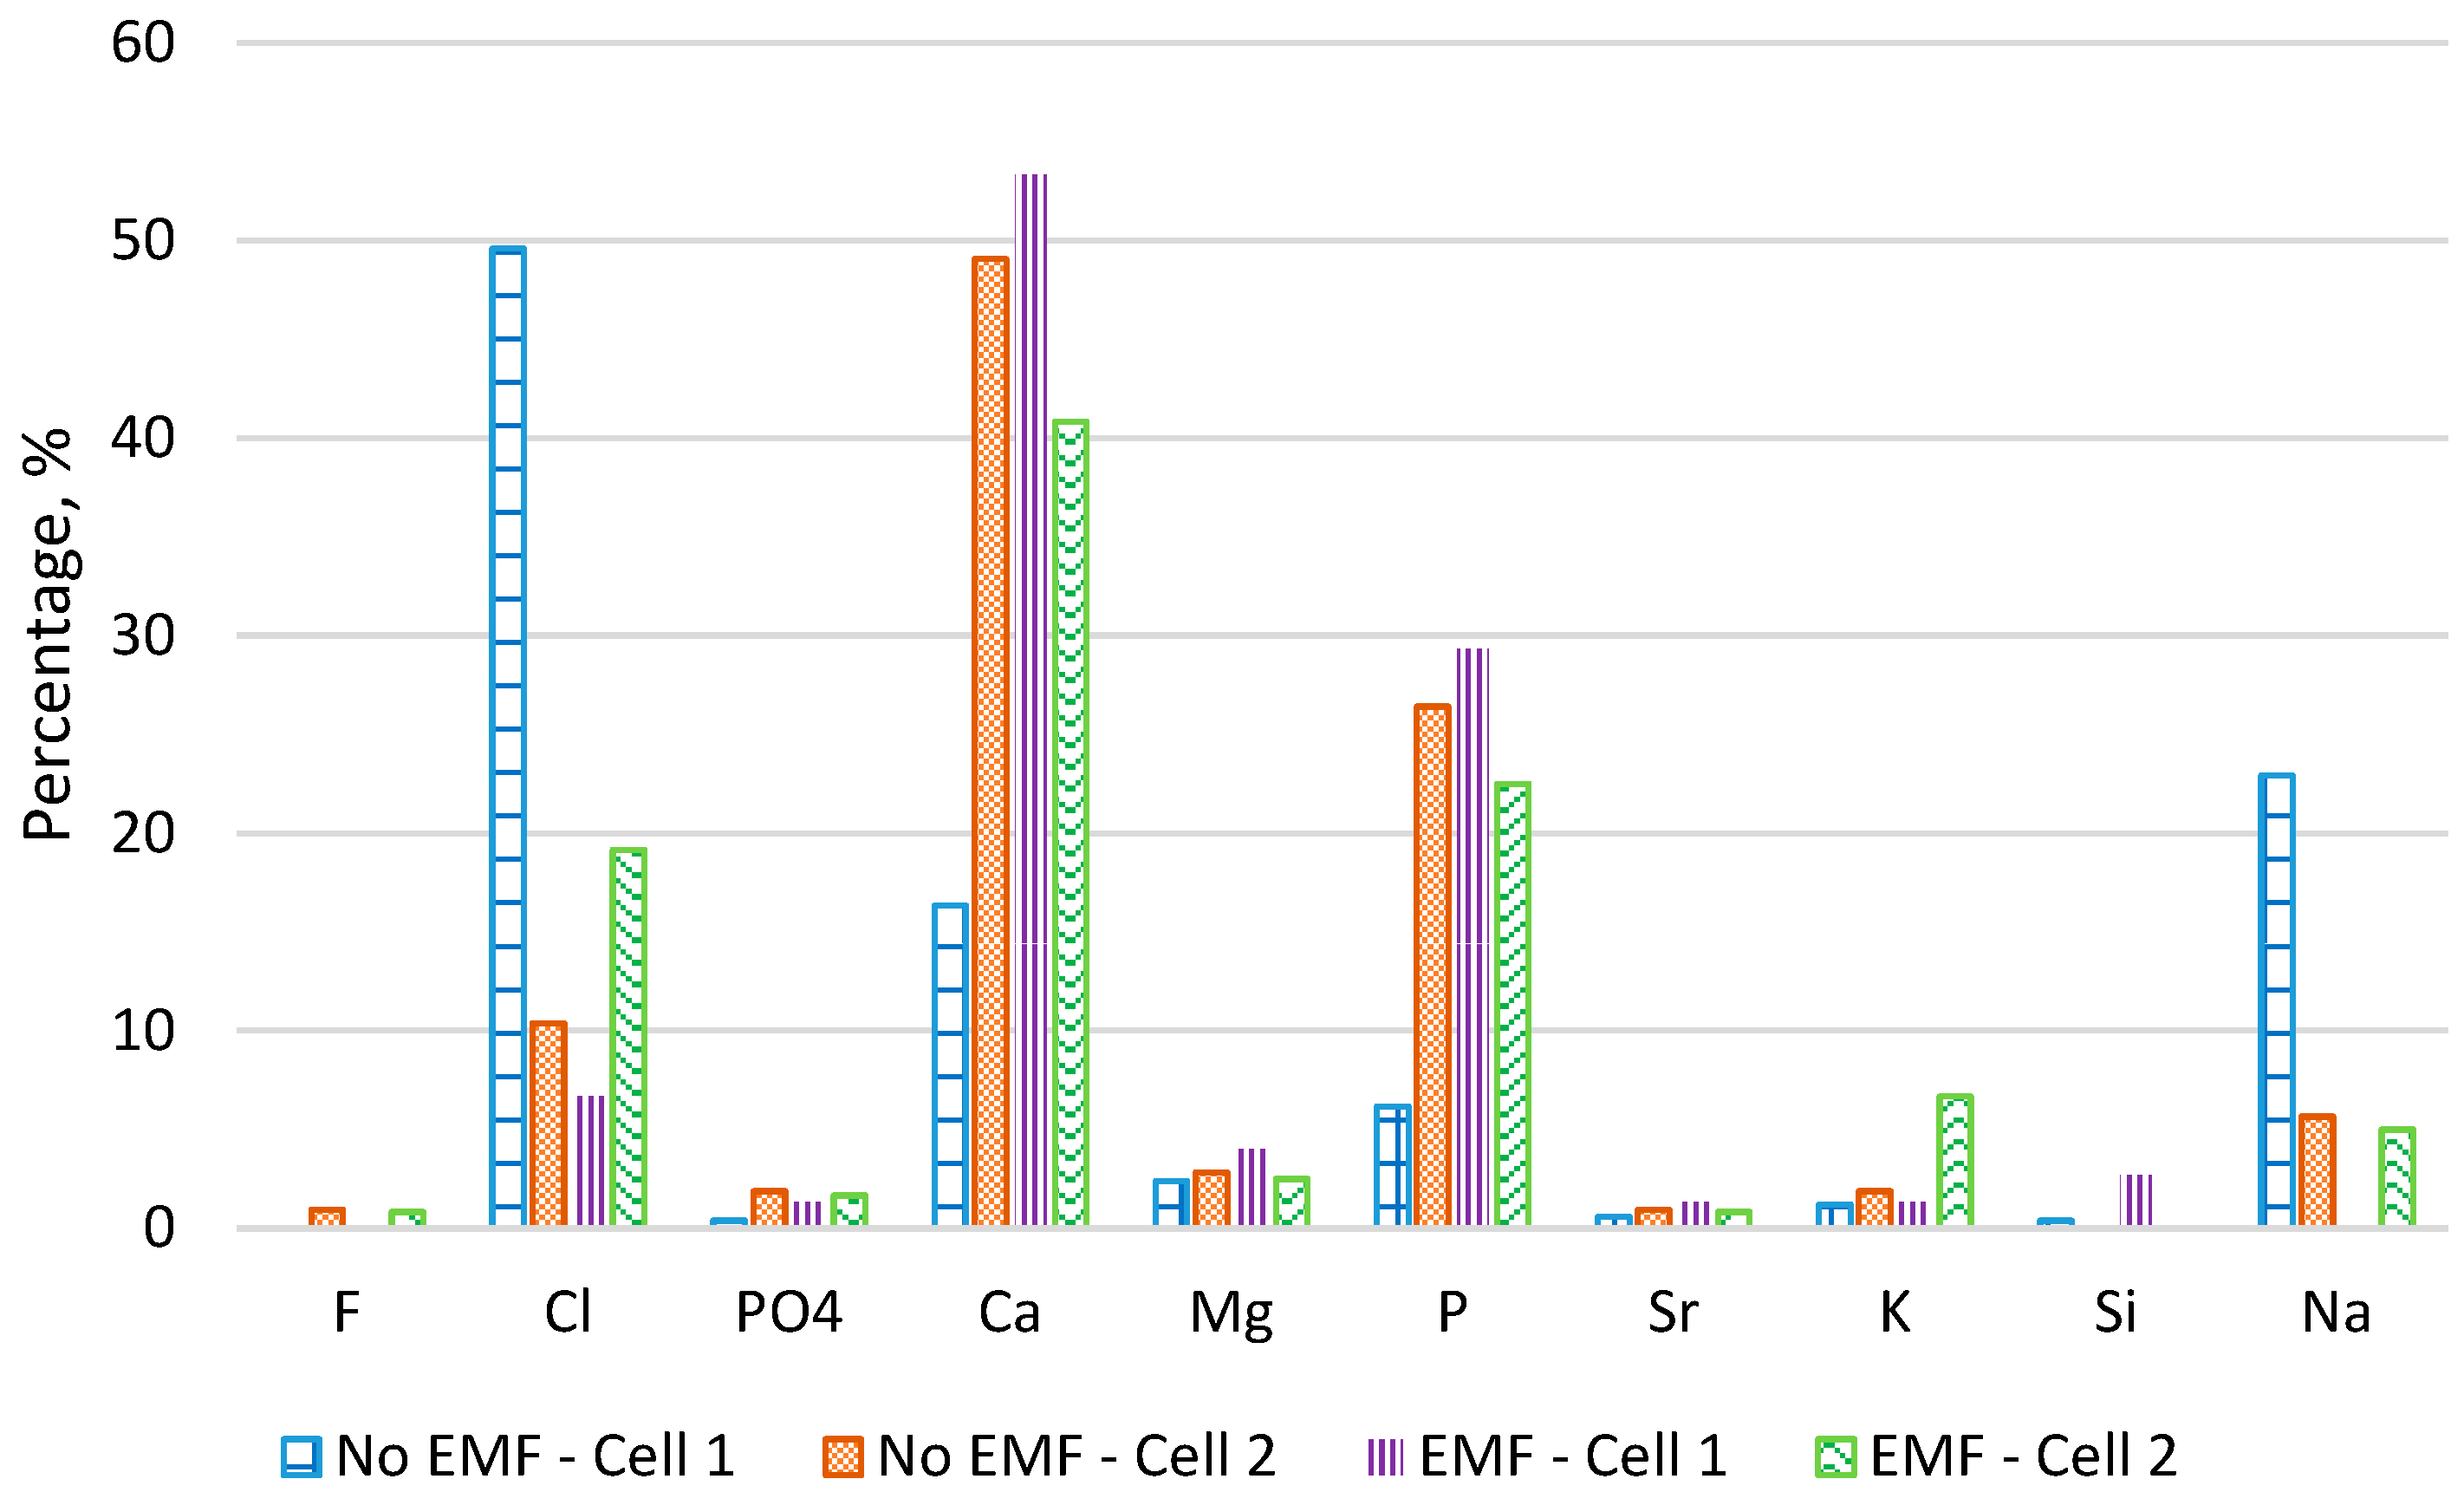
After each experiment, membrane specimens were collected to characterize membrane foulants and scalants formed on the membrane surface. The specimens were stored in sterile polystyrene Petri dishes and kept in a refrigerator (~4 °C, unexposed to light) prior to analysis. The membrane morphology, surface structure, and elemental composition were characterized by scanning electron microscope (SEM, S-3400N II, Hitachi High-Technologies Corp., Pleasanton, CA, USA) and energy dispersive X-ray microanalysis (EDS, Noran System Six 300, Thermo Electron Corp., Madison, WI, USA). To quantify membrane fouling and scaling under different operating conditions, chemical extractions were conducted on membrane samples, using a virgin membrane as baseline control. The membranes were cut into pieces of 16 cm2 and further into smaller pieces, and then they were soaked separately in 0.8 M nitric acid (HNO3) solution and 0.1 M potassium hydroxide (KOH) solution to extract inorganic scalants and organic foulants, respectively. All membranes and solution samples were ultrasonicated for 120 min and then centrifuged for particle separation from the solution. DOC and F-EEM were used to determine organic fouling. The concentrations of inorganic scalants were measured using IC and ICP-OES.
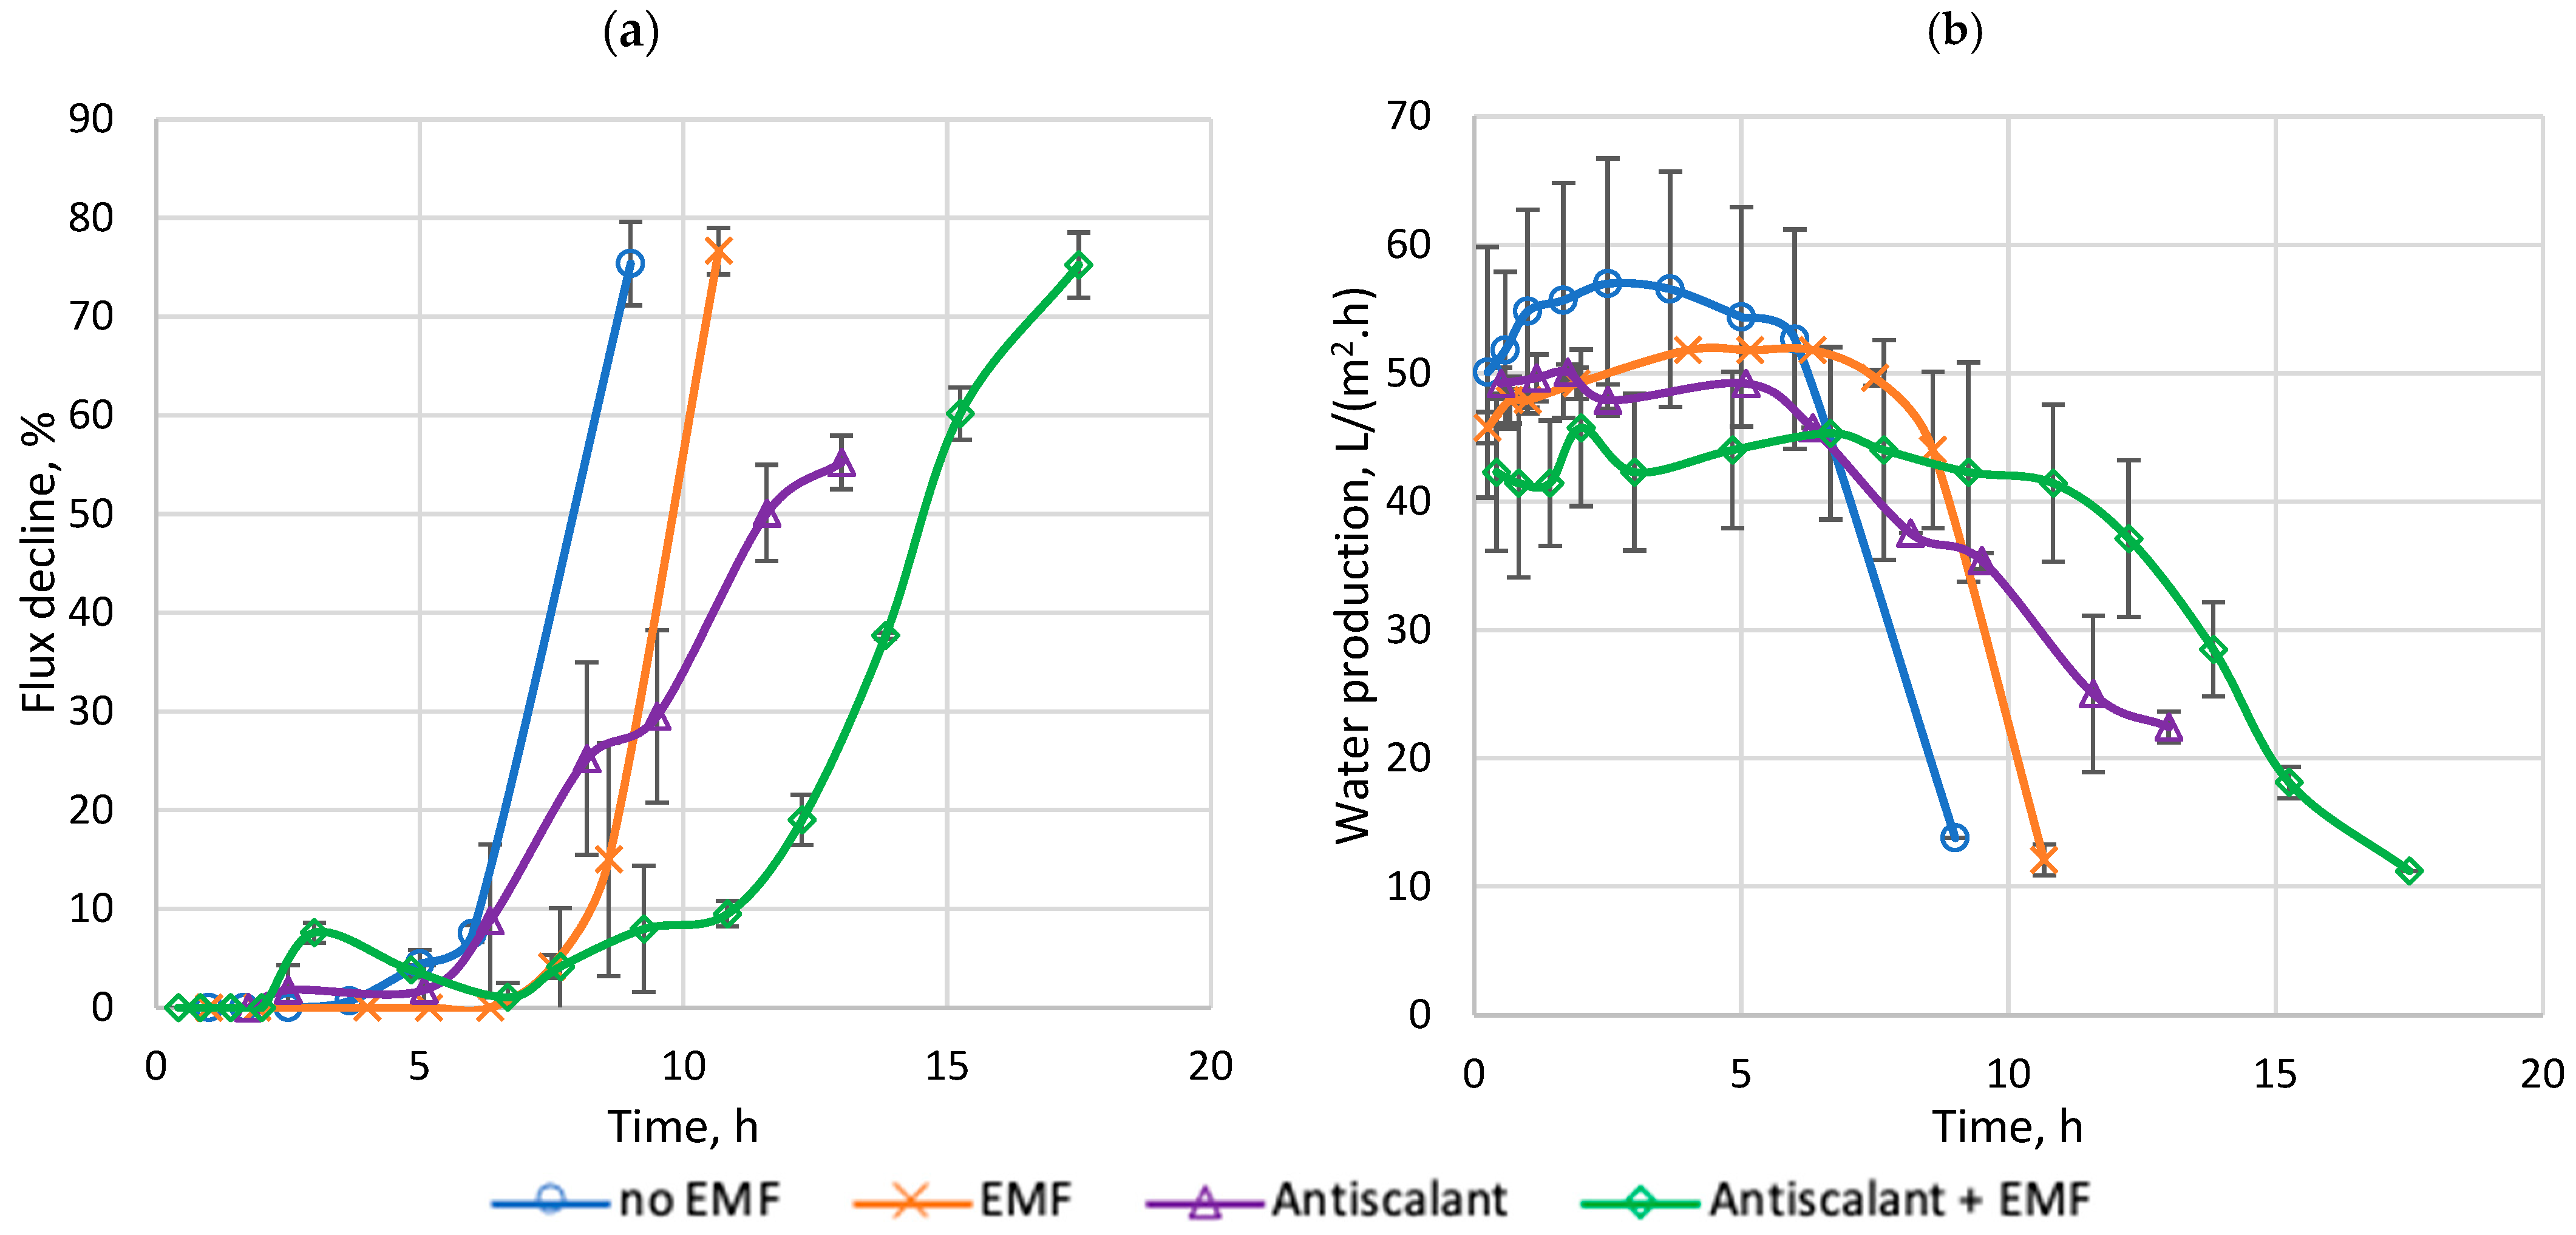
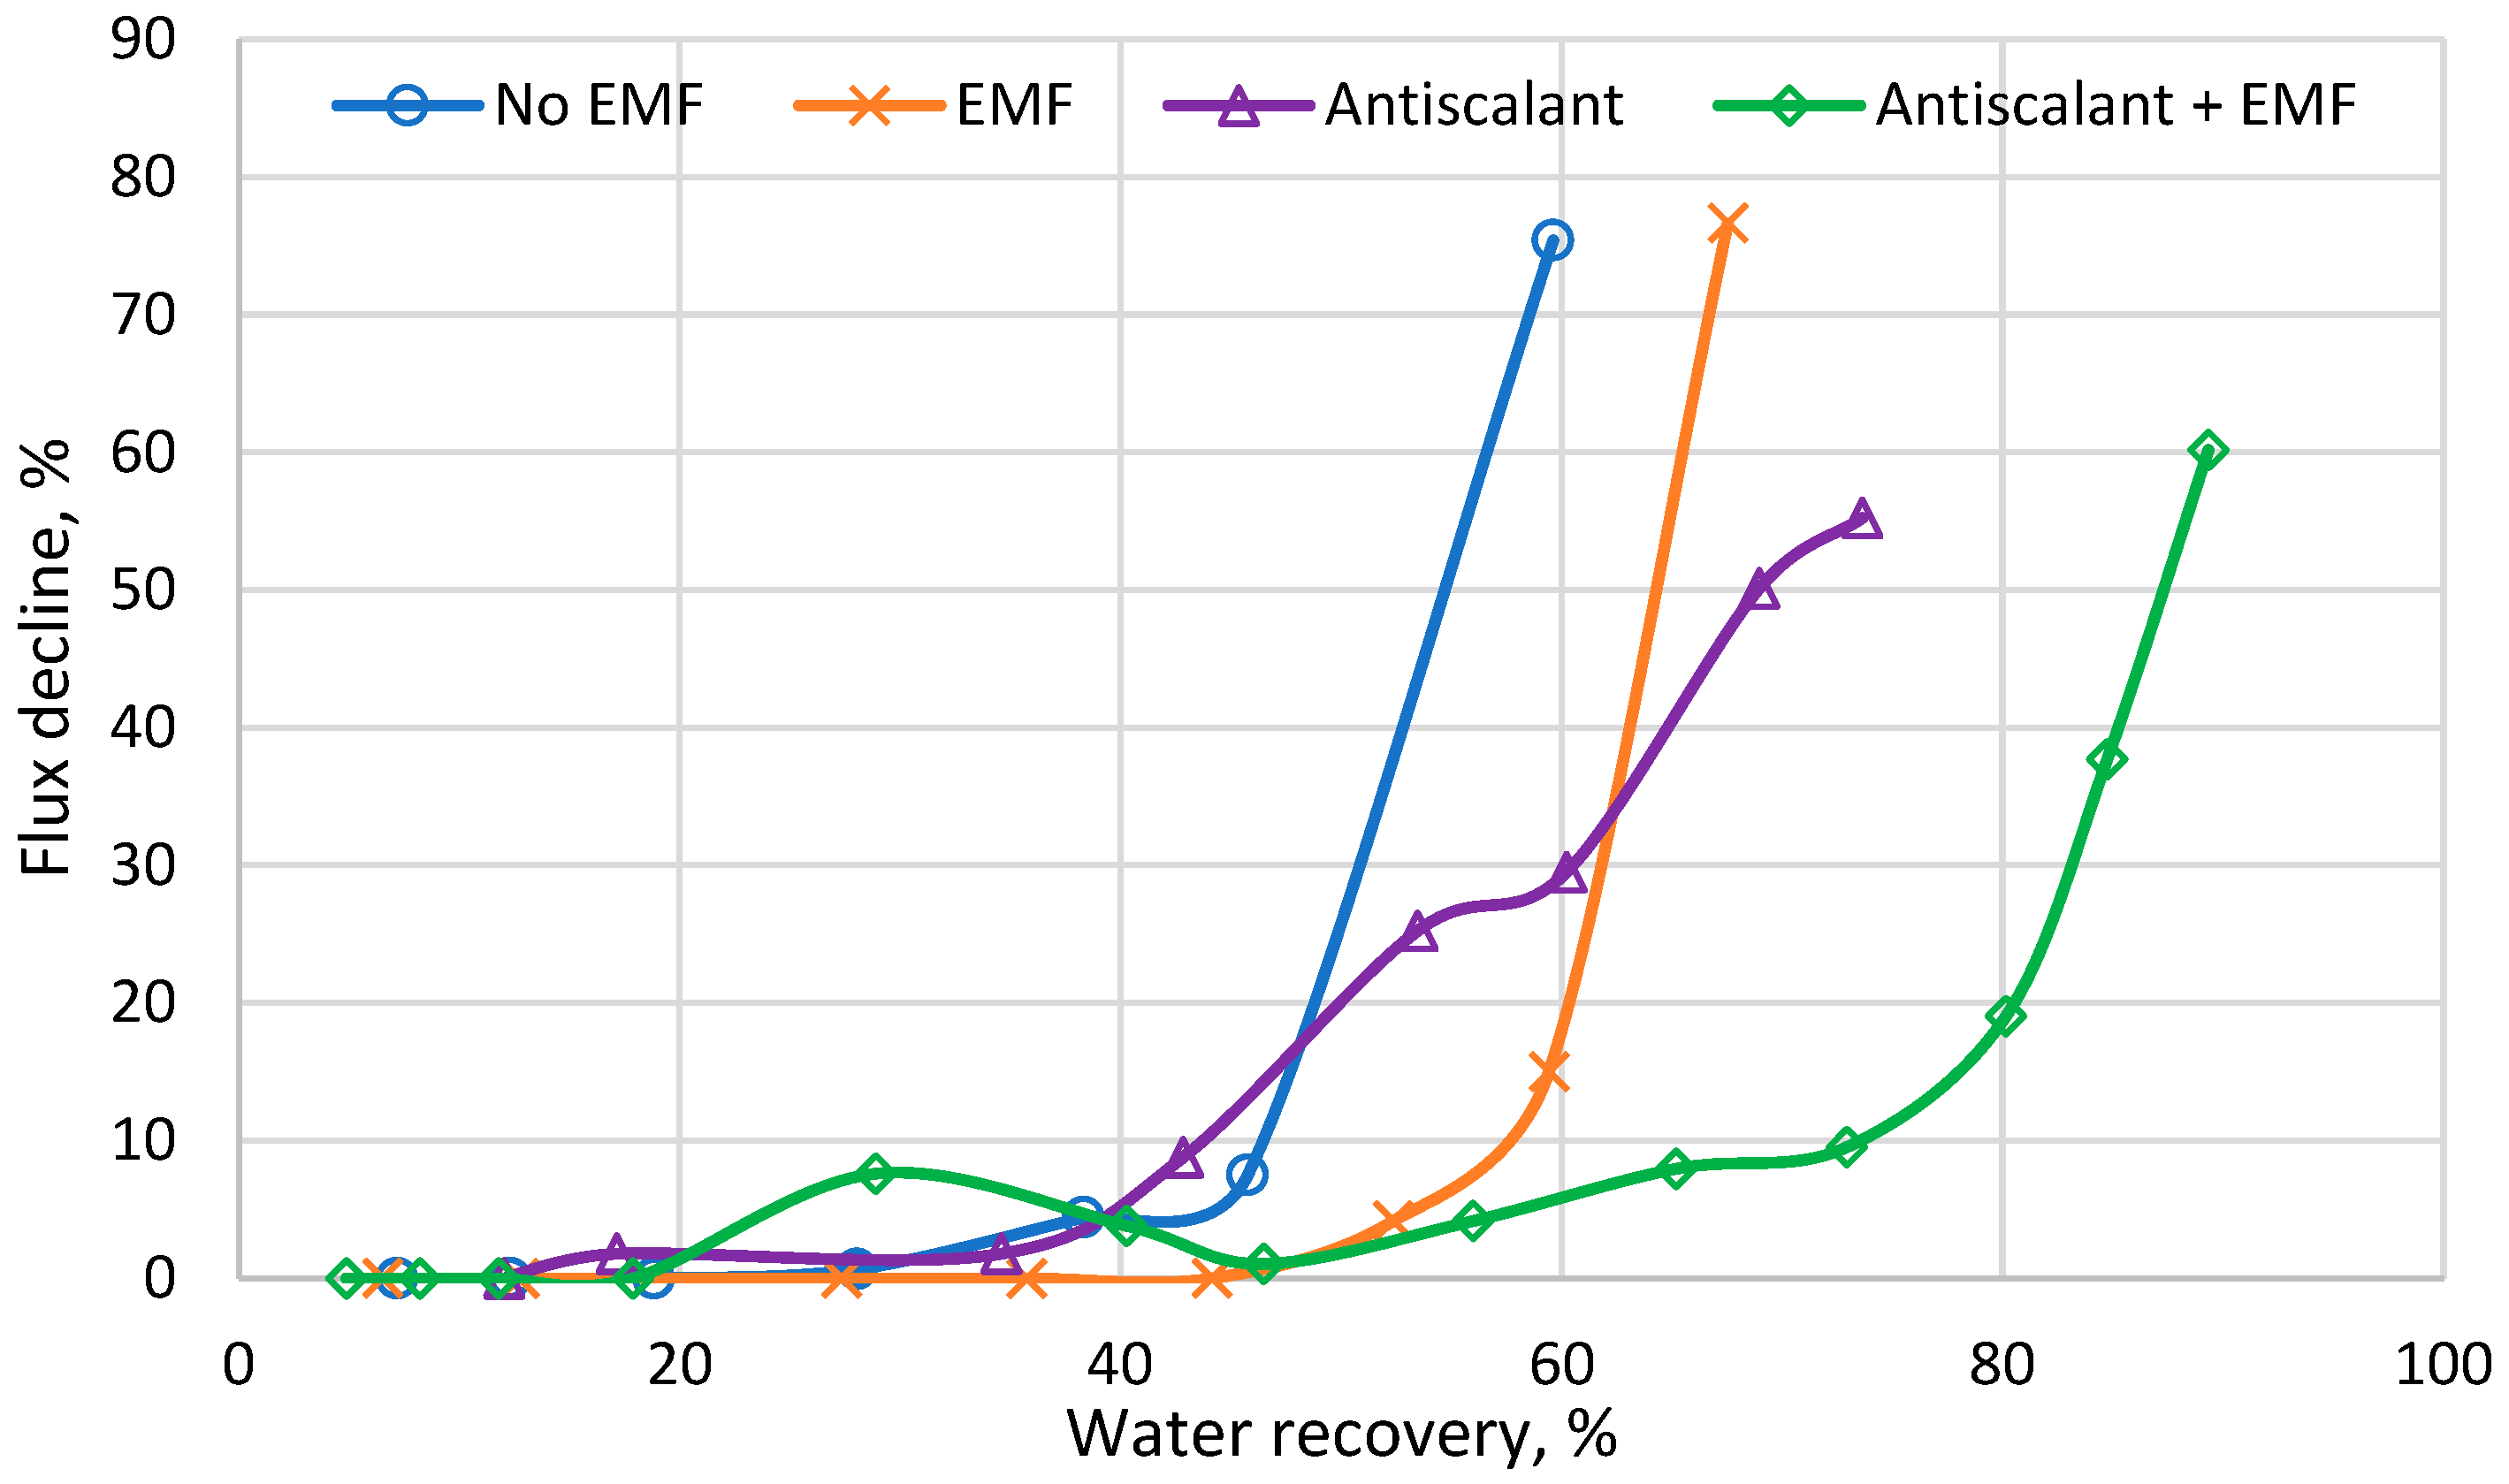
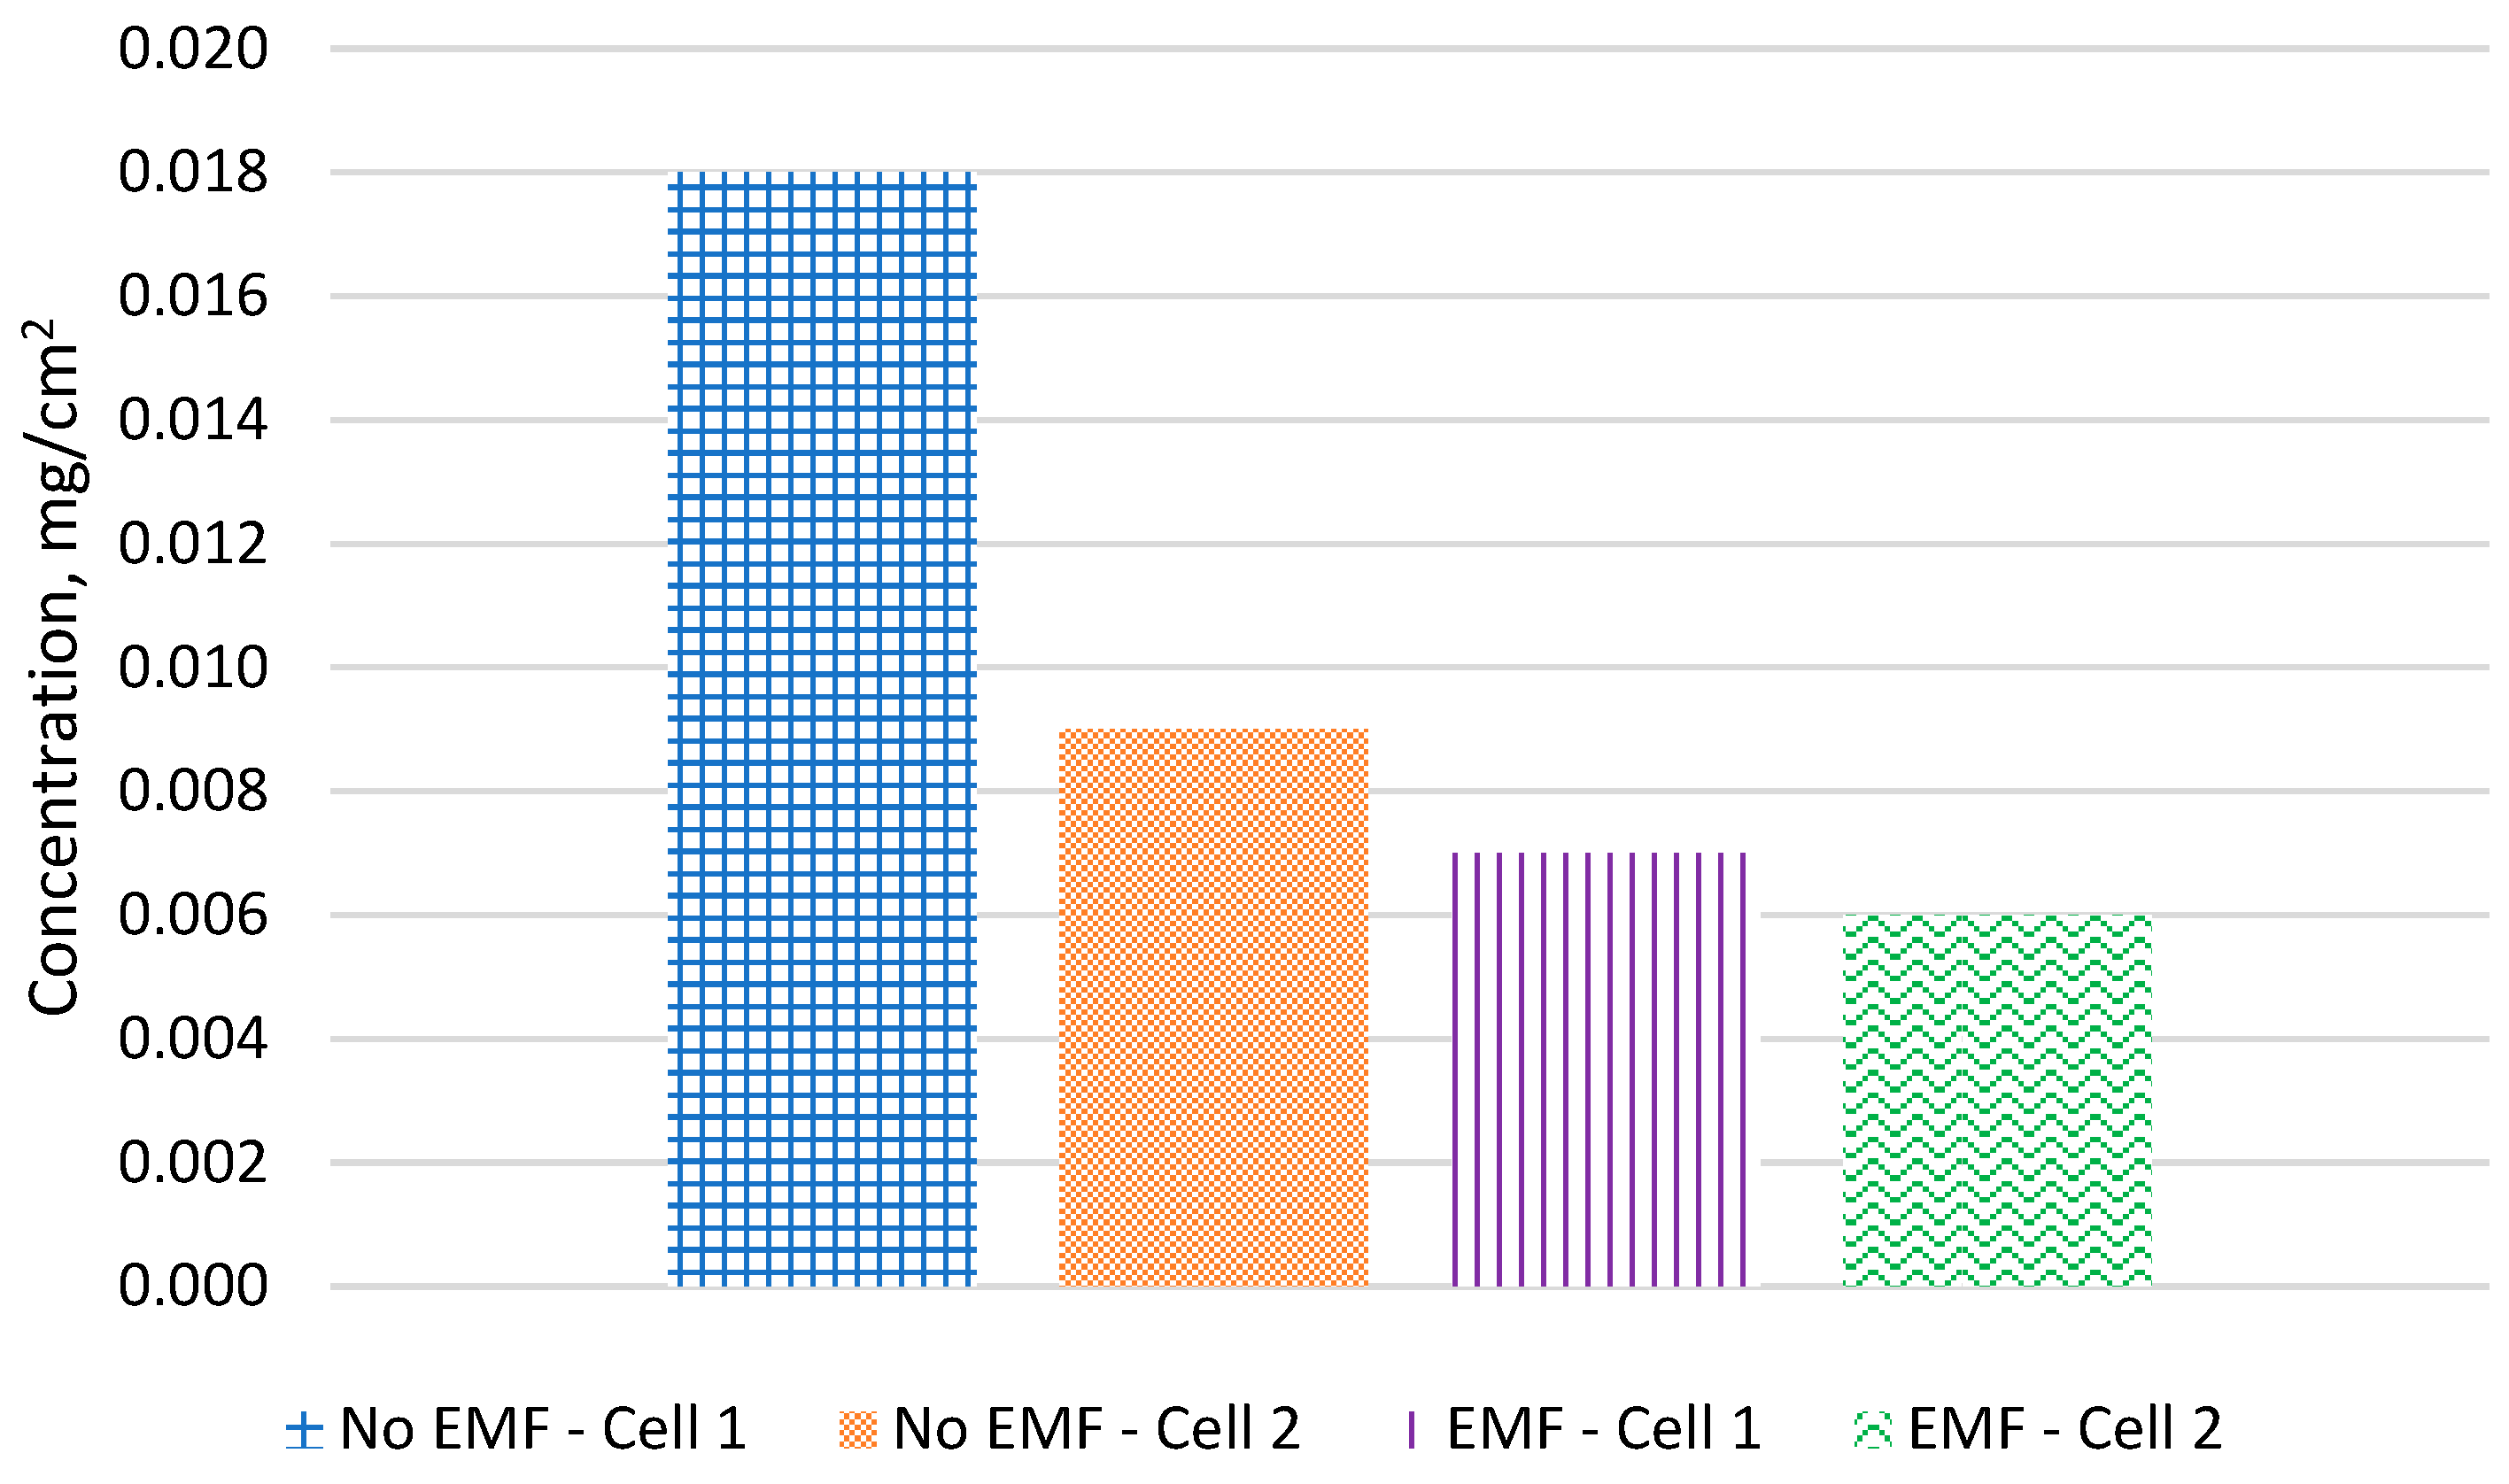
3. Results and Discussion

3.1. Water Flux Tests

3.1.1. Continuous Recirculation Operation

All the experiments that operated in a continuous recirculation flow regime were conducted at ambient temperatures (20 °C), at 150 psi (1034 kPa) of feed pressure, and operated at a feed cross-flow velocity of 0.20 m/s. The flux decline observed over the course of a 120 h operation was lower in experiments utilizing an EMF (Figure 2a), with a reduction of 32%, compared to 51% without EMF. This suggests that the EMF was effective in partially mitigating membrane fouling and scaling during the treatment of secondary effluent. In the first 10 h of filtration without EMF, the water production was slightly higher (~11%). Between 10 and 24 h of the experiments, the water production was similar. However, after 24 h of filtration, the EMF experiments showed a higher water production over time (~13%), as depicted in Figure 2b. The flux decline over time is typically attributed to membrane fouling and scaling, which can adversely affect the efficiency and productivity of the desalination treatment.

3.1.2. Feed-and-Bleed Operation

After demonstrating the effectiveness of EMF in reducing fouling and scaling in experiments at low water recovery (about 1% in every single passing) in continuous recirculating mode, the effects of EMF were evaluated in a feed-and-bleed operation at higher water recoveries and with a higher fouling propensity.
The flux decline of four different setups studied in feed-and-bleed operation mode is presented in Figure 3a. At 9 h of treatment, the flux declines for the no-EMF, EMF-only, antiscalant-only, and EMF + antiscalant configurations were 75%, 28%, 28%, and 9%, respectively. After 11 h of treatment, the EMF-only, antiscalant-only, and EMF + antiscalant configurations had reached flux declines of 75%, 40%, and 10%, respectively. Then, at 13 h of treatment, the flux declines for the antiscalant and EMF + antiscalants were 55% and 30%, respectively.
In Figure 3b, the experiment without EMF exhibited the fastest decrease in water production, decreasing from 45.4 L/m2·h at around 6.8 h of operation to 12 L/m2·h at 9 h of operation. Both the EMF-only and antiscalant-only configurations demonstrated longer periods of higher water production (>40 L/m2·h), lasting for ~9 h, which was a ~29% increase in running time compared to the no-EMF configuration. For the EMF + antiscalant configuration, the period of high water production (>40 L/(m2·h)) increased to ~11 hours, corresponding to a ~57% increased runtime, compared to the no-EMF control. Said another way, at a flux decline of 60%, the water recovery for the no-EMF, EMF-only, antiscalant-only, and EMF + antiscalant was 55%, 64%, 73%, and 89.3%, respectively (Figure 4).
The combination of EMF and antiscalant was shown to be more effective than using EMF or antiscalants as standalone pretreatment processes. This result is intriguing because these two processes are presumed to have opposing mechanisms for fouling and scaling control. The antiscalant used in this study is HYPERSPERSE MDC714, a phosphonate-type product containing 2.5–10% disodium phosphonate, 1–2.5% NaCl, (nitrilotris(methylene))triphosphonic acid, and water. Phosphonates are the salts and esters of phosphonic acid, HPO(OH)2, and are highly soluble in water [11]. Antiscalant delays the onset crystallization or retards the growth of mineral salt crystals [11]. While the antiscalant provides protection against scale and colloidal foulants, it does not remove the constituents causing scaling or prevent their formation in the water once the mineral concentrations exceed the antiscalant inhibition thresholds. On the other hand, EMFs are hypothesized to promote the agglomeration of loosely connected particles, ultimately causing precipitation in the bulk solution, instead of on the membrane surface [44].
Striving to enhance comprehension of mineral precipitation, it is worth exploring the concept of calcium carbonate as a dynamically ordered liquid-like oxyanion polymer (DOLLOP). The term DOLLOP was proposed by Demichelis et al. who conducted computer simulations and experimental data analysis to investigate the properties and mechanisms of prenucleation clusters in mineral formation, focusing on the early stages of calcium carbonate formation without the influence of an EMF. The authors observed a stable cluster form of calcium carbonate and suggested that DOLLOPs may have a significant impact on determining the nucleation rate of minerals, as well as the size and morphology of resulting crystals [45]. Coey later evaluated the effects of magnetic fields on water treatment and proposed that the role of the magnetic field might affect DOLLOPs rather than the water itself. This was supported by Sammer et al. who observed an increased formation of nanometer-sized prenucleation clusters (DOLLOPs) under the influence of a magnetic field, in accordance with Coey’s theory [46,47].
Therefore, using EMFs and antiscalants together, despite their seemingly opposing mechanisms, may have synergistic effects because the EMF exposure and the addition of antiscalants may be impacting DOLLOP formation. Indeed, from Figure 4, the EMF-only curve shows that increasing water recovery from 40% to over 65% resulted in a rapid, parabolic rise in flux decline. Conversely, the antiscalant-only flux decline was gradual and linear as the water recovery increased over the same range. Interestingly, the EMF + antiscalant curve appears to be a combination of the two, with a gradual, linear flux decline observed as water recovery increased initially, but eventually further increasing the water recovery result in a parabolic flux decline. This suggests that the EMF and the antiscalant mechanisms for controlling fouling and scaling may be more effective at lower and higher recoveries, respectively, and could explain why, despite their seemingly opposing mechanisms, they had synergistic effects when used together. Consequently, this study hypothesizes that EMF alters the crystal formation proprieties, leading to changes in the DOLLOPs’ behavior and their interaction with antiscalants. Additionally, it is hypothesized that the combination of EMF and antiscalant promotes the formation of larger DOLLOPs, which may enhance the effectiveness of the antiscalant due to the larger surface area. However, further research is required to fully understand the interactions between these factors and to optimize their utilization in desalination applications.

3.1.3. Impact of Hydraulic Flushing on Membrane Performance

To verify the hypothesis that the precipitates and foulants formed in the presence of EMF were loose and easily removable, a hydraulic flushing (HF) procedure was conducted using deionized water. The system was flushed with a flow rate of 2 L/min for 1 min every hour over a 24 h period. These tests were performed in continuous recirculation mode utilizing new virgin membranes for each testing condition. The feed flow rate of 1 L/min and the applied pressure of 150 psi (1034 kPa) remained consistent with the other experiments. Thus, the system treated secondary effluent for one hour, followed by one minute of hydraulic flushing, before resuming the treatment process.
Figure 5b demonstrates that in the presence of EMF, the initial water flux was slightly higher (~11%) and then remained stable throughout the experiment period. The combination of hydraulic flushing and EMF resulted in a decrease in flux decline (Figure 5a). The use of only hydraulic flushing caused a 14% flux decline, whereas the combination of EMF and hydraulic flushing reduced it to less than 2%. This reduced fouling in the presence of an EMF aligns with the findings of Jiang et al. who reported that the scaling/fouling layer formed under the influence of EMF was loosely attached with low density, making it easy to remove through hydraulic flushing [43].

3.2. Water Quality Tests

During the continuous recirculation mode, the feedwater electrical conductivity was 2239 ± 64 μS/cm and the salt rejection ranged from 98.2 to 99.2% in all experiments, indicating the membranes were intact and that there was no major difference between the four configurations. The hydraulic flushing experiments showed the lowest salt rejection of 98.5% (Figure 6). Detailed raw water quality data from the various analyses are in the Appendix A and Appendix B. To ensure consistency between the four setups, water samples were collected at 50% of water recovery during feed-and-bleed operation mode and were tested for organics rejection. The results showed that the DOC removal efficiency ranged between 91.4% and 95.9% for all setups (Figure 6 and Table A1). The F-EEM analysis indicated high removals of specific organic fractions, with and without the EMF: 98.8–99.7% for aromatic proteins (such as tryptophan and tyrosine); 97.8–99.2% for fulvic acid-like compounds; 99.4–99.7% for soluble microbial byproduct-like material (such as carbohydrates, aldehydes, ketones, and alcohols); and 99.1–99.8% for humic-like organic substances (Table A3).
Regarding anion removal efficiencies, chloride showed a removal efficiency of 98.3–99.4%, sulfate was 99.5–99.9%, bromide was 95.2–97.5%, and phosphate was higher than 99.4% (Table A4 and Table A5). Nitrate and nitrite were not detected in feedwater and permeates while fluoride was not detected in permeates (Table A4). Cation removal efficiencies were 99.6–99.9% for calcium, 97.4–98.3% for potassium, and 98.3–99.0% for sodium (Table A6 and Table A7). Magnesium and strontium were not detected in the permeates. Silica removal reached 98.7–99.4%. The removal efficiency varied for each salt and did not show a significant difference among the different experimental conditions, suggesting that EMF did not significantly impact their rejection.

3.3. Membrane Fouling Characterization

During the continuous recirculation continuous recirculation mode operation, the membrane fouling was characterized for no-EMF and EMF experiments to visualize, compare, and understand if the EMF could change the precipitation characteristics and fouling on the membrane. SEM micrographs showed a fouling layer in the presence and absence of the EMF, although the fouling layer characteristics differed between experiments with and without the EMF, particularly in the first membrane cell (Figure 7). This observation is consistent with the membrane filtration results indicating rapid and significant flux decline when an EMF was not applied.
Figure 8a shows the elements detected on the membrane surface using EDS scanning analysis analysis for the continuous recirculation mode operation. The results revealed that aluminum fouling mostly occurred when an EMF was not applied. Aluminum fouling might come from suspended and colloidal particles, and its deposition occurred in cell 1. Aluminum oxide is the primary clay mineral in natural water, soil, and wastewater. The processes of aluminum-rich material origin and its interaction with water were studied by Keller [48]. Zhu and Elimelech demonstrated that the colloidal fouling rate, caused by aluminum oxide on RO membranes, increased with the ionic strength and particle concentration in suspension in the solution [49]. In this present study, the application of EMF led to higher water recovery while reducing aluminum fouling, as shown in Figure 8. This suggests that EMF can partially alleviate particulate and colloidal fouling.
Diverse wastewater reclamation RO autopsy studies [1,21,50,51] reported the tendency of inorganic scale precipitation in the tail-end of RO spiral-wound elements. These studies matched with the observation in the bench system when the inorganic scale occurred in the second RO cell at high water recovery (~70%). In addition, calcium and magnesium precipitation on the membrane were higher in cell 2 (the tail-end) than in cell 1, consistent with the findings from the feed-and-bleed operation mode experiments, as depicted in Figure 8, and consistent with other studies [1,21,50,51].
Figure 9 illustrates SEM data for membranes tested under both the presence and absence of EMF during feed-and-bleed operation mode. In both experimental setups, a thick fouling layer was observed. EDS analysis in Figure 8b for a virgin membrane and membranes in experiments with and without EMF shows phosphorus precipitation in both cells, as well as calcium, magnesium, aluminum, silica, and fluoride.
Hydranautics IMSDesign software was used to predict membrane scaling. The simulation was run for 75% of water recovery using the same membranes studied (ESPA2-LD). From the simulation, the precipitation of calcium phosphate, calcium carbonate, calcium fluoride, and silicon dioxide is expected, consistent with the membrane autopsy results. Fouling primarily consists of colloidal natural organic matter, colloidal calcium phosphate, and occasionally colloidal silicates as its main constituents, as indicated by Ning and Troyer (2007). These colloidal particles have a great affinity towards aggregation with each other [52], supporting our bench study results.

3.4. Chemical Extraction and Characterization of Scalants and Foulants on the RO Membranes

A chemical extraction process was conducted to characterize the inorganic scalants (Figure 10) and foulants (Figure 11) on the RO membrane surface from both cells.
Figure 10 and Table A8 show ion concentration from the chemical extraction of foulants on the RO membranes. Nitrate, nitrite, bromide, and sulfate were not detected. Low concentrations of fluoride (<0.01 mg/cm2) were detected on the membrane surface regardless of the presence or absence of EMF. Similarly, silica precipitation on the membrane was minimal (<0.02 mg/cm2 in cell 1) and did not vary between the EMF and no-EMF experiments.
On the other hand, the EMF reduced the precipitation of chloride and phosphate by 98% and 50% in cell 1, respectively. It is possible that chloride and sodium (Figure 10) adsorption occurred in cell 1 when the EMF was not present, as the removal of bound water during the desalination process leads to the loss of structural integrity in solids, resulting in hydration.
In the presence of an EMF, the inorganic precipitation was reduced. Reductions in scale formation were observed for calcium (51% precipitation reduction in cell 1 and 3.6% in cell 2), magnesium (75% precipitation reduction in cell 1), phosphorus (29% precipitation reduction in cell 1 and 4% in cell 2), strontium (66% precipitation reduction in cell 1), potassium (83% precipitation reduction in cell 1), and sodium (no precipitation in cell 1).
Figure 11 and Table A9 present the DOC concentration from the chemical extraction. DOC accumulation on the RO membrane surface was reduced by 64% in cell 1 and 40% in cell 2. When EMF was present, fouling regarding aromatic proteins (e.g., tryptophan and tyrosine) and fulvic acid-like compounds was reduced by more than 99.9% in both cells. For soluble microbial byproduct-like materials (e.g., carbohydrates, aldehydes, ketones, and alcohols), no significant difference in fouling was observed. For humic acid-like organics, a fouling reduction of ~89.2% was observed for both cells when EMF was present.
The data analysis of the RO membrane chemical extraction allowed us to quantify the EMF’s ability to control fouling and scaling during treatment of secondary effluent from municipal wastewater. The results confirmed that the EMF device effectively reduced the precipitation of both organic and inorganic substances on the RO membrane.

4. Conclusions

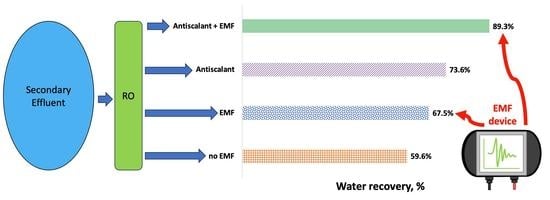
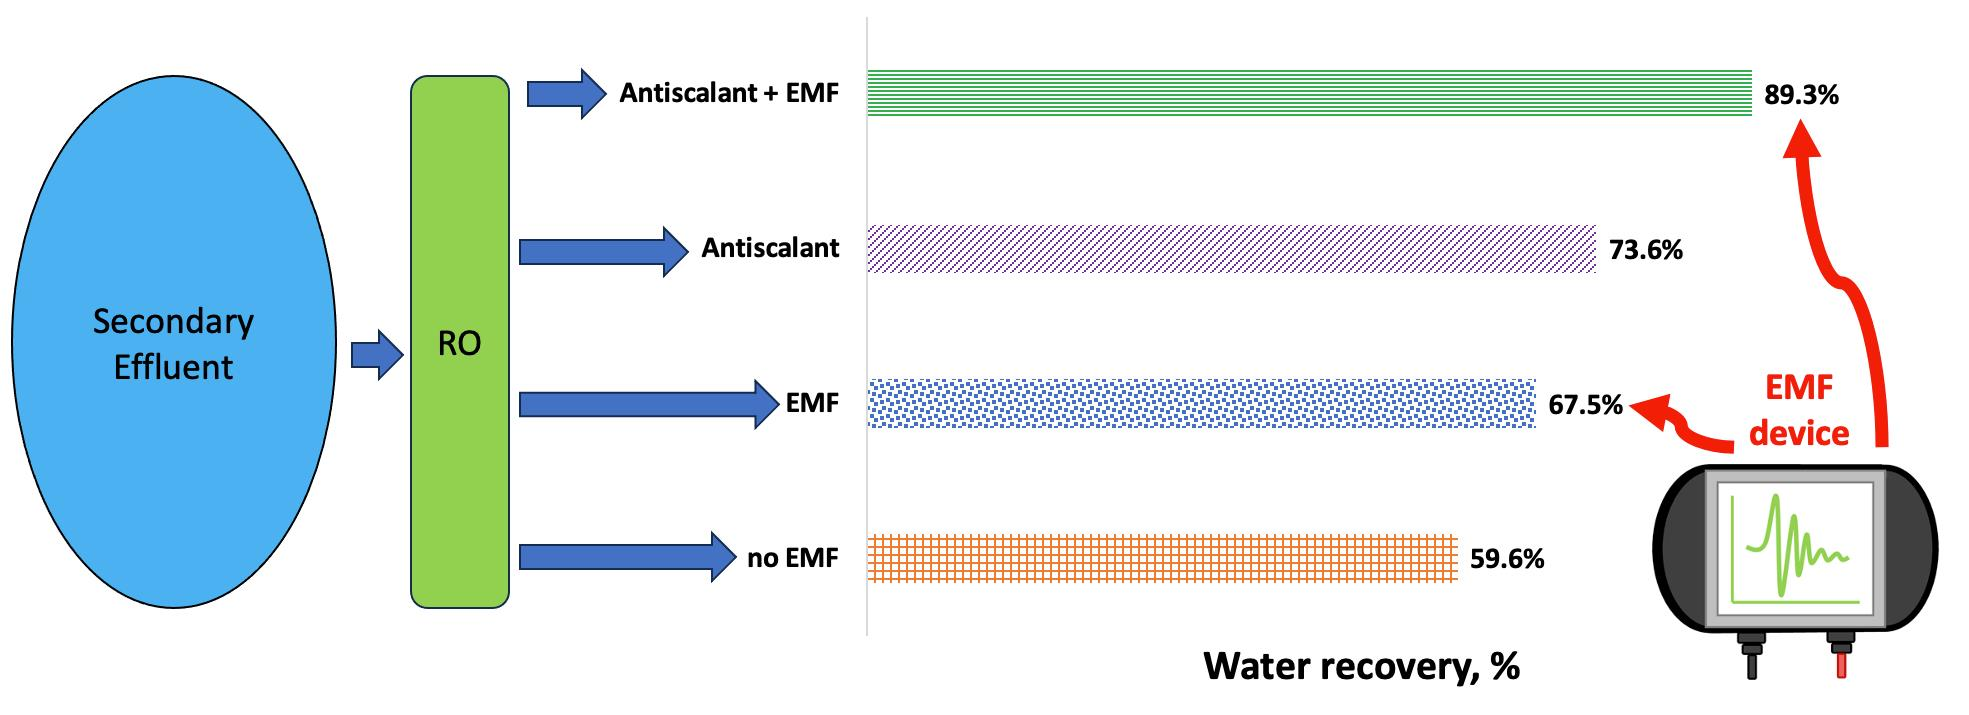
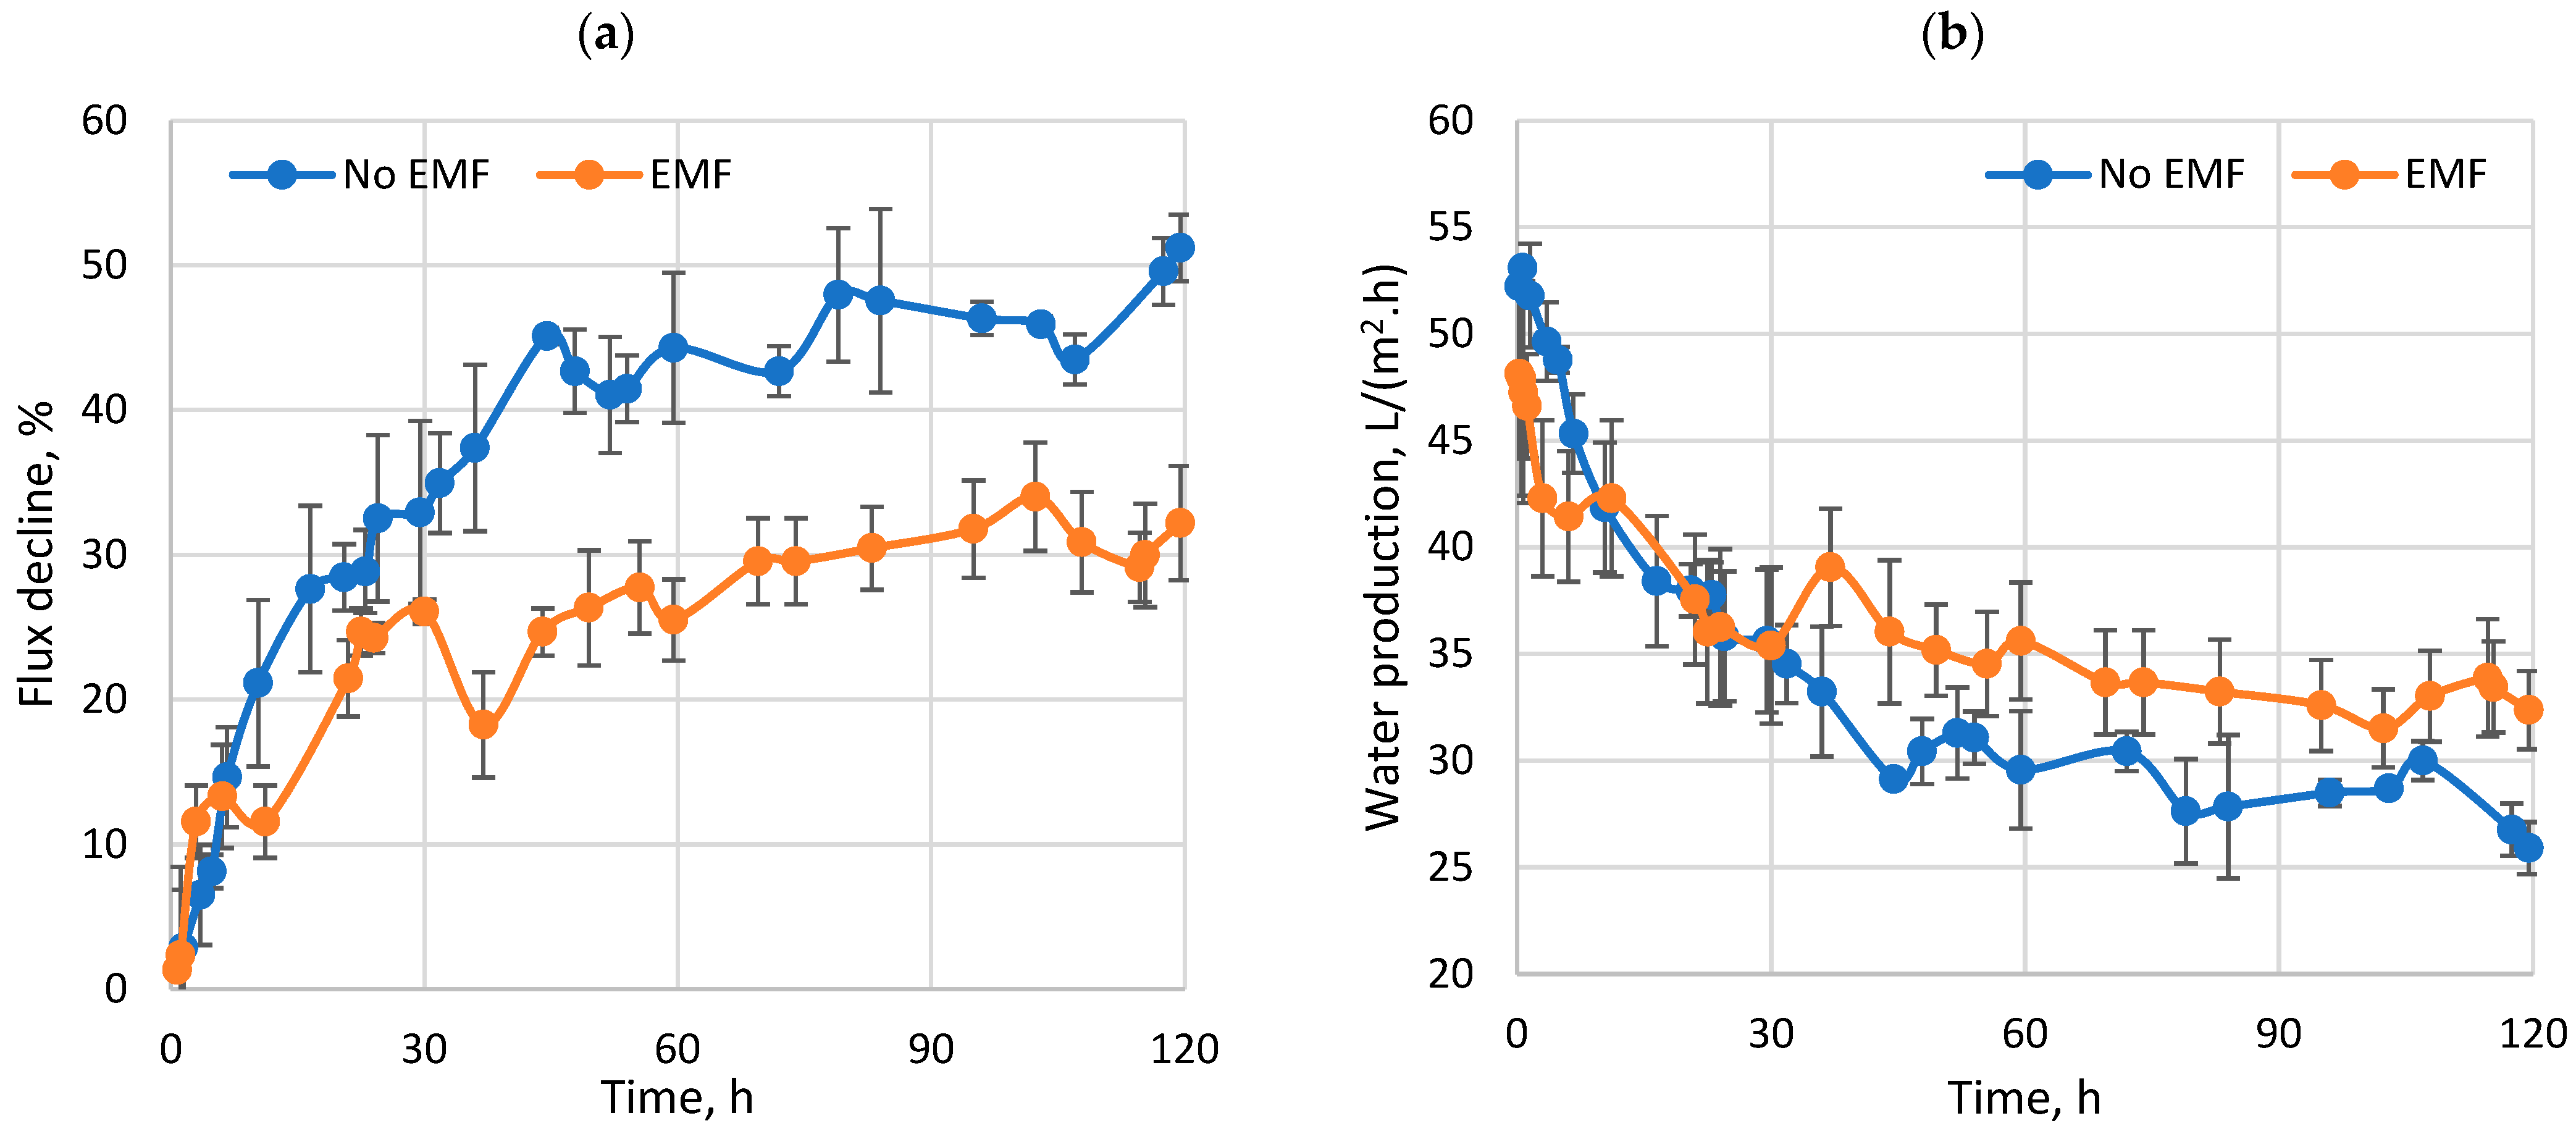
This study evaluated the membrane performance during desalination of municipal secondary effluent using an AC-induced EMF device as a standalone pretreatment option and in conjunction with antiscalants. Experiments demonstrated that the use of an EMF was effective in reducing fouling and scaling, leading to stable water production, higher water recovery rates, and longer operational times, compared to the no-EMF experimental setup. The bench-scale testing showed that the EMF could reduce membrane scaling by 2–8 times and organic fouling by 2 times when EMF was used compared to experiments without EMF. Interestingly, the highest water recovery (89.3%) was achieved when using a combination of EMF and antiscalants, which was higher than the recoveries achieved by the EMF-only (67.5%) and antiscalant-only (73.6%) experiments. This result was non-intuitive because the proposed mechanisms for EMFs and antiscalants are seemingly opposite, with the former acting to promote crystallization in the bulk solution and the latter acting to suppress crystallization. As such, additional research is needed to elucidate the fundamental mechanisms of EMF fouling and scaling control as a standalone process, and in conjunction with other pretreatment methods. Many factors need to be investigated individually and holistically, including water chemistry, applied pressure, magnetism generation source, shape and strength of the field, exposure time to EMF, RO membrane material, and feedwater velocity.

Author Contributions

Conceptualization, J.P.d.A. and P.X.; methodology, J.P.d.A. and P.X.; formal analysis, J.P.d.A. and P.X.; investigation, J.P.d.A. and P.X.; resources, P.X.; data curation, J.P.d.A.; writing—original draft preparation, J.P.d.A., P.X. and Z.S.; writing—review and editing, J.P.d.A., P.X. and Z.S.; visualization, J.P.d.A.; supervision, P.X.; project administration, P.X.; funding acquisition, P.X. All authors have read and agreed to the published version of the manuscript.

Funding

This research was funded by the U.S. Bureau of Reclamation, grant number R18AC00118; and the National Alliance for Water Innovation (NAWI), funded by the U.S. Department of Energy, Energy Efficiency and Renewable Energy Office, Advanced Manufacturing Office under Funding Opportunity Announcement DE-FOA-0001905.

Data Availability Statement

The research data will be available upon request.

Acknowledgments

The authors are grateful for the technical support provided by El Paso Water, Texas, and Xuesong Xu.

Conflicts of Interest

The authors declare no conflict of interest. The funders had no role in the design of the study; in the collection, analyses, or interpretation of data; in the writing of the manuscript; or in the decision to publish the results.

Appendix A

Calculations in this study are given based on the following equations.
Salt rejection is defined as Equation (A1):
S a l t   r e j e c t i o n , % = 100 × F e e d w a t e r   c o n d u c t i v i t y P e r m e a t e   w a t e r   c o n d u c t i v i t y F e e d w a t e r   c o n d u c t i v i t y
Water recovery is defined as Equation (A2):
W a t e r   r e c o v e r y % = P e r m e a t e   f l o w   r a t e F e e d   f l o w   r a t e × 100
In the feed-and-bleed operation mode, the water recovery is defined as Equation (A3):
W a t e r   r e c o v e r y % = I n i t i a l   f e e d w a t e r   v o l u m e F i n a l   f e e d w a t e r   v o l u m e I n i t i a l   f e e d w a t e r   v o l u m e × 100
Water flux decline or permeate flux decline is defined as Equation (A4):
F l u x   d e c l i n e % = M a x   p e r m e a t e   f l o w A c t u a l   p e r m e a t e   f l o w M a x   p e r m e a t e   f l o w × 100
Removal efficiency is defined as Equation (A5):
R e m o v a l   e f f i c i e n c y % = I n i t i a l   c o n c e n t r a t i o n F i n a l   c o n c e n t r a t i o n I n i t i a l   c o n c e n t r a t i o n × 100

Appendix B

Figure A1. Schematic diagram of the RO bench-scale system for continuous recirculating mode (a) and feed-and-bleed operation mode (b).
Water 15 02234 g0a1
Table A1. Electrical conductivity, salt rejection, DOC concentration and removal efficiency for feed-and-bleed operation mode experiments at 50% of water recovery.
ConfigurationSample at 50% of Water RecoveryConductivityDOC
μS/cmSR, %mg/LRem.
Eff., %
No EMFFeed3870 11.6
Permeate 13199.20.794.0
Permeate 23999.01.091.4
EMFFeed3900 12.2
Permeate 13199.20.893.4
Permeate 24398.90.595.9
AntiscalantFeed3870 15.4
Permeate 13097.20.994.2
Permeate 23997.00.894.8
Antiscalant + EMFFeed3552 12.8
Permeate 13998.90.695.3
Permeate 25598.50.993.0
Table A2. Turbidity, pH, and temperature for feed-and-bleed operation mode experiments at 50% of water recovery and the end of the experiment.
ConfigurationSampleTurbidity, NTUpHTemp, °C
No EMF50% WRFeed2.188.1222.4
Permeate 1*5.5122.4
Permeate 2*5.5022.4
60% WRFeed3.588.2523.4
Permeate 1*6.4923.4
Permeate 2*6.2423.4
EMF50% WRFeed1.527.3423.8
Permeate 1*5.3023.9
Permeate 2*5.1823.9
68% WRFeed5.418.1823.5
Permeate 1*6.1123.7
Permeate 2*5.9023.7
Antiscalant50% WRFeed2.058.5623.2
Permeate 1*8.0423.3
Permeate 2*8.1223.3
74% WRFeed14.208.7724.1
Permeate 1*8.1424.1
Permeate 2*8.0024.1
Antiscalant + EMF50% WRFeed1.128.1124.7
Permeate 1*6.0724.9
Permeate 2*6.0624.8
89% WRFeed1.848.9923.8
Permeate 1*7.0323.8
Permeate 2*6.8723.8
Note(s): * Samples not tested.
Table A3. F-EEM representing the removal efficiency of dissolved organic matter at 50% of water recovery.
ConfigurationSampleZone IZone IIZone IIIZone IVZone V
Rem. Eff., %Rem. Eff., %Rem. Eff., %Rem. Eff., %Rem. Eff., %
No EMF50% WRPM 198.999.798.699.799.5
PM 298.899.498.699.699.5
EMF50% WRPM 199.499.798.099.499.1
PM 299.499.397.899.499.2
Antiscalant50% WRPM 199.599.699.299.699.6
PM 299.499.698.899.699.6
Antiscalant + EMF50% WRPM 199.499.499.199.699.7
PM 299.599.699.299.799.8
Table A4. Fluoride, chloride, and sulfate concentration and their removal efficiency for feed-and-bleed operation mode experiments at 50% of water recovery and the end of the experiment.
ConfigurationSampleFluorideChlorideSulfate
mg/LRem. Eff., %mg/LRem. Eff., %mg/LRem. Eff., %
No EMF50% WRFeed1.5 765.9 574
Permeate 1ND100.04.899.40.899.9
Permeate 2ND100.06.599.11.299.8
60% WRFeed1.9 964.1 728.4
Permeate 10.196.826.897.25.499.3
Permeate 20.197.128.397.16.999.0
EMF50% WRFeed1.6 764.8 568.5
Permeate 1ND100.07.599.02.199.6
Permeate 2ND100.09.998.72.699.5
68% WRFeed2.6 1171.60 885.3
Permeate 10.197.92198.20.999.9
Permeate 20.197.926.597.72.2199.8
Antiscalant50% WRFeed2.2 645.6 498.2
Permeate 1ND100.04.299.30.699.9
Permeate 2ND100.07.398.91.199.8
74% WRFeed4.1 3697.10 2848.00
Permeate 1ND100.01799.53.199.9
Permeate 20.198.425.599.35.699.8
Antiscalant + EMF50% WRFeed1.9 671.8 510.3
Permeate 1ND100.07.698.91.399.7
Permeate 2ND100.011.498.32.699.5
89% WRFeed6.9 4967.30 3778.10
Permeate 10.199.048.399.05.199.9
Permeate 20.199.049.599.07.799.8
Note(s): ND = not detected.
Table A5. Bromide and phosphate concentration and their removal efficiency for feed-and-bleed operation mode experiments at 50% of water recovery and the end of the experiment.
ConfigurationSampleBromidePhosphate
mg/LRem. Eff., %mg/LRem. Eff., %
No EMF50% WRFeed83.3 20.3
Permeate 12.197.50.199.4
Permeate 22.696.90.199.5
60% WRFeed108.2 16.2
Permeate 111.689.30.299.0
Permeate 211.689.30.199.1
EMF50% WRFeed87.7 23.6
Permeate 12.996.70.299.2
Permeate 23.695.90.299.3
68% WRFeed143.8 19.5
Permeate 113.190.90.199.4
Permeate 214.689.80.199.4
Antiscalant50% WRFeed74 13.3
Permeate 12.396.9ND100.0
Permeate 23.495.4ND100.0
74% WRFeed476.5 3.6
Permeate 18.798.2ND100.0
Permeate 211.797.50.0100.0
Antiscalant + EMF50% WRFeed78.6 10.1
Permeate 13.795.3ND100.0
Permeate 23.895.2ND100.0
89% WRFeed722.9 0.2
Permeate 127.896.2ND100.0
Permeate 225.996.4ND100.0
Note(s): ND = not detected.
Table A6. Calcium, magnesium, phosphorus, and strontium concentration and their removal efficiency for feed-and-bleed operation mode experiments at 50% of water recovery and the end of the experiment.
ConfigurationSampleCalciumMagnesiumPhosphorusStrontium
mg/LRem. Eff., %mg/LRem. Eff., %mg/LRem. Eff., %mg/LRem. Eff., %
No EMF50% WRFeed91.4 23.8 2.4 2.3
PM10.299.8ND100.0ND100.0-100.0
PM20.299.8ND100.0ND100.0-100.0
60% WRFeed147.7 41.3 7.8 3.9
PM10.999.40.399.3-100.0-100.0
PM21.399.10.499.0-100.0-100.0
EMF50% WRFeed124.1 33.5 11.7 3.3
PM10.499.7ND100.0ND100.0-100.0
PM20.599.6ND100.0-100.0-100.0
68% WRFeed188.3 56.1 9.5 5.0
PM10.299.9ND100.0ND100.0-100.0
PM20.499.8ND100.0ND100.0-100.0
AS Antiscalant50% WRFeed117.8 30.4 11.9 3.0
PM10.199.9ND100.0ND100.0ND100.0
PM20.299.8ND100.0ND100.0-100.0
74% WRFeed219.6 60.8 9.6 5.8
PM10.399.9ND100.0ND100.0-100.0
PM20.799.7ND100.0-100.0-100.0
Antiscalant + EMF50% WRFeed114.0 28.7 4.2 2.9
PM10.299.8ND100.0ND100.0-100.0
PM20.399.7ND100.0ND100.0-100.0
89% WRFeed392.8 105.8 3.2 9.3
PM10.699.8ND100.0ND100.0-100.0
PM20.799.80.399.7ND100.0-100.0
Note(s): ND = not detected.
Table A7. Potassium, silicon dioxide, sodium, and sulfur concentration and their removal efficiency for feed-and-bleed operation mode experiments at 50% of water recovery and the end of the experiment.
ConfigurationSamplePotassiumSiO2SodiumSulfur
mg/LRem. Eff., %mg/LRem. Eff., %mg/LRem. Eff., %mg/LRem. Eff., %
No EMF50% WRFeed31.1 53.7 426.6 137.0
PM10.797.70.499.35.498.7ND100.0
PM20.897.40.599.17.098.4ND100.0
60% WRFeed53.1 78.0 752.7 236.4
PM12.395.72.297.225.496.61.899.2
PM22.196.02.397.126.196.52.399.0
EMF50% WRFeed44.2 62.4 609.8 194.7
PM10.998.00.699.06.798.90.699.7
PM21.197.50.898.79.498.50.999.5
68% WRFeed68.2 104.9 1006.0 321.7
PM11.897.41.798.420.198.0ND100.0
PM22.296.82.098.124.397.60.799.8
Antiscalant50% WRFeed42.4 62.5 587.5 184.5
PM10.798.30.499.45.899.0ND100.0
PM21.097.60.699.07.798.7ND100.0
74% WRFeed83.3 123.5 1169.0 376.5
PM11.498.31.299.016.698.60.799.8
PM21.798.01.898.523.398.01.499.6
Antiscalant + EMF50% WRFeed42.2 59.6 562.0 178.8
PM10.997.90.699.07.398.7ND100.0
PM21.097.60.798.89.798.30.699.7
89% WRFeed149.3 111.0 1822.0 631.3
PM13.297.93.097.343.697.61.199.9
PM23.297.92.697.742.897.71.899.7
Note(s): ND = not detected.
Table A8. Ion concentrations from the chemical extraction for MWT.
SampleFluoride,Chloride,Phosphate,Calcium,
mg/cm2mg/cm2mg/cm2mg/cm2
No EMF—Cell 1ND2.490.020.82
No EMF—Cell 20.010.110.020.52
EMF—Cell 1ND0.050.010.40
EMF—Cell 20.010.230.020.49
SampleMagnesium,Phosphorus,Strontium,
mg/cm2mg/cm2mg/cm2
No EMF—Cell 10.120.310.03
No EMF—Cell 20.030.280.01
EMF—Cell 10.030.220.01
EMF—Cell 20.030.270.01
SamplePotassium,Silicon,Sodium,
mg/cm2mg/cm2mg/cm2
No EMF—Cell 10.060.021.15
No EMF—Cell 20.020.000.06
EMF—Cell 10.010.020.00
EMF—Cell 20.080.000.06
Table A9. DOC concentration on the membrane surface for MWT.
SampleDOC,
mg/cm2
No EMF—Cell 10.018
No EMF—Cell 20.009
EMF—Cell 10.007
EMF—Cell 20.006

References

  1. Xu, P.; Bellona, C.; Drewes, J.E. Fouling of Nanofiltration and Reverse Osmosis Membranes during Municipal Wastewater Reclamation: Membrane Autopsy Results from Pilot-Scale Investigations. J. Memb. Sci. 2010, 353, 111–121. [Google Scholar] [CrossRef]
  2. U.S. EPA Potable Reuse Compendium. 2017, 203. Available online: https://www.epa.gov/sites/default/files/2018-01/documents/potablereusecompendium_3.pdf (accessed on 12 April 2023).
  3. Tortajada, C.; van Rensburg, P. Drink More Recycled Wastewater. Nature 2020, 577, 26–28. [Google Scholar] [CrossRef] [PubMed] [Green Version]
  4. Wiecheteck, G.K.G.K.; Campos, L.C.L.C.; Carranza, G.A.G.A.; Acevedo, M.F.M.F.; Szeliga, M.R.; de Souza, M.E.M.E.; Bovaroti, T.; Rodrigues, A.C.M.A.C.M.; de Almeida, J.P.J.P.; Kummer, A.C.B.A.C.B. Addressing Drinking Water Salinity Due to Sea Water Intrusion in Praia de Leste, Parana, by a Brackish Water Desalination Pilot Plant. Desalin. Water Treat. 2019, 169, 9–21. [Google Scholar] [CrossRef]
  5. Tran, T.; Bolto, B.; Gray, S.; Hoang, M.; Ostarcevic, E. An Autopsy Study of a Fouled Reverse Osmosis Membrane Element Used in a Brackish Water Treatment Plant. Water Res. 2007, 41, 3915–3923. [Google Scholar] [CrossRef] [PubMed] [Green Version]
  6. Jiang, S.; Li, Y.; Ladewig, B.P. A Review of Reverse Osmosis Membrane Fouling and Control Strategies. Sci. Total Environ. 2017, 595, 567–583. [Google Scholar] [CrossRef] [PubMed]
  7. Wetterau, G.; Liu, P.; Chalmers, B.; Richardson, T.; VanMeter, H. Optimizing RO Design Criteria for Indirect Potable Reuse. IDA J. Desalin. Water Reuse 2011, 3, 40–45. [Google Scholar] [CrossRef]
  8. Ke, X.; Hongqiang, R.; Lili, D.; Jinju, G.; Tingting, Z. A Review of Membrane Fouling in Municipal Secondary Effluent Reclamation. Environ. Sci. Pollut. Res. 2013, 20, 771–777. [Google Scholar] [CrossRef]
  9. Shahid, M.K.; Choi, Y.G. The Comparative Study for Scale Inhibition on Surface of RO Membranes in Wastewater Reclamation: CO2 Purging versus Three Different Antiscalants. J. Memb. Sci. 2018, 546, 61–69. [Google Scholar] [CrossRef]
  10. Pandey, S.R.; Jegatheesan, V.; Baskaran, K.; Shu, L. Fouling in Reverse Osmosis (RO) Membrane in Water Recovery from Secondary Effluent: A Review. Rev. Environ. Sci. Biotechnol. 2012, 11, 125–145. [Google Scholar] [CrossRef]
  11. Antony, A.; Low, J.H.; Gray, S.; Childress, A.E.; Le-Clech, P.; Leslie, G. Scale Formation and Control in High Pressure Membrane Water Treatment Systems: A Review. J. Memb. Sci. 2011, 383, 1–16. [Google Scholar] [CrossRef]
  12. Bereschenko, L.A.; Stams, A.J.M.; Euverink, G.J.W.; Van Loosdrecht, M.C.M. Biofilm Formation on Reverse Osmosis Membranes Is Initiated and Dominated by Sphingomonas Spp. Appl. Environ. Microbiol. 2010, 76, 2623–2632. [Google Scholar] [CrossRef] [Green Version]
  13. Van Geluwe, S.; Braeken, L.; Van der Bruggen, B. Ozone Oxidation for the Alleviation of Membrane Fouling by Natural Organic Matter: A Review. Water Res. 2011, 45, 3551–3570. [Google Scholar] [CrossRef] [Green Version]
  14. Matin, A.; Rahman, F.; Shafi, H.Z.; Zubair, S.M. Scaling of Reverse Osmosis Membranes Used in Water Desalination: Phenomena, Impact, and Control; Future Directions. Desalination 2019, 455, 135–157. [Google Scholar] [CrossRef]
  15. Wilf, M.; Alt, S. Application of Low Fouling RO Membrane Elements for Reclamation of Municipal Wastewater. Desalination 2000, 132, 11–19. [Google Scholar] [CrossRef]
  16. Tang, F.; Hu, H.Y.; Sun, L.J.; Sun, Y.X.; Shi, N.; Crittenden, J.C. Fouling Characteristics of Reverse Osmosis Membranes at Different Positions of a Full-Scale Plant for Municipal Wastewater Reclamation. Water Res. 2016, 90, 329–336. [Google Scholar] [CrossRef] [PubMed]
  17. Piyadasa, C.; Ridgway, H.F.; Yeager, T.R.; Stewart, M.B.; Pelekani, C.; Gray, S.R.; Orbell, J.D. The Application of Electromagnetic Fields to the Control of the Scaling and Biofouling of Reverse Osmosis Membranes—A Review. Desalination 2017, 418, 19–34. [Google Scholar] [CrossRef]
  18. Zheng, L.; Yu, D.; Wang, G.; Yue, Z.; Zhang, C.; Wang, Y.; Zhang, J.; Wang, J.; Liang, G.; Wei, Y. Characteristics and Formation Mechanism of Membrane Fouling in a Full-Scale RO Wastewater Reclamation Process: Membrane Autopsy and Fouling Characterization. J. Memb. Sci. 2018, 563, 843–856. [Google Scholar] [CrossRef]
  19. Tang, F.; Hu, H.Y.; Sun, L.J.; Wu, Q.Y.; Jiang, Y.M.; Guan, Y.T.; Huang, J.J. Fouling of Reverse Osmosis Membrane for Municipal Wastewater Reclamation: Autopsy Results from a Full-Scale Plant. Desalination 2014, 349, 73–79. [Google Scholar] [CrossRef]
  20. Hoek, E.M.V.; Weigand, T.M.; Edalat, A. Reverse Osmosis Membrane Biofouling: Causes, Consequences and Countermeasures. npj Clean Water 2022, 5, 45. [Google Scholar] [CrossRef]
  21. Tong, X.; Cui, Y.; Wang, Y.-H.H.; Bai, Y.; Yu, T.; Zhao, X.-H.H.; Ikuno, N.; Luo, H.; Hu, H.-Y.Y.; Wu, Y.-H.H. Fouling Properties of Reverse Osmosis Membranes along the Feed Channel in an Industrial-Scale System for Wastewater Reclamation. Sci. Total Environ. 2020, 713, 136673. [Google Scholar] [CrossRef]
  22. Li, H.; Guo, Y.; Liu, C.; Zhou, Y.; Lin, X.; Gao, F. Microbial Deposition and Growth on Polyamide Reverse Osmosis Membrane Surfaces: Mechanisms, Impacts, and Potential Cures. Desalination 2023, 548, 116301. [Google Scholar] [CrossRef]
  23. Liu, J.; Zhao, M.; Duan, C.; Yue, P.; Li, T. Removal Characteristics of Dissolved Organic Matter and Membrane Fouling in Ultrafiltration and Reverse Osmosis Membrane Combined Processes Treating the Secondary Effluent of Wastewater Treatment Plant. Water Sci. Technol. 2021, 83, 689–700. [Google Scholar] [CrossRef] [PubMed]
  24. Abada, B.; Safarik, J.; Ishida, K.P.; Chellam, S. Surface Characterization of End-of-Life Reverse Osmosis Membranes from a Full-Scale Advanced Water Reuse Facility: Combined Role of Bioorganic Materials and Silicon on Chemically Irreversible Fouling. J. Memb. Sci. 2022, 653, 120511. [Google Scholar] [CrossRef]
  25. Turek, M.; Mitko, K.; Piotrowski, K.; Dydo, P.; Laskowska, E.; Jakóbik-Kolon, A. Prospects for High Water Recovery Membrane Desalination. Desalination 2017, 401, 180–189. [Google Scholar] [CrossRef]
  26. Baker, J.S.; Judd, S.J.; Parsons, S.A. Antiscale Magnetic Pretreatment of Reverse Osmosis Feedwater. Desalination 1997, 110, 151–165. [Google Scholar] [CrossRef]
  27. Benson, R.F.; Lubosco, R.; Martin, D.F. Magnetic Treatment of Solid Carbonates, Sulfates, and Phosphates of Calcium. J. Environ. Sci. Health Part A 2000, 35, 1527–1540. [Google Scholar] [CrossRef]
  28. Lipus, L.C.; Ačko, B.; Hamler, A. Electromagnets for High-Flow Water Processing. Chem. Eng. Process. Process Intensif. 2011, 50, 952–958. [Google Scholar] [CrossRef]
  29. Al-Qahtani, H. Effect of Magnetic Treatment on Gulf Seawater. Desalination 1996, 107, 75–81. [Google Scholar] [CrossRef]
  30. Rouina, M.; Kariminia, H.R.; Mousavi, S.A.; Shahryari, E. Effect of Electromagnetic Field on Membrane Fouling in Reverse Osmosis Process. Desalination 2016, 395, 41–45. [Google Scholar] [CrossRef]
  31. Zaidi, N.S.; Sohaili, J.; Muda, K.; Sillanpää, M. Magnetic Field Application and Its Potential in Water and Wastewater Treatment Systems. Sep. Purif. Rev. 2014, 43, 206–240. [Google Scholar] [CrossRef]
  32. Wang, Y.; Gu, X.; Quan, J.; Xing, G.; Yang, L.; Zhao, C.; Wu, P.; Zhao, F.; Hu, B.; Hu, Y. Application of Magnetic Fields to Wastewater Treatment and Its Mechanisms: A Review. Sci. Total Environ. 2021, 773, 145476. [Google Scholar] [CrossRef]
  33. Sibiya, N.P.; Amo-Duodu, G.; Tetteh, E.K.; Rathilal, S. Magnetic Field Effect on Coagulation Treatment of Wastewater Using Magnetite Rice Starch and Aluminium Sulfate. Polymers 2023, 15, 10. [Google Scholar] [CrossRef]
  34. Krzemieniewski, M.; Debowski, M.; Dobrzynska, A.; Zielinski, M. Chemical Oxygen Demand Reduction of Various Wastewater Types Using Magnetic Field-Assisted Fenton Reaction. Water Environ. Res. 2004, 76, 301–309. [Google Scholar] [CrossRef]
  35. Łebkowska, M.; Rutkowska-Narożniak, A.; Pajor, E.; Tabernacka, A.; Załęska-Radziwiłł, M. Impact of a Static Magnetic Field on Biodegradation of Wastewater Compounds and Bacteria Recombination. Environ. Sci. Pollut. Res. 2018, 25, 22571–22583. [Google Scholar] [CrossRef]
  36. Ji, Y.; Wang, Y.; Sun, J.; Yan, T.; Li, J.; Zhao, T.; Yin, X.; Sun, C. Enhancement of Biological Treatment of Wastewater by Magnetic Field. Bioresour. Technol. 2010, 101, 8535–8540. [Google Scholar] [CrossRef]
  37. Vedavyasan, C.V. Potential Use of Magnetic Fields—A Perspective. Desalination 2001, 134, 105–108. [Google Scholar] [CrossRef]
  38. Corbett, B.E.; Moody, C.D.; Morris, M.D. Evaluation of Reverse Osmosis Scaling Prevention Devices at High Recovery; 2003. Available online: https://www.usbr.gov/research/dwpr/reportpdfs/report091.pdf (accessed on 27 April 2023).
  39. Szkatula, A.; Balanda, M.; Kopec, M. Magnetic Treatment of Industrial Water. Silica Activation. Eur. Phys. J. Appl. Phys. 2002, 49, 41–49. [Google Scholar] [CrossRef]
  40. Gabrielli, C.; Jaouhari, R.; Maurin, G.; Keddam, M. Magnetic Water Treatment for Scale Prevention. Water Res. 2001, 35, 3249–3259. [Google Scholar] [CrossRef] [PubMed]
  41. Lin, L.; Jiang, W.; Xu, X.; Xu, P. A Critical Review of the Application of Electromagnetic Fields for Scaling Control in Water Systems: Mechanisms, Characterization, and Operation. npj Clean Water 2020, 3, 25. [Google Scholar] [CrossRef]
  42. Jiang, W.; Xu, X.; Johnson, D.; Lin, L.; Wang, H.; Xu, P. Effectiveness and Mechanisms of Electromagnetic Field on Reverse Osmosis Membrane Scaling Control during Brackish Groundwater Desalination. Sep. Purif. Technol. 2022, 280, 119823. [Google Scholar] [CrossRef]
  43. Jiang, W.; Xu, X.; Lin, L.; Wang, H.; Shaw, R.; Lucero, D.; Xu, P. A Pilot Study of an Electromagnetic Field for Control of Reverse Osmosis Membrane Fouling and Scaling during Brackish Groundwater Desalination. Water 2019, 11, 15. [Google Scholar] [CrossRef] [Green Version]
  44. Xiaokai, X.; Chongfang, M.; Yongchang, C. Investigation on the Electromagnetic Anti-Fouling Technology for Scale Prevention. Chem. Eng. Technol. 2005, 28, 1540–1545. [Google Scholar] [CrossRef]
  45. Demichelis, R.; Raiteri, P.; Gale, J.D.; Quigley, D.; Gebauer, D. Stable Prenucleation Mineral Clusters Are Liquid-like Ionic Polymers. Nat. Commun. 2011, 2, 590. [Google Scholar] [CrossRef] [PubMed] [Green Version]
  46. Coey, J.M.D. Magnetic Water Treatment-How Might It Work? Philos. Mag. 2012, 92, 3857–3865. [Google Scholar] [CrossRef]
  47. Sammer, M.; Kamp, C.; Paulitsch-Fuchs, A.H.; Wexler, A.D.; Buisman, C.J.N.; Fuchs, E.C. Strong Gradients in Weak Magnetic Fields Induce DOLLOP Formation in Tap Water. Water 2016, 8, 79. [Google Scholar] [CrossRef] [Green Version]
  48. Keller, W.D. The Origin of High-Alumina Clay Minerals—A Review. Clays Clay Miner. 1963, 12, 129–151. [Google Scholar] [CrossRef]
  49. Zhu, X.; Elimelech, M. Fouling of Reverse Osmosis Membranes by Aluminum Oxide Colloids. J. Environ. Eng. 1995, 121, 884–892. [Google Scholar] [CrossRef]
  50. Khan, M.T.; Busch, M.; Molina, V.G.; Emwas, A.H.; Aubry, C.; Croue, J.P. How Different Is the Composition of the Fouling Layer of Wastewater Reuse and Seawater Desalination RO Membranes? Water Res. 2014, 59, 271–282. [Google Scholar] [CrossRef]
  51. Raffin, M.; Germain, E.; Judd, S. Assessment of Fouling of an RO Process Dedicated to Indirect Potable Reuse. Desalin. Water Treat. 2012, 40, 302–308. [Google Scholar] [CrossRef]
  52. Ning, R.Y.; Troyer, T.L. Colloidal Fouling of RO Membranes Following MF/UF in the Reclamation of Municipal Wastewater. Desalination 2007, 208, 232–237. [Google Scholar] [CrossRef]
Figure 1. Signal waveform generated by the EMF device.
Water 15 02234 g001
Figure 2. Effect of EMF on (a) permeate flux decline and (b) water production during continuous recirculation operation mode for desalination of secondary effluent. The error bars represent the standard deviation of RO cells 1 and 2.
Water 15 02234 g002
Figure 3. Effect of EMF and antiscalant on (a) flux decline and (b) water production in the feed-and-bleed operation for desalination of secondary effluent. The error bars represent the standard deviation of RO cells 1 and 2.
Water 15 02234 g003
Figure 4. Flux decline vs. water recovery in the feed-and-bleed operation for desalination of secondary effluent.
Water 15 02234 g004
Figure 5. Effect of EMF on (a) permeate flux decline and (b) water production applying hydraulic flushing (HF) hourly during continuous recirculation operation mode for desalination of secondary effluent. The error bars represent the standard deviation of RO cell 1 and cell 2. Solid lines correspond to the water production (left y-axis) and dashed lines correspond to the flux decline (right y-axis).
Water 15 02234 g005
Figure 6. Salt and DOC rejection at 25 °C for continuous recirculation operation mode experiments.
Water 15 02234 g006
Figure 7. SEM micrographs of membranes at a magnification of 100 for continuous recirculation operation mode for desalination of secondary effluent. Virgin membrane (a). RO membrane without EMF for cell 1 (b) and cell 2 (c). RO membrane after EMF treatment for cell 1 (d) and cell 2 (e).
Water 15 02234 g007aWater 15 02234 g007b
Figure 8. EDS analysis of the foulants on membranes in (a) continuous recirculation mode and (b) feed-and-bleed operation mode experiments for desalination of secondary effluent.
Water 15 02234 g008
Figure 9. SEM micrograph membrane at a magnification of 100 for feed-and-bleed operation mode for desalination of secondary effluent. Virgin membrane (a). RO membrane without EMF for cell 1 (b) and cell 2 (c). RO membrane after EMF treatment for cell 1 (d) and cell 2 (e).
Water 15 02234 g009aWater 15 02234 g009b
Figure 10. Ion concentrations from the chemical extraction of scalants on membrane surfaces during desalination of secondary effluent.
Water 15 02234 g010
Figure 11. Dissolved organic carbon (DOC) measured from the chemical extraction of foulants on membrane surfaces during desalination of secondary effluent.
Water 15 02234 g011
Table 1. Feedwater quality parameters of RBWWTP secondary effluent.
AnalyteUnitValue
Temperature°C26 ± 3
pH 6.67 ± 0.21
Alkalinitymg/L as CaCO3130 ± 35
Dissolved organic carbon (DOC)mg/L13 ± 2
Electrical conductivity (EC)μS/cm2154 ± 112
Total dissolved solids (TDS)mg/L1218 ± 115
TurbidityNTU1.00 ± 0.68
Aluminummg/L<0.167
Arsenicmg/L<0.1
Bariummg/L0.05 ± 0.01
Berylliummg/L<0.0007
Bismuthmg/L0.02 ± 0.01
Boronmg/L0.2 ± 0.04
Bromidemg/L<1
Calciummg/L61 ± 4
Cadmiummg/L<0.001
Chloridemg/L391 ± 54
Chromiummg/L<0.003
Cobaltmg/L<0.002
Coopermg/L0.02 ± 0.000
Fluoridemg/L<1
Ironmg/L0.04 ± 0.01
Leadmg/L<0.007
Lithiummg/L0.10 ± 0.03
Magnesiummg/L16 ± 1
Manganesemg/L0.02 ± 0.01
Molybdenummg/L<0.0017
Nickelmg/L0.01 ± 0.000
Phosphatemg/L2 ± 1
Potassiummg/L31 ± 4
Seleniummg/L<0.045
Silicamg/L31 ± 4
Sodiummg/L309 ± 73
Strontiummg/L1.41 ± 0.33
Sulfatemg/L278 ± 25
Thalliummg/L<0.024
Vanadiummg/L0.01 ± 0.000
Zincmg/L0.06 ± 0.02
Disclaimer/Publisher’s Note: The statements, opinions and data contained in all publications are solely those of the individual author(s) and contributor(s) and not of MDPI and/or the editor(s). MDPI and/or the editor(s) disclaim responsibility for any injury to people or property resulting from any ideas, methods, instructions or products referred to in the content.

